Article

Date Palm Surface Fibers for Green Thermal Insulation

1
Chemical and Petroleum Engineering Department, College of Engineering, United Arab Emirates University, Al Ain P.O. Box 15551, United Arab Emirates
2
National Water and Energy Center, United Arab Emirates University, Al Ain P.O. Box 15551, United Arab Emirates
*
Author to whom correspondence should be addressed.
Buildings 2022, 12(6), 866; https://doi.org/10.3390/buildings12060866
Submission received: 12 May 2022 / Revised: 8 June 2022 / Accepted: 17 June 2022 / Published: 20 June 2022
(This article belongs to the Topic Building Energy and Environment)

Abstract

:
Some of the major challenges of the twenty-first century include the continued increase in energy consumption and environmental pollution. One approach to overcoming these challenges is to increase the use of waste materials and environmentally friendly manufacturing methods. The high energy consumption in the building sector contributes significantly to global climatic changes. Here, by using date palm surface fibers, a high-performance green insulation material was developed via a simple technique that did not rely on any toxic ingredients. Polyvinyl alcohol (PVA) was used as a binding agent. Four insulation samples were made, each with a different density within the range of 203 to 254 kg/m3. Thermal conductivity and thermal diffusivity values for these four green insulators were 0.038–0.051 W / m · K and 0.137–0.147 mm2/s, respectively. Thermal transmittance (U-value) of the four insulation composites was between 3.8–5.1 W / m 2 · K , which was in good comparison to other insulators of similar thickness. Thermogravimetric analysis (TGA) showed that insulating sample have excellent thermal stability, with an initial degradation temperature of 282 °C, at which just 6% of its original weight is lost. Activation energy ( E a ) analysis revealed the fire-retardancy and weakened combustion characteristics for the prepared insulation composite. According to differential scanning calorimetry (DSC) measurements, the insulating sample has a melting point of 225 °C, which is extremely close to the melting point of the binder. The fiber-based insulating material’s composition was confirmed by using Fourier transform infrared spectroscopy (FTIR). The ultimate tensile range of the insulation material is 6.9–10 MPa, being a reasonable range. Our study’s findings suggest that developing insulation materials from date palm waste is a promising technique for developing green and low-cost alternatives to petroleum-based high-cost and toxic insulating materials. These insulation composites can be installed in building envelopes during construction.

1. Introduction

For decades, mostly all industrial applications have initiated energy efficiency and sustainability. Almost every field of engineering is seeing plans to reduce energy consumption and to improve its conservation [1]. Low energy consumption has also become a major impediment to achieving urban sustainability. Many countries have nonetheless pledged to reduce their energy usage and carbon emissions to combat global climate change [2]. This rising energy demand has prompted a refocusing of energy research towards the usage and development of renewable sources to replace non-renewable fossil fuels that are rapidly diminishing in supply and that emit harmful pollutants into the atmosphere [3]. According to the United Nations Environment Program, buildings consume around 40% of the world’s energy, 25% of its water, and are responsible for 50% of total greenhouse gas emissions [4]. Therefore, several attempts have been made to improve energy efficiency in the building sector. Thermal insulation in building materials can help to reduce energy consumption significantly. Using efficient insulation materials can help to save energy by reducing heat losses and gains during building heating and cooling [5]. A pivotal characteristic of all insulation materials used in modern construction is their low thermal conductivity, this typically is <0.1 W / m · K [6]. If a material’s thermal conductivity is <0.07 W / m · K , it is generally called a thermal insulator [7].
In most building construction practices, petrochemical and inorganic insulation materials are being used, such as polyurethane, mineral wool, expanded polystyrene, and fiberglass. The manufacturing of these insulation materials consumes much energy, which greatly impacts the environment in adverse ways over their whole life cycle [8]. For example, making 1 kg of expanded polystyrene emits 3 kg of carbon dioxide [9]. Natural fibers are very appealing and have a huge potential as eco-friendly raw materials for thermal insulation. Moreover, natural fibers are biodegradable and have minimal ecological impact [10]. The market for insulation materials is highly competitive in terms of both performance and cost. Natural insulation materials are currently a niche market [11]. Green composites are a type of biocomposite in which natural fibers are used to strengthen a bio-based polymer [12,13] Matrix. The United Arab Emirates (UAE) is home to ca. 40 million date palm trees. Their leaves, stem, trunk, leaf stem, surface fibers, and date fruit seeds (Figure 1) are among the plant parts generated and considered waste materials [14]. The possibility of discovering uses for date palm wood in developing insulation materials could open new markets for what is typically regarded as waste or for its usage in low-value products. In the UAE, the construction industry consumes 35–40% of the country’s total energy generated [15], the majority of which comes from fossil fuels [16]. The UAE is constantly extending its development projects as a global hub for the international community, with real estate being the fastest growing sector in recent decades [17]. Therefore, developing an insulation material from local waste material will bring a cost saving from waste disposal and availability of cheap thermal insulation material.
Today, various studies have been carried out to develop building insulation materials using unconventional approaches. Therefore, researchers are focusing on the development of sustainable building insulators especially made from renewable/or waste materials. Piotr Kosinski et al. [18] reported the findings of research on raw hemp shives obtained from the Polish crop of industrial hemp as a loose-fill thermal insulating material. The measurements of the pore size distribution, thermal conductivity, and air permeability of the material were the main emphasis of the research. In the density range of 109–124 kg/m3, thermal conductivity 0.049–0.052 W / m · K showed a slight tendency to rise with density. In this study, the least density that could be achieved was 109 kg/m3. Yan Qiuhui et al. [19] performed an acid/base two-step catalytic procedure followed by ambient pressure drying to produce a hydrophobic and low-cost SiO2 aerogel. The developed material fulfills well with insulation standards, with a thermal conductivity of 0.0212 W / m · K , a specific surface area of 920 m2/g, a density of 0.109 g/cm3, a porosity of 95.05 percent, and a super hydrophobic and mesoporous structure. Srihanum et al. [20] developed low-density rigid polyurethane foam incorporated with renewable polyol. Palm olein-based polyol (PP) was employed as a partial substitute for conventional sucrose/glycerin-initiated polyether polyol (GP). When palm-based rigid polyurethane foams with up to 30 percentage PP were compared with GP foams, the compressive strength and strain were shown to be improved. The addition of 10 percentage PP resulted in the lowest thermal conductivity (0.0232 W / m · K ) of low-density rigid polyurethane foam with a density below 30 kg/m3. Abu-Jdayil et al. [21] conducted research in which they combined polyurethane dust waste with unsaturated polyester resin to develop a heat insulation composite material for building. Insulation composite materials were produced with polyurethane dust ratios ranging from 10% to 50%. With low thermal conductivity in the range of 0.076 to 0.10 W / m · K , the findings demonstrated good thermal insulation performance. Furthermore, the composites had compression strengths of 56 to 100 MPa and tensile strengths of 10.3 to 28 MPa. Dissanayake DG et al. [22] developed an insulation material using textile waste and a natural rubber. Textile wastes are harmful when landfilled, therefore cotton/polyester mixed wastes were utilized to produce sound insulation material. The newly designed material’s noise reduction coefficient values varied from 0.5 to 0.7. The sound insulation capabilities of the samples were found to be comparable to those of commercially available sound insulation panels. Waseem Hittini et al. [23] developed thermal insulation composite from devulcanized waste rubber tires. Using a melt extruder, a grounded devulcanized rubber tire was combined with polystyrene in various amounts (0–50 wt%). Insulation composites with less than 40 wt% filler content showed very good properties, with thermal conductivity ranging from 0.0502 to 0.07084 W / m · K , density from 462.8 to 482.32 kg/m3, and compressive strength from 11.66 to 7.47 MPa.
Hence, utilizing date palm wastes in the UAE and the Gulf region is of paramount importance. Limited research, however, has been performed on the utilization of date palm waste to develop thermal insulation materials. An overview of the studies that included date palm waste to develop building insulators is presented in Table 1. In most studies, date palm waste was utilized as a reinforcing agent with different polymers to develop insulation composites through a melt extrusion process. However, there are very few studies in which date palm waste has been utilized without melt extrusion or pretreatment process.
Therefore, there exists a demand to devise thermal insulation materials that utilize date palm waste without any reliance on sophisticated processing. This study aims to develop such a novel thermal insulation material by utilizing the date palm waste coupled with a natural binder. In bypassing the extrusion process/or any pretreatment of the date fibers, this should further promote the insulation composite’s renewability, lower its toxicity, and, most importantly, reduce its cost of production. Thus, our goal was to build a low-cost low-impact material with a good thermal performance that may be employed on a large scale in building applications. To the authors’ best knowledge, this is the first empirical study to develop building insulation material using date palm surface fibers and polyvinyl alcohol. A US patent for this process has also been recently granted to the same authors (US 11255052) [35]. Therefore, utilizing date palm waste material for developing building insulation materials not only entails nil carbon emissions but its production also helps to reduce the huge amounts of biomass waste materials that arise yearly in MENA (Middle East/North Africa) regions.

2. Materials and Methods
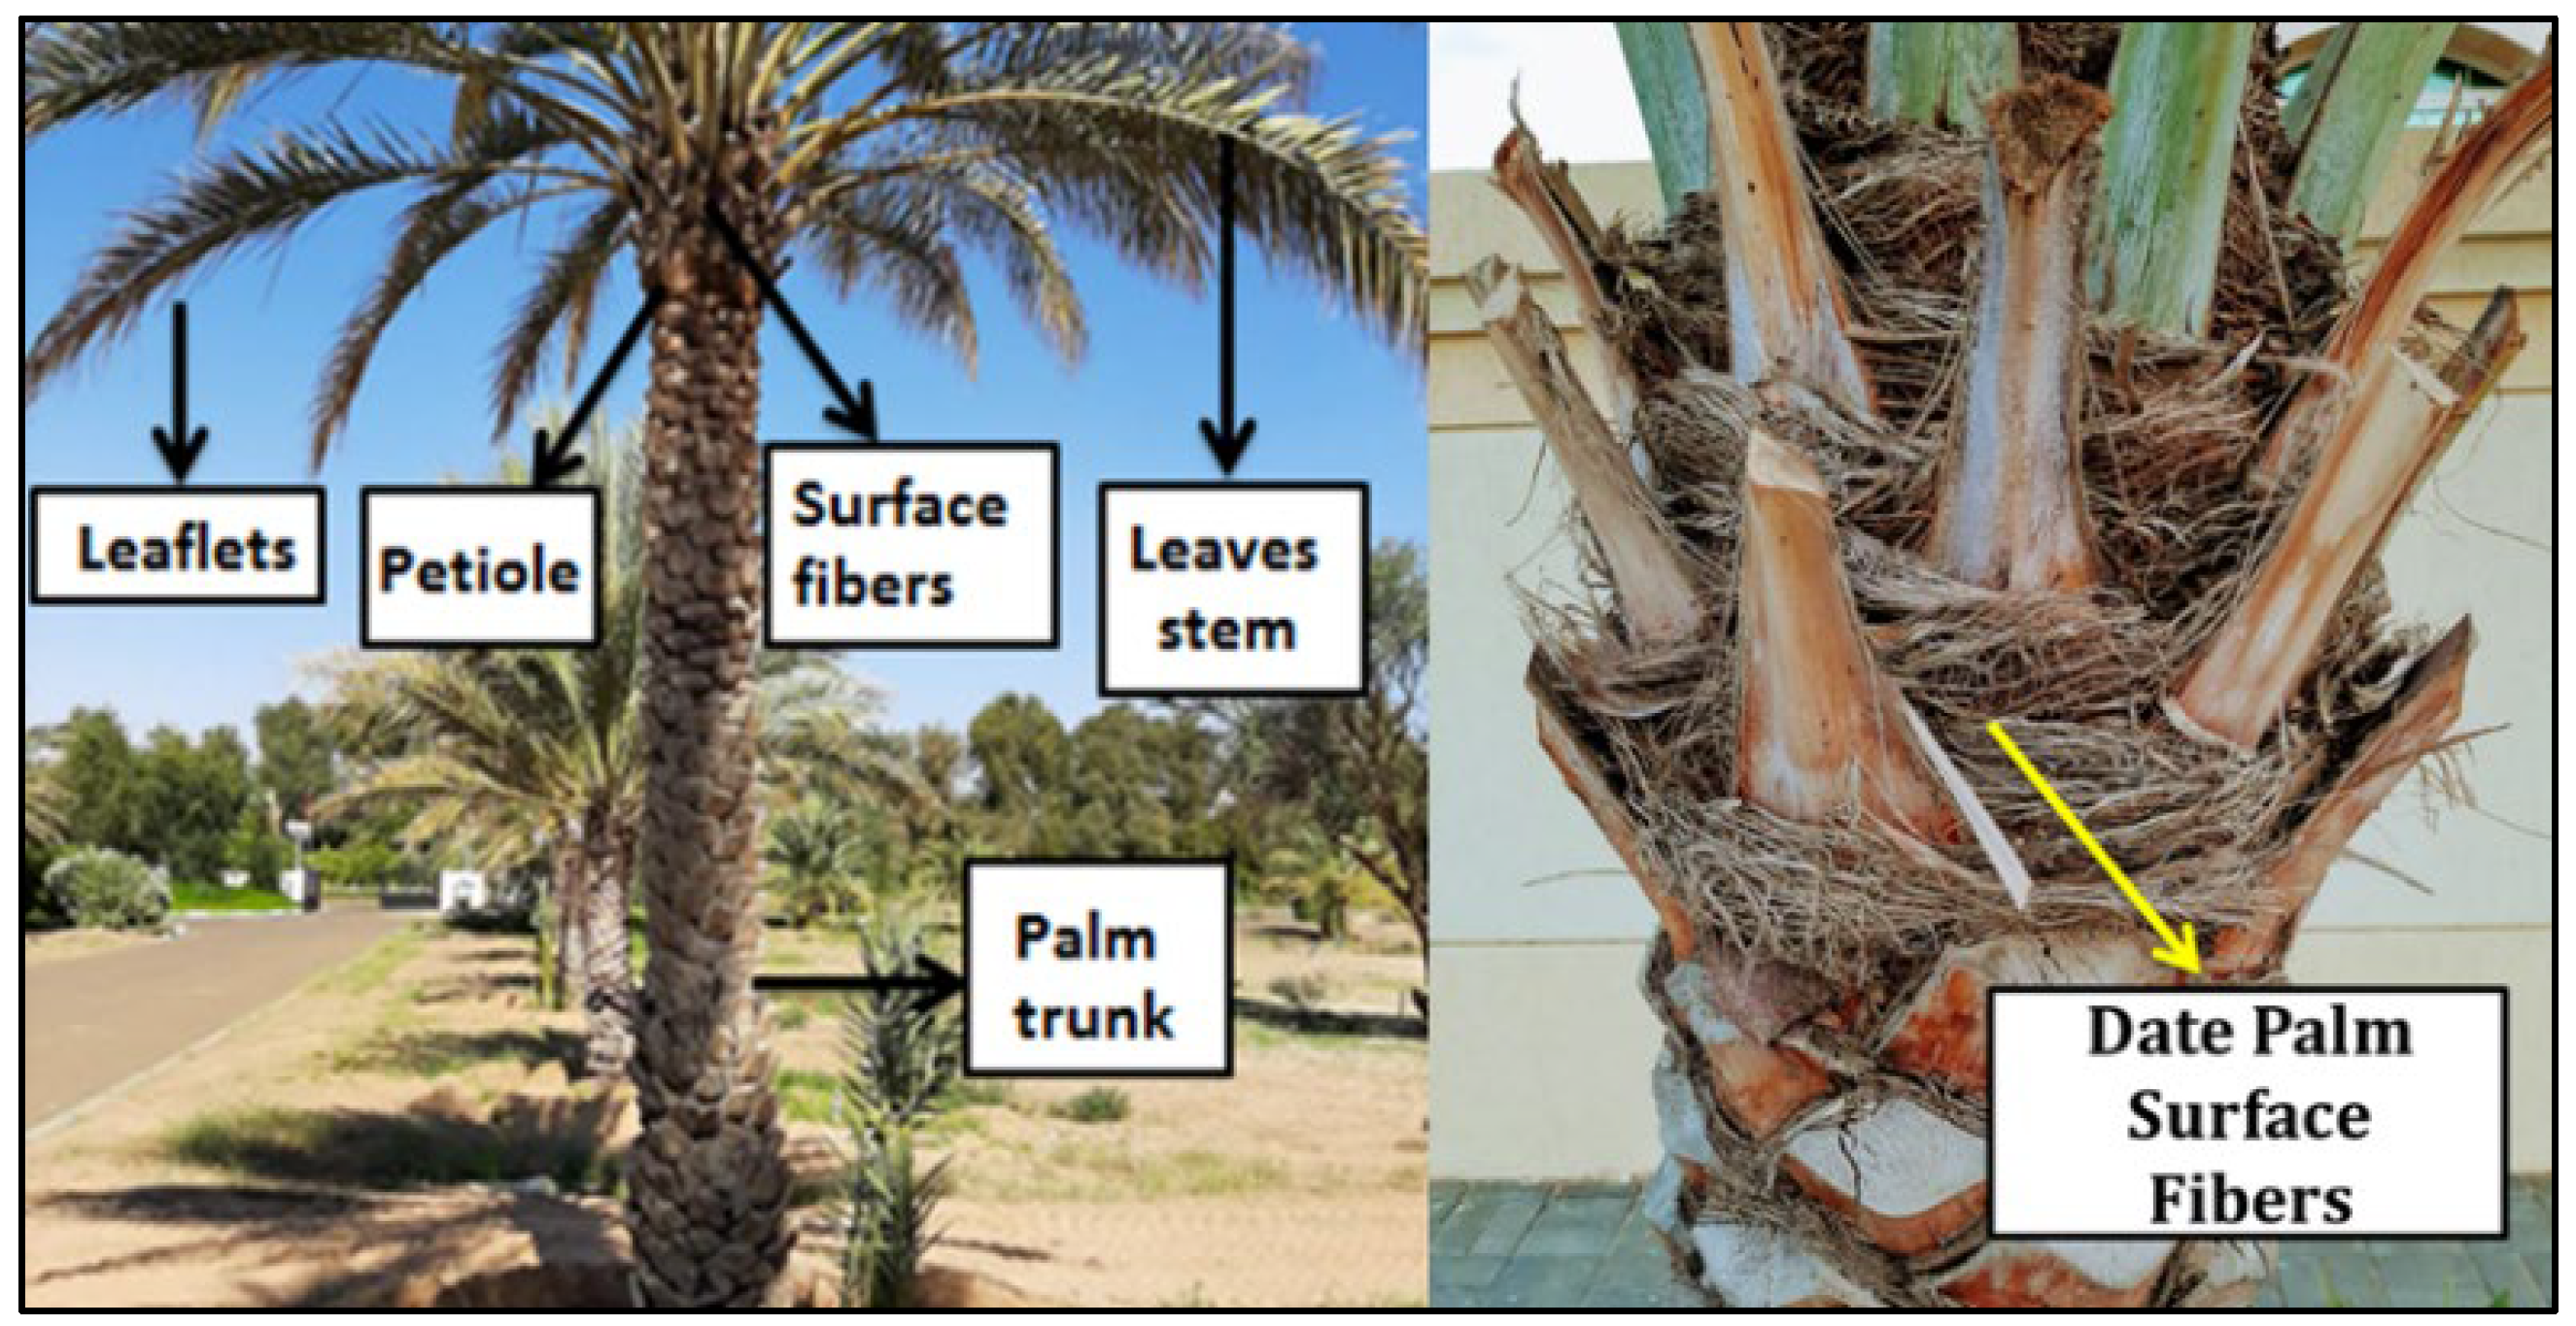
2.1. Materials

The natural fibers used in this study were collected from date palm trees at the Al-Foah Experimental Farm, United Arab University (Figure 1), Al-Ain, United Arab Emirates. The natural fibers were cut from the tree by knife. The polyvinyl alcohol (PVA) used was bought from Sigma Aldrich (99% purity) and applied here without any further modification.

2.2. Methods

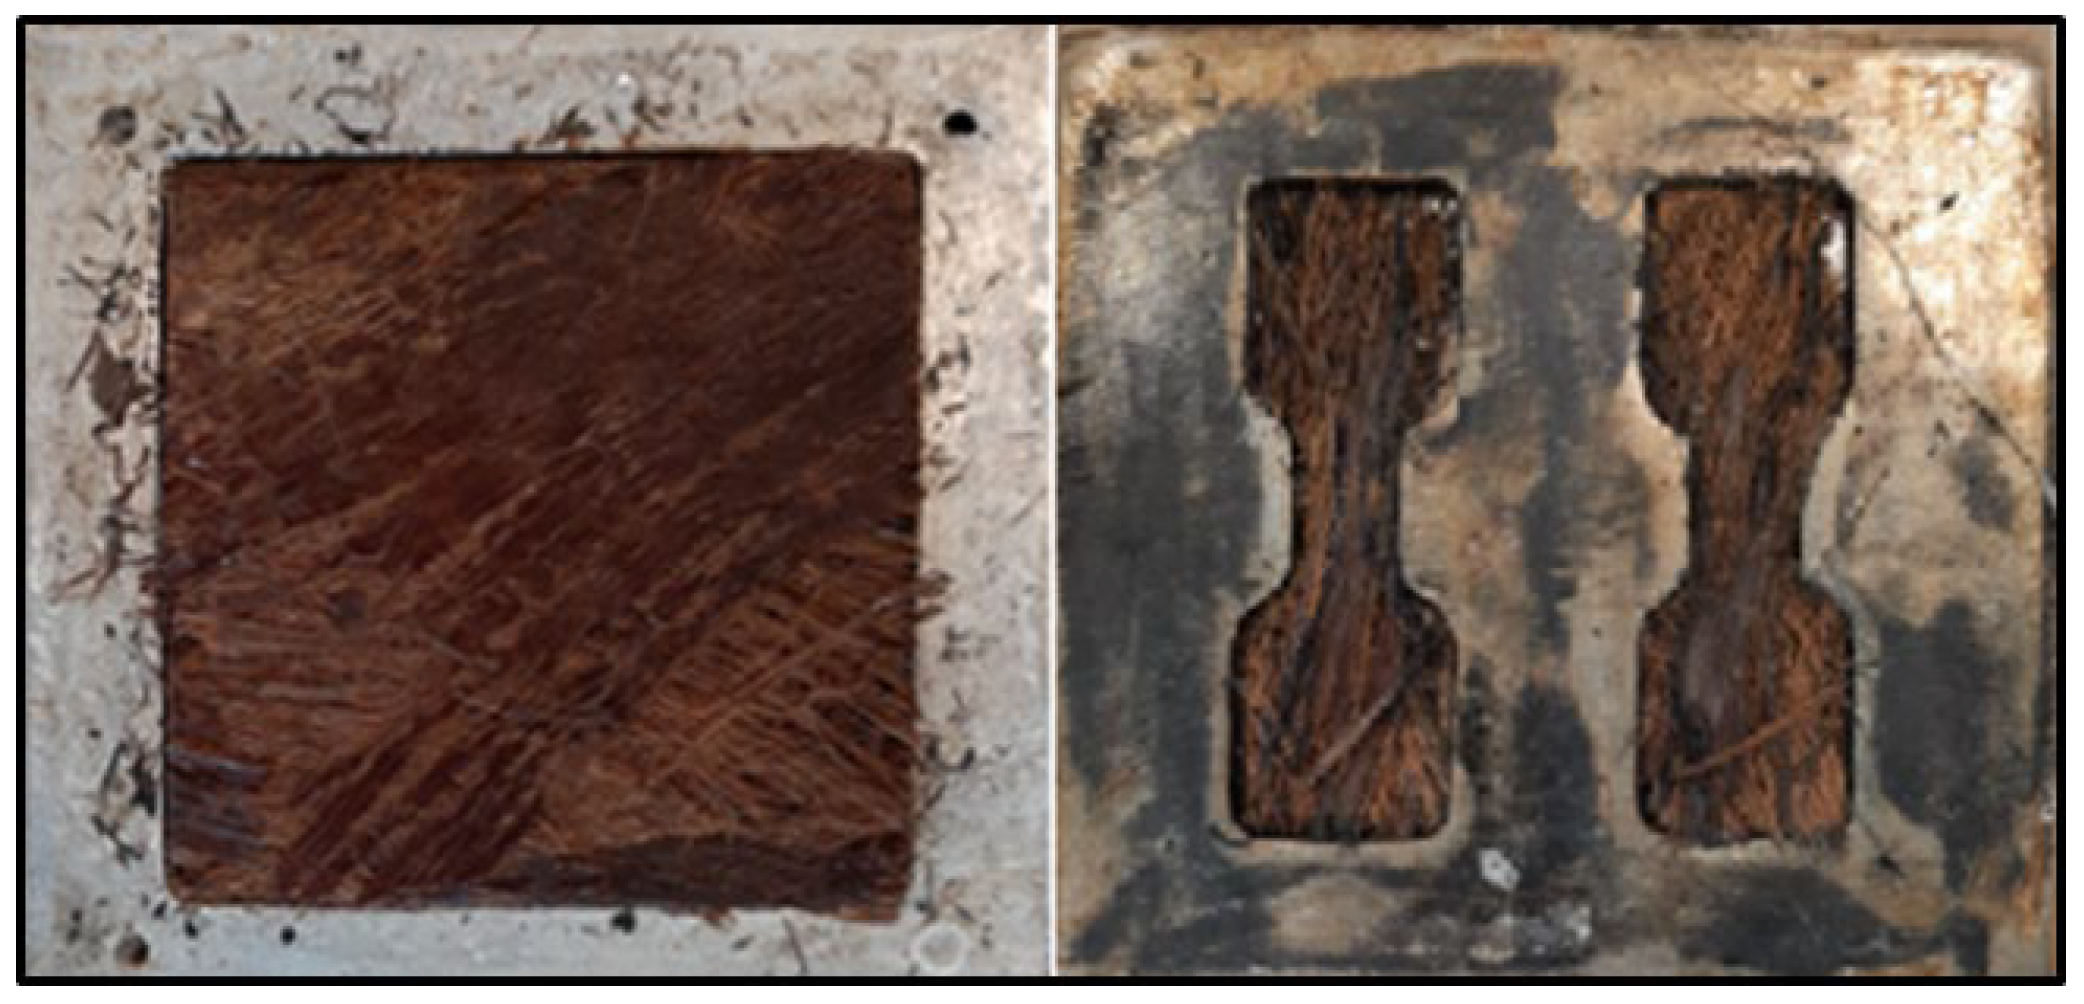
2.2.1. Sample Preparation

The date palm surface fibers (DPSFs) were first cleaned with water to remove any lingering dust or contaminants. The raw DPSFs were rough and rather inflexible; hence, these natural fibers were soaked in water for 24 h at room temperature to render them flexible for processing. The raw fibers were dried in an oven until constant weight was obtained. At 230 °C, an 8 wt.% PVA solution was made by stirring for 30–40 min until all the PVA granules had dissolved in deionized water and the solution turned transparent. Date palm surface fibers were immersed in the PVA solution (200 mL) for 10 min. This ensured that each thread of date palm fiber came into contact with the PVA binder. No specific weight percentage of DPFs/PVA was used. After that, the fibers were removed from the PVA solution and carefully inserted into the mold to completely fill the required space. Figure 2 shows the filled molds for the DPSF/PVA samples produced for the later thermal conductivity and mechanical testing measurements. The molds were then placed in a hot press machine (AUTOFOUR/3015 by Carver, Wabash, IN, USA) for 3 h at 70 °C under a load of 3 tons. Next, the compressed DPSF/PVA samples were oven dried for 48 h at 100 °C. After the water content had been completely vaporized, a coherent sample was obtained. Four samples (A, B, C, and D) of varying density (Figure 3) were created, then comprehensively analyzed [34] and systematically tested. The apparent (bulk) density of each sample was determined using the method of Centiner and Shea [36]. The total mass of each respective sample was divided by the volume of the mold. Similarly, a real density can also be measured using the area of the mold. The square mold used to make each sample for thermal conductivity measurement had dimensions of 11 cm × 11 cm × 3 mm (length × width × thickness). The dog-bone-shaped mold for making samples to test mechanical properties had dimensions of 100 mm × 14 mm × 3 mm (length × width × thickness). The density of each sample is based on three replicates. The average values have been used to represent the samples (Figure 4).

2.2.2. Thermal Conductivity Measurement

The thermal conductivity of the composite samples was measured using a LaserComp FOX-200, Tokyo, Japan. This instrument measures the thermal conductivity of a given sample according to the steady-state method. Its principal is that by measuring the temperature gradient and the power input, and by following the ASTM C1045-07 standard, one can calculate the thermal conductivity value. The thermal conductivity measurement was performed in triplicate. The standard deviation was very low. For example, the calculations of thermal conductivity at 25 °C for the four samples can be seen in Figure 5.

2.2.3. Thermogravimetric Analysis (TGA)

This investigation was carried out to determine the prepared composite’s thermal stability. A thermogravimetric analyzer was used to test an insulation composite sample consisting of 5–10 mg (TGA Q500 by TA Instruments, New Castle, DE, USA). The insulation composite sample decomposition was studied under a heating rate of 10 °C/min spanning temperatures of 25–800 °C. The carrier gas was nitrogen, which flowed at a rate of 20 mL/min. To obtain least error and to have good accuracy the experiment was performed two times.

2.2.4. Kinetic Study

The activation energy ( E a ) was estimated using the fundamental Coats–Redfern equation, as presented in Equation (1) [37]:
ln g α T 2 K = ln A R β E a 1 2 R T E a E a R T
where g(α) denotes the model for the reaction mechanism; β (°C/min) is the rate of heating; R is a universal constant, taking the value of 0.008321 kJ/mol; T (Kelvin) is the reaction temperature; and A ( m 1 ) is the pre-exponential or frequency factor.
The α term is the conversion amount, calculated using Equation (2) [38]:
α = m o m i m o m f
where m o is the original mass of the respective sample at t = 0, m i is the instantaneous mass of the respective sample at any time t, and m f is the final mass of the respective sample.
Plotting the left side of Equation (1) ( ln g α T 2 K ) vs. 1/T will yield both E a and A. The fitted straight line’s slope will be equivalent to −Ea/R and its intercept is ln A R β E a .

2.2.5. Differential Scanning Calorimetry (DSC)

The differential scanning calorimetry (DSC) analysis was conducted using a TA instrument (model DSC25, TA instruments, New Castle, USA). A DSC analysis was performed on a 5-mg sub-sample across a temperature range of 25–250 °C. Nitrogen at a flow rate of 5 mL/min was used to maintain the system under inert conditions. The heating rate was set to 10 °C/min in the ramp mode. To obtain least error and to have good accuracy the experiment was performed two times.

2.2.6. Fourier Transformation Infrared (FTIR)

The FTIR analysis of the four prepared samples was performed on an IRTracer-100 FTIR spectrometer (Shimadzu, Kyoto, Japan). The FTIR results were used to examine the changes in the functional groups at different wavelengths. An advanced Fourier transform infrared (ATR-FTIR) spectrograph was obtained per sample, having a range of 500 to 4000 cm−1, 34 scans on average, and a spectral resolution of 4 cm−1.

2.2.7. Scanning Electron Microscopy (SEM)

A JEOL/EO scanning electron microscope (SEM), operating at 5 kV, was used to observe the surface morphology of the prepared composite samples. The samples were gold-coated before this analysis to avoid any electrostatic charges during their examination.

2.2.8. X-Ray Diffraction (XRD)

The index of crystallization of the samples was determined by the X-ray diffraction analysis method. Each sample was investigated using Cu K radiation, for which the working lamp parameters were set as follows: receiving slit = 0.15 mm, v = 40 kV, I = 30 mA. The SEGAL method was used to calculate the crystallinity index, as follows:
X c r = I 200 I a m I 200
where X c r is the index of crystallinity; I 200 corresponds to the diffracted intensity at the highest crystalline peak; and I a m denotes the diffraction intensity of the amorphous region.

2.2.9. Mechanical Testing

The tensile properties of the four fabricated composite samples were measured with an autograph testing machine (Shimadzu Co. AGS-20NJ Series, Kyoto, Japan). To do this, each sample was extended at a constant elongation velocity of 10 mm/min until it broke. Dog-bone-shaped samples, as shown in Figure 2, were prepared for this mechanical analysis.

3. Results and Discussion

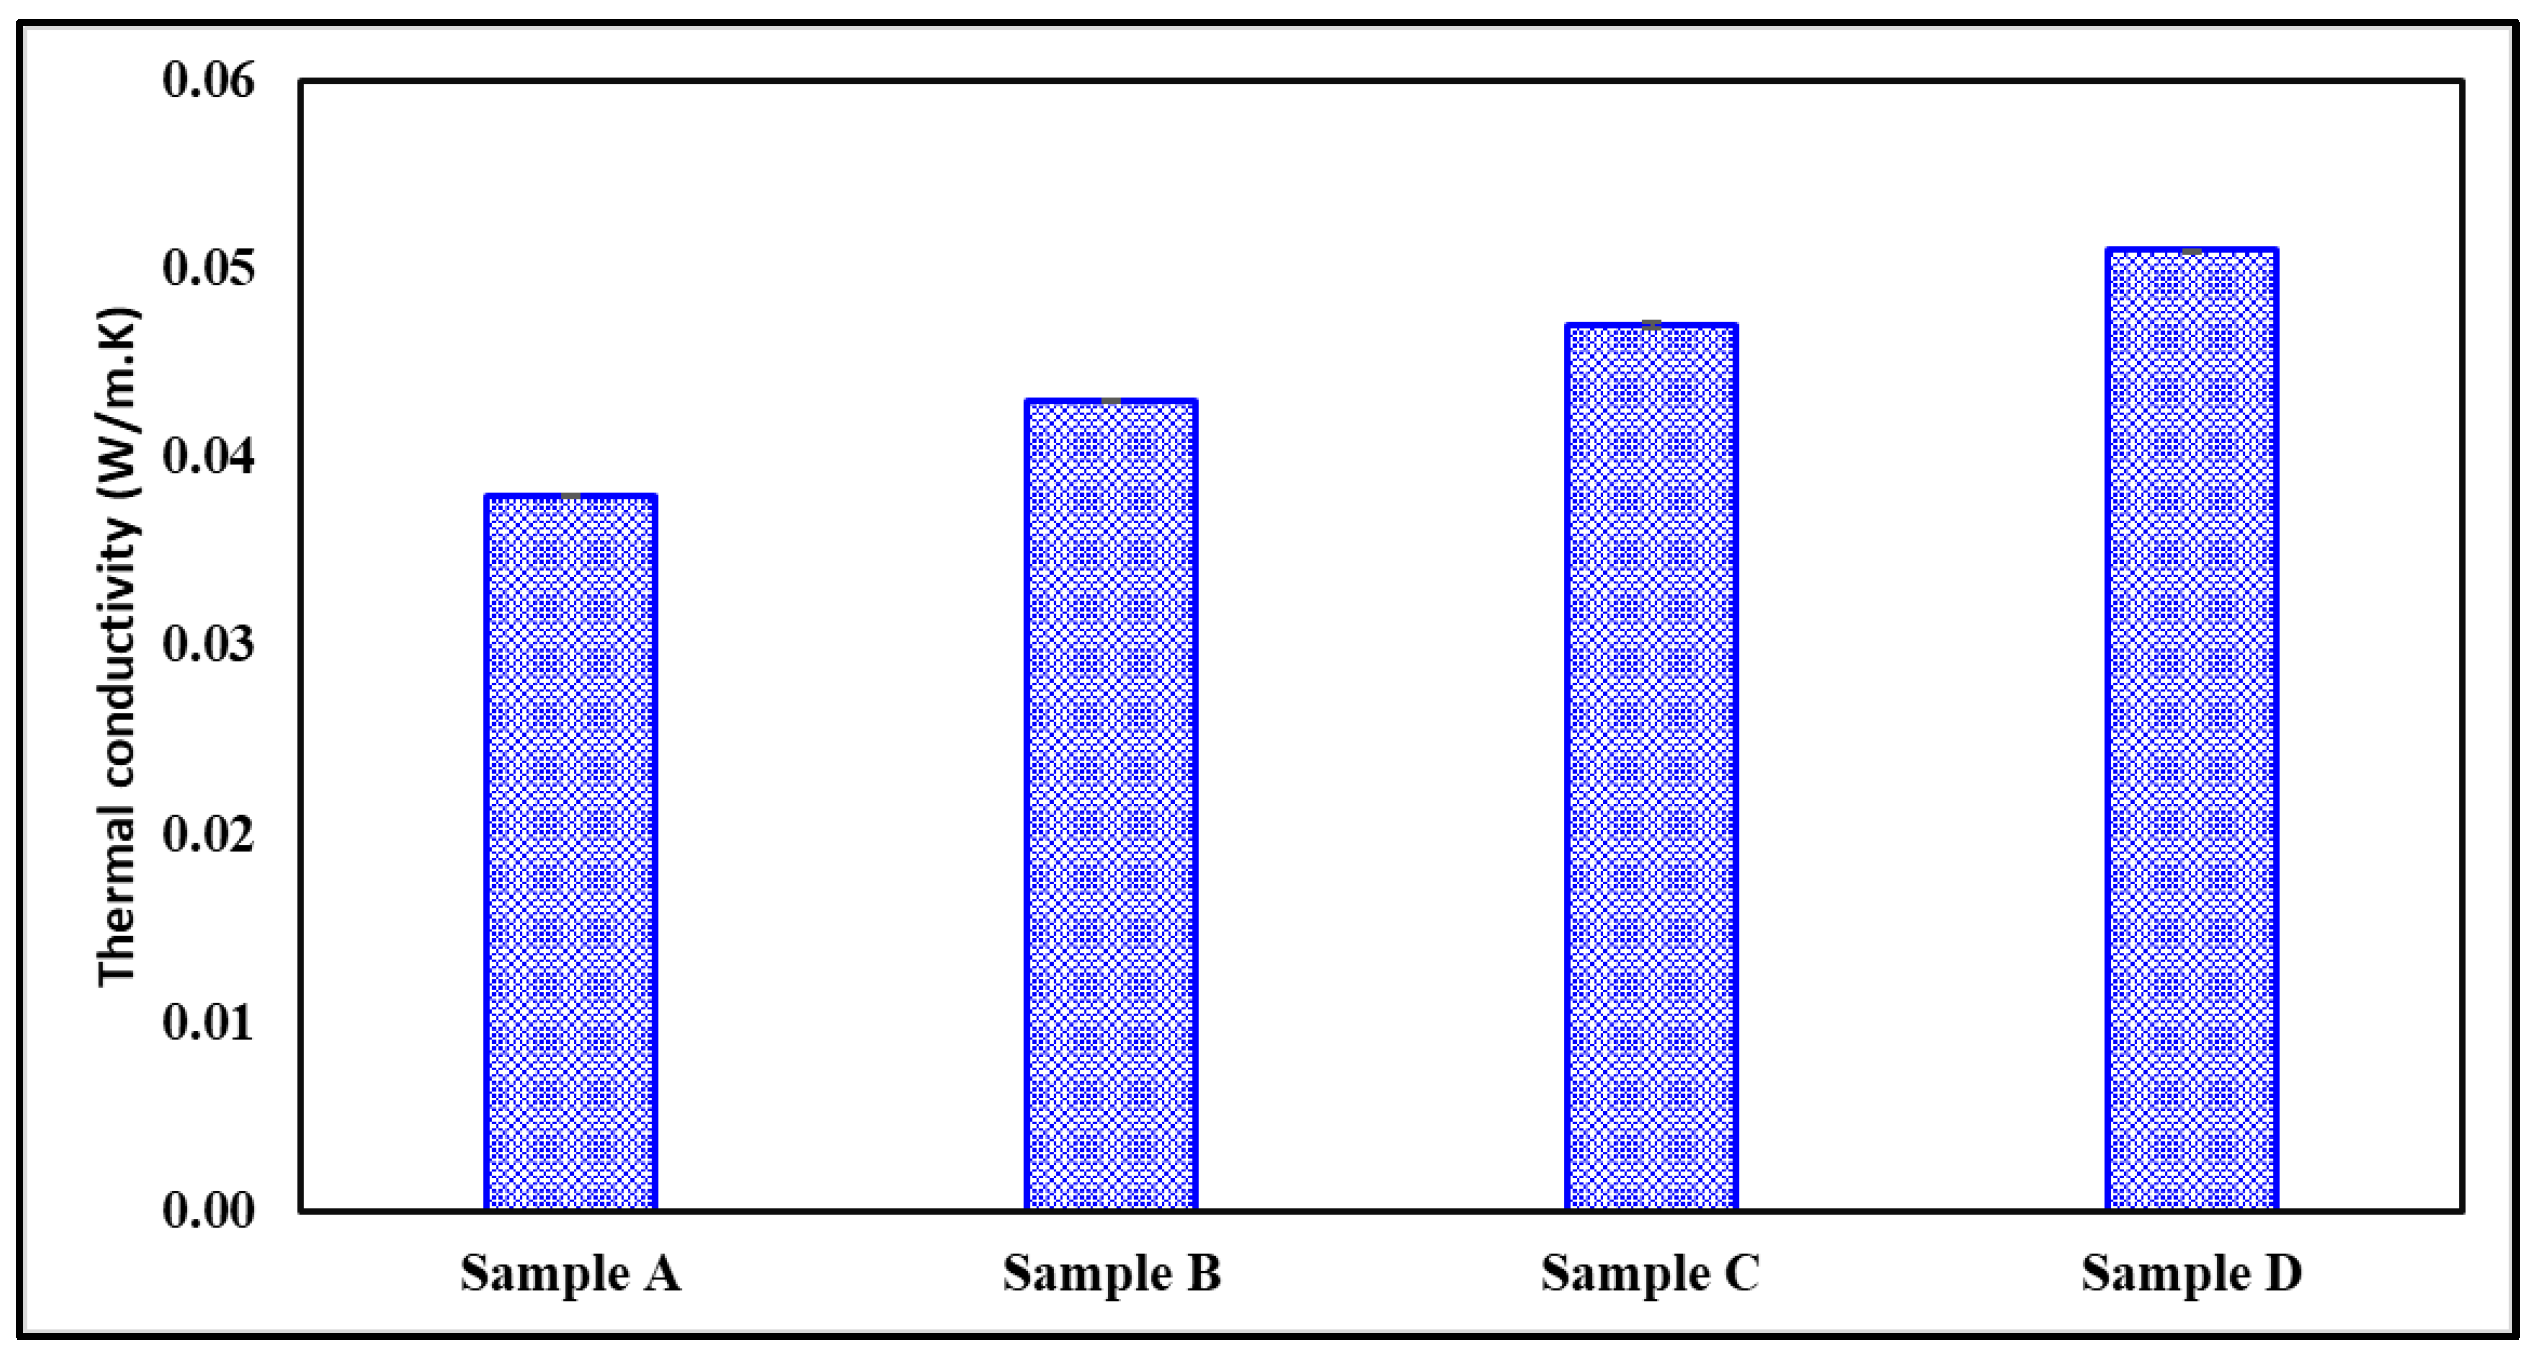
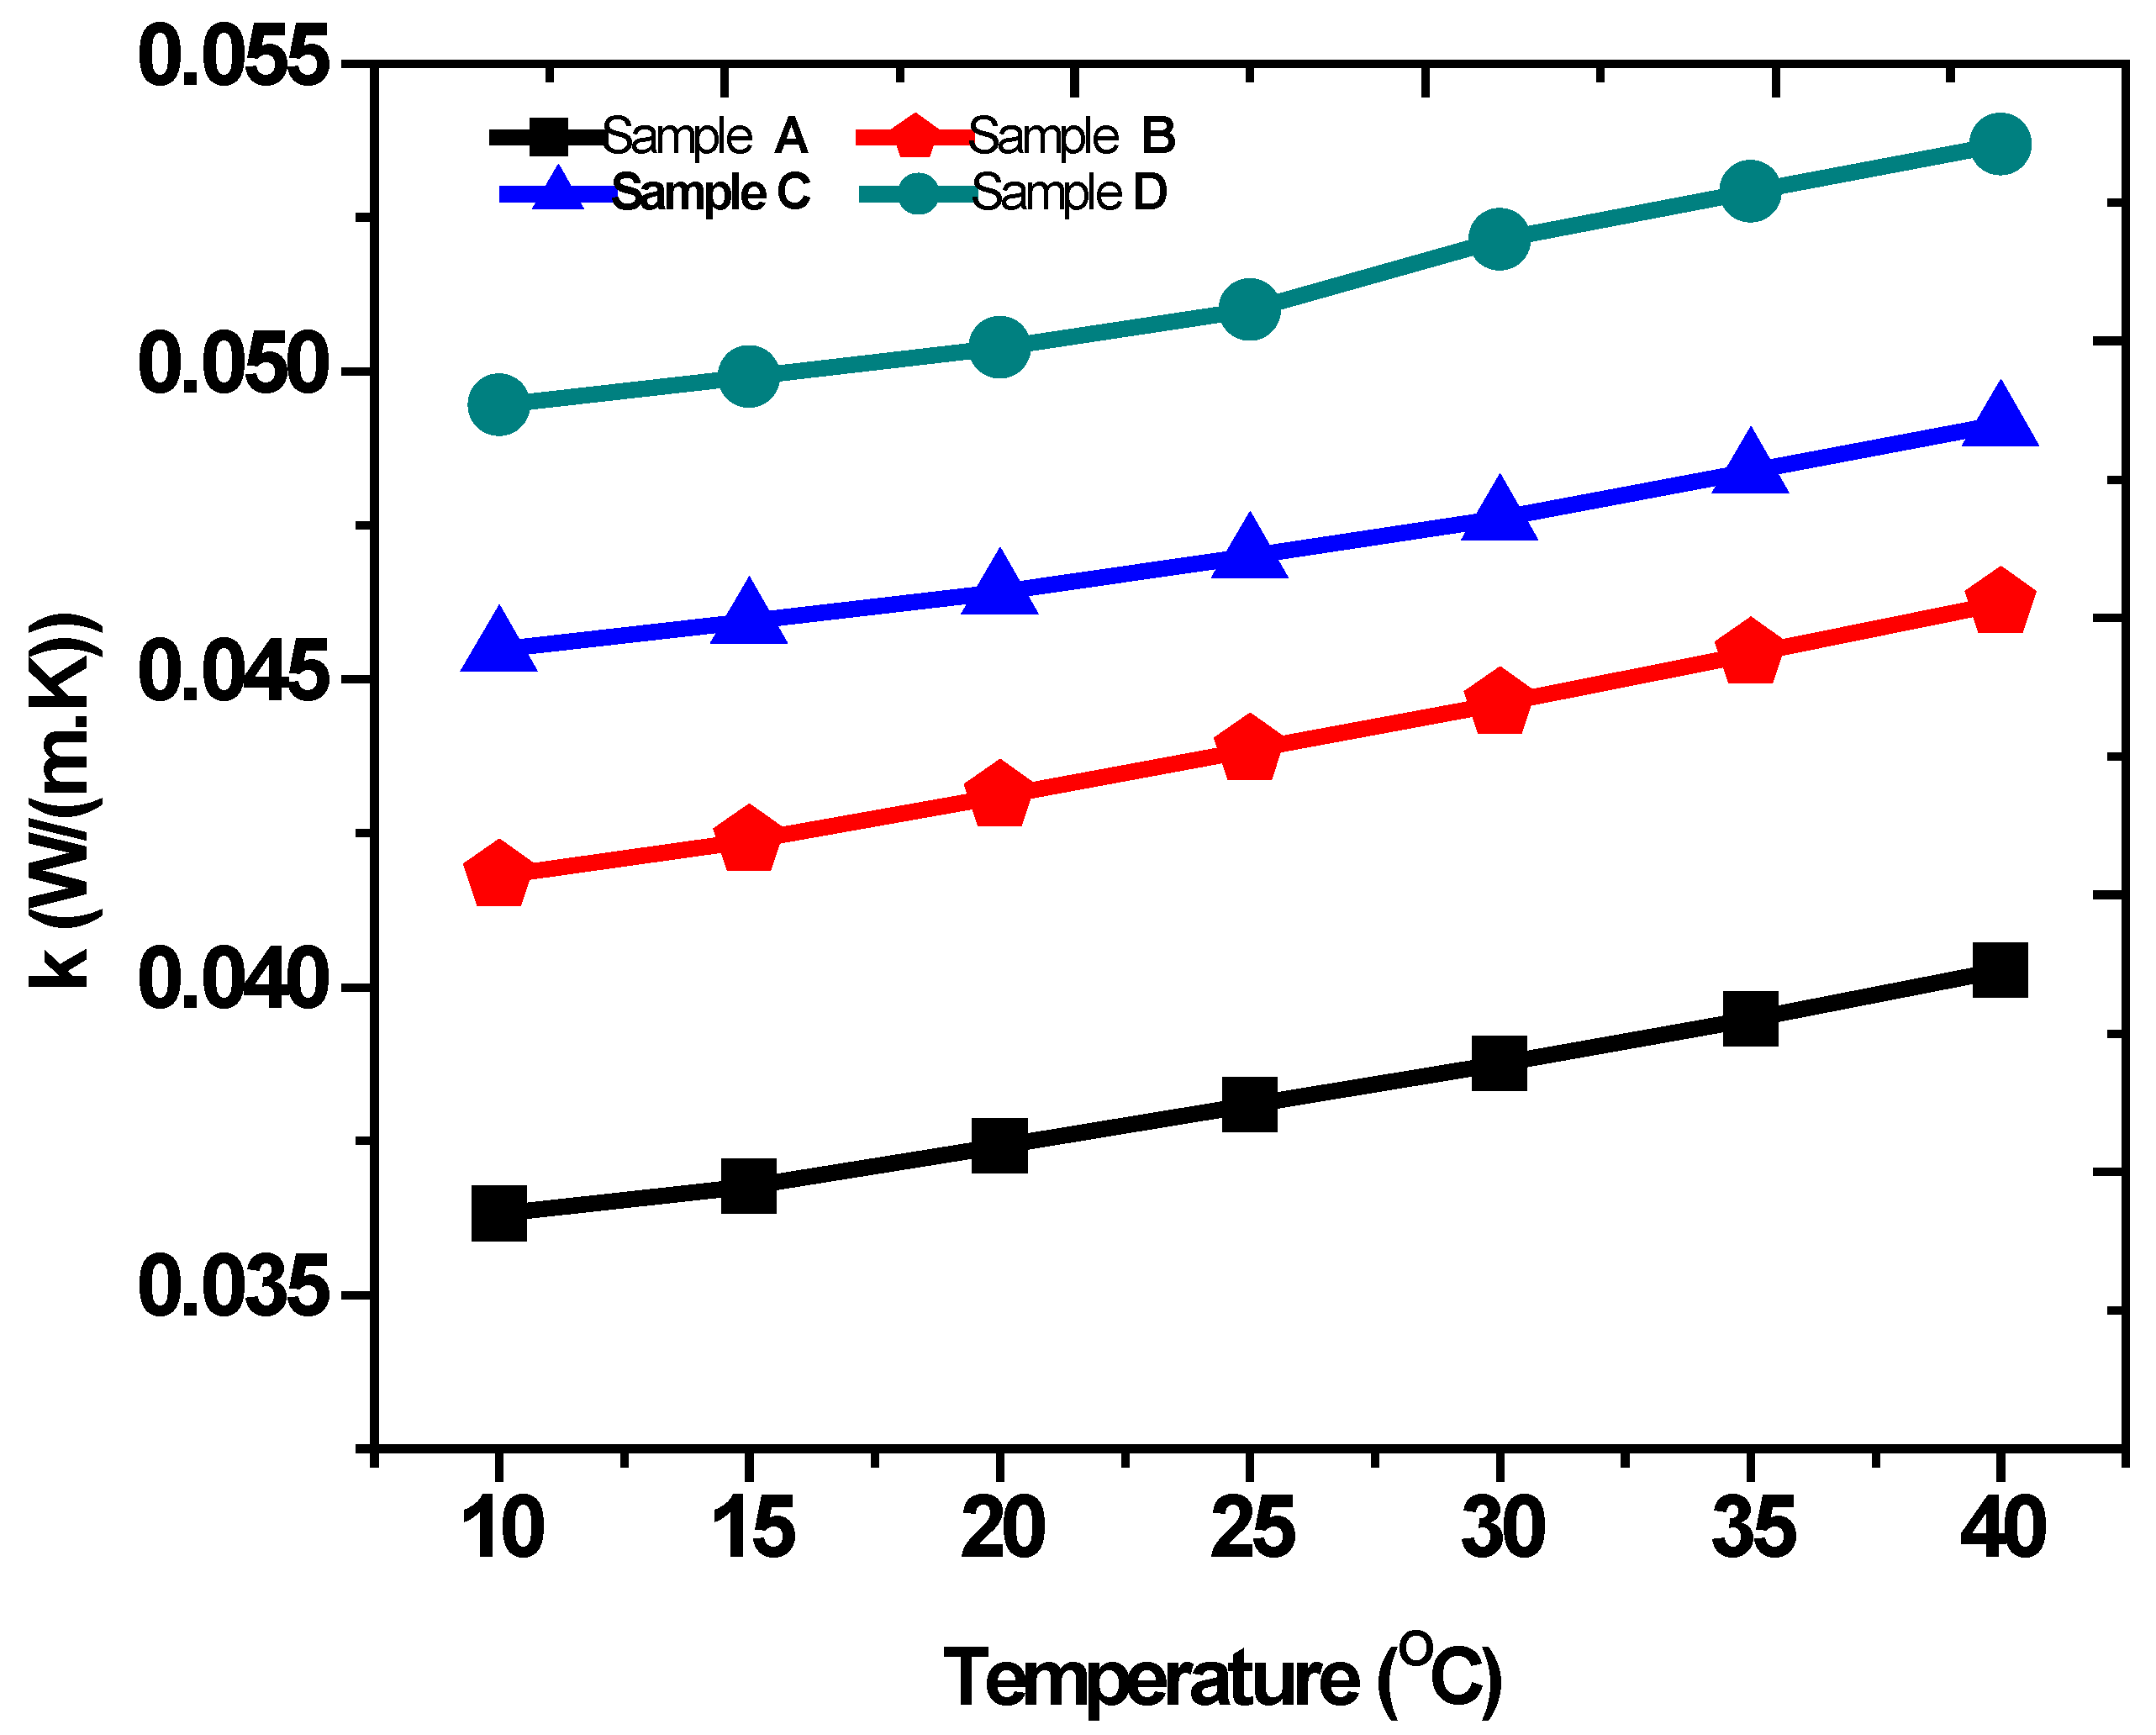
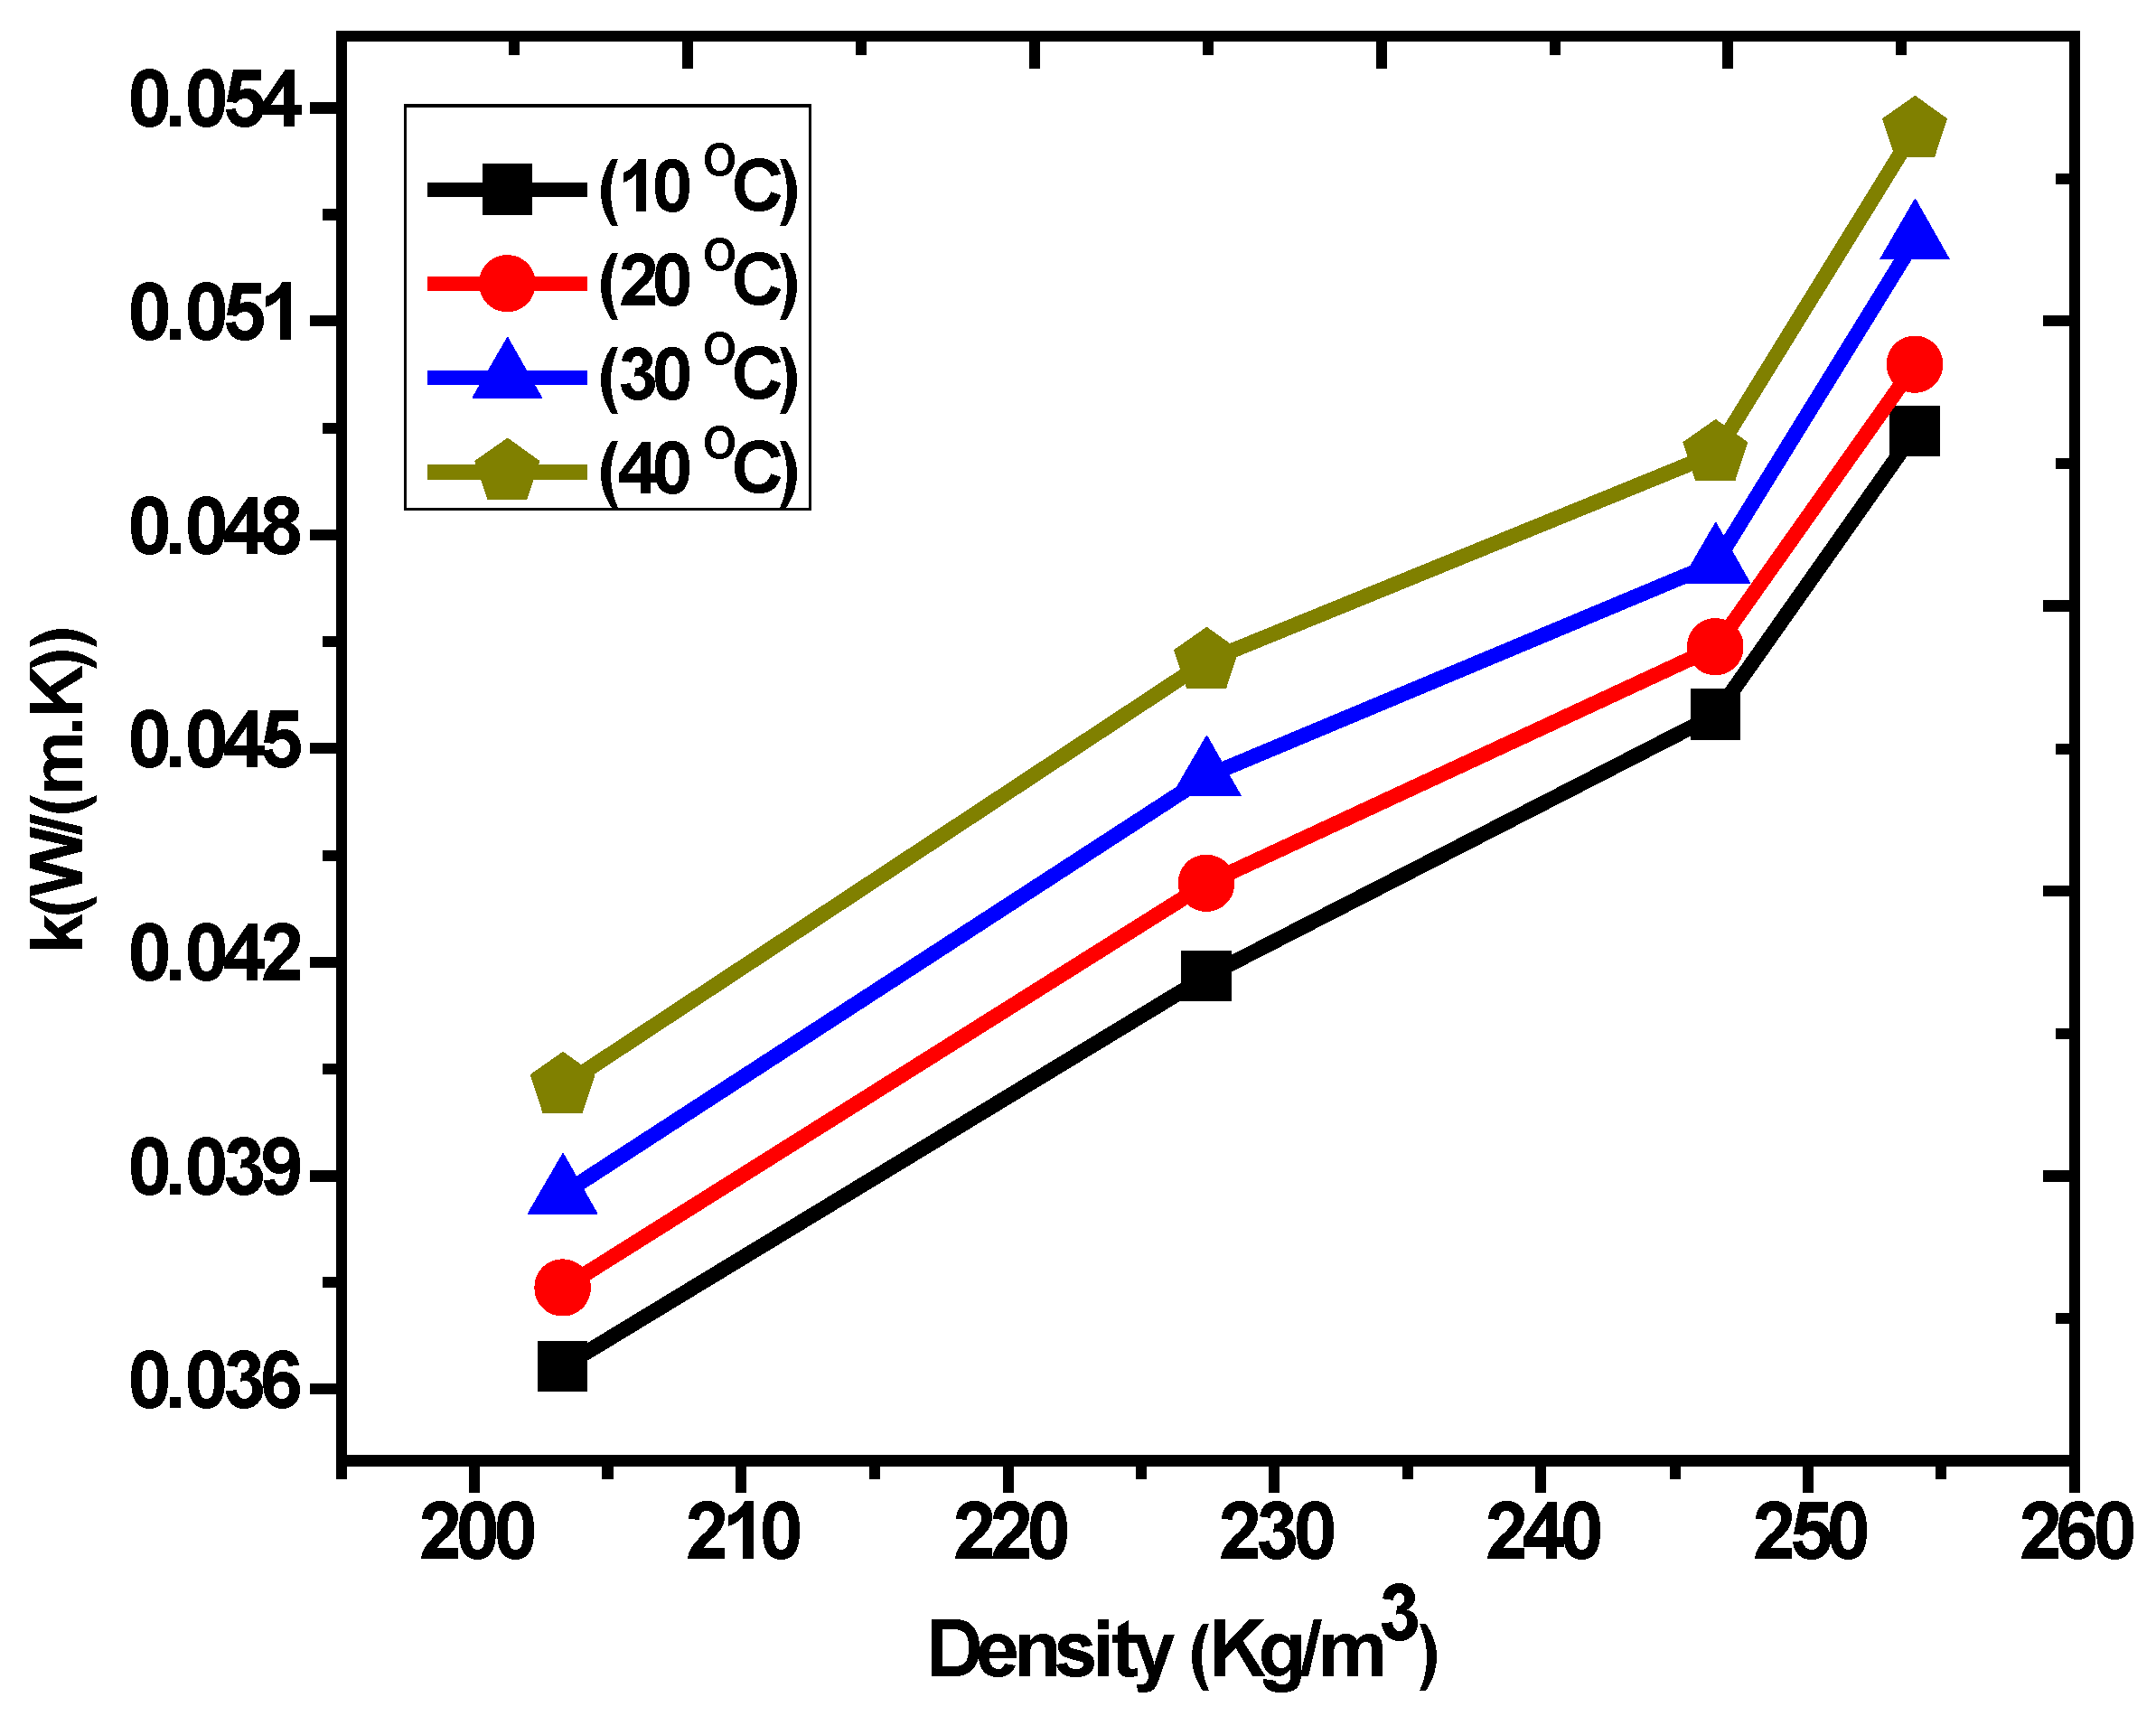
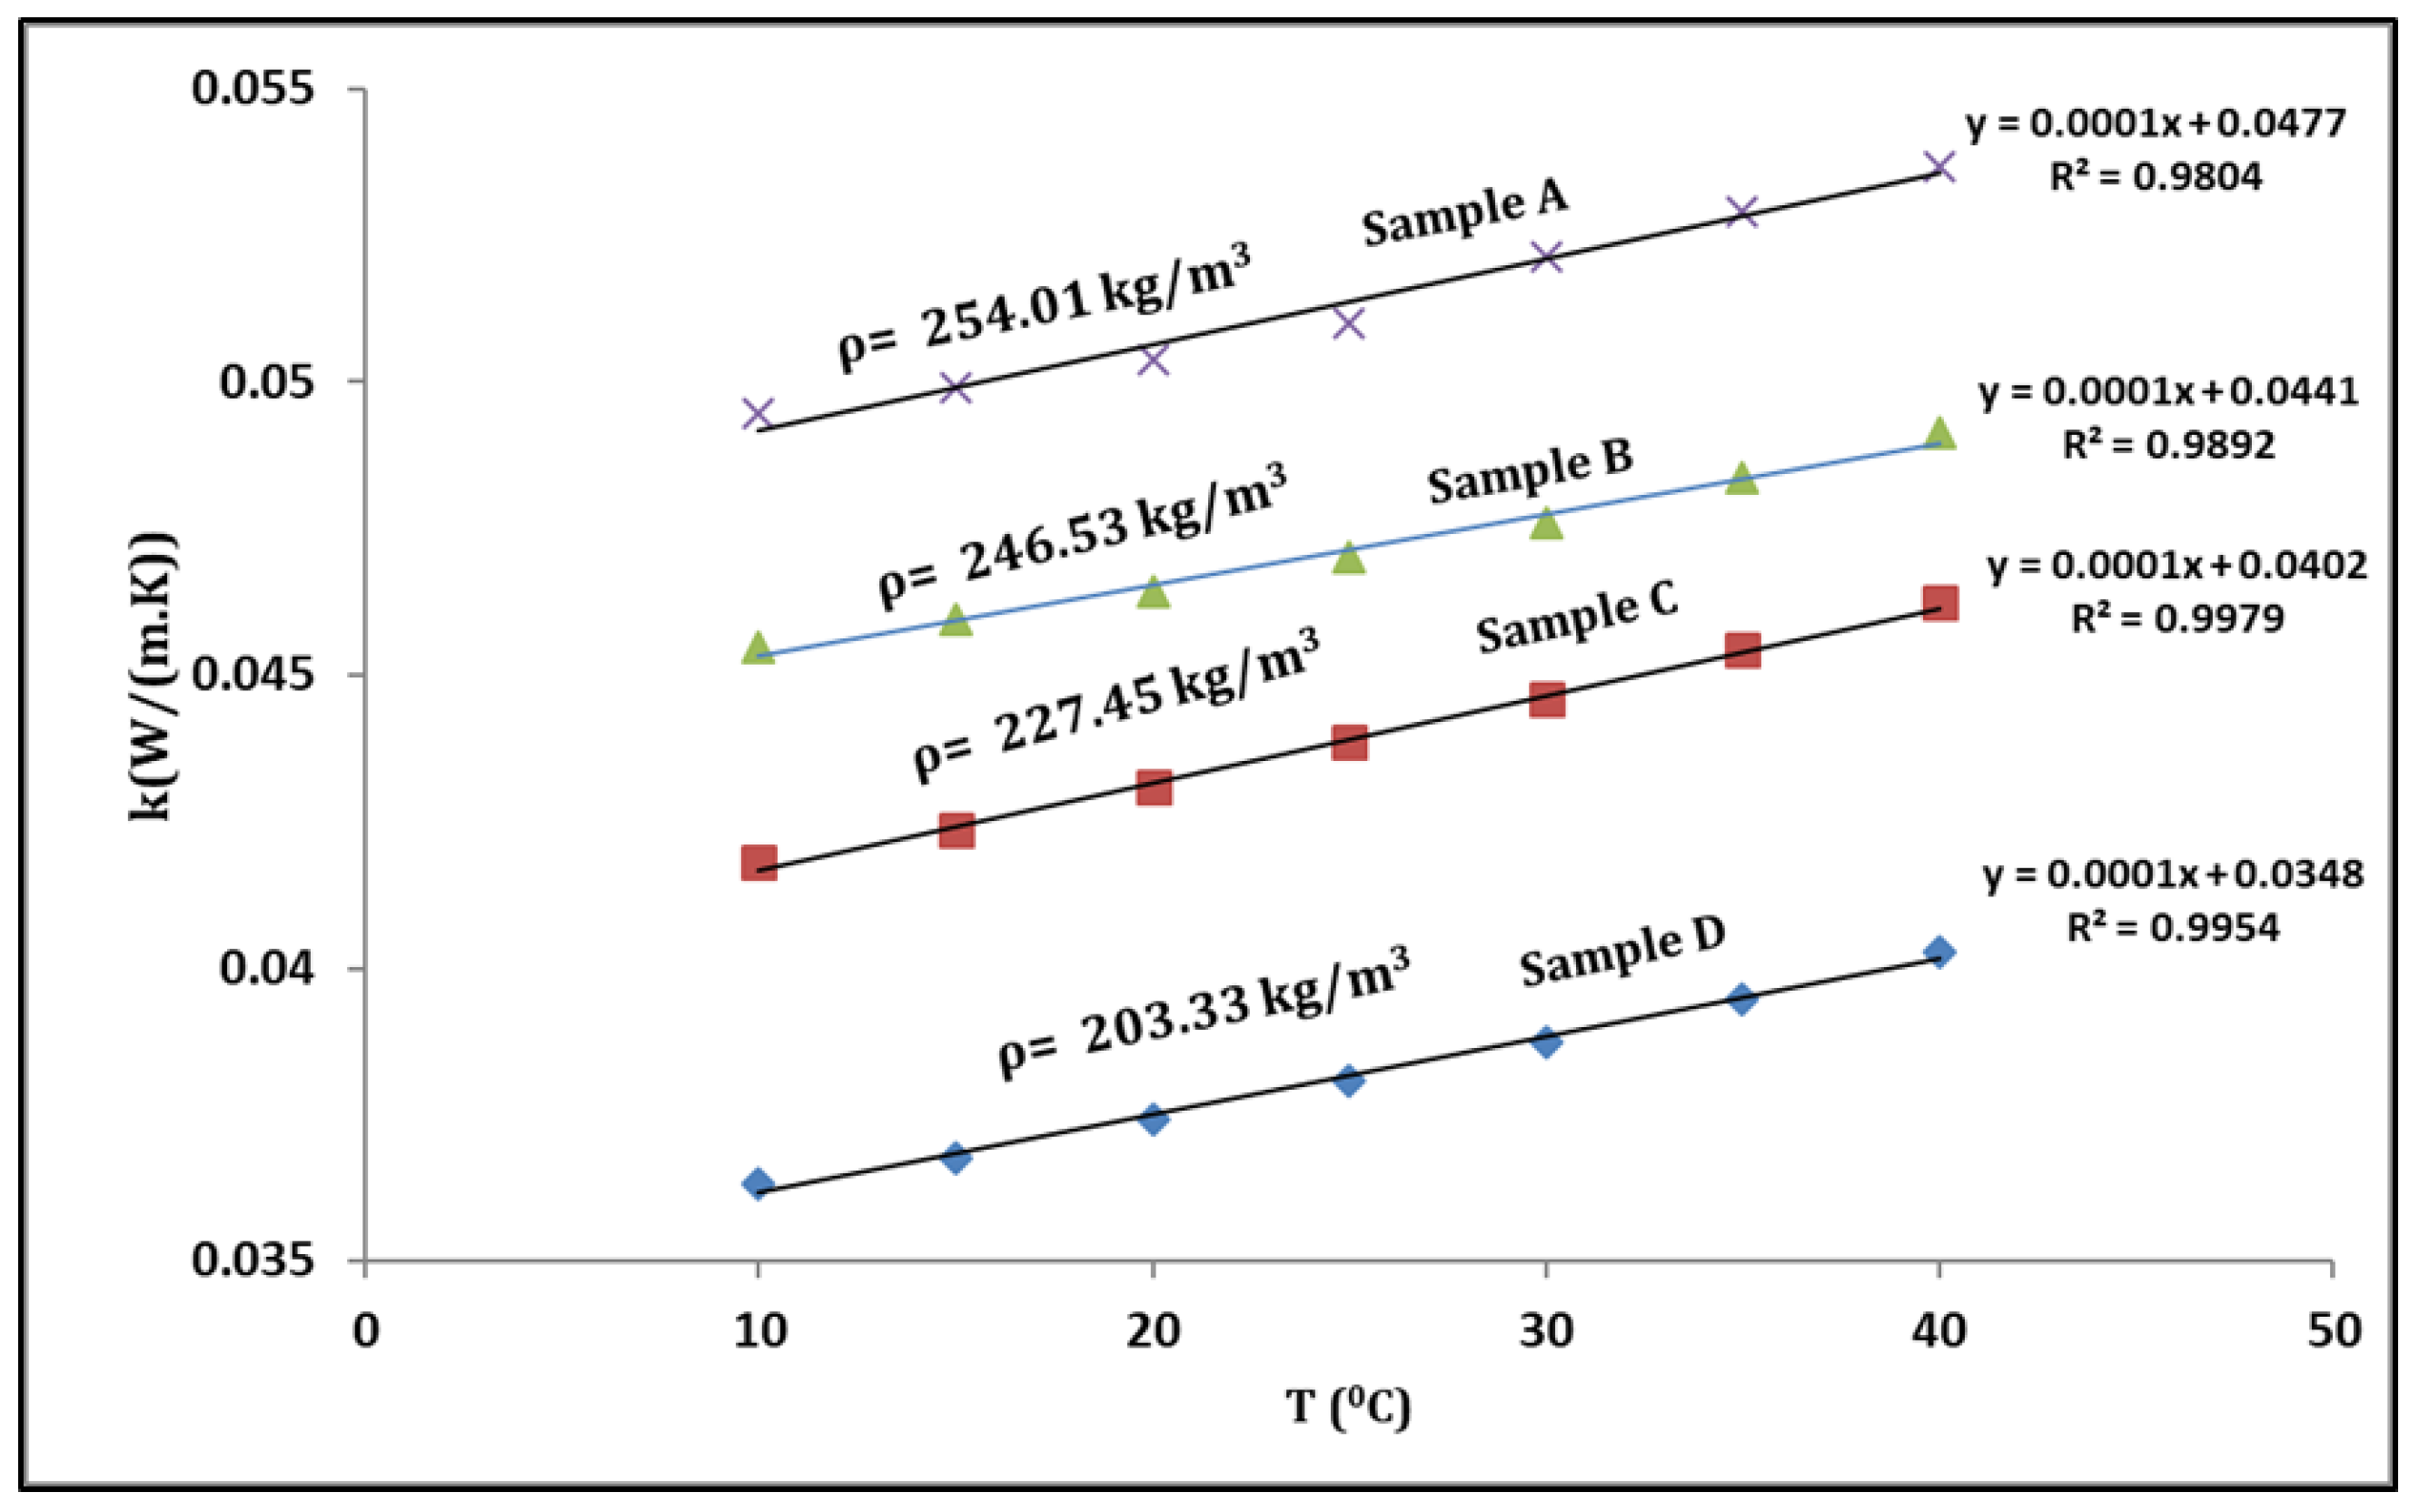
3.1. Thermal Conductivity (k) and Diffusivity (α)

Figure 6 shows the thermal conductivity profiles of four composite samples, whose respective densities were 203 kg/m3, 227 kg/m3, 247 kg/m3, and 254 kg/m3. Evidently, thermal conductivity of the samples increases with their increasing density. At 25 °C, the thermal conductivity of Sample A with the lowest density (203 kg/m3) was 0.038 W / m · K , 0.043 W / m · K for Sample B with a density of (227 kg/m3), 0.047 W / m · K for Sample C with a density of (246 kg/m3), and 0.051 W / m · K for Sample D with the highest density (254 kg/m3).
It should also be noted that for a given density of the composite, its thermal conductivity also increases linearly with temperature. For example, if the sample has a density of 203 kg/m3 (Sample A), its thermal conductivity increases from 0.036 W / m · K to 0.040 W / m · K across a temperature range of 10–40 °C (5 °C increments).
Figure 7 shows that at every fixed temperature (from 10 to 40 °C), the thermal conductivity increases linearly as the sample density increases. At 30 °C, this being close to the normal application temperature for building insulating materials, the thermal conductivity increased from 0.03875–0.05215 W / m · K over a sample density spanning 203 kg/m3 to 254 kg/m3. Therefore, the thermal conductivity of dried samples is a function of both temperature and density.
Figure 8 shows the linear fits of thermal conductivity against temperature. Very high regression coefficient values characterized all four samples (>0.98), whose slope values were very small (≈0.0001). This indicated that the thermal conductivity of these insulation samples changed little (low sensitivity) in response to a rising temperature. This is a fundamental characteristic of robust insulation materials.
In Table 2, thermal conductivity values of our prepared heat insulating samples are compared with those of other renewable insulation materials. Ali and Alabdulkarem [32] prepared a thermal insulation material using date palm surface fibers and corn starch as a binding agent; their lowest thermal conductivity was 0.0475 W / m · K at a density of 176 kg/m3. In our study, the thermal conductivity of the date palm fibers bound with polyvinyl alcohol was 0.038 W / m · K at a density of 203 kg/m3. Hence, although their density is lower, their thermal conductivity value is higher than that of date palm fibers bonded with PVA. In addition, the thermal conductivity of this novel composite material is comparable to that of conventional insulation materials. Cellular glass (0.041 W / m · K at 115 kg/m3), glass mineral wool (0.035 W / m · K at ca. 20 kg/m3), polyurethane foam (0.023–0.026 W / m · K at 30–40 kg/m3), expanded polystyrene (0.034–0.038 W / m · K at 15–30 kg/m3), and extruded polystyrene (0.033–0.035 W / m · K at 20–40 kg/m3) are prominent examples of this similarity in performance [39].
The heat capacity ( C p ) of the date palm thermal insulation composite over various temperatures is presented in Table 2. Heat capacity clearly has a linear relation with temperature. Another important physical property of an insulating material is its thermal diffusivity. It is the rate of temperature distribution through a material that predicts the behavior in terms of thermal conduction relative to the heat storage capacity ( C p ). High diffusion means a high heat transfer rate and vice versa. The thermal diffusivity ( α ) was calculated using Equation (4):
T h e r m a l   d i f f u s i v i t y   α = T h e r m a l   c o n d u c t i v i t y   k ρ × C p
where thermal diffusivity (α) is measured in units of m2/s or mm2/s, the ρ is the density of the sample, and C p is the heat capacity of the sample.
Table 3 shows the thermal diffusivity values of the four prepared samples. At 25 °C, Sample A had the lowest thermal diffusivity, being 0.137 mm2/s. In the earlier thermal conductivity analysis, we found the conductivity coefficient (k) rising predictably with temperature, albeit slightly, and considered better at lower temperatures. However, the thermal diffusivity attains higher values at lower temperatures and lower values as the temperature rises. This trend is linked to a greater heat capacity of the samples at higher temperatures that lowers the transport rate of heat through the material. Hence, thermal conductivity cannot be used alone as a measure of insulating material performance. Moreover, thermal diffusivity stayed nearly constant for all four composite samples, in that it changes little with respect to density. A similar relationship between thermal conductivity and thermal diffusivity was reported by Cetiner et al. [36]. Thermal diffusivity of our DPSF-based insulation material is comparable to commercially available insulation materials like cellular glass boards (0.42 mm2/s) and hempcrete blocks (0.15 mm2/s) [39].
Although thermal conductivity and diffusivity are significant, we can additionally account for the thickness of the insulation in our analyses. The thicker the insulating layer the slower the rate of heat loss and the better the building’s ability to retain heat. The U-value comes into play here. The U-value represents the amount of heat lost through a certain thickness of material. This allows you to compare insulation materials and thickness immediately. The calculation of thermal transmittance (U-value) is as follows [42]:
T h e r m a l   t r a n s m i t t a n c e   ( U - value ) = t h e r m a l   c o n d u c t i v i t y t h i c k n e s s
where U-value is in W / m 2 · K , thermal conductivity in W / m · K , and thickness of samples is taken in meters. When considering U-values, a lower number is better; a lower U-value implies that a material transfers less heat and thus is a good insulator [43]. Table 4 shows the U-values of four insulation samples. It can be seen that the U-value of date palm surface fibers based insulation samples is in close comparison to other insulation materials. However, the U-value comparison is more accurate when the thickness is the same between insulators. The general consensus is that the thicker the insulation the lesser the heat transmission. Thermal conductivity, on the other hand, is unaffected by insulation thickness, which instead influences thermal resistance [44]. Lakatos et al. [45] examined the relationships between thermal conductivity and expanded material thickness. They demonstrated that, contrary to U-values, thermal conductivity is independent of insulator thickness. Zack J. et al. [46] showed that U-values decreased with increasing the samples thickness from 40–80 mm. Therefore, the U-values of date palm surface fibers based insulation material can further be decreased at higher sample thickness. However, Mahlia T.M.I. et al. [47] suggested that there is a relation between thermal conductivity and thickness of insulation materials. Therefore, an optimum thickness can be evaluated.

3.2. Thermal Analysis

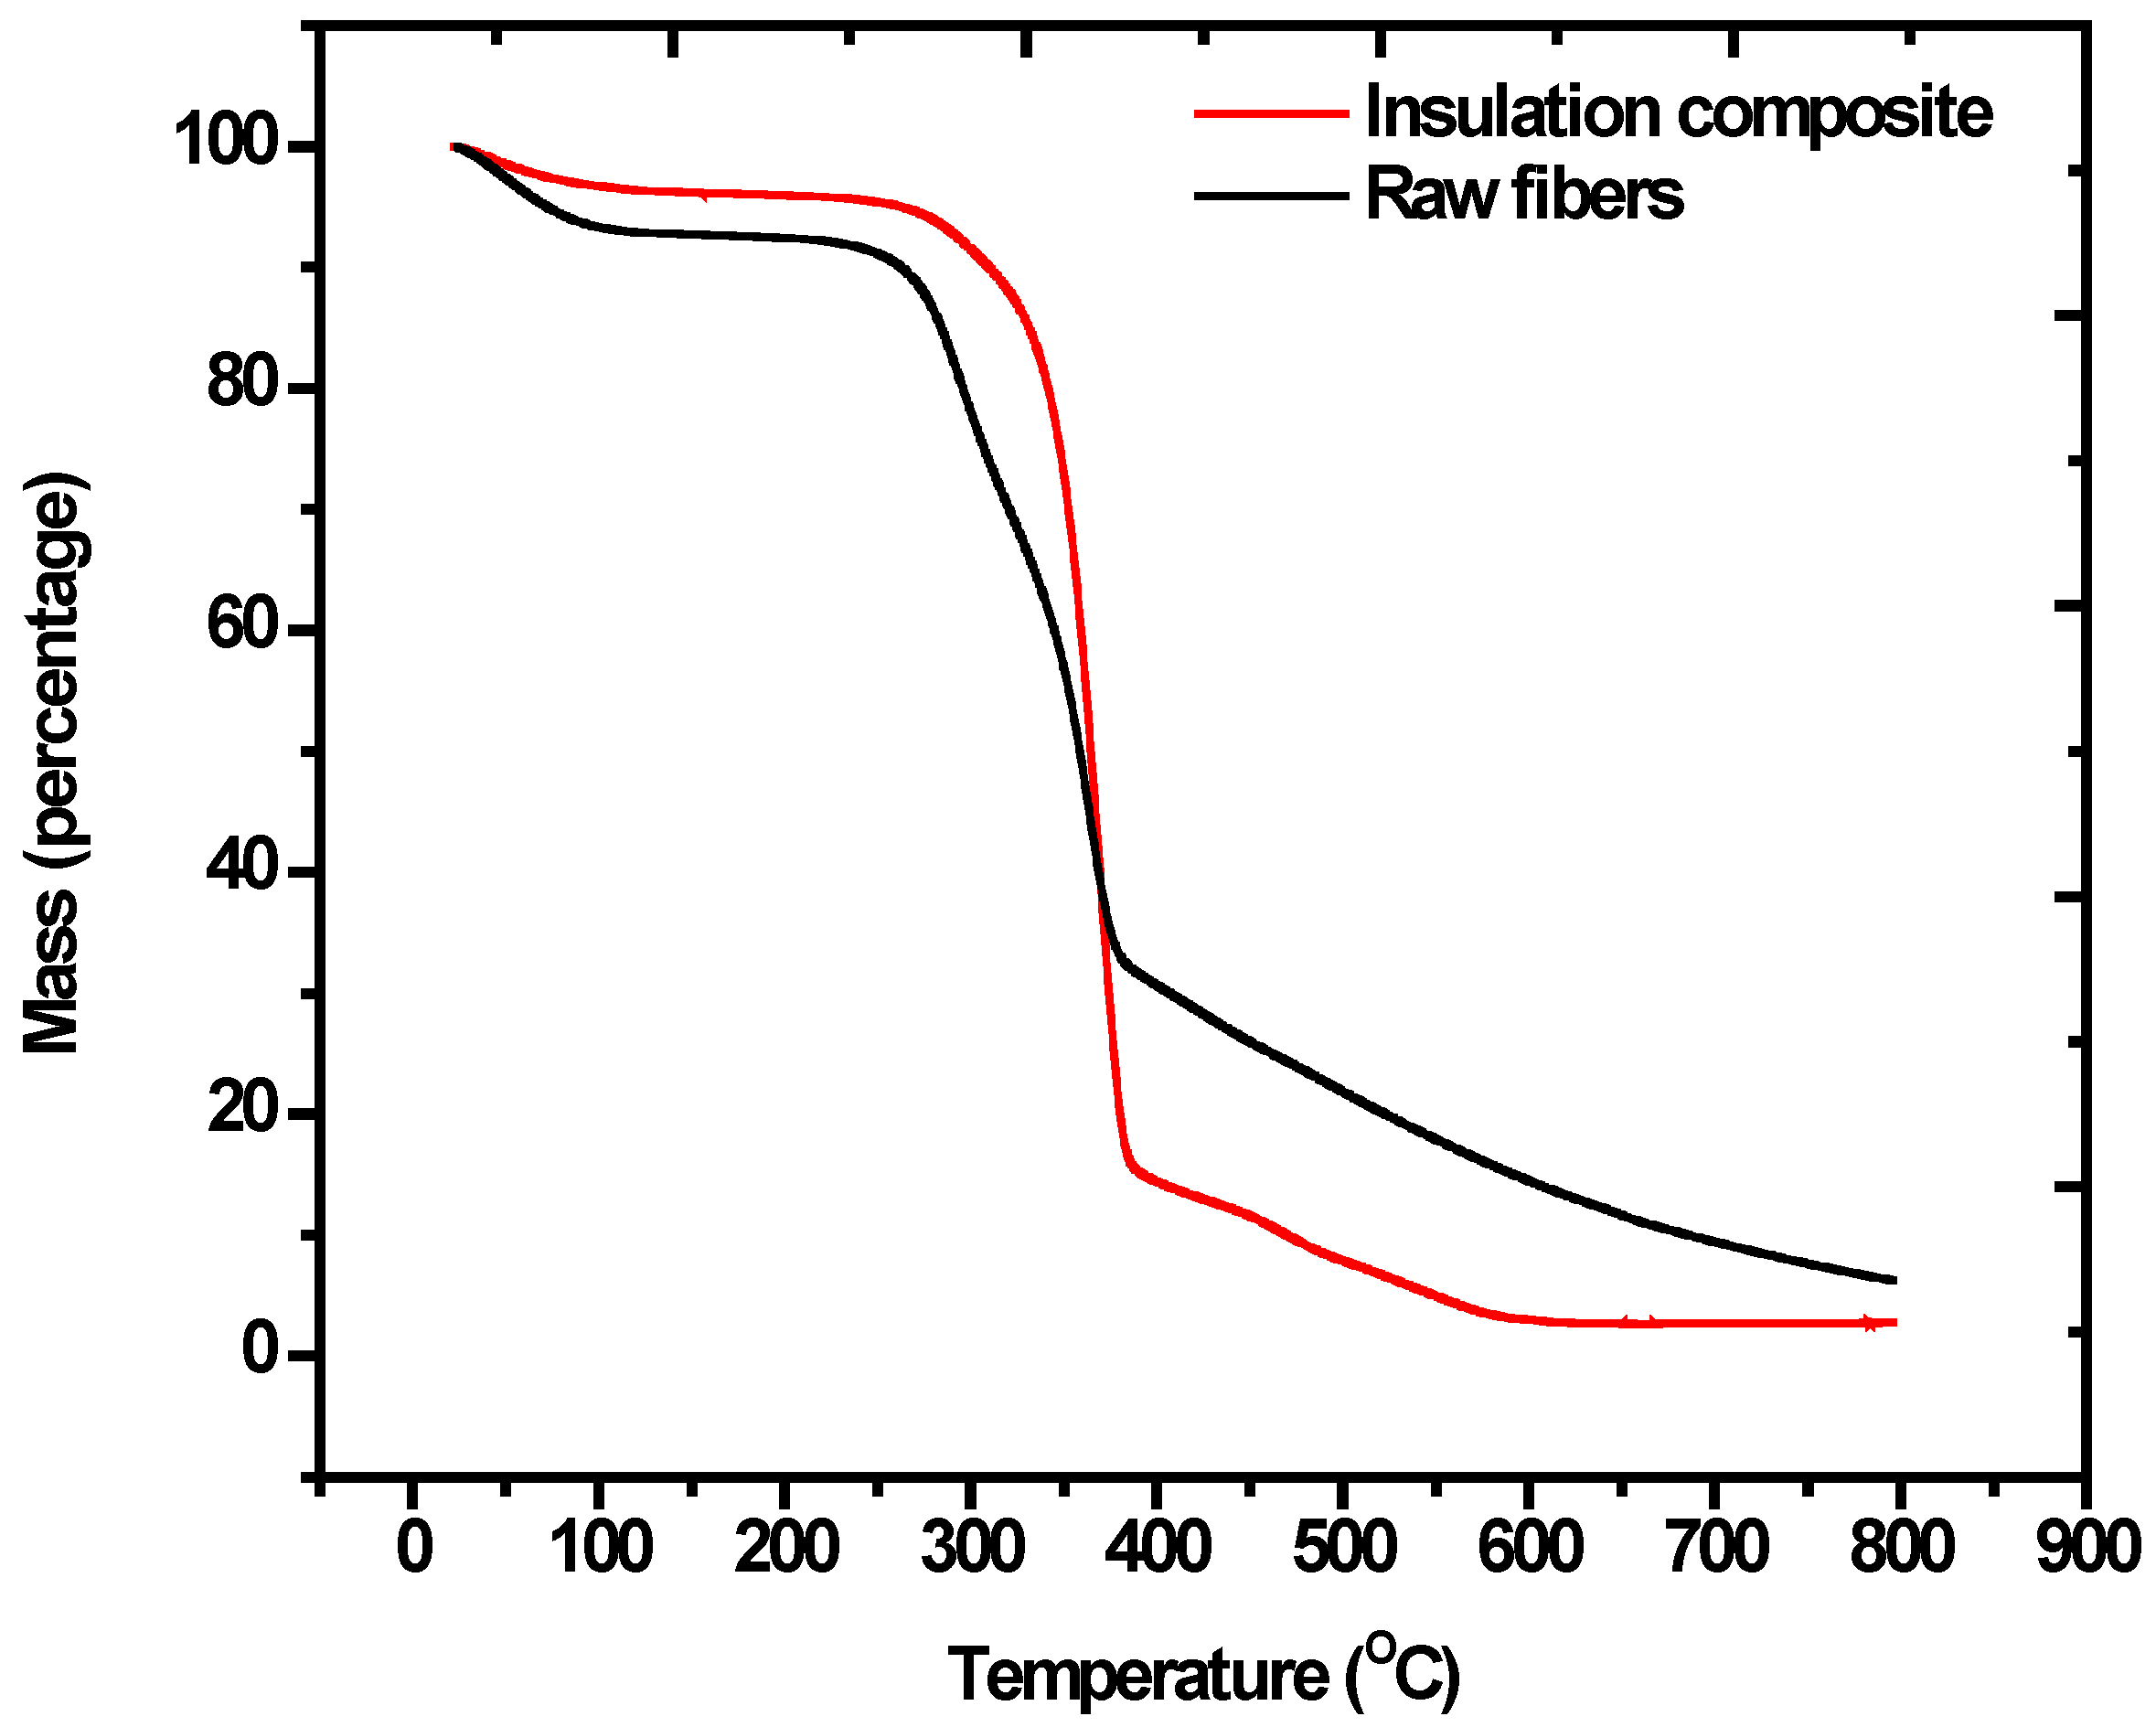
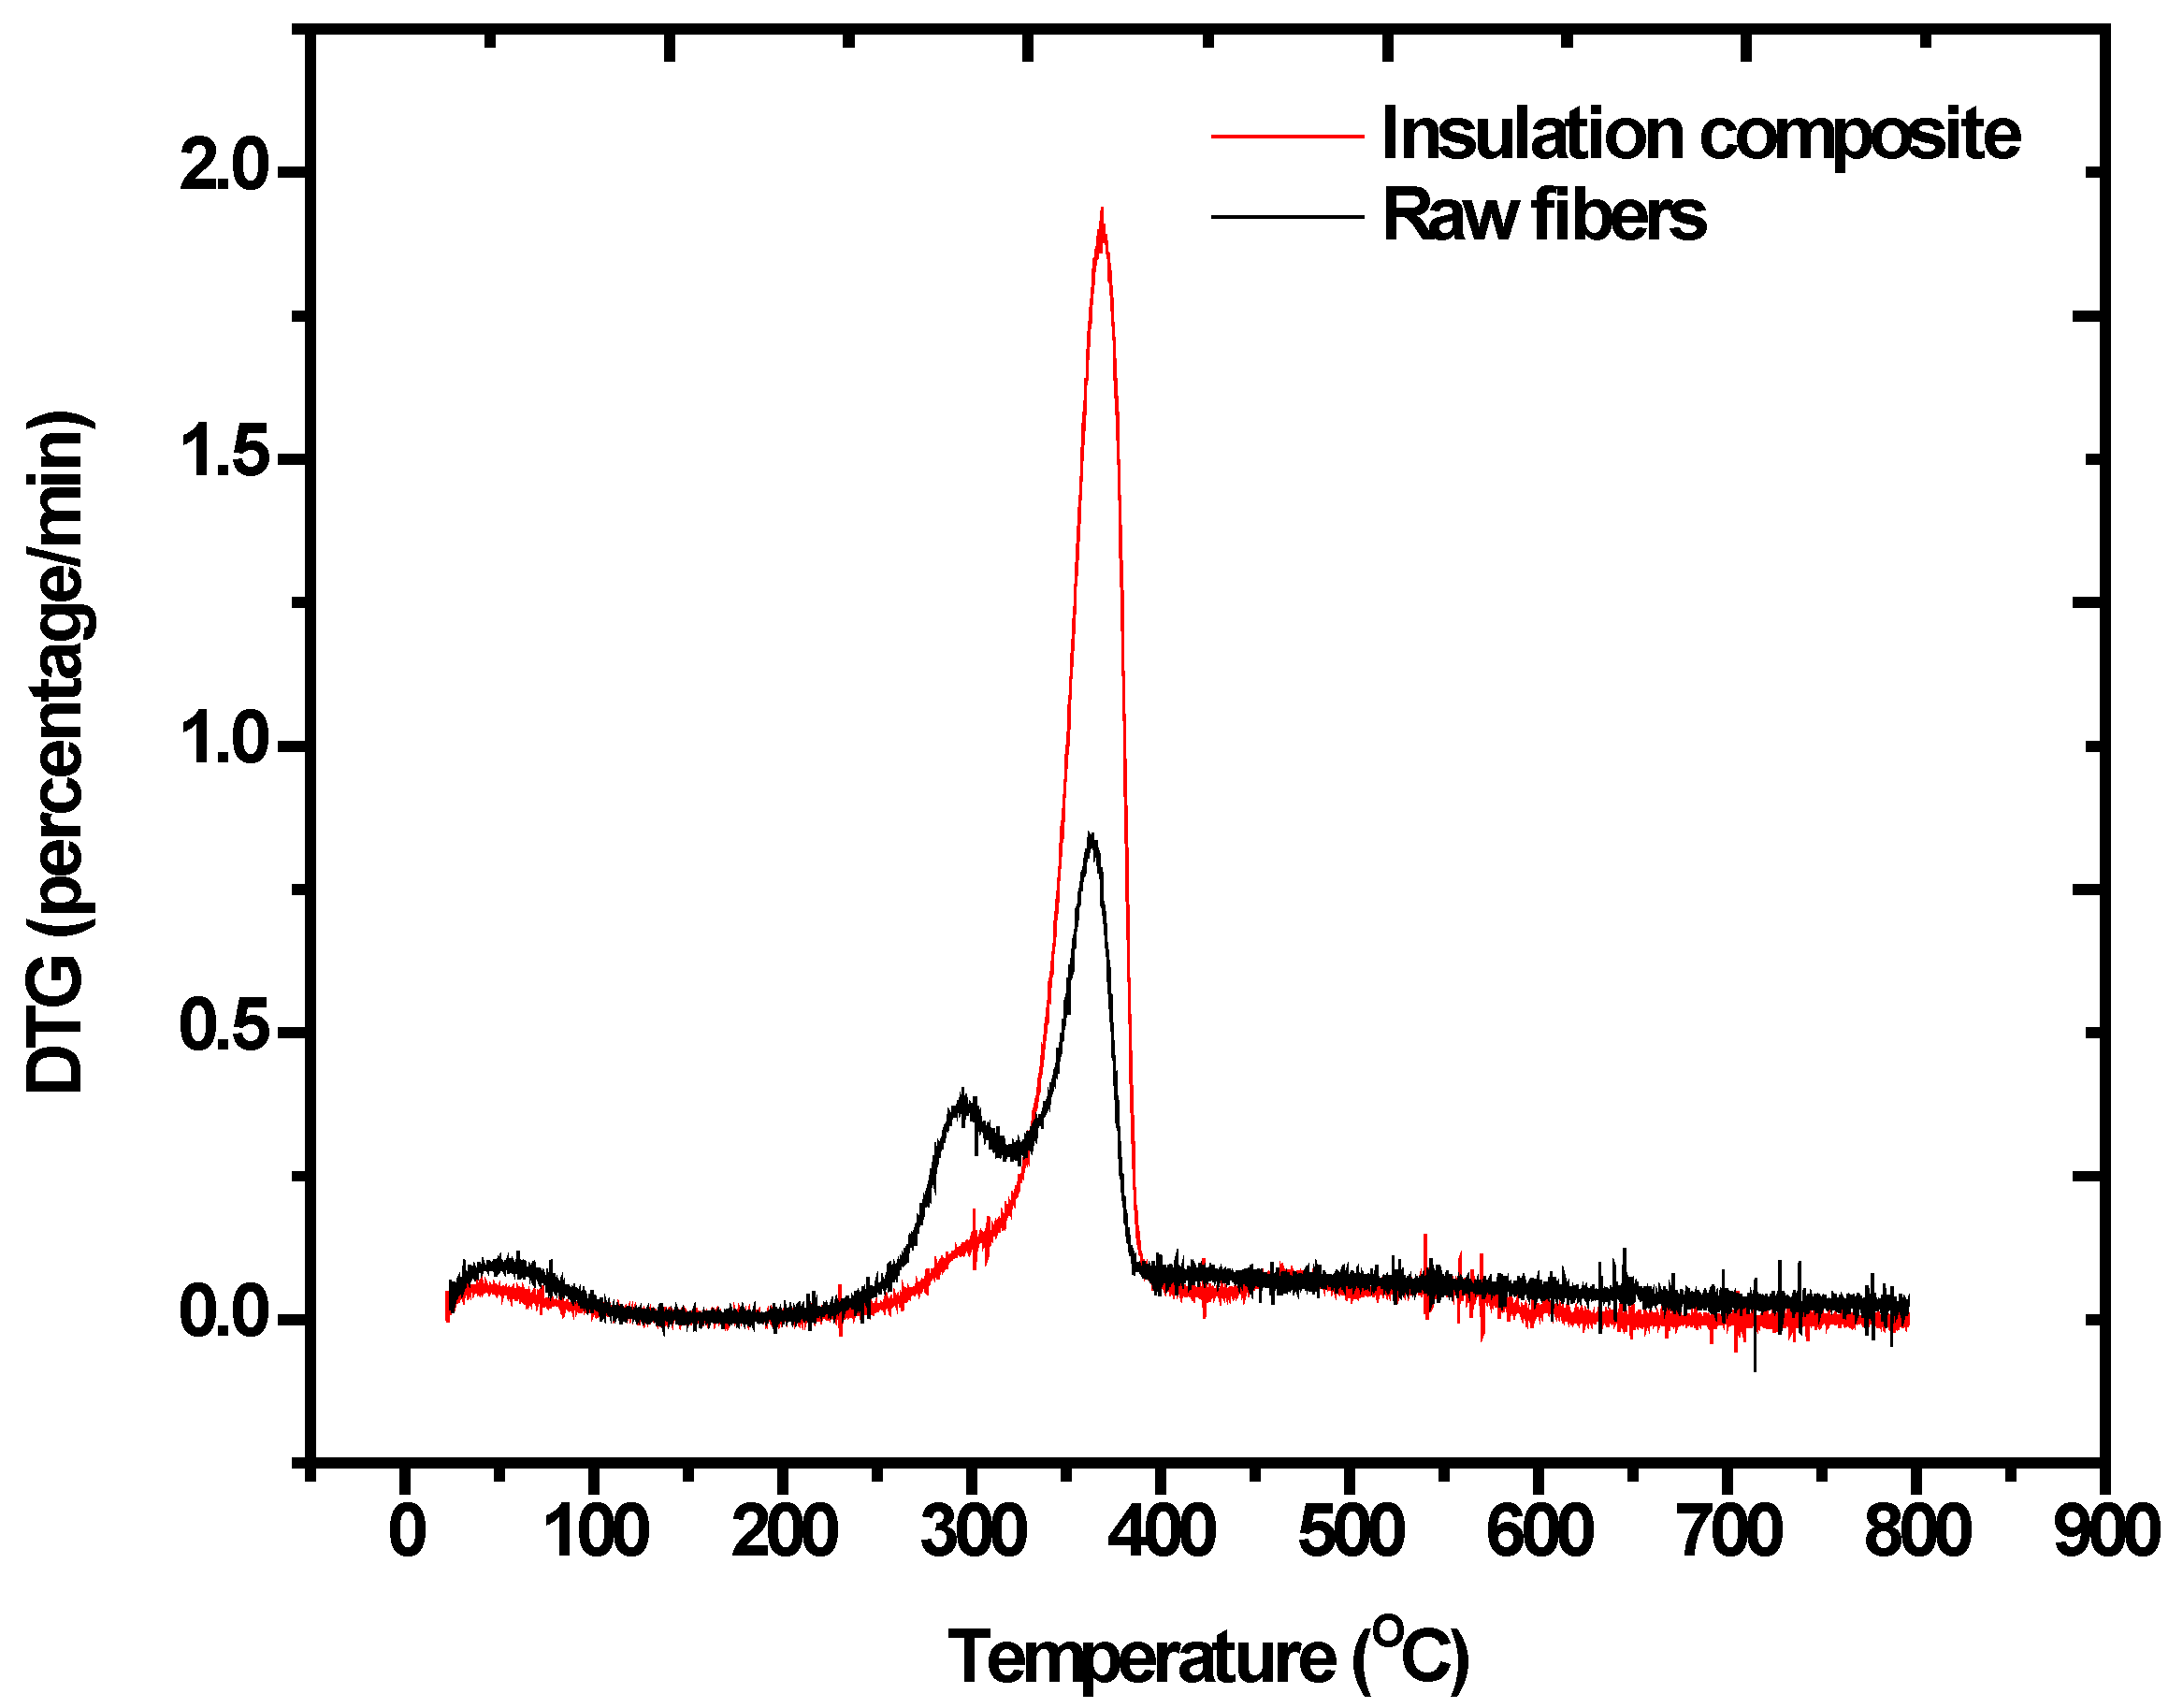
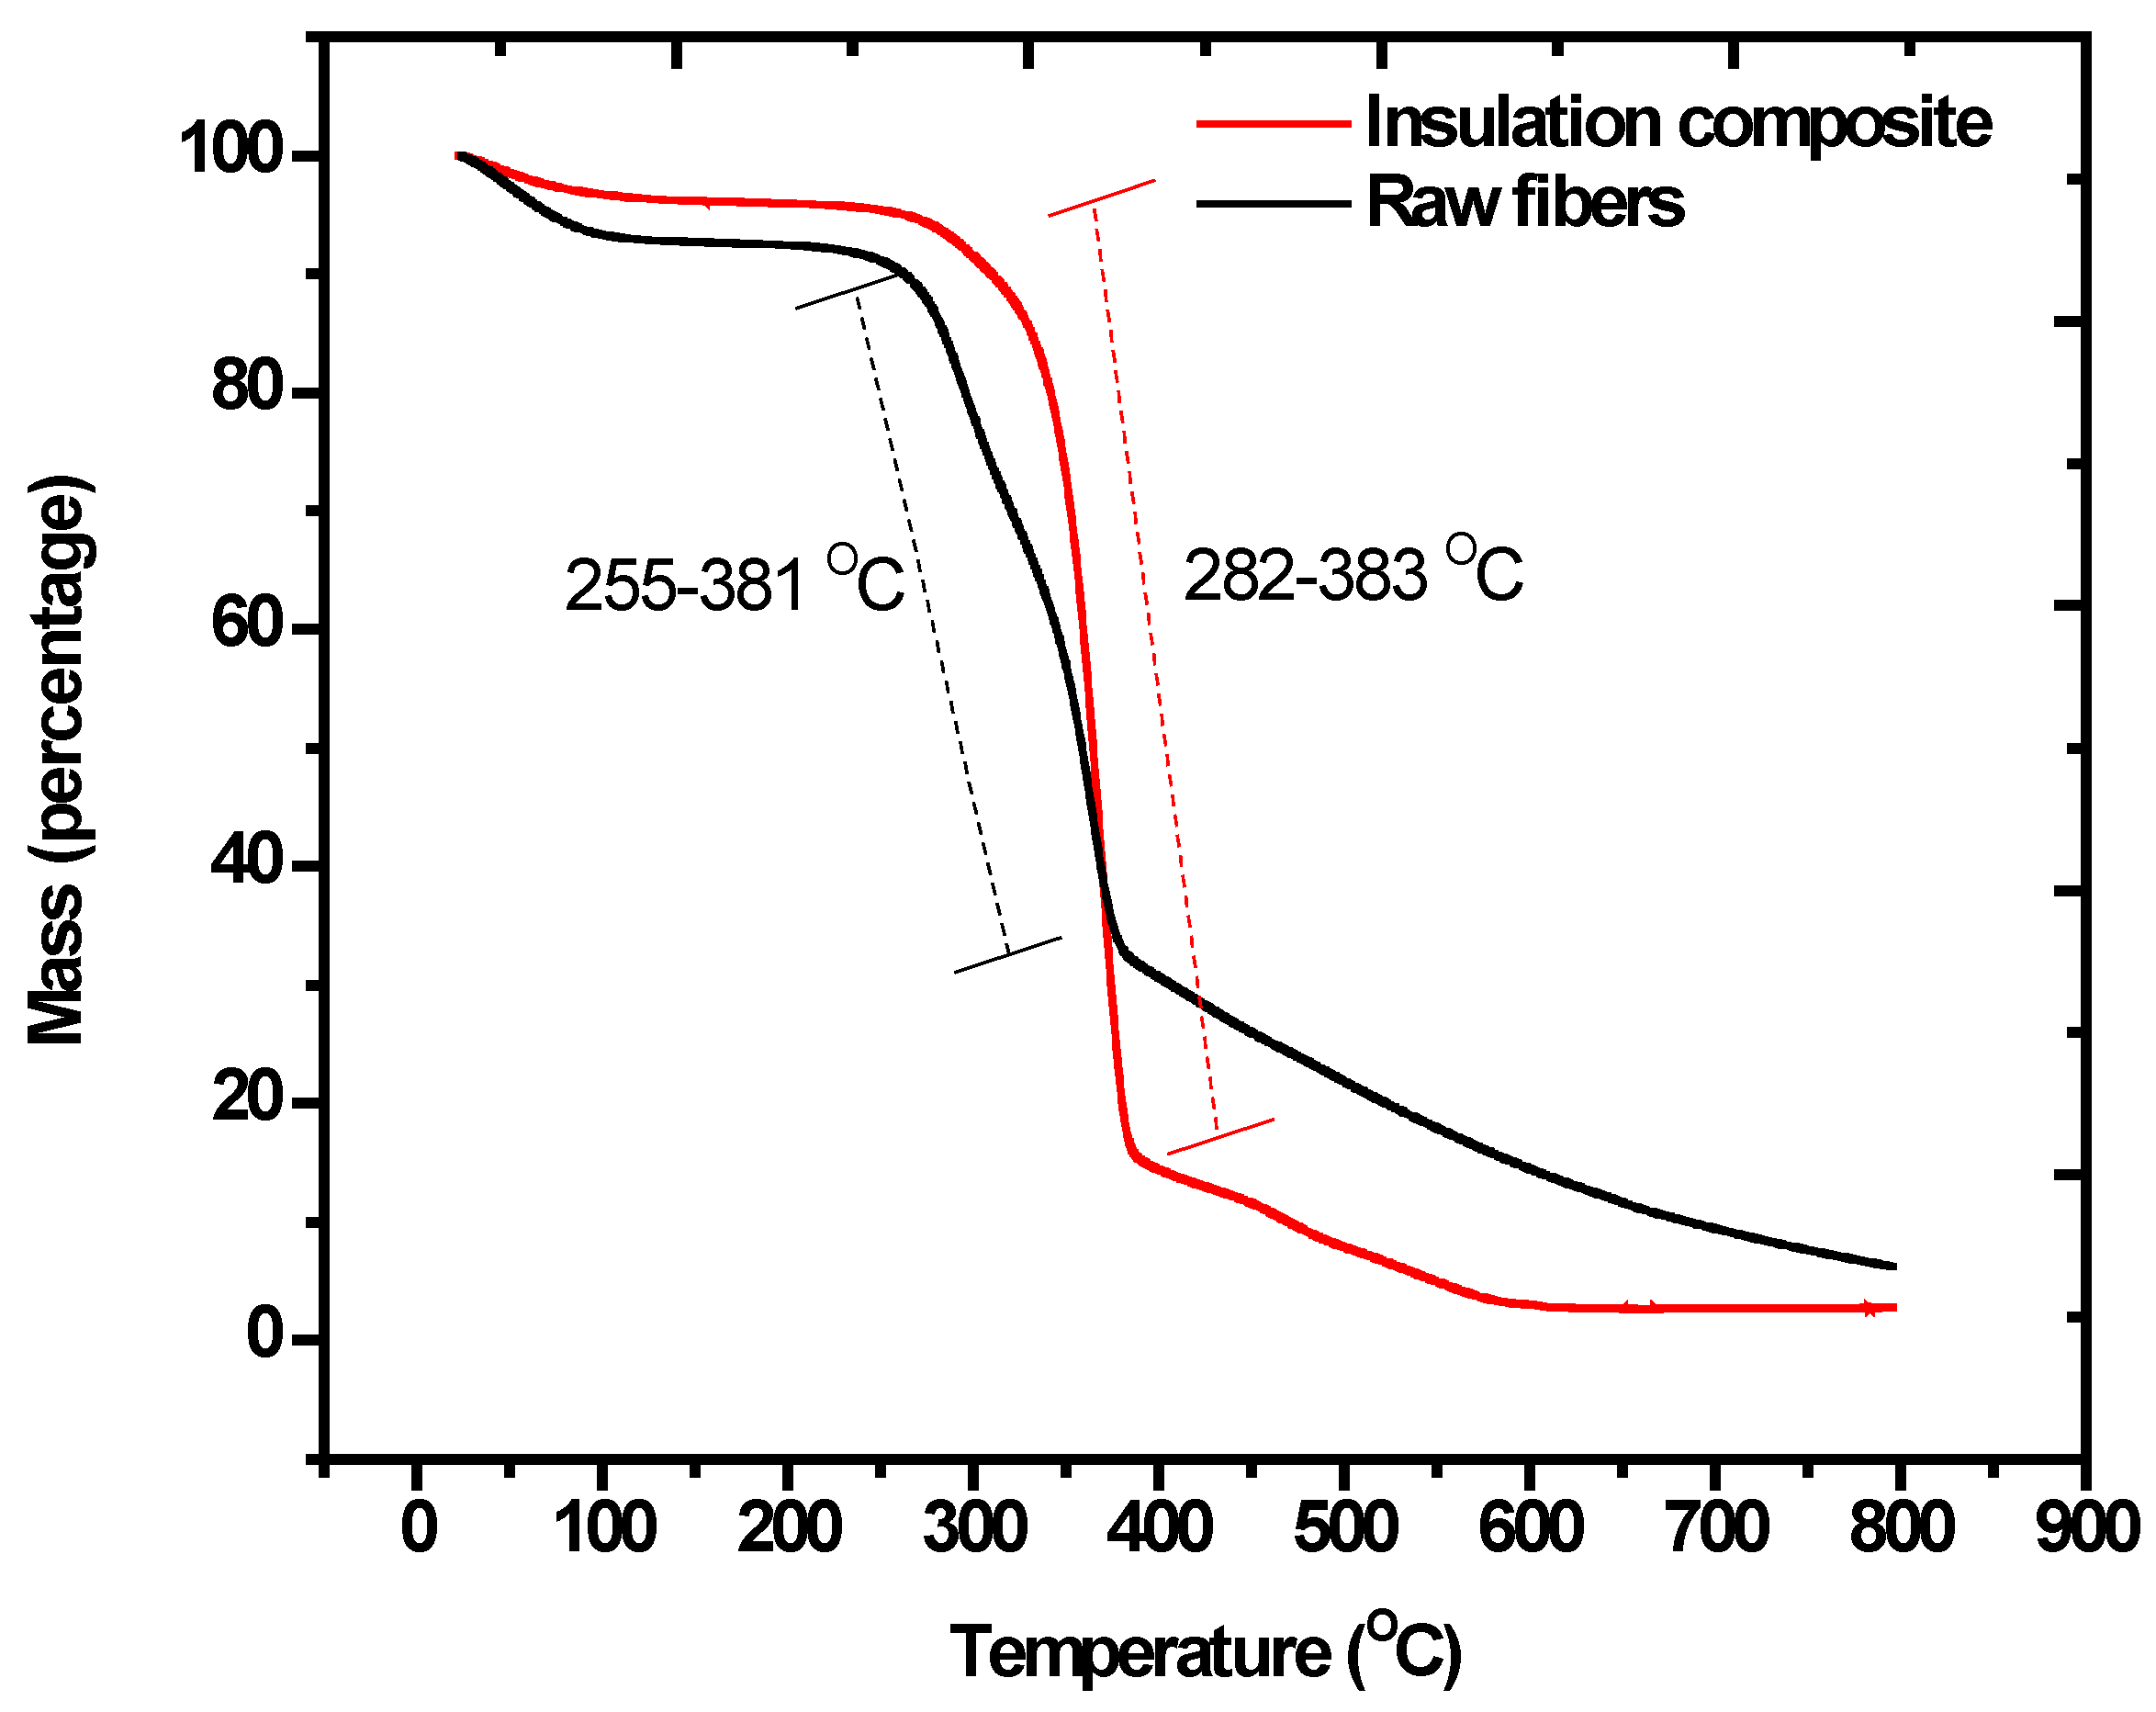
3.2.1. Thermogravimetric Analysis (TGA)

Thermal degradation behavior is also another crucial characteristic of insulation materials. A higher thermal degradation range with a lower weight loss is considered an excellent property of insulation materials. Thermogravimetric analysis (TGA) was performed here to analyze the degradation behavior of raw fibers of date palm and the insulation composite material prepared with them. Initial degradation temperature (TIN), mass loss (%) at TIN, major weight loss region, and major degradation temperature range (T) are the primary physical properties of interest for insulation materials. A multi-step thermal decomposition pattern was obtained from thermogravimetric analysis (Figure 9). These results are summarized in Table 5. Raw fibers started to degrade at a very high temperature of 255 °C, corresponding to TIN. At this TIN, the sample lost 11% of its original weight. The initial degradation temperature of the insulation composite further increased to 282 °C where the sample loss was only 6% of its original weight. The major degradation range of the insulation composite expands going from 282 to 383 °C. Major weight loss, which is ca. 84% of the original weight, thus falls within that major degradation range. Major degradation rates were also identified by DTG (Figure 10). The TIN for the insulation composite (282 °C) is a very high temperature, one not yet realized for any building insulation material during the normal application period, and its corresponding weight loss is very small. This makes the DPSF/PVA composite highly suitable for use as a building insulating material.

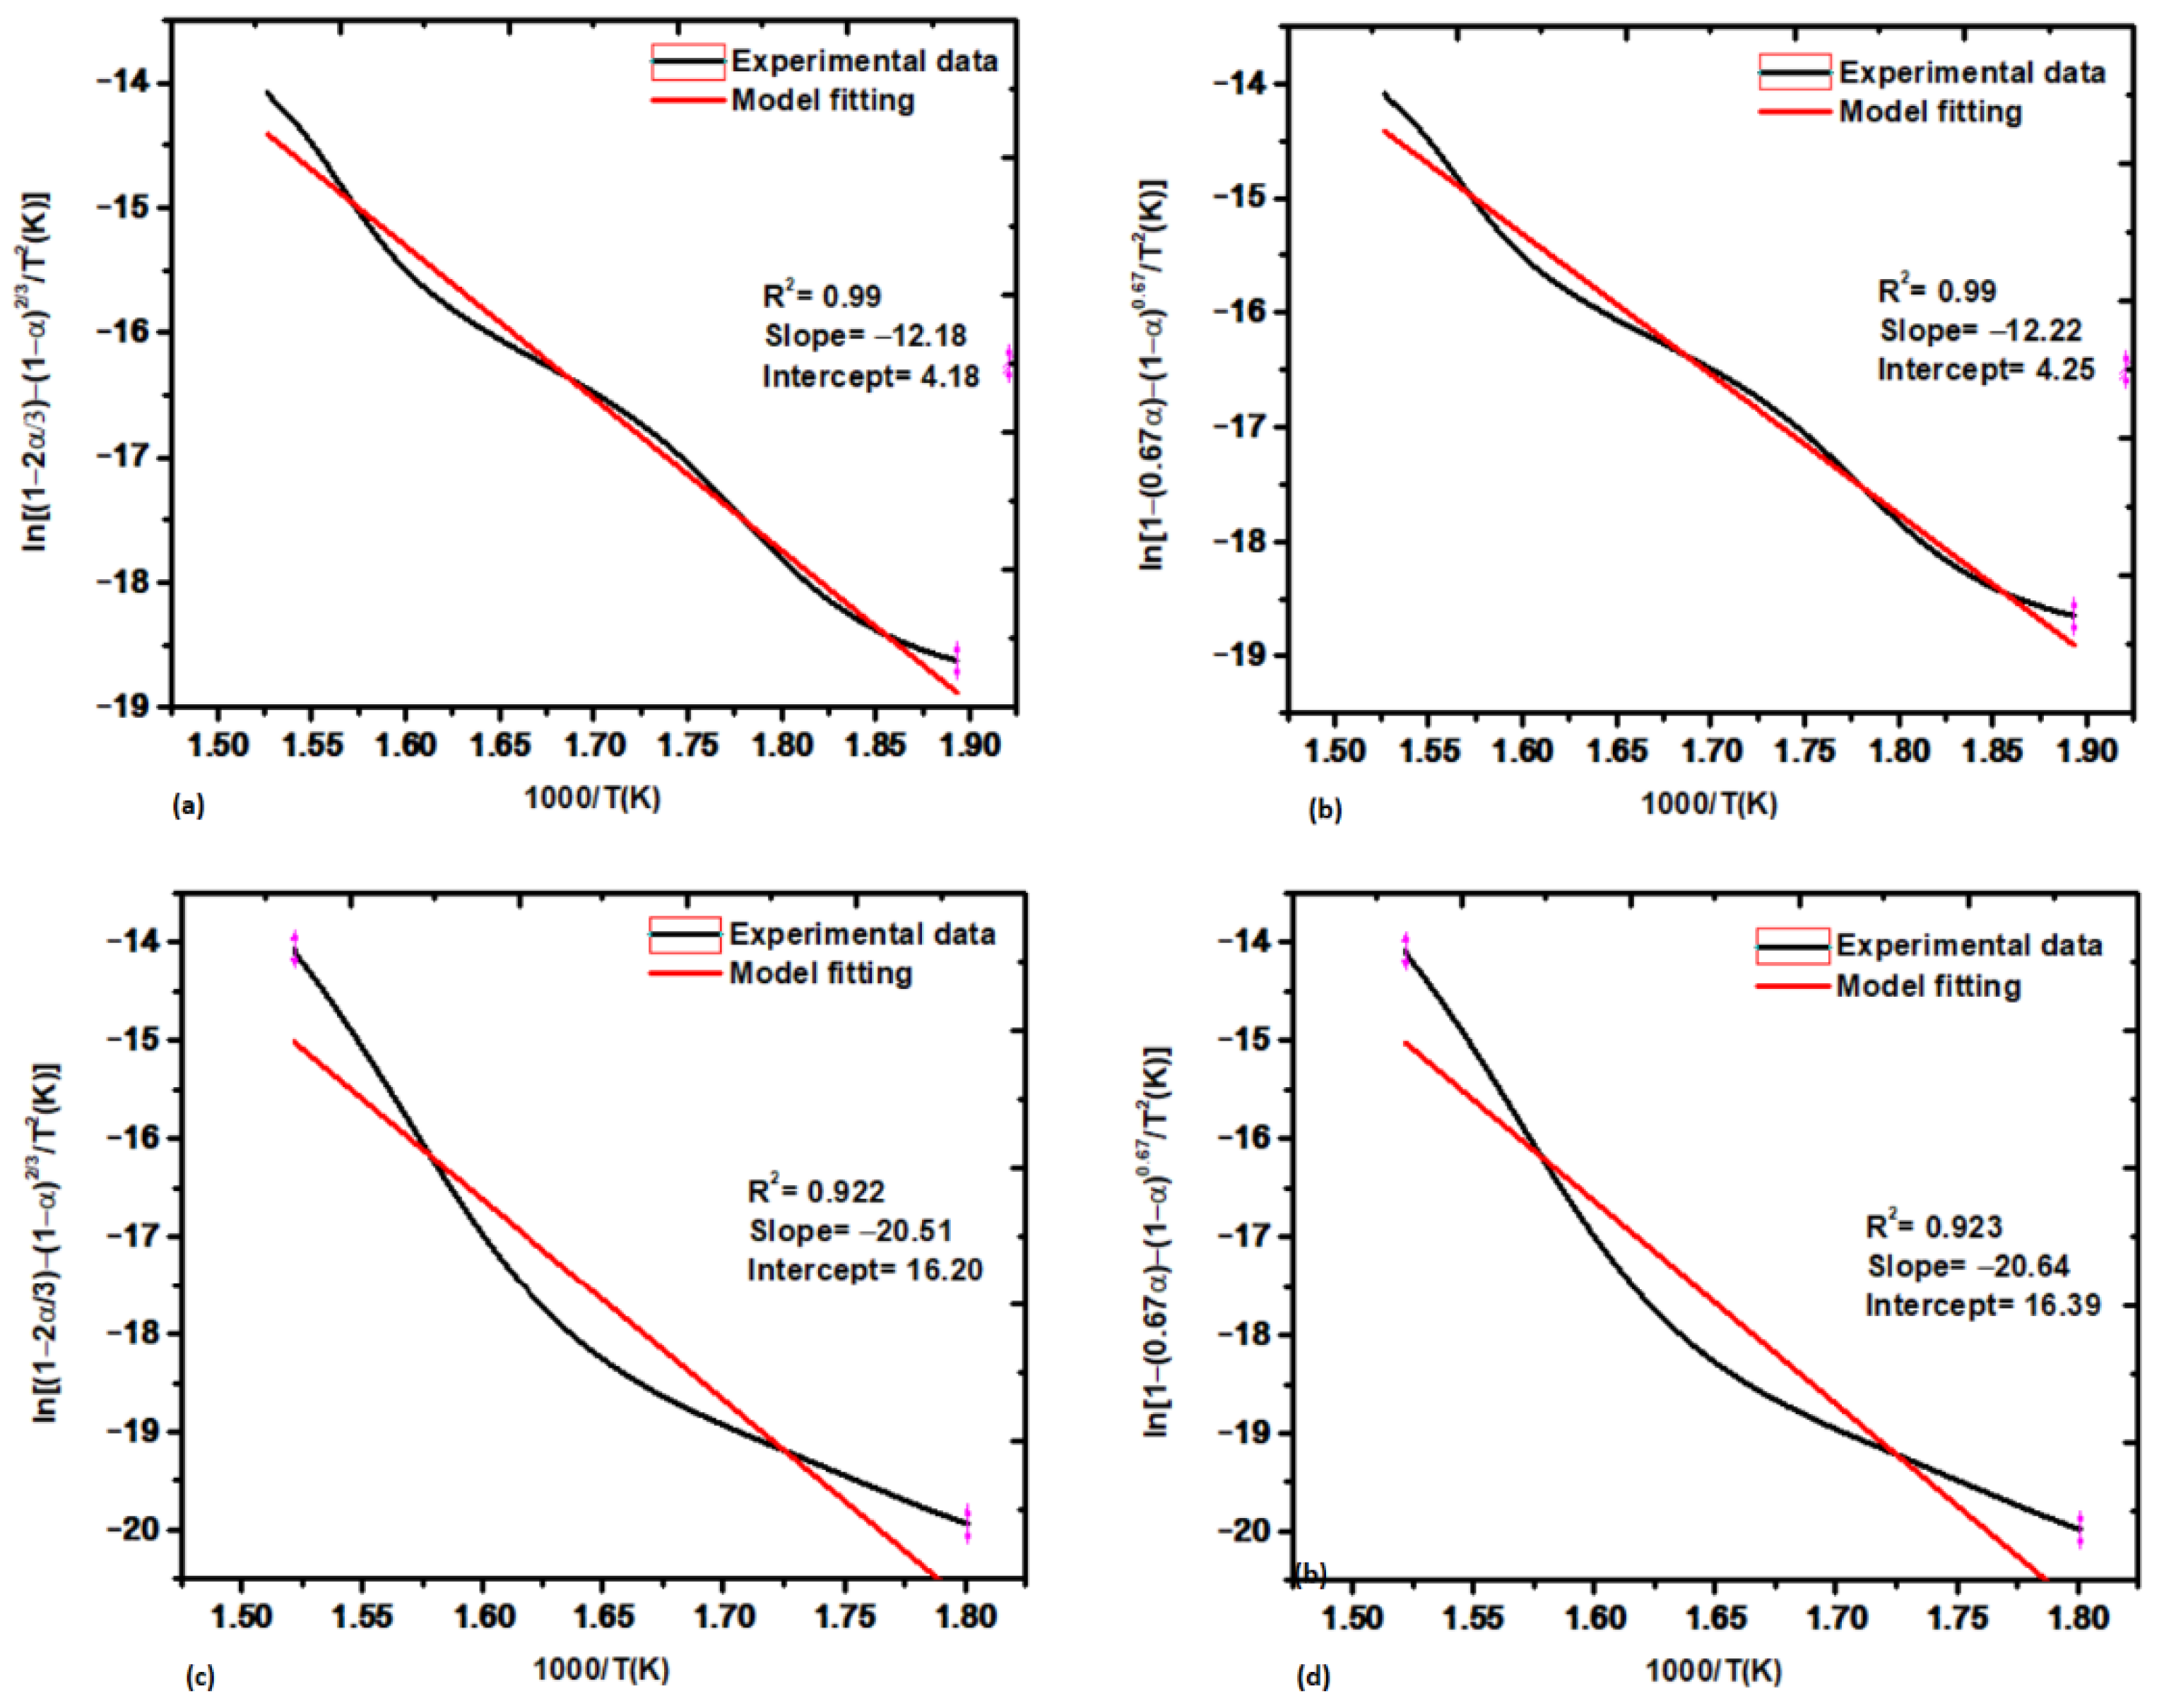
3.2.2. Kinetic Analysis

Many researchers have performed kinetic analyses of insulation materials. This type of analysis is helpful for understanding the thermal stability of insulation materials and establishing their aging and fire-retardant characteristics. Zheng et al. [51] produced a thermal insulation material using cellulose pulp, whose fire retardancy was developed using an intumescent fire retardant, and its activation energy E a increased due to the formation of thermally stable char. Later, Lie et al. [52] conducted a kinetic analysis of thermal insulator waste in the form of extruded polystyrene to learn more about its fire retardancy and recycling potential. Earlier work by Jiao et al. [53] ran kinetic analyses of three insulation materials: rigid polyurethane foam, extruded polystyrene, and expanded polystyrene. The goal of that study was to look at the thermal degradation properties and volatile products of those insulation materials.
Activation energy ( E a ) was calculated here for date palm raw fibers and insulation composite material by using the Coat–Redfern integral method. Kinetic analyses were applied to the major degradation region, using the thermogravimetric data. The major degradation region (i.e., active pyrolysis zone) is indicated in Figure 11.
Two diffusion models, the anti-Jander equation and the Ginstling equation, yielded excellent linear fits to the thermogravimetric data of raw date palm fibers (R2 ≈ 0.99) and the insulation composite (≈0.92). These results are summarized in Table 6. The E a increased from 101 kJ/mol to a much higher value of 170 kJ/mol for the insulation composite. The 68% increase in the E a value shows that the binding of date palm fibers with PVA augmented its fire retardancy and weakened its combustibility. The best-fitted diffusion models are also depicted in Figure 12.

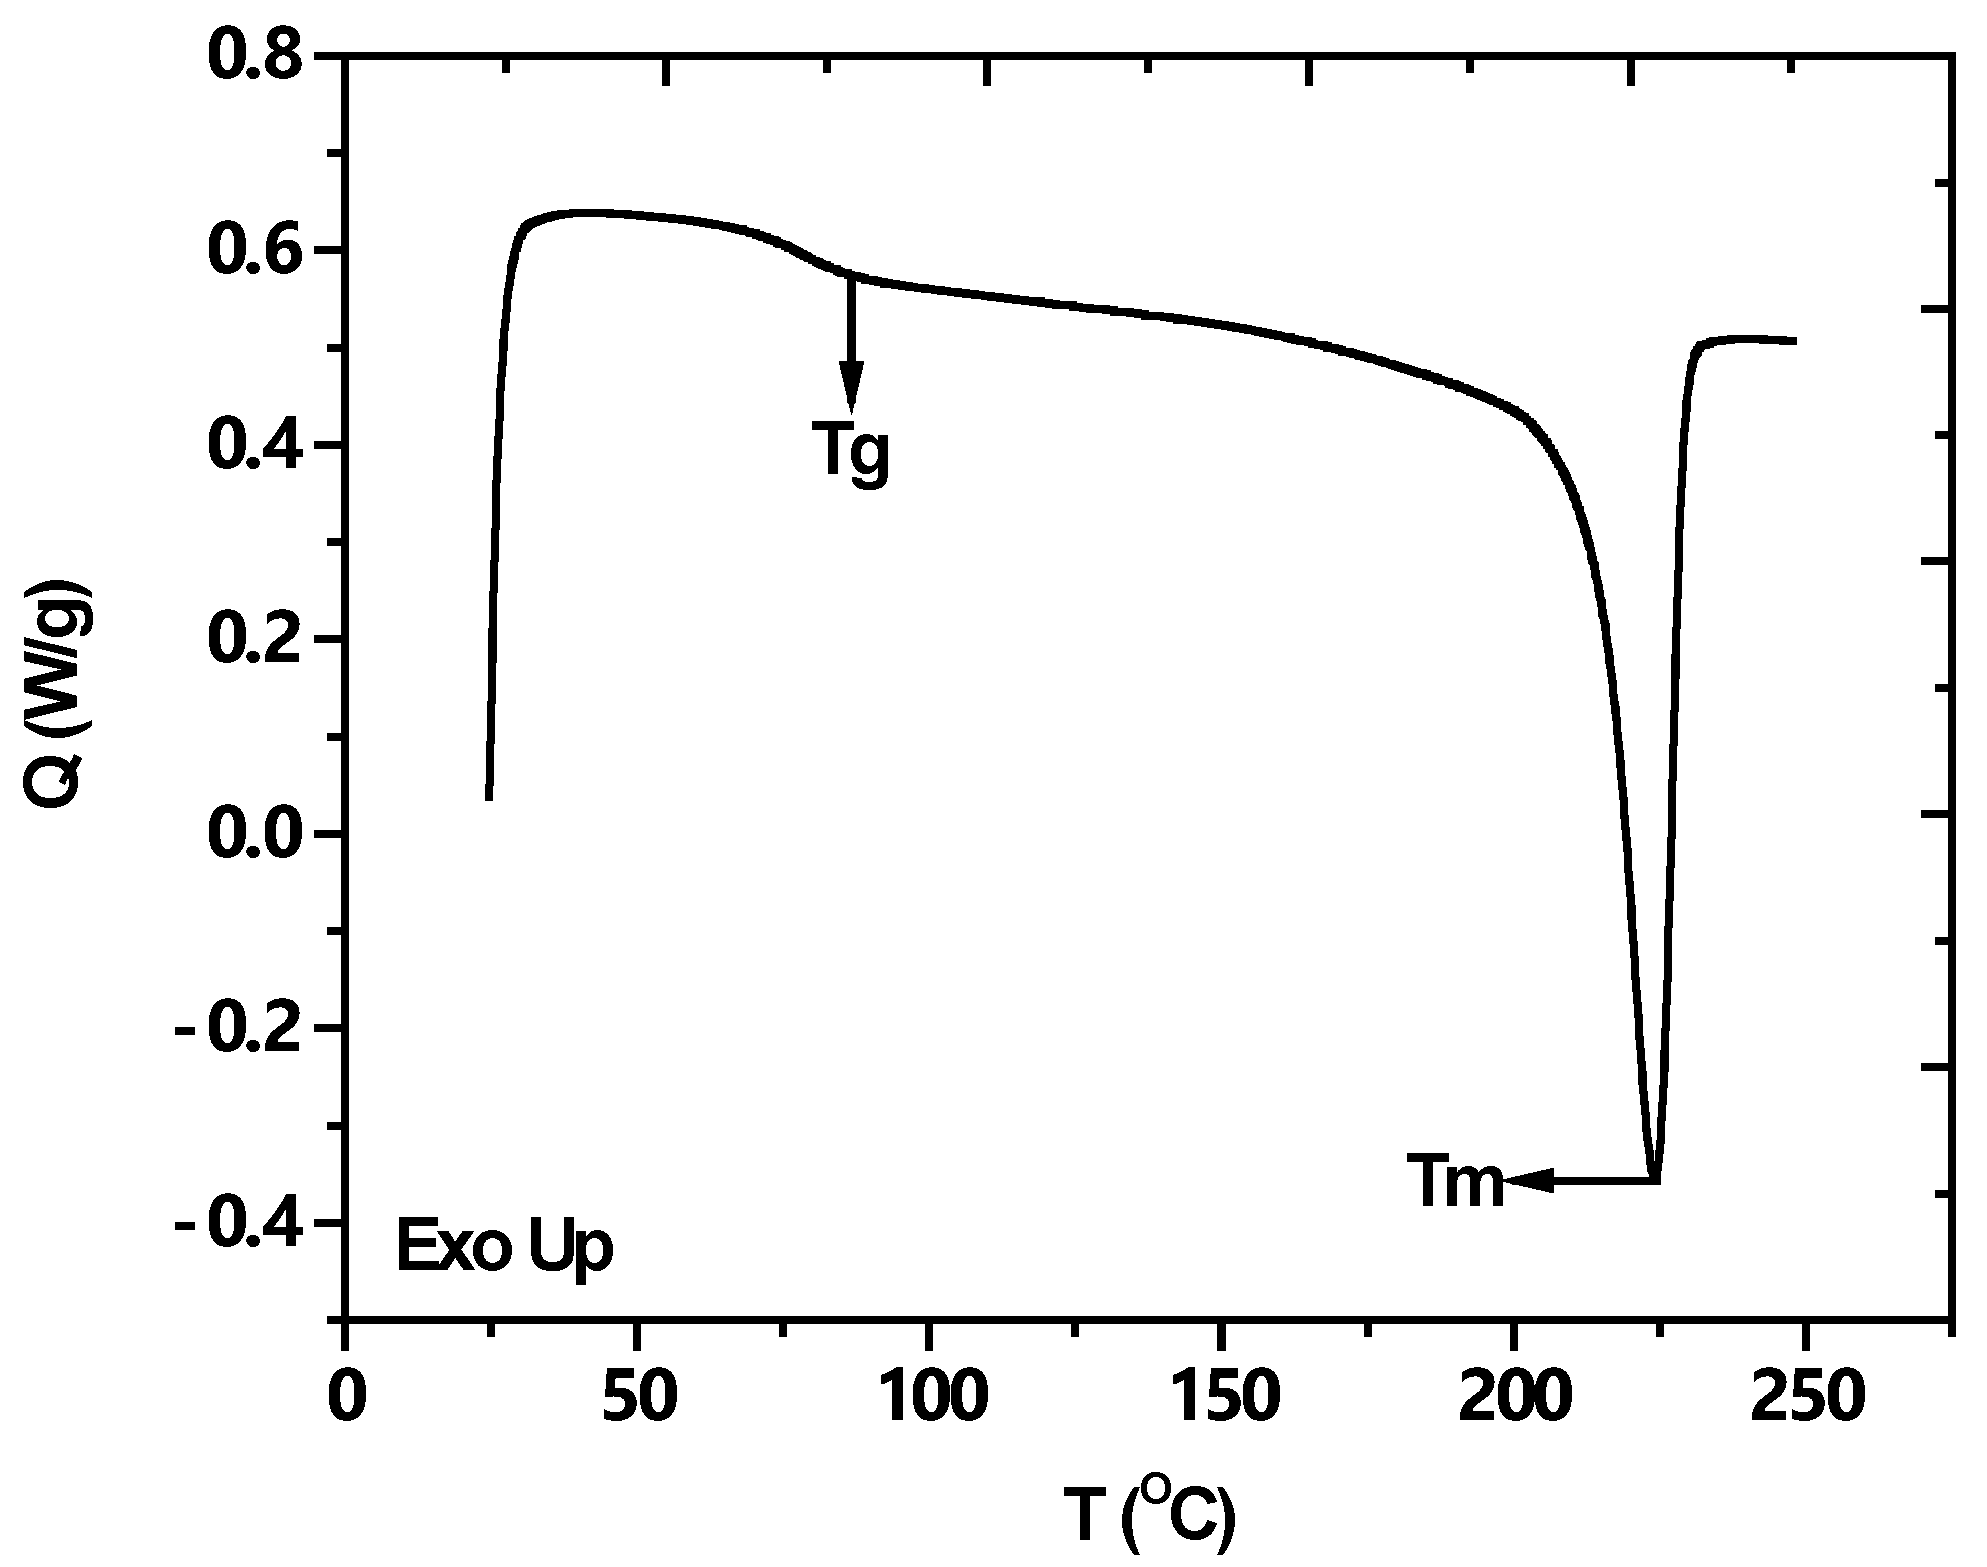
3.2.3. Differential Scanning Calorimetry (DSC) Analysis

DPSFs were successfully bound with polyvinyl alcohol (PVA). Differential scanning calorimetry (DSC) is a technique employed to observe the thermal transitions of polymers upon heating. An insulation composite sample (one with least thermal diffusivity) was analyzed to identify its glass transition ( T g ), cold crystallization ( T c ), and melting point T m . A second cycle isotherm for an insulation composite from 25–250 °C (10 °C/min) is depicted in Figure 13. Upon heating a sample at a certain temperature, its state changes from a hard glassy material into a soft rubbery material. This corresponds to the first step change in the DSC curve, better known as the T g . The T g value for the composite sample was 86.2 °C, slightly higher than the T g value for pure PVA (80 °C). Upon further heating a sample above T g , a polymer often acquires much greater mobility and, once reaching the proper threshold temperature, it gives off enough heat to attain an ordered structure. This heat release or dumping of heat can be recognized by an upward peak in the DSC plot. The area of this peak conveys the latent heat of crystallization, and the temperature at this stage is denoted T c . Yet, most importantly, it tells us that the polymer in question can crystallize. In cases where we have amorphous or semi-crystalline polymers, this peak fails to appear, as we would expect in the DPSF/PVA prepared sample because its PVA component is a semi-crystalline polymer. When the material is further heated beyond T c , the molecules will no longer retain their arranged pattern and a temperature point is reached when they fall apart and the polymer melts. This is known as the T m and is discernible on a DSC curve as a steep downward curve. The melting point temperature ( T m ) for the insulation composite sample was 225 °C. Therefore, the developed material has a very high melting point or dissociation from its binding material.
We also used the DSC data to measure the crystallinity of the sample, using Equation (6) [28]:
D e g r e e   o f   c r y s t a l l i n i t y   X c r = Δ H m Δ H c Δ H m
where Δ H m is the measured melting enthalpy from the sample (55.68 J/g); Δ H c is the measured enthalpy from the sample; Δ H m is the enthalpy of 100% crystalline PVA (138.6 J/g). Hence, the X c r for the insulation sample is 40.17%.

3.3. Microstructure Properties

Figure 14 shows the FTIR analysis of the insulation composite sample (one with least thermal diffusivity). This analysis is useful for identifying the green nature of a composite’s fabrication process. The FTIR spectra of insulation composite resembles closely with pure lignocellulose material exhibiting typical vibration spectrum of natural fibers, where the cellulose is the dominant component. The examination of the stretching peaks indicated that carbon, hydrogen, and oxygen were the core components present in the insulation composite. Hence, it is expected to be fully organic in nature. These functional groups are allocated different wavelength numbers. Carbon–carbon (C=C), hydrocarbon (C-H), carbonyl (C=O), and hydroxyl (OH) are the main fundamental groups. There is some medium stretching at 3321 cm 1 , due to an aliphatic primary amine (N-H) group that appears in the sample, and two strong alkane C-H stretching peaks appear at 2918 cm 1 and 2846 cm 1 . Then, at 1602 cm 1 , we can see a medium C=C stretching peak associated with the conjugated alkene group. The medium-bending peak appears at 1418 cm−1 because of an OH-bending alcohol group. At 1237 cm 1 there is a medium C-N stretching of an amine group. The peak at 1015 cm 1 arises from the medium C-N stretching of an amine group. Similar FTIR analysis has been reported in the literature for DPSFs [32] and agave fibers bonded with corn starch and wood adhesive. [34]. Mohammad Ali et al. [32] also reported the presence of similar spectrums when date palm fibers were bonded with corn starch. FTIR results showed that the fabrication process is expected to be a green process, with no toxic materials present.
Scanning electron microscopy is used to provide information on the microstructure of the composites and permits the observation of the interaction of the DPF fibers with the PVA solution. SEM images of the DPSFs and insulation composite can be seen in Figure 15. Evidently, the fibers are bonded together with PVA and display a complex binding structure. This analysis is helpful in showing, at the microstructure level, the bonding capacity of polyvinyl alcohol to hold together the surface fibers of date palm. The raw date palm fibers are long and needle shaped. In our recent study [14], it demonstrated that these DPSFs are a lignocellulosic biomass composed of 44 wt.% cellulose, 22 wt.% hemicellulose, 30 wt.% lignin, with the remainder of it comprising extractives, such as waxes or pectins, among others. Good compatibility between date palm fibers and PVA binder has been observed without any pretreatment of raw fibers. Moreover, a homogenous structure is shown in the insulation composite without any huge gaps and voids.
The X-ray diffraction analysis was performed on raw date palm fibers and insulation composite. Date palm surface fibers are basically composed of lignin, hemicellulose, and cellulose, of which cellulose is known as crystalline in nature, while lignin is the amorphous phase; therefore, the semi-crystalline behavior of date surface fibers can be seen in Figure 16. The crystallinity of insulation composites is an important parameter for evaluating their strength. A sharp peak appeared in the insulation composite XRD scan, indicating the presence of the crystalline phase and suggesting that the crystal structure of PVA was incorporated. The crystallinity index of the DPSFs is only 34.6%, but it increased to 41.7% for the insulation composite. This increase in crystallinity is due to the binding of fibers with a crystalline PVA polymer binder. Due to the ordered PVA structure, the intermolecular bonding is significant, which results in a higher mechanical strength [54]. The degree of crystallinity found here matches the crystallinity index of kapok tree fiber (Xcr = 45%) [55]. The value of the crystallinity index also corroborates the value obtained from our DSC analysis of the insulation composite. A greater crystalline structure provides more hardness and strength to materials.

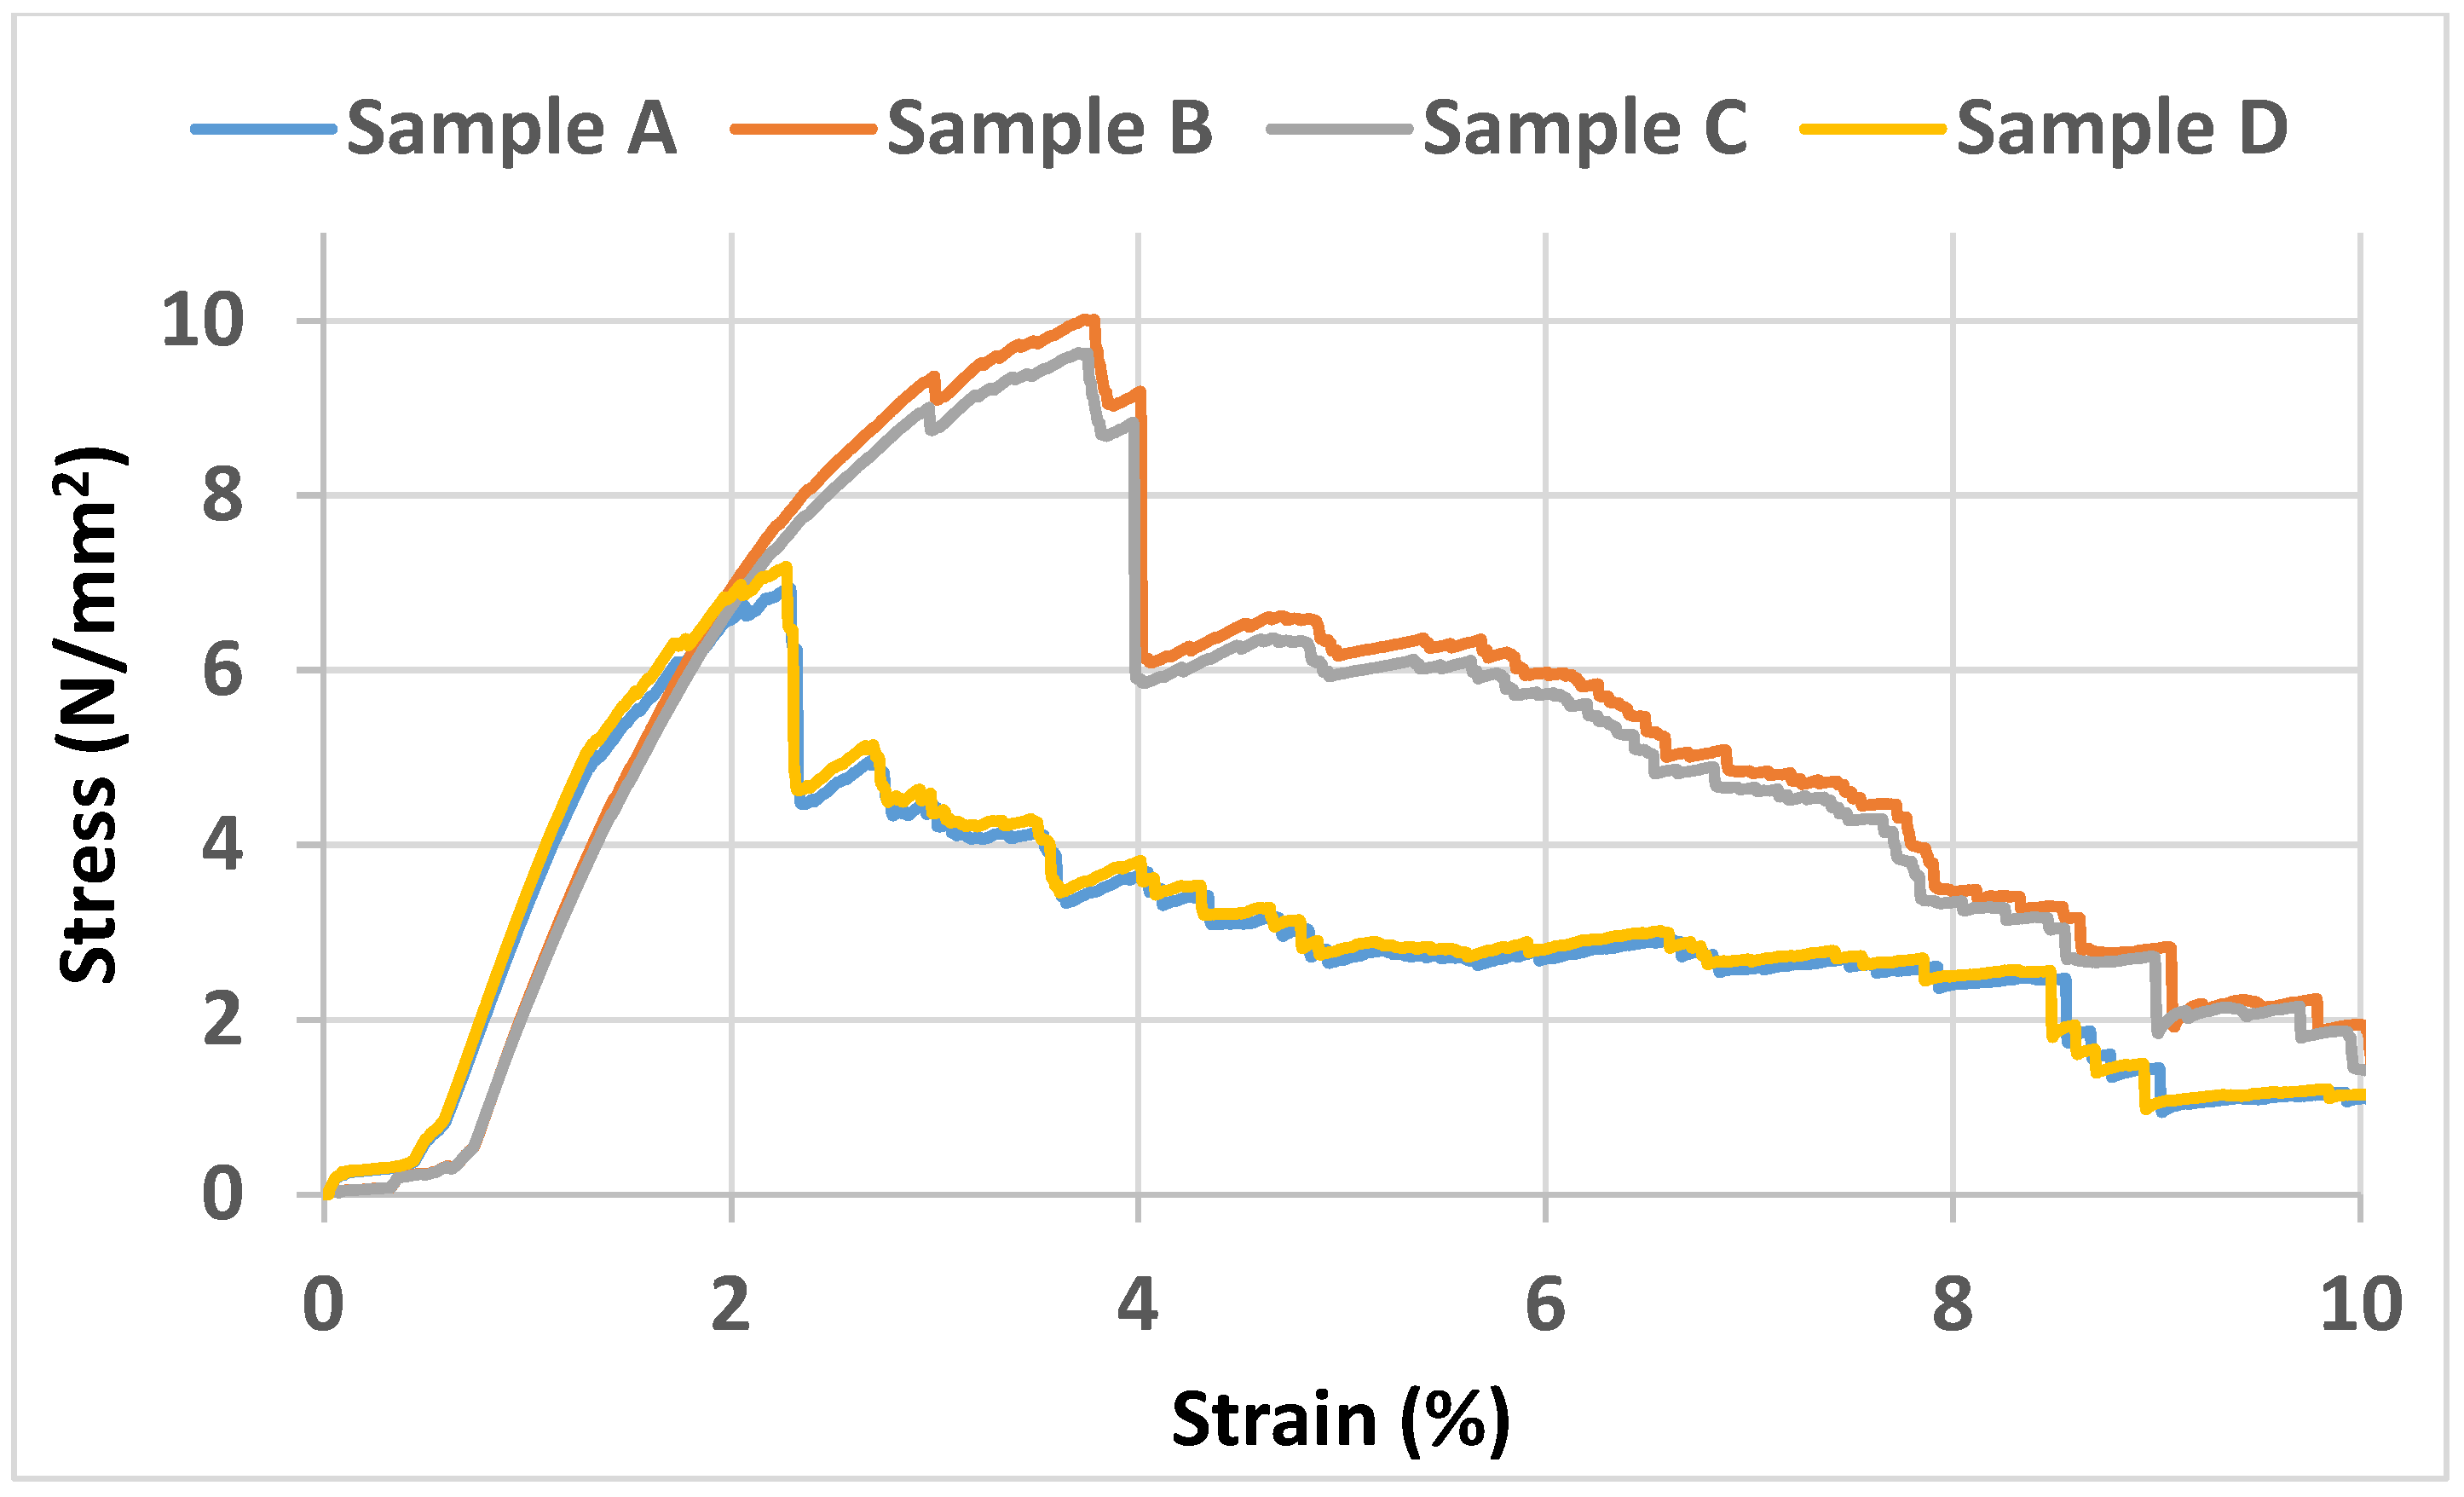
3.4. Mechanical Properties

Mechanical strength is an indispensable characteristic of any insulation material. Tensile strength and Young’s modulus were measured for the four prepared insulation composite samples. Their stress–strain graphs are shown in Figure 17. It is noted that the tensile strength of the insulation composite increased for Sample B and Sample C as compared with Sample A. However, it again decreases for Sample D. The tensile strength of Sample B and Sample C is closely matched. It was expected to not have a clear relation between density and tensile, since the nature of fibers is uneven. During testing, if any single fiber breaks the fracture point is obtained, eliminating the effect of samples density. However, it should be noted that during tensile testing even when any single fiber breaks to give break point, the remaining sample is still in contact, unlike extruded polymeric samples that break in parts. The value of tensile strength ranged from 7 to 10 mPa. Additionally, presented in Table 7 are values for Young’s modulus, which is a measure of tensile stiffness. We should note that the mechanical properties of fiber/binder composites depend on the properties of the binder as well as the fiber used. The mechanical properties of natural fiber-based or biodegradable thermal insulation materials are generally lower than those of conventional insulation materials. These findings for mechanical performance are comparable to reported values in recent studies. For example, Feng et al. [56] obtained a maximum tensile strength of 20.36 mPa for polypropylene composites when these were reinforced with Kenaf and pineapple leaf fibers and treated with varying concentrations of sodium hydroxide and 3-aminopropyltriethoxysilane. Pawlak et al. [57] used maleinized linseed oil to plasticize polylactic acid, which was then reinforced with sheep wool fibers recovered from the dairy industry; they recorded a tensile strength of ca. 25 mPa for their PLA composites whose content of sheep wool fibers was 10%. Moreover, in stark contrast, the tensile strength of polyurethane foam is just 0.110 mPa [58] and 0.120 mPa for the EPS [59].

4. Conclusions

Date palm surface fibers, an abundant form of lignocellulosic biomass waste, were utilized here to develop a thermal insulation material. The goal was to develop a more environmentally friendly biodegradable material for use as thermal insulation that could be used in buildings instead of conventional fossil fuel based insulators.
Polyvinyl alcohol was successfully used as a binder in the synthesis of fiber-based heat insulation composites.
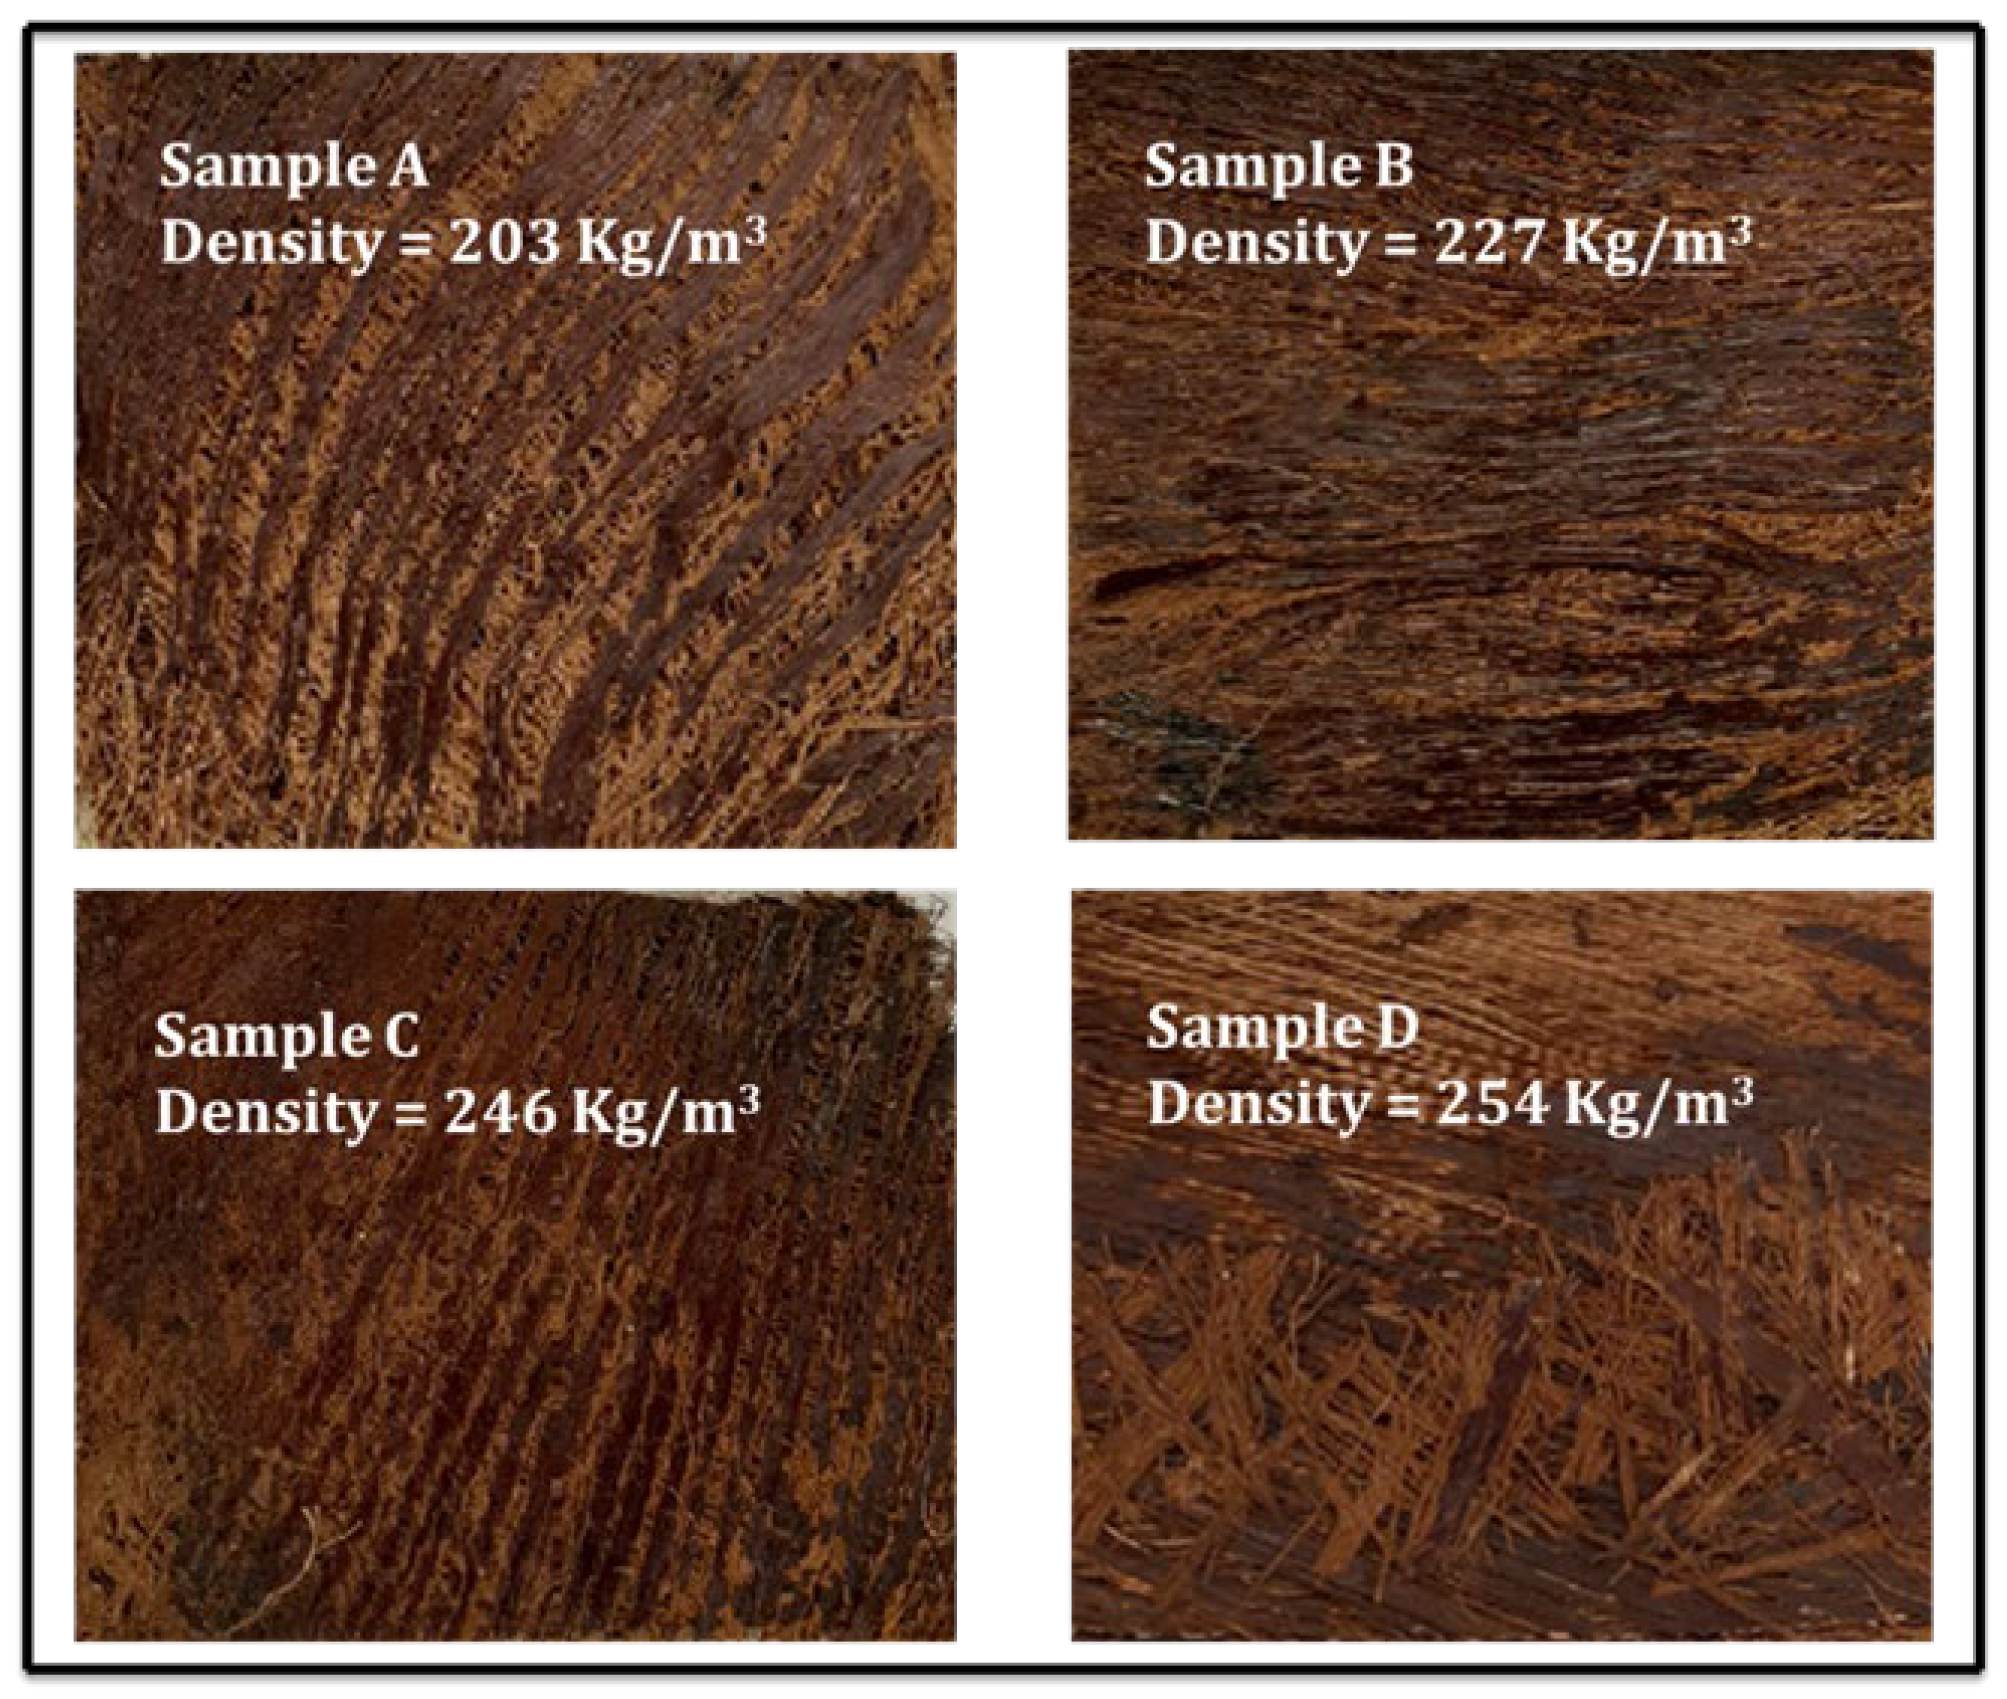
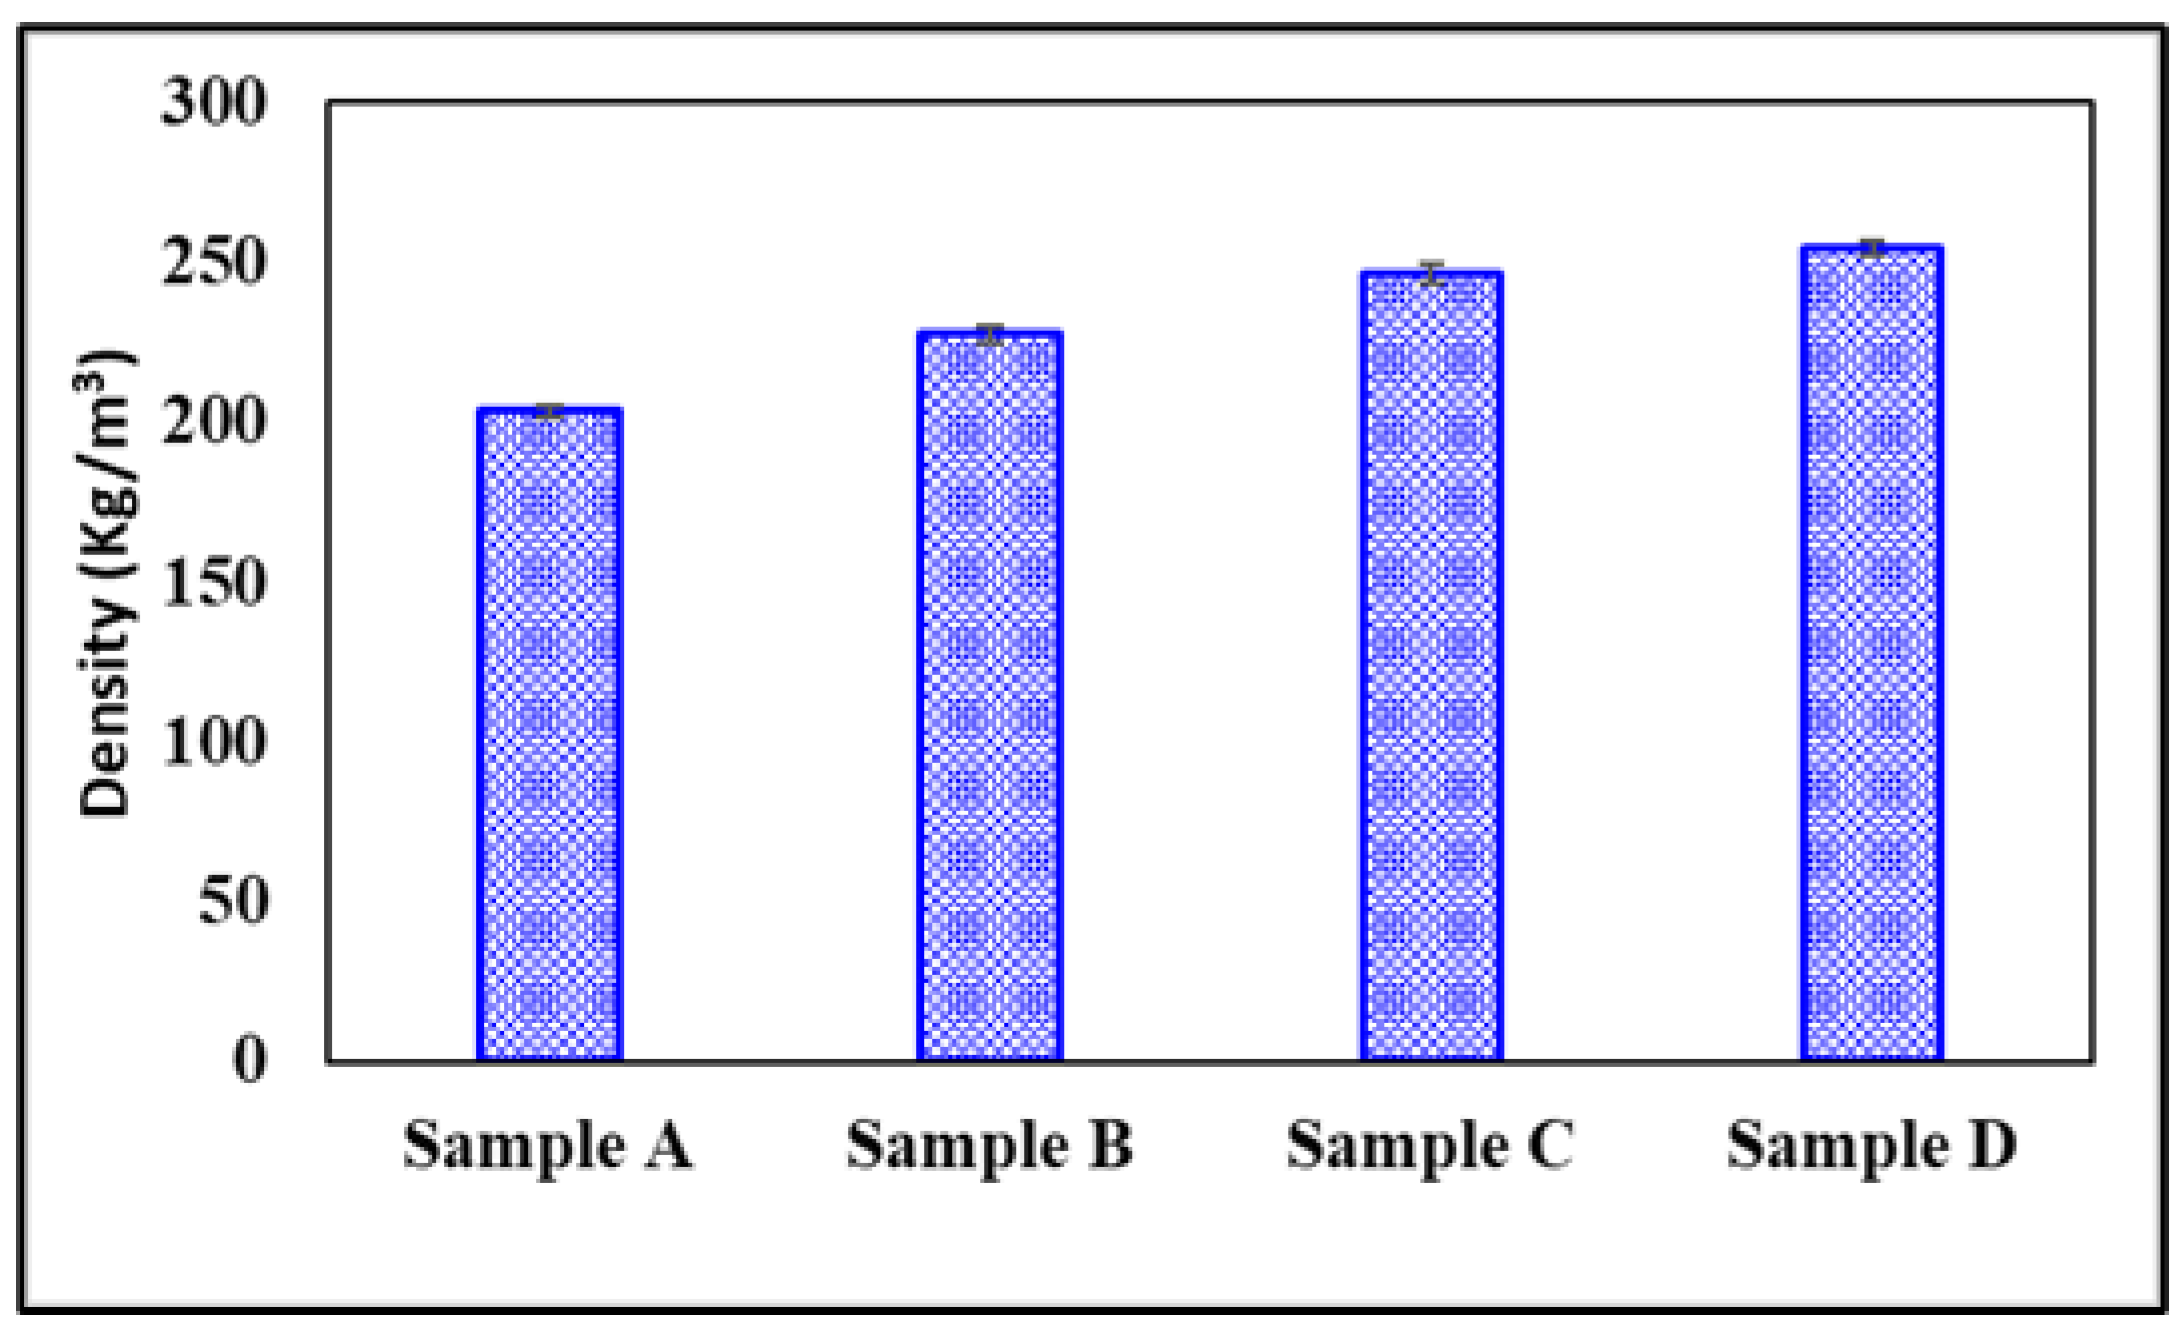
Their thermal conductivity was found to be density- and temperature-dependent. Four thermal insulation composites with densities of 203–254 kg/m3 had thermal conductivity and diffusivity values of 0.038–0.051 W / m · K and 0.137–0.147 mm2/s, respectively. Crucially, both the thermal conductivity and diffusivity were on par with those of existing commercial insulators.
Thermal transmittance (U-value) of the four insulation composites were between 3.8–5.1 W / m 2 · K , which was in good comparison to other insulators of similar thickness.
TGA and DSC analyses confirm the higher thermal stability of the novel insulation composite. Initial degradation temperature and melting point were 282 °C and 225 °C, respectively.
An E a analysis was applied to predict the more resistive nature of the insulation material. An activation energy increased to 171 kJ/mol for the insulation composite compared with raw fibers ( E a = 101 kJ/mol).
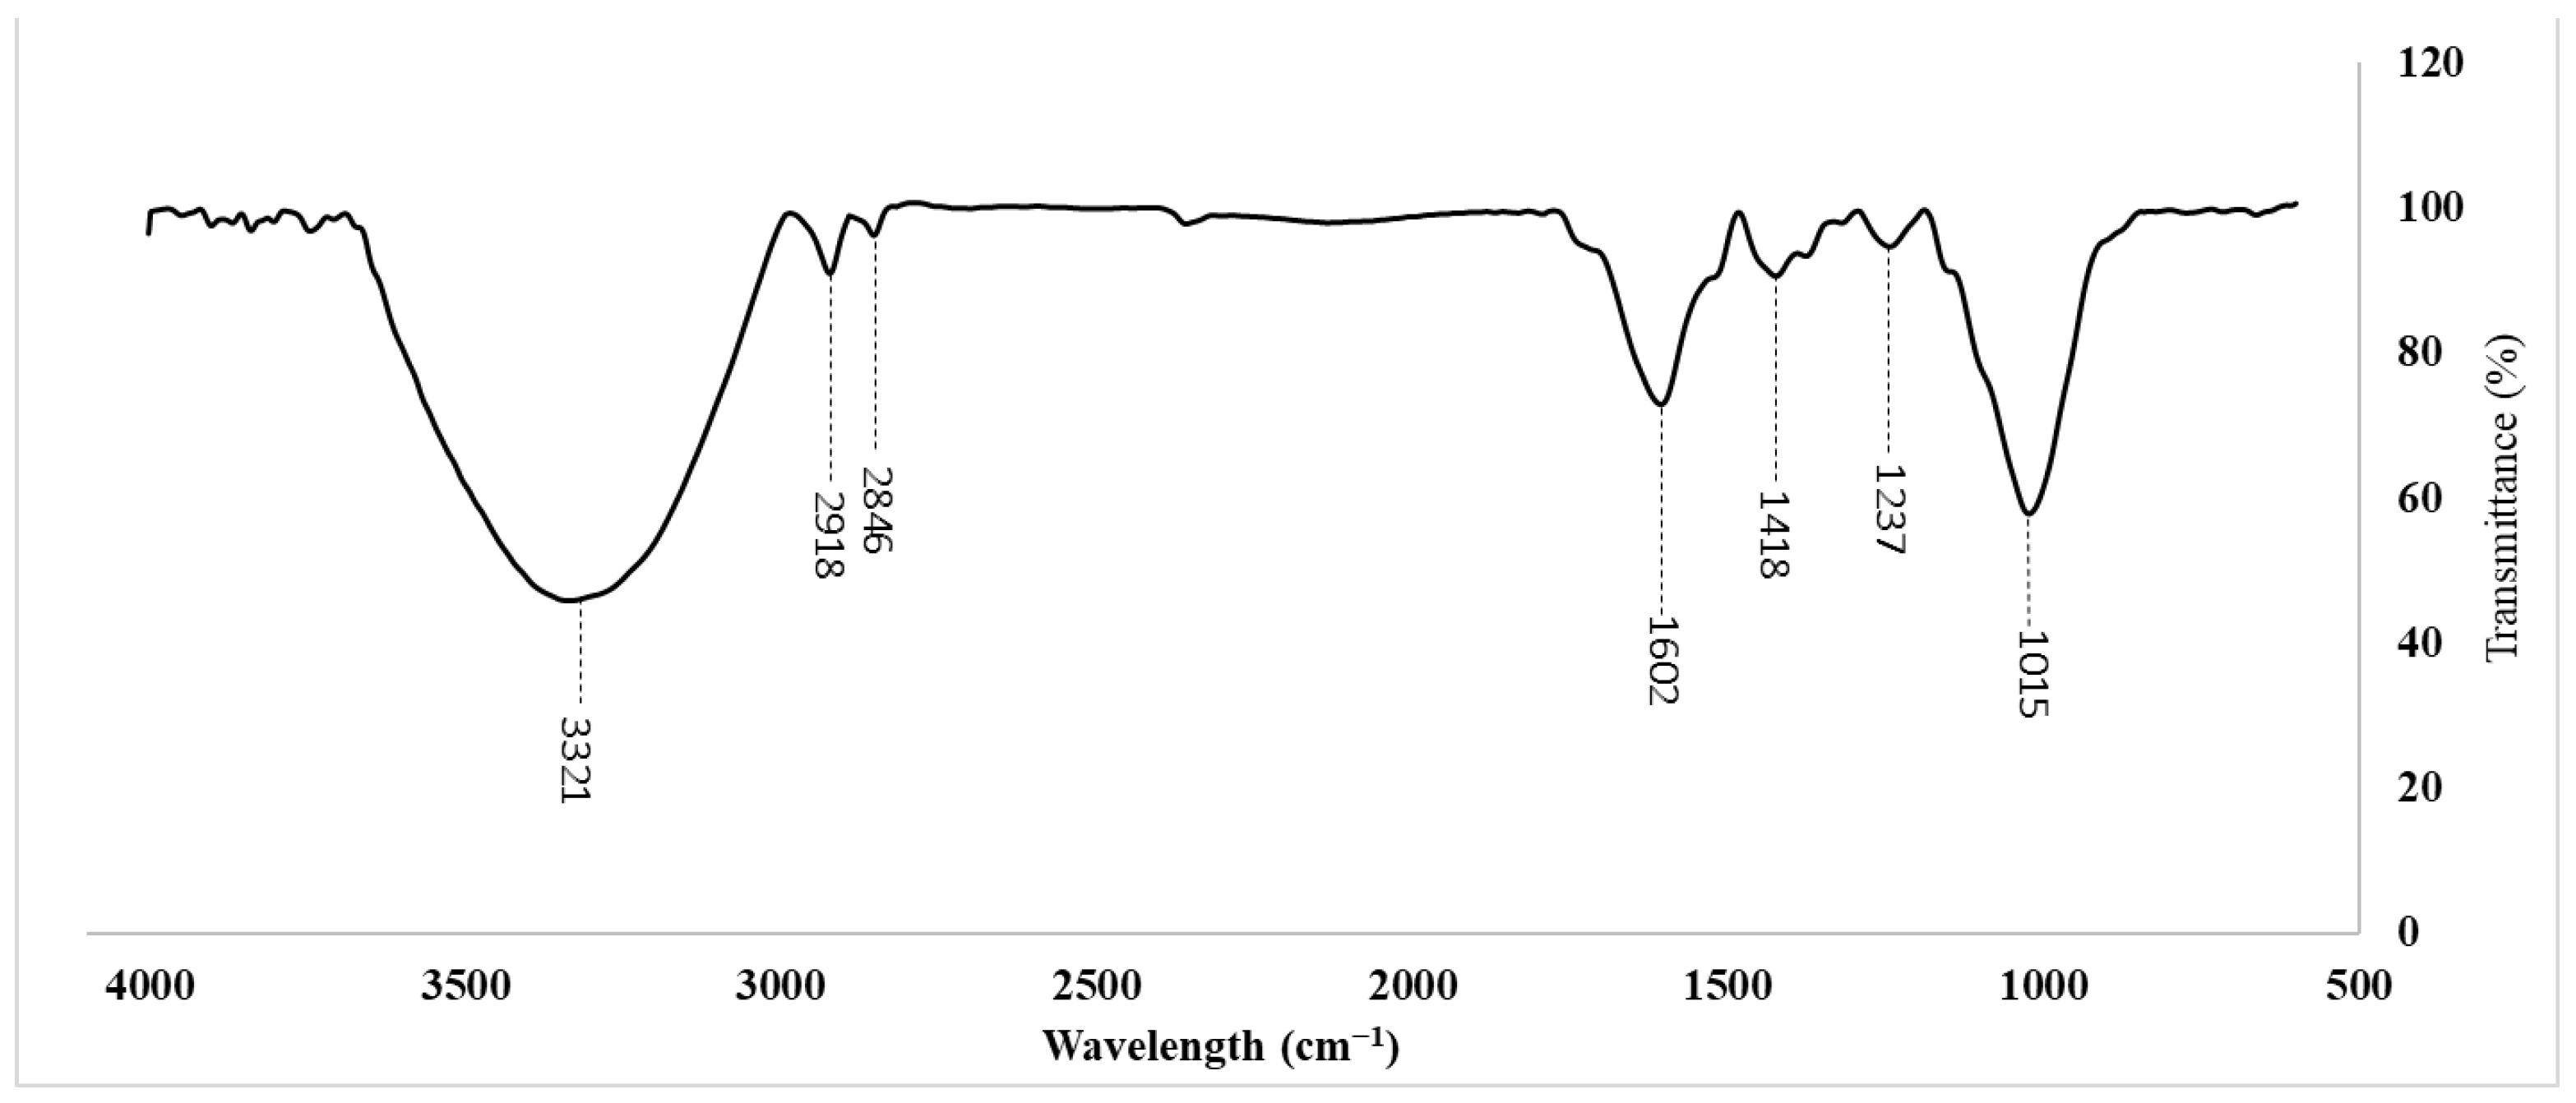
FTIR analysis showed that only carbon, hydrogen, and oxygen are the main constituents of the thermal composite and that it is organic in nature.
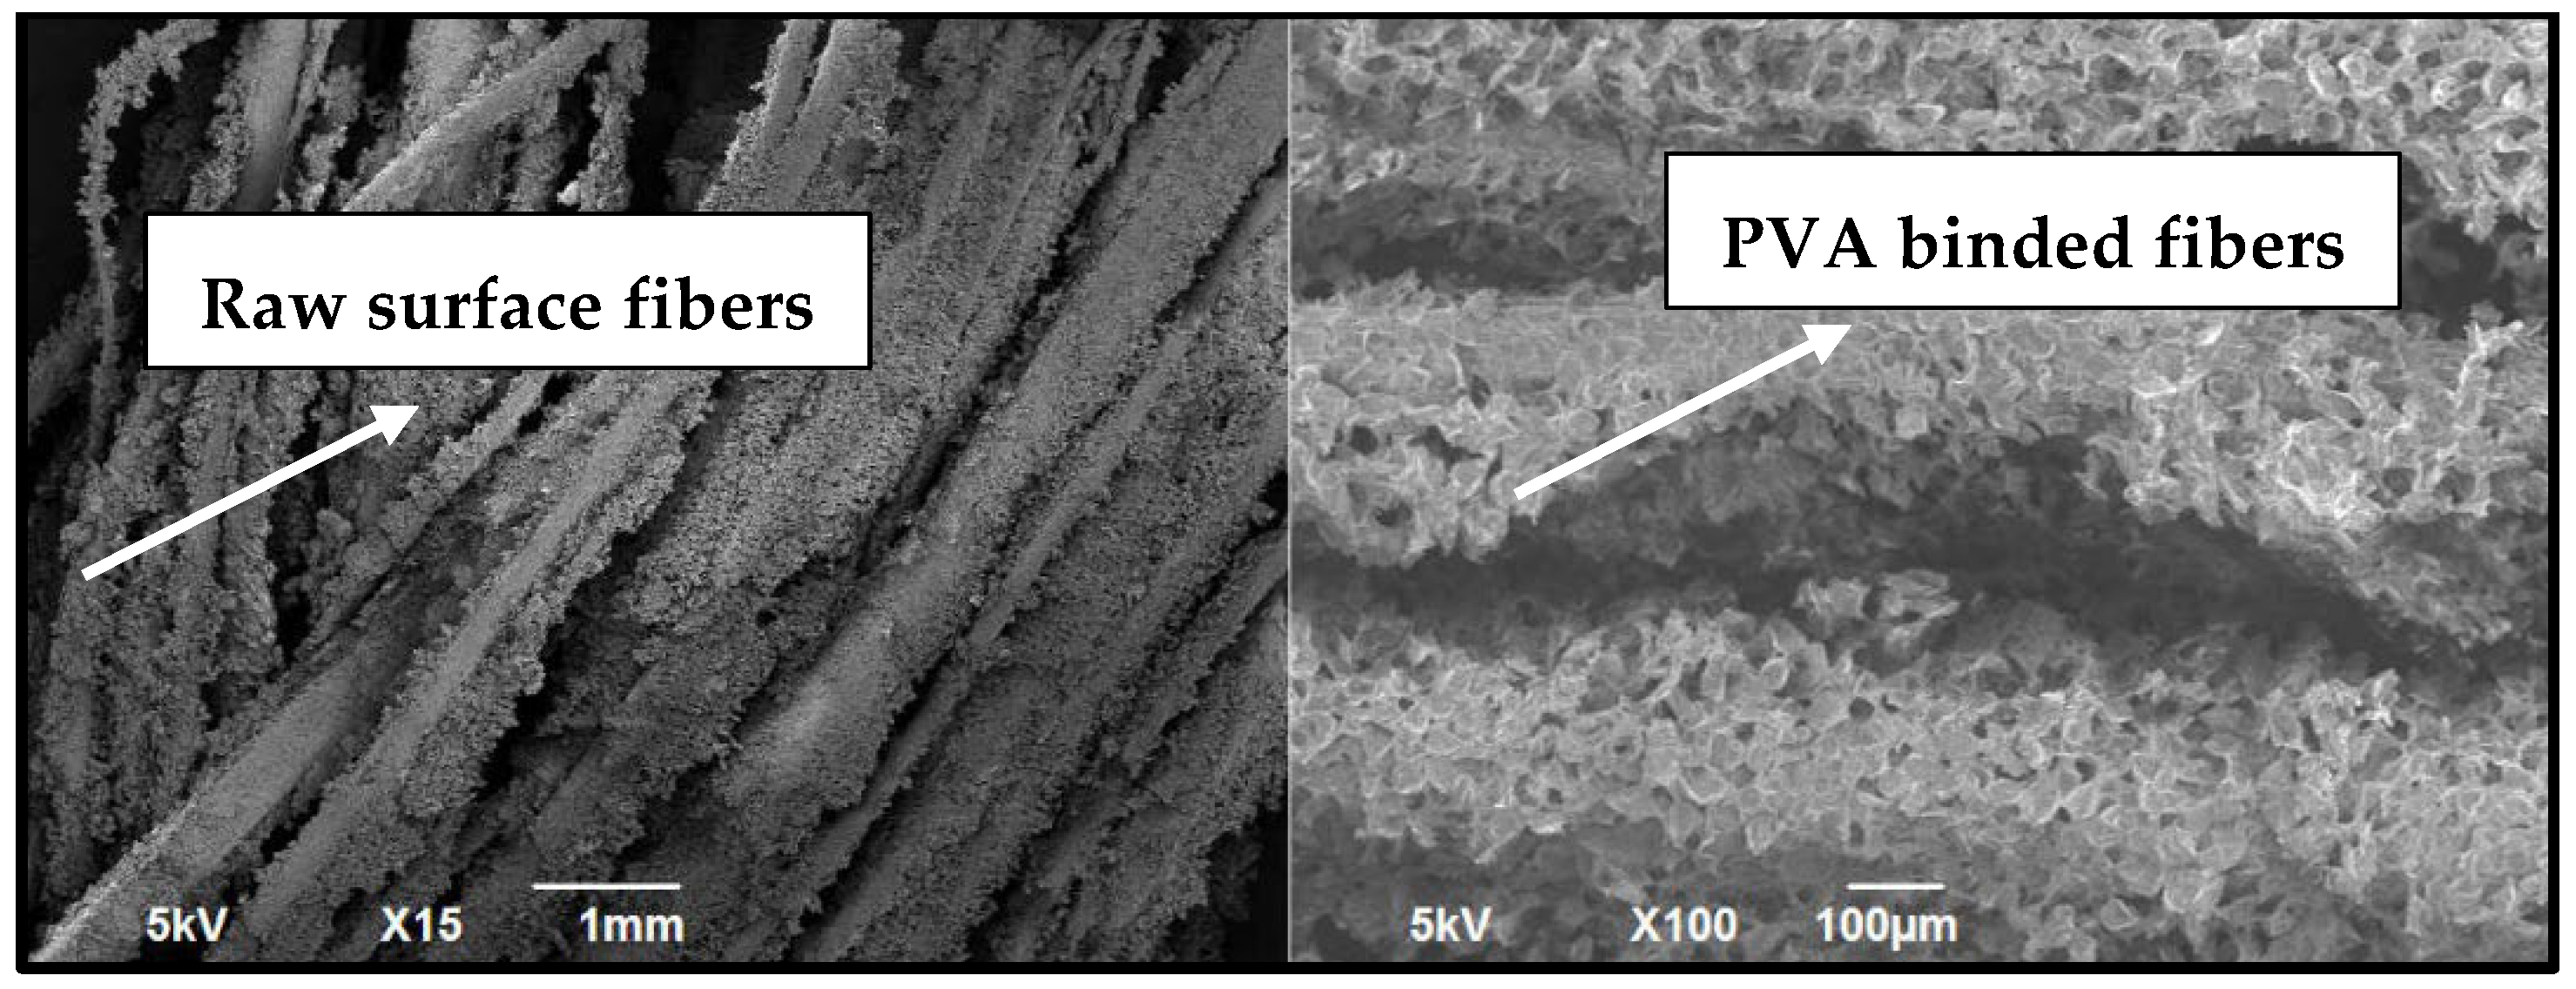
Further, our SEM results confirmed the binding of PVA into the fiber structures.
The prepared insulation composites had a tensile strength of 6.9–10 MPa.
Therefore, date palm surface fiber based building insulation material exhibits excellent properties for use as a substitute for conventional insulation.

Author Contributions

M.R., formal analysis, data curation, writing—original draft; H.A.A., investigation, writing—review and editing; A.A., investigation, writing—review and editing; B.A.-J., conceptualization, methodology, validation, resource management, writing—review and editing. All authors have read and agreed to the published version of the manuscript.

Funding

The research work was funded by research grants (no. 12R014 and 31R272) from the United Arab Emirates University.

Institutional Review Board Statement

Not applicable.

Informed Consent Statement

Not applicable.

Data Availability Statement

Not applicable.

Conflicts of Interest

The authors state that they have no conflicting economic interests or personal connections that could be perceived to have impacted the research presented in this study.

References

  1. Economidou, M.; Todeschi, V.; Bertoldi, P.; D’Agostino, D.; Zangheri, P.; Castellazzi, L. Review of 50 years of EU energy efficiency policies for buildings. Energy Build. 2020, 225, 110322. [Google Scholar] [CrossRef]
  2. Miner, K.R.; Turetsky, M.R.; Malina, E.; Bartsch, A.; Tamminen, J.; McGuire, A.D.; Sweeney, C.; Elder, C.D.; Miller, C.E. Permafrost carbon emissions in a changing Arctic. Nat. Rev. Earth Environ. 2022, 3, 55–67. [Google Scholar] [CrossRef]
  3. Pigliautile, I.; Chàfer, M.; Pisello, A.L.; Pérez, G.; Cabeza, L.F. Inter-building assessment of urban heat island mitigation strategies: Field tests and numerical modelling in a simplified-geometry experimental set-up. Renew. Energy 2020, 147, 1663–1675. [Google Scholar] [CrossRef]
  4. Aly, N.M.; Seddeq, H.; Elnagar, K.; Hamouda, T. Acoustic and thermal performance of sustainable fiber reinforced thermoplastic composite panels for insulation in buildings. J. Build. Eng. 2021, 40, 102747. [Google Scholar] [CrossRef]
  5. Gounni, A.; Alami, M.E. Experimental study of heat transfer in a reduced scale cavity incorporating phase change material into its vertical walls. J. Therm. Sci. Eng. Appl. 2018, 10, 011010. [Google Scholar] [CrossRef]
  6. Berardi, U. The impact of aging and environmental conditions on the effective thermal conductivity of several foam materials. Energy 2019, 182, 777–794. [Google Scholar] [CrossRef]
  7. Asdrubali, F.; D’Alessandro, F.; Schiavoni, S. A review of unconventional sustainable building insulation materials. Sustain. Mater. Technol. 2015, 4, 1–17. [Google Scholar] [CrossRef]
  8. Yildiz, G.; Yahia, M.E. Comparative performance evaluation of conventional and renewable thermal insulation materials used in building envelops. Teh. Vjesn. 2020, 27, 283–289. [Google Scholar]
  9. Hill, C.; Norton, A.; Dibdiakova, J. A comparison of the environmental impacts of different categories of insulation materials. Energy Build. 2018, 162, 12–20. [Google Scholar] [CrossRef]
  10. Abedom, F.; Sakthivel, S.; Asfaw, D.; Melese, B.; Solomon, E.; Kumar, S.S. Development of natural fiber hybrid composites using sugarcane bagasse and bamboo charcoal for automotive thermal insulation materials. Adv. Mater. Sci. Eng. 2021, 2021, 2508840. [Google Scholar] [CrossRef]
  11. Dickson, T.; Pavía, S. Energy performance, environmental impact and cost of a range of insulation materials. Renew. Sustain. Energy Rev. 2021, 140, 110752. [Google Scholar] [CrossRef]
  12. Ilyas, R.A.; Aisyah, H.A.; Nordin, A.H.; Ngadi, N.; Zuhri, M.Y.M.; Asyraf, M.R.M.; Sapuan, S.M.; Zainudin, E.S.; Sharma, S.; Abral, H.; et al. Natural-Fiber-Reinforced Chitosan, Chitosan Blends and Their Nanocomposites for Various Advanced Applications. Polymers 2022, 14, 874. [Google Scholar] [CrossRef]
  13. Asyraf, M.R.M.; Ishak, M.R.; Sapuan, S.M.; Yidris, N.; Ilyas, R.A.; Rafidah, M.; Razman, M.R. Potential application of green composites for cross arm component in transmission tower: A brief review. Int. J. Polym. Sci. 2020, 2020, 8878300. [Google Scholar] [CrossRef]
  14. Raza, M.; Abu-Jdayil, B.; Al-Marzouqi, A.H.; Inayat, A. Kinetic and thermodynamic analyses of date palm surface fibers pyrolysis using Coats-Redfern method. Renew. Energy 2022, 183, 67–77. [Google Scholar] [CrossRef]
  15. Inayat, A.; Raza, M. District cooling system via renewable energy sources: A review. Renew. Sustain. Energy Rev. 2019, 107, 360–373. [Google Scholar] [CrossRef]
  16. Alzaabi, M.S.A.; Mezher, T. Analyzing existing UAE national water, energy and food nexus related strategies. Renew. Sustain. Energy Rev. 2021, 144, 111031. [Google Scholar] [CrossRef]
  17. Rehman, M.S.U.; Shafiq, M.T.; Afzal, M. Impact of COVID-19 on project performance in the UAE construction industry. J. Eng. Des. Technol. 2021, 20, 245–266. [Google Scholar]
  18. Kosiński, P.; Brzyski, P.; Tunkiewicz, M.; Suchorab, Z.; Wiśniewski, D.; Palczyński, P. Thermal Properties of Hemp Shives Used as Insulation Material in Construction Industry. Energies 2022, 15, 2461. [Google Scholar] [CrossRef]
  19. Yan, Q.; Feng, Z.; Luo, J.; Xia, W. Preparation and characterization of building insulation material based on SiO2 aerogel and its composite with expanded perlite. Energy Build. 2022, 255, 111661. [Google Scholar] [CrossRef]
  20. Srihanum, A.; Tuan Noor, M.T.; Devi, K.P.; Hoong, S.S.; Ain, N.H.; Mohd, N.S.; Din Mat, N.S.M.N.; Kian, Y.S. Low density rigid polyurethane foam incorporated with renewable polyol as sustainable thermal insulation material. J. Cell. Plast. 2022, 58, 1–19. [Google Scholar] [CrossRef]
  21. Abu-Jdayil, B.; Abdallah, H.A.; Mlhem, A.; Alkhatib, S.; Sayah, E.A.; Abdulsalam, H.; Asayel, A.; Alaydaroos, A. Utilization of Polyurethane Foam Dust in Development of Thermal Insulation Composite. Buildings 2022, 12, 126. [Google Scholar] [CrossRef]
  22. Dissanayake, D.; Weerasinghe, D.; Thebuwanage, L.; Bandara, U. An environmentally friendly sound insulation material from post-industrial textile waste and natural rubber. J. Build. Eng. 2021, 33, 101606. [Google Scholar] [CrossRef]
  23. Hittini, W.; Mourad, A.-H.I.; Abu-Jdayil, B. Utilization of devulcanized waste rubber tire in development of heat insulation composite. J. Clean. Prod. 2021, 280, 124492. [Google Scholar] [CrossRef]
  24. Abu-Jdayil, B.; Mourad, A.-H.I.; Hussain, A.; Al Abdallah, H. Thermal insulation and mechanical characteristics of polyester filled with date seed wastes. Constr. Build. Mater. 2022, 315, 125805. [Google Scholar] [CrossRef]
  25. Mlhem, A.; Abu-Jdayil, B.; Tong-Earn, T.; Iqbal, M. Sustainable heat insulation composites from date palm fibre reinforced poly (β-hydroxybutyrate). J. Build. Eng. 2022, 54, 104617. [Google Scholar] [CrossRef]
  26. Al Abdallah, H.; Abu-Jdayil, B.; Iqbal, M.Z. The Effect of Alkaline Treatment on Poly(lactic acid)/Date Palm Wood Green Composites for Thermal Insulation. Polymers 2022, 14, 1143. [Google Scholar] [CrossRef]
  27. Abu-Jdayil, B.; Barkhad, M.S.; Mourad, A.-H.I.; Iqbal, M.Z. Date palm wood waste-based composites for green thermal insulation boards. J. Build. Eng. 2021, 43, 103224. [Google Scholar] [CrossRef]
  28. Barkhad, M.S.; Abu-Jdayil, B.; Iqbal, M.Z.; Mourad, A.-H.I. Thermal insulation using biodegradable poly (lactic acid)/date pit composites. Constr. Build. Mater. 2020, 261, 120533. [Google Scholar] [CrossRef]
  29. Al Abdallah, H.; Abu-Jdayil, B.; Iqbal, M.Z. Improvement of Mechanical Properties and Water Resistance of Bio-based Thermal Insulation Material via Silane Treatment. J. Clean. Prod. 2022, 346, 131242. [Google Scholar] [CrossRef]
  30. Masri, T.; Ounis, H.; Sedira, L.; Kaci, A.; Benchabane, A. Characterization of new composite material based on date palm leaflets and expanded polystyrene wastes. Constr. Build. Mater. 2018, 164, 410–418. [Google Scholar] [CrossRef]
  31. Ali, M.; Alabdulkarem, A.; Nuhait, A.; Al-Salem, K.; Iannace, G.; Almuzaiqer, R. Characteristics of agro waste fibers as new thermal insulation and sound absorbing materials: Hybrid of date palm tree leaves and wheat straw fibers. J. Nat. Fibers 2021, 1–9. [Google Scholar] [CrossRef]
  32. Ali, M.E.; Alabdulkarem, A. On thermal characteristics and microstructure of a new insulation material extracted from date palm trees surface fibers. Constr. Build. Mater. 2017, 138, 276–284. [Google Scholar] [CrossRef]
  33. Haseli, M.; Layeghi, M.; Hosseinabadi, H.Z. Characterization of blockboard and battenboard sandwich panels from date palm waste trunks. Measurement 2018, 124, 329–337. [Google Scholar] [CrossRef]
  34. Alabdulkarem, A.; Ali, M.; Iannace, G.; Sadek, S.; Almuzaiqer, R. Thermal analysis, microstructure and acoustic characteristics of some hybrid natural insulating materials. Constr. Build. Mater. 2018, 187, 185–196. [Google Scholar] [CrossRef]
  35. Abu-Jdayil, B.; Raza, M.; Al Abdallah, H. Thermal Insulating Material Made from Date Palm Surface Fibers. U.S. Patent 11255052b1, 22 July 2022. [Google Scholar]
  36. Cetiner, I.; Shea, A.D. Wood waste as an alternative thermal insulation for buildings. Energy Build. 2018, 168, 374–384. [Google Scholar] [CrossRef]
  37. Gayathri, K.; Rajesh, K.M.; Krishnan, P.V.; Anandan, K.; Rexalin, D.A.; Anbalagan, G. A study on kinetic properties of brucinium hydroge (s) malate pentahydrate single crystal by Coats Redfern method. In AIP Conference Proceedings; AIP Publishing LLC: Jodhpur, India, 2020; Volume 2265, p. 030425. [Google Scholar]
  38. Naqvi, S.R.; Uemura, Y.; Osman, N.; Yusup, S. Kinetic study of the catalytic pyrolysis of paddy husk by use of thermogravimetric data and the Coats–Redfern model. Res. Chem. Intermed. 2015, 41, 9743–9755. [Google Scholar] [CrossRef]
  39. GreenSpec. Insulation Materials and Their Thermal Properties. 2021. Available online: https://www.greenspec.co.uk/building-design/insulation-materials-thermal-properties/ (accessed on 11 May 2022).
  40. Patnaik, A.; Mvubu, M.; Muniyasamy, S.; Botha, A.; Anandjiwala, R.D. Thermal and sound insulation materials from waste wool and recycled polyester fibers and their biodegradation studies. Energy Build. 2015, 92, 161–169. [Google Scholar] [CrossRef]
  41. Nguyen, D.M.; Grillet, A.-C.; Diep, T.M.H.; Bui, Q.B.; Woloszyn, M. Influence of thermo-pressing conditions on insulation materials from bamboo fibers and proteins based bone glue. Ind. Crops Prod. 2018, 111, 834–845. [Google Scholar] [CrossRef]
  42. Alana. Thermal Conductivity & U-Values. September 2020. Available online: https://ewistore.co.uk/thermal-conductivity-u-values/#login-modal (accessed on 11 May 2022).
  43. Mahmoodzadeh, M.; Gretka, V.; Hay, K.; Mukhopadhyaya, C.S.P. Determining overall heat transfer coefficient (U-Value) of wood-framed wall assemblies in Canada using external infrared thermography. Build. Environ. 2021, 199, 107897. [Google Scholar] [CrossRef]
  44. Sahu, D.K.; Sen, P.K.; Sahu, G.; Sharma, R.; Bohidar, S. A review on thermal insulation and its optimum thickness to reduce heat loss. Int. J. Innov. Res. Sci. Technol 2015, 2, 1–6. [Google Scholar]
  45. Lakatos, Á.; Kalmár, F. Investigation of thickness and density dependence of thermal conductivity of expanded polystyrene insulation materials. Mater. Struct. 2013, 46, 1101–1105. [Google Scholar] [CrossRef] [Green Version]
  46. Zach, J.; Korjenic, A.; Petránek, V.; Hroudová, J.; Bednar, T. Performance evaluation and research of alternative thermal insulations based on sheep wool. Energy Build. 2012, 49, 246–253. [Google Scholar] [CrossRef]
  47. Mahlia, T.; Taufiq, B.; Masjuki, H. Correlation between thermal conductivity and the thickness of selected insulation materials for building wall. Energy Build. 2007, 39, 182–187. [Google Scholar] [CrossRef]
  48. Cassidy, K. My Builder. 2014. Available online: https://www.mybuilder.com/questions/v/14947/using-50mm-polystyrene-instead-of-50mm-celotex-for-extension (accessed on 11 May 2022).
  49. NBS. What Is A U-Value? 2022. Available online: https://www.thenbs.com/knowledge/what-is-a-u-value-heat-loss-thermal-mass-and-online-calculators-explained (accessed on 11 May 2022).
  50. Kumar, D.; Alam, M.; Zou, P.X.; Sanjayan, J.G.; Memon, R.A. Comparative analysis of building insulation material properties and performance. Renew. Sustain. Energy Rev. 2020, 131, 110038. [Google Scholar] [CrossRef]
  51. Zheng, C.; Li, D.; Ek, M. Mechanism and kinetics of thermal degradation of insulating materials developed from cellulose fiber and fire retardants. J. Therm. Anal. Calorim. 2019, 135, 3015–3027. [Google Scholar] [CrossRef] [Green Version]
  52. Li, A.; Zhang, W.; Zhang, J.; Ding, Y.; Zhou, R. Pyrolysis kinetic properties of thermal insulation waste extruded polystyrene by multiple thermal analysis methods. Materials 2020, 13, 5595. [Google Scholar] [CrossRef]
  53. Jiao, L.; Xu, G.; Wang, Q.; Xu, Q.; Sun, J. Kinetics and volatile products of thermal degradation of building insulation materials. Thermochim. Acta 2012, 547, 120–125. [Google Scholar] [CrossRef]
  54. Song, F.; Wang, Q.; Wang, T. The effects of crystallinity on the mechanical properties and the limiting PV (pressure× velocity) value of PTFE. Tribol. Int. 2016, 93, 1–10. [Google Scholar] [CrossRef]
  55. Mwaikambo, L.Y.; Ansell, M.P. Chemical modification of hemp, sisal, jute, and kapok fibers by alkalization. J. Appl. Polym. Sci. 2002, 84, 2222–2234. [Google Scholar] [CrossRef]
  56. Feng, N.L.; Malingam, S.D.; Razali, N.; Subramonian, S. Alkali and silane treatments towards exemplary mechanical properties of kenaf and pineapple leaf fibre-reinforced composites. J. Bionic 2020, 17, 380–392. [Google Scholar] [CrossRef]
  57. Pawlak, F.; Aldas, M.; Parres, F.; López-Martínez, J.; Arrieta, M.P. Silane-functionalized sheep wool fibers from dairy industry waste for the development of plasticized pla composites with maleinized linseed oil for injection-molded parts. Polymers 2020, 12, 2523. [Google Scholar] [CrossRef]
  58. Ma, S.; Xiao, Y.; Zhou, F.; Schartel, B.; Chan, Y.Y.; Korobeinichev, O.P.; Trubachev, S.A.; Hu, W.; Ma, C.; Hu, Y. Effects of novel phosphorus-nitrogen-containing DOPO derivative salts on mechanical properties, thermal stability and flame retardancy of flexible polyurethane foam. Polym. Degrad. Stab. 2020, 177, 109160. [Google Scholar] [CrossRef]
  59. Rydzkowski, T.; Reszka, K.; Szczypiński, M.; Szczypiński, M.M.; Kopczyńska, E.; Thakur, V.K. Manufacturing and evaluation of mechanical, morphological, and thermal properties of reduced graphene oxide-reinforced expanded polystyrene (EPS) nanocomposites. Adv. Polym. Technol. 2020, 2020, 3053471. [Google Scholar] [CrossRef] [Green Version]
Figure 1. A date palm tree and its key material parts at the Al-Foah Experimental Farm of the UAE University, Al-Ain, United Arab Emirates.
Buildings 12 00866 g001
Figure 2. The two types of molds used for the DPSF/PVA composite fabrication.
Buildings 12 00866 g002
Figure 3. Images of the prepared DPSF/PVA insulation composites varying in density (four samples).
Buildings 12 00866 g003
Figure 4. Density of four insulation composites based on three triplicates.
Buildings 12 00866 g004
Figure 5. Thermal conductivity of four insulation composites based on three triplicates.
Buildings 12 00866 g005
Figure 6. Thermal conductivity of the four prepared samples of insulation composite differing in density.
Buildings 12 00866 g006
Figure 7. Thermal conductivity profiles of the insulation composite at fixed temperatures.
Buildings 12 00866 g007
Figure 8. Linear regressions of thermal conductivity as a function of temperature.
Buildings 12 00866 g008
Figure 9. TGA analysis of raw fibers and the insulation composite.
Buildings 12 00866 g009
Figure 10. DTG of raw fibers and the insulation composite.
Buildings 12 00866 g010
Figure 11. TGA curves of raw fibers and the insulation composite.
Buildings 12 00866 g011
Figure 12. Fitted diffusion models. (a) The anti-Jander model for raw fibers, (b) the Ginstling model for raw fibers, (c) the anti-Jander model for insulation composite, and (d) the Ginstling model for the insulation composite.
Buildings 12 00866 g012
Figure 13. DSC thermograph of the DPSF/PVA sample.
Buildings 12 00866 g013
Figure 14. FTIR spectra of the insulation composite material.
Buildings 12 00866 g014
Figure 15. SEM image of raw date palm fibers (left side) and the prepared insulation composite (right side).
Buildings 12 00866 g015
Figure 16. XRD analysis of raw fibers and insulation composite.
Buildings 12 00866 g016
Figure 17. Stress–strain graphs of insulation composites.
Buildings 12 00866 g017
Table 1. Date palm waste-based insulators.
Date Waste TypeTreatmentsPolymerThermal Conductivity ( W / m · K ) Ref.
Pits (fruit seeds)-Unsaturated polyester0.126–0.138 [24]
Fibers-Poly (β-hydroxybutyrate)0.086–0.112 [25]
Fibers Alkaline treatment (NaOH & KOH)Polylactic acid0.076–0.084 [26]
Wood-Polylactic acid0.0692–0.0757 [27]
Pits-Polylactic acid0.0794 to 0.0682 [28]
Fiberssilane-treated (APTES)Polylactic acid0.085–0.105 [29]
Leaflets Expanded polystyrene0.11–0.16 [30]
LeavesCorn starch and wood adhesive as binder-0.045–0.065 [31]
Surface fibersCorn starch as binder-0.0475–0.0697 [32]
Trunk woodIsocyanate based polyurethane and polyvinyl acetate as binder-0.1357–0.14 [33]
Fibers Corn starch, glue, and white cement as binder-04234–0.05291 [34]
Table 2. Thermal conductivity coefficients of the fiber-based insulation composites.
No.Materials Thermal Conductivity Coefficient, k (W/(m·K))Ref.
1.Date palm surface fibers bonded with PVA (polyvinyl alcohol) 0.038   W / m · K (25 °C) at ρ = 203.33 kg/m3
0.043   W / m · K (25 °C) at ρ = 227.45 kg/m3
0.047   W / m · K (25 °C) at ρ = 246.53 kg/m3
0.051   W / m · K (25 °C) at ρ = 254.01 kg/m3
This study
2.Date palm surface fibers bonded with corn starch 0.047   W / m · K (25 °C) at ρ = 176 kg/m3 [32]
3.Date palm surface fibers, apple of Sodom fibers, and agave fibers bonded with corn starch, wood adhesive glue, and white cement Range   of   0.0418 0.056   W / m · K for all samples at ρ = 170–300 kg/m3 [34]
4.Waste wool and recycled polyester fibers 0.035   W / m · K (35 °C) at ρ = 62.50 kg/m3 [40]
5.Bamboo fibers bonded with protein-based bone glue 0.055   W / m · K (25 °C) at ρ = 246 kg/m3 [41]
Table 3. Thermal diffusivity values of the different insulation composite samples.
T (°C)Heat Capacity C p
(J/g °C)
Thermal Diffusivity (α) (mm2/s)
Sample ASample BSample CSample D
100.1790.2480.2550.2560.270
151.1220.1610.1660.1660.175
201.2910.1420.1450.1450.153
251.3650.1370.1380.1390.147
301.4420.1320.1360.1330.142
351.5010.1290.1330.1300.138
401.5450.1280.1310.1290.136
Table 4. U-value of insulation materials.
No.U-Value
( W / m 2 · K )
Ref.
Sample A (10 mm)3.8This study
Sample B (10 mm)4.3
Sample C (10 mm)4.7
Sample D (10 mm)5.1
Polystyrene (50 mm)1.25 [48]
Celotex (50 mm)2.25
Glass wool (100 mm)0.4 [49]
Concrete blocks (100 mm)11.1
Clay bricks (100 mm)7.6
Fiber glass (50 mm)1 [50]
Table 5. Thermal characteristics of raw fibers and insulation composite.
Thermal Property Raw Fibers Insulation Composite
Initial degradation temperature at (TIN) (°C)255282
Mass loss (%) at TIN116
Major degradation temperature range (°C)255–381282–383
Maximum degradation temperature (Tmax)365368
Table 6. Activation energy ( E a ) of date palm fibers and the insulation composite.
Equation Model E a (kJ/mol)
Raw fibersInsulation composite
Anti-Jander101.26170.57
Ginstling101.67171.63
Table 7. Mechanical properties of insulation composites.
Sample No. Tensile Strength (MPa)Young’s Modulus
(MPa)
Sample A6.93.80
Sample B103.56
Sample C9.84.11
Sample D7.25.98
Publisher’s Note: MDPI stays neutral with regard to jurisdictional claims in published maps and institutional affiliations.

