Article

Life Cycle Environmental Impact of Underground Plastic Recharge Chambers in Stormwater Management

by
Lisa A. Peterson
1,*,
Patricia M. Gallagher
1 and
Sabrina Spatari
2
1
Department of Civil, Architectural and Environmental Engineering, Drexel University, Philadelphia, PA 19104, USA
2
Department of Civil and Environmental Engineering, Technion—Israel Institute of Technology, Haifa 3200003, Israel
*
Author to whom correspondence should be addressed.
Buildings 2022, 12(6), 867; https://doi.org/10.3390/buildings12060867
Submission received: 30 March 2022 / Revised: 31 May 2022 / Accepted: 9 June 2022 / Published: 20 June 2022
(This article belongs to the Section Building Energy, Physics, Environment, and Systems)

Abstract

:
Life cycle assessment is used to systematically evaluate the environmental impact of underground plastic recharge chambers (RCs) used for stormwater management. Using cradle-to-gate life cycle assessment and a functional unit of 1 m3 stormwater capacity, different RC structure types, manufacturing processes and materials are considered. The inventory is based on various commercially available RCs, including injection-molded or extruded polypropylene and polyvinylchloride polymers and typical installation materials and methods. A new dataset is developed to estimate the manufacture and use of recycled polypropylene granulate. TRACI 2.1 is used to investigate the midpoint life cycle impact assessment metrics, acidification, eutrophication, global warming, and fossil fuel resources. Results indicate that plastic represents as much as 99% of the total cradle-to-gate impact, driven largely by the polymer processing method. Injection molding has on average a 50% higher impact per kg of material than extrusion. Processing and transport of backfill material to the project site is approximately 20% of the total cradle-to-gate impact. The transport distance is highly significant: long transport distances can cause the transportation impact to exceed the plastic impact.

1. Introduction

Land development typically requires stormwater control measures (SCMs) to limit runoff volume, reduce peak flow, delay discharge to streams, and reduce pollutant loads to receiving waters, with the ideal goal of mimicking the natural hydrologic system [1]. Another goal of stormwater management is to minimize the area dedicated to SCMs and maximize the utility of developed land such that the land is most efficiently used to the benefit of the owner. Over the last century, SCMs have transitioned from large, centralized installations focused on conveyance to small and decentralized installations located near the impervious area where the runoff is generated and focused on retention and infiltration [2,3]. SCM designers and practitioners have options to choose from as they consider which green and/or gray SCMs will be selected for each impervious surface area site.
Engineers, designers, landowners, and governing bodies need to consider regulations, technical performance, cost, and environmental impact when planning SCMs. Even with infiltration-focused SCMs being applied to all impervious surface areas, peak flow and discharge time, although mitigated, are altered by land development and urbanization [4]. Examples of SCMs include bioretention cells, swales, detention and retention ponds, infiltration trenches, and underground recharge chambers (RCs).
RCs are part of the market segment known as modular tank systems, which represent a 59% share of the USD 516.1 million worldwide stormwater detention system market as of 2021 [5]. RCs allow for decentralized infiltration, with installations placed nearby each area of impervious surface area. They are popular in urban streetscapes and often placed under parks and recreation areas to achieve green space requirements in suburban developments [6]. Moreover, approaches that limit stormwater runoff from the urban built environment align with green building rating systems and guidelines such as LEED, which place an emphasis on best management practices for stormwater management. The RC SCM features an underground structure that collects water during storm events, allowing the collected storm water to slowly infiltrate into the underlying soil over 24 or 48 h following the rain event. Infiltration capability of the underlying soil is a key consideration for RC design. The underground structures are assembled as building blocks or positioned as individual units to accommodate the geometry of the site. The individual building block structures take the form of a box or an arch with significant void space for water storage. Materials used for these structures include concrete or plastic, among which polypropylene (PP) and polyvinyl chloride (PVC) may be used. Some solutions can be stacked as layers deeper into the ground to reduce the surface area footprint. Examples of single-layer plastic box and arch structures are illustrated in Figure 1.

2. Background

In quantifying the impacts of underground retention systems on life cycle environmental and cost impact, a thorough background review is described in five key areas: the role of RCs in infiltration and water quality; RC testing of mechanical properties under load; life cycle assessment (LCA) of SCM studies; and RCs as an SCM strategy. These are the topics covered below.

2.1. Infiltration Studies Involving RCs

RCs were included in the list of SCMs employed for understanding infiltration, recharge, and streamflow at a watershed scale [4,7,8,9]. Hopkins et al. [4] showed that decentralized infiltration-focused SCMs mitigated peak flow and runoff volumes better than centralized detention-focused SCMs, although decentralized infiltration-focused SCMs did not perform as well as forested conditions. Bhaskar’s work [7] evaluated stream flow changes as agricultural and forested land was developed with low-impact development (LID) SCMs including some RCs. Urbanization was positively correlated with increased baseflow and reduced evapotranspiration, meaning that infiltration-focused SCMs recharged stormwater that previously would have been evaporated or stored in soil moisture for plant take-up. Another body of work by Bhaskar [8] looked at the movement of infiltrated stormwater within an urbanized setting utilizing LID SCMs, some of which were RCs. The recharge-to-precipitation ratio was found to be more negatively correlated with precipitation magnitude and more positively correlated with duration in developed and urbanized areas compared to undeveloped land. A faster rate of the rise and fall of groundwater levels was found to be positively correlated with closer proximity of the recharge facility to monitoring wells and a farther distance from the recharge facility to the stream. Rhea [9] utilized a unit hydrograph model to evaluate precipitation to streamflow at catchments in Maryland where RCs were some of the SCMs utilized, finding that land use and construction grading were predictors of precipitation to streamflow. Burszta-Adamiak [10] studied the deterioration of infiltration rates for surface basins and underground basins over time and presented a mathematical model to estimate module clogging.

2.2. Water Quality Studies Involving RCs

A study comparing downstream water quality between traditional SCMs and LID SCMs at the watershed scale, where two RCs were part of the LID SCMs employed, found the LID SCMs implemented close to the source of the stormwater runoff offered better pollutant removal efficiency. Notably, the pollutant removal efficiency (PRE) for each SCM was cited from prior literature where available, but the PRE for the RC was assumed to be equivalent to an infiltration trench due to a paucity of available RC literature [11]. Regarding stormwater treatment performance of the underground chamber, Drake [12] compared a stormwater pond and a concrete underground detention basin for water quality and water temperature, finding that both ponds and underground basins reduced pollutant concentrations; however, the underground detention basin provided cooler outlet water temperatures, which better aligned with the thermal regime of the local habitat.

2.3. Testing of Mechanical Properties of RCs under Loads

Load testing of plastic box and arch RCs was found to be critical to civil and structural design considerations for stormwater systems. The strength and deformation properties of materials for RCs, whether using virgin or recycled polymers, were critical given the loads they were subjected to over their service lives [13,14,15,16,17,18,19]. Since RC structures are frequently utilized under parking lots or driven over in some capacity, a standard load test method was defined by the American Association of State Highway and Transportation Officials (AASHTO) to specify truck axle loads that can safely travel over a structure such as a bridge or an underground structure [20]. McGrath and Mailhot’s work [18] focused on arch structures, defining key design elements of loads, profile sections, and associated time-dependent properties. Masada’s work focused on the live-load testing of buried plastic arch structures [14], the finite element modeling of the arch structure revealing the critical nature of the foot design [15], and deflection formulas intended for use by practicing engineers [13]. Aung’s work [19] investigated the stress on modules under roads. Brachman and Moore’s work [16,17] focused on the live-load testing and failure mechanisms of buried plastic box structures resulting from backfill compaction on the sides, different soil types, and thickness of the top layer over the buried structure. The plastic and the backfill materials are critical components for the structural performance of these SCMs.

2.4. LCA Studies of SCMs Other Than RCs

Increasingly in recent years, LCA has been used to support decision making on alternative SCMs, predominantly in urban settings [21,22,23,24,25,26], although also in rural settings [27]. LCA was also used to understand the environmental impacts and tradeoffs of many SCMs, such as ponds, surface basins, detention tanks, sand filters, trenches, rain gardens, and green roofs [22,23,24,25,26,27,28,29,30,31,32,33,34,35]. Spatari et al. [34] compared the life cycle environmental performance of underground stormwater storage including gravel basin, virgin HDPE pipe in a gravel bed, and recycled HDPE pipe in a gravel bed. Their work found that recycled and virgin HDPE pipe in a gravel bed offered less environmental impact on energy demand (MJ) and global warming potential (kg CO2 eq.) than traditional gravel basin storage. There is, however, a significant gap in the literature related to LCA of RCs, both box and arch structures, utilizing polypropylene (PP) and polyvinylchloride (PVC) plastic polymers and processed via injection molding and extrusion.

2.5. RCs as an SCM

As RCs are a commonly applied SCM, understanding their potential life cycle environmental impacts can support engineering design and implementation decisions, since those impacts are influenced by polymer, RC design, and manufacturing methods. Various studies defined different functional units for their assessment, which means that direct comparison of potential midpoint impact from one study to another is complex or not feasible. Sand filter, concrete vortex, rain garden, and filter swale infiltration trench SCMs were studied utilizing a functional unit of one m3 of stormwater [22,23,28]. Coupled with a study of surface basins, floodplain restoration, permeable paving, and underground stormwater infiltration basins (USIBs, also known as RCs), SCMs were found to range from a global warming midpoint impact of less than 50 kg CO2 eq per cubic meter of managed stormwater for green solutions, such as filter swale infiltration trenches, surface basins, floodplain restorations, and rain gardens, to more than 300 kg CO2 eq per cubic meter of managed stormwater for permeable paving and plastic RC solutions (Supplementary Materials Figure SI-1) [22,23,27,28].
Prior research by Peterson et al. [27] undertook a cradle-to-grave LCA of a plastic box RC product and other SCMs including surface basins, permeable paving, and floodplain restoration. The installation phase of the plastic box RC represented more than half the life cycle potential midpoint impacts for the categories of acidification (kg SO2 eq), eutrophication (kg N eq), global warming (kg CO2 eq), and fossil fuel resources (MJ surplus energy. The authors chose those midpoint impact categories for their relevance to construction (global warming, fossil fuel resources, and acidification) and water resources (acidification and eutrophication). One insight derived by the authors was that the plastic box structure in the RC installation represented over 80% of the installation phase potential impact across these four midpoint impact categories (Supplementary Materials Figures SI-2–SI-5). These findings reveal the dominance of the installation phase compared to the maintenance and end-of-life phases in determining the environmental footprint for one type of RC and led to this expanded study of different types of RC products. This new study elucidates the cradle-to-gate installation phase of various commercially available RC products. Once installed, any RC will have similar maintenance and end-of-life phases; however, the different types of polymer materials, different plastic manufacturing processes, and different installation site backfill materials could significantly impact the magnitude of the installation phase potential midpoint impact for that particular RC.
The objective of this work is to evaluate alternative RC designs for stormwater management using LCA. The second objective is to develop a new dataset for recycled polypropylene granulate using polypropylene scrap from the injection molding process.

3. Methods

3.1. Functional Unit, Goal, Scope, and System Boundary

LCA following ISO 14040/44 methods is used to evaluate alternative plastic RC systems. The functional unit for this study is 1 m3 of managed stormwater over 50 years installed under a landscaped area. Five variants of plastic material and manufacturing processes are analyzed across two main RC structural design types—box and arch, as shown in Figure 2. Two different backfill options, gravel and sand, are also evaluated. The system boundary includes excavation and installation of the RC but excludes construction of manufacturing facilities to make the products in the inventory and final surface materials for the RC installation such as lawn grass, wildflowers, sports turf, or pavement.

3.2. Life Cycle Inventory

Inventories, including plastic material, plastic manufacturing process, backfill material, and geotextile fabric are obtained from review of publicly available data from plastic RC suppliers (Supplementary Materials Tables SI-1 [36,37,38,39,40,41,42,43] and SI-2 [44,45,46,47,48]). Using the data on plastic structure dimensions, mass, storage volume, and/or void area, the mass per cubic meter of stormwater storage is calculated. Some manufacturers list mass of the plastic chamber per volume of stormwater storage, while others provide mass per module, storage volume per module, or dimensions and void space per module. When mass per volume of stormwater is not directly provided, mass per module divided by cubic meters of storage per module is calculated to approximate mass per cubic meter storage.
Using the additional information contained in the installation instructions for excavation, geotextile fabric, and backfill materials, the range for each of these inventory items per m3 of stormwater storage is calculated based on a small 10 m3 rectangular footprint installation and a large 50,000 m3 square footprint installation. Calculation of the excavation volume is based on the volume of the installed plastic infiltration basin plus an additional 1 m of depth for the base layer and top layer and an additional meter of length and width for human maneuverability during installation and for the compactor to backfill the perimeter of the installation. The area of geotextile material is based on the surface area of the installed plastic infiltration basin plus 20% additional material to account for overlap as the geotextile is folded to cover the structure. The volume of backfill material is determined by volume difference between the excavation and the installed plastic infiltration basin. Transport distances are assumed to be 100 km for the plastic RC structure and for the geotextile fabric with sensitivity analysis up to 1000 km based on industrial practice [6]. Transport distances are assumed to be 30 km for the gravel and sand backfill material with sensitivity analysis from 10 km to 300 km [49,50,51]. Moist excavated earth, gravel, sand, and geotextile fabric inventories are converted from volume or area into units of mass as shown in Supplementary Materials Table SI-3 [52,53]. Inventories for each of the box and arch RC installations are summarized in Table 1. While the various suppliers are headquartered in the US, Europe, and Asia, manufacturing locations for the products are also at various places throughout the globe. Given the global nature of these products, we utilize global models where available. Otherwise, datasets already available to the authors are used, which are mostly Europe-based models. Each analysis includes excavation, geotextile fabric, backfill material, and plastic material with the specified manufacturing process. Four different material and process alternatives are analyzed for the box structure and one for the arch structure, totaling 5 analyses.

3.3. Life Cycle Impact Assessment

Cradle-to-gate LCIA of various plastic RCs inform practitioners of the range of potential midpoint impact this SCM imparts through the installation phase. The LCA software package, GaBi ts version 8.7, Leinfelden-Echterdingen, Germany [54], whose earlier version is described in [55], is used for the modeling of the box and arch inventories as documented in Table 1. The midpoint impact categories of acidification, eutrophication, global warming, and fossil fuel resources are assessed via TRACI 2.1 [56,57,58,59].
For the box structure, some suppliers use recycled polypropylene from process scrap (Supplementary Materials Table SI-1). A model for recycled polypropylene granulate from post-consumer plastic waste is commercially available [60], but not for injection molding process scrap. As is the practice of many injection molders, runners, sprues, and injection molding part scrap which comes directly from the injection-molding machines can be ground and used as recycled polypropylene granulate feed material at various ratios from 5% blended with virgin polypropylene to 100% reground polypropylene depending on the product specification. For example, it may be fed back into production of the same product using 15% recycled with 85% virgin material and re-injection-molded, or it may be gathered and used as a lower-grade resin for making a different injection-molded product that uses up to 100% recycled material. When directly fed from the injection-molding machine output into the granulator, no transportation is used; and parts are clean, so washing is not required. However, to be conservative in this model, we add the step of transporting scrap when recycled polypropylene may be consolidated from the manufacturer’s various injection molding plants running only virgin material to another of their plants that blends recycled material into their feed. Further, we add washing to account for any parts that may have become dusty or soiled before granulation due to warehousing of the parts (Supplementary Materials Figure SI-6). Finally, we do not inventory or credit scrap generated as part of start-up, shut-down, or RC tanks scrapped due to quality control; however, the quantity of this material is assumed to be low as noted in earlier LCA work on injection-molded automotive parts [61]; moreover, this source of plastic scrap may be re-ground and sold in secondary markets.
The fraction of recycled content used by current manufacturers is not published in their reports, so 100% recycled material is assumed to assess the maximum upper bound of recycled polymer blending that could be achieved from this material choice; however, it is uncertain. While we assess the case with 100% recycled resin that originates from regrind rather than post-consumer resin, likely a blend of the recycled resin is mixed with primary (virgin) resin. For example, studies by Na et al. [62] and Nguyen et al. [63] describe the failure mechanisms of underground pipe, citing blends for those applications that may take up to 50% post-consumer resin. Nguyen et al. [63] assume a thicker-walled pipe to compensate for post-consumer resin not having the same mechanical properties as primary resin. Our assumption of 100% recycled resin is a source of uncertainty in the analysis.
For the option where recycled polypropylene is used (as noted in Table 1), the value of the midpoint impact for recycled re-granulated polypropylene is substituted for the midpoint impact value of virgin polypropylene granulate (Supplementary Materials Figures SI-7 through SI-10). No impact avoidance such as landfill or incineration avoidance is included. No impact from the original manufacture of the polypropylene is included. Nguyen et al. [64] made similar assumptions for HDPE. It is assumed that scrap polypropylene is an available input to the recycling process, and that the inventories associated with the recycling constitute the environmental impact of using this stream.

4. Results

The plastic structure is the dominant inventory item of the total system installation phase for both box and arch structures across the four midpoint impact categories evaluated. (Supplementary Materials Figures SI-11–SI-13). Each mean midpoint impact value from the plastic is greater than the other inventory items of backfill, transportation, excavation, and geotextile fabric, and each mean midpoint impact value from the plastic in the box structure is larger than in the arch structure (Figure 3), because the arch structure uses less mass of plastic per m3 of managed stormwater.

4.1. Plastic Structure

Focusing on the plastic, the greatest midpoint impact across acidification, eutrophication, global warming, and fossil fuels resources utilizes injection-molded polypropylene (design type 1), with injection-molded recycled polypropylene (design type 2) slightly lower, except for fossil fuels resources where the recycled polypropylene design type is in the same range as the remaining materials and processes analyzed (Figure 4). In consideration of designs using ratios of recycled polypropylene mixed with virgin polypropylene, comparing design type 1 and 2, the potential impact of various percentage blends of virgin and recycled content can be observed. Using 100% recycled polypropylene (design type 2) only reduces the eutrophication and acidification potential impact by about 10% while global warming potential impact is reduced by about one-third and fossil fuel resources potential impact is reduced by almost 70%.
There is uncertainty in this analysis assuming 100% recycled content. The use of recycled resin directly from manufacturing scrap without comingling and sorting of waste and any other post-consumer processing represents the best-case scenario for recycled materials. Including the impacts of any additional processing, as is performed for post-consumer recycled materials, would lessen the benefits. In the work of Na [62] and Nguyen [63] with the HDPE pipe subject to buried loads, a more conservative recycled fraction was applied, albeit different underground material and function were being evaluated. In the case of Nguyen et al., thicker-walled, higher-mass pipe was assumed to compensate for diminished failure time based on durability and failure tests for drainage pipe.

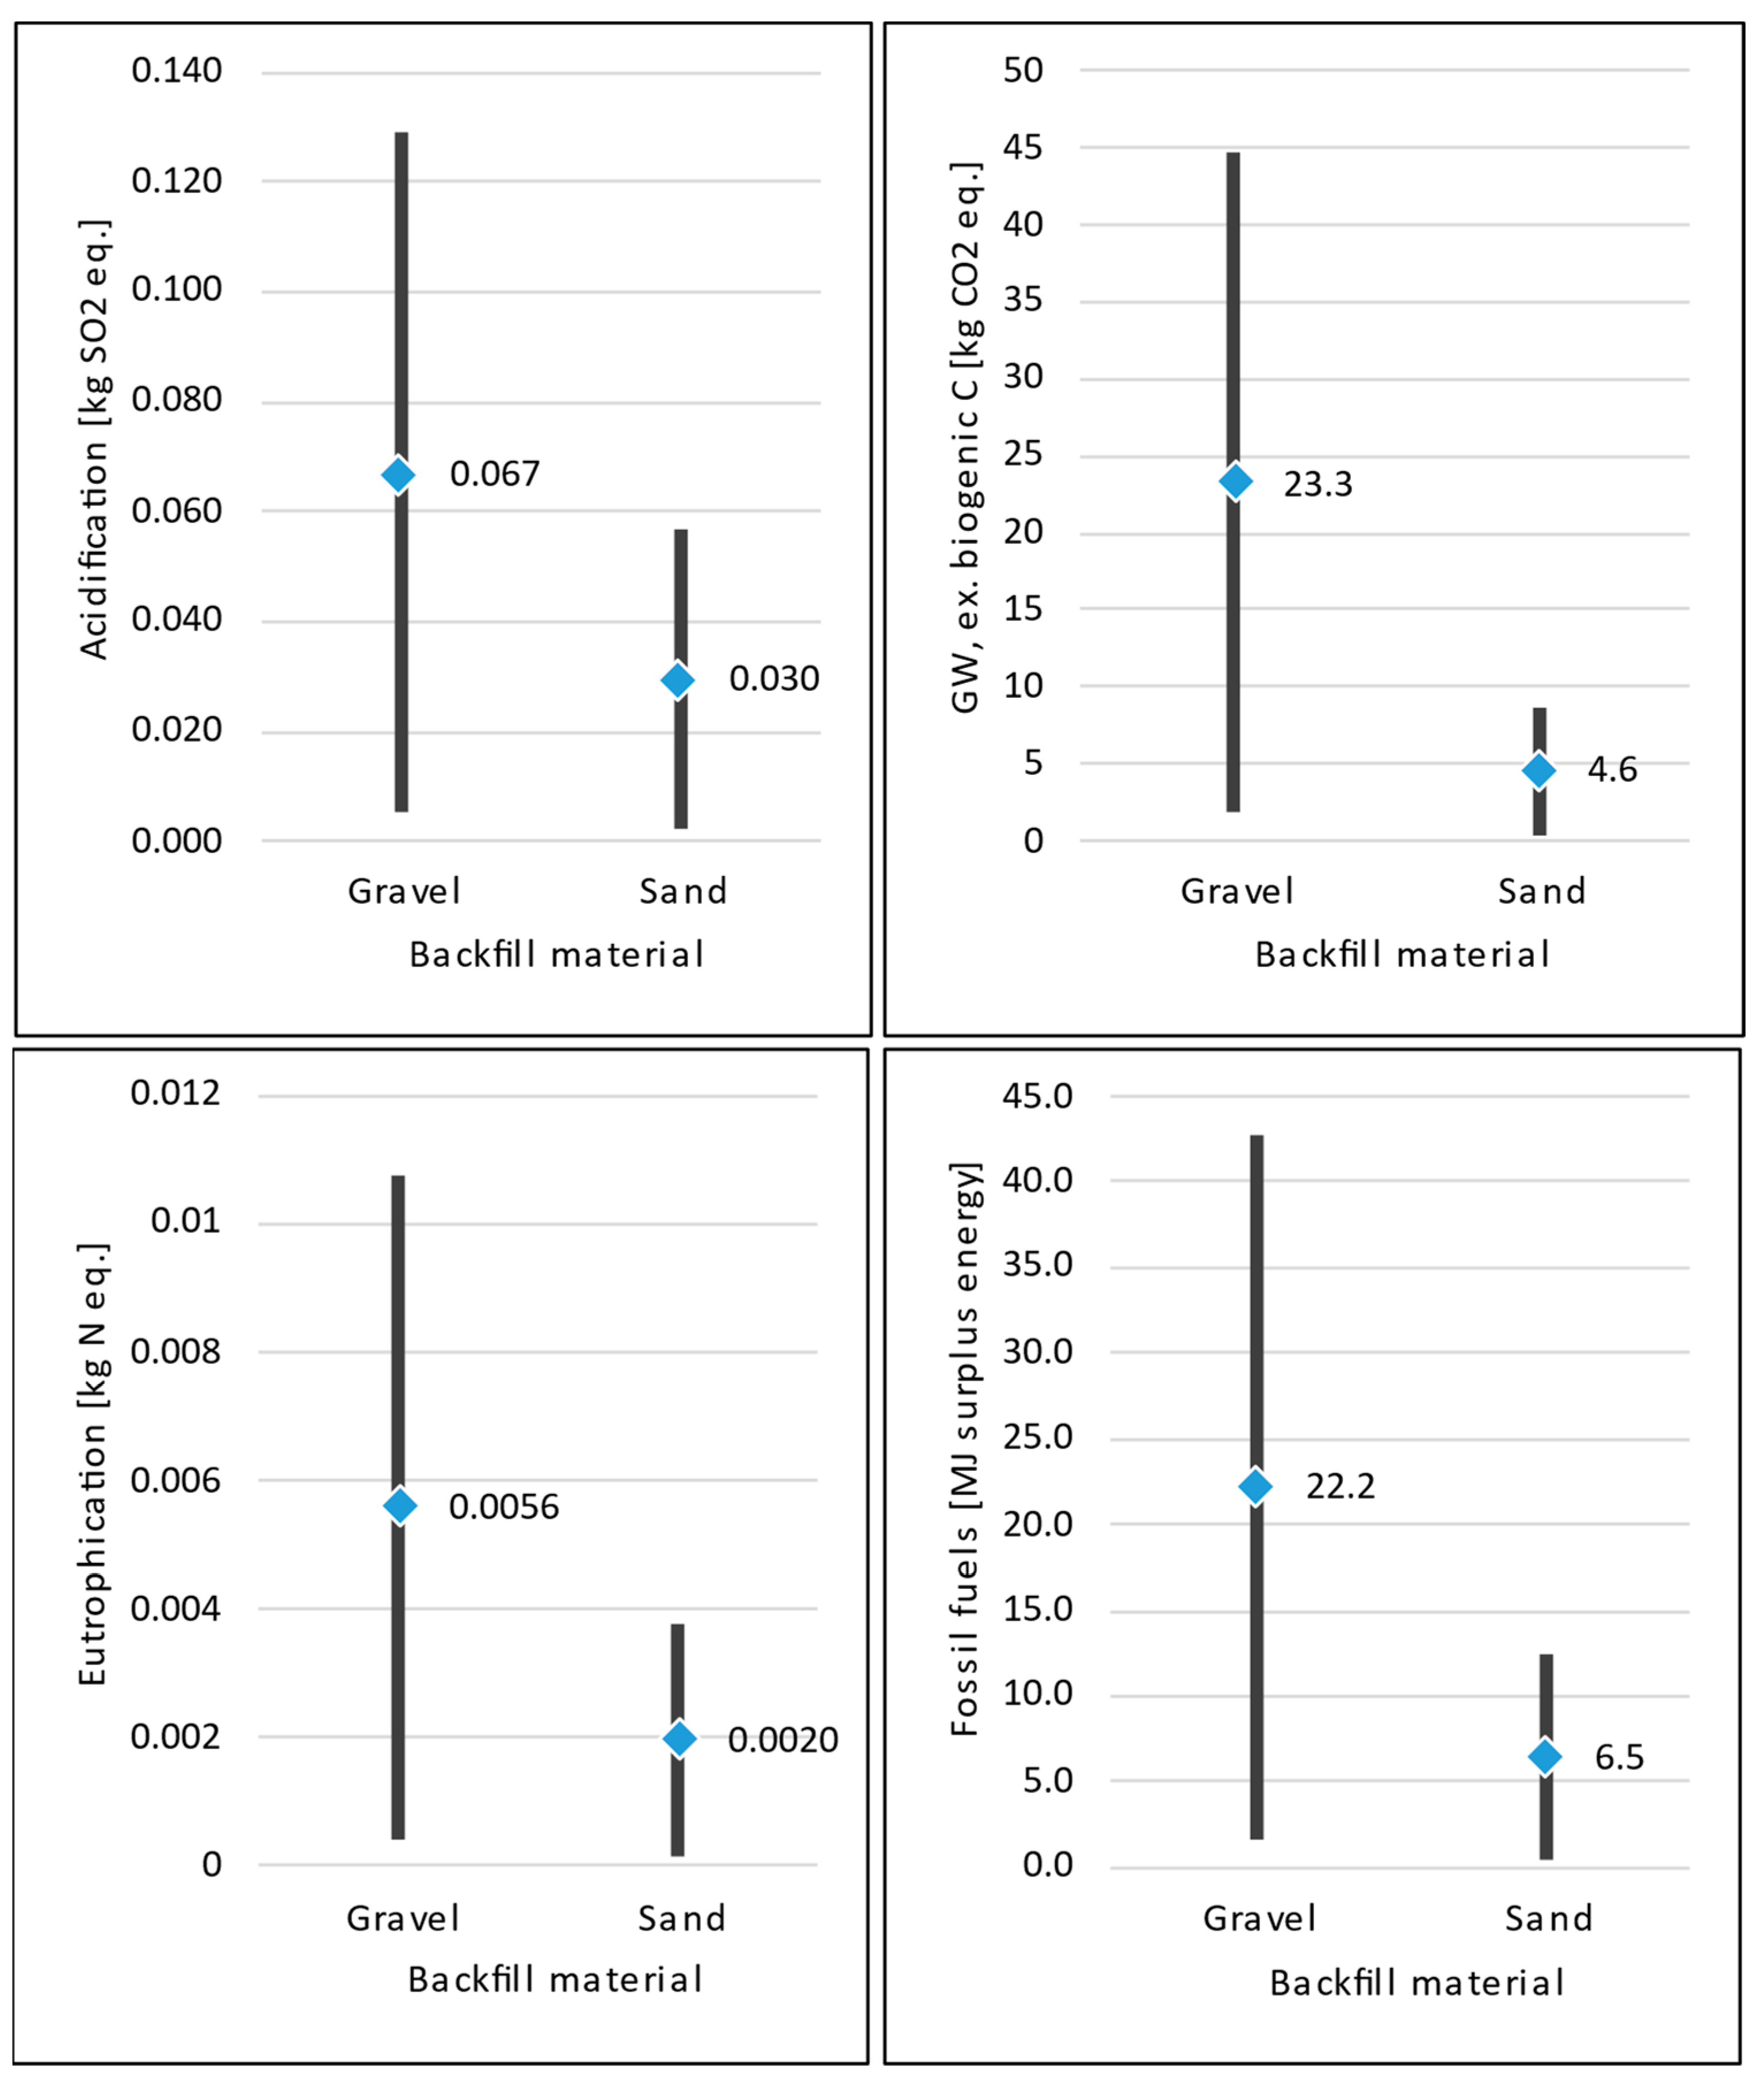
4.2. Backfill Material

In the box structure, some manufacturers recommend sand while other manufacturers recommend gravel. In some design guides either sand or gravel is permitted, resulting in the opportunity to select the backfill material. The global warming impact of gravel is more than 2 times that of sand due to the quarrying and crushing operations associated with gravel (Figure 5).

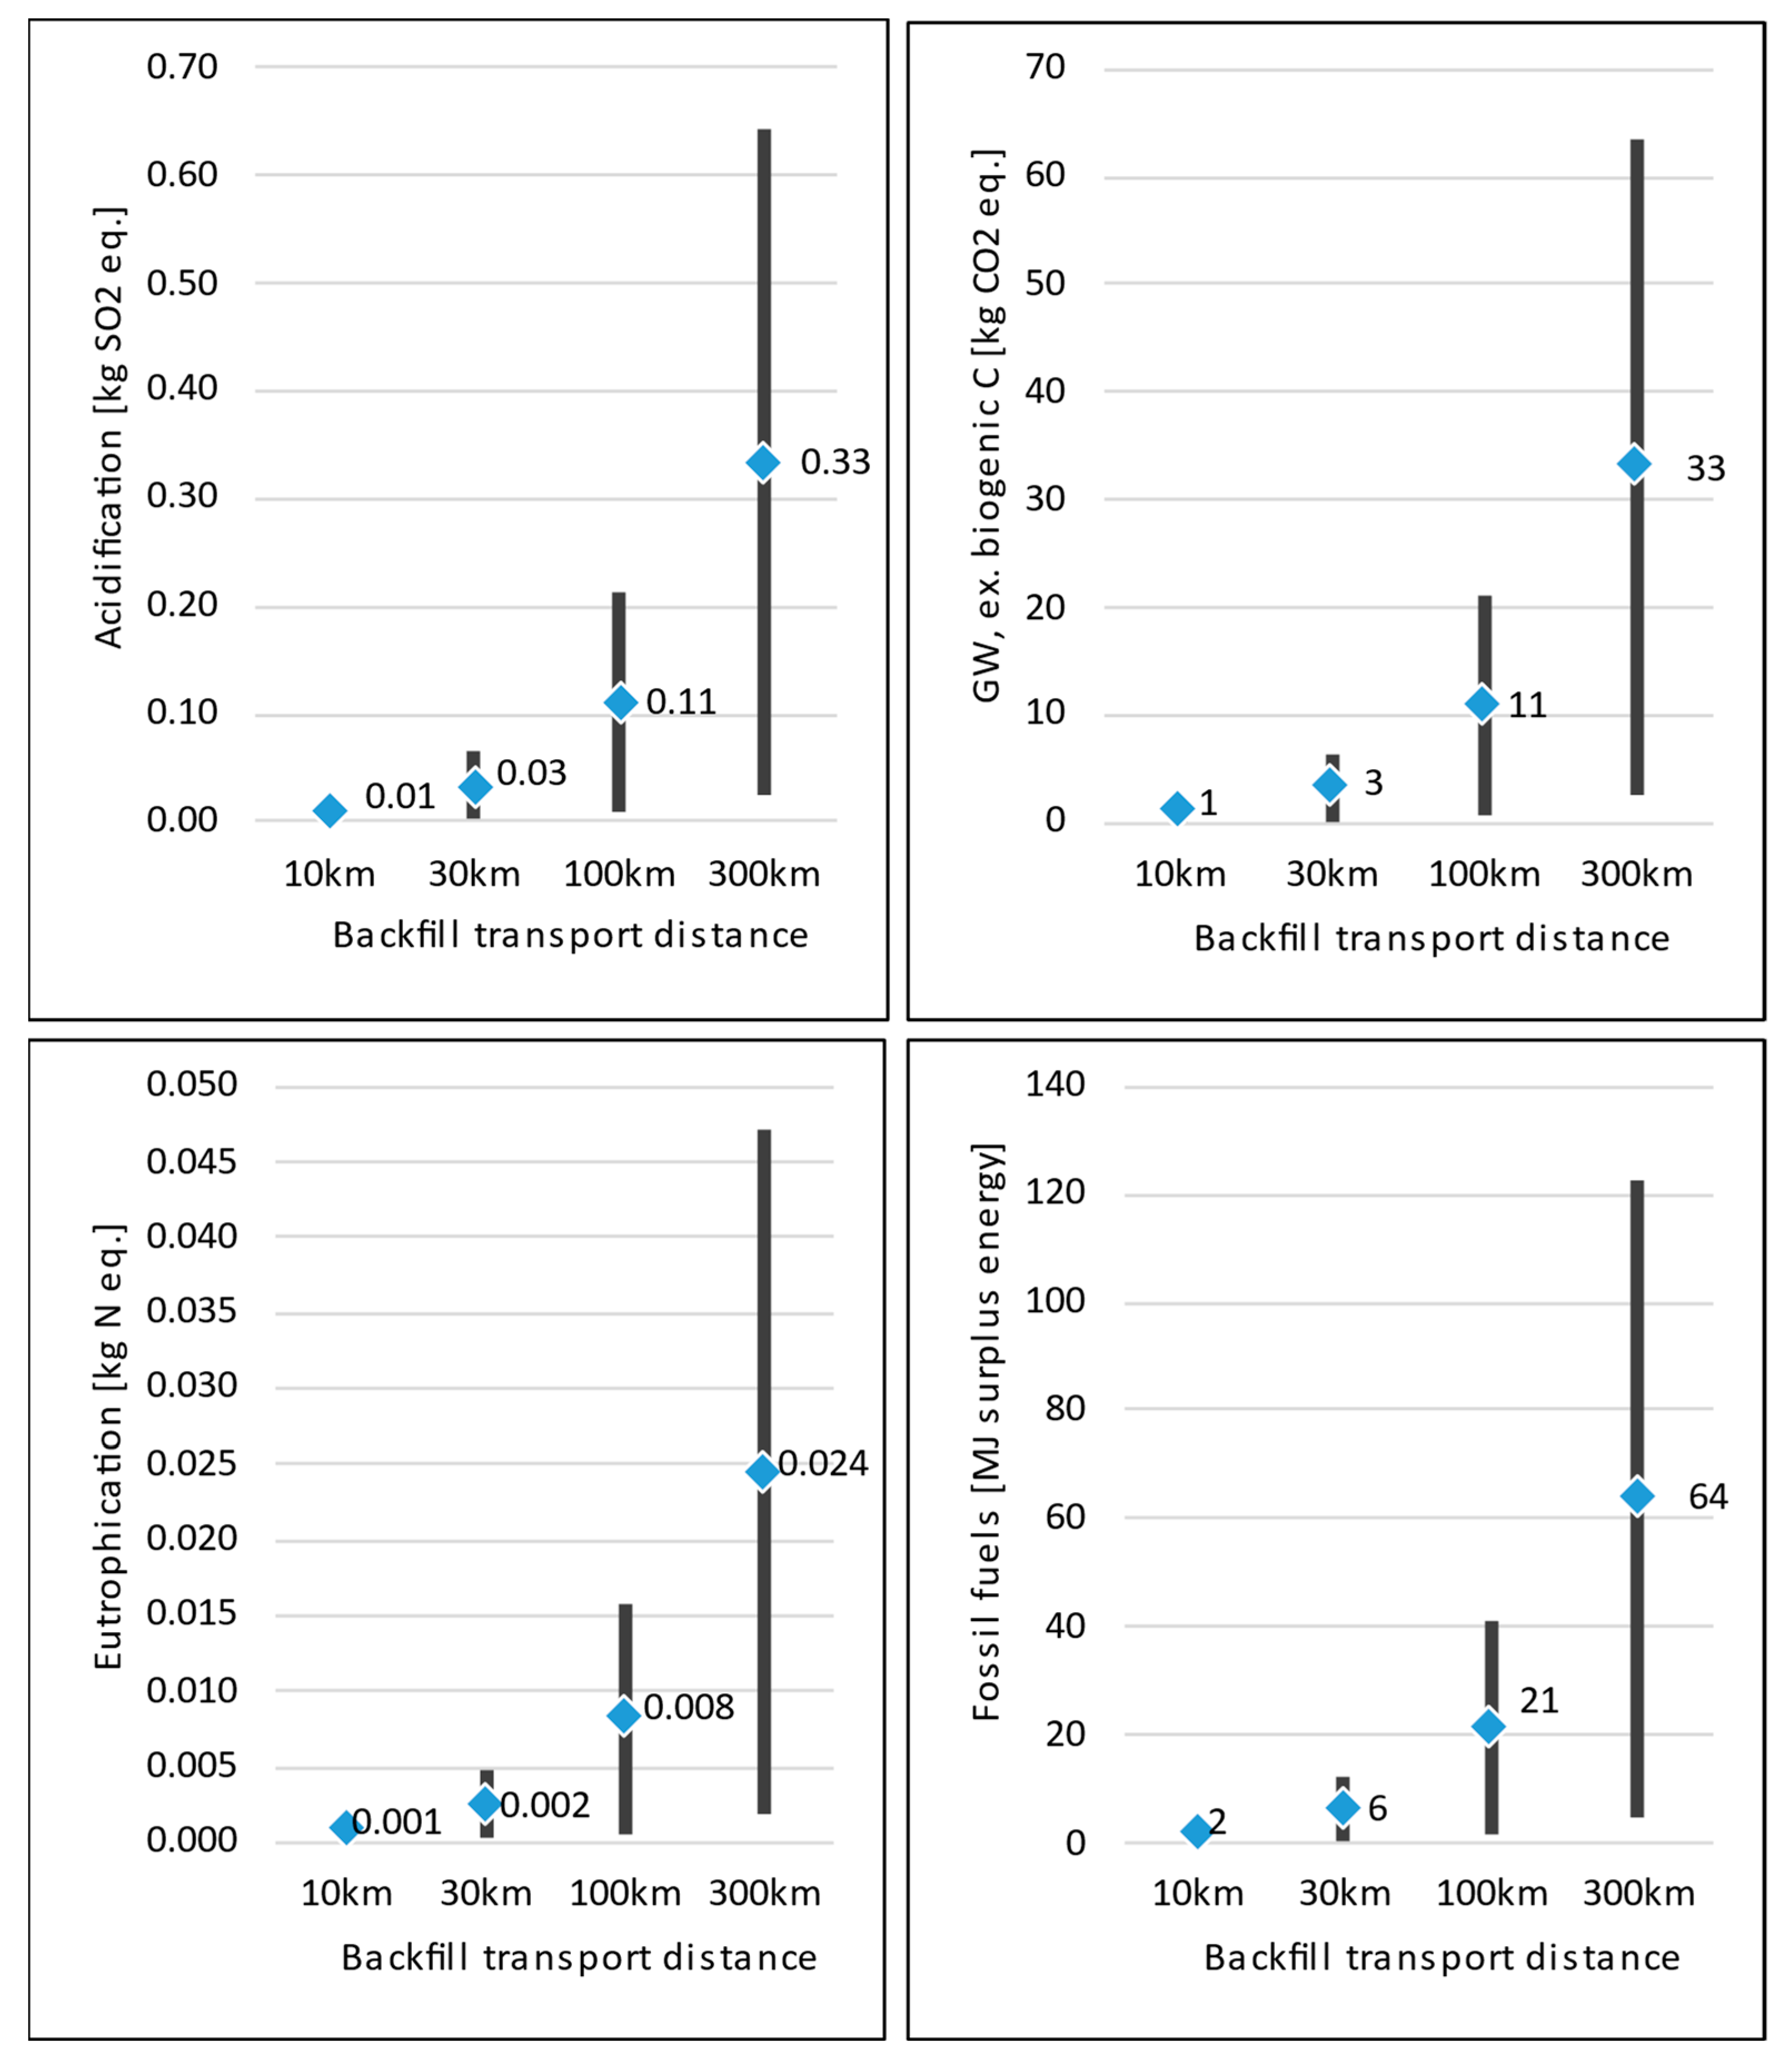
4.3. Transportation Distance

Distance for transportation of the gravel or sand backfill material, which is the inventory item with the largest mass, raises the life cycle impact. The impact could be more than that of the plastic material should gravel or sand need to be transported as far as 300 km from the quarry (gravel) or from the coast (sand) to the stormwater management installation site (Figure 6).

5. Discussion

The plastic in RC SCMs contributes between 13% and 99% towards the acidification and eutrophication impact of the installation phase (Table SI-4). Using the extreme cases of minimum plastic and maximum other inventory items, the minimum percent value of the potential impact from plastic is obtained. Using the other extreme case of maximum plastic and minimum other inventory items, the maximum percent value of the potential impact from plastic is achieved. For the midpoint impact categories of acidification and eutrophication, 300 km backfill transportation distances can exceed the impact of the plastic by an order of 5 (Figure 6). For the midpoint impact categories of global warming and fossil fuels, the plastic in the RC SCMs contributes from about 35% to 99% of the installation phase using the extreme cases as described above, and the transportation distance of the backfill material represents as much as 70% to 105% of the impact of the plastic. Therefore, in the scenario where gravel or sand can be used, consideration of quarry (gravel) or coast (sand) distance should be granted to minimize potential midpoint impacts. The choice of the plastic material and the manufacturing process used to convert the raw plastic into the finished product represent as much as a factor of 10 difference in the midpoint impacts evaluated.
Comparing the global warming midpoint impact metric, a commonly studied metric in prior LCA infrastructure material research, the mean value of global warming for the installation phase of the arch structure is 135 kg CO2 eq. per m3 of stormwater management and 167 kg CO2 eq. per m3 of stormwater management for the box structure. The range of global warming including maximum transportation distances for arch structures is 60 to 257 kg CO2 eq. and 88 to 493 kg CO2 eq. for box structures. Compared to other SCMs, the arch and box RCs are similar in global warming potential to permeable paving, and at minimum values are on par with or slightly greater than sand filters, concrete vortex units, and rain gardens [22,23,28].
Given the significance of the midpoint impact from backfill material, future research should consider recycled materials such as flowable fill derived from fly ash or lightweight foamed glass aggregates derived from recycled container glass [65,66]. For installations near facilities producing these recycled materials, such as flowable fill and lightweight foamed glass aggregates, the opportunity for a reduced midpoint impact may be significant. If substituting natural and renewable products in place of synthetics, the geotextile is another inventory item worthy of future research. While the polypropylene geotextile fabric is not a major contributor to the midpoint impact categories evaluated, natural geotextiles such as jute or coir could be a substitution that would offer an additional reduction in the midpoint impact.
Another area of future research is the refinement of ratios of virgin and recycled polymer used for the RCs with respect to their mechanical properties and structural performance. We note that the ratio of recycled-to-virgin polymer used that can maintain the polymer mechanical property is subject to uncertainty and should be aligned with investigation of failure time, as was carried out in other work by Na et al. [62] for underground pressure pipe. Understanding the failure time of recycled material blends used in underground chambers is critical to determining the service life of the asset, which should be integrated into the LCA. For example, Nguyen et al. [63] built stochastic LCA models that account for variability in HDPE pipe service life to predict ranges of the life cycle environmental impact when using recycled content. Using Monte Carlo analysis to predict LCIA metrics when knowing the variability in asset service life can overcome this limitation. Notwithstanding, while Nguyen et al. modeled the service life of pipe composed of blended post-consumer HDPE resin, here we examine re-ground industrial scrap, which is expected to have better mechanical properties and potentially a longer service life. Given the load-bearing requirements of some installations, the structural performance of recycled polymer RCs and their estimated service life are critical for their use as green materials for stormwater management. Thus, extending analysis to a full cradle-to-grave boundary is critical for predicting the service life and replacement time of RC alternatives that include recycled polymer blends.

6. Conclusions

Limited available land can constrain stormwater management options in development projects. Buried solutions such as RCs can overcome those challenges while also promoting streetscapes, parks, and green spaces. The life cycle environmental impact categories evaluated for plastic RCs reveal that the box structures have higher values than the arch structures for managing stormwater, predominantly because of the higher mass of plastic used in box structures compared to arch structures. The arch structures are favored from the perspective of minimizing midpoint impact; however, the option to use the extruded process for the box structure results in lower midpoint impacts. If the design allows the use of sand, the midpoint impacts could be reduced to less than 50% of impacts for gravel assuming equivalent transport distance. However, in the case where sand needs to be transported longer distances than gravel, careful analysis of tradeoffs between backfill material impacts and transport distance impacts must be considered.
Recycling injection molding process scrap, which is common practice among RC fabricators, reduces fossil resource consumption and global warming impact compared with using primary polymeric material alone. The reduced burden comes without collection and sorting processes that are needed when using post-consumer plastic resin.
In summary, the results obtained show the dominance of the plastic and backfill transport distance in relevant potential midpoint impacts for both plastic RC design types of box and arch structures. There is wide variation in these results, which is driven by the choice of plastic and choice of manufacturing process used for the product. In general, sand as backfill material around the box structure RC installation provides a smaller global warming impact compared to gravel, although the impact of large transport distances could favor local sources of gravel over remote sources of sand.

Supplementary Materials

The following supporting information can be downloaded at: https://www.mdpi.com/article/10.3390/buildings12060867/s1: Figures SI-1–SI-14 and Tables SI-1–SI-4.

Author Contributions

L.A.P. conceived the work, completed analysis, and wrote the original draft. S.S. and P.M.G. reviewed and edited the manuscript. S.S. supervised the work. All authors have read and agreed to the published version of the manuscript.

Funding

This research received no external funding.

Institutional Review Board Statement

Not applicable.

Data Availability Statement

Not applicable.

Acknowledgments

The authors thank Jason Bailey, PE, for recharge chamber industry expertise and various inventory information used in the models as well as Steve Billman for backfill material industry expertise. The authors thank Franco Montalto, Patricia Awerbuch, and Joseph Martin at Drexel University for discussion surrounding developing the system boundaries in this paper.

Conflicts of Interest

The authors declare no conflict of interest.

References

  1. US EPA. Low Impact Development (LID) Literature Review Document #EPA-841-B-00-005; United States Environmental Protection Agency, Office of Water: Washington, DC, USA, 2000.
  2. Hale, R. Spatial and temporal variation in local stormwater infrastructure use and stormwater management paradigms over the 20th century. Water 2016, 8, 310. [Google Scholar] [CrossRef]
  3. McPhillips, L.E.; Matsler, A.M. Temporal evolution of green stormwater infrastructure strategies in three US cities. Front. Built Environ. 2018, 4. [Google Scholar] [CrossRef] [Green Version]
  4. Hopkins, K.G.; Bhaskar, A.S.; Woznicki, S.A.; Fanelli, R.M. Changes in event-based streamflow magnitude and timing after suburban development with infiltration-based stormwater management. Hydrol. Processes 2019, 34, 387–403. [Google Scholar] [CrossRef] [PubMed] [Green Version]
  5. Market Study Report. Global Stormwater Detention System Market Size, Status and Forecast 2021–2027Document #MSR3951641. 2021, p. 117. Available online: https://www.marketstudyreport.com/reports/global-stormwater-detention-system-market-size-status-and-forecast-2021-2027 (accessed on 28 March 2022).
  6. Bailey, J. Personal communication on recharge chambers including applications and installations. 2017. [Google Scholar]
  7. Bhaskar, A.S.; Hogan, D.M.; Archfield, S.A. Urban base flow with low impact development. Hydrol. Processes 2016, 30, 3156–3171. [Google Scholar] [CrossRef] [Green Version]
  8. Bhaskar, A.S.; Hogan, D.M.; Nimmo, J.R.; Perkins, K.S. Groundwater recharge amidst focused stormwater infiltration. Hydrol. Processes 2018, 32, 2058–2068. [Google Scholar] [CrossRef]
  9. Rhea, L.; Jarnagin, T.; Hogan, D.; Loperfido, J.V.; Shuster, W. Effects of urbanization and stormwater control measures on streamflows in the vicinity of Clarksburg, Maryland, USA. Hydrol. Processes 2015, 29, 4413–4426. [Google Scholar] [CrossRef]
  10. Burszta-Adamiak, E.; Lomotowski, J. Modelling of percolation rate of stormwater from underground infiltration systems. Water Sci. Technol. 2013, 68, 2144–2150. [Google Scholar] [CrossRef]
  11. Sparkman, S.A.; Hogan, D.M.; Hopkins, K.G.; Loperfido, J.V. Modeling watershed-scale impacts of stormwater management with traditional versus low impact development design. J. Am. Water Resour. Assoc. 2017, 53, 1081–1094. [Google Scholar] [CrossRef]
  12. Drake, J.; Young, D.; McIntosh, N. Performance of an underground stormwater detention chamber and comparison with stormwater management ponds. Water 2016, 8, 211. [Google Scholar] [CrossRef] [Green Version]
  13. Masada, T. Deflection formulas for buried chamber structures. J. Pipel. Syst. Eng. Pract. 2017, 8, 4017005. [Google Scholar] [CrossRef]
  14. Masada, T. Full-scale field load testing of storm-water storage chamber structures. J. Perform. Constr. Facil. 2011, 25, 317–325. [Google Scholar] [CrossRef]
  15. Masada, T.; Zhu, J.Q. Computer analysis of buried stormwater chamber structures. J. Pipel. Syst. Eng. Pract. 2015, 6, 4014013. [Google Scholar] [CrossRef]
  16. Brachman, R.W.I.; LeBlanc, J.M. Short-term lateral response of a buried modular polymer stormwater collection structure to compaction and overburden pressure. J. Geotech. Geoenviron. Eng. 2017, 143, 4017070. [Google Scholar] [CrossRef]
  17. Moore, I.D.; Brachman, R.W.I.; Elshimi, T.; Rahman, K. Analysis and testing to characterize the strength of buried infrastructure. In Proceedings of the 13th International Conference of the International Association for Computer Methods and Advances in Geomechanics, Melbourne, Australia, 9–13 May 2011; p. 6. [Google Scholar]
  18. McGrath, T.J.; Mailhot, D. Designing stormwater chambers to meet AASHTO specifications. J. ASTM Int. 2010, 7, 1–8. [Google Scholar] [CrossRef]
  19. Aung, T.H.; Khabbaz, H.; Fatahi, B. Parametric study of applied stresses on infiltration modular cells installed under roads. Procedia Eng. 2016, 143, 1325–1332. [Google Scholar] [CrossRef] [Green Version]
  20. AASHTO Standard Specifications. Available online: https://www.transportation.org/ (accessed on 11 December 2021).
  21. Montalto, F.; Behr, C.; Alfredo, K.; Wolf, M.; Arye, M.; Walsh, M. Rapid assessment of the cost-effectiveness of low impact development for CSO control. Landsc. Urban Plan. 2007, 82, 117–131. [Google Scholar] [CrossRef]
  22. Petit-Boix, A.; Sevigne-Itoiz, E.; Rojas-Gutierrez, L.A.; Barbassa, A.P.; Josa, A.; Rieradevall, J.; Gabarrell, X. Environmental and economic assessment of a pilot stormwater infiltration system for flood prevention in Brazil. Ecol. Eng. 2015, 84, 194–201. [Google Scholar] [CrossRef] [Green Version]
  23. Vineyard, D.; Ingwersen, W.W.; Hawkins, T.R.; Xue, X.B.; Demeke, B.; Shuster, W. Comparing green and grey infrastructure using life cycle cost and environmental impact: A rain garden case study in Cincinnati, OH. J. Am. Water Resour. Assoc. 2015, 51, 1342–1360. [Google Scholar] [CrossRef]
  24. Fathollahi, A.; Coupe, S.J. Life cycle assessment (LCA) and life cycle costing (LCC) of road drainage systems for sustainability evaluation: Quantifying the contribution of different life cycle phases. Sci. Total Environ. 2021, 776, 145937. [Google Scholar] [CrossRef]
  25. Hengen, T.J.; Sieverding, H.L.; Stone, J.J. Lifecycle assessment analysis of engineered stormwater control methods common to urban watersheds. J. Water Resour. Plan. Manag.-ASCE 2016, 142, 04016016. [Google Scholar] [CrossRef]
  26. Andrew, R.M.; Vesely, E.T. Life-cycle energy and CO2 analysis of stormwater treatment devices. Water Sci. Technol. 2008, 58, 985–993. [Google Scholar] [CrossRef] [PubMed]
  27. Peterson, L.A.; Awerbuch, P.M.; Spatari, S. Environmental and economic implications of stormwater management alternatives in rural development. J. Ind. Ecol. 2021, 24, 1076–1088. [Google Scholar] [CrossRef]
  28. O’Sullivan, A.D.; Wicke, D.; Hengen, T.J.; Sieverding, H.L.; Stone, J.J. Life Cycle Assessment modelling of stormwater treatment systems. J. Environ. Manag. 2015, 149, 236–244. [Google Scholar] [CrossRef] [PubMed]
  29. Byrne, D.M.; Grabowski, M.K.; Benitez, A.C.B.; Schmidt, A.R.; Guest, J.S. Evaluation of life cycle assessment (LCA) for roadway drainage systems. Environ. Sci. Technol. 2017, 51, 9261–9270. [Google Scholar] [CrossRef] [PubMed]
  30. Flynn, K.M.; Traver, R.G. Green infrastructure life cycle assessment: A bio-infiltration case study. Ecol. Eng. 2013, 55, 9–22. [Google Scholar] [CrossRef]
  31. De Sousa, M.R.C.; Montalto, F.A.; Spatari, S. Using life cycle assessment to evaluate green and grey combined sewer overflow control strategies. J. Ind. Ecol. 2012, 16, 901–913. [Google Scholar] [CrossRef]
  32. Moore, T.L.C.; Hunt, W.F. Predicting the carbon footprint of urban stormwater infrastructure. Ecol. Eng. 2013, 58, 44–51. [Google Scholar] [CrossRef]
  33. Rivela, B.; Cuerda, I.; Olivieri, F.; Bedoya, C.; Neila, J. Life Cycle Assessment for ecodesign of ecological roof made with Intemper TF ecological water-tank system. Mater. Constr. 2013, 63, 131–145. [Google Scholar] [CrossRef] [Green Version]
  34. Spatari, S.; Hubler, J.F.; Hsuan, Y.G.; Marcellus, K. Beneficial use of plastic pipe in sustainable stormwater infrastructure. In Proceedings of the 1st International Specialty Conference on Sustaining Public Infrastructure, Edmonton, AB, Canada, 6–9 June 2012. [Google Scholar]
  35. Spatari, S.; Yu, Z.W.; Montalto, F.A. Life cycle implications of urban green infrastructure. Environ. Pollut. 2011, 159, 2174–2179. [Google Scholar] [CrossRef]
  36. ACF Environmental. Available online: www.acfenvironmental.com (accessed on 13 November 2017).
  37. ACO Stormbrixx. Available online: www.acostormbrixx.us (accessed on 13 November 2017).
  38. Atlantis. Available online: www.rainharvest.com/atlantis-d-raintank-modular-rainwater-storage-system.asp (accessed on 13 November 2017).
  39. Brentwood StormTank. Available online: www.brentwoodindustries.com/stormwater-management (accessed on 13 November 2017).
  40. EcoRain. Available online: www.ecorain.com (accessed on 13 November 2017).
  41. Greening Solution. Available online: www.greening-solution.com (accessed on 13 November 2017).
  42. NidaPlast. Available online: www.nidaplast.com/en-uk (accessed on 13 November 2017).
  43. Wavin Q-Bic Plus. Available online: www.wavin.co.uk (accessed on 13 November 2017).
  44. ADS Storm Tech. Available online: www.stormtech.com (accessed on 13 November 2017).
  45. Contech Engineered Solutions. Available online: http://www.conteches.com/ (accessed on 13 November 2017).
  46. Graf EcoBloc. Available online: www.graf-water.com (accessed on 13 November 2017).
  47. Prinsco HydroStor. Available online: www.prinsco.com (accessed on 13 November 2017).
  48. StormKeeper. Available online: www.laneenterprises.com (accessed on 13 November 2017).
  49. Billman, S.; Schlouch Inc., Blandon, PA, USA. Personal communication on project pricing and price sensitivity, 2017.
  50. PA Aggregates and Concrete Association. Available online: http://www.pacaweb.org/ (accessed on 5 January 2018).
  51. Dirt-Doc. Available online: http://dirt-doc.com/ (accessed on 5 January 2018).
  52. Walker, R. Density of Bulk Materials. Available online: https://www.simetric.co.uk/si_materials.htm (accessed on 13 November 2017).
  53. Wallbarn Geotextiles. Available online: https://www.wallbarn.com/geotextiles/ (accessed on 13 November 2017).
  54. Thinkstep. Thinkstep GaBi. Available online: http://www.gabi-software.com/international/index/ (accessed on 17 December 2017).
  55. Spatari, S.; Betz, M.; Florin, H.; Baitz, M.; Faltenbacher, M. Using GaBi 3 to perform life cycle assessment and life cycle engineering. Int. J. Life Cycle Assess. 2001, 6, 81. [Google Scholar] [CrossRef]
  56. Bare, J.C. Tool for the Reduction and Assessment of Chemical and Other Environmental Impacts (TRACI Version 2.1). Available online: https://www.epa.gov/chemical-research/tool-reduction-and-assessment-chemicals-and-other-environmental-impacts-traci (accessed on 17 April 2020).
  57. Bare, J. TRACI 2.0: The tool for the reduction and assessment of chemical and other environmental impacts 2.0. Clean Technol. Environ. Policy 2011, 13, 687–696. [Google Scholar] [CrossRef]
  58. Bare, J.C. Traci—The tool for the reduction and assessment of chemical and other environmental impacts. J. Ind. Ecol. 2002, 6, 49–78. [Google Scholar] [CrossRef]
  59. Ryberg, M.; Vieira, M.D.M.; Zgola, M.; Bare, J.; Rosenbaum, R.K. Updated US and Canadian normalization factors for TRACI 2.1. Clean Technol. Environ. Policy 2014, 16, 329–339. [Google Scholar] [CrossRef]
  60. Sphera Solutions. Polypropylene (PP) Granulate Secondary; from Post-Consumer Waste, via Washing, Granulation, Pelletization; Production Mix, at Plant; 90% Recycling Rate (en); Sphera Solutions: Stuttgart, Germany, 2020. [Google Scholar]
  61. Keoleian, G.A.; Spatari, S.; Beal, R.T.; Stephens, R.D.; Williams, R.L. Application of life cycle inventory analysis to fuel tank system design. Int. J. Life Cycle Assess. 1998, 3, 18–28. [Google Scholar] [CrossRef]
  62. Na, S.; Nguyen, L.; Spatari, S.; Hsuan, Y.G. Effects of recycled HDPE and nanoclay on stress cracking of HDPE by correlating Jc with slow crack growth. Polym. Eng. Sci. 2018, 58, 1471–1478. [Google Scholar] [CrossRef] [Green Version]
  63. Nguyen, L.K.; Na, S.; Hsuan, Y.G.; Spatari, S. Uncertainty in the life cycle greenhouse gas emissions and costs of HDPE pipe alternatives. Resour. Conserv. Recycl. 2020, 154, 104602. [Google Scholar] [CrossRef]
  64. Nguyen, L.; Hsuan, Y.G.; Spatari, S. Life cycle economic and environmental implications of Prisitne high density polyethylene and alternative materials in drainage pipe applications. J. Polym. Environ. 2017, 25, 925–947. [Google Scholar] [CrossRef]
  65. Aero Aggregates North America. Available online: https://www.aeroaggna.com/ (accessed on 30 May 2022).
  66. National Ready Mixed Concrete Association on Flowable Fill. Available online: https://www.flowablefill.org/ (accessed on 30 May 2022).
Figure 1. Example of single-layer recharge chamber structure installation with cutaway views, showing undisturbed soil, geotextile fabric, backfill material, and plastic box (left view) and arch (right view).
Buildings 12 00867 g001
Figure 2. System diagram for cradle-to-gate LCA of box and arch recharge chambers showing options for plastic and backfill. Boxes represent cradle-to-gate processes and arrows represent material flows.
Buildings 12 00867 g002
Figure 3. Traci 2.1 midpoint impact ranges for box and arch structures per cubic meter of stormwater management show that box structures generally have larger potential midpoint impact than arch structures and that the variability of the plastic structure is significant for both box and arch. The transportation upside strongly hinges on the 300 km (max) transport distance for the backfill material. At 30 km (min) transport distances, the transport of all materials in the inventory is small and comparable to the magnitude of the backfill material, excavation, and geotextile. (Data in Supplementary Materials Table SI-4).
Buildings 12 00867 g003
Figure 4. Traci 2.1 midpoint impact of plastic material and process choice showing the injection-molded polypropylene box having the greatest impact. Diamonds represent the midpoint, and the black bars represent the range.
Buildings 12 00867 g004
Figure 5. Traci 2.1 midpoint impact of backfill material choice showing gravel with higher impact than sand by more than 2:1. Diamonds represent the midpoint, and the black bars represent the range.
Buildings 12 00867 g005
Figure 6. Traci 2.1 midpoint impact of box backfill transportation distance shows the increase in potential impact with additional distance of transport. Diamonds represent the midpoint, and the black bars represent the range. Transport of gravel backfill for the arch yields a similar profile. (Supplementary Materials Figure SI-14).
Buildings 12 00867 g006
Table 1. Inventories for plastic box and arch installations per cubic meter of stormwater storage.
Design TypeLCIMin (kg)Max (kg)Distance (km)GaBi Thinkstep
Dataset
1 (Box,
Polypropylene, Injection-Molded)
Excavation of moist earth19525192 GLO: excavator, 100 kW, construction
Polypropylene
geotextile fabric
0.120.61100–1000RER: polypropylene film (PP)
PlasticsEurope
Backfill material (gravel or sand)160402130–300EU-28: limestone, gravel
or EU28: sand 0/2
Polypropylene injection-molded structure4385100–1000RER: polypropylene injection-molding part
2 (Box,
Recycled
Polypropylene, Injection-Molded)
Excavation of moist earth19525192 GLO: excavator, 100 kW, construction
Polypropylene
geotextile fabric
0.120.61100–1000RER: polypropylene film (PP)
PlasticsEurope
Backfill material (gravel or sand)160402130–300EU-28: limestone, gravel
or EU28: sand 0/2
Recycled
Polypropylene injection-molded structure
4377100–1000RER: polypropylene injection-molding partMinus DE:
polypropylene
granulateplus recycled
regranulated PP 1
3 (Box,
Polypropylene, Extruded)
Excavation of moist earth19525192 GLO: excavator, 100 kW, construction
Polypropylene
geotextile fabric
0.120.61100–1000RER: polypropylene film (PP)
PlasticsEurope
Backfill material (gravel or sand)160402130–300EU-28: limestone, gravel
or EU28: sand 0/2
Polypropylene
extruded structure
4044100–1000DE: polypropylene granulate (PP) mix
and GLO: plastic extrusion profile
4 (Box,
Polypropylene, Injection-Molded + PVC, Extruded)
Excavation of moist earth19525192 GLO: excavator, 100 kW, construction
Polypropylene
geotextile fabric
0.120.61100–1000RER: polypropylene film (PP)
PlasticsEurope
Backfill material (gravel or sand)160402130–300EU-28: limestone, gravel
or EU28: Sand 0/2
Polypropylene injection-molded structure1417100–1000RER: polypropylene injection-molding part
Polyvinylchloride
extruded structure
1923100–1000RER: polyvinylchloride pipe (PVC)
PlasticsEurope
5 (Arch,
Polypropylene, Injection-Molded)
Excavation of moist earth19554623 GLO: excavator, 100 kW, construction
Polypropylene
geotextile fabric
0.420.69100–1000RER: polypropylene film (PP)
PlasticsEurope
Backfill material (gravel)611324930–300EU-28: limestone, gravel
Polypropylene injection-molded structure1137100–1000RER: polypropylene injection-molding part
1 For the recycled polypropylene injection-molded part, the recycled regranulated polypropylene model as described was added to the RER model for a polypropylene injection-molded part instead of the DE model for polypropylene granulate.
Publisher’s Note: MDPI stays neutral with regard to jurisdictional claims in published maps and institutional affiliations.

