
Machine Learning Algorithm for Shear Strength Prediction of Short Links for Steel Buildings


Abstract
:1. Introduction
2. Literature Review
2.1. Analytical Models
2.1.1. AISC 2016
2.1.2. Corte et al., 2013
2.1.3. G. Almasabha 2022
2.2. ML Models
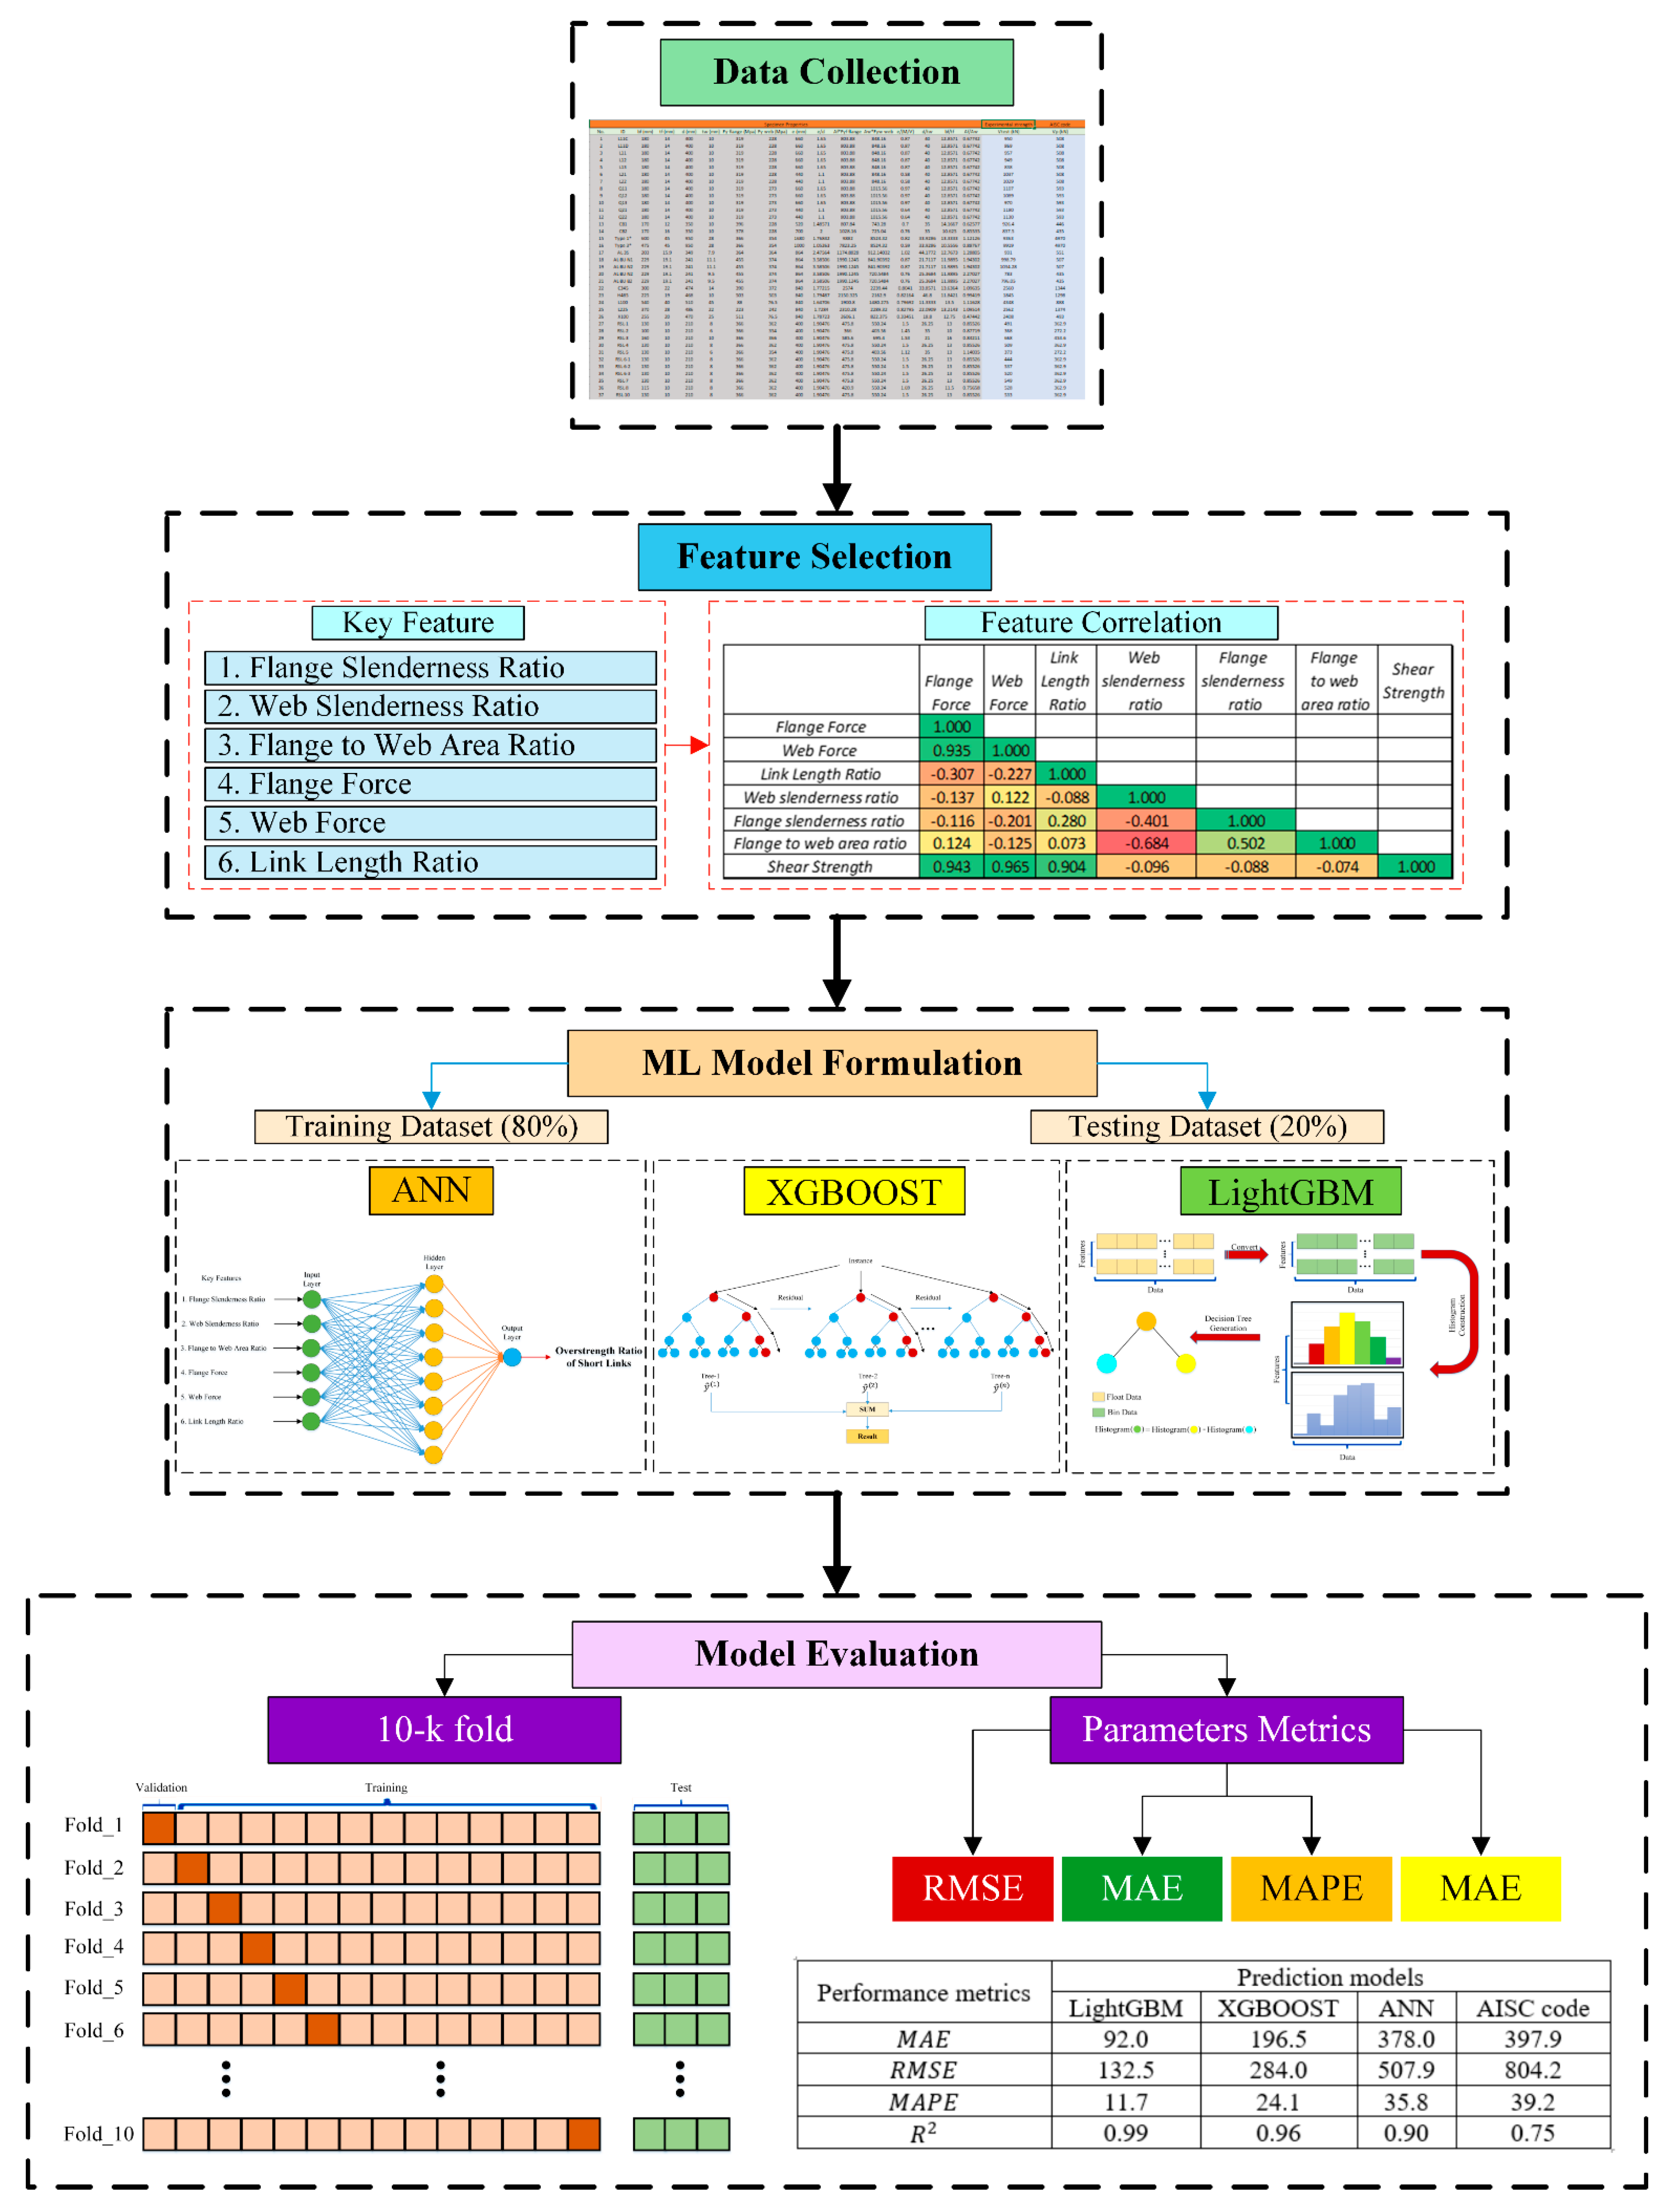
3. Methodology
3.1. Data collection and Feature Definition
3.2. Data Preprocessing
3.3. Algorithm
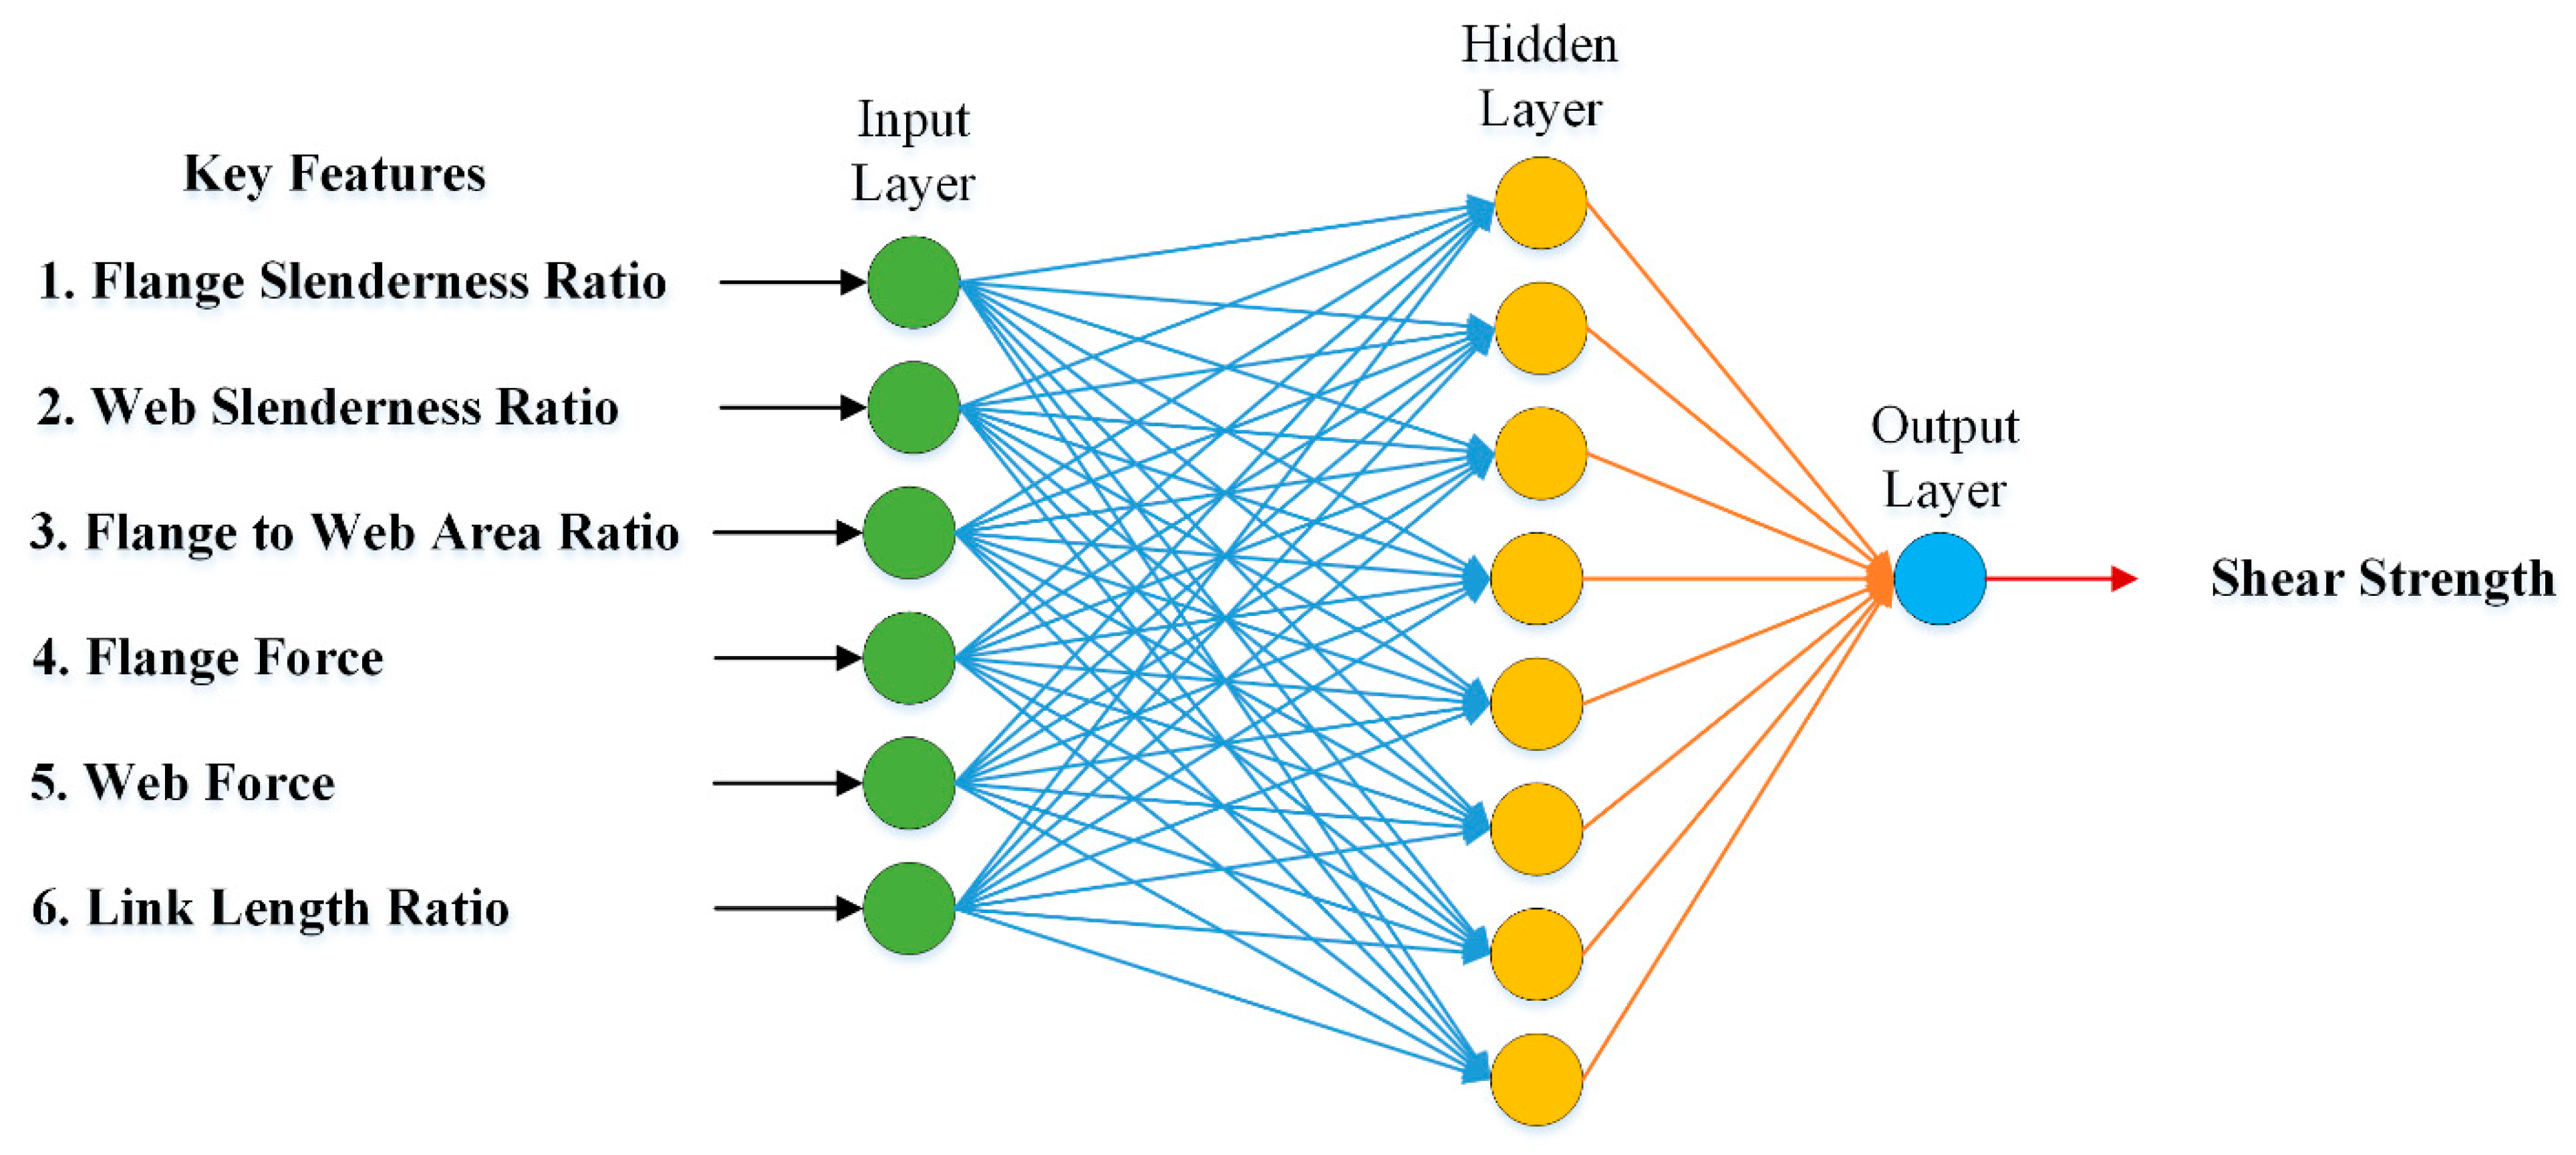
3.3.1. Artificial Neural Network
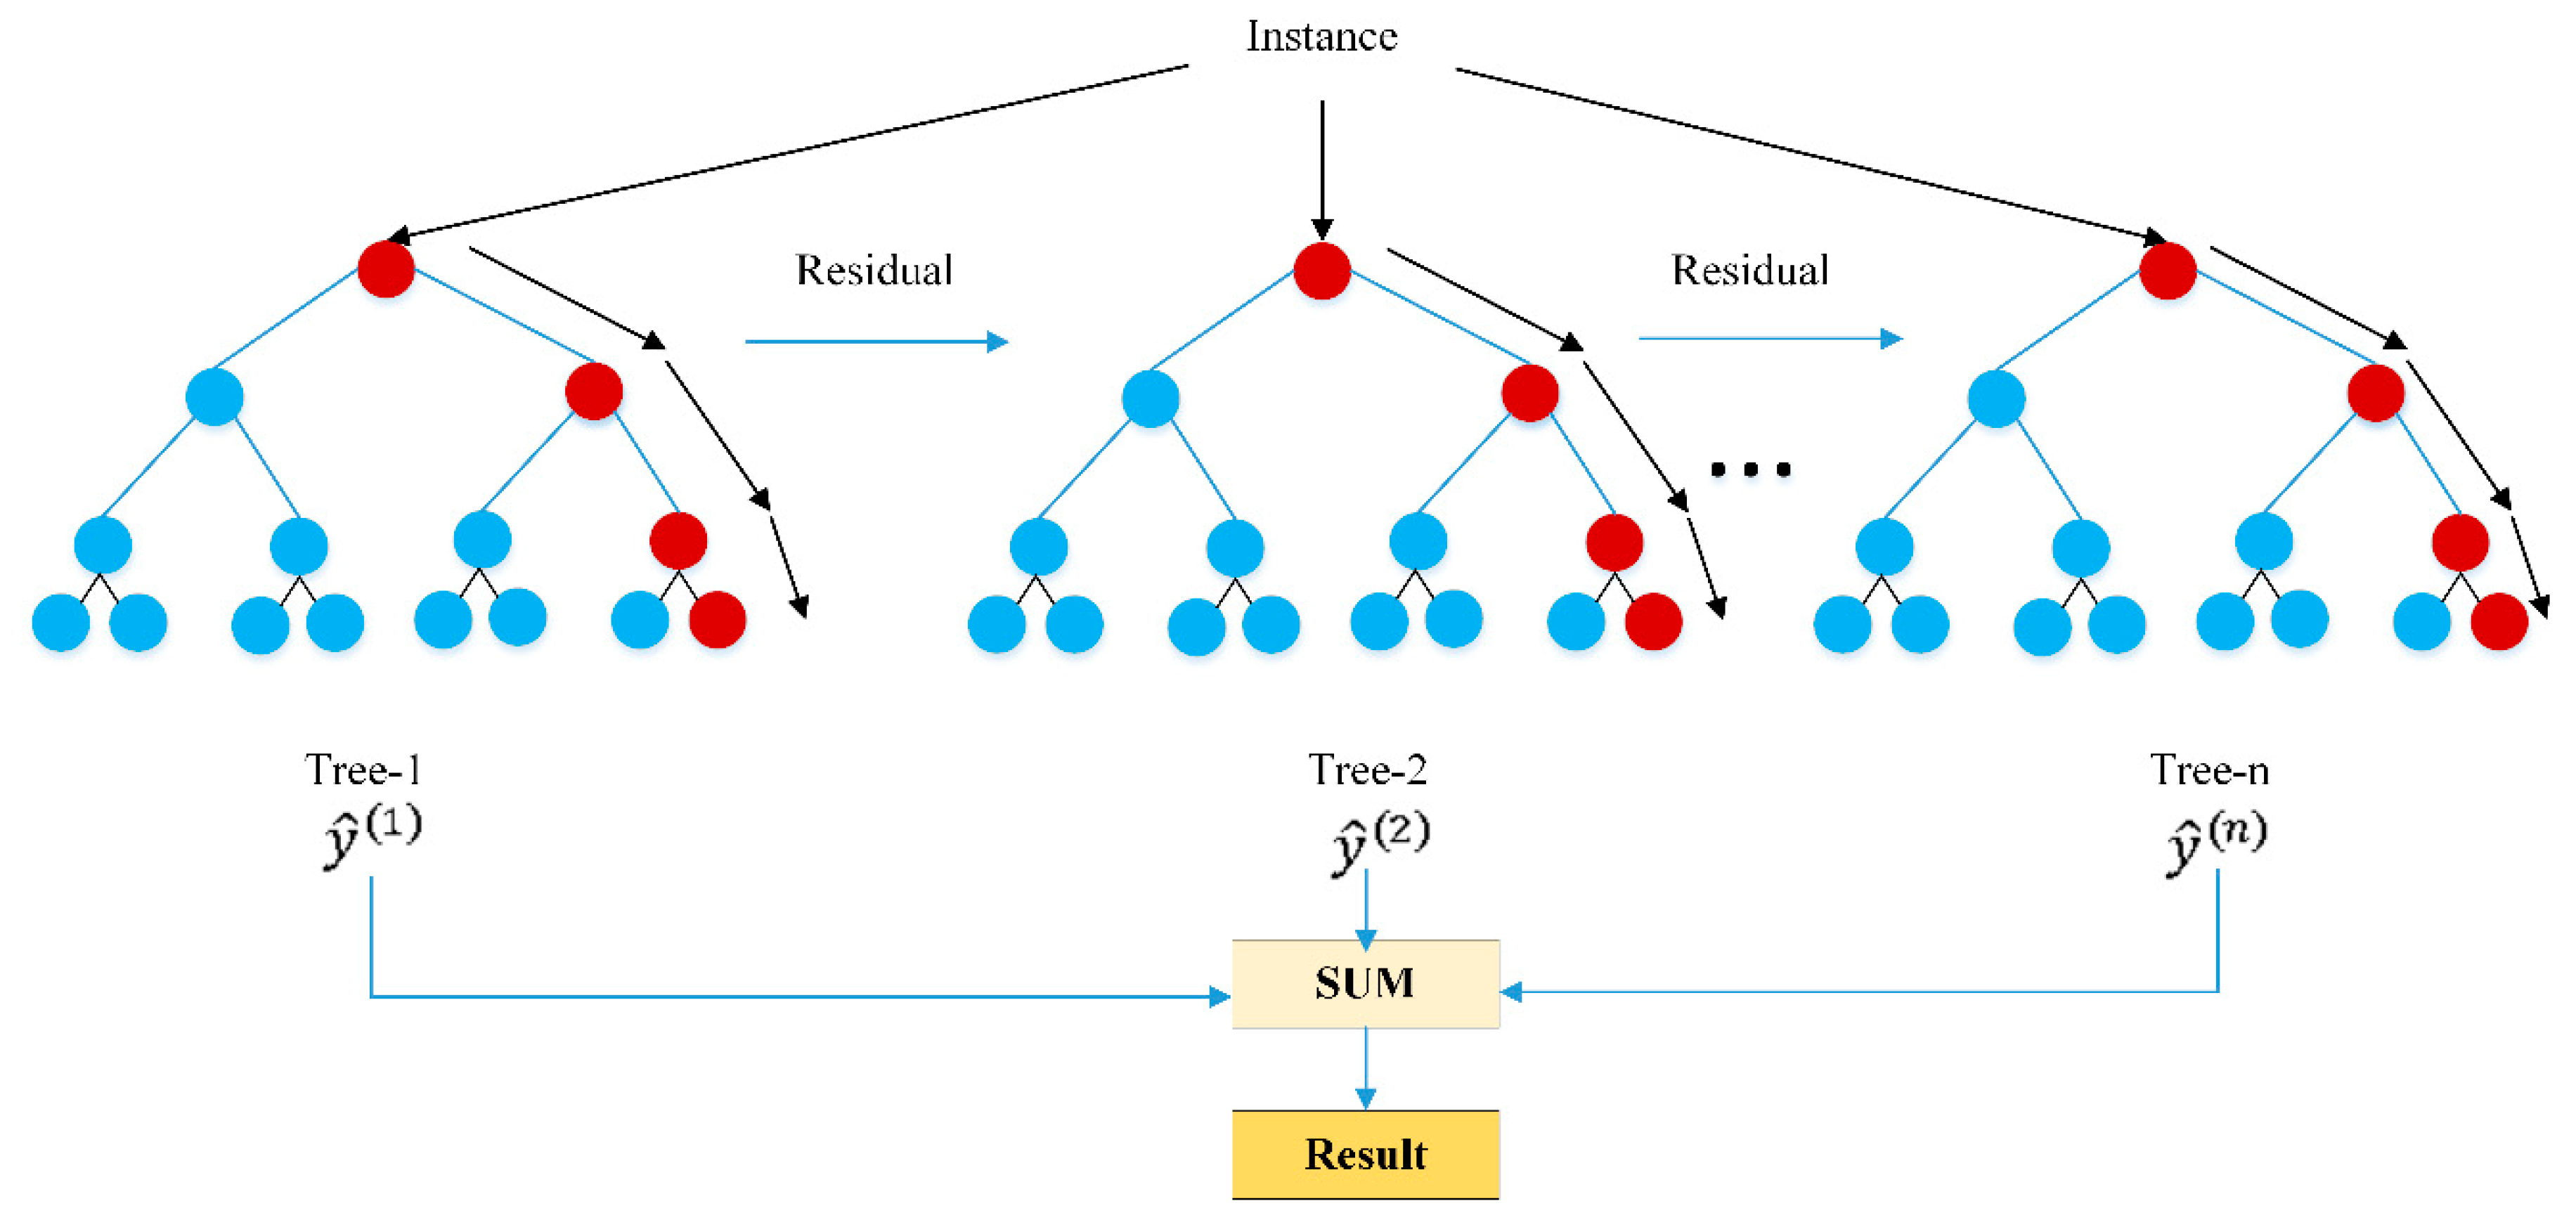
3.3.2. Extreme Gradient Boosting
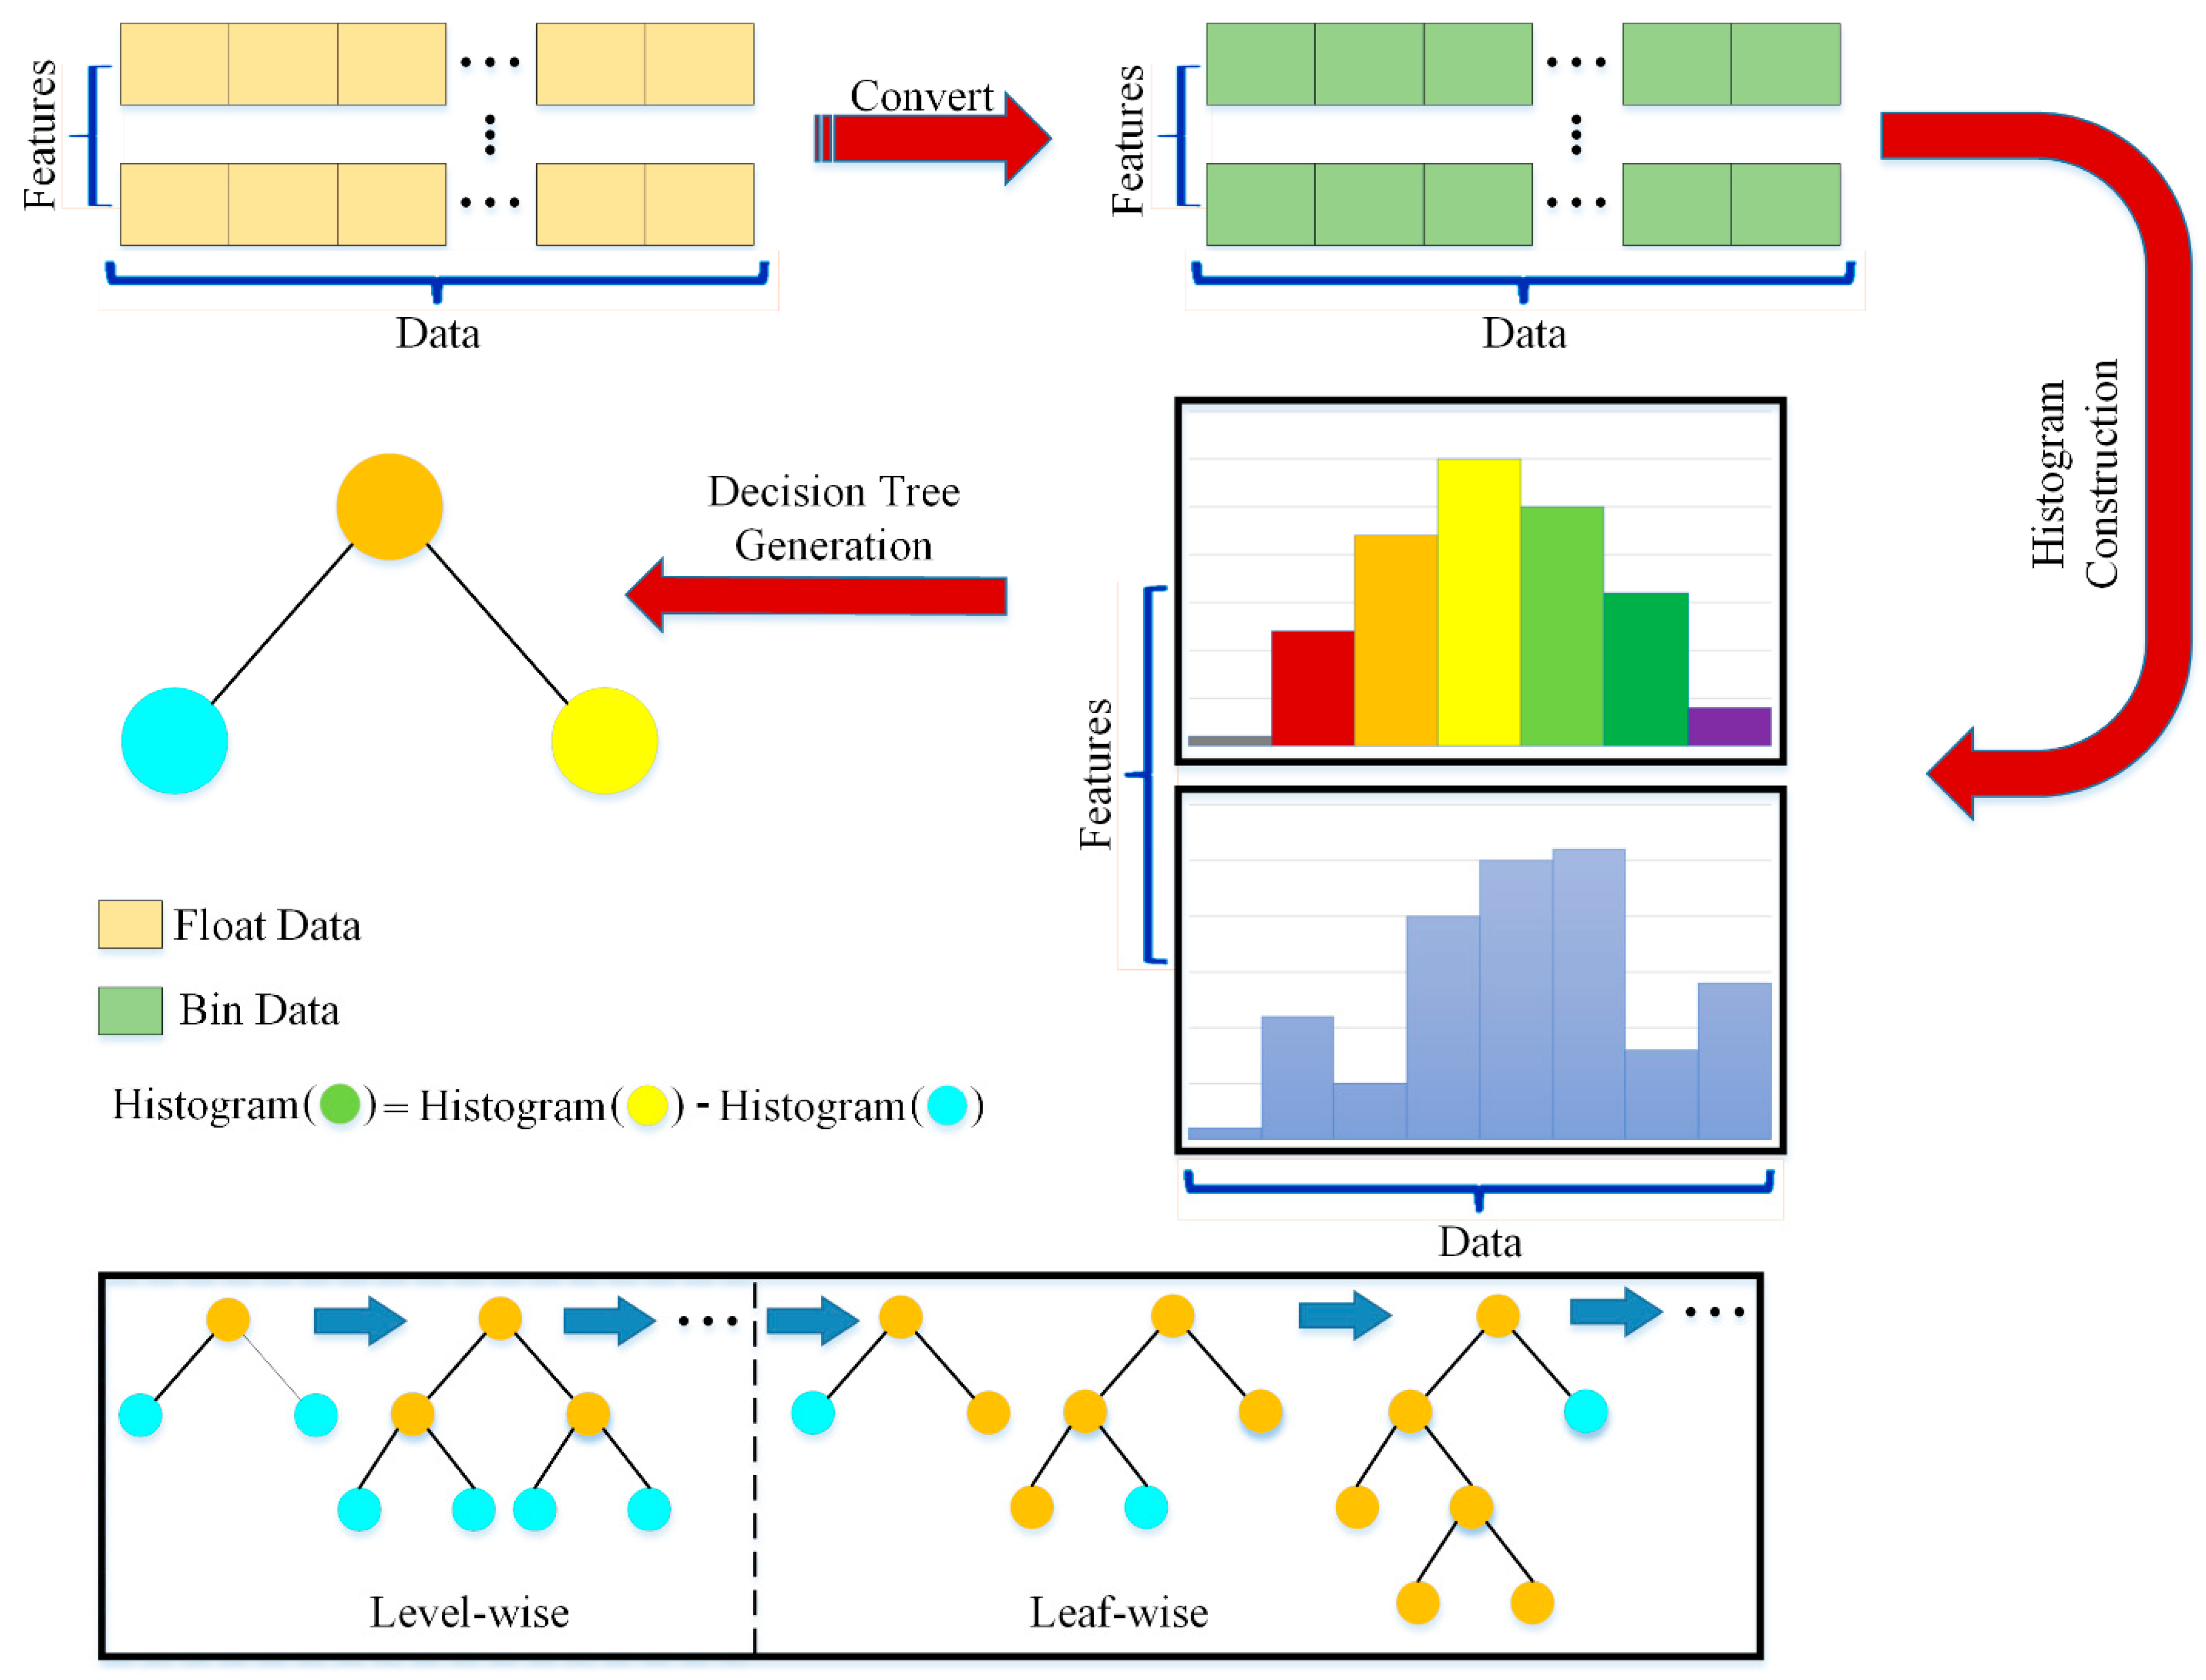
3.3.3. Light Gradient Boosting Machine ()

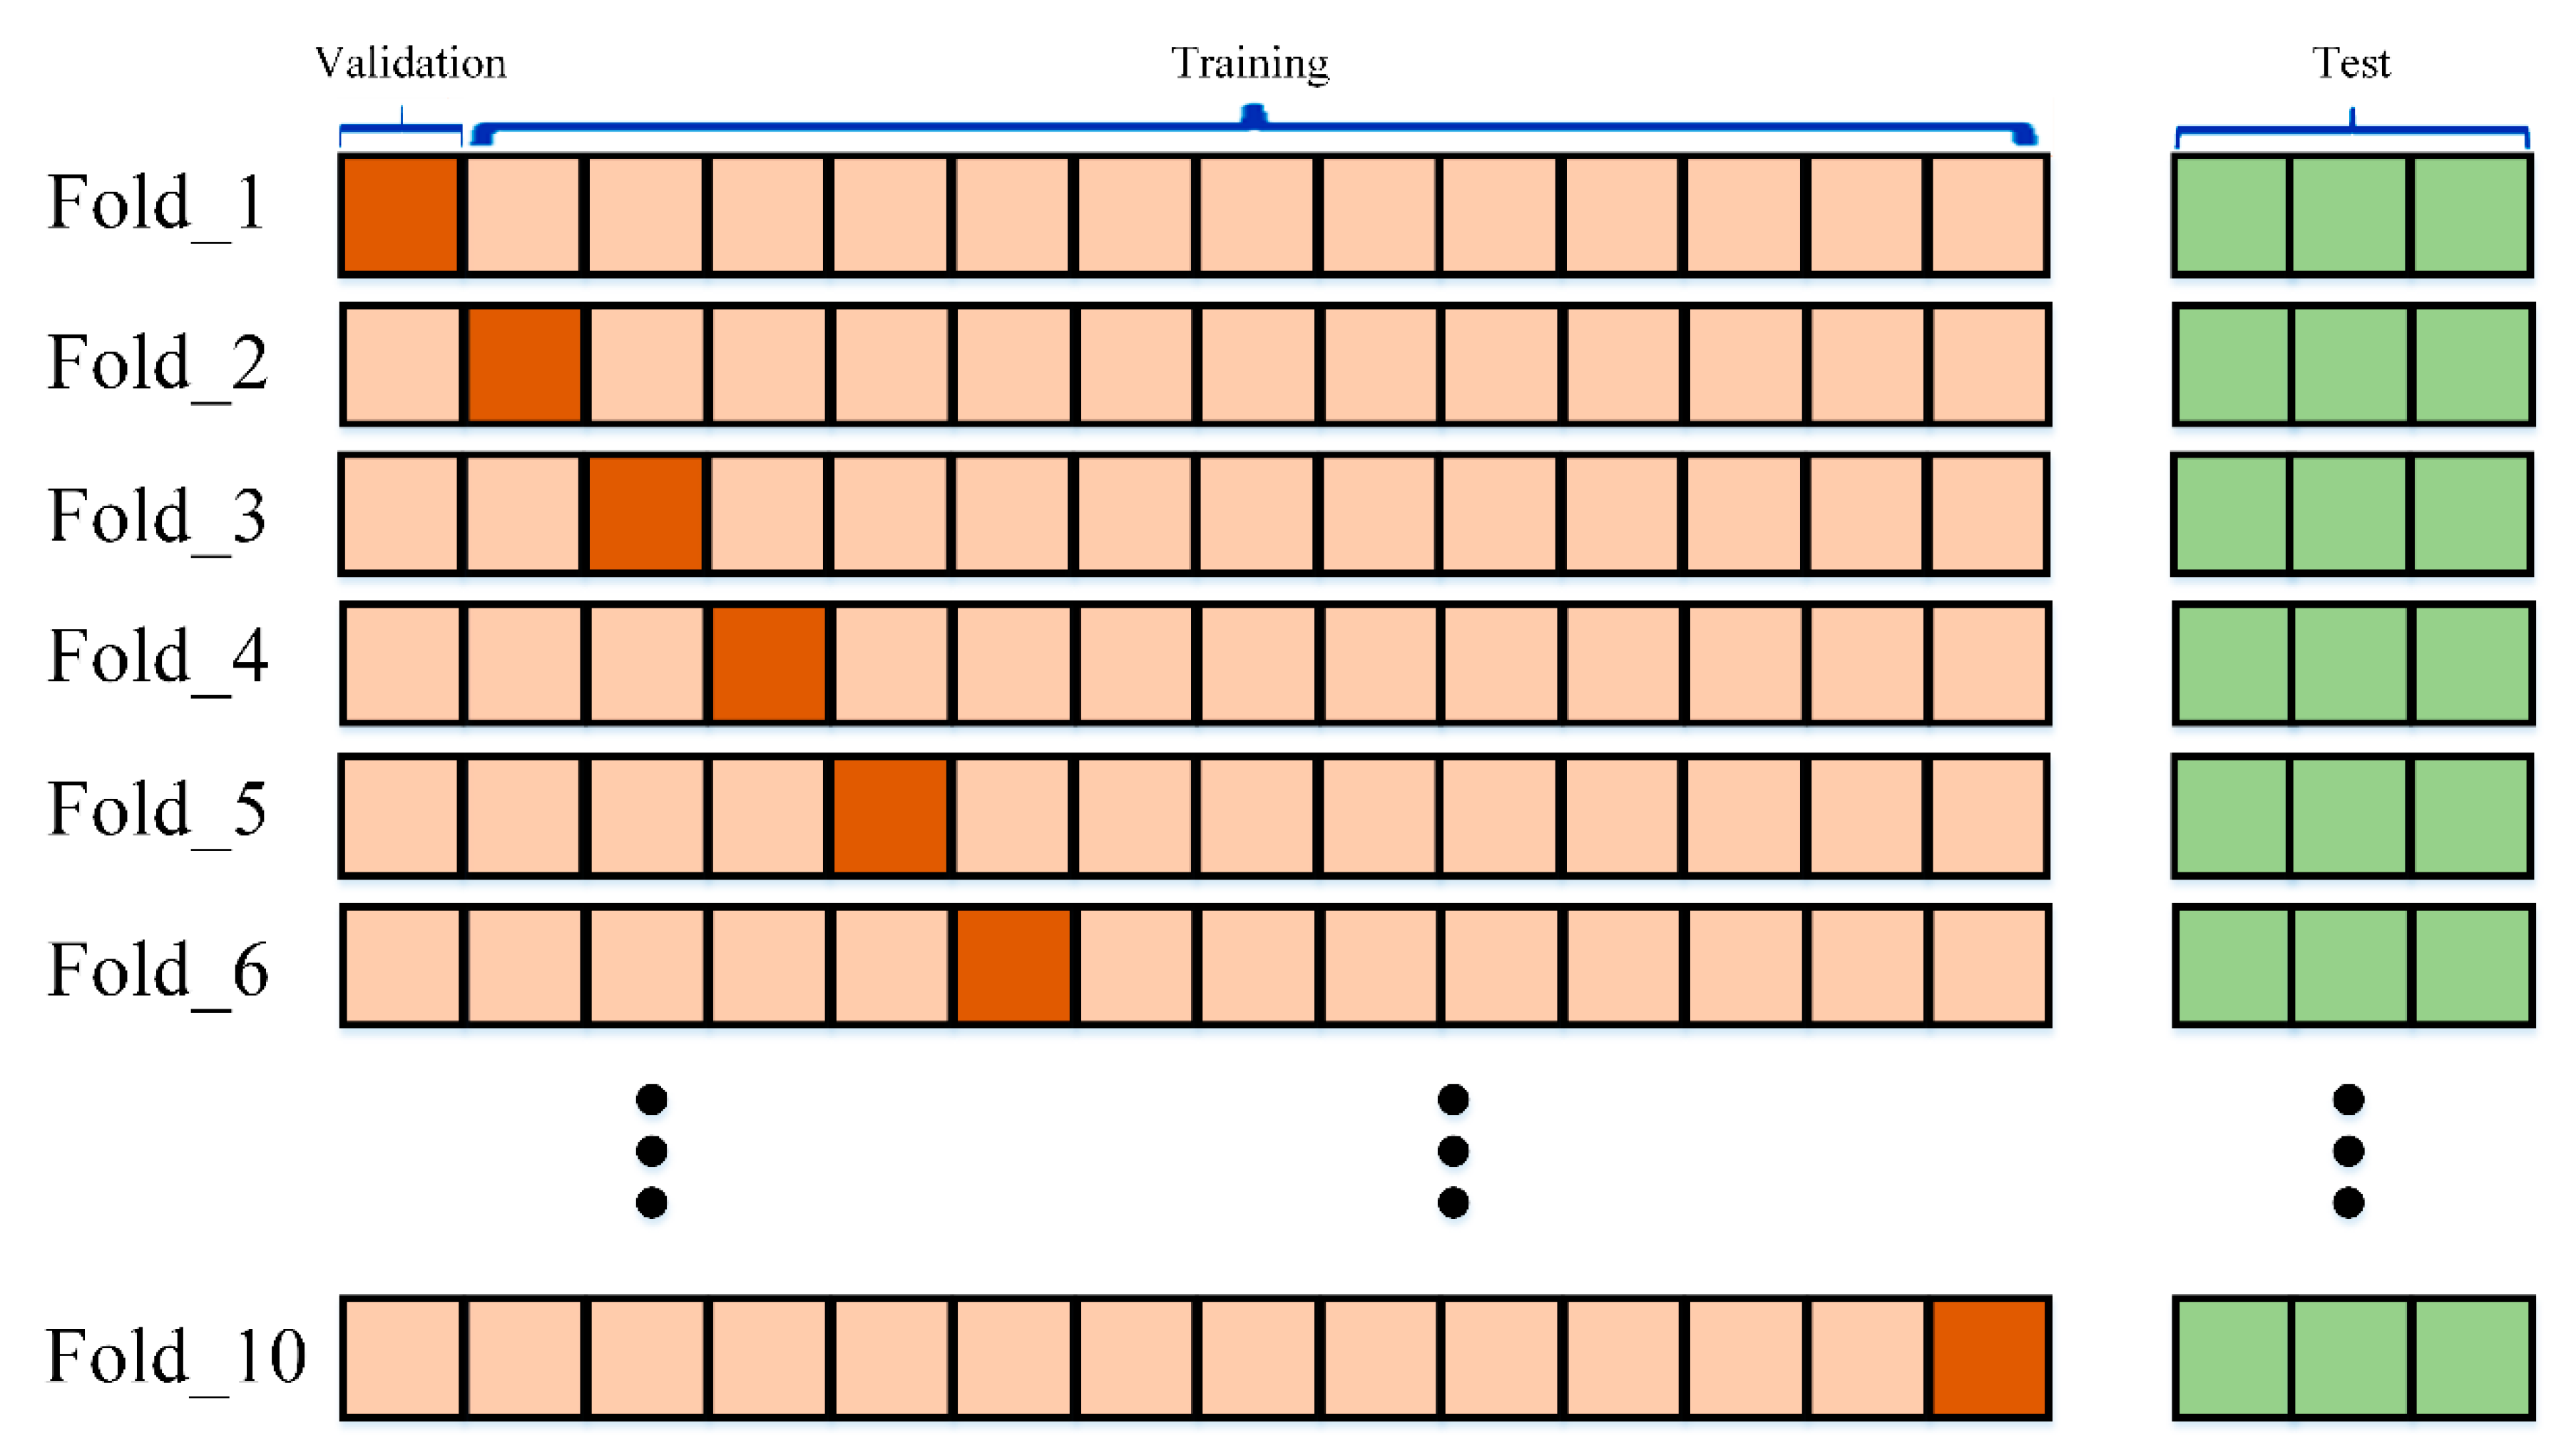
3.4. Stratified K-Fold Cross-Validation
3.5. Prediction Accuracy Measurement
4. Result and Discussion
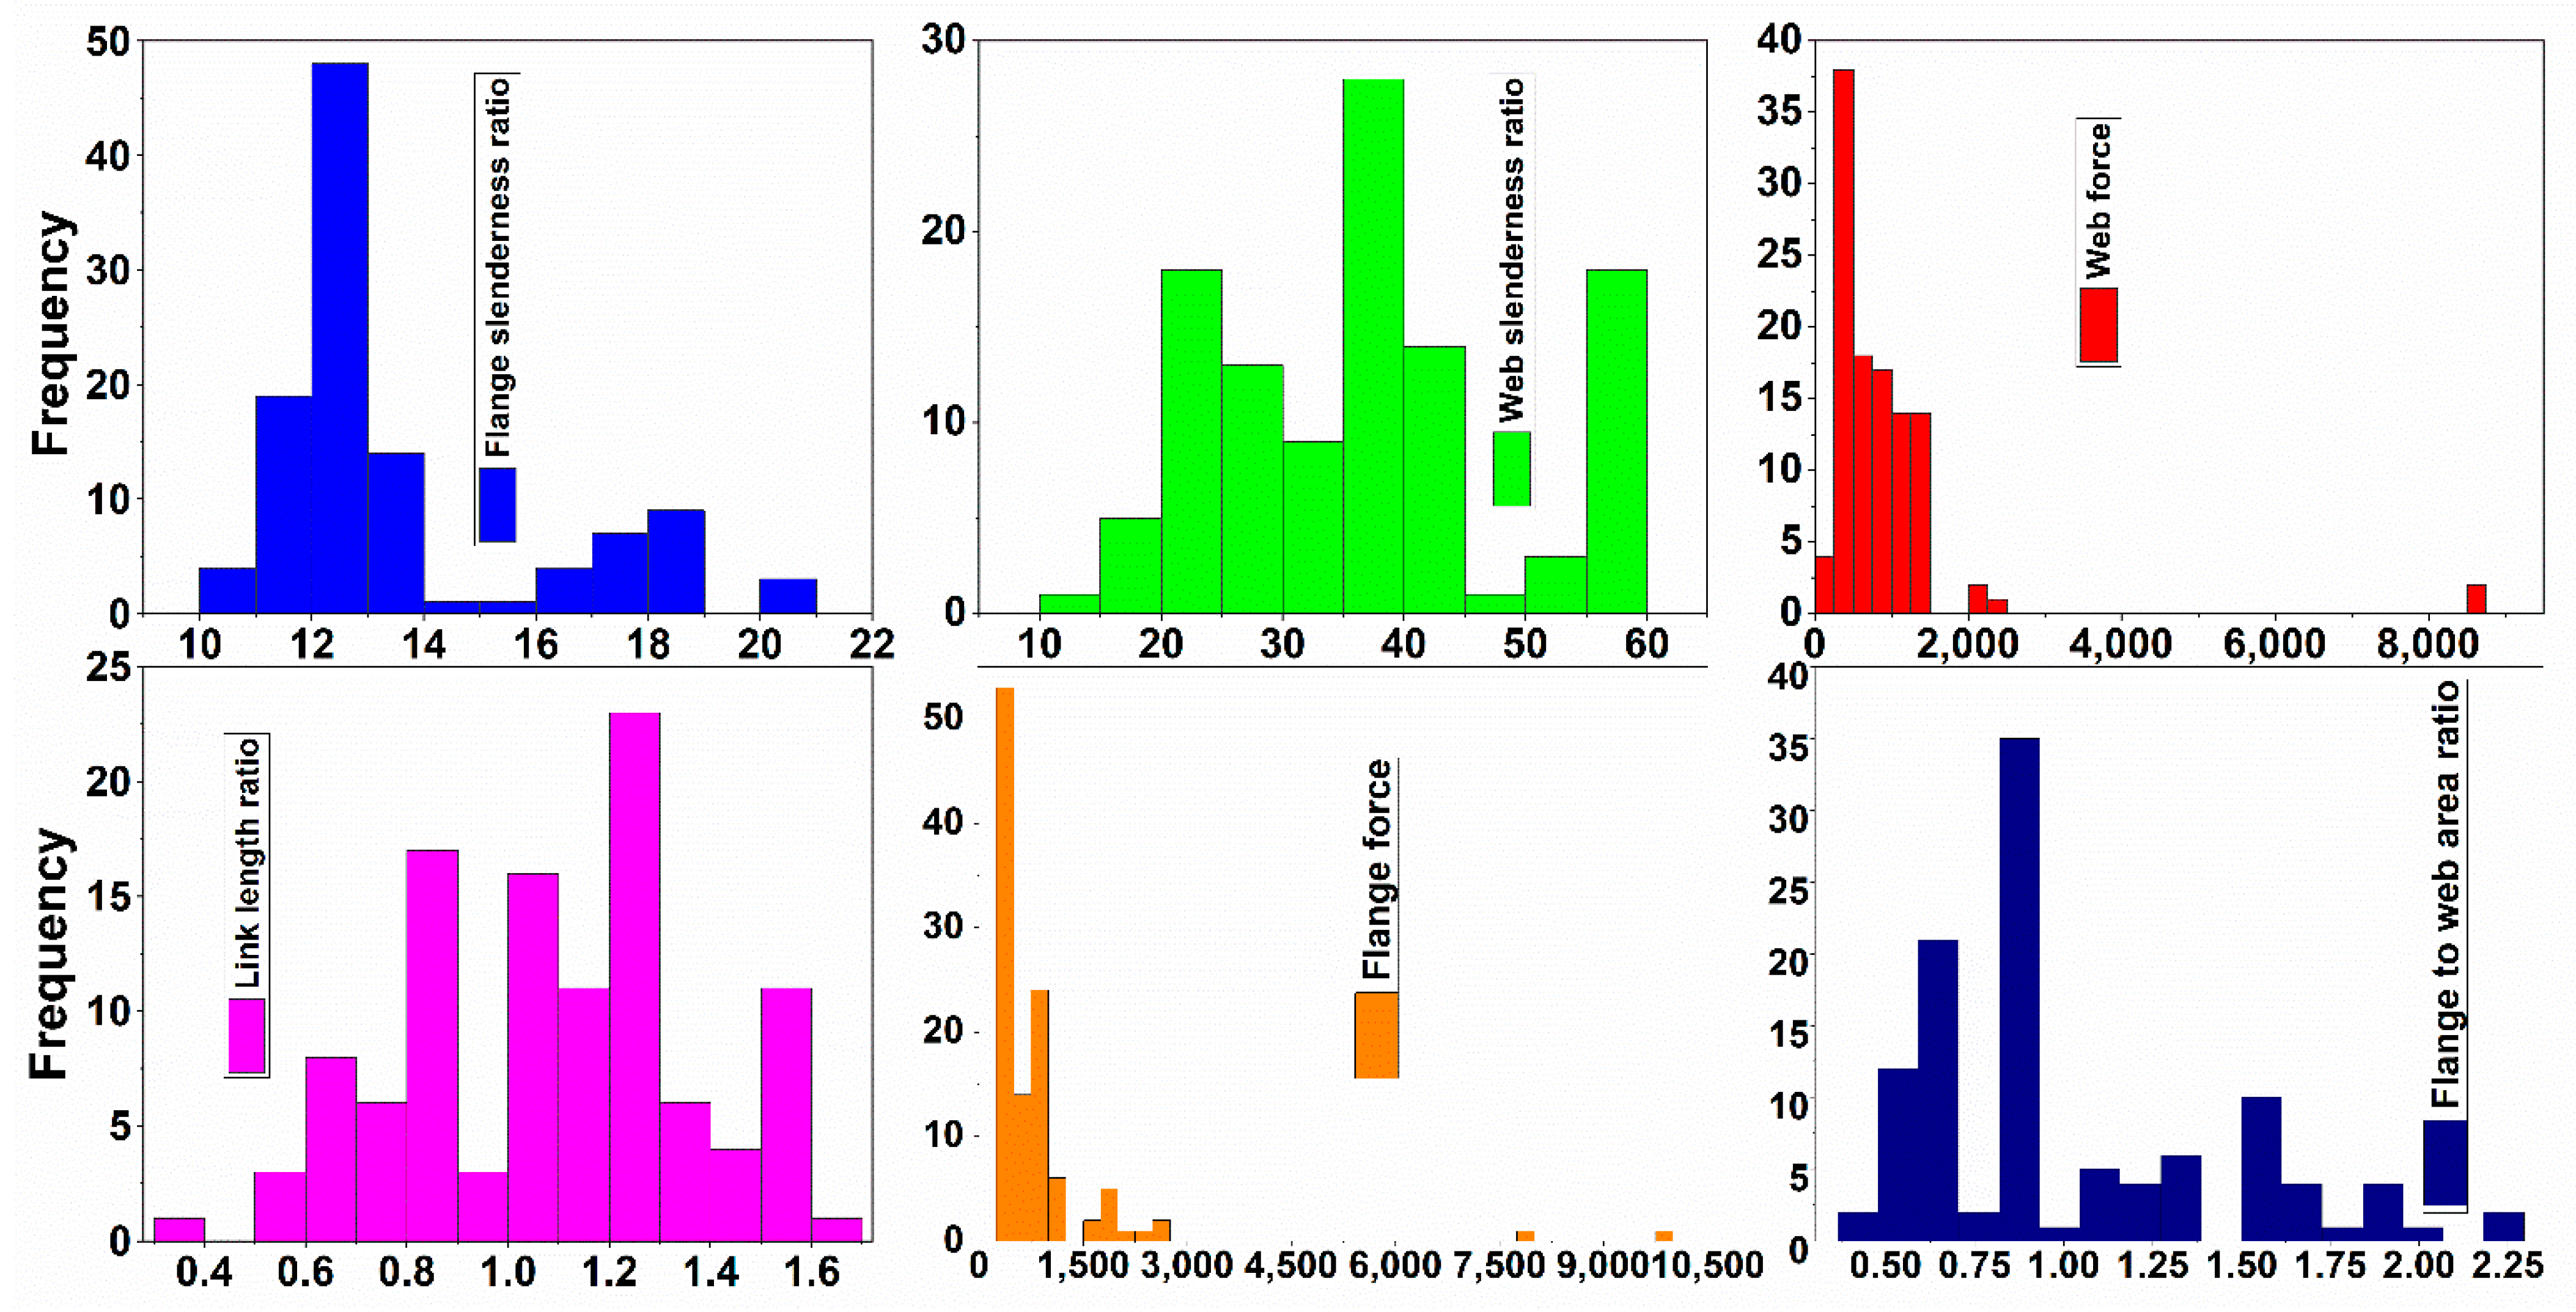
4.1. Descriptive Statistics
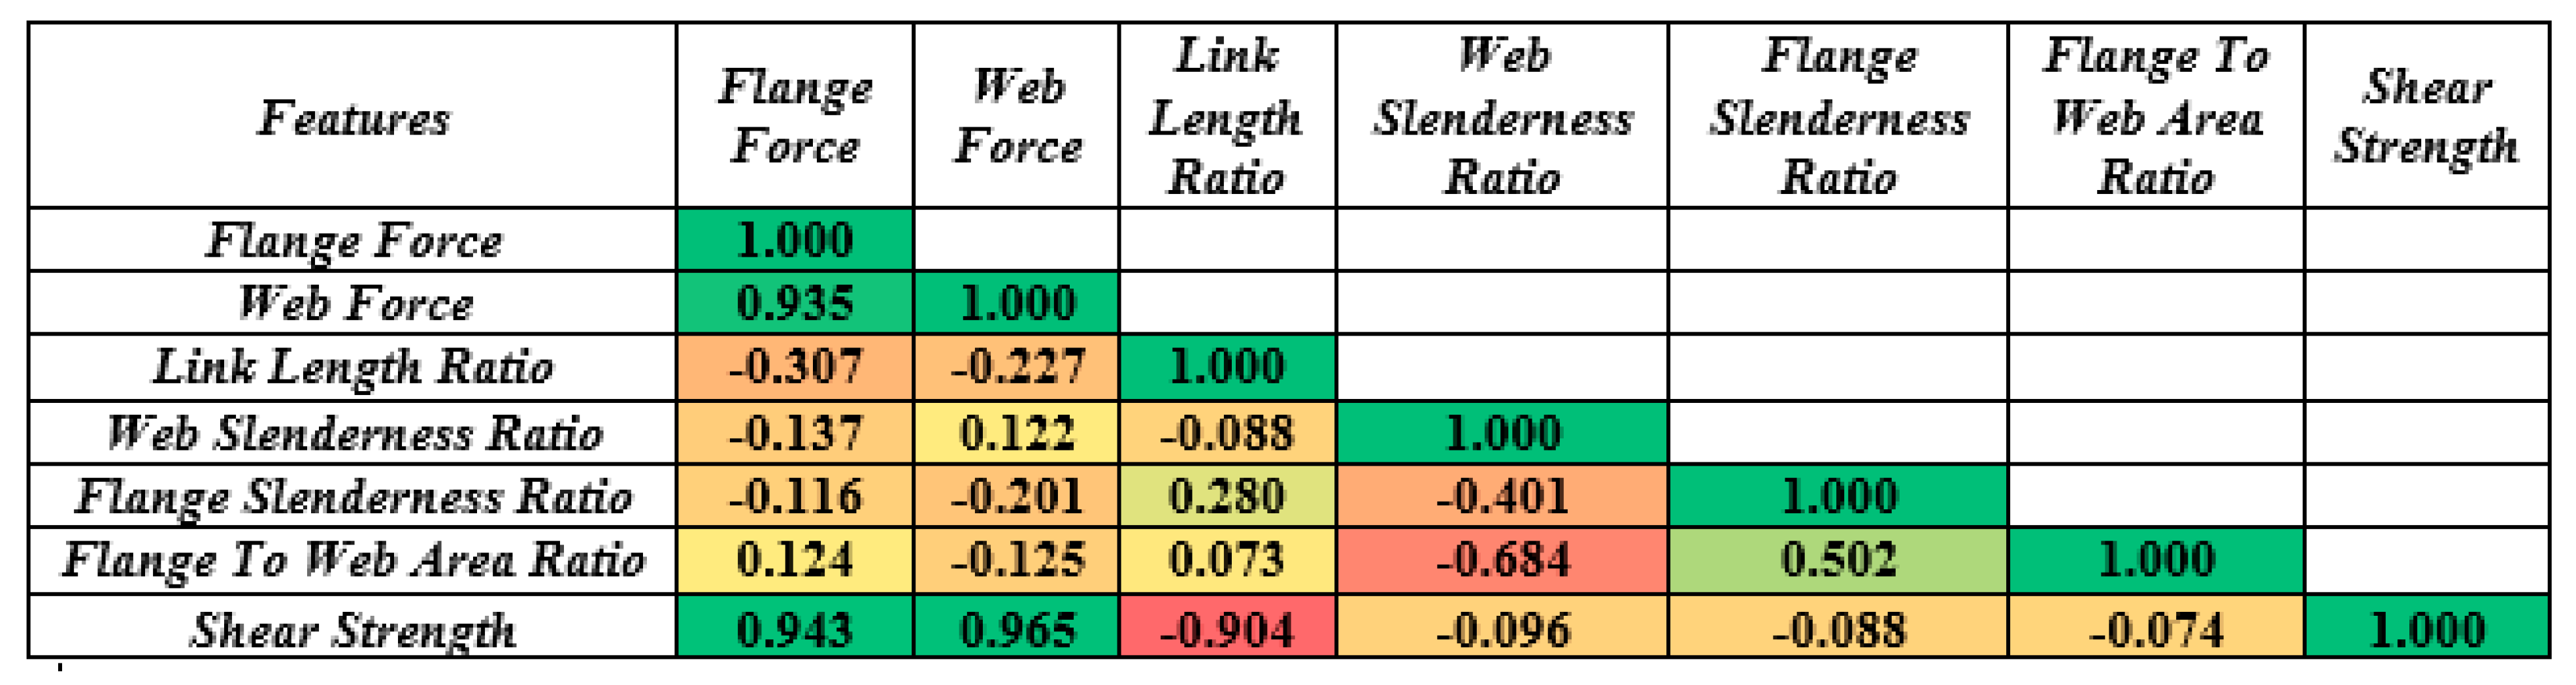
4.2. Correlation Matrix Analysis
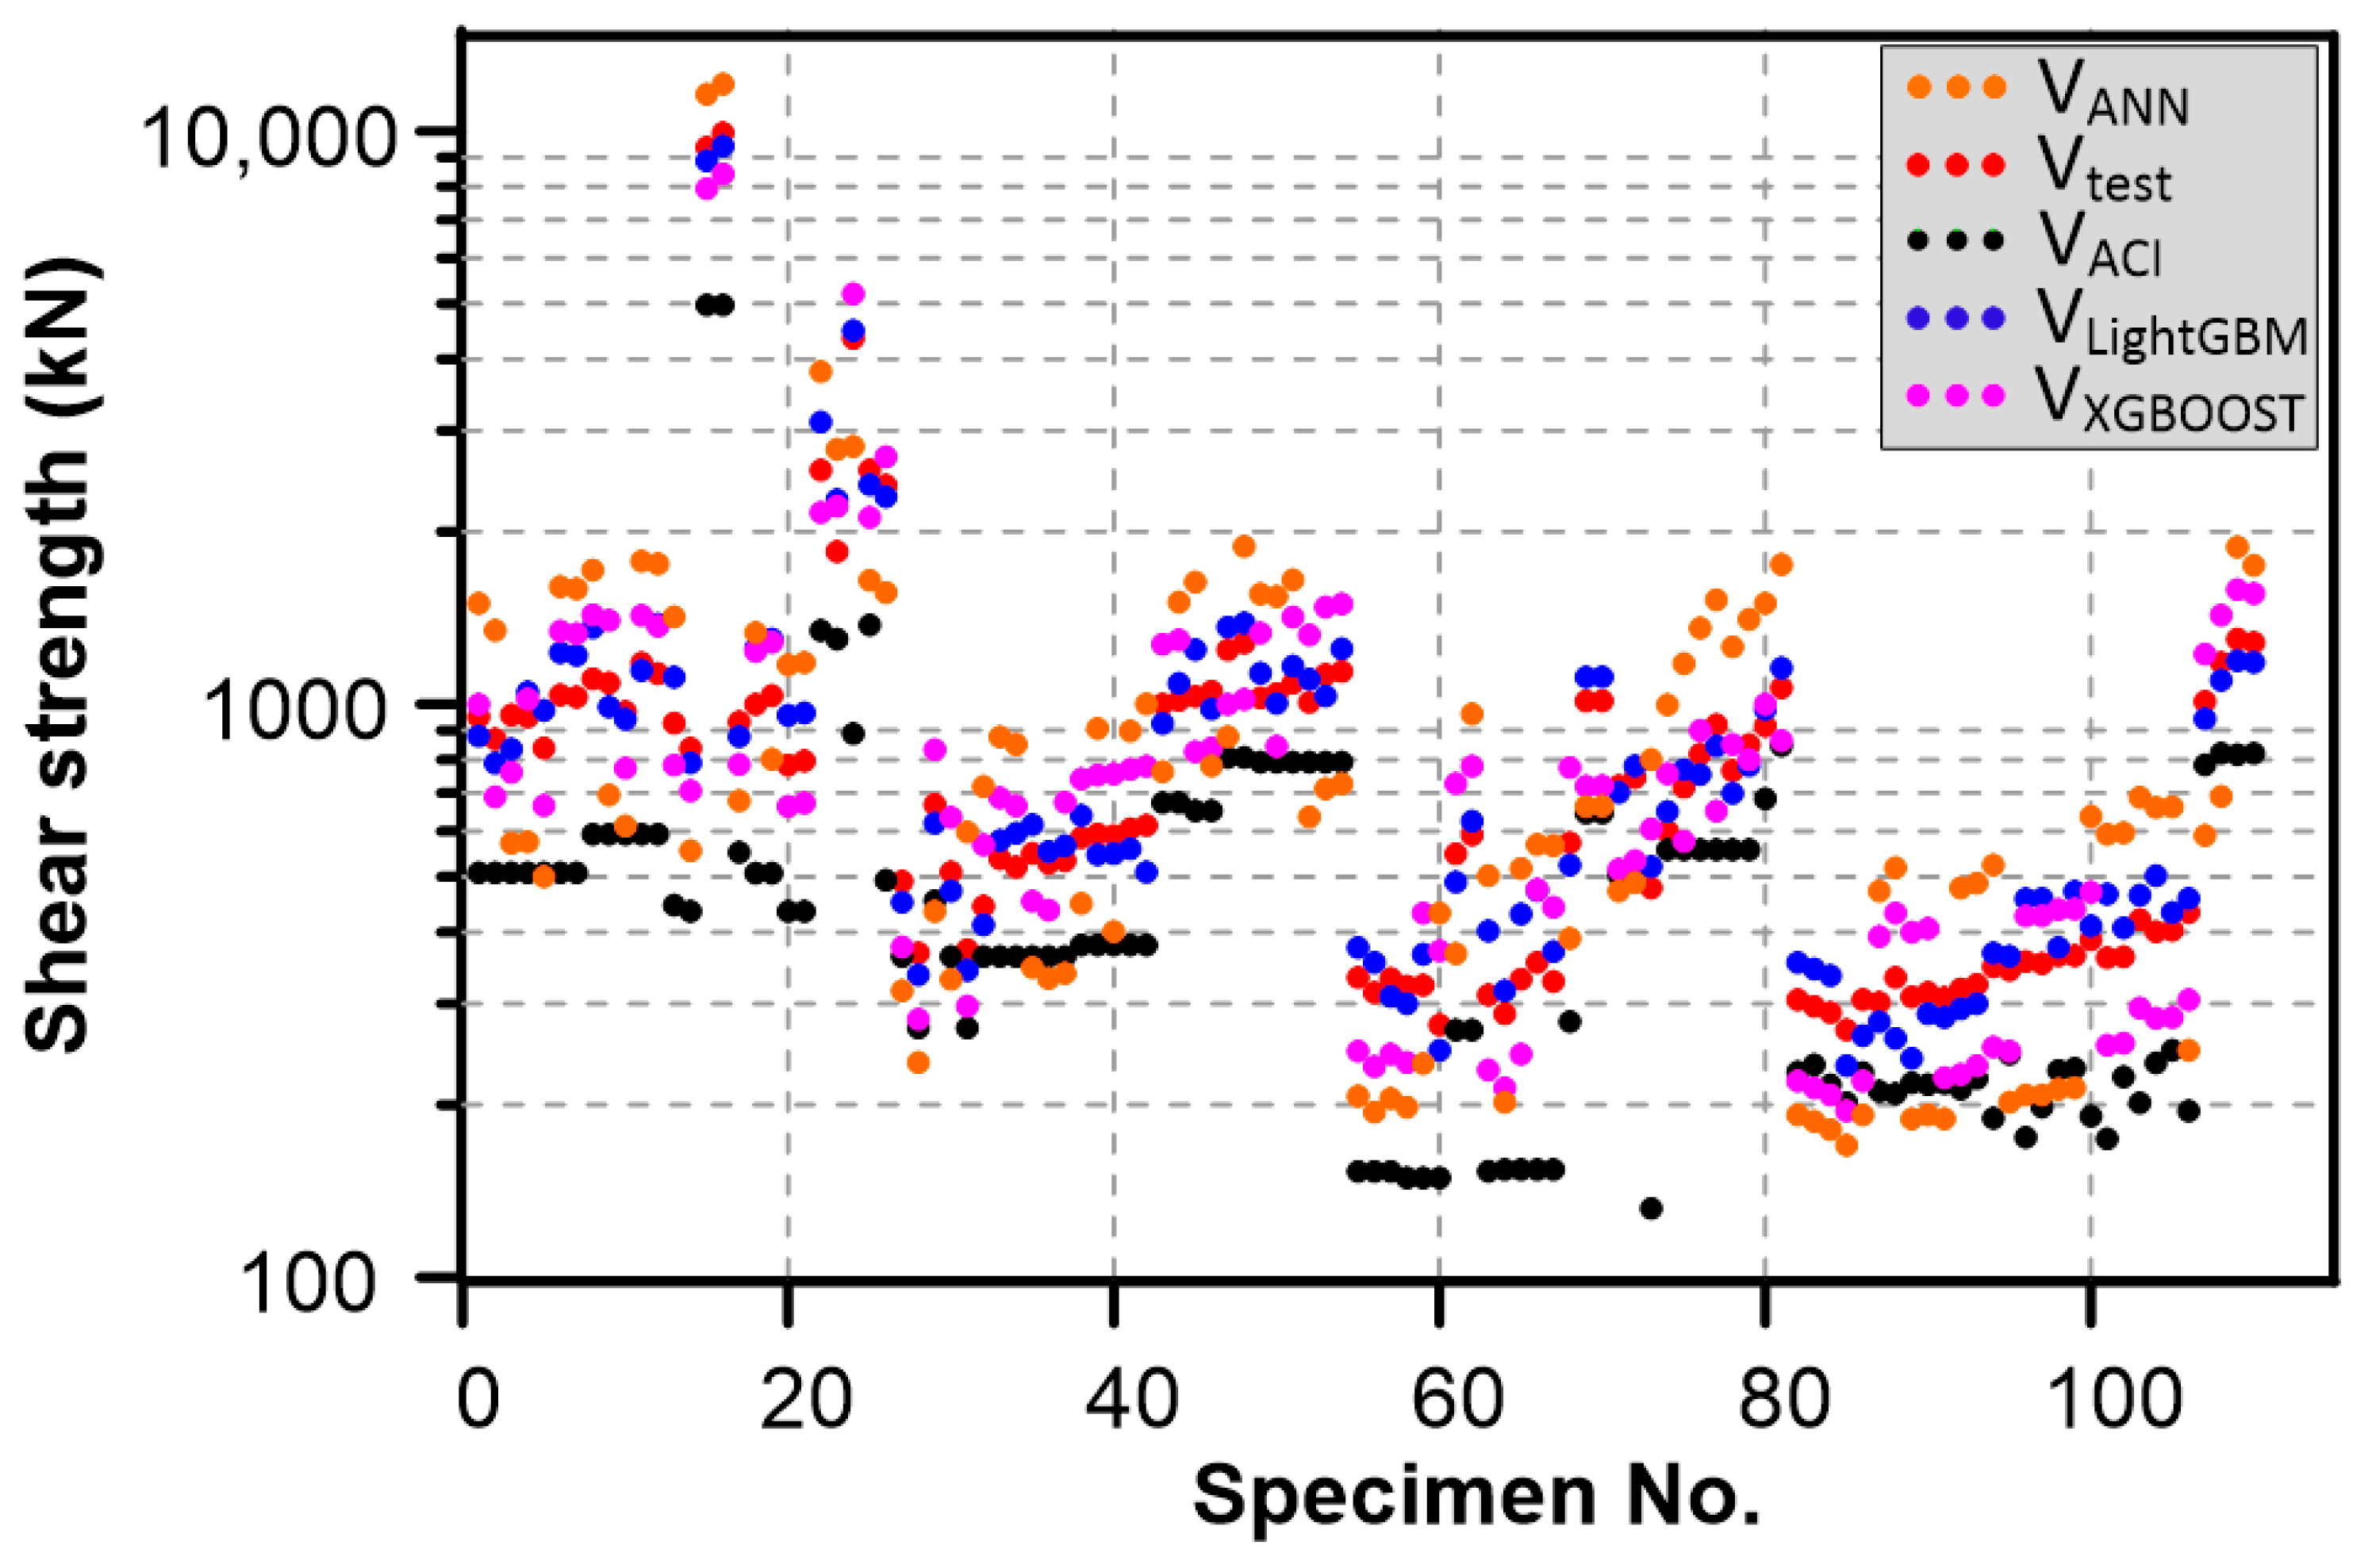
4.3. Performance of ML Algorithms
4.4. Features Importance Analysis
5. Conclusions
Author Contributions
Funding
Acknowledgments
Conflicts of Interest
References
- AISC. Seismic Provisions for Structural Steel Building; ANSI/AISC 341-16; AISC: Chicago, IL, USA, 2016. [Google Scholar]
- Engelhardt, M.D.; Popov, E.P. Experimental Performance of Long Links in Eccentrically Braced Frames. J. Struct. Eng. 1992, 118, 3067–3088. [Google Scholar] [CrossRef]
- Ji, X.; Wang, Y.; Ma, Q.; Okazaki, T. Cyclic Behavior of Very Short Steel Shear Links. J. Struct. Eng. 2015, 142, 04015114. [Google Scholar] [CrossRef]
- Liu, X.-G.; Fan, J.-S.; Liu, Y.-F.; Yue, Q.-R.; Nie, J.-G. Experimental research of replaceable Q345GJ steel shear links considering cyclic buckling and plastic overstrength. J. Constr. Steel Res. 2017, 134, 160–179. [Google Scholar] [CrossRef]
- McDaniel, C.C.; Uang, C.-M.; Seible, F. Cyclic Testing of Built-Up Steel Shear Links for the New Bay Bridge. J. Struct. Eng. 2003, 129, 801–809. [Google Scholar] [CrossRef]
- Okazaki, T.; Arce, G.; Ryu, H.-C.; Engelhardt, M.D. Experimental Study of Local Buckling, Overstrength, and Fracture of Links in Eccentrically Braced Frames. J. Struct. Eng. 2005, 131, 1526–1535. [Google Scholar] [CrossRef]
- Okazaki, T. Seismic Performance of Link-To Column Connections in Steel Eccentrically Braced Frames; The University of Texas at Austin: Austin, TX, USA, 2004. [Google Scholar]
- Dusicka, P.; Itani, A.M.; Buckle, I.G. Cyclic Behavior of Shear Links of Various Grades of Plate Steel. J. Struct. Eng. 2010, 136, 370–378. [Google Scholar] [CrossRef]
- AISC. Seismic Provisions for Structural Steel Buildings; ANSI/AISC 341-02; AISC: Chicago, IL, USA, 2002. [Google Scholar]
- AISC. Specification for Structural Steel Buildings; ANSI/AISC 360-10; AISC: Chicago, IL, USA, 2010. [Google Scholar]
- Ji, X.; Wang, Y.; Ma, Q.; Okazaki, T. Cyclic Behavior of Replaceable Steel Coupling Beams. J. Struct. Eng. 2016, 143, 04016169. [Google Scholar] [CrossRef]
- Bozkurt, M.B.; Topkaya, C. Replaceable links with direct brace attachments for eccentrically braced frames: Replaceable Links with Direct Brace Attachments for EBF. Earthq. Eng. Struct. Dyn. 2017, 46, 2121–2139. [Google Scholar] [CrossRef]
- Bozkurt, M.B.; Kazemzadeh Azad, S.; Topkaya, C. Development of detachable replaceable links for eccentrically braced frames. Earthq. Eng. Struct. Dyn. 2019, 48, 1134–1155. [Google Scholar] [CrossRef]
- Chao, S.-H.; Khandelwal, K.; El-Tawil, S. Ductile Web Fracture Initiation in Steel Shear Links. J. Struct. Eng. 2006, 132, 1192–1200. [Google Scholar] [CrossRef]
- Della Corte, G.; D’Aniello, M.; Landolfo, R. Analytical and numerical study of plastic overstrength of shear links. J. Constr. Steel Res. 2013, 82, 19–32. [Google Scholar] [CrossRef]
- Hong, J.-K.; Uang, C.-M.; Okazaki, T.; Engelhardt, M.D. Link-to-Column Connection with Supplemental Web Doublers in Eccentrically Braced Frames. J. Struct. Eng. 2015, 141, 04014200. [Google Scholar] [CrossRef]
- Hu, S.; Xiong, J.; Zhou, Q.; Lin, Z. Analytical and Numerical Investigation of Overstrength Factors for Very Short Shear Links in EBFs. KSCE J. Civ. Eng. 2018, 22, 4473–4482. [Google Scholar] [CrossRef]
- Liu, X.-G.; Fan, J.-S.; Liu, Y.-F.; Zheng, M.-Z.; Nie, J.-G. Theoretical research into cyclic web buckling and plastic overstrength of shear links. Thin Walled Struct. 2020, 152, 106644. [Google Scholar] [CrossRef]
- Ohsaki, M.; Nakajima, T. Optimization of link member of eccentrically braced frames for maximum energy dissipation. J. Constr. Steel Res. 2012, 75, 38–44. [Google Scholar] [CrossRef] [Green Version]
- Yin, W.-H.; Sun, F.-F.; Jin, H.-J.; Hu, D.-Z. Experimental and analytical study on plastic overstrength of shear links covering the full range of length ratio. Eng. Struct. 2020, 220, 110961. [Google Scholar] [CrossRef]
- Song, H.; Ahmad, A.; Farooq, F.; Ostrowski, K.A.; Maslak, M.; Czarnecki, S.; Aslam, F. Predicting the compressive strength of concrete with fly ash admixture using machine learning algorithms. Constr. Build. Mater. 2021, 308, 125021. [Google Scholar] [CrossRef]
- Tarawneh, A.; Almasabha, G.; Murad, Y. ColumnsNet: Neural Network Model for Constructing Interaction Diagrams and Slenderness Limit for FRP-RC Columns. J. Struct. Eng. 2022, 148, 04022089. [Google Scholar] [CrossRef]
- Saleh, E.; Tarawneh, A.; Naser, M.; Abedi, M.; Almasabha, G. You only design once (YODO): Gaussian Process-Batch Bayesian optimization framework for mixture design of ultra high performance concrete. Constr. Build. Mater. 2022, 330, 127270. [Google Scholar] [CrossRef]
- Almasabha, G.; Tarawneh, A.; Saleh, E.; Alajarmeh, O. Data-Driven Flexural Stiffness Model of FRP-Reinforced Concrete Slender Columns. J. Compos. Constr. 2022, 26, 04022024. [Google Scholar] [CrossRef]
- Tarawneh, A.; Almasabha, G.; Alawadi, R.; Tarawneh, M. Innovative and Reliable Model for Shear Strength of Steel Fibers Reinforced Concrete Beams. Structures 2021, 32, 1015–1025. [Google Scholar] [CrossRef]
- Alshboul, O.; Alzubaidi, M.A.; Mamlook, R.E.A.; Almasabha, G.; Almuflih, A.S.; Shehadeh, A. Forecasting Liquidated Damages via Machine Learning-Based Modified Regression Models for Highway Construction Projects. Sustainability 2022, 14, 5835. [Google Scholar] [CrossRef]
- Alshboul, O.; Shehadeh, A.; Tatari, O.; Almasabha, G.; Saleh, E. Multiobjective and multivariable optimization for earthmoving equipment. J. Facil. Manag. 2022. [Google Scholar] [CrossRef]
- Shehadeh, A.; Alshboul, O.; Tatari, O.; Alzubaidi, M.A.; Hamed El-Sayed Salama, A. Selection of heavy machinery for earthwork activities: A multi-objective optimization approach using a genetic algorithm. Alex. Eng. J. 2022, 61, 7555–7569. [Google Scholar] [CrossRef]
- Alshboul, O.; Shehadeh, A.; Hamedat, O. Development of integrated asset management model for highway facilities based on risk evaluation. Int. J. Constr. Manag. 2021, 1–10. [Google Scholar] [CrossRef]
- Shehadeh, A.; Alshboul, O.; Hamedat, O. A Gaussian mixture model evaluation of construction companies’ business acceptance capabilities in performing construction and maintenance activities during COVID-19 pandemic. Int. J. Manag. Sci. Eng. Manag. 2022, 17, 112–122. [Google Scholar] [CrossRef]
- Alshboul, O.; Shehadeh, A.; Hamedat, O. Governmental Investment Impacts on the Construction Sector Considering the Liquidity Trap. J. Manag. Eng. 2022, 38, 04021099. [Google Scholar] [CrossRef]
- Shehadeh, A.; Alshboul, O.; Hamedat, O. Risk Assessment Model for Optimal Gain-Pain Share Ratio in Target Cost Contract for Construction Projects. J. Constr. Eng. Manag. 2022, 148, 04021197. [Google Scholar] [CrossRef]
- Alshboul, O.; Shehadeh, A.; Almasabha, G.; Almuflih, A.S. Extreme Gradient Boosting-Based Machine Learning Approach for Green Building Cost Prediction. Sustainability 2022, 14, 6651. [Google Scholar] [CrossRef]
- Almasabha, G. Gene expression model to estimate the overstrength ratio of short links. Structures 2022, 37, 528–535. [Google Scholar] [CrossRef]
- Alshboul, O.; Shehadeh, A.; Al-Kasasbeh, M.; Al Mamlook, R.E.; Halalsheh, N.; Alkasasbeh, M. Deep and machine learning approaches for forecasting the residual value of heavy construction equipment: A management decision support model. Eng. Constr. Archit. Manag. 2021. [Google Scholar] [CrossRef]
- Shehadeh, A.; Alshboul, O.; Al Mamlook, R.E.; Hamedat, O. Machine learning models for predicting the residual value of heavy construction equipment: An evaluation of modified decision tree, LightGBM, and XGBoost regression. Autom. Constr. 2021, 129, 103827. [Google Scholar] [CrossRef]
- Cevik, A. Genetic programming based formulation of rotation capacity of wide flange beams. J. Constr. Steel Res. 2007, 63, 884–893. [Google Scholar] [CrossRef]
- Fonseca, E.T.; da Vellasco, P.C.G.S.; de Andrade, S.A.L.; Vellasco, M.M.B.R. Neural network evaluation of steel beam patch load capacity. Adv. Eng. Softw. 2003, 34, 763–772. [Google Scholar] [CrossRef]
- Güneyisi, E.M.; D’Aniello, M.; Landolfo, R.; Mermerdaş, K. A novel formulation of the flexural overstrength factor for steel beams. J. Constr. Steel Res. 2013, 90, 60–71. [Google Scholar] [CrossRef]
- Fan, J.; Wang, X.; Wu, L.; Zhou, H.; Zhang, F.; Yu, X.; Lu, X.; Xiang, Y. Comparison of Support Vector Machine and Extreme Gradient Boosting for predicting daily global solar radiation using temperature and precipitation in humid subtropical climates: A case study in China. Energy Convers. Manag. 2018, 164, 102–111. [Google Scholar] [CrossRef]
- Zhang, M.; Xiang, F.; Liu, Z. Short-term traffic flow prediction based on combination model of XGBoost-LightGBM. In Proceedings of the 2018 International Conference on Sensor Networks and Signal Processing (SNSP), Xi’an, China, 28–31 October 2018; pp. 322–327. [Google Scholar]
- Pathy, A.S.; Meher, B.P. Predicting algal biochar yield using eXtreme Gradient Boosting (XGB) algorithm of machine learning methods. Algal Res. 2020, 50, 102006. [Google Scholar] [CrossRef]
- Price, B. Investigation on Innovative Shear Link Configurations and Optimal Design for Earthquake Resistant Steel Eccentrically Braced Frames. Master’s Thesis, University of Texas at Arlington, Arlington, TX, USA, 2015. [Google Scholar]
- Dubina, D.; Stratan, A.; Dinu, F. Dual high-strength steel eccentrically braced frames with removable links. Earthq. Eng. Struct. Dyn. 2008, 37, 1703–1720. [Google Scholar] [CrossRef]
- Hjelmstad, K.D.; Popov, E.P. Cyclic Behavior and Design of Link Beams. J. Struct. Eng. 1983, 109, 2387–2403. [Google Scholar] [CrossRef]
- Volynkin, D.; Dusicka, P.; Clifton, G.C. Intermediate Web Stiffener Spacing Evaluation for Shear Links. J. Struct. Eng. 2018, 145, 04018257. [Google Scholar] [CrossRef]
- Yang, X. Artificial neural networks. In Handbook of Research on Geoinformatics; IGI Global: Hershey, PA, USA, 2009; pp. 122–128. [Google Scholar]
- Kim, M.; Jung, S.; Kang, J. Artificial Neural Network-Based Residential Energy Consumption Prediction Models Considering Residential Building Information and User Features in South Korea. Sustainability 2020, 12, 109. [Google Scholar] [CrossRef] [Green Version]
- Chen, T.; Guestrin, C. XGBoost: A Scalable Tree Boosting System. In Proceedings of the 22nd ACM SIGKDD International Conference on Knowledge Discovery and Data Mining, San Francisco, CA, USA, 13–17 August 2016; pp. 785–794. [Google Scholar] [CrossRef] [Green Version]
- Friedman, J.H. Greedy function approximation: A gradient boosting machine. Ann. Statist. 2001, 29, 11891232. [Google Scholar] [CrossRef]
- Ke, G.; Meng, Q.; Finley, T.; Wang, T.; Chen, W.; Ma, W.; Ye, Q.; Liu, T.-Y. LightGBM: A highly efficient gradient boosting decision tree. Adv. Neur. Infor. Process. Sys. 2017, 30, 3146–3154. [Google Scholar]
- Zeng, H.; Yang, C.; Zhang, H.; Wu, Z.; Zhang, J.; Dai, G.; Babiloni, F.; Kong, W. A lightGBM-based EEG analysis method for driver mental states classification. Comput. Intell. Neurosci. 2019, 2019, 3761203. [Google Scholar] [CrossRef]
- Tong, L.; Zhang, Y.; Zhang, L.; Liu, H.; Zhang, Z.; Li, R. Ductility and energy dissipation behavior of G20Mn5QT cast steel shear link beams under cyclic loading. J. Constr. Steel Res. 2018, 149, 64–77. [Google Scholar] [CrossRef]
- Mahmoudi, F.; Dolatshahi, K.M.; Mahsuli, M.; Nikoukalam, M.T.; Shahmohammadi, A. Experimental study of steel moment resisting frames with shear link. J. Constr. Steel Res. 2018, 154, 197–208. [Google Scholar] [CrossRef]


| Feature | Definition | Data Type |
|---|---|---|
| ) | Flange slenderness ratio | Numeric |
| ) | Web slenderness ratio | Numeric |
| ) | Flange to web area ratio | Numeric |
| ) | Flange force | Numeric |
| ) | Web force | Numeric |
| Link length ratio | Numeric |
| Reference | No. of Tests | bf/tf | d/tw | e/(M/V) | fyflange, MPa | fyweb, MPa | Vtest (kN) |
|---|---|---|---|---|---|---|---|
| Ji et al., 2015 [3] | 12 | 12.9 | 40 | 0.58–0.97 | 319 | 228; 273 | 869–1130 |
| Ji et al., 2016 [11] | 2 | 10.6; 14.2 | 35 | 0.7–0.76 | 378; 396 | 228 | 838–926 |
| McDaniel et al., 2003 [5] | 2 | 10.6–13.3 | 33.9 | 0.59; 0.82 | 366 | 354 | 9363–9919 |
| Volynkin et al., 2018 [46] | 5 | 12–12.8 | 21.7–44.2 | 0.76–1.02 | 364; 455 | 364; 374 | 783–1034 |
| Dusicka et al., 2010 [8] | 5 | 11.8; 13.6 | 22–33.9 | 0.8; 0.82 | 223–503 | 242–503 | 1845–4348 |
| Liu et al., 2017 [4] | 11 | 10–13 | 21–35 | 1.12–1.6 | 366 | 354–362 | 373–668 |
| Okazaki et al., 2005 [6] | 11 | 11.5–18.3 | 22.1–56.8 | 1.04–1.49 | 319–362 | 382–404 | 585–1280 |
| Okazaki, T. 2004 [7] | 6 | 12.2 | 57.5 | 1.11 | 351.6 | 393 | 1007–1140 |
| Bokurt and Topaya 2017 [12] | 8 | 18–20.7 | 22.4–22.8 | 1.04–1.59 | 268–281 | 275–299 | 275–591 |
| Bokurt and et al., 2019 [13] | 6 | 18–20 | 22.2–29 | 1.26–1.59 | 272–357 | 276–343 | 288–573 |
| Tong et al., 2018 [53] | 4 | 12 | 17.9 | 1.25 | 461.2 | 463.4 | 720–1013 |
| Mahmoudi et al., 2018 [54] | 1 | 10 | 34 | 0.78 | 301 | 301 | 478 |
| Hjelmstad et al., 1983 [45] | 8 | 11.5; 15.6 | 43.4; 57 | 1.27–1.57 | 241.3; 285.4 | 711–914 | 600–1067 |
| Dubina et al., 2008 [44] | 24 | 12.25 | 38.7 | 0.65–1.3 | 221–315 | 221–315 | 270–420 |
| Price, B. 2015 [43] | 5 | 11.5; 16.5 | 23.8; 56.8 | 1.11; 1.23 | 353.7; 398.5 | 360; 403 | 433–1298 |
| Total | 110 |
| Stander Statistics | Features | |||||
|---|---|---|---|---|---|---|
| Mean | 13.51 | 36.66 | 1.01 | 879.08 | 891.67 | 1.09 |
| Standard Error | 0.24 | 1.16 | 0.04 | 115.7 | 107.91 | 0.03 |
| Median | 12.24 | 38.71 | 0.86 | 608.74 | 664.32 | 1.1 |
| Mode | 12.24 | 38.71 | 0.86 | 803.88 | 550.24 | 0.87 |
| Standard Deviation | 2.53 | 12.18 | 0.43 | 1213.48 | 1131.79 | 0.28 |
| Sample Variance | 6.42 | 148.37 | 0.18 | 1,472,537 | 1,280,955 | 0.08 |
| Kurtosis | 0.56 | −0.76 | 0.33 | 36.84 | 37.1 | −0.65 |
| Skewness | 1.33 | 0.31 | 1.08 | 5.65 | 5.74 | −0.15 |
| Range | 10.71 | 46.15 | 1.86 | 9622.04 | 8304.59 | 1.36 |
| Minimum | 10 | 11.33 | 0.41 | 259.96 | 219.73 | 0.33 |
| Maximum | 20.71 | 57.48 | 2.27 | 9882 | 8524.32 | 1.69 |
| Sum | 1486.02 | 4032.6 | 110.61 | 96698.71 | 98083.4 | 119.9 |
| Count | 110 | 110 | 110 | 110 | 110 | 110 |
| Performance Comparison | Prediction Models | |||
|---|---|---|---|---|
| 92.0 | 196.5 | 378.0 | 397.9 | |
| 132.5 | 284.0 | 507.9 | 804.2 | |
| 11.7 | 24.1 | 35.8 | 39.2 | |
| 0.99 | 0.96 | 0.90 | 0.75 | |
| 7 s | 9 s | 14 s | ||
Publisher’s Note: MDPI stays neutral with regard to jurisdictional claims in published maps and institutional affiliations. |
© 2022 by the authors. Licensee MDPI, Basel, Switzerland. This article is an open access article distributed under the terms and conditions of the Creative Commons Attribution (CC BY) license (https://creativecommons.org/licenses/by/4.0/).
Share and Cite
Almasabha, G.; Alshboul, O.; Shehadeh, A.; Almuflih, A.S. Machine Learning Algorithm for Shear Strength Prediction of Short Links for Steel Buildings. Buildings 2022, 12, 775. https://doi.org/10.3390/buildings12060775
Almasabha G, Alshboul O, Shehadeh A, Almuflih AS. Machine Learning Algorithm for Shear Strength Prediction of Short Links for Steel Buildings. Buildings. 2022; 12(6):775. https://doi.org/10.3390/buildings12060775
Chicago/Turabian StyleAlmasabha, Ghassan, Odey Alshboul, Ali Shehadeh, and Ali Saeed Almuflih. 2022. "Machine Learning Algorithm for Shear Strength Prediction of Short Links for Steel Buildings" Buildings 12, no. 6: 775. https://doi.org/10.3390/buildings12060775