Article

Behavior of Scaled Infilled Masonry, Confined Masonry & Reinforced Concrete Structures under Dynamic Excitations

by
Asad Ullah Qazi
1,
Ali Murtaza Rasool
2,3,4,*,
Yasser E. Ibrahim
5,*,
Asif Hameed
1 and
Muhammad Faizan Ali
6
1
Civil Engineering Department, University of Engineering and Technology, Lahore 54000, Pakistan
2
National Engineering Services Pakistan (NESPAK), Lahore 54000, Pakistan
3
Civil Engineering Department, University of Central Punjab (UCP), Lahore 54000, Pakistan
4
Department of Architecture, National College of Arts (NCA), Lahore 54000, Pakistan
5
Engineering Management Department, Prince Sultan University, Riyadh 11586, Saudi Arabia
6
ANS Associates, Lahore 54000, Pakistan
*
Authors to whom correspondence should be addressed.
Buildings 2022, 12(6), 774; https://doi.org/10.3390/buildings12060774
Submission received: 2 April 2022 / Revised: 21 May 2022 / Accepted: 2 June 2022 / Published: 6 June 2022
(This article belongs to the Section Building Structures)

Abstract

:
This research investigates the nonlinear behavior of scaled infilled masonry (IFM), confined masonry (CM), and reinforced concrete (RC) structures by utilizing and validating two tests from the literature as benchmarks. The validation was based on a comparison with the pushover results of small-scaled physical tests and their numerical modeling. Numerical modeling of small-scale (1:4 and 1:3) IFM, CM, and RC models has been carried out with Finite Element Modelling (FEM) and Applied Element Modelling (AEM) techniques using SAP2000 and the Extreme Loading for Structures (ELS) software, respectively. The behavior of the structure under lateral loads and excitations was investigated using nonlinear static (pushover) and nonlinear time history (dynamic) analysis. The evaluation of the pushover analysis results revealed that for IFM, the %age difference of tangent stiffness was 4.2% and 13.5% for FEMA Strut and AEM, respectively, and the %age difference for strength was 31.2% and 2.8% for FEMA Strut and AEM, respectively. Similarly, it was also calculated for other wall types. Dynamic analysis results from FEM and AEM techniques were found in the fairly acceptable range before yield; however, beyond yield, AEM proved more stable. Finally, the results also showed that the numerical study can be utilized for the evaluation of small-scale models before performing the physical test.

1. Introduction

Numerical or physical modeling is the core methodology for determining the behavior of numerous engineering processes, components, and structures. The small-scale test models that have been developed, based on the rules of similitude, have served their purpose in research history [1,2]. They are adequately capable of demonstrating the pre- and post-peak behavior of prototypes. The development of the small-scale model in itself is a research-oriented aspect that needs dire engineering thought and attention [3,4]. In the literature, some research that covers experimental tests on the full scale or scaled specimens has been performed by [5,6,7]. Thus, there is a need for research-oriented guidelines for developing small-scale test models. Tagel-Din and Meguro (1999) compared the results of shaking table experiments to the results of simulating the collapse of a scaled reinforced concrete (RC) structure. The consequences of reinforcement yield and cracking and concrete crushing on the nonlinear dynamic behavior of structures was researched and addressed using a two-dimensional Applied Element Method (AEM) numerical simulation [8]. Elwood and Moehle (2003) concluded that the analytical models of the shake table specimens incorporating the proposed drift to capture the observed shear and axial load failures deliver a virtuous estimate of the specimen’s measured response [9]. Li et al. (2016) used the shake table test on a 3-story single-bay RC structural model (scaled down to 1/5) to investigate the collapse mechanism of an RC frame structure subjected to earthquake vibrations. The information gathered from the test program was utilized to validate current analytical and numerical simulation methodologies. The research also helped to clarify the gradual collapse process of RC frame constructions [10]. Tong et al. (2019) examined the seismic performance of a self-centering prestressed concrete frame using shake-table testing and numerical analysis. On a shaking table, a 0.5-scale, 1-by-2 bay with a 2-story frame was developed and tested under a variety of ground shaking conditions with an increasing intensity. In order to reproduce the test results, the frame’s analytical model was created using OpenSees, and the analytical and test results showed a strong connection. [11]. Grange et al. (2008) in their research described constitutive models based on concrete damage mechanics and steel plasticity [12]. Masonry infill walls are utilized all around the world for partitioning, and they are particularly popular in developing nations due to their superior functionality, accessibility, and low cost. They are utilized to either surround or divide the reinforced frame construction. Some studies are available that describe the functionality and behavior of masonry walls [13,14]. In a study performed by Jeon et al. in 2015, numerical models were used to estimate the seismic fragility of weak RC frames with infilled masonry (IM) considering variability in ground motion and building materials. Due to the interaction with the boundary frame, the favorable effect of the masonry infill was found to decrease at more severe limit conditions [15]. Concerning the dynamics of rigid block-like masonry specimens, that can be also treated through a modified Housner’s approach through experimental, deterministic, and probabilistic approaches, as reported in [16,17,18,19]. Confined masonry (CM) is structural system made up of masonry in which the unreinforced masonry walls are confined by nominally RC tie-elements, i.e., tie-beams, columns, etc., at the perimeter and other critical areas [20]. Confined masonry construction has been used widely throughout the world in high seismic regions. Its importance became more prominent in Pakistan after the October 8th, 2005 great Kashmir earthquake [21,22,23].
However, there is still a need to study the role of confined and infilled masonry quantitatively. Žarnić et al. (2001) tested models for infilled masonry reinforced concrete frame structures on shake tables. The scale ratio was kept at 1:4 and an appreciable similitude was attained for both material and geometrical parameters. The models were subjected to simple sine wave dwells with varying intensity and amplitude. An important note posed by the author was that the masonry infills for the test structure were laid in weak mortar to allow crack propagations along masonry beds and faces. The author also employed nonlinear computational models for the numerical modeling of the test structure and validated the test behavior with the obtained analytical results [24]. Idrizi et al. (2009) demonstrated that the proper implementation and application of the infill walls can improve the structural response regarding the seismic behavior of structures. This behavior is dependent not only on their respective lateral resistance and participation in the building, but also on their structural configuration, especially in elevation and the type of lateral load resisting structural system implemented in the structure. Infill walls will increase the lateral load resisting capacity of the structure; however, the ductility of the structure still depends on the main RC lateral load resisting structural system [25]. Waqar Ahmad (2013) performed a small-scale and nonlinear static (pushover) analysis on an infilled masonry wall with plane masonry and column interaction, and on a confined masonry wall with saw tooth masonry and column interaction. The results of the experimental study were compared with the numerical simulations and were found to be in the fairly acceptable range with each other [26]. Unreinforced masonry (URM) is also used around the world, including seismically active regions, and it is important to evaluate the seismic performance of reinforced concrete structures engaging URM infill walls. Blagojević et al. (2021) and Ma et al. (2022) described practical analytical modeling strategies that can be used for the seismic performance evaluation of URM infill walls located within an RC frame structure [27,28]. Several other researchers [29,30,31,32,33,34,35,36,37,38] have provided guidelines for the numerical modeling of IFM, CM, and RC structures. Infill walls within the RC frame can be modeled using various strategies including the diagonal strut model, three-strut model, horizontal spring model, etc. [21,39]. In the diagonal strut concept, a masonry panel is substituted by an equivalent single diagonal compression strut between the corners of the corresponding concrete frame. In the three-strut (Tri-Strut) concept, a masonry panel is substituted by one diagonal and two non-diagonal struts with force-deformation characteristics depending on the orthotropic behavior of the masonry material. A masonry panel is replaced by an equivalent horizontal shear spring between two neighboring stories in the horizontal spring model concept. In research published in 2012, Dehghani Sanij compared three models for the nonlinear analysis of reinforced concrete frames with masonry infill walls, i.e., the diagonal strut model, the three-strut model, and the horizontal spring model. The SAP2000 tool was used to perform a nonlinear pushover analysis on a series of RC frames with varying numbers of stories and infill wall layouts. The seismic performances of the frames were compared and the effect of using different models was studied [40]. Ranjbaran et al. (2012) proposed simple formulas for expressing the relationships between a confined wall’s lateral strength and wall specifications such as the initial stiffness, secondary stiffness after cracking, ultimate strength, and ductility for use in engineering programs such as SAP 2000, which are widely used in engineering firms and by practicing engineers [41]. Stavridis and Shing (2008) introduced a calibration approach and FEM technique for masonry-infilled RC frames. The comparison of numerical and laboratory data revealed that the numerical models successfully captured the extremely nonlinear behavior of the physical specimens and that numerical models can be used in the preparation of small-scale physical test models [42]. Previous research has shown that few studies are available that explain and compare the seismic behavior of IM, CM, and RC structures modeled with different modeling strategies. Furthermore, numerical or physical modeling is the core methodology for determining the behavior of numerous engineering processes, components, and structures. Small-scaled test models are developed based on the rules of similitude. They are adequately capable of demonstrating the pre- and post-behavior of prototypes. However, the development of small-scaled test models is itself a research-oriented aspect that needs dire engineering thought and attention. Thus, research-oriented guidance for the development of small-scale test models is required.
The framework of this research involved the numerical study and analytical modeling of small-scale structures for dynamic excitations. The objective was to effectively predict the dynamic behavior of small-scale masonry and RC structures before testing. Researchers have identified three major issues with the dynamic testing of scaled models, i.e., the modeling of scaled material properties for establishing similitude, the financial constraints resulting in the testing of a small number of specimens, and specimen size limitations. Thus, this research addresses an approach that facilitates the effective planning of physical testing for scaled models. This research shall aid in establishing the feasibility of the test and hence the evaluation of time, space, and finances in attaining appreciable results and to foresee any complications that may arise. The study refers to past research performed by Žarnić et al. (2001) [24] and Waqar Ahmad (2013) [26] on validating the adopted computational models. The current study has been carried out in two steps. In the first step, numerical modeling of the prototype model tested by Žarnić et al. (2001) [24] at a scale of 1:4 was conducted using FEM and AEM approaches, and a nonlinear time history (dynamic) analysis was carried out. In the second step, numerical modeling of the prototype walls tested by Waqar Ahmad (2013) [26] at a scale of 1:3 was performed using FEM and AEM approaches, and both nonlinear static (pushover) analysis and nonlinear time history (dynamic) analysis were carried out. Finally, the results obtained from different numerical approaches were analyzed and discussed in detail.

2. Numerical Modeling Approaches

The main objective of this study was to simulate the pushover behavior of research performed by Žarnić et al. (2001) [24] and Waqar Ahmad (2013) [26] via two analytical techniques, i.e., Finite Element Modelling (FEM) and Applied Element Modelling (AEM), and to compare the results using a numerical analysis.

2.1. Finite Element Modelling (FEM)

The FEM technique, which dates back to the late 1950s, is one of the most widely used analytical techniques [43,44]. The common finite elements for the linear, planar, and 3D discretization are the line, plane, and solid elements, respectively. In FEM, the structural system is divided into finite and discrete elements. The elements are joined by common nodes. The equations for the equilibrium are established and solved for the structural solutions. The basic origin of the FEM is the matrix analysis of structures. In this method, the displacements of the structural nodes denoted as the degrees of freedom (DOFs) are represented as a function of the stiffness matrix and load vector [45]. CSI-SAP2000 [46] is an integrated graphical interfaced software for structural analysis and design based on FEM. SAP2000 is capable of modeling both material and geometric nonlinearity and can perform both Nonlinear Static Analysis (NSA) and Nonlinear Time History (NLTHA) Analysis [47].

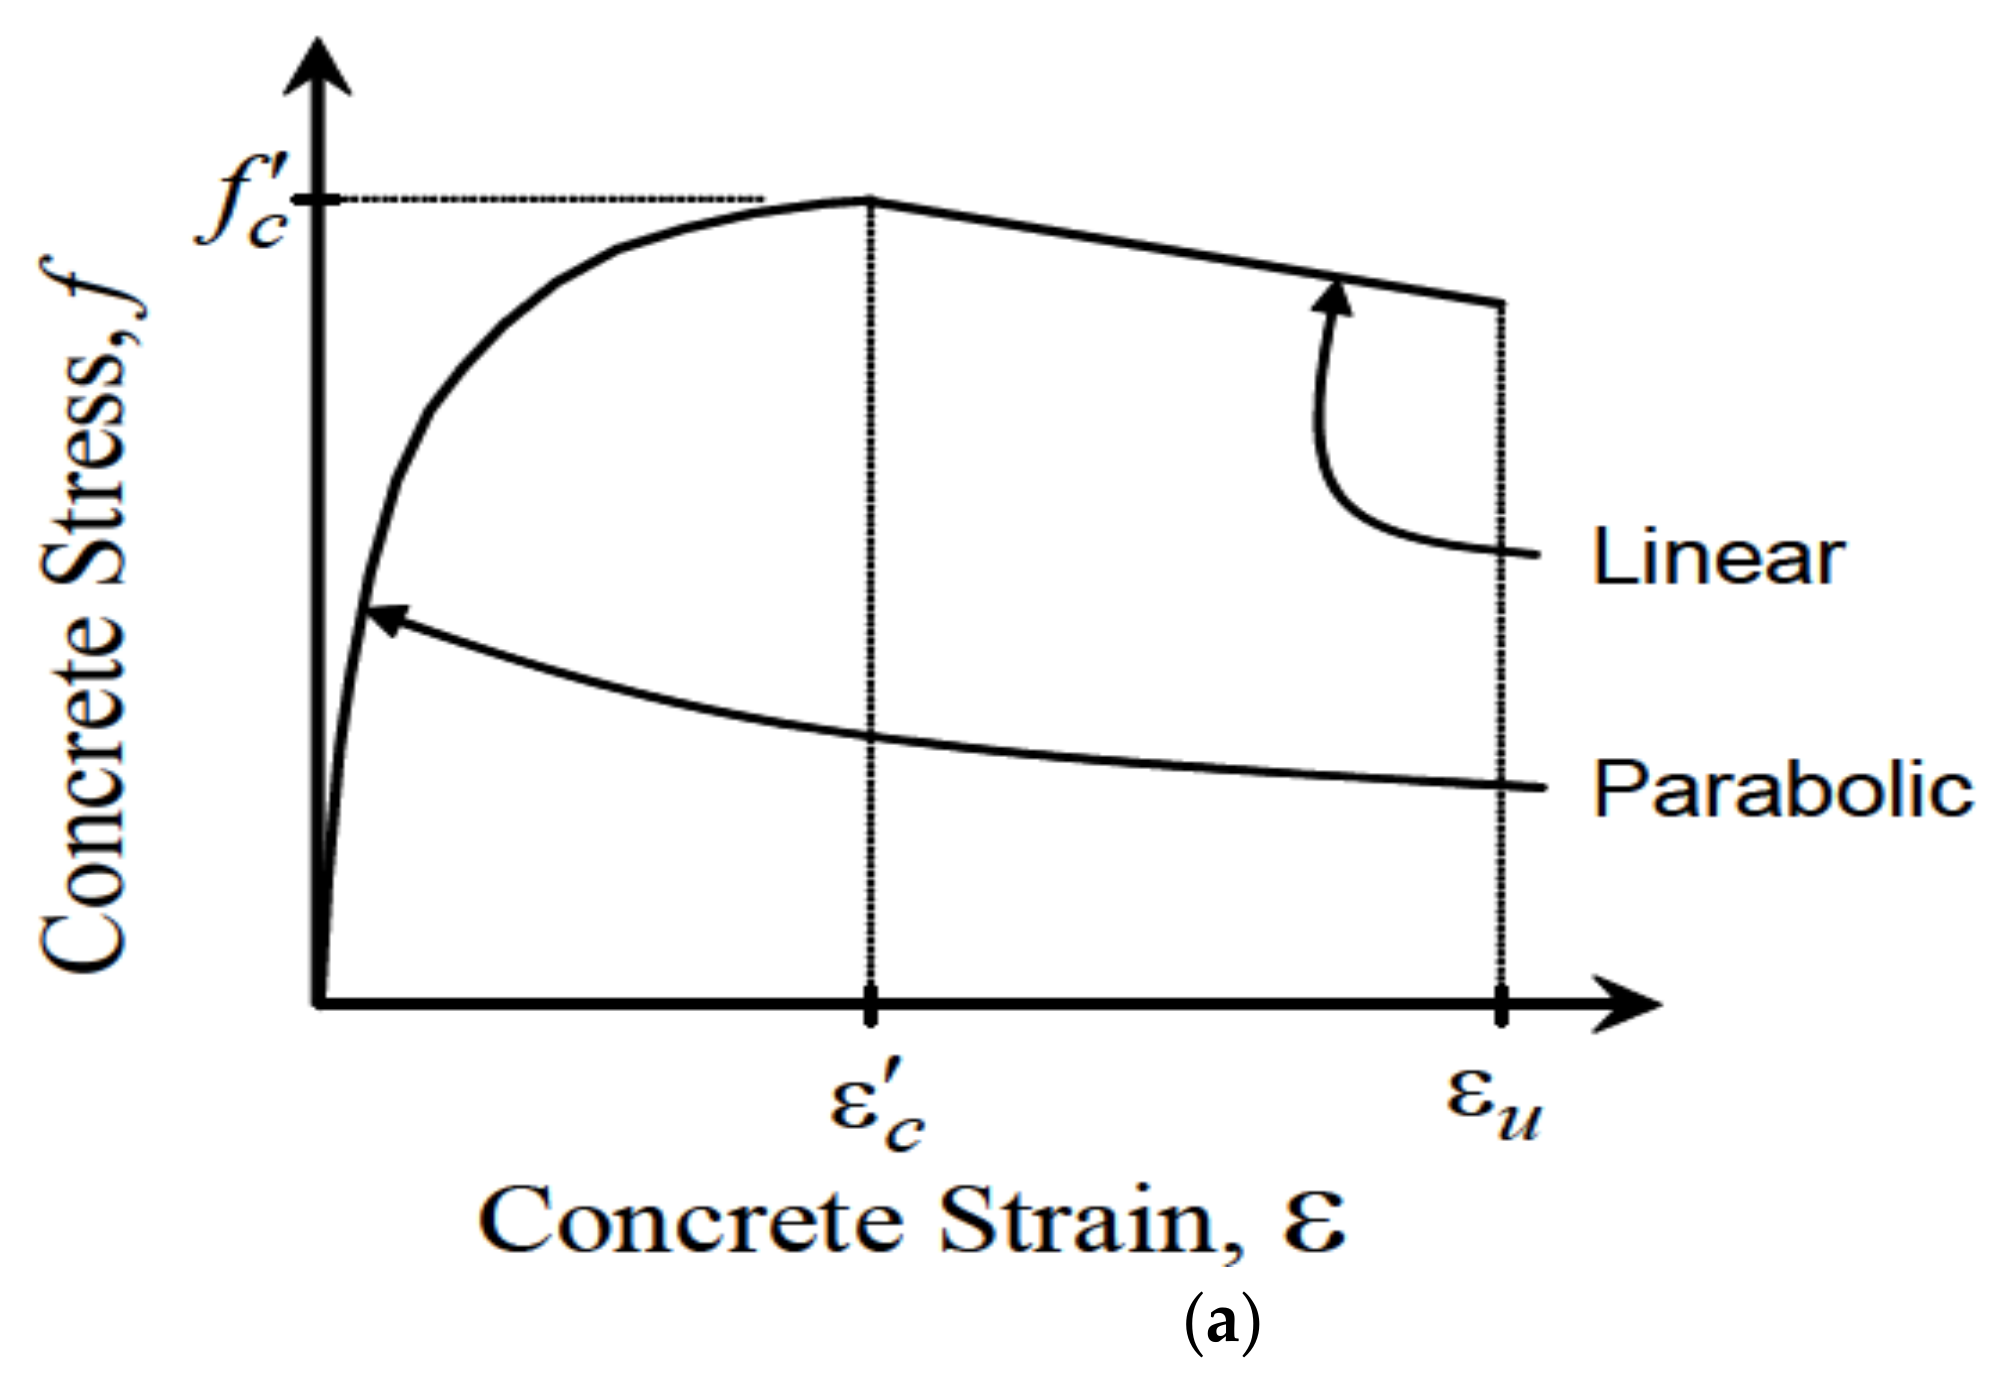
2.1.1. Material Stress-Strain Models

The nonlinear material models for concrete and masonry were adopted for this study. The properties of the materials were selected based on the conventional strength requirements. The material model’s backbone curves for concrete and masonry were almost similar. For concrete, a simple concrete parametric stress-strain model was adopted, [48] and for masonry, an idealized stress-strain model [49] was adopted, shown in Figure 1. The concrete and reinforcement material properties of the infilled and confined masonry wall models are listed in Table 1.

2.1.2. Nonlinear Frame Hinges

Nonlinear frame hinges were applied at sections where nonlinear behavior was expected. Thus, it is also referred to as the lumped plasticity model. Zhao et al. (2011) analytically investigated the plastic hinge length in RC flexural members with the Finite Element Method (FEM) using the computational software DIANA [50]. Hassan and Hamid (2013), based on the concept of demand and capacity rotation, and by means of a Monte Carlo simulation, derived a probabilistic model for the evaluation of moment redistribution factors [51]. Whereas Gusella (2022) studied the effect of the plastic rotation randomness on the moment redistribution in reinforced concrete structures [52]. SAP2000 uses the fiber hinge model for the section behavior evaluation. The fiber behavior conforms to the material stress-strain data. The section behavior can be obtained in the form of a moment–curvature diagram (M-φ Curve). A fiber-based section analysis and its corresponding moment–curvature diagram as evaluated by SAP2000 is shown in Figure 2.

2.1.3. Nonlinear Layered Shell Elements

SAP2000 also offers a nonlinear layered shell element which is a plane element. The Takeda hysteresis model [53] was applied in this study for the shell elements.

2.1.4. Geometric Non-Linearity

Geometric nonlinearity, also referred to as P-Delta effects, are important for slender elements. SAP2000 has the capability of incorporating geometric nonlinearity.

2.2. Applied Element Modelling (AEM)

AEM is a recent development and is considered here for predicting the continuum and discrete behavior of structures. In AEM, structural damage stages like elastic behavior, crack initiation and propagation, the yielding of reinforcements, element contacts, collisions, etc., are intrinsic. The structure in AEM is modeled as an assembly of small elements as shown in Figure 3. The two elements are assumed to be connected by one normal and two shear springs located at contact points, which are distributed around the edges of the elements. Each group of springs completely represents stresses and deformations. All the structural elements like beams, columns, structural infills, etc., are modeled as 8-noded solid elements. The structural system is interconnected via normal and shear springs at their interface. In FEM, elements are joined at common nodes and equilibrium equations are developed. However, in the case of AEM, the spring behaviors are evaluated based on the given material models and the equilibrium equations for the elements are solved for the structural solution, respectively. Another primary advantage for AEM is that due to the fewer DOFs it yields fewer stiffness equations compared to FEM. In FEM for a solid element, the number of DOFs shall be eight nodes times six DOFs resulting in 48 DOFs in total for one element. However, the AEM approach employs only six DOFs in total for one element because only the element is evaluated in general. Extreme Loading Services (ELS) [54], a commercial software package that uses AEM, developed by Applied Science International (ASI), has been used in this study. For masonry, ELS has specifically defined elements that incorporate the brick mortar interaction.

Material and Geometric Non-Linearity

ELS also utilizes nonlinear material models for concrete and masonry proposed by [55,56]. Its built-in modules require the definition of a few key parameters only for the development of nonlinear material models. For reinforcements, a bilinear material model with strain hardening is applied. ELS incorporates the strength and stiffness degradation of the structure under repeated loadings, and this degradation constitutes the hysteresis behavior. ELS employs constitutive models for concrete. Strength and stiffness degradation of the structure is important for the current study as the dynamic behavior of the test structures is dependent on the residual deformations, energy dissipations, etc. To accommodate this, the stress-strain hysteresis model of Ristic et al. (1986) [57] was employed in the current study. Material nonlinearity and stiffness degradations are incorporated in the connecting spring relationships as the discretized elements are connected by normal and shear springs at the interface. These springs exhibit the nonlinear force deformation behavior based on their respective material model. ELS or AEM automatically incorporates effects like the yielding of reinforcements, plastic hinge formations, buckling, crack initiation and propagations, and P-delta effects.

2.3. Mesh Analysis and Size

IFM was modeled as a homogenous nonlinear shell element. In AEM, two brick elements are assumed to be connected by one normal and two shear springs located at contact points, which are distributed around the edges of the elements.

3. Description of Structure and Models Employed

3.1. Description of H-Building Structure

In the current study, a small-scaled H-Building structure, as shown in Figure 4a tested by Žarnić et al. (2001) [24], was taken as a reference for performing numerical investigations. The data regarding the physical test such as scale ratio, geometry, material properties as well as the results for pushover behavior were already available. The model was applied to sine dwell ground motions with subsequent variation in intensity. Žarnić et al. (2001) [24] established the pushover behavior of the test model and presented both experimental and analytical results for the pushover curve. The purpose of current is to analytically evaluate the same test structure performed by Žarnić et al. (2001) [24] using different numerical approaches, and to compare the results for their effectiveness before performing physical tests. The analytical models of the bare frame and IFM are shown in Figure 4b,c, respectively.
In FEM and AEM, the studied elements/models are as under:
  • Finite Element Modelling
    • Homogenous Shell Finite Element Model;
    • FEMA Strut Finite Element Model;
    • Tri-strut Finite Element Model.
  • Applied Element Modelling
    • Continuum Applied Element Model.
The various approaches that are examined in the current study are described in Figure 5a,b.

3.2. Description of Numerical Models Employed in the Study

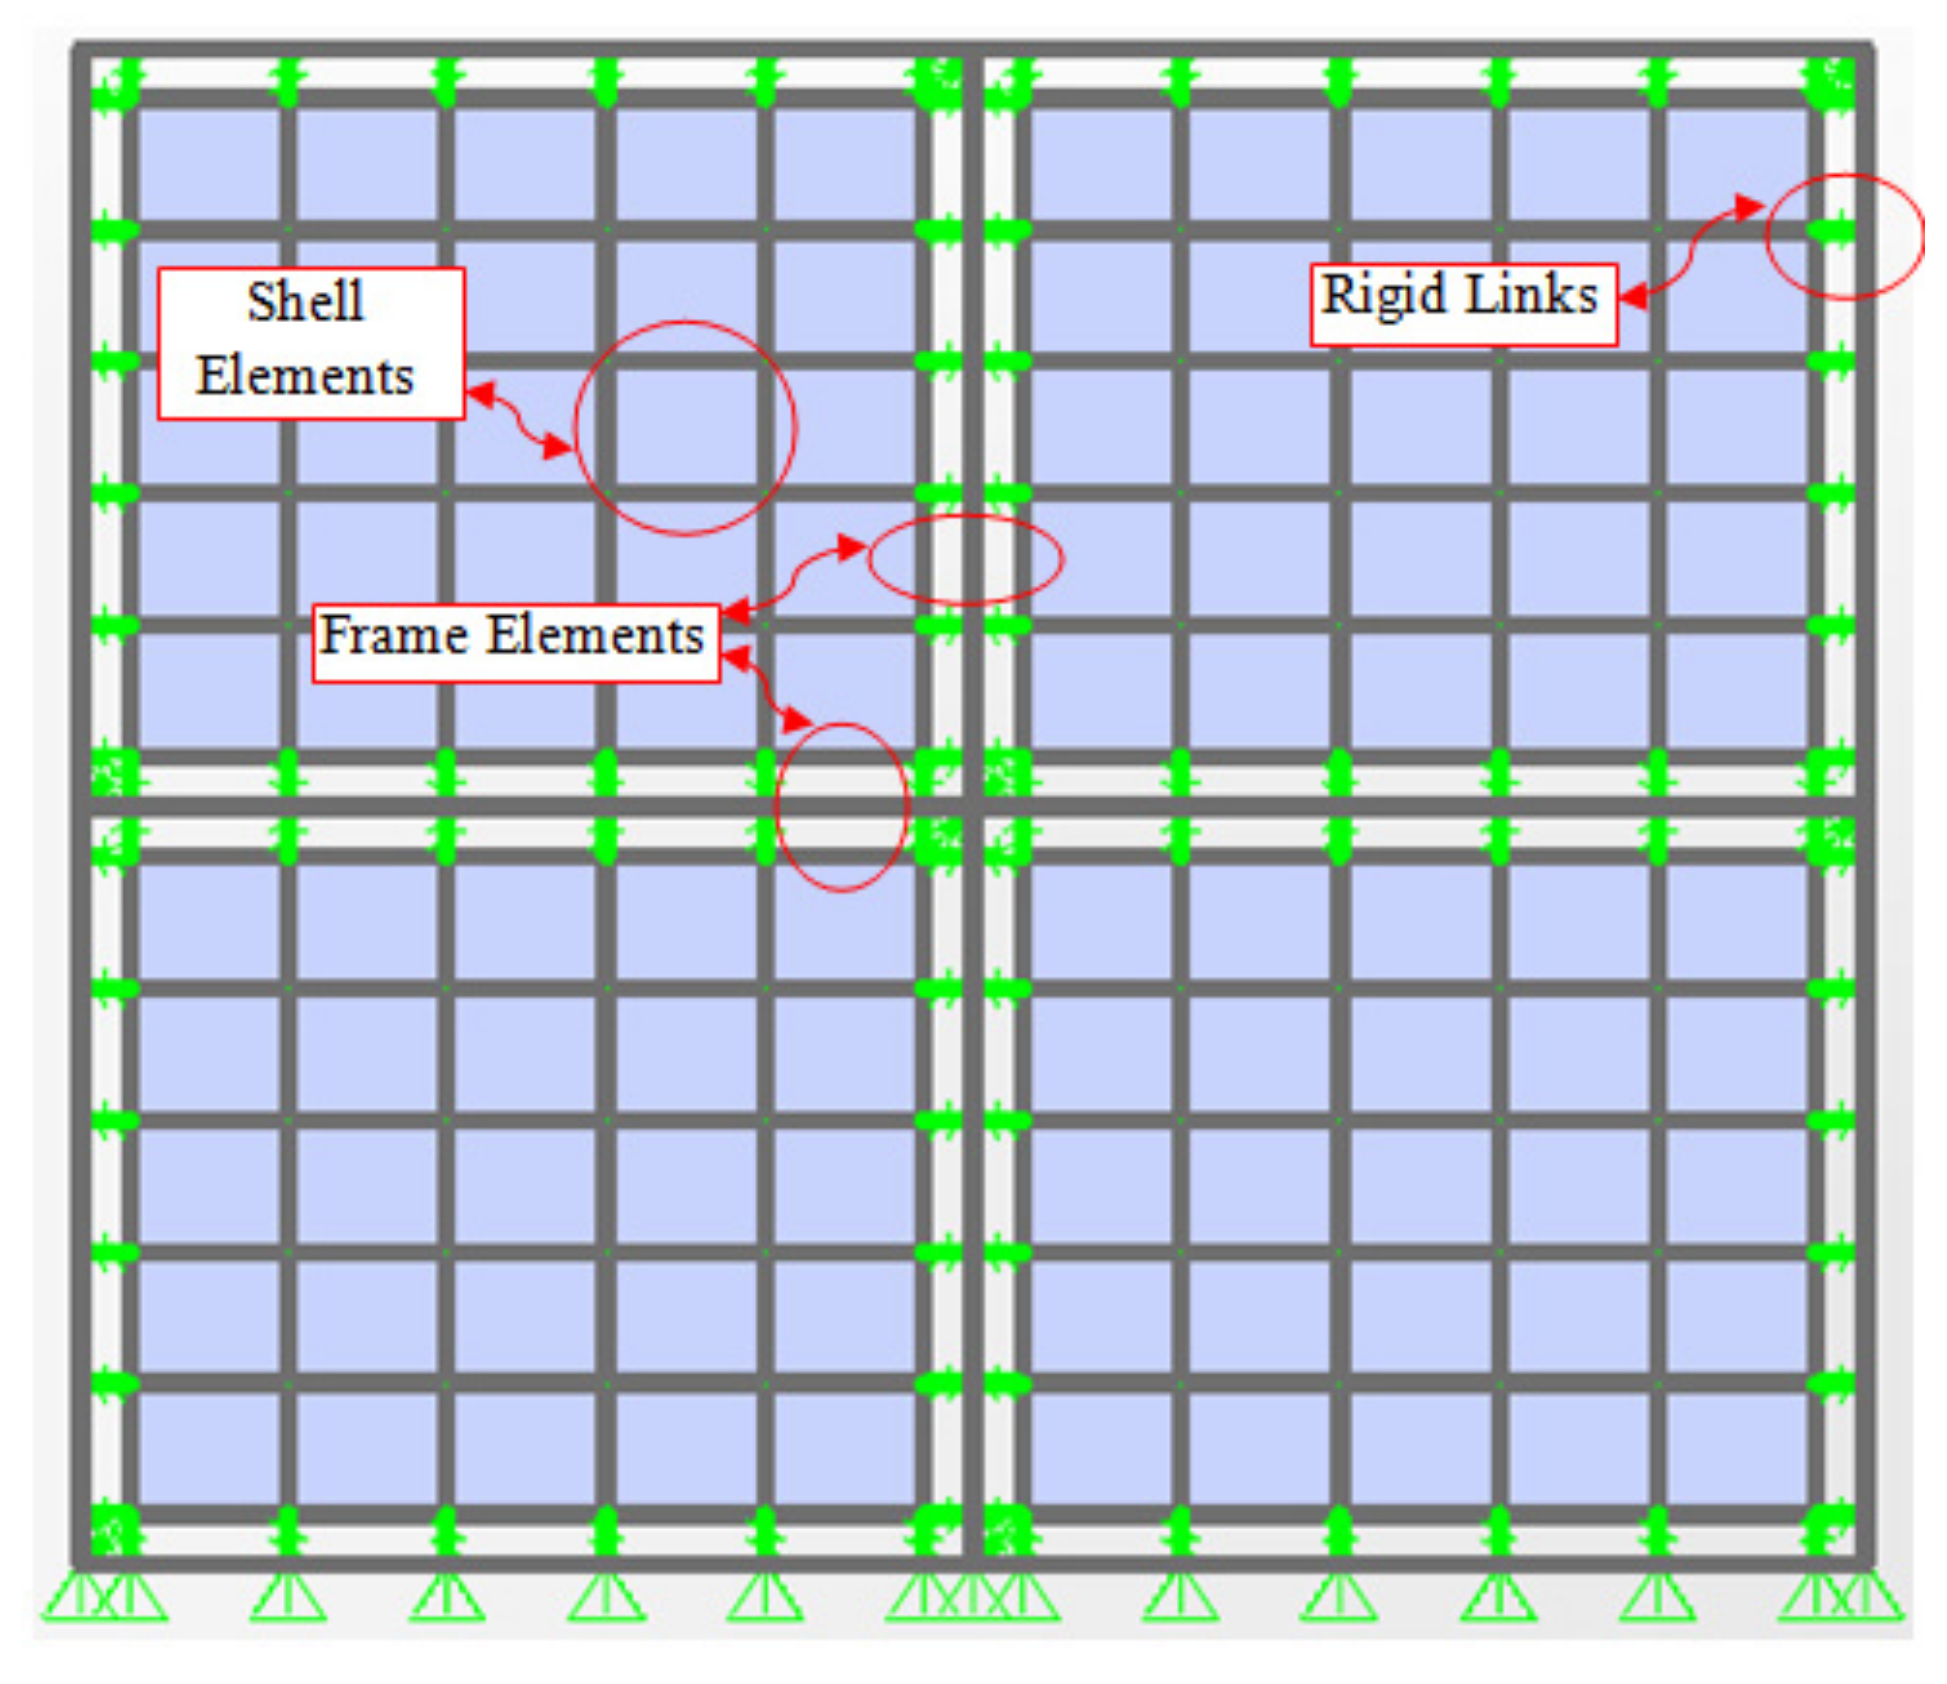
3.2.1. Homogenous Shell Finite Element Model

IFM is modeled as a homogenous nonlinear shell element in SAP2000. In the modeling of the building, the concrete frame was modeled as line elements. For nonlinear frame behavior, plastic hinges were assigned at beam and column ends. The beams and columns were modeled at the centerline; therefore, rigid links were applied between the masonry and frame centerline as shown in Figure 6.

3.2.2. FEMA Strut Finite Element Model

In the strut finite element model, the masonry infill wall is modeled as a single compression/tension element that equates to the behavior of the wall. For this model in SAP2000, masonry was modeled as a pinned frame element with a specific force–deformation relationship assigned. The concrete frame was modeled as line elements. For nonlinear frame behavior, the frame hinges were assigned at the beam/column ends. The equivalent strut properties were evaluated as per FEMA 356 [58] (Section 7.5.2), proposed by [59]. The strut was modeled as a rectangular frame element with masonry material assigned to it. For the post elastic limit, a force deformation relationship model given by [60] was applied as the backbone for the masonry strut element. For the nonlinear behavior of masonry, ACI 530 [61] was considered for the required shear strength evaluations. Shear strength evaluation is a prerequisite for the application of the nonlinear force deformation backbone curve. The diagonal strut was modeled on the assumption that the masonry lying in the diagonal zone of the panel is predominately active against lateral loads. The properties of the diagonal strut are dependent on the masonry and confining frame properties. A schematic representation of the FEMA equivalent strut finite element model of H-building structure is shown in Figure 7.

3.2.3. Tri-Strut Finite Element Model

In the Tri-strut Finite Element Model, the masonry infill wall is modeled as three compression and tension elements that equate the behavior of the wall. For modeling the masonry infill wall, SAP2000 was used and the masonry was modeled as three pinned frame elements. These struts were assigned with force deformation hinges that exhibit a response as per the material stress-strain data, whereas the concrete frame was modeled as line elements. For nonlinear frame behavior, the frame hinges were assigned at beam/column ends. The triple strut approach was applied as per El-Dakhakhni et al. (2003) [62]. The additional struts can effectively model the increased contact between the infill and frame elements due to lateral load application. This approach attests to its application for CM (masonry with saw-tooth interface), because CM offers more masonry contact than normal IFM. CM was also modeled analytically in this study. A schematic representation of the Tri-strut finite element model of the H-building is shown in Figure 8.

3.2.4. Continuum Applied Element Model

In this approach, the IFM wall, beams, and columns were modeled as continuum elements. The modeling was carried out using the ELS [54] software package. In the trial analysis, it was observed that for modeling infilled masonry walls, ELS is better than SAP2000 because for masonry structures, ELS has specifically defined elements that incorporate the brick–mortar interaction. ELS has a specific masonry element for modeling (based on AEM 8-N elements), and it also discretizes the mortar bed joints. In AEM, the initiation and propagation of cracks within masonry can be evaluated. Built-in finite elements were used for developing the AEM model. ELS does not require the insertion of plastic hinges and their corresponding backbone curves. It assigns multi-linear relationships to springs for the matrix based on the material properties. In addition, ELS follows a discrete crack approach. It reports the breaking of the springs at locations where material failure is reached. AEM model of H-building is shown in Figure 9.

4. Methodology

In the first phase of the research, the verification of the small-scale model study performed by Žarnić et al. (2001) [24] was performed. In the second stage, verification of small-scale IFM and CM wall structures prepared and tested under static lateral loads and dynamic loads by Waqar Ahmad (2013) [26] was performed. Schematic views of both IFM and CM walls structures are shown in Figure 10, and the details of the analysis performed in this study is given below.

4.1. Modelling of H-Building Structure

4.1.1. Nonlinear Static (Pushover) Analysis of H-Building Structure

Two distinct approaches, i.e., FEM and AEM, were utilized for performing the nonlinear static analysis of H-Building structure.

4.1.2. Nonlinear Time History (Dynamic) Analysis of H-Building Structure

For H-building structures, AE models developed were also subjected to El-Centro (1940) ground motion Chopra (1995) [63] with varying intensities. The PGA of the ground motion amounting to 0.319 g was scaled up to 3.0 g. A bare frame model was also studied for H-Building to investigate the increase in strength and stiffness due to IFM. The seismic signal was scaled only in terms of acceleration. The 0.319 g PGA of the ground motion was scaled up to 3.0 g to investigate the capacity and failure mechanism of H-building structures.

4.2. Modelling of Masonry Wal Structures

4.2.1. Nonlinear Static (Pushover) Analysis of Infilled and Confined Masonry Wall Structure

The infilled wall has plane masonry and column interaction, whereas the confined wall has sawed tooth masonry and column interaction. Pushover behavior of the analytical and experimental models was evaluated and compared in this study. The similitude for the test models was based on true replica principles and of the order 1:3. The pushover behavior was evaluated and compared with the experimental results. Pushover Analysis was carried out by giving a target lateral displacement calculated for 1.5% drift. The FEM and AEM models were studied for the IFM wall, as shown in Figure 11, whereas FEM tri-strut and AEM models were studied for CM walls, as shown in Figure 12.

4.2.2. Nonlinear Time History (Dynamic) Analysis of Infilled and Confined Masonry Wall Structure

Evaluation of the dynamic behavior of small-scale infilled and confined masonry wall structures using analytical techniques was studied in this research. Both the FE and AE models were subjected to El-Centro (1940) ground motion [63] with varying intensities. The peak ground acceleration (PGA) of the ground motion of 0.319 g was scaled up to 3.0 g.

5. Analysis and Results

The analytical models that were developed are solved and the results obtained are discussed in the following sections.

5.1. Nonlinear Static (Pushover) Analysis of H-Building Structure

In a study performed by Žarnić et al. (2001) [24], a physical model was subjected to sinusoidal ground motion with a varying amplitude and duration to observe the resonance effects. A pushover analysis was performed using DRAIN-2DX, and the results of the maximum story drifts and the corresponding base shear were plotted. The pushover curve obtained from the DRAIN-2DX was found to be in good agreement with the test run results. In the current study, the same H-Building structure was analyzed using FEM and AEM techniques. The results of pushover analysis were evaluated and compared with the results established by Žarnić et al. (2001) [24] as shown in Figure 13 and are presented in Table 2. From the results, it is evident that the initial stiffness and post-peak behavior of the H-Building structure from the shake table test are in good agreement with FEM Strut and AEM approaches. The shell analytical model overestimated the strength/stiffness of the test structure. However, FEMA strut, Tri Strut, and AEM were found comparable with Žarnić et al.’s (2001) [24] numerical test results. The average percentage differences for all the test runs and pushover curves were 31.6%, 28.6%, 47.3%, and 35.9% for Zarnic et al., FEMA Strut, Tri-strut, and AEM, respectively. This is because AEM is a concept that incorporates a discrete fracture and cracking approach and hence it predicts results fairly close to the experimental results. However, in FEM, the masonry infill wall is modeled as a simplified single compression and tension element; therefore, FEM Tri-strut and FEMA strut results are not in good agreement with the experimental values. The percentage differences for the strength corresponding to test run H10 were 16.0%, 24.8%, 3.0%, and 19.8% for Zarnic et al.’s method, FEMA Strut, Tri-strut, and AEM, respectively. A comparison to test run H10 also serves as a comparison of the secant stiffness for the test structure. The percentage differences for post strength corresponding to test run H20 were 21.0%, 32.9%, 79.4%, and 43.5% for Zarnic et al.’s method, FEMA Strut, Tri-strut, and AEM, respectively. These differences between the pushover curve of Zarnic et al.’s approach as well as the test runs are relatively small. Therefore, the studied computational models are appropriate, which shows that the presented research can be carried out before a physical test on a shake table. SAP2000 reports structural damage in terms of hinge status but ELS applies a discrete structural damage approach for evaluating structural damage and reports structural damage like cracks at the onset of specified tensile strain, as shown in Figure 14.
FEMA-365 [56] set three performance points (i.e., IO, LS, and CP) between the characteristic points B and C. IO is the abbreviation for “Immediate Occupancy”, which means that structure is in the serviceability limit state. LD is the abbreviation for “Life Safety”, which means that the structure is close to the safety limit state. CP is the abbreviation for “Collapse Prevention”, which means that the structure is close to the collapse limit state.

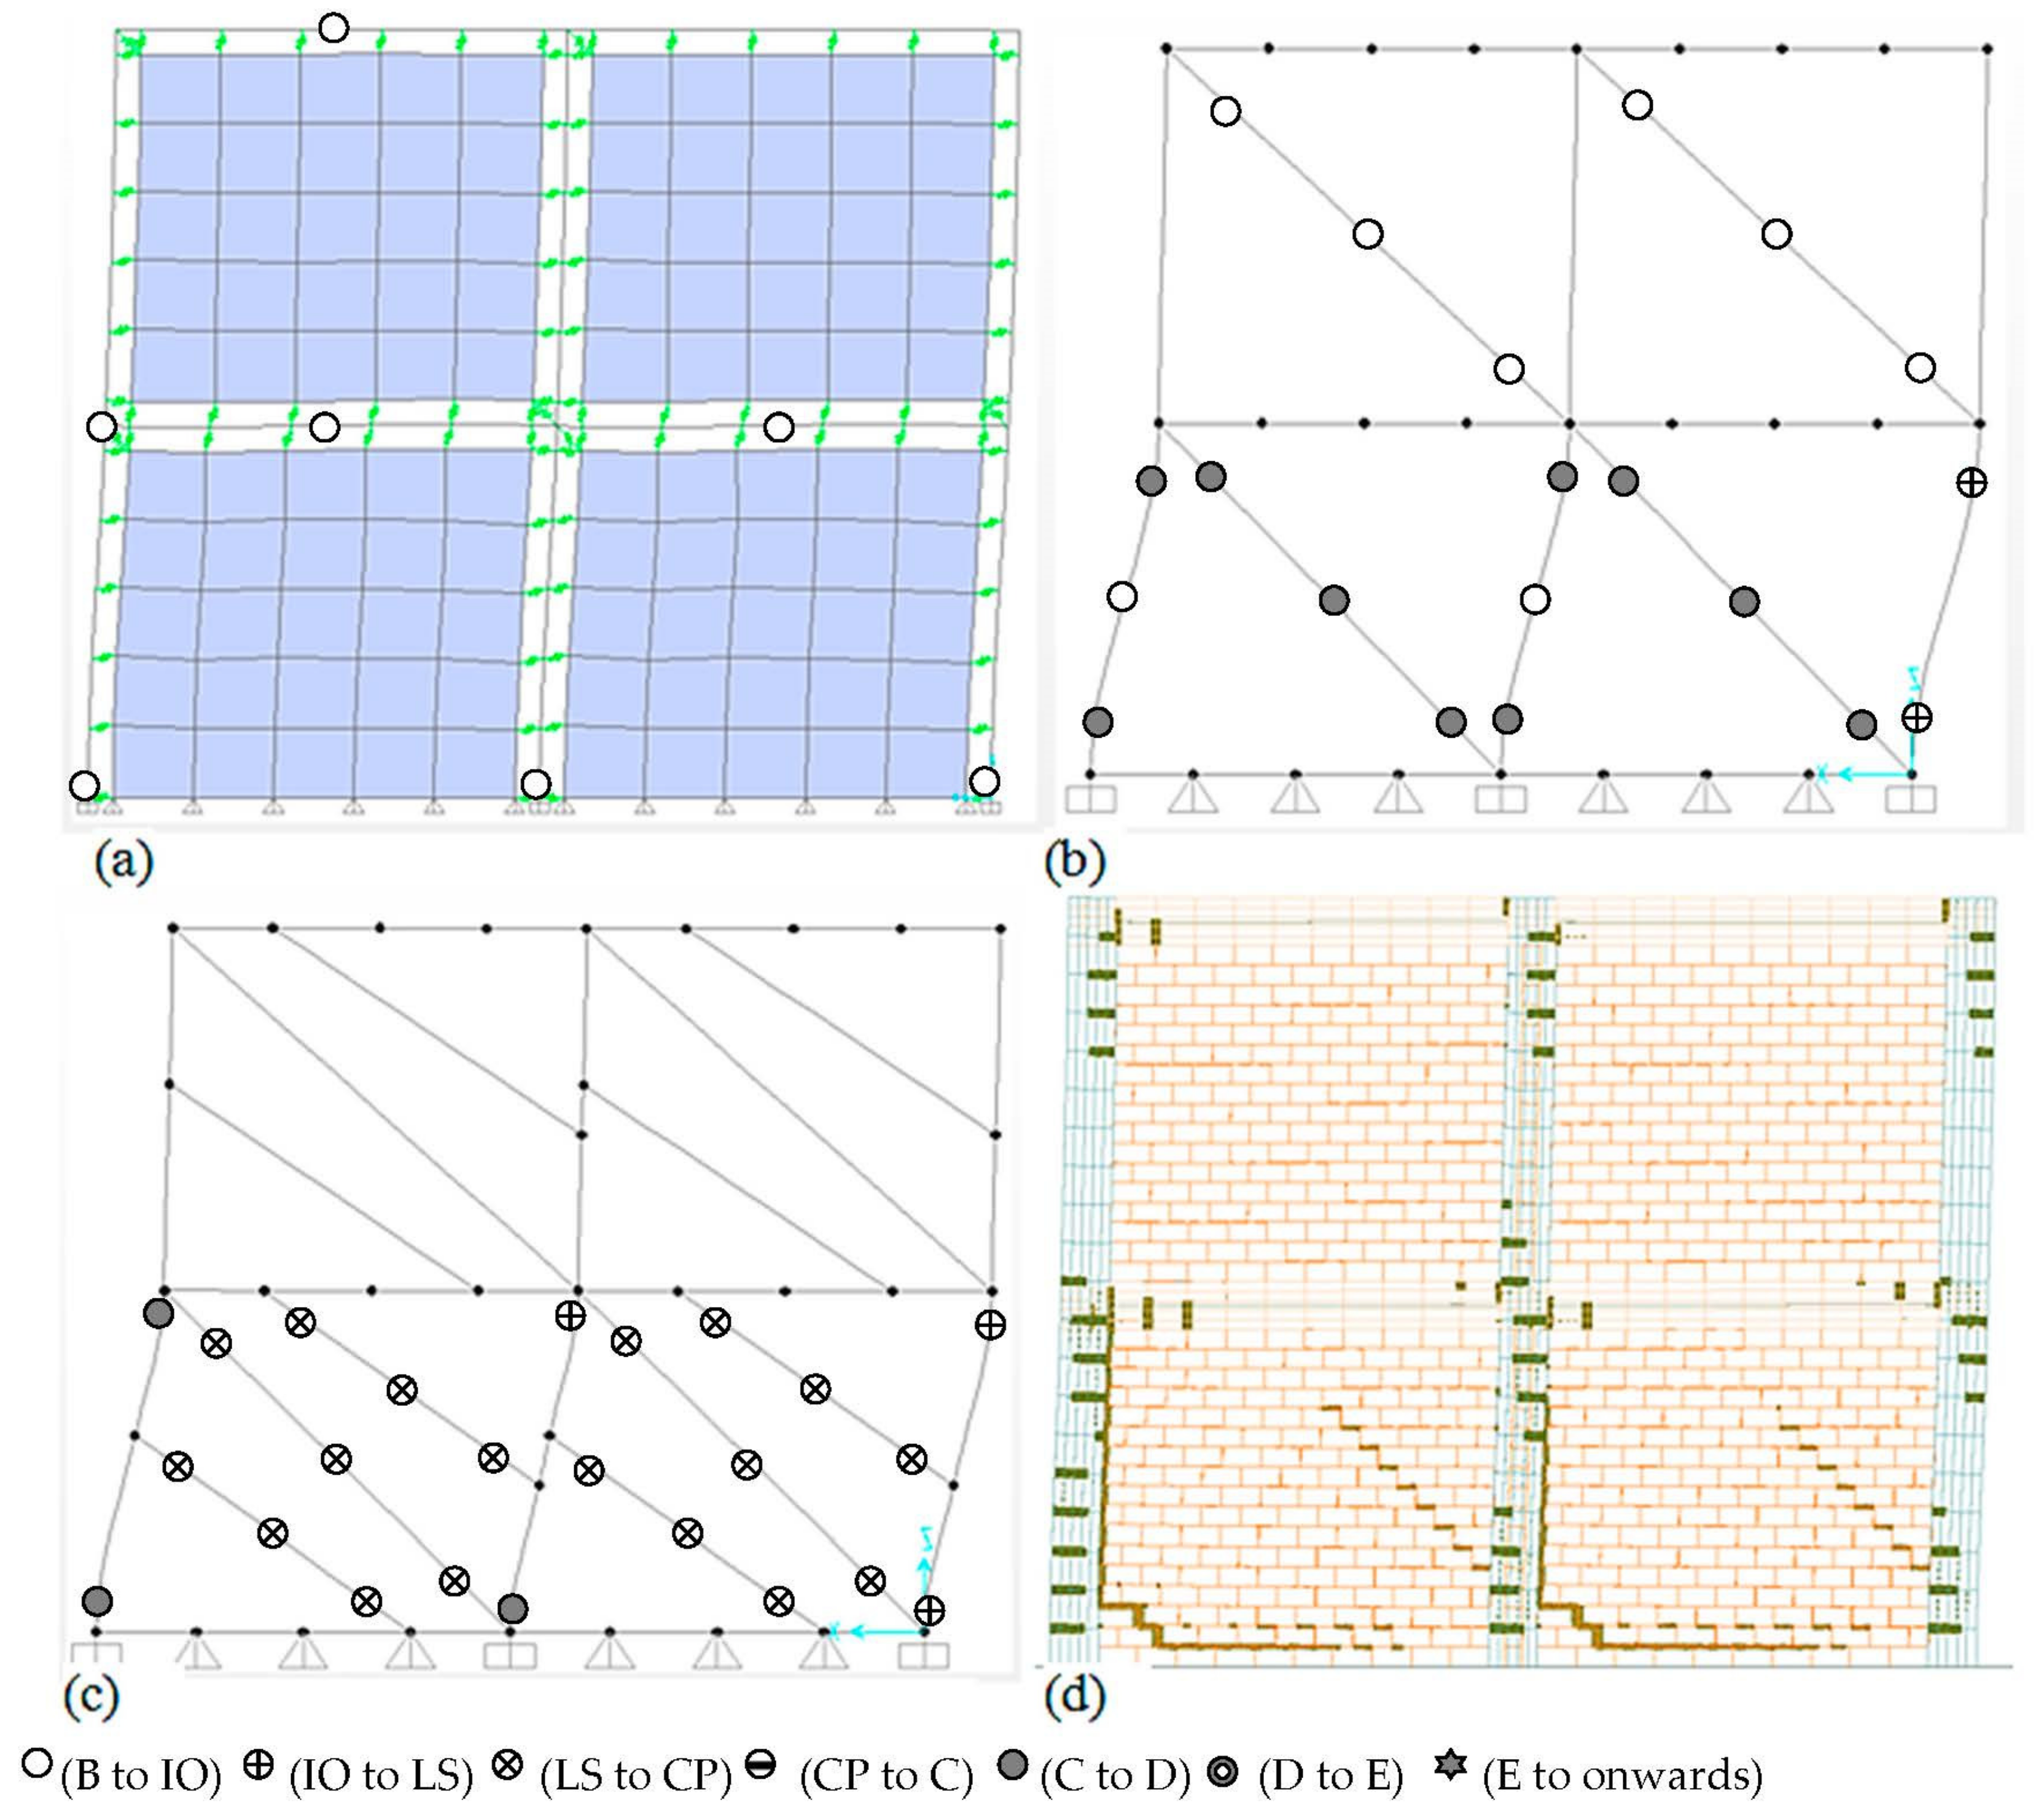
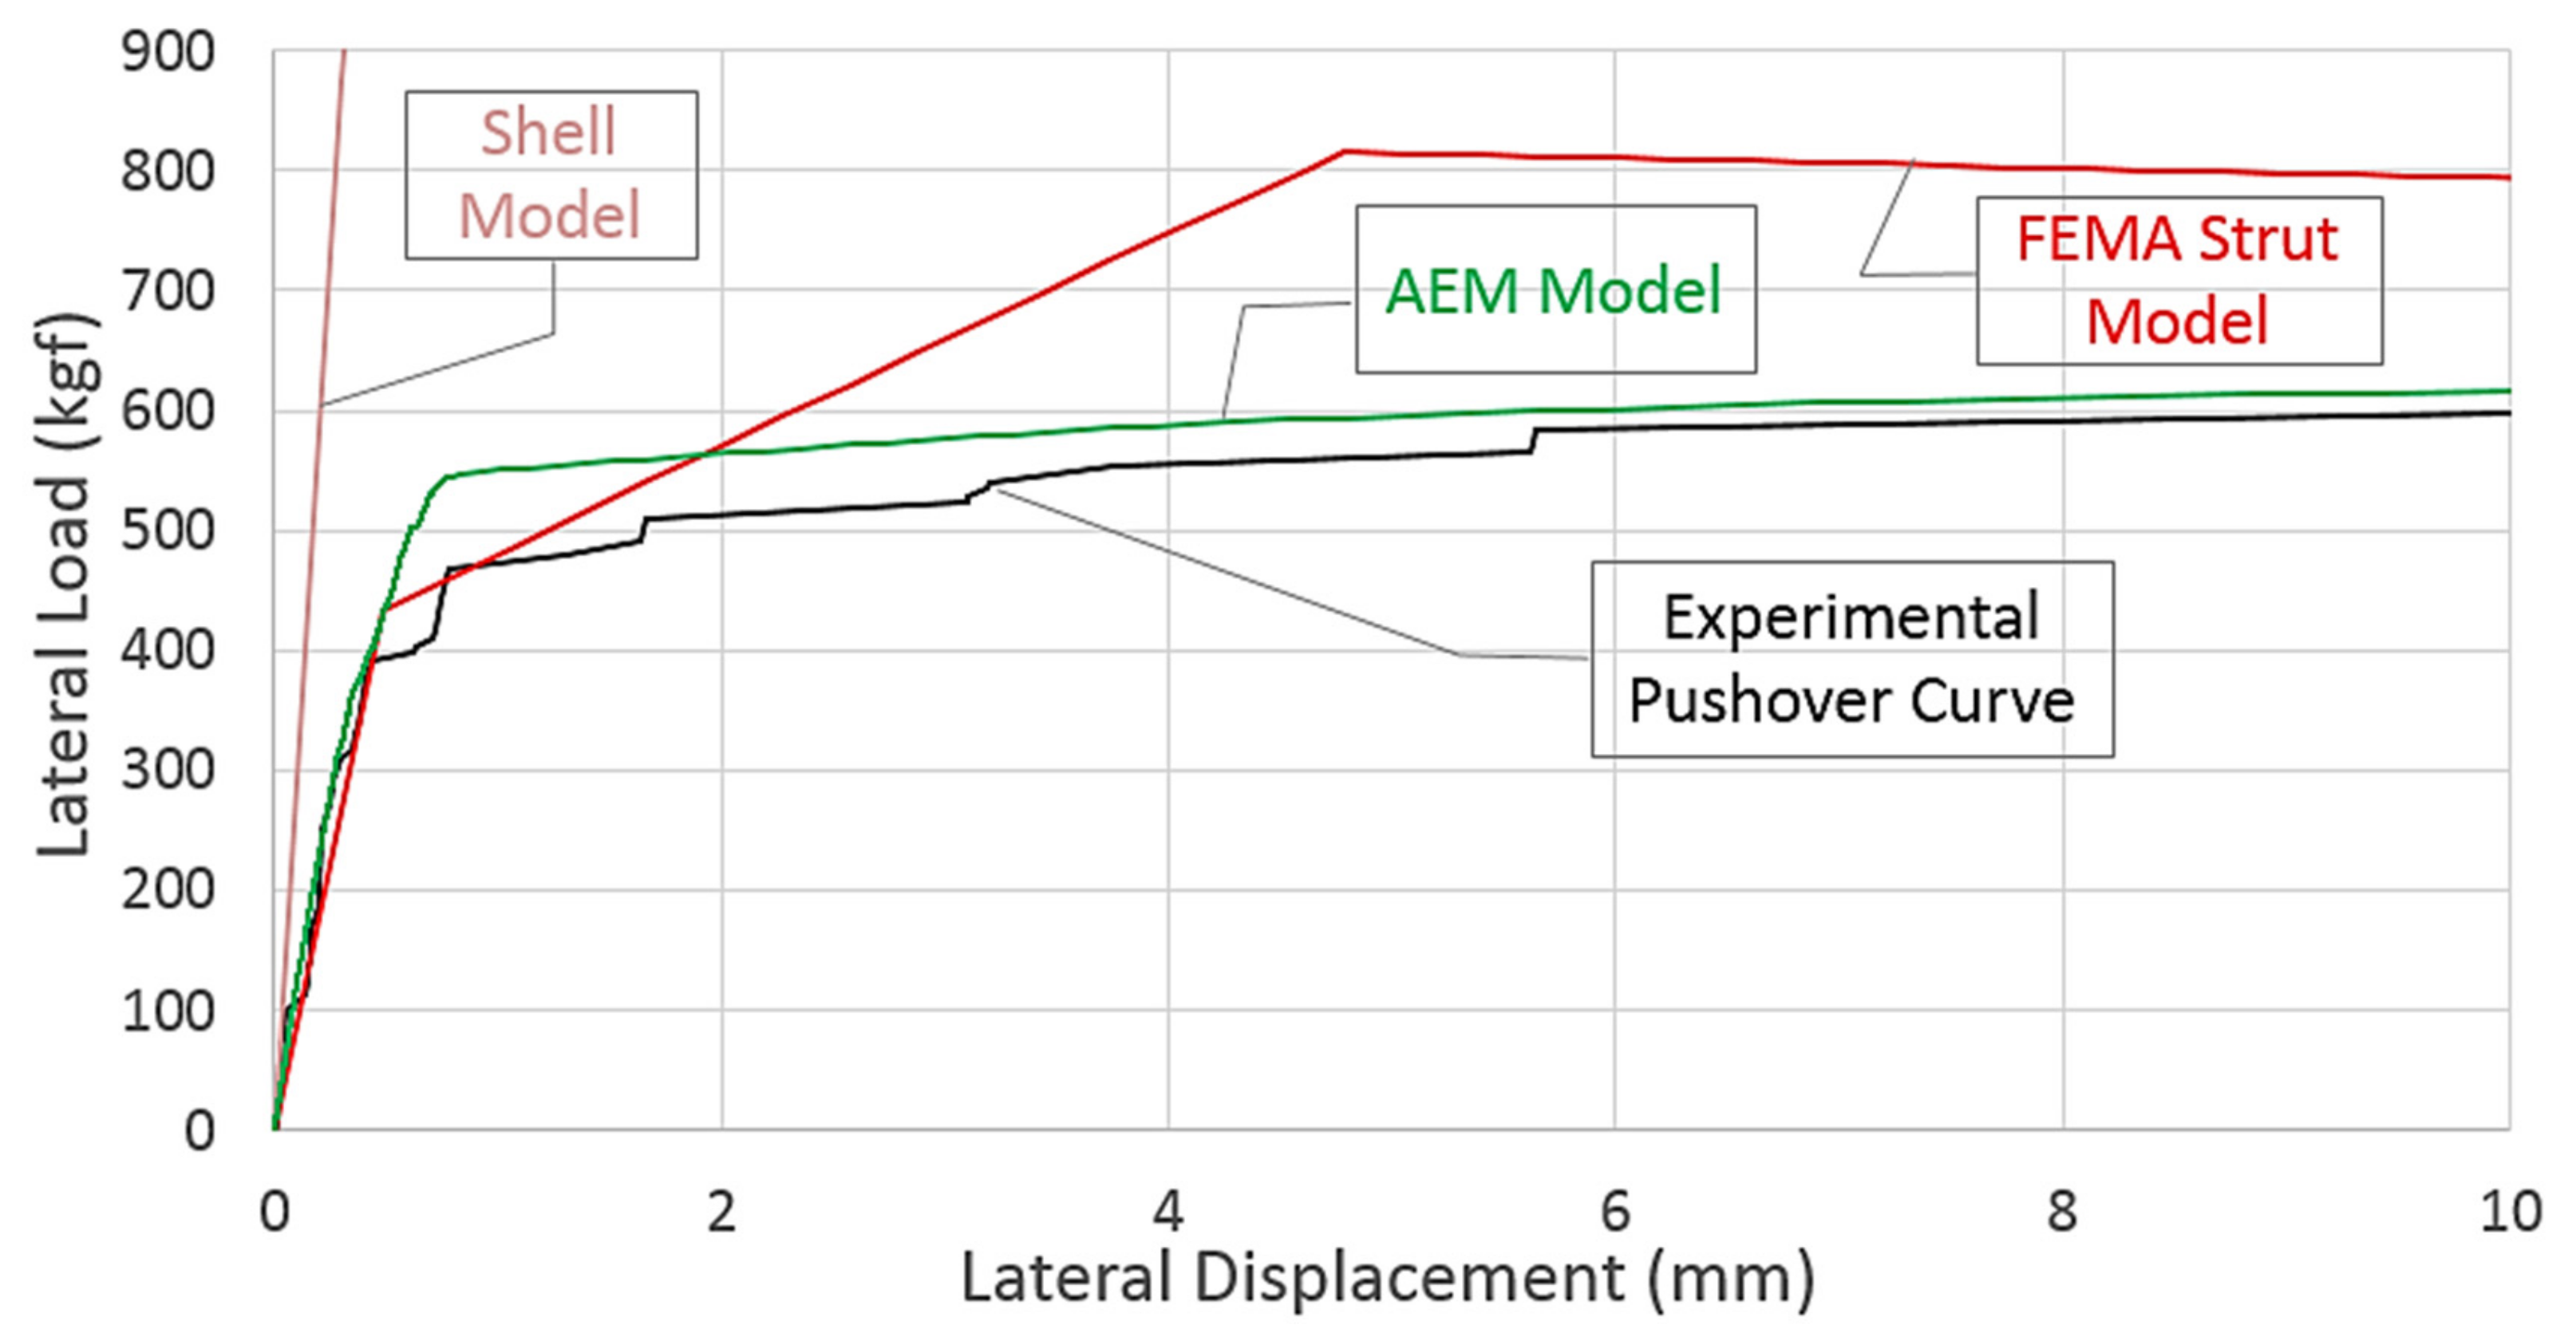
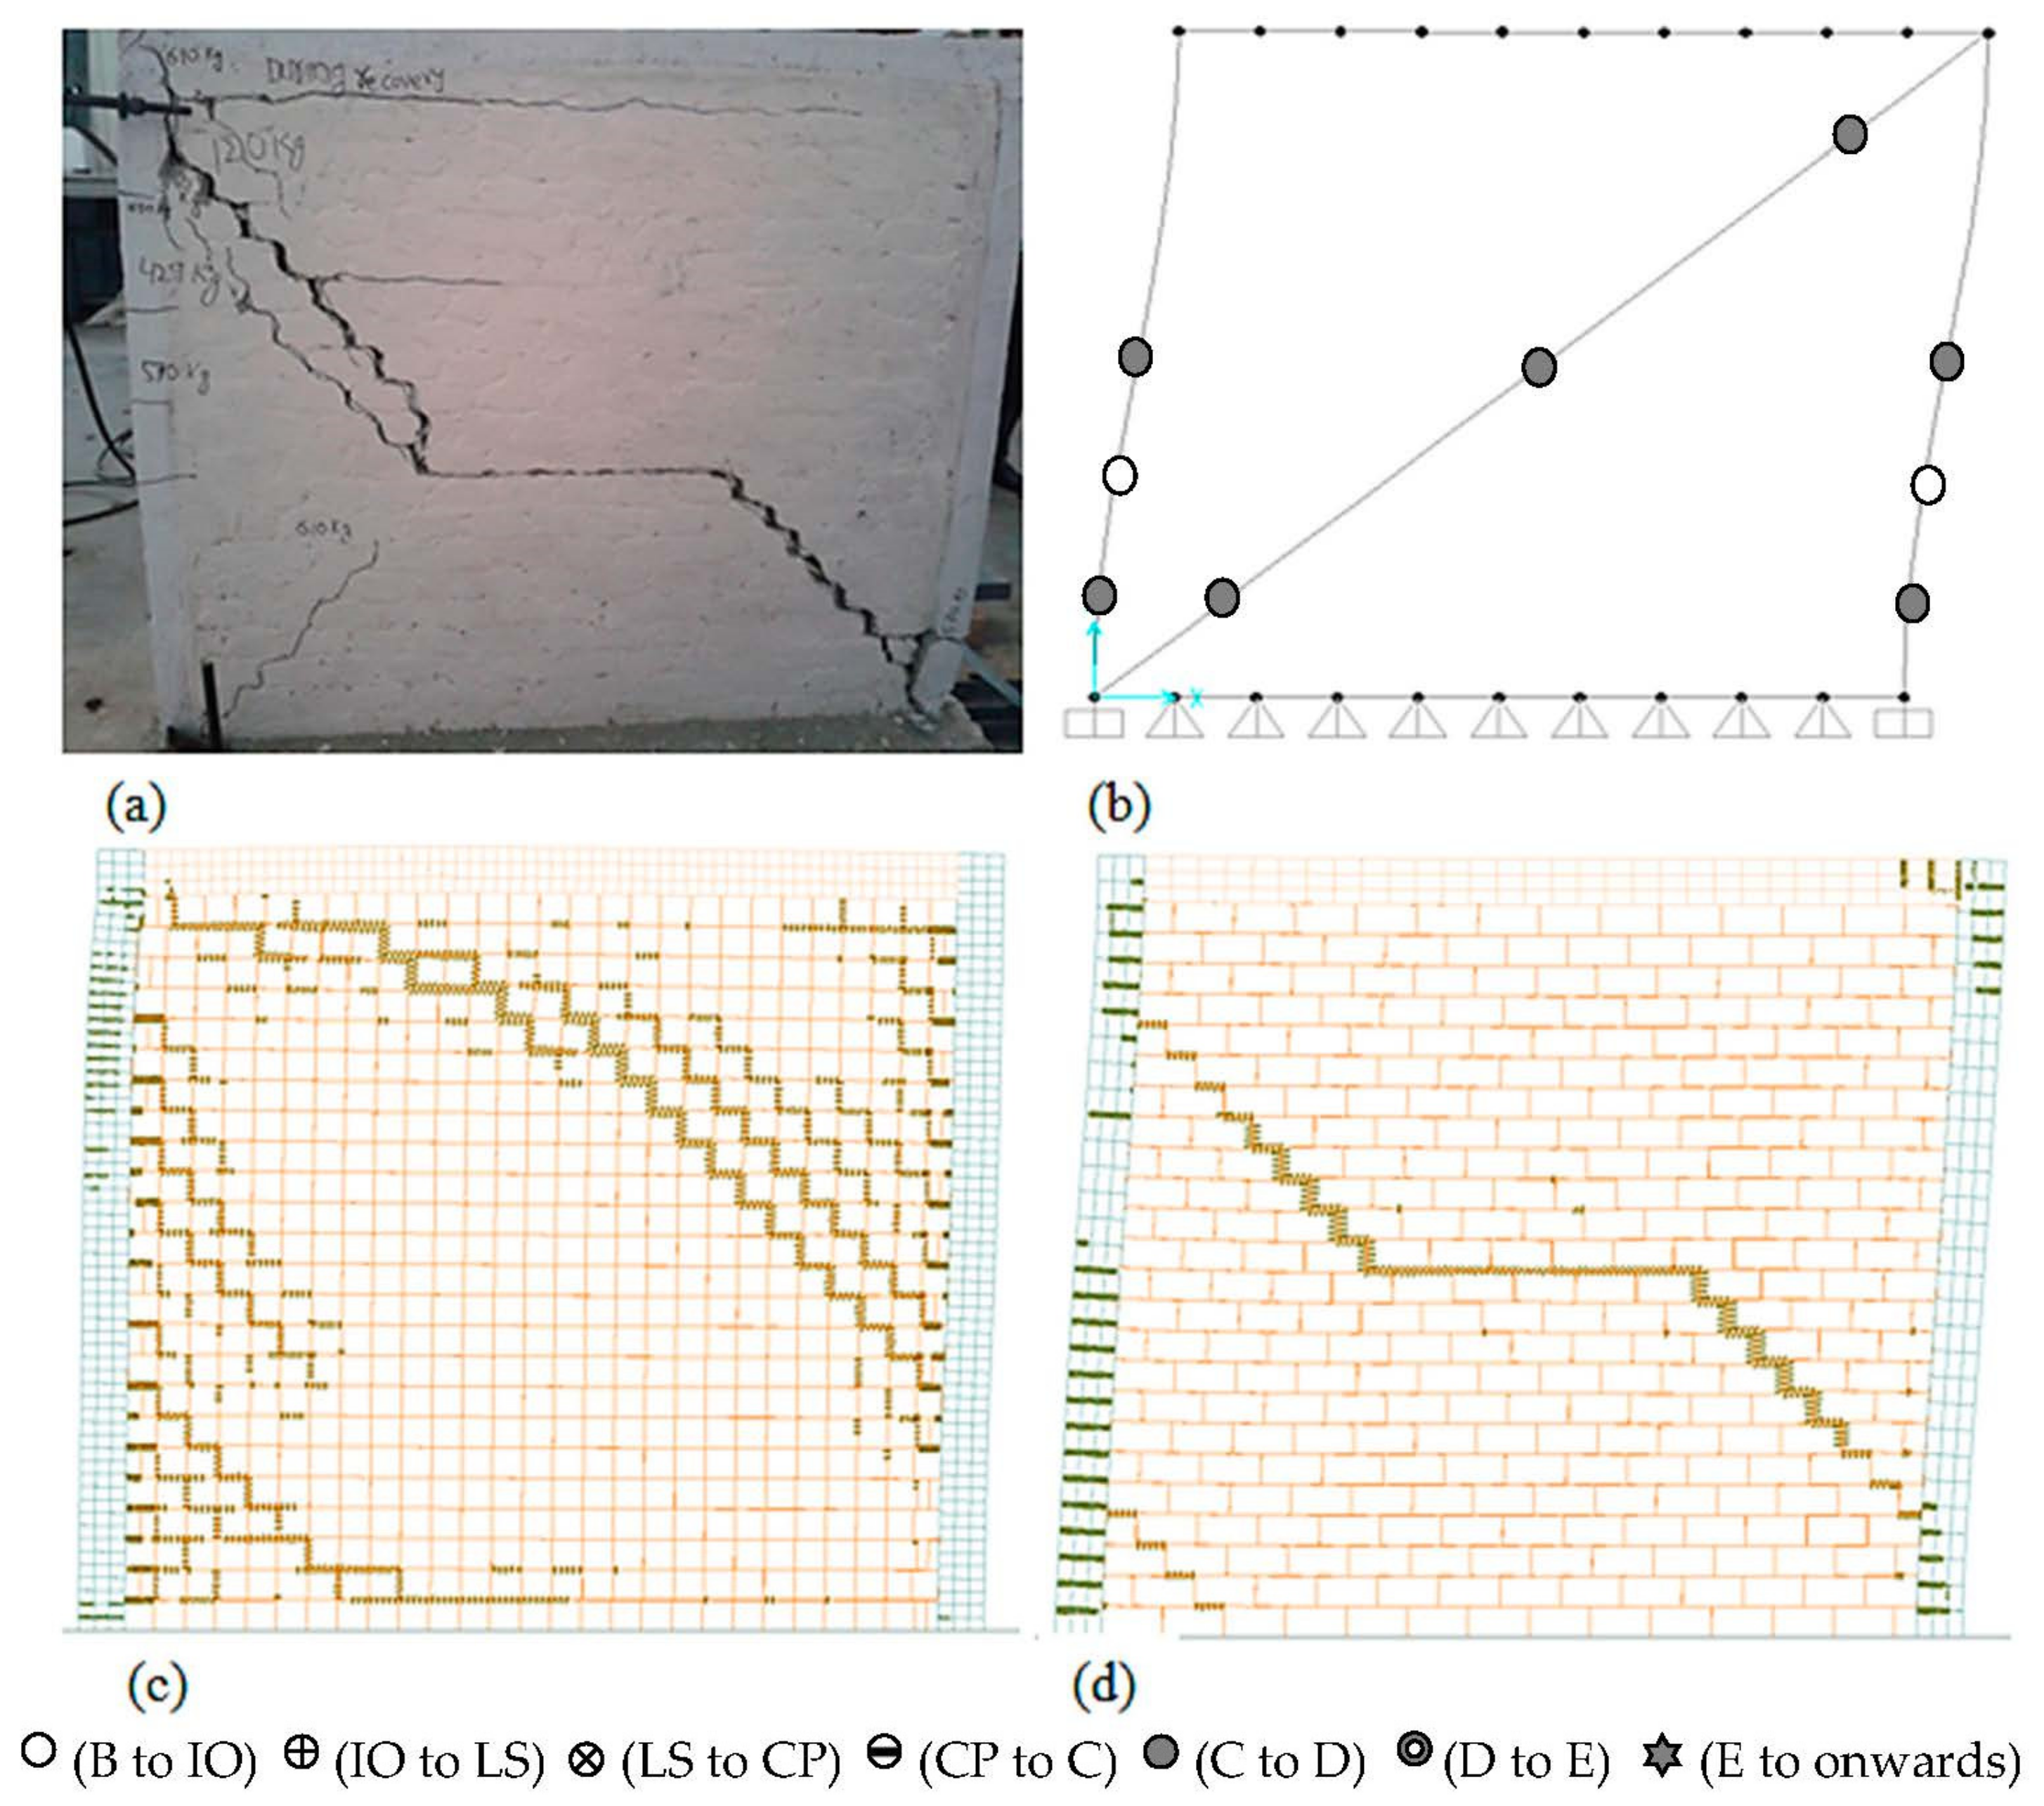
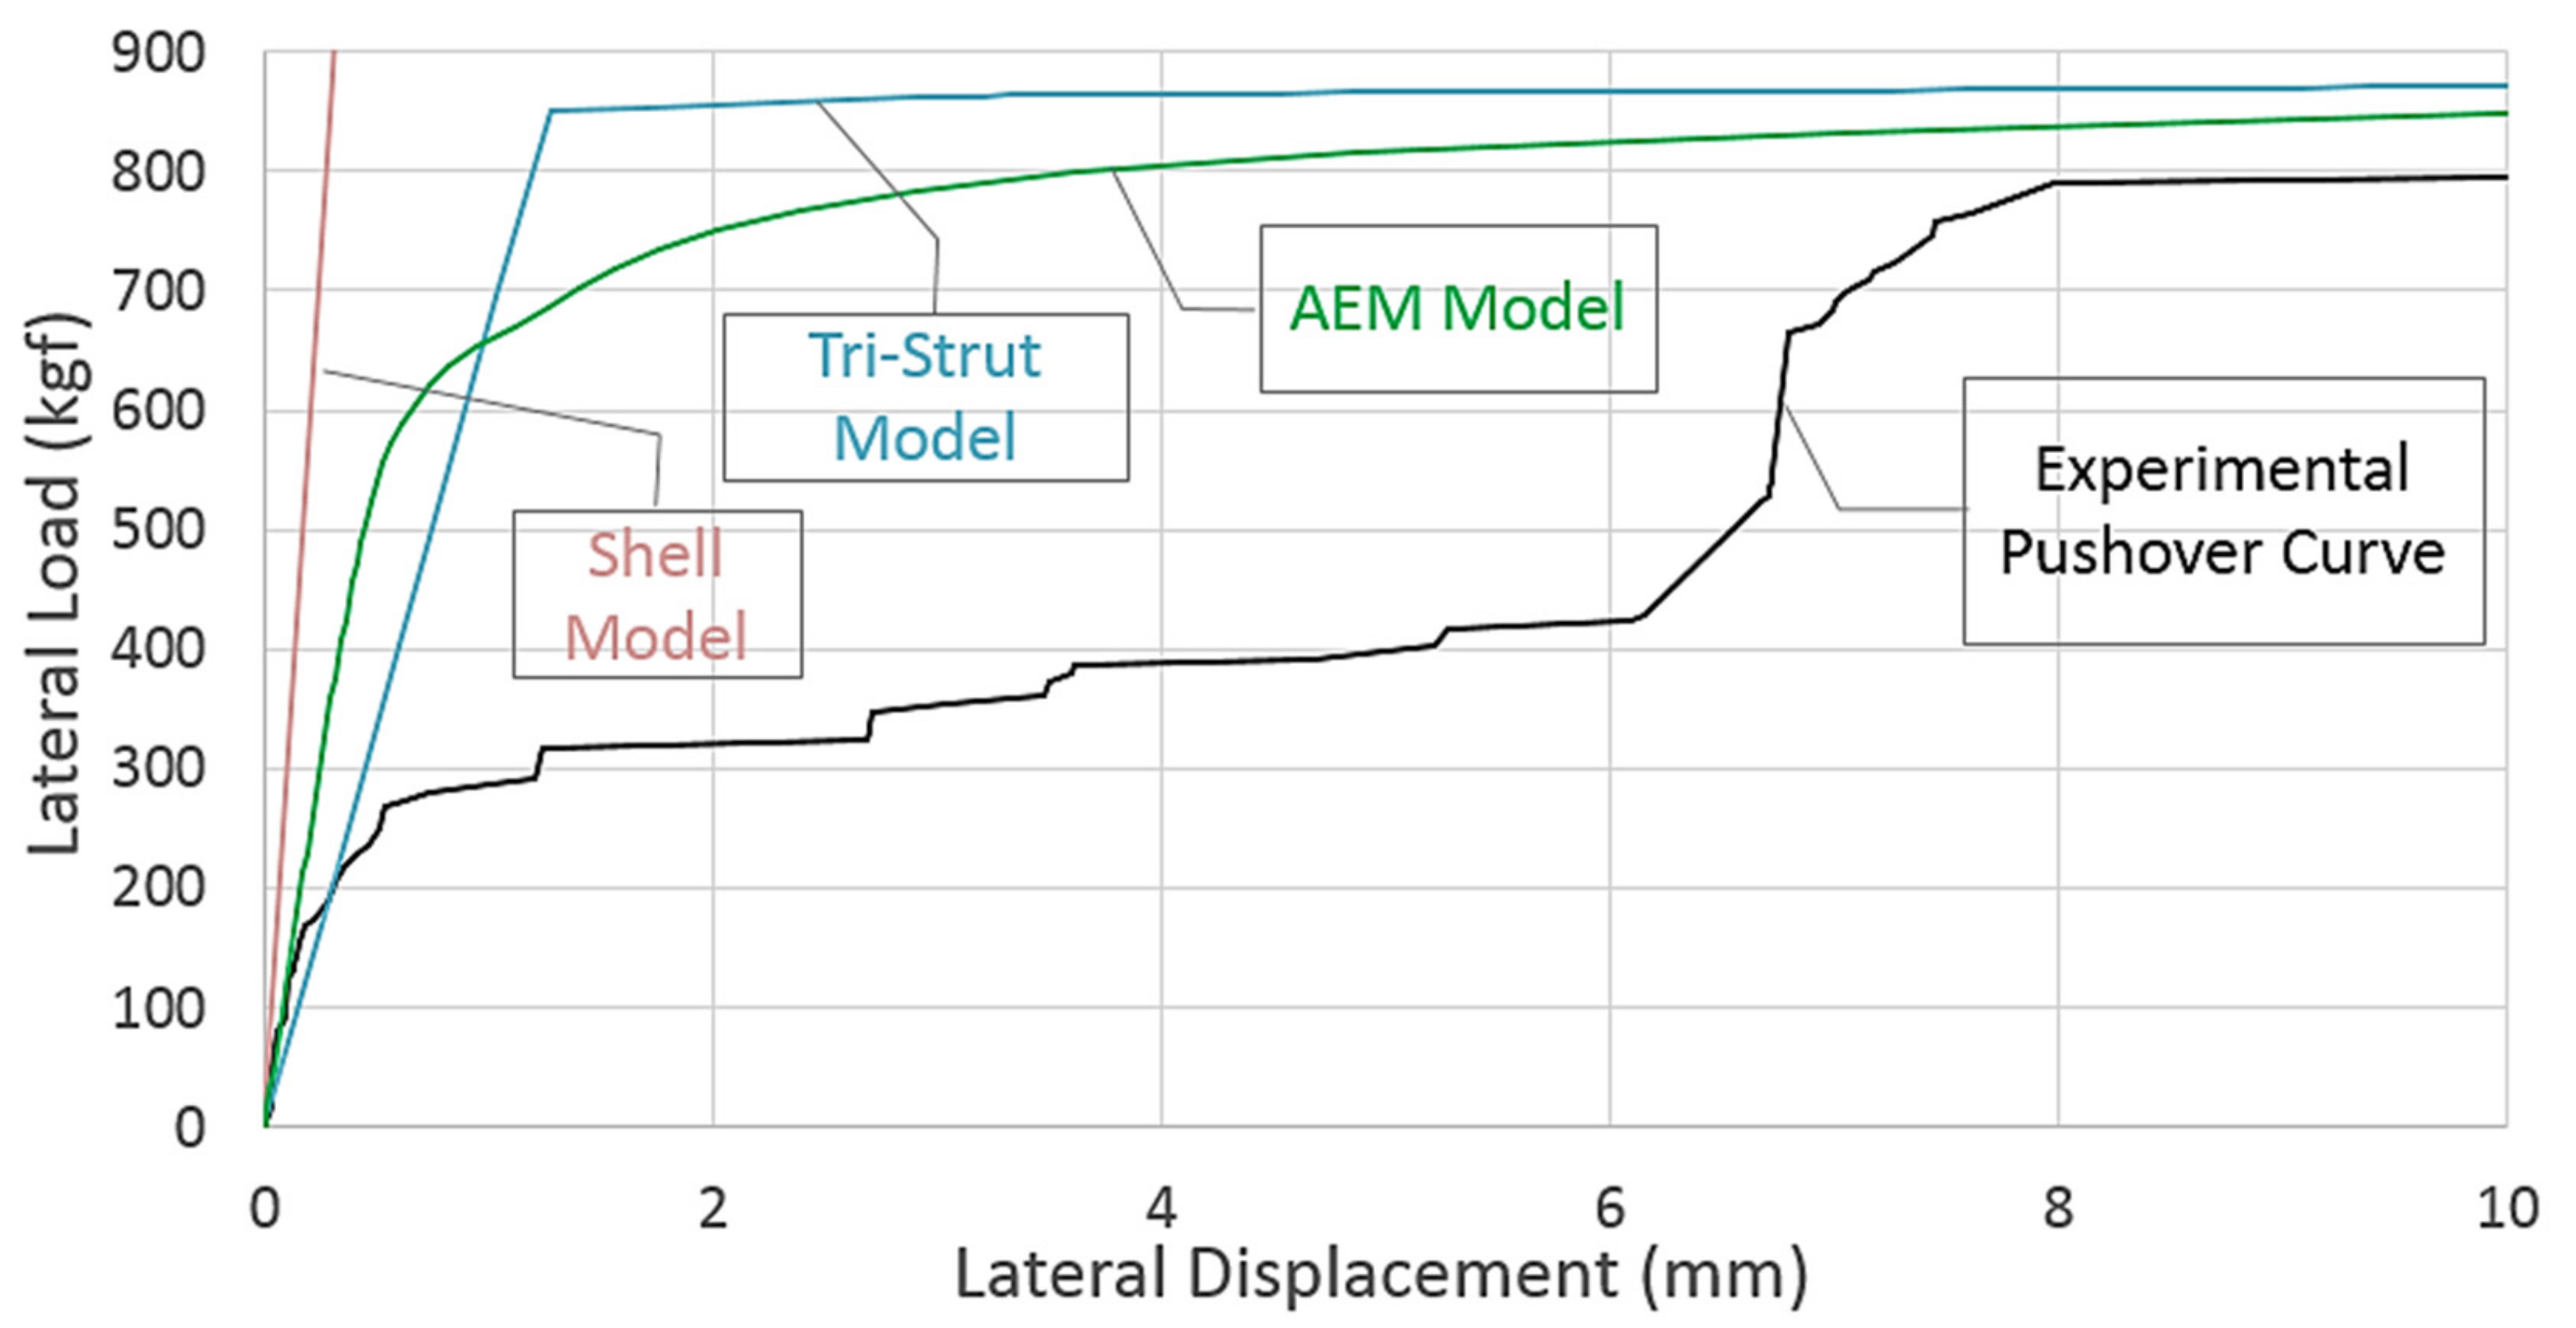
5.2. Nonlinear Static (Pushover) Analysis of Infilled Masonry Wall Structure

The pushover test results of the experiments on IFM conducted by Waqar Ahmad (2013) [26] were compared with the results of the analytical models. The percentage differences for the tangent stiffness were 4.2% and 13.5% for FEMA Strut and AEM, respectively. The percentage differences for strength were 31.2% and 2.8% for FEMA Strut and AEM, respectively. The results of the pushover analysis for the studied analytical models are shown in Figure 15, and a summary of the results is presented in Table 3. Since the AEM is a concept employing a discrete fracture and cracking approach, it thus predicts results fairly close to the experimental results. However, in FEM, the masonry infill wall was modeled as a simplified single compression and tension element; therefore, the FEM tri-strut results are not in good agreement with the experimental values. The trend representing the behavior of the shell model appears interrupted because the shell model was investigated up to a magnitude that was almost double the experimental maximum load. It can be inferred that the shell analytical model overestimates the strength/stiffness of the test structure. However, the computational cost is greatly reduced compared to the sophisticated nonlinear finite element modeling methods. It is also noticeable that the wall structure carried a cold joint, which can be modeled in the AEM approach by introducing a weak mortar joint bed, and the corresponding damage profile obtained was in close agreement with the damage observed experimentally, as shown in Figure 16.

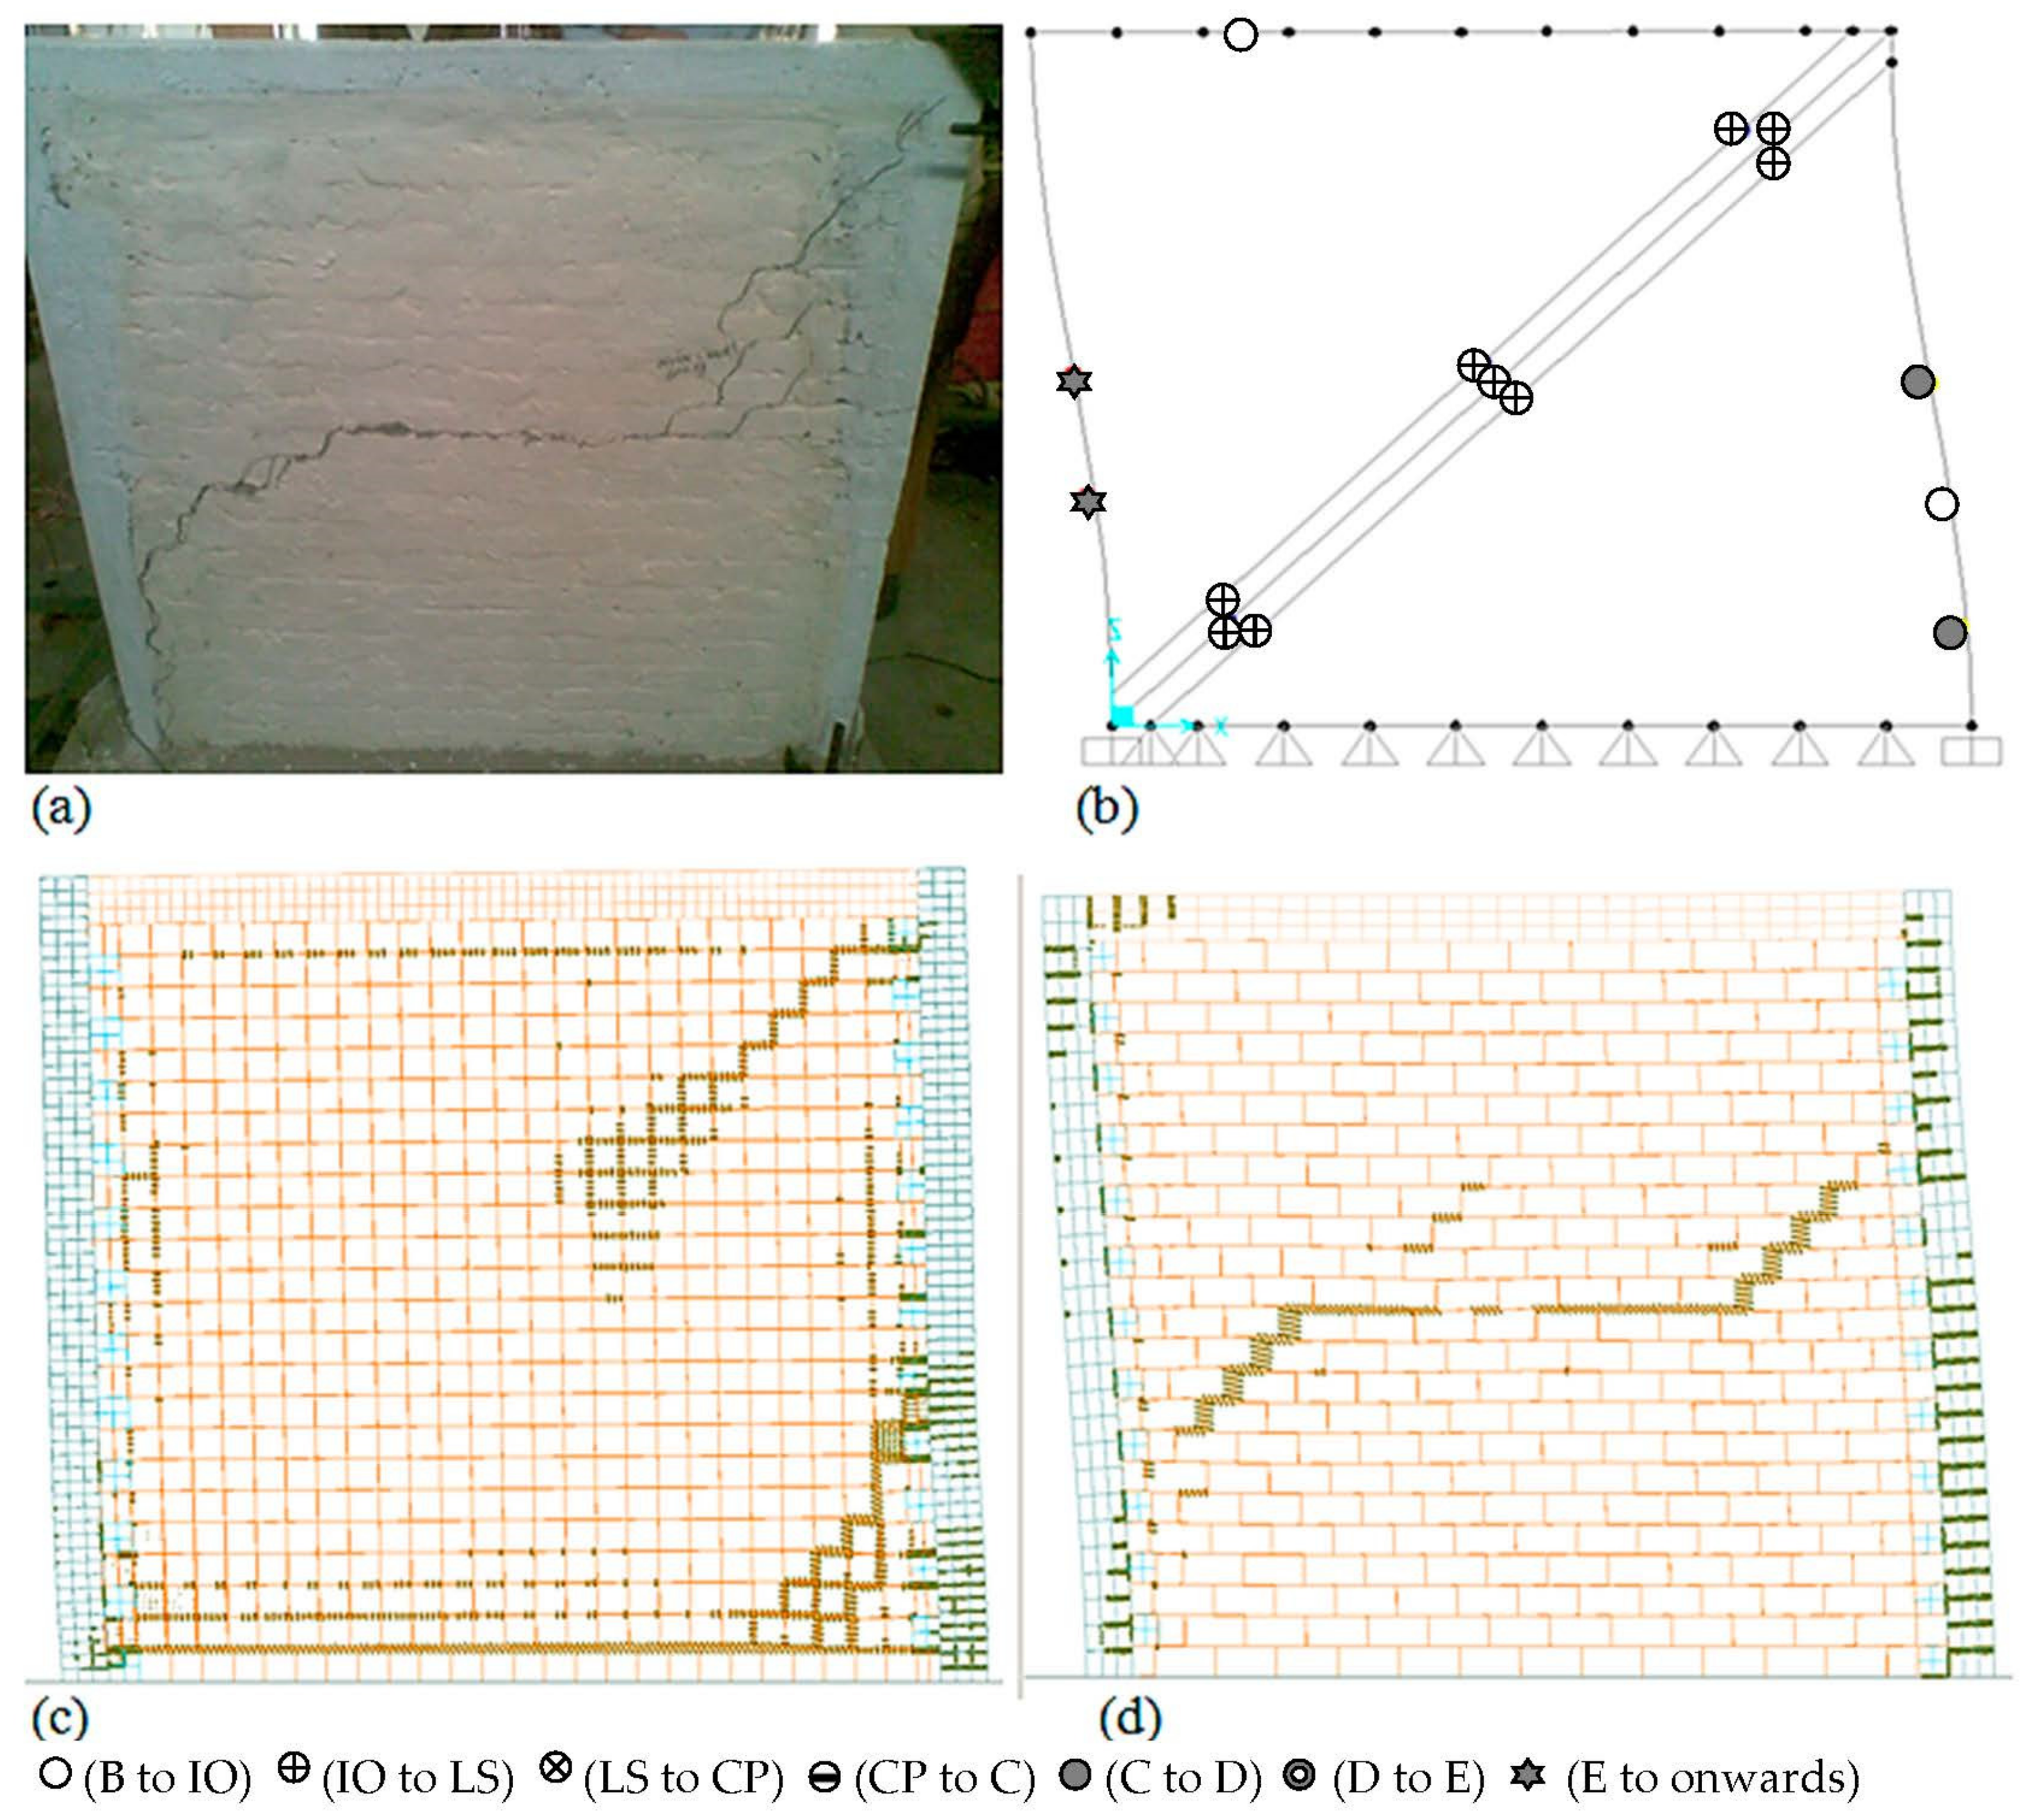
5.3. Nonlinear Static (Pushover) Analysis of Confined Masonry Wall Structure

The results for the pushover test of the CM wall performed by Waqar Ahmad (2013) [26] were compared with the results of analytical models. The percentage differences for tangent stiffness were 40.8% and 34.3% for Tri-strut and AEM, respectively, whereas the percentage differences for strength were 21.9% and 12.0% for Tri-strut and AEM, respectively. The results of the pushover analysis for the studied analytical models are shown in Figure 17 and the summary of results is presented in Table 4. It is evident from Figure 17 that around 7 mm the stiffness increases. Since it was a confined masonry wall, after shear sliding at the interface of the brick and mortar, the confining element and the compression strut perhaps played their role and thus the strain hardening was observed at around 7 mm lateral displacement. The trend representing the behavior of the shell model appears interrupted because the shell model was investigated up to a magnitude that was almost double the experimental maximum load. It can be inferred that the shell analytical model overestimates the strength/stiffness of the test structure. It is evident that the wall structure carried a cold joint, which can be modeled in the AEM approach by introducing a weak mortar joint bed. Since the masonry wall tested in the laboratory had a cold joint, the simulation of the actual observed behavior of the tested specimen in the AEM approach was modeled by introducing a weak mortar joint. The corresponding damage profile obtained is in close agreement with observed experimentally, as shown in Figure 18.

5.4. Nonlinear Time History (Dynamic) Analysis of H-Building Structure

A nonlinear time history analysis of the H-Building was carried out using El-Centro scaled ground Motions with a PGA ranging from 0.5 g to 3.0 g. For the evaluation of the behavior of the H-Building, FEMA Strut and AEM were used. The results from the dynamic analysis of the base shear vs top lateral displacement for various PGAs are presented in Figure 19. The results show that the percentage difference was 9.3% for secant stiffness and 22.6% for strength or peak load. In addition, a dynamic analysis of the infilled and bare frames with AEM was also carried out to provide an insight into the degree of over-strength achieved because of the infills. The results of the dynamic analysis are presented in Figure 20. It can be seen from the graphs that the percentage difference was 50.1% for secant stiffness and 35.6% for peak strength. Figure 21 shows the results of nonlinear time history analysis using the AEM approach overlying the Žarnić et al. (2001) [24] analytical pushover curve. The results in the figure are plotted as a story against the corresponding base shear. The results were found in the fairly acceptable range compared to Žarnić et al.’s (2001) [24] analytical pushover curve. The difference in the curves was due to the cyclic degradation of the structure because the type of loading was stress reversal. The results also depict that the applied hysteresis models were applied for evaluation by the application of stiffness and strength degradation modeling. The summary of the results of the dynamic analysis of FEMA strut, AEM infilled, and AEM bare frame models is presented in Table 5, and the corresponding damage profiles at various PGA levels are presented in Figure 22.

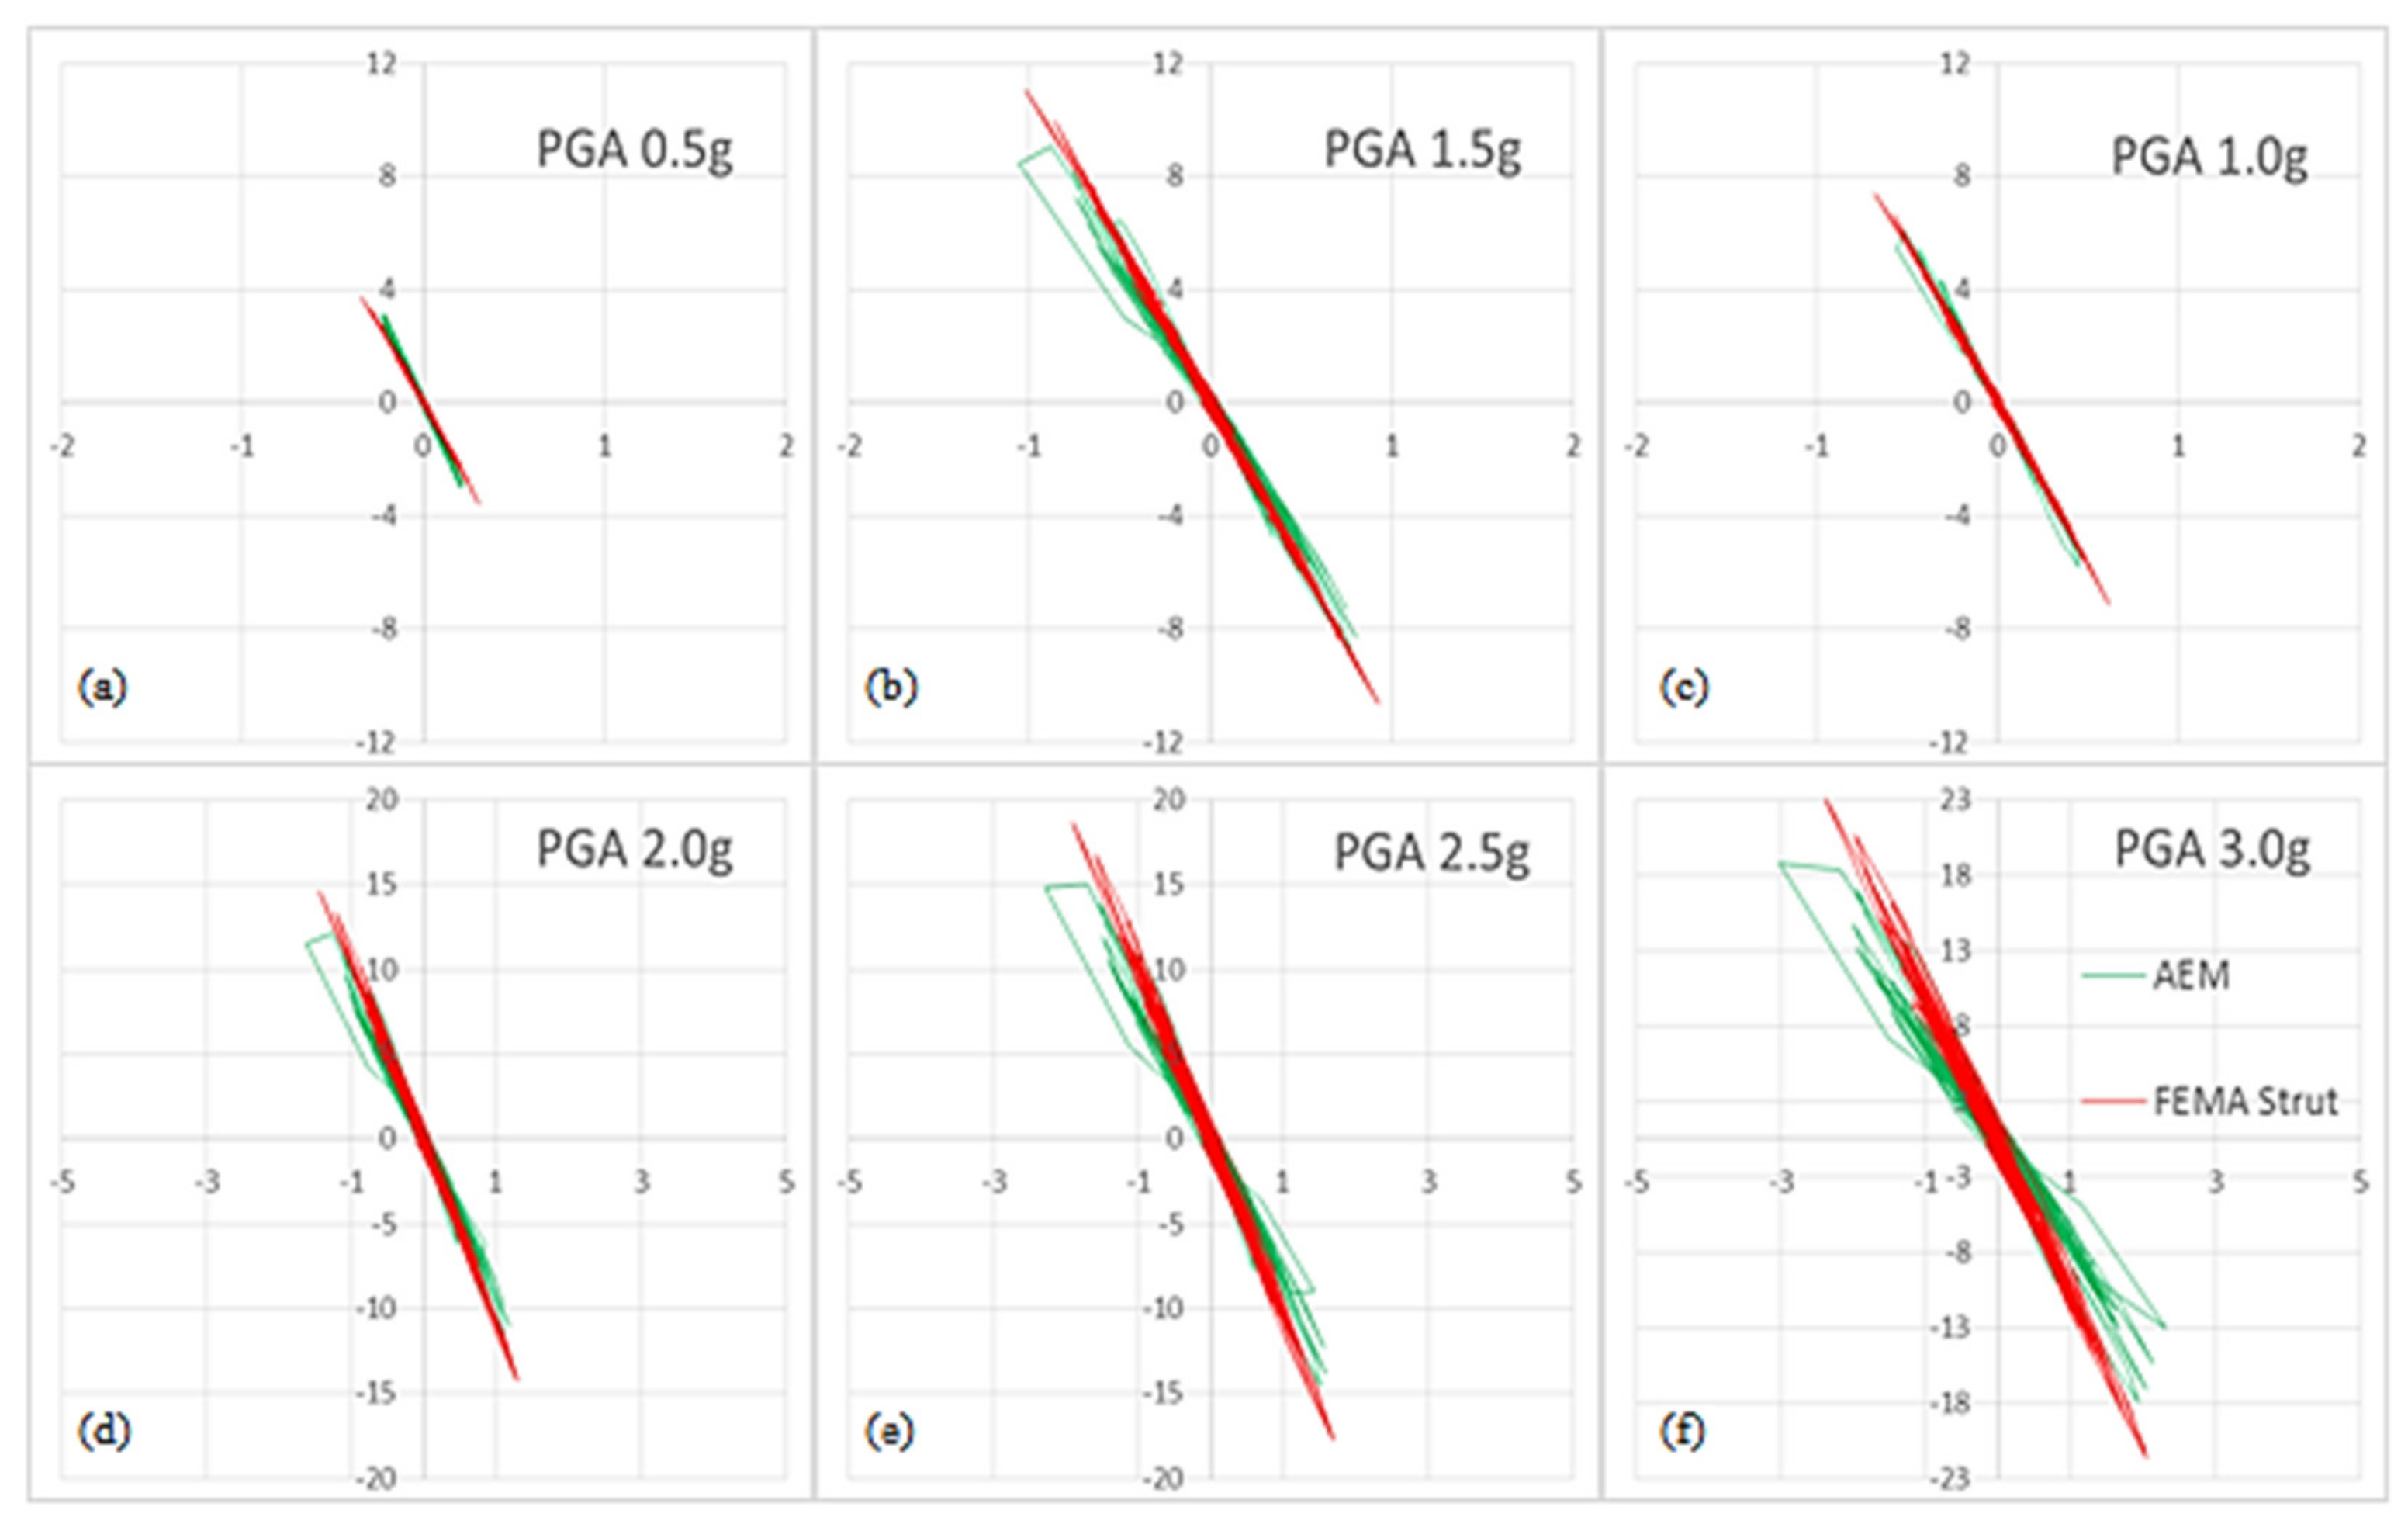
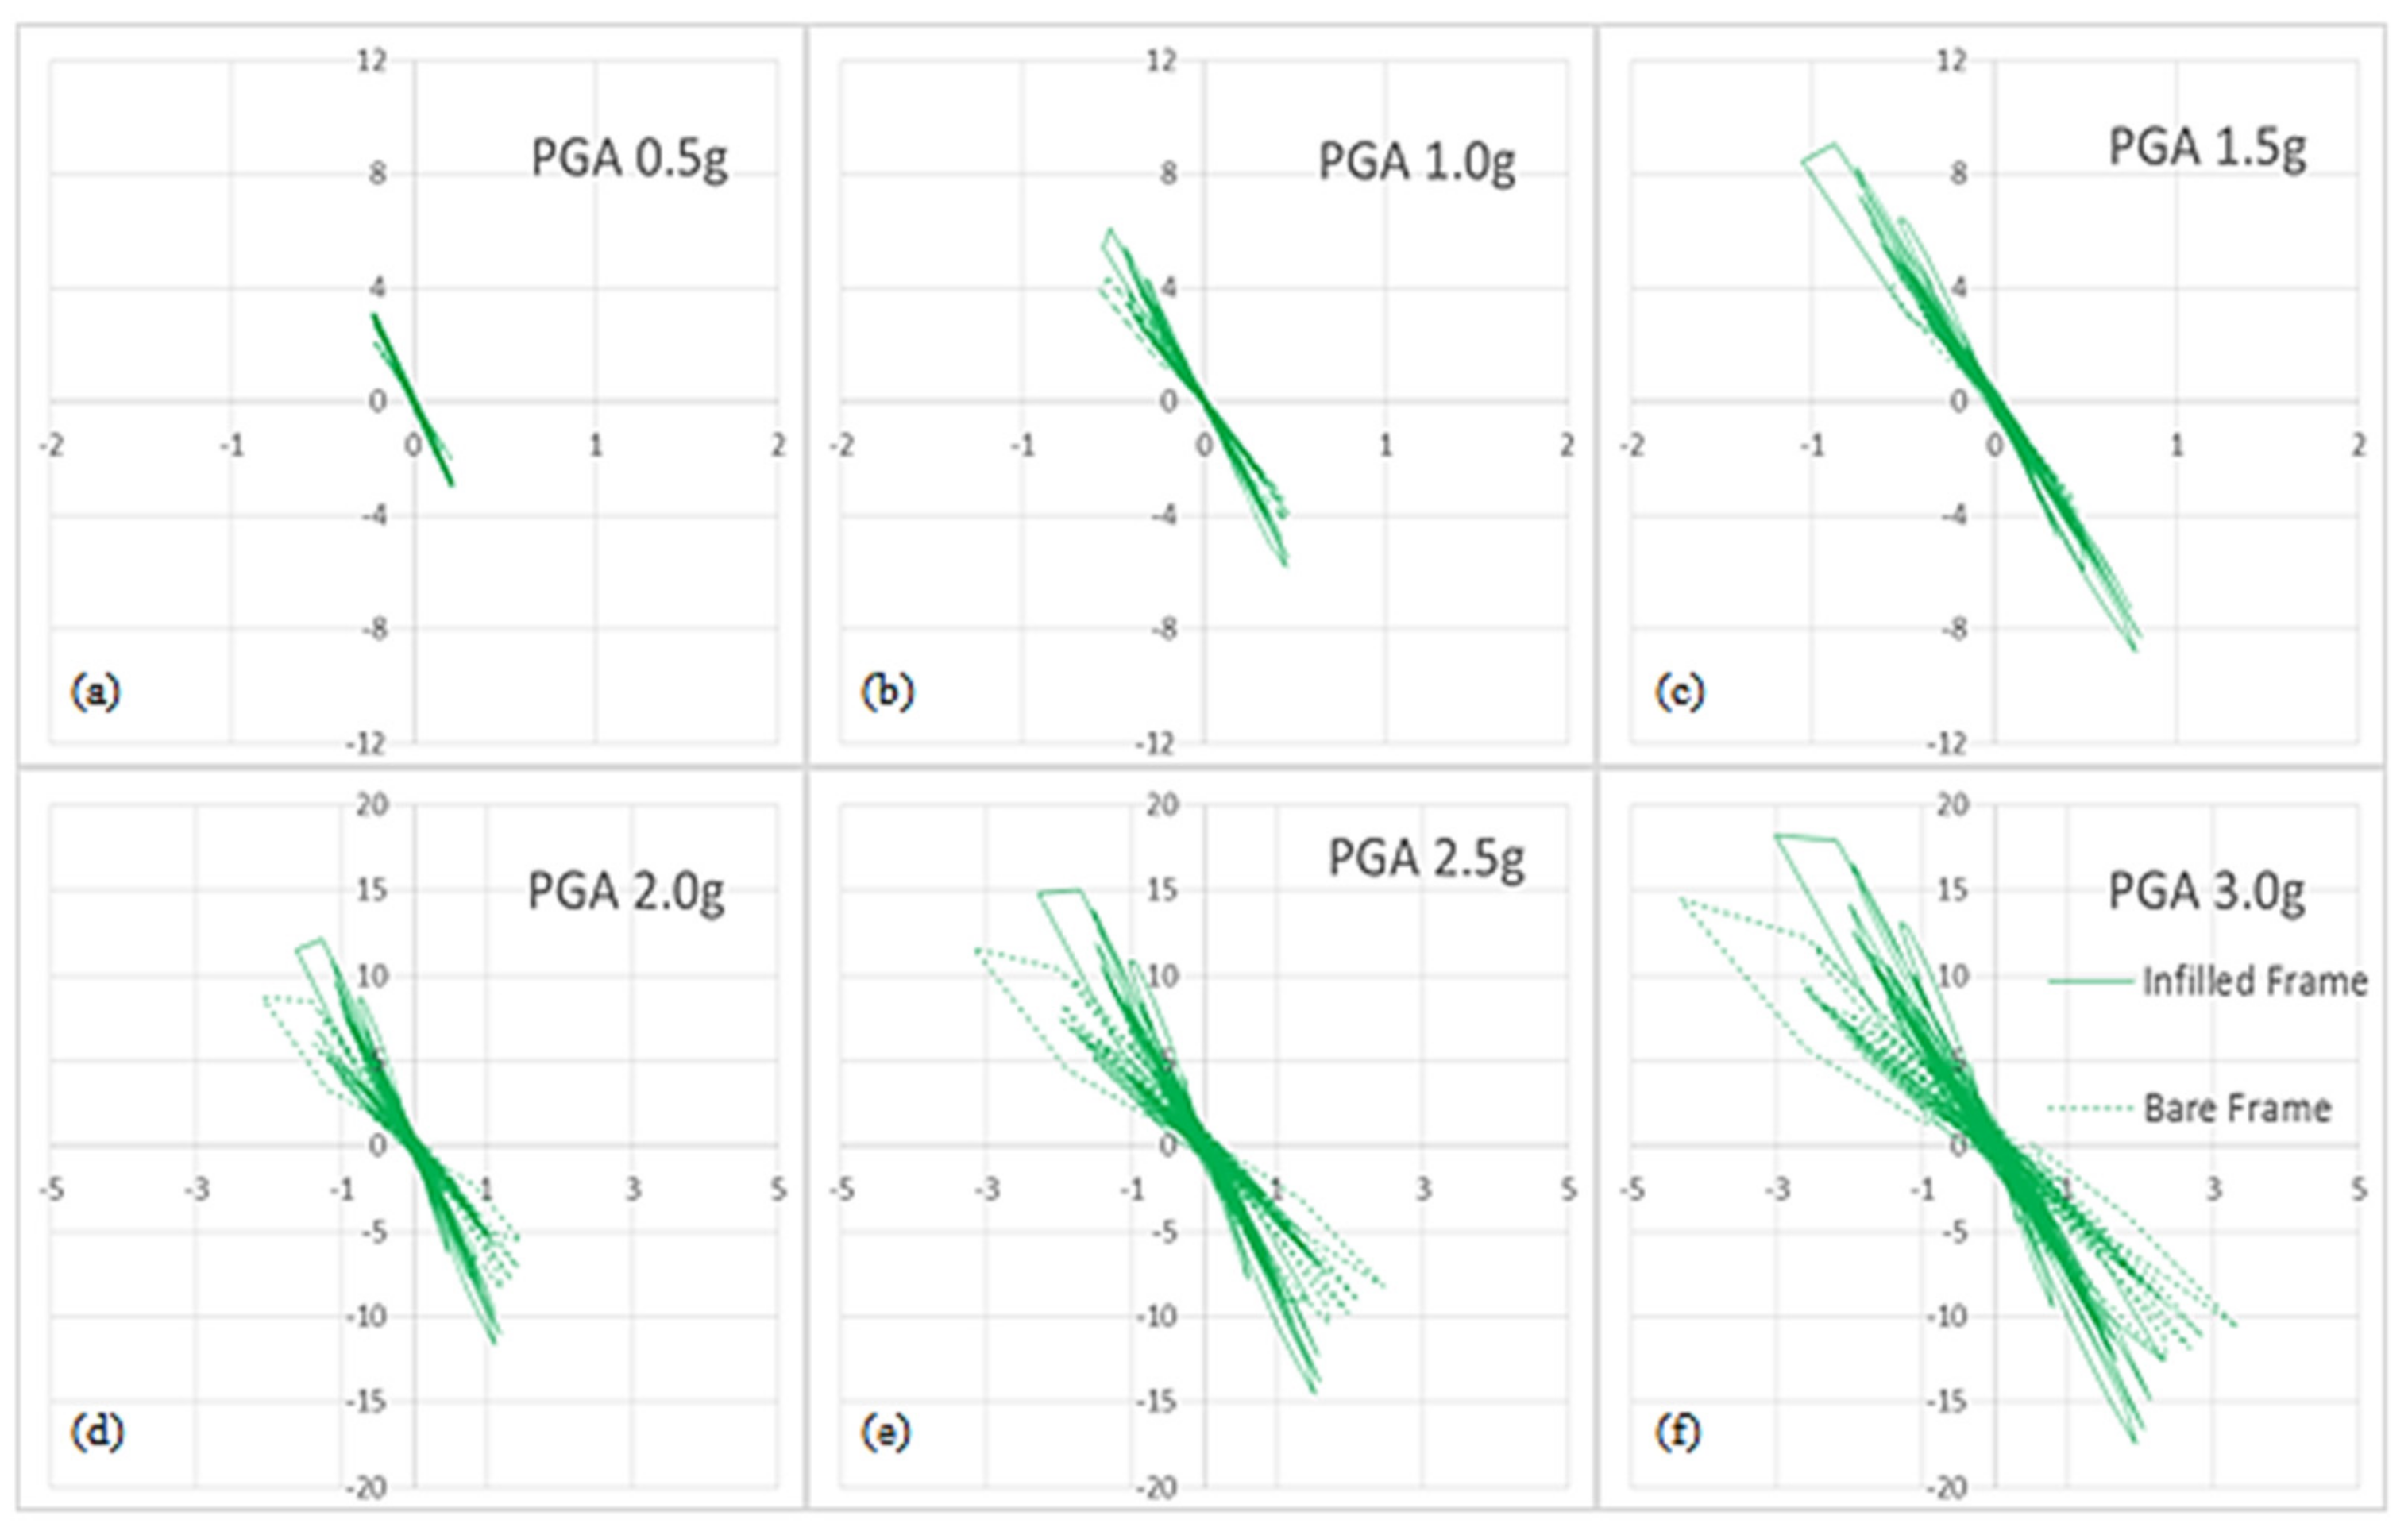
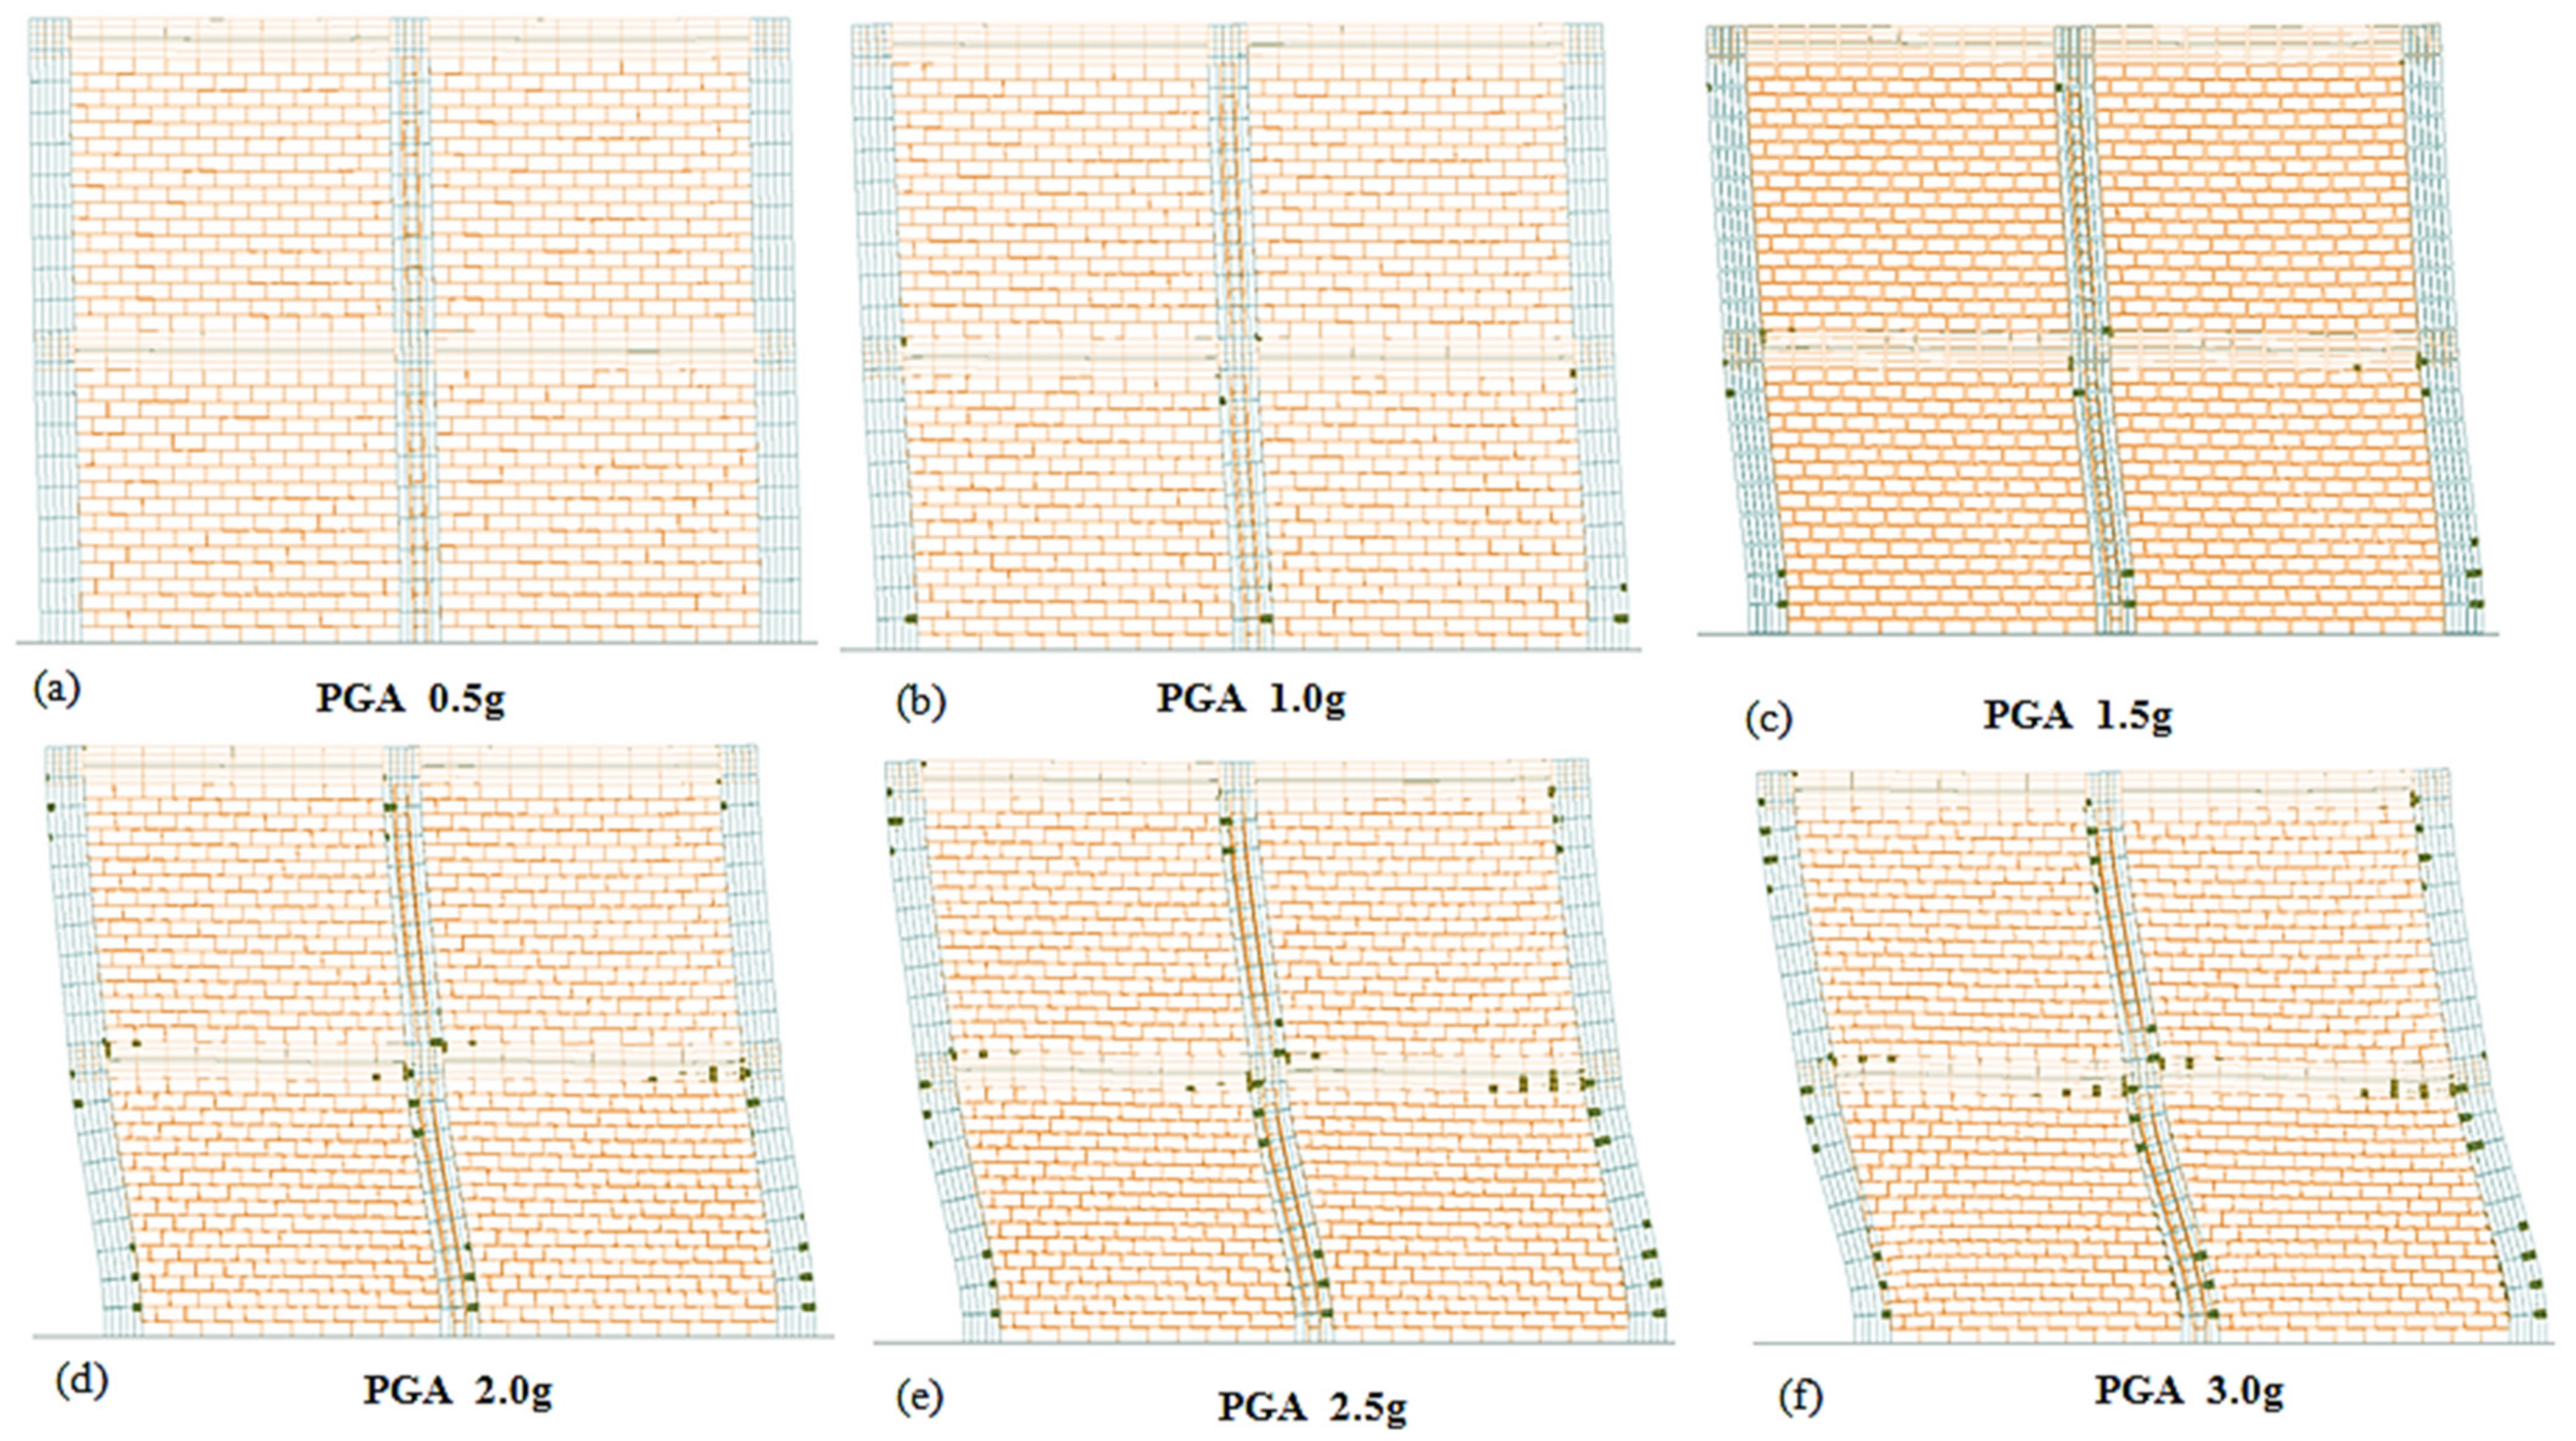
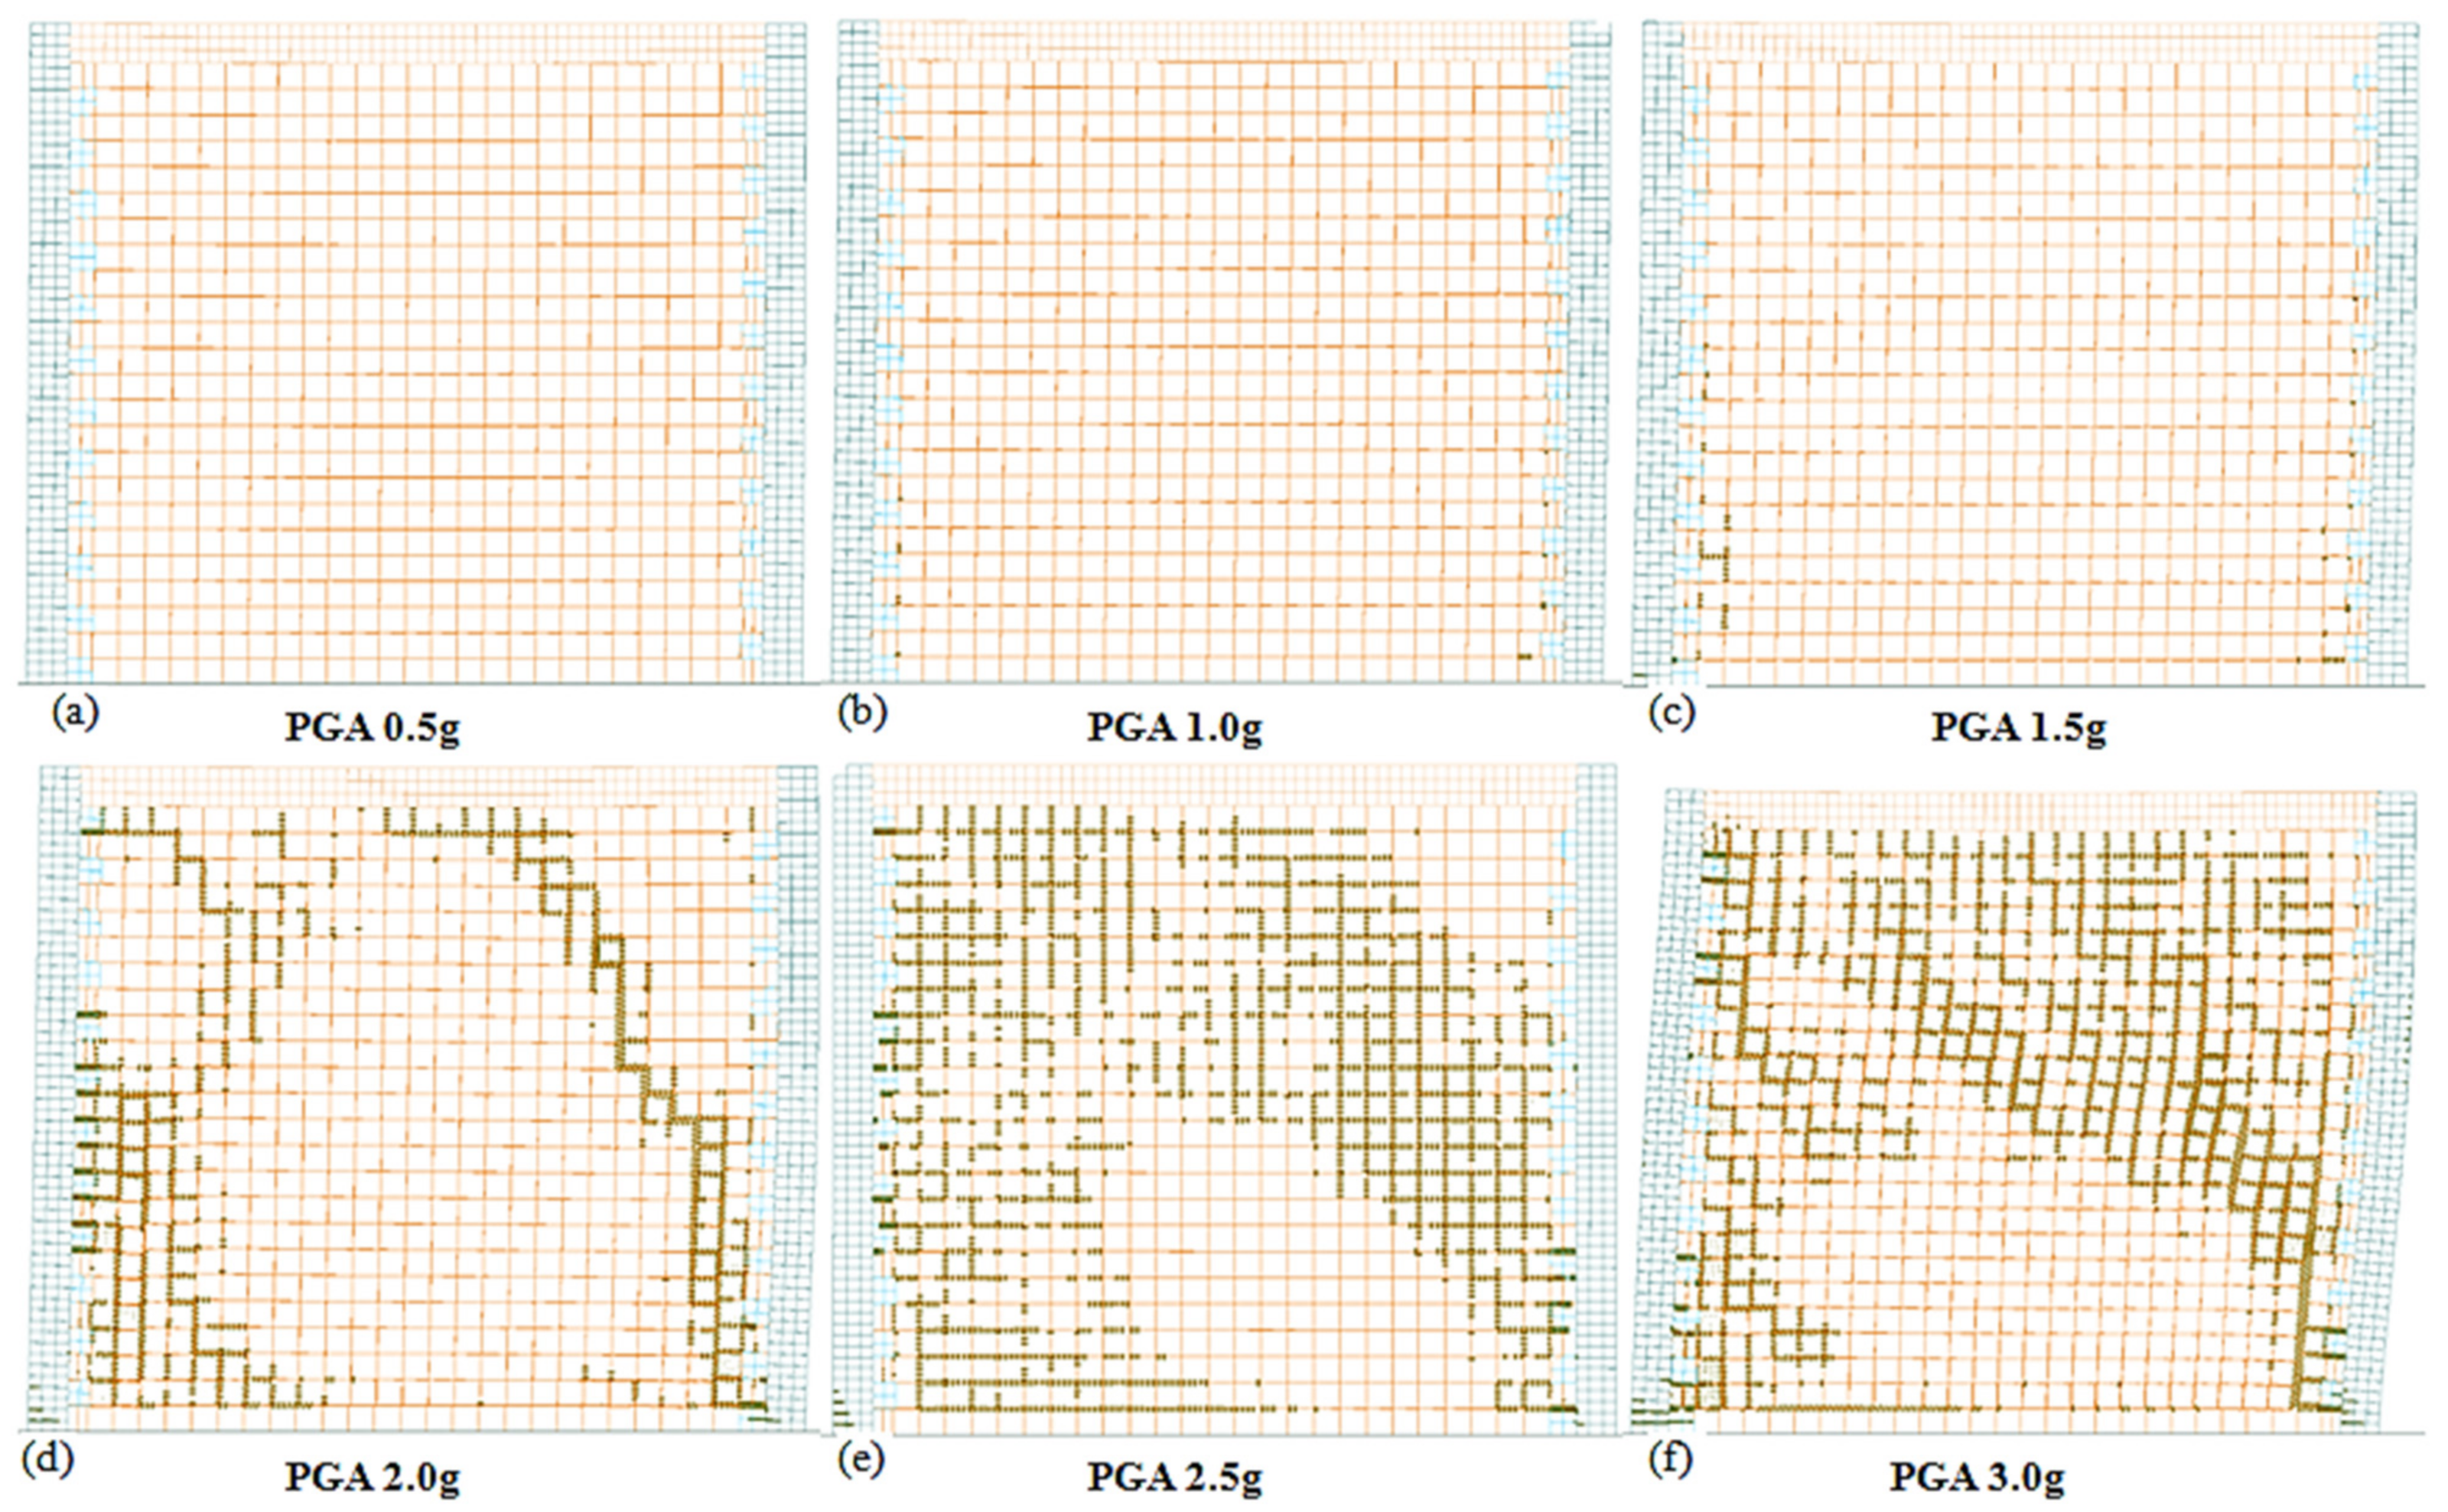
5.5. Nonlinear Time History (Dynamic) Analysis of Infilled Masonry Wall

A nonlinear time history analysis of the IFM wall structure was carried out using El-Centro scaled ground Motions with PGA ranging from 0.5 g to 3.0 g. For the evaluation of the behavior of the IFM wall, FEMA Strut and AEM approaches were used. The results from the dynamic analysis of the base shear vs top lateral displacement for various PGAs are presented in Figure 23. It is evident that for PGAs of 0.5 g, 1.0 g, and 1.5 g, both FEMA Strut and AEM evaluated the response for the complete duration of ground motion. However, for PGAs of 2.0 g, 2.5 g, and 3.0 g, the FEMA strut approach lost convergence after severe damage, reporting structural collapse, whereas the AEM approach continued its evaluation of the response for large lateral displacements and also reported residual deformation. The corresponding damage profiles of an IFM wall at the instant of PGA are presented in Figure 24.

5.6. Nonlinear Time History (Dynamic) Analysis of Confined Masonry Wall

A nonlinear time history analysis of the CM wall structure was carried out using El-Centro scaled ground Motions with PGA ranging from 0.5 g to 3.0 g. For the evaluation of the behavior of the confined masonry wall, Tri-Strut and AEM approaches were used. The results from the dynamic analysis of the base shear vs top lateral displacement for various PGAs are presented in Figure 25. It is evident that for PGAs of 0.5 g, 1.0 g, 1.5 g, and 2.0 g both the Tri-strut and AEM approaches evaluated the response for the complete duration of the ground motion. However, for PGAs of 2.5 g and 3.0 g, the Tri-strut approach lost convergence after severe damage, reporting structural collapse. On the other hand, the AEM approach continued the evaluation of the response for large lateral displacements and reported residual deformation. The corresponding damage profiles of a confined masonry wall at the instant of PGA are presented in Figure 26.
The reason attributed to the non-convergence encountered in the dynamic analysis via the strut approaches is that these approaches are developed for evaluating the pushover behavior of RC frame structure. RC frame structures have a frame lateral stiffness and strength significantly more than that of masonry panels, whether infilled or confined. These approaches involve only the representation of equivalent diagonal masonry; however, in the case of wall structures, frame stiffness and strength are weak or comparable to masonry panel. Residual or non-diagonal masonry also contributes to lateral stiffness and strength, which is not provided by Strut approaches. For the studied wall structures, the frame stiffness and strength are weak or comparable to masonry panel. Thus, this structure(s)’s application of the strut approach implies that non-diagonal masonry is ignored. After the failure of strut elements, the structure collapsed under large lateral displacements loads and it is reported as a non-convergence of solution.

6. Conclusions

A comprehensive numerical study has been carried out for an investigation of the nonlinear behavior of scaled infilled masonry, confined masonry, and RC structures. Numerical modeling of small-scale (1:4 and 1:3) IFM, CM, and RC models has been carried out using FEM and AEM techniques. The conclusions drawn from the numerical study are as follows:
  • This numerical study can be utilized for the evaluation of a small-scale model before the physical test is performed on a shake table.
  • The initial stiffness and post-yield behavior from the shake table test runs performed by Žarnić et al. (2001) [24] were found to be in good agreement with AEM and FEM (Strut) approaches.
  • The differences between the pushover curve Žarnić et al. (2001) [24] and shake table test runs were relatively small; therefore, the applied computational models considered in this study are appropriate.
  • Both the numerical approaches (SAP2000 and ELS) can reasonably simulate small-scale IFM, CM, and RC models under the static lateral loads (pushover analysis).
  • In comparison with FEM, under Dynamic loads, the AEM approach proved more stable during extreme lateral loading/large displacements.

Author Contributions

Conceptualization, A.U.Q. and A.H.; Formal analysis, A.M.R. and M.F.A.; Funding acquisition, Y.E.I.; Supervision, A.U.Q. and A.H.; Validation, Y.E.I.; Writing–Original draft, A.M.R. and M.F.A. All authors have read and agreed to the published version of the manuscript.

Funding

The APC was funded by Prince Sultan University, Riyadh, Saudi Arabia.

Institutional Review Board Statement

Not applicable.

Informed Consent Statement

Not applicable.

Data Availability Statement

Not applicable.

Acknowledgments

The Department of Civil Engineering, University of Engineering and Technology, Lahore, Pakistan, is greatly acknowledged for providing research, financial, and experimental facilities. Experts from the National Engineering Services Pakistan (NESPAK) and Prince Sultan University, Riyadh, Saudi Arabia, are greatly acknowledged for providing technical assistance. The authors would like to thank Prince Sultan University for supporting the publication of the manuscript.

Conflicts of Interest

The authors declare no conflict of interest.

References

  1. Casaburo, A.; Petrone, G.; Franco, F.; De Rosa, S. A Review of Similitude Methods for Structural Engineering. Appl. Mech. Rev. 2019, 71, 030802. [Google Scholar] [CrossRef] [Green Version]
  2. Coutinho, C.P.; Baptista, A.J.; Dias Rodrigues, J. Reduced scale models based on similitude theory: A review up to 2015. Eng. Struct. 2016, 119, 81–94. [Google Scholar] [CrossRef]
  3. Morgado, F.F.R.; Meireles, J.F.F.; Neves, C.M.; Amaral, A.C.S.; Ferreira, M.E.C. Scale development: Ten main limitations and recommendations to improve future research practices. Psicol. Reflex. Crit. 2017, 30, 3. [Google Scholar] [CrossRef] [Green Version]
  4. Ibrahim, Y.E.; Hameed, A.; Qazi, A.U.; Rasool, A.M.; Latif, M.F.; Qureshi, M.U. Experimental response of cold-formed steel stud shear wall with hardboard sheathing under seismic loading. Case Stud. Constr. Mater. 2021, 15, e00574. [Google Scholar] [CrossRef]
  5. Alecci, V.; Ayala, A.G.; De Stefano, M.; Marra, A.M.; Nudo, R.; Stipo, G. Influence of the masonry wall thickness on the outcomes of double flat-jack test: Experimental and numerical investigation. Constr. Build. Mater. 2021, 285, 122912. [Google Scholar] [CrossRef]
  6. Alecci, V.; Barducci, S.; D’Ambrisi, A.; De Stefano, M.; Focacci, F.; Luciano, R.; Penna, R. Shear capacity of masonry panels repaired with composite materials: Experimental and analytical investigations. Compos. Part B Eng. 2019, 171, 61–69. [Google Scholar] [CrossRef]
  7. Alecci, V.; De Stefano, M.; Galassi, S.; Magos, R.; Stipo, G. Confinement of Masonry Columns with Natural Lime-Based Mortar Composite: An Experimental Investigation. Sustainability 2021, 13, 13742. [Google Scholar] [CrossRef]
  8. Tagel-Din, H.; Meguro, K. Analysis of a small scale RC building subjected to shaking table tests using applied element method. In Proceedings of the 12th World Conference on Earthquake Engineering, Auckland, New Zealand, 30 January–4 February 2000. [Google Scholar]
  9. Elwood, K.J.; Moehle, J.P. Shake Table Tests and Analytical Studies on the Gravity Load Collapse of Reinforced Concrete Frames; University of California: Los Angeles, CA, USA, 2003. [Google Scholar]
  10. Li, S.; Zuo, Z.; Zhai, C.; Xu, S.; Xie, L. Shaking table test on the collapse process of a three-story reinforced concrete frame structure. Eng. Struct. 2016, 118, 156–166. [Google Scholar] [CrossRef]
  11. Tong, G.; Lianglong, S.; Zhiliang, C.; Yaowen, H. Shake-Table Tests and Numerical Analysis of Self-Centering Prestressed Concrete Frame. ACI Struct. J. 2019, 116, 3–17. [Google Scholar] [CrossRef]
  12. Grange, S.; Kotronis, P.; Mazars, J. Numerical modelling of the seismic behaviour of a 7-story building: NEES benchmark. Mater. Struct. 2008, 42, 1433. [Google Scholar] [CrossRef]
  13. Amer, O.; Aita, D.; Mohamed, E.K.; Torky, A.; Shawky, A. Multi-Leaf Stone Masonry Walls in Egypt: A Legend. Heritage 2021, 4, 156. [Google Scholar] [CrossRef]
  14. Joyklad, P.; Ali, N.; Rashid, M.U.; Hussain, Q.; Magbool, H.M.; Elnemr, A.; Chaiyasarn, K. Strength enhancement of interlocking hollow brick masonry walls with low-cost mortar and wire mesh. Infrastructures 2021, 6, 166. [Google Scholar] [CrossRef]
  15. Jeon, J.-S.; Park, J.-H.; DesRoches, R. Seismic fragility of lightly reinforced concrete frames with masonry infills. Earthq. Eng. Struct. Dyn. 2015, 44, 1783–1803. [Google Scholar] [CrossRef]
  16. Solarino, F.; Giresini, L. Fragility curves and seismic demand hazard analysis of rocking walls restrained with elasto-plastic ties. Earthq. Eng. Struct. Dyn. 2021, 50, 3602–3622. [Google Scholar] [CrossRef]
  17. Giresini, L.; Taddei, F.; Solarino, F.; Mueller, G.; Croce, P. Influence of Stiffness and Damping Parameters of Passive Seismic Control Devices in One-Sided Rocking of Masonry Walls. J. Struct. Eng. 2022, 148, 4021257. [Google Scholar] [CrossRef]
  18. Giresini, L.; Solarino, F.; Taddei, F.; Mueller, G. Experimental estimation of energy dissipation in rocking masonry walls restrained by an innovative seismic dissipator (LICORD). Bull. Earthq. Eng. 2021, 19, 2265–2289. [Google Scholar] [CrossRef]
  19. Zampieri, P.; Piazzon, R.; Pantò, B.; Pellegrino, C. A Discrete-Macro-Element-Model for the in-Plane Analysis of Masonry Structures Strengthened by Frcms. In Proceedings of the 8th International Conference on Computational Methods in Structural Dynamics and Earthquake Engineering, Athens, Greece, 28–30 June 2021; pp. 309–317. [Google Scholar] [CrossRef]
  20. Borah, B.; Singhal, V.; Kaushik, H.B. Sustainable housing using confined masonry buildings. SN Appl. Sci. 2019, 1, 983. [Google Scholar] [CrossRef] [Green Version]
  21. Khan, N.A.; Monti, G.; Nuti, C.; Vailati, M. Effects of infills in the seismic performance of an RC factory building in Pakistan. Buildings 2021, 11, 276. [Google Scholar] [CrossRef]
  22. Ahmed, A.; Ahmad, I.; Shahzada, K.; Naqash, M.T.; Alam, B.; Fahad, M.; Khan, S.W. Seismic Capacity Assessment of Confined Brick Masonry Building: An Experimental Approach. Shock Vib. 2018, 2018, 4756352. [Google Scholar] [CrossRef] [Green Version]
  23. Hameed, A.; Qazi, A.; Rasool, A.M. Seismic Performance of Low to Medium Rise Reinforced Concrete Buildings using Passive Energy Dissipation Devices. Pakistan J. Eng. Appl. Sci. 2014, 14, 1–16. [Google Scholar]
  24. Žarnić, R.; Gostič, S.; Crewe, A.; Taylor, C. Shaking table tests of 1:4 reduced-scale models of masonry infilled reinforced concrete frame buildings. Earthq. Eng. Struct. Dyn. 2001, 30, 819–834. [Google Scholar] [CrossRef]
  25. Idrizi, I.; Idrizi, N.; Idrizi, Z.; Idrizi, S.; Idrizi, I. Effect of infill walls in structural response of RC buildings. In Challenges, Opportunities and Solutions in Structural Engineering and Construction; Nader Ghafoori, Ed.; CRC Press: London, UK, 2009. [Google Scholar]
  26. Waqar, A. Shake Table Testing of Infilled Block Masonry Model; University of Engineering and Technology: Lahore, Pakistan, 2013. [Google Scholar]
  27. Blagojević, P.; Brzev, S.; Cvetković, R. Simplified seismic assessment of unreinforced masonry residential buildings in the Balkans: The case of Serbia. Buildings 2021, 11, 392. [Google Scholar] [CrossRef]
  28. Ma, P.; Yao, J.; Hu, Y. Numerical Analysis of Different Influencing Factors on the In-Plane Failure Mode of Unreinforced Masonry (URM) Structures. Buildings 2022, 12, 183. [Google Scholar] [CrossRef]
  29. Nwofor, T. Numerical micro-modeling of masonry infilled frames. Adv. Appl. Sci. Res. 2012, 4, 764–771. [Google Scholar]
  30. Zendaoui, A.; Kadid, A.; Yahiaoui, D. Comparison of Different Numerical Models of RC Elements for Predicting the Seismic Performance of Structures. Int. J. Concr. Struct. Mater. 2016, 10, 461–478. [Google Scholar] [CrossRef] [Green Version]
  31. Mucedero, G.; Perrone, D.; Brunesi, E.; Monteiro, R. Numerical Modelling and Validation of the Response of Masonry Infilled RC Frames Using Experimental Testing Results. Buildings 2020, 10, 182. [Google Scholar] [CrossRef]
  32. Ahmed, H.A.; Shahzada, K. Numerical modeling of confined brick masonry structures with parametric analysis and energy absorption calculation. Int. J. Prot. Struct. 2020, 12, 129–152. [Google Scholar] [CrossRef]
  33. Filippou, C.A.; Kyriakides, N.C.; Chrysostomou, C.Z. Numerical Modelling and Simulation of the In-Plane Response of a Three-Storey Masonry-Infilled RC Frame Retrofitted with TRM. Adv. Civ. Eng. 2020, 2020, 6279049. [Google Scholar] [CrossRef]
  34. Selvakumar, A.; Thirumurugan, V.; Satyanarayanan, K.S. Structural significance of Pneumatic Interface in Masonry infilled RC frames. Mater. Today Proc. 2021, 50, 282–286. [Google Scholar] [CrossRef]
  35. Crespi, P.; Zucca, M.; Longarini, N.; Giordano, N. Seismic assessment of six typologies of existing RC bridges. Infrastructures 2020, 5, 52. [Google Scholar] [CrossRef]
  36. Clementi, F.; Gazzani, V.; Poiani, M.; Lenci, S. Assessment of seismic behaviour of heritage masonry buildings using numerical modelling. J. Build. Eng. 2016, 8, 29–47. [Google Scholar] [CrossRef]
  37. Franchi, A.; Napoli, P.; Crespi, P.; Giordano, N.; Zucca, M. Unloading and Reloading Process for the Earthquake Damage Repair of Ancient Masonry Columns: The Case of the Basilica di Collemaggio. Int. J. Archit. Herit. 2021, 1–16. [Google Scholar] [CrossRef]
  38. Faizan, A. Numerical Study on Dynamic Behavior of Scaled Confined Masonry and RC Structures; University of Engineering and Technology: Lahore, Pakistan, 2014. [Google Scholar]
  39. Lee, S.-J.; Eom, T.-S.; Yu, E. Investigation of Diagonal Strut Actions in Masonry-Infilled Reinforced Concrete Frames. Int. J. Concr. Struct. Mater. 2021, 15, 6. [Google Scholar] [CrossRef]
  40. Dehghani Sanij, E. Nonlinear earthquake response analysis of RC frames with masonry. In Proceedings of the 15th World Conference on Earthquake Engineering, Lisbon, Portugal, 24–28 September 2012. [Google Scholar]
  41. Ranjbaran, F.; Hosseini, M.; Soltani, M. Simplified Formulation for Modeling the Nonlinear Behavior of Confined Masonry Walls in Seismic Analysis. Int. J. Archit. Herit. 2012, 6, 259–289. [Google Scholar] [CrossRef]
  42. Stavridis, A.; Shing, P. Shum Calibration of a numerical model for masonry infilled RC frames. In Proceedings of the 14th World Conference on Earthquake Engineering, Beijing, China, 12–17 October 2008. [Google Scholar]
  43. Mahendran, M. Applications of finite element method in structural engineering. In Proceedings of the International Conference on Computer Aided Engineering, Chennai, India, 13–15 December 2007; pp. 38–46. [Google Scholar]
  44. Plevris, V.; Markeset, G. Educational challenges in computer-based Finite Element Analysis and design of structures. J. Comput. Sci. 2018, 14, 1351–1362. [Google Scholar] [CrossRef] [Green Version]
  45. Prévost, J.H.; Bagrianski, S. An Introduction to Matrix Structural Analysis and Finite Element Methods; World Scientific: Singapore, 2016; ISBN 978-981-320-677-9. [Google Scholar]
  46. Computers & Structures Inc. SAP 2000; Computers & Structures Inc.: Walnut Creek, CA, USA, 2019. [Google Scholar]
  47. Daee, B.B.; Aghakouchak, A. Assessment of Nonlinear Static Procedures for Determination of Target Displacement in Asymmetric Buildings. Adv. Struct. Eng. 2012, 15, 1265–1278. [Google Scholar] [CrossRef]
  48. Mander, J.B.; Priestley, M.J.N.; Park, R. Theoretical Stress-Strain Model for Confined Concrete. J. Struct. Eng. 1988, 114, 1804–1826. [Google Scholar] [CrossRef] [Green Version]
  49. Kaushik, H.B.; Rai, D.C.; Jain, S.K. Stress-Strain Characteristics of Clay Brick Masonry under Uniaxial Compression. J. Mater. Civ. Eng. 2007, 19, 728–739. [Google Scholar] [CrossRef]
  50. Zhao, X.; Wu, Y.-F.; Leung, A.Y.; Lam, H.F. Plastic Hinge Length in Reinforced Concrete Flexural Members. Procedia Eng. 2011, 14, 1266–1274. [Google Scholar] [CrossRef] [Green Version]
  51. Baji, H.; Ronagh, H.R. Reliability analysis of moment redistribution in reinforced concrete beams. Mag. Concr. Res. 2013, 65, 769–779. [Google Scholar] [CrossRef] [Green Version]
  52. Gusella, F. Effect of the plastic rotation randomness on the moment redistribution in reinforced concrete structures. Eng. Struct. 2022, 252, 113652. [Google Scholar] [CrossRef]
  53. Toshikazu, T.; Mete, A.S.; Norby, N.N. Reinforced Concrete Response to Simulated Earthquakes. J. Struct. Div. 1970, 96, 2557–2573. [Google Scholar] [CrossRef]
  54. ELS Extreme Loading for Structures; Applied Science International, LLC: Durham, NC, USA, 2019.
  55. Maekawa, K.; Okamura, H.; Pimanmas, A. Non-Linear Mechanics of Reinforced Concrete; CRC Press: Boca Raton, FL, USA, 2003. [Google Scholar]
  56. Maekawa, K.; Irawan, P.; Okamura, H. Path-dependent three-dimensional constitutive laws of reinforced concrete-formulation and experimental verifications. Struct. Eng. Mech. 1997, 5, 743–754. [Google Scholar] [CrossRef]
  57. Ristic, D.; Yamada, Y.; Iemura, H. Stress-Strain Based Modeling of Hysteretic Structures under Earthquake Induced Bending and Varying Axial Loads; Kyoto University: Kyoto, Japan, 1986. [Google Scholar]
  58. FEMA-356 Prestandard. Commentary for the Seismic Rehabilitation of Buildings (FEMA-356); Federal Emergency Management Agency: Washington, DC, USA, 2000. [Google Scholar]
  59. Stafford Smith, B.; Carter, C. A Method of Analysis for Infilled Frames. Proc. Inst. Civ. Eng. 1969, 44, 31–48. [Google Scholar] [CrossRef]
  60. Reinhorn, A.M.; Madan, A.; Valles, R.E.; Reichman, Y.; Mander, J.B. Modeling of Masonry Infill Panels for Structural Analysis. J. Struct. Eng. Div. 1995, 123, 13418. [Google Scholar]
  61. ACI 530. Building Code Requirements and Specification for Masonry Structures and Companion Commentaries; American Concrete Institute: Farmington Hills, MI, USA, 2013. [Google Scholar]
  62. El-Dakhakhni, W.W.; Elgaaly, M.; Hamid, A.A. Three-strut model for concrete masonry-infilled steel frames. J. Struct. Eng. 2003, 129, 177–185. [Google Scholar] [CrossRef]
  63. Chopra, A.K. Dynamics of Structures: Theory and Applications to Earthquake Engineering; Prentice Hall: Englewood Cliffs, NJ, USA, 1995. [Google Scholar]
Figure 1. (a) Simple concrete stress-strain model; (b) idealized stress-strain model for masonry.
Buildings 12 00774 g001aBuildings 12 00774 g001b
Figure 2. (a) Fiber-based sectional analysis (b) Moment–curvature diagram evaluated by SAP2000.
Buildings 12 00774 g002
Figure 3. AEM structural discretization for structural elements.
Buildings 12 00774 g003
Figure 4. H-building modeled after Žarnić et al. (2001) [24]: (a) perspective view; (b) bare frame model and; (c) IFM model.
Buildings 12 00774 g004aBuildings 12 00774 g004b
Figure 5. Modeling of structural elements using: (a) Finite Element Modelling; (b) Applied Element Modelling approach.
Buildings 12 00774 g005
Figure 6. Homogenous shell finite element model of H-building structure.
Buildings 12 00774 g006
Figure 7. Schematic representation of FEMA strut Finite Element Model of H-building structure.
Buildings 12 00774 g007
Figure 8. Schematic representation of Tri-strut Finite Element Model of H-building structure.
Buildings 12 00774 g008
Figure 9. Schematic representation of Continuum applied element model of H-building structure.
Buildings 12 00774 g009
Figure 10. Schematic view of small-scaled (a) infilled, (b) confined, masonry wall.
Buildings 12 00774 g010
Figure 11. FEMA: (a) strut Finite Element Model (b); Continuum Applied Element model of infilled wall structure.
Buildings 12 00774 g011
Figure 12. Confined masonry (CM) wall structure: (a) Tri-strut Finite Element model; (b) Continuum Applied Element model.
Buildings 12 00774 g012
Figure 13. Comparison of predicted and experimentally obtained base shear vs story drift of scaled H-Building by Žarnić et al. (2001) [24] and the studied analytical models.
Buildings 12 00774 g013
Figure 14. Comparison of predicted damage profiles; (a) Homogenous Shell Model; (b) FEMA strut model; (c) Tri-strut model; (d) AEM.
Buildings 12 00774 g014
Figure 15. Comparison of experimentally obtained and predicted base shear vs top displacement for scaled IFM wall.
Buildings 12 00774 g015
Figure 16. Comparison of IFM damage profiles for (a) physical test performed by Waqar Ahmad (2013) [26]; (b) FEMA strut model; (c) AEM; (d) AEM with cold joint.
Buildings 12 00774 g016
Figure 17. Comparison of experimentally obtained and predicted base shear vs top lateral displacements for scaled CM Wall.
Buildings 12 00774 g017
Figure 18. Comparison of CM damage profiles for (a) physical test (Waqar Ahmad, 2013); (b) tri-Strut model; (c) AEM; (d) AEM with cold joint.
Buildings 12 00774 g018
Figure 19. Comparison of base shear and top lateral displacements for FEMA Strut and AEM models for H-building structure (RC and IFM) at PGA: (a) 0.5 g; (b) 1.5 g; (c) 1.0 g; (d) 2.0 g; (e) 2.5 g; (f) 3.0 g.
Buildings 12 00774 g019
Figure 20. Comparison of base shear and top lateral displacements of AEM models for H-building structure (IFM and Bare Frame building structure) at PGA: (a) 0.5 g; (b) 1.0 g; (c) 1.5 g; (d) 2.0 g; (e) 2.5 g; (f) 3.0 g.
Buildings 12 00774 g020
Figure 21. Comparison of pushover curve and dynamic analysis results of AEM models for H-building structure (RC and IFM).
Buildings 12 00774 g021
Figure 22. Damage Profiles of AEM models for H-building structure (RC and IFM) at PGA: (a) 0.5 g; (b) 1.0 g; (c) 1.5 g; (d) 2.0 g; (e) 2.5 g; (f) 3.0 g.
Buildings 12 00774 g022
Figure 23. Comparison of base shear and top lateral displacements for FEMA strut and AEM models for IFM wall structure at PGA: (a) 0.5 g; (b) 1.0 g; (c) 1.5 g; (d) 2.0 g; (e) 2.5 g; (f) 3.0 g.
Buildings 12 00774 g023
Figure 24. Damage profiles of AEM models for IFM wall structure at PGA: (a) 0.5 g; (b) 1.0 g; (c) 1.5 g; (d) 2.0 g; (e) 2.5 g; (f) 3.0 g.
Buildings 12 00774 g024
Figure 25. Comparison of base shear and top lateral displacements for FEMA strut and AEM models for CM wall structure at PGA: (a) 0.5 g; (b) 1.0 g; (c) 1.5 g; (d) 2.0 g; (e) 2.5 g; (f) 3.0 g.
Buildings 12 00774 g025
Figure 26. Damage profiles of AEM models for CM wall structure at PGA: (a) 0.5 g; (b) 1.0 g; (c) 1.5 g; (d) 2.0 g; (e) 2.5 g; (f) 3.0 g.
Buildings 12 00774 g026
Table 1. Concrete and reinforcement material properties of infilled and confined masonry wall models.
PropertyPrototype ValueModel Value TargetedModel Value AchievedTrue P/M Ratio
Compressive strength of concrete, psi2100.50700.16713.383.02
Strain at peak stress, psi0.00320.00320.00323.32
Density of concrete, pcf151.36151.36151.722.87
Modulus of Elasticity of concrete, psi18, 34, 186.16611, 395.39590, 239.523.12
Yield strength of Steel reinforcement, psi47, 780.8815, 926.9614, 931.563.20
Bar to concrete bond strength, psi566.44188.81----------
Table 2. Reported Base Shears from Pushover Curves for H-Building Structure.
Test Run ResultsReported Base Shear
Test RunStory DriftDynamic TestDrain-2DX FEMA StrutTri-StrutAEM
#%kNkNkNkNkN
H60.011.52.71.01.01.9
H70.023.35.32.12.03.7
H80.151720.713.514.615.1
H100.322924.421.828.123.3
H140.7519.522.223.731.430.8
H160.781922.023.731.529.3
H180.7917.522.023.731.528.4
H201.0217.821.523.731.925.5
Table 3. Reported results of Pushover Curves for scaled Infilled Wall Structure.
Test RunTangent StiffnessStrength
#(kg/mm)(kg)
Experiment851.6622.0
FEMA Strut887.7815.8
AEM967.0639.2
Table 4. Reported results of Pushover Curves for scaled Confined Wall Structure.
Test RunTangent StiffnessStrength
#(kg/mm)(kg)
Experiment1135.51132.0
FEMA Strut672.7883.8
AEM1525.2996.1
Table 5. Reported results of Dynamic Analysis for scaled H-Building Structure.
NLTHAFEMA Strut Model (IFM and RC)AEM (IFM and RC)AEM (Bare RC Frame)
Secant StiffnessStrengthSecant StiffnessStrengthSecant StiffnessStrength
(PGA)kN/mmkNkN/mmkNkN/mmkN
0.5 g11.53.713.93.010.02.2
1.0 g11.57.412.96.19.54.4
1.5 g11.511.111.39.18.06.5
2.0 g10.914.610.512.16.98.7
2.5 g10.518.69.715.06.011.6
3.0 g10.322.89.018.35.314.5
Publisher’s Note: MDPI stays neutral with regard to jurisdictional claims in published maps and institutional affiliations.

