1. Introduction
The quality of indoor environment effects health, well-being, and productivity of the residents/occupants. In the absence of adequate indoor thermal comfort, the performance of occupant is likely to deteriorate as their ability to make decisions and/or execute professional tasks depreciates [
1]. Thus, ensuring satisfactory levels of thermal comfort is necessary and estimating and/or predicting indoor thermal comfort is an important problem in academia and industry.
The advancements in the domain of machine learning [
2,
3] and the continually lowering cost of computational resources, has made it possible to solve complex thermal comfort prediction problems. Recent studies show that Machine Learning (ML)based models are more precise and accurate [
4,
5,
6] in predicting thermal comfort of occupants, as compared to the conventional numerical models such as the Predicted Mean Vote model (PMV) and Percentage of Dissatisfied (PPD) model [
7], and the Adaptive Thermal Comfort model (ATC) [
8]. Further, ML models can be designed and trained for predicting both, individual thermal comfort [
9] and group-based thermal comfort [
10].
Further, ML-based predictive solutions are data-driven and more suited to ensure energy efficiency while providing indoor thermal comfort (TC). Typically, buildings are designed to meet the thermal comfort needs of residents in three ways, i.e., through smart Heating, Ventilation And Cooling (HVAC) systems, natural ventilation (NV), and mixed ventilation systems. Though HVAC systems are the most effective in ensuring optimal TC, their energy consumption is up to 50% of the energy budget of a building, amounting to a staggering 20% of the total energy consumption in USA [
11]. Despite smart HVAC control strategies for energy-conservation [
12], this solution is not ecologically sustainable in the long-term. Moreover, HVACs and mixed systems are not affordable in most developing countries, where the bulk of indoor spaces including classrooms are naturally ventilated [
13]. From the perspective of energy efficiency and conservation, naturally ventilated buildings seem ideal [
14]. However, natural ventilation also renders occupants more vulnerable to the temporal changes in the weather, making thermal comfort estimation and prediction a challenging task.
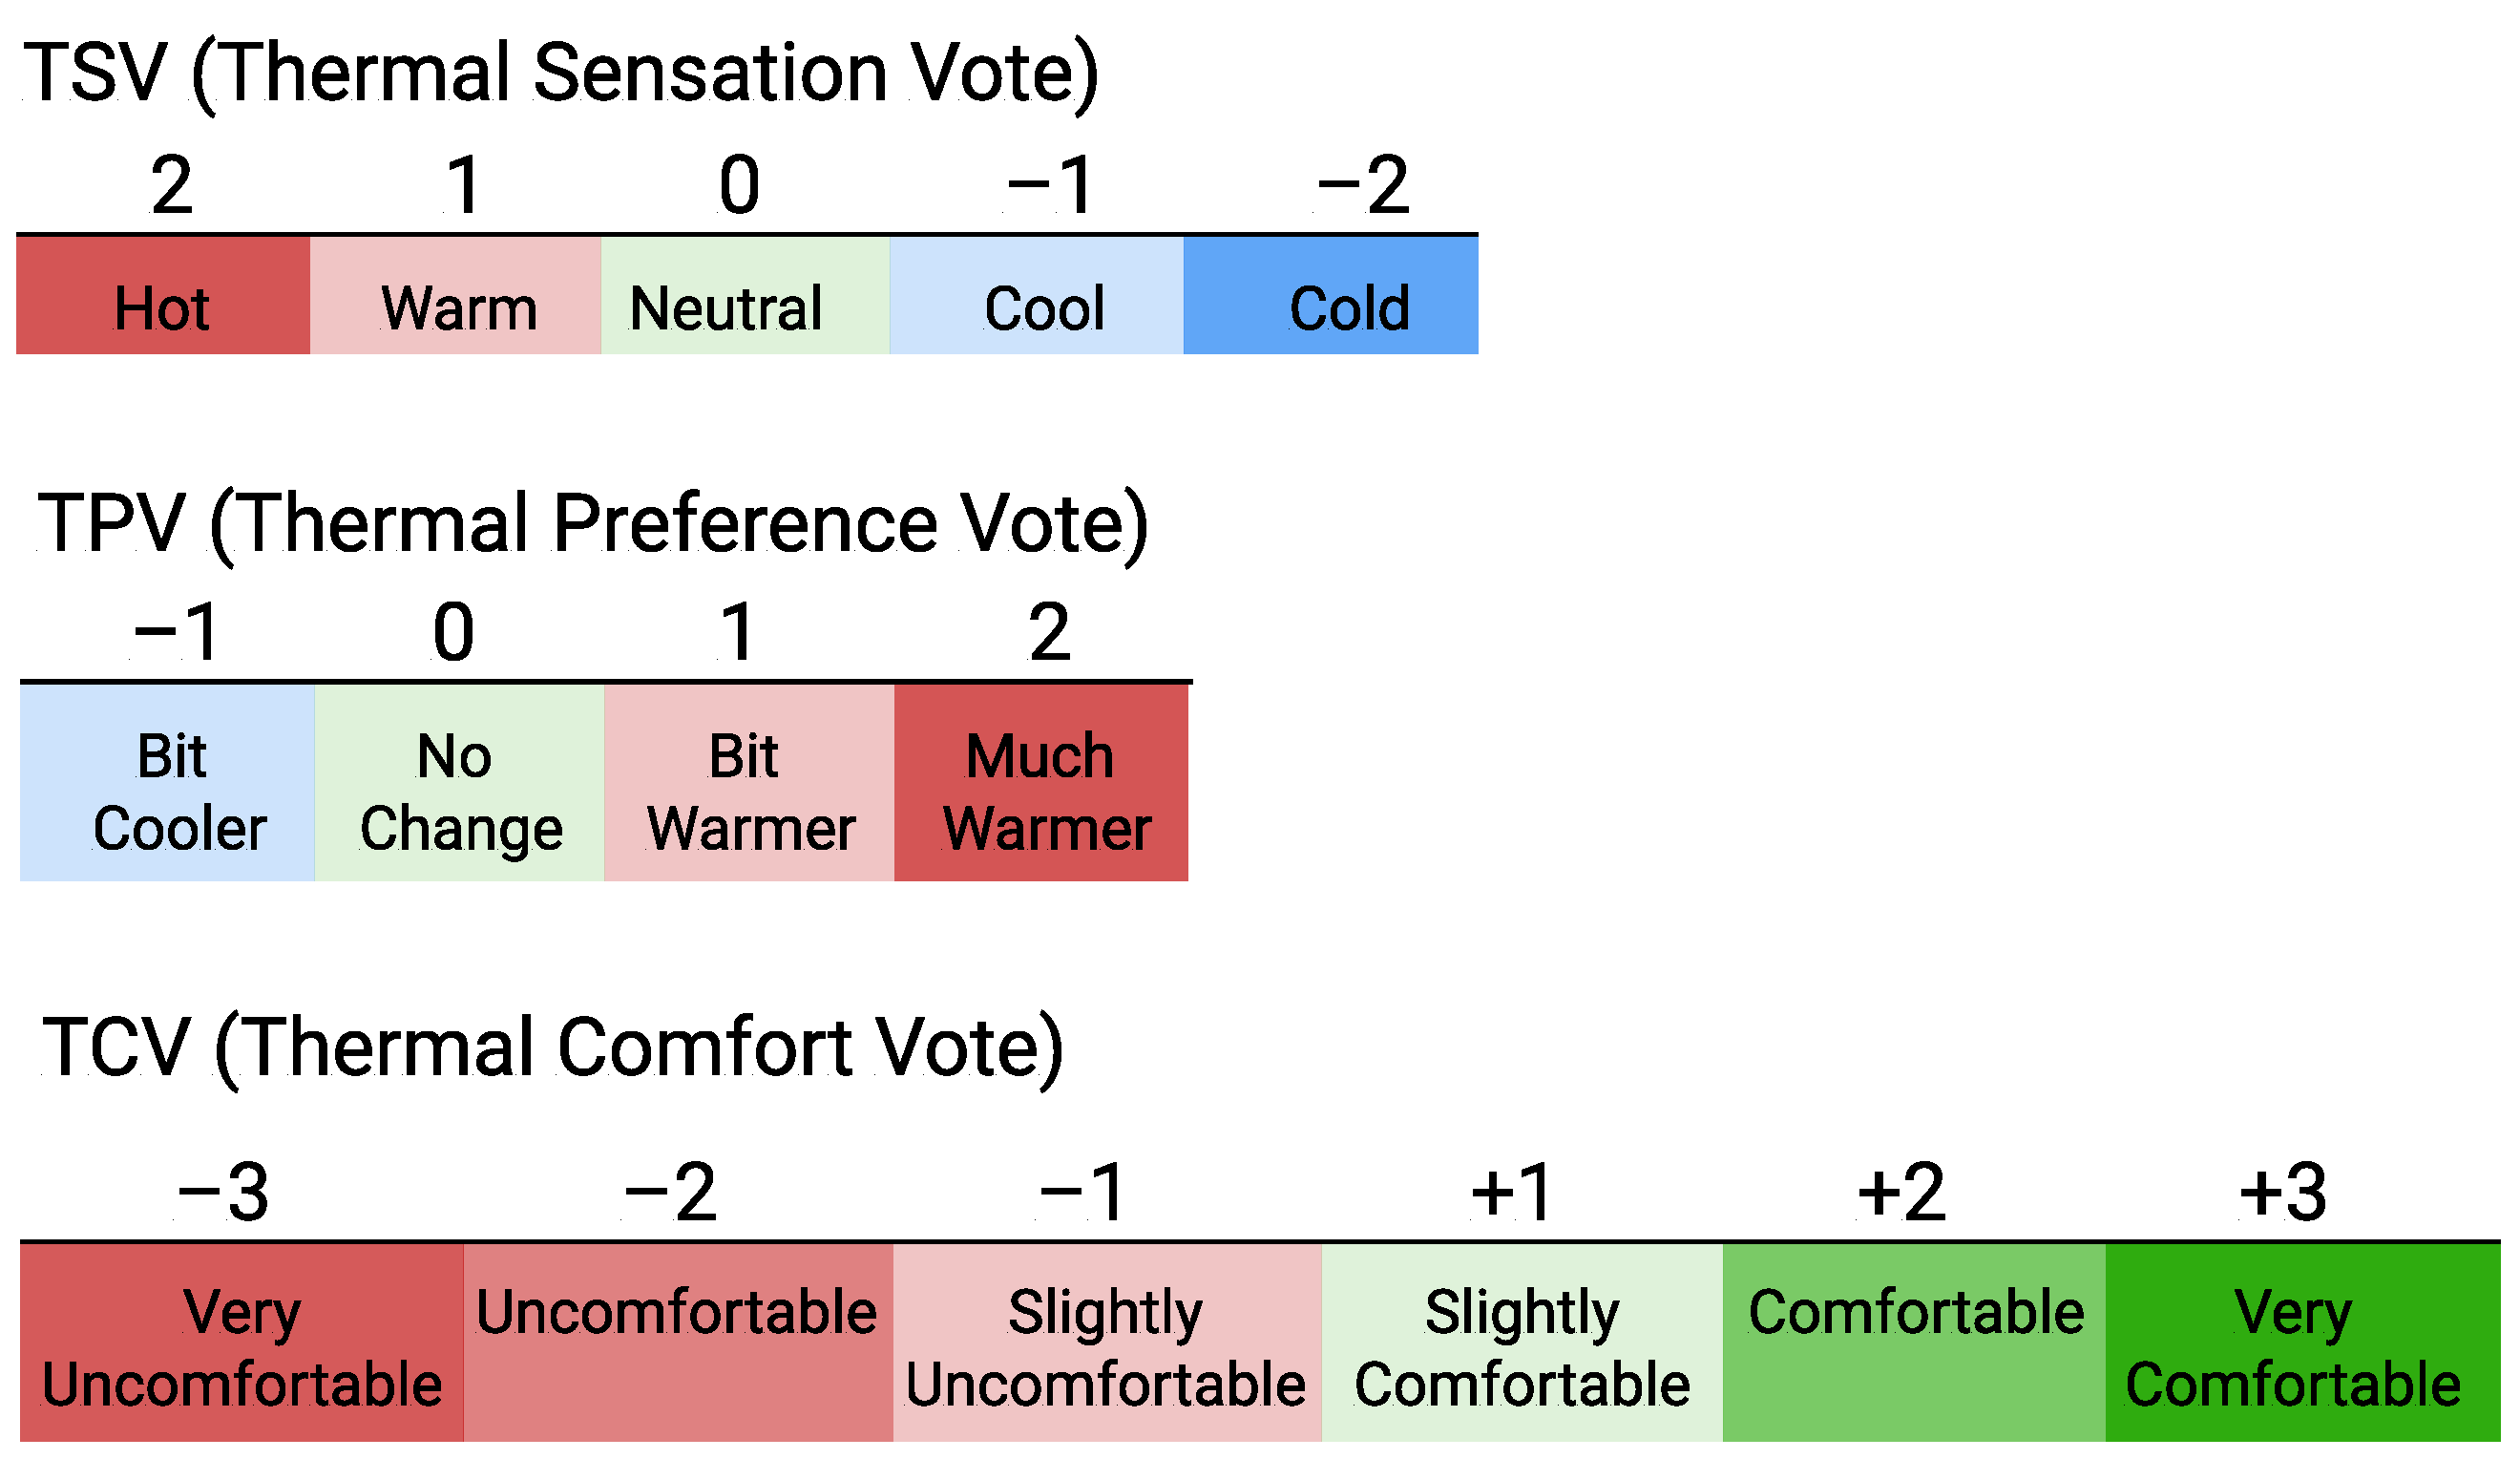
Most importantly, the current ML-based thermal comfort prediction models often offer partial or conflicting solutions. This happens because thermal comfort perception of an individual is highly subjective and personal. It has several dimensions specific to an occupant, such as
sensation,
preference, the
current level of comfort, etc. These dimensions are captured through corresponding subjective metrics, viz., Thermal Sensation Vote (TSV), Thermal Preference Vote (TPV), and Thermal Comfort Vote (TCV), shown in
Figure 1. However, the current ML-based solutions either focus on just one of these metrics, such as TSV [
9,
10], or propose a different prediction model for each metric [
15]. This leads to confusing or contradictory predictions, rendering practical real-world implementation infeasible. This work tries to address this problem.
For practical implementation of TC prediction models, occupant data must be gathered through field experiments. Schools and classrooms are an ideal real-world setting as school students spend more time in classrooms as compared to any other built environment outside their homes [
16]. It is well established that higher levels of indoor thermal comfort and air quality facilitate improved concentration and enhance scholastic learning [
17]. Moreover, school children exhibit lower metabolism than adults [
18], limited cognitive abilities to evaluate their environments, and limited opportunities for adaptation in naturally ventilated classrooms. Thus, understanding and predicting students’ thermal comfort needs in naturally ventilated classrooms is a challenging problem that needs to be solved for better learning outcomes, health, and energy efficiency.
To remedy these challenges, this work proposes a Multi-task learning inspired solution, that simultaneously predicts the three most important thermal comfort metrics for primary school students in naturally ventilated classrooms. The high-level research problems and specific contributions are presented ahead.
1.1. Motivation and Research Problems
Subjective responses vary across different TC metrics, which makes the prediction of occupants’ thermal comfort perception a complex problem. The existing TC prediction studies employ a Single Task Learning approach, wherein an ML model is dedicated to predicting a single thermal comfort metric. Consequently, studies propose multiple independent models, each focusing on one of the subjective metrics.
However, this approach is problematic. Considering one thermal comfort metric at a time does not adequately capture the thermal comfort of an occupant and may yield conflicting results. For example, the TCV model may predict that the occupant is comfortable (response = “Comfortable”) while the TPV model may indicate a preference for a major change in the environment (response = “Much Warmer”).
Further, the pursuit of high accuracy in the prediction of a single metric requires fine-tuning of the hyperparameters for that particular TC metric. Thus, a metric-specific model does not guarantee that it will perform reliably for the other metrics. This causes ambiguity and confusion in choosing the right TC metric. Moreover, from the perspective of real-world implementation, maintaining and deploying multiple ML models for a single built space is practically infeasible for researchers, building administrators, and indoor residents.
These challenges arise because thermal comfort perception is subjective and context-specific, making multiple TC output metrics necessary. One solution is to identify a minimal subset of TC output metrics that have a high correlation with all other metrics [
15]. However, this solution requires an additional step of linear and non-linear correlation analysis of only TC output metrics. Doing so may not always yield favorable results leaving the set of TC output metrics unchanged. Even if successful, the process may also result in the loss of context-specific information by excluding some of the TC output metrics.
The second primary motivation of this work is to pave the way for a real-world implementation of ML-based TC prediction that encourages energy efficiency. TC prediction models are context-specific and the predictive capabilities of an ML-based solution will be sensitive to the characteristics of the occupants, the indoor space, and the outdoor environment. With respect to occupants, thermal comfort prediction of primary school students has been largely unaddressed in the ML-based TC studies [
5,
6]. Further, naturally ventilated (NV) classrooms are more suitable for energy conservation and long-term sustainability goals. They offer reduced operating costs, lower greenhouse emissions, improved indoor air quality, and prevent the spread of COVID-19 [
14,
19]. However, primary school students are more vulnerable to external environmental factors in NV classrooms. Given their limited cognitive ability to assess their environment and capacity for behavioral adaptation, predicting their thermal comfort responses is far more challenging in NV environments than it is for adults.
Thus, this work aims to solve two main research problems with respect to thermal comfort prediction. First, is to address the challenges posed by “multiple models”, for the TC metrics in an indoor space. Second, develop an intelligent TC prediction model for primary school students that can be deployed in naturally ventilated classrooms.
1.2. Contributions
This paper addresses the above problems by leveraging the Multi-task Learning (MTL) paradigm. It adopts a unified approach to thermal comfort prediction through multi-task prediction wherein multiple TC output metrics are predicted simultaneously, with high accuracy, by training a single model. Further, for accurate context-specific prediction of thermal comfort perception of primary school students in naturally ventilated classrooms, extensive field experiments and surveys are conducted. In particular, the following are the major contributions of this work.
Field-experiments and Surveys: The primary school student dataset is created through month-long field experiments and surveys involving 512 unique student participants, in 14 classrooms of 5 different schools, during January (the coldest winter month) in North India. A total of 2039 survey responses were gathered.
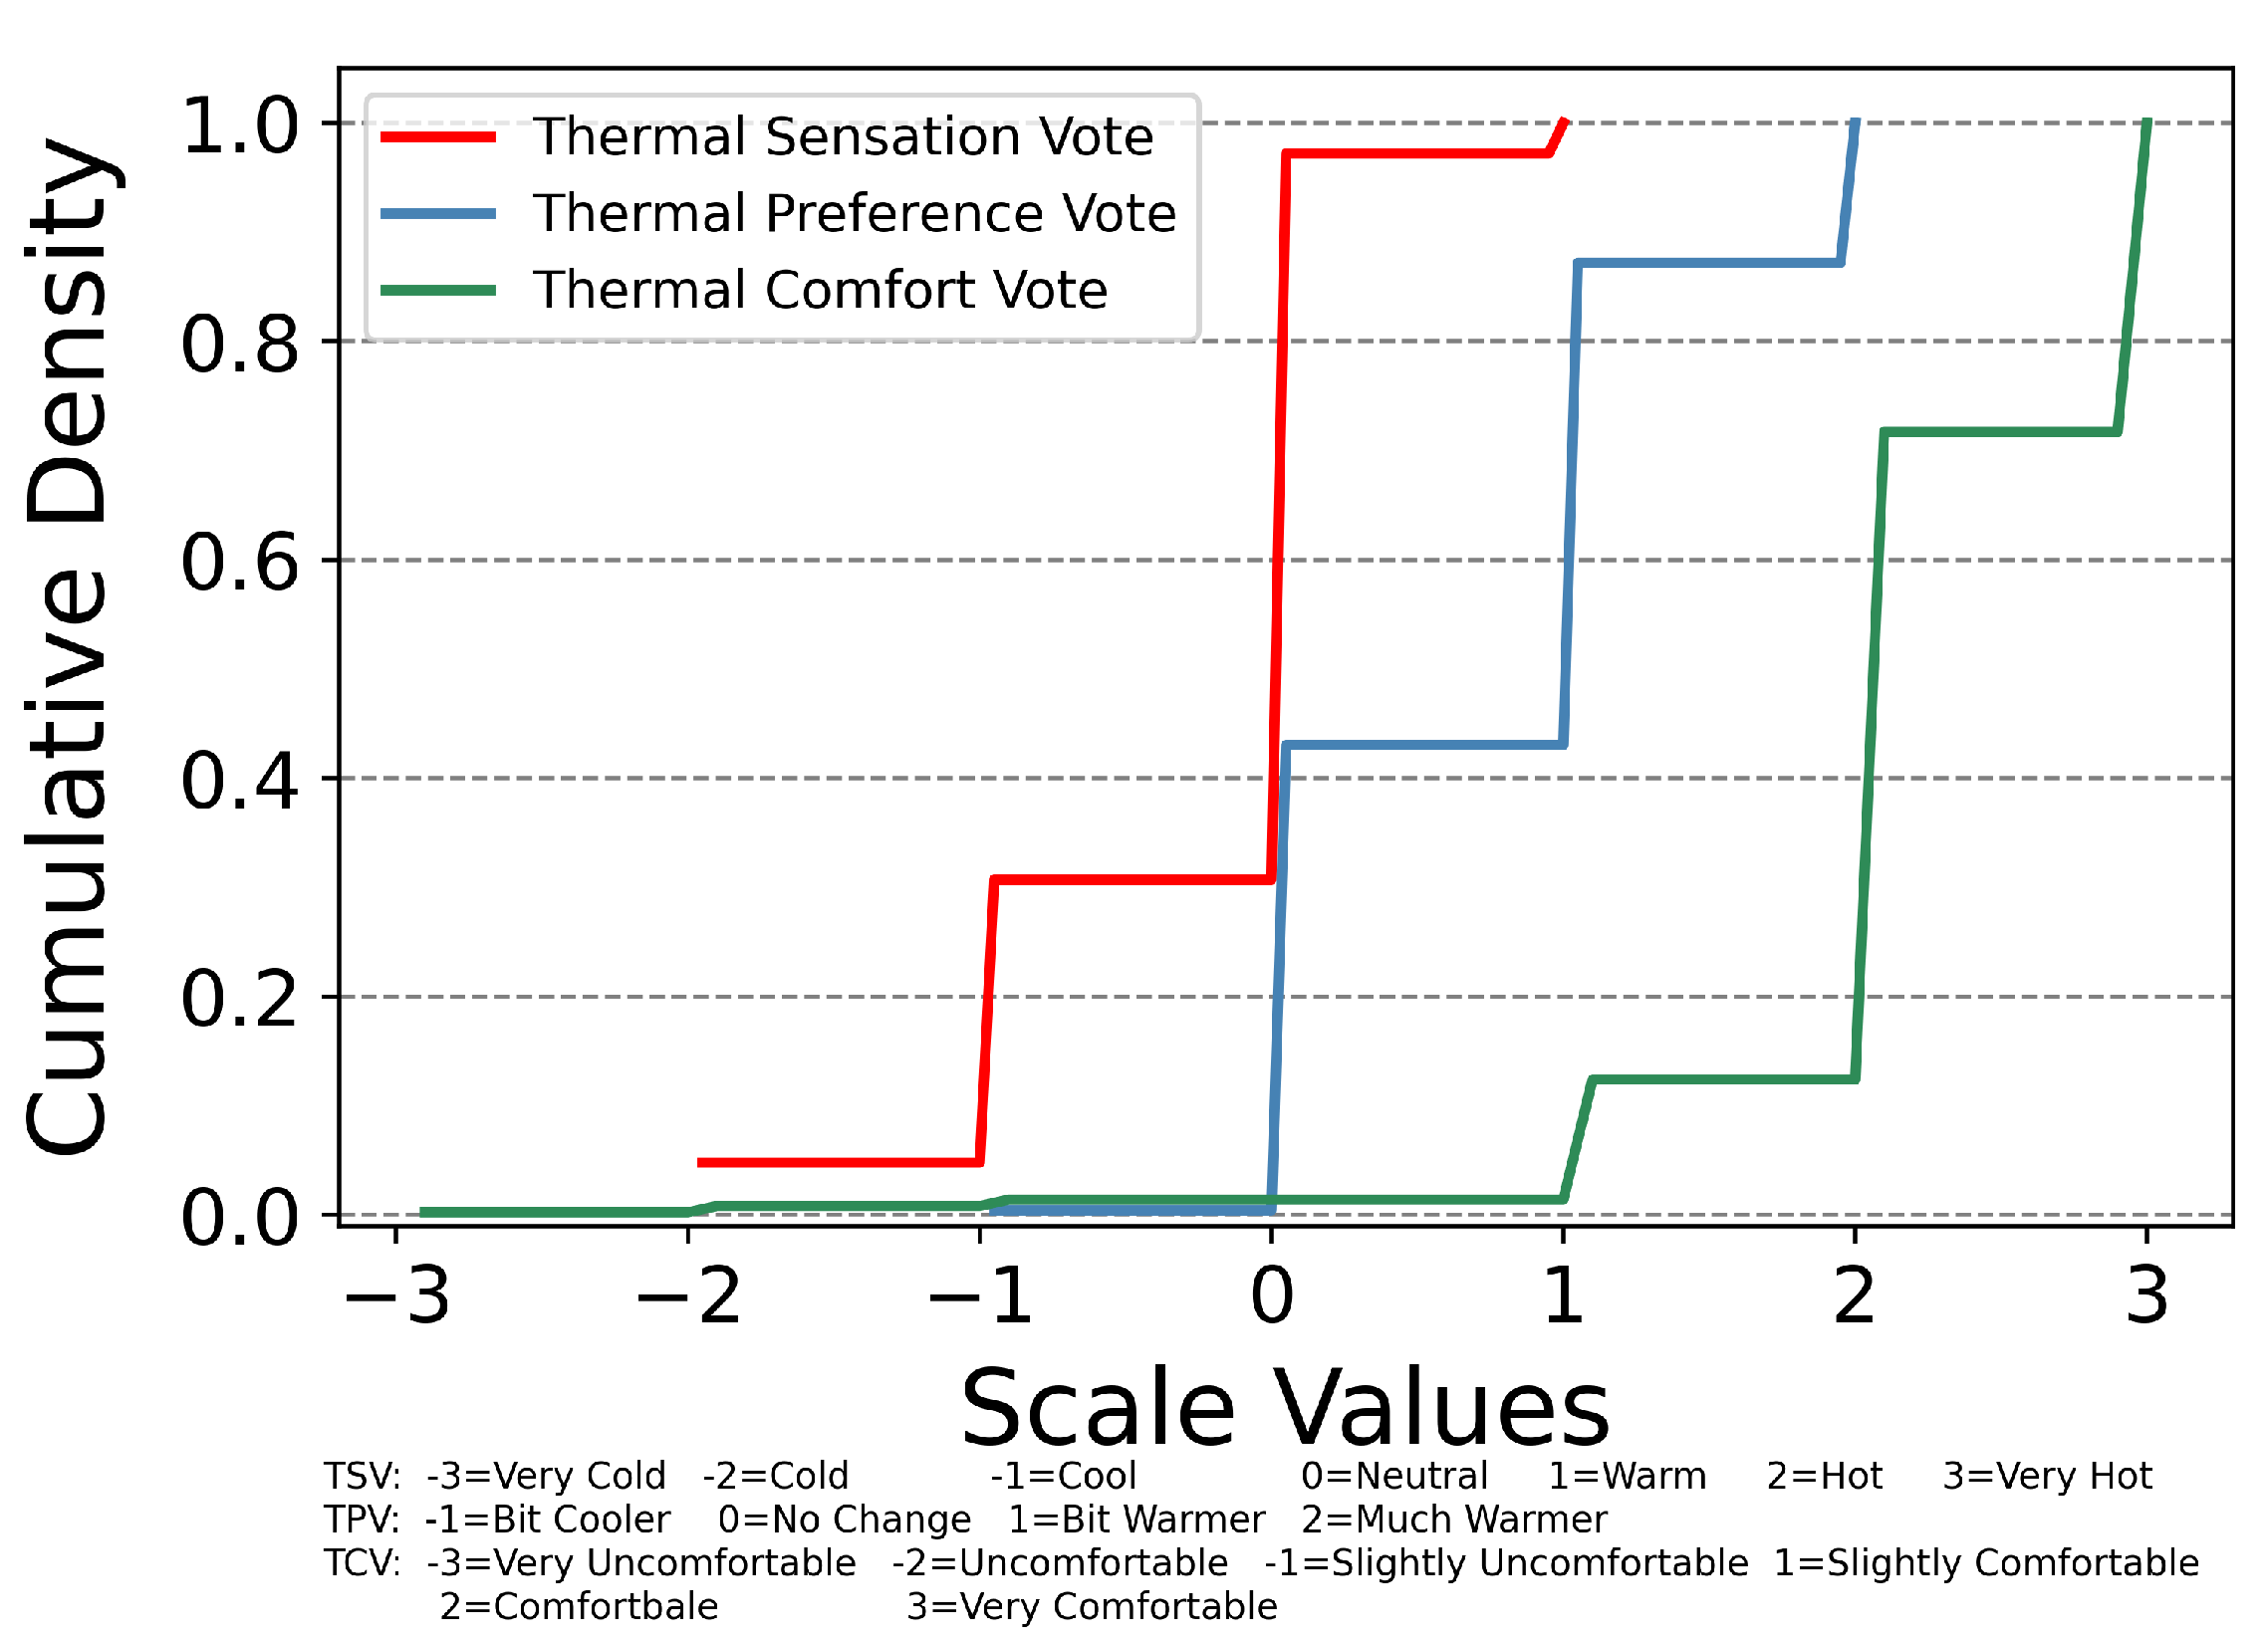
Data analysis: Distribution of three subjective TC perception responses is analyzed.
Multi-task learning for Thermal Comfort prediction: The work proposes “DeepComfort”– an MTL system, which employs Deep Learning (DL) for accurate and simultaneous multi-class prediction of TSV, TPV, and TCV.
Validation: DeepComfort is validated on the standard ASHRAE II dataset and primary student dataset presented in this study.
Performance Evaluation: DeepComfort is evaluated against 6 single-task machine learning techniques and is shown to outperform them on parameters such as F-score, Precision, Recall, and Accuracy. The STL techniques include supervised shallow algorithms viz., Support Vector Machines, Random Forest, Decision Tree, K-Nearest Neighbours, Adaboost, and unsupervised Deep Neural Networks.
Impact of categorical features: The multi-task prediction capability of DeepComfort is assessed for different sub-categories of the data viz., gender of the students, grade of students, different schools, field experiment timings, etc.
To the best of our knowledge, this is the first multi-task learning-based thermal comfort assessment study in naturally ventilated classrooms [
5,
6,
20].
1.3. Paper Organization
The rest of the paper is organized as follows.
Section 2 presents a brief overview of the application of machine learning to thermal comfort studies and discusses the need for multi-task learning.
Section 3, describes several aspects of the data gathering exercise in great detail, including the questionnaire, school survey, experiments, and the weather data.
Section 4 presents an exploratory analysis of important features and TC output metrics. The DeepComfort system is proposed in
Section 5 and the technical details of the underlying Deep Learning neural network model are specified. Thereafter, a comprehensive evaluation of DeepComfort is conducted in
Section 6 along with statistical analysis of data wherever necessary. Finally, the conclusions of the study and next steps are presented in
Section 7.
2. Machine Learning for TC Prediction
Thermal comfort prediction models that leverage machine learning are fundamentally different from the conventional TC estimation models viz., PMV-PPD model, Adaptive model, Physiological Equivalent Temperature (PET) model, 1-node model, and 2-node model [
7,
8,
21]. Moreover, the physics-based TC estimation models such as PET are motivated by the energy balance of a human body and require additional measurements such as the mean skin temperature, core temperature, sweating rate and shivering heat production, etc. [
21]. Unfortunately, conventional TC estimation models are not reliable when it comes to predicting subjective thermal comfort perceptions [
5,
6,
20].
As a result, recent focus of thermal comfort research has been on predictive modeling through machine learning techniques. Unlike conventional adaptive models, ML-based prediction models do not rely on pre-determined equations that represent relationships between system variables [
8]. ML models are data-driven. They can learn multi-dimensional non-linear mappings between several environmental and physiological parameters and predict subjective thermal comfort perceptions of occupants with high accuracy.
This section presents a discussion on inputs, objectives, and outputs, for ML-based TC prediction models, followed by the limitations of single-task approaches, and the need for multi-task learning.
2.1. Input Parameters, Objectives, and Outputs
Most machine learning-based thermal comfort (MLTC) studies consider features/ parameters that are a combination of indoor environmental measurements (e.g., indoor temperature), outdoor environmental measurements (e.g., daily rainfall), and individual features (e.g., clothing) [
6]. Hence, the multi-task DeepComfort model includes input features that are a combination of indoor environmental measurements (e.g., indoor temperature, relative humidity), individual-specific features (e.g., Clothing value), and weather data procured from the Indian Meteorological Department (IMD) for the month in which the field experiments and surveys were conducted.
With respect to the objectives of ML models, MLTC studies address a wide array of problems pertaining to the thermal comfort of occupants. These include predicting thermal comfort of individuals and groups [
9,
10], optimizing HVAC systems for energy efficiency of buildings [
22], predicting occupant behavior e.g., opening/closing windows [
23], etc. The primary objective of DeepComfort is to offer a reliable model for group-based multi-output thermal comfort prediction. In addition, this work also analyzes the impact of factors such as age, grade, gender, and spatial and ambient environment (classroom and school) on multi-task thermal comfort prediction. While the impact of age and gender on thermal comfort prediction models have been studied earlier in naturally ventilated buildings [
24], it has not been done for multi-objective models. More importantly, the DeepComfort model aims to overcome the impact of these factors on the accuracy of multi-task prediction.
Coming to output metrics, the subjective metrics used to quantify thermal comfort in the conventional TC studies are illustrated in
Figure 2. It is evident that Thermal Sensation Vote (TSV), Thermal Preference Vote (TPV), and Thermal Comfort Vote (TCV), are the three most popular TC metrics [
25]. Less frequent ones include Air Movement Acceptability (AMA), Air Movement Preference (AMP), and Thermal Accepatbility (TA). Likewise, in ML-based thermal comfort studies, TSV is used as the sole or primary output in close to 50% of works, with TPV being used in 12% of studies [
5]. Consequently, in this work, TSV, TPV, and TCV are considered to be the outputs for DeepComfort. The DeepComfort system can be trained to predict more than three TC outputs as well.
2.2. Single-Task vs. Multi-Task Learning
This subsection discusses the characteristics of Single-task and Multi-task learning paradigms, and the reason why the latter is more suitable.
2.2.1. Single-Task Learning & TC Prediction
MLTC studies analyze multiple thermal comfort perception metrics and propose ML models that predict these metrics as outputs. For example, TSV and TCV are used in [
24,
26], TSV, Effective Temperature (ET), and Standard Effective Temperature (SET) are used in [
27], and TSV, TPV, TCV, and TA are used in [
15].
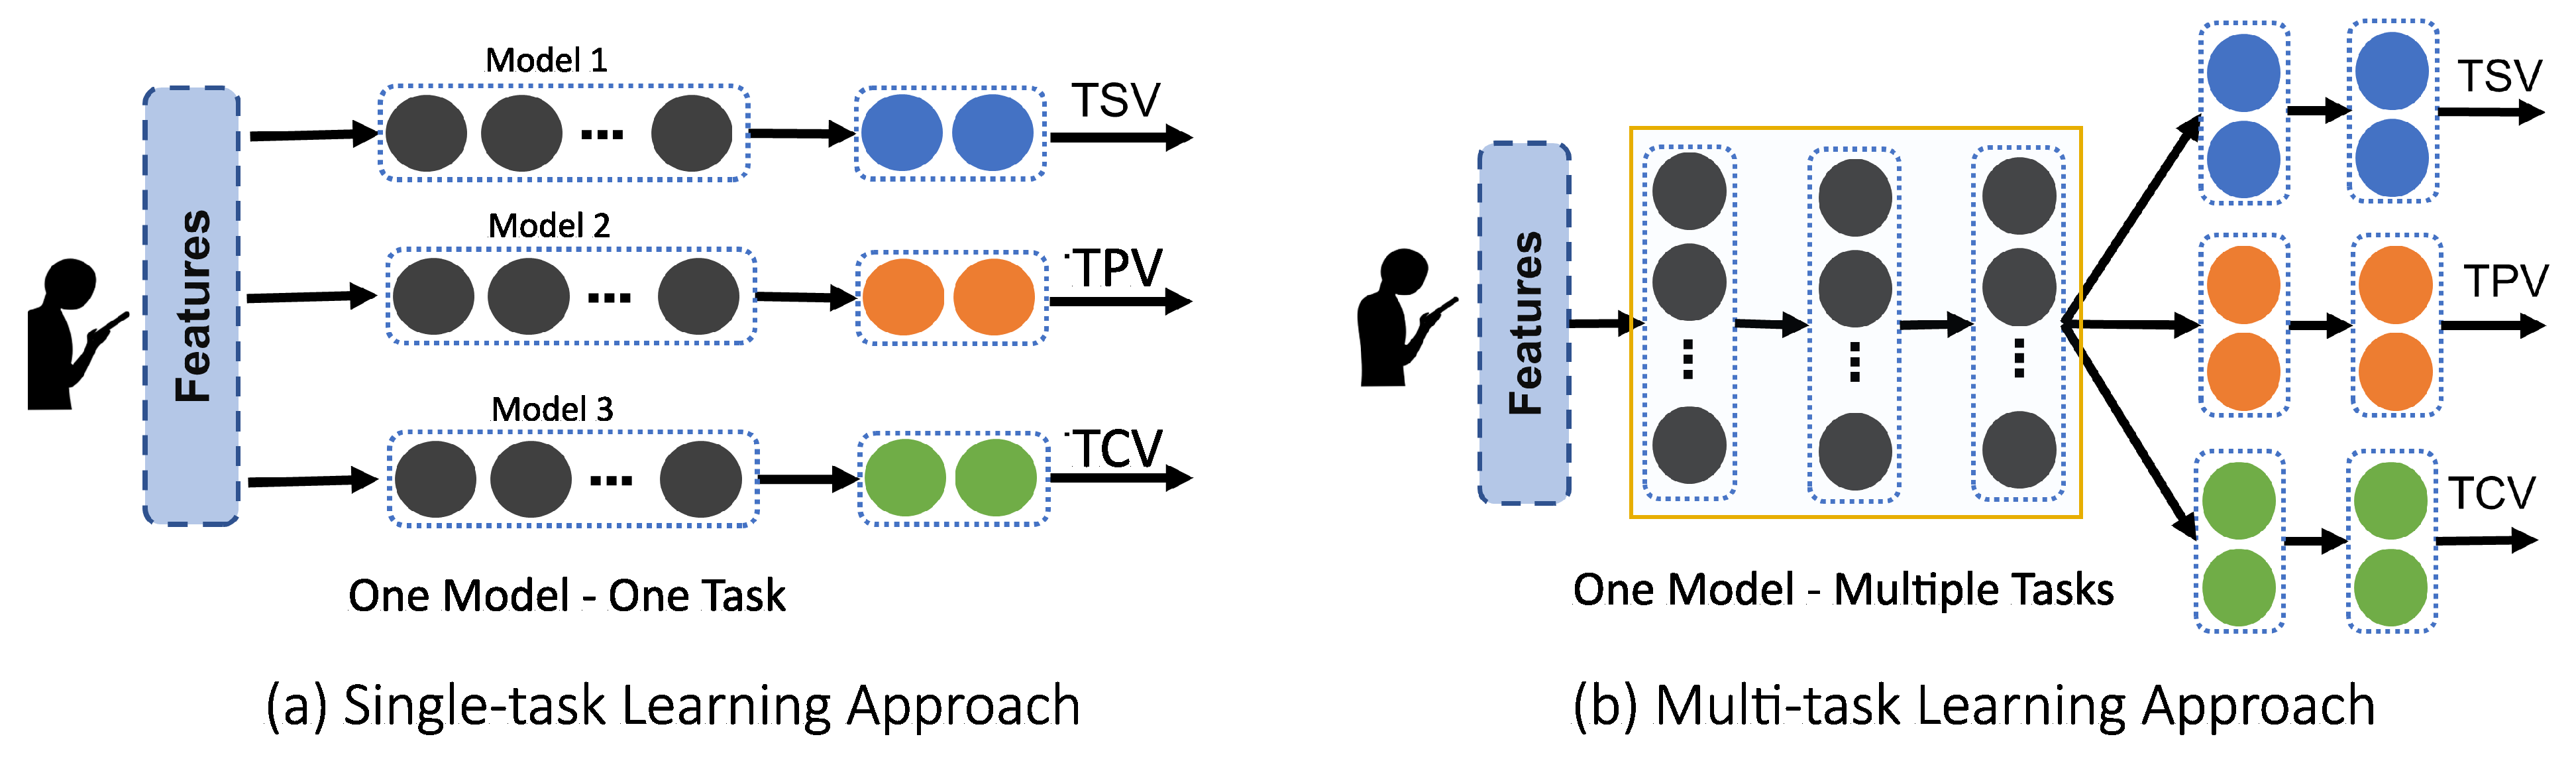
However, it is noteworthy that while these studies seek to predict “multiple” outputs, they employ
Single-task Learning, which results in
one ML model per output. This characteristic is demonstrated as an illustration in
Figure 3a. Thus, each output such as TSV, TPV, or TCV, has an independent ML model dedicated to it.
The STL thermal comfort prediction models suffer from several problems. First, each output-specific model may differ in the inputs/features required for maximal prediction accuracy. Further, the number of samples corresponding to different classes of the outputs for example TSV (7 Classes), TPV (5 Classes), and TCV (6 Classes), will vary. It is possible that there may not be sufficient data for each output to train an accurate classification (prediction) model [
28]. Specifically, in such scenarios, the models tend to overfit the training data losing their generalization ability for real-world deployment. Moreover, tuning the hyperparameters and optimization techniques such as the number of layers in a neural network model are context-specific and vary across outputs [
28,
29]. As a result, keeping track of the inputs and model specifications for each output variable is tedious and time-consuming [
5].
The most critical problem with this approach is that multiple independent models may yield inaccurate and contradicting results. For example, a conflict may occur if the TSV model predicts the sensation felt by occupants to be “Cold”, but the TCV model predicts that the occupants are “Very Comfortable”. Such contradicting predictions make it challenging to decide which output or model is considered accurate and take corresponding corrective action.
There are several reasons for conflicting predictions in single-task learning models. First, the Pearson and Distance correlation analysis of ASHRAE databases I and II presented in [
15] show that all subjective TC outputs do not necessarily exhibit a high correlation with each other. Second, the prediction accuracy of the outputs may depend upon the context, data, and the ML algorithm used. For example, the prediction accuracy for the conventional Support Vector Machine (SVM) algorithm for TPV and TA outputs is 63.9% and 87.4%, respectively, leading to a significant performance difference (≈36%) [
15]. Likewise, in [
27], the prediction accuracy of models does not just vary across outputs viz., TSV, ET, and SET, but also across the choice of the ML algorithm chosen, viz., SVM, Bagging, and Artificial Neural Networks (ANN). Due to these reasons, the single-task approach is not suitable for practical application in a real-world setting.
2.2.2. Multi-Task Learning: One Model to Predict Them All
Multi-task learning (MTL) [
30] is the solution to the challenges highlighted above and is illustrated in
Figure 3b. A multi-task model is trained differently in the following respects:
It is a common-input-multiple-output system.
The model and hyperparameters for all TC outputs are mainly constant.
It optimizes for the cumulative prediction accuracy of all outputs.
Thus, the constancy of input features combined with concurrent learning of multiple outputs gives multi-task learning a clear edge in terms of practical implementation in the real world. The advantage that MTL offers is best summarized by Caruana et al., “MTL improves generalization by leveraging the domain-specific information contained in the training signals of related tasks” [
30].
The paradigm of Multi-task learning (MTL) has recently been applied to the domain of thermal comfort, primarily to solve the challenges of energy efficiency of buildings and HVAC control [
28,
29,
31,
32]. In [
29], authors employ multi-task learning to propose a portable building management solution for better HVAC control. The task definition is based on publicly available building metadata such as the
Brick database [
33] and the solution is validated on the ASHRAE RP884 database [
34]. Using metadata for task identification is suitable to avoid the problem of negative transfer i.e., incorrect task construction and learning unrelated tasks [
31]. However, the use of metadata in MTL is also challenging due to the problems of inaccurate representation generation, the need for domain expertise in creating metadata, variation in the context and types of the metadata itself, and improper integration with the MTL system [
29,
31].
Thus, when task information and relation are clear (e.g., optimizing heating and cooling in HVAC) and for specific contexts (e.g., residential buildings), MTL without metadata is equally suitable for thermal comfort prediction. For example, a Deep Reinforcement Learning (DRL) model that aims to optimize the HVAC efficiency with cooling and heating, as its two outputs, is proposed in [
28]. Likewise, the recEnergy system proposed in [
32], leverages a multi-task DRL model to optimize three tasks, viz. energy efficiency, occupant comfort, and air quality.
However, the current studies that leverage MTL studies are aimed at optimizing building and HVAC efficiency and rely on sensor data and metadata. Further, none of the existing MTL studies have been conducted in naturally ventilated built environments (e.g., classrooms) or trained their models using subjective survey and questionnaire data [
28,
29,
31,
32]. Deep Learning (DL) is increasingly being used for thermal comfort prediction as it offers better accuracy than conventional ML algorithms [
10]. DL is also generally more suited for accurate multi-task learning [
35]. It is better equipped to learn shared representations from interrelated tasks through layer-sharing of multi-task networks [
36]. Given the capabilities of DL the proposed DeepComfort model employs deep neural networks. A comparative analysis of Deepcomfort and STL models is presented in
Table 1.
In this work, TSV, TPV, and TCV are considered the outputs (Labels) of the proposed DeepComfort model. The responses for these metrics along with other data were gathered from the survey and measurement exercise, discussed ahead.
3. Field Experiments and Survey Methodology
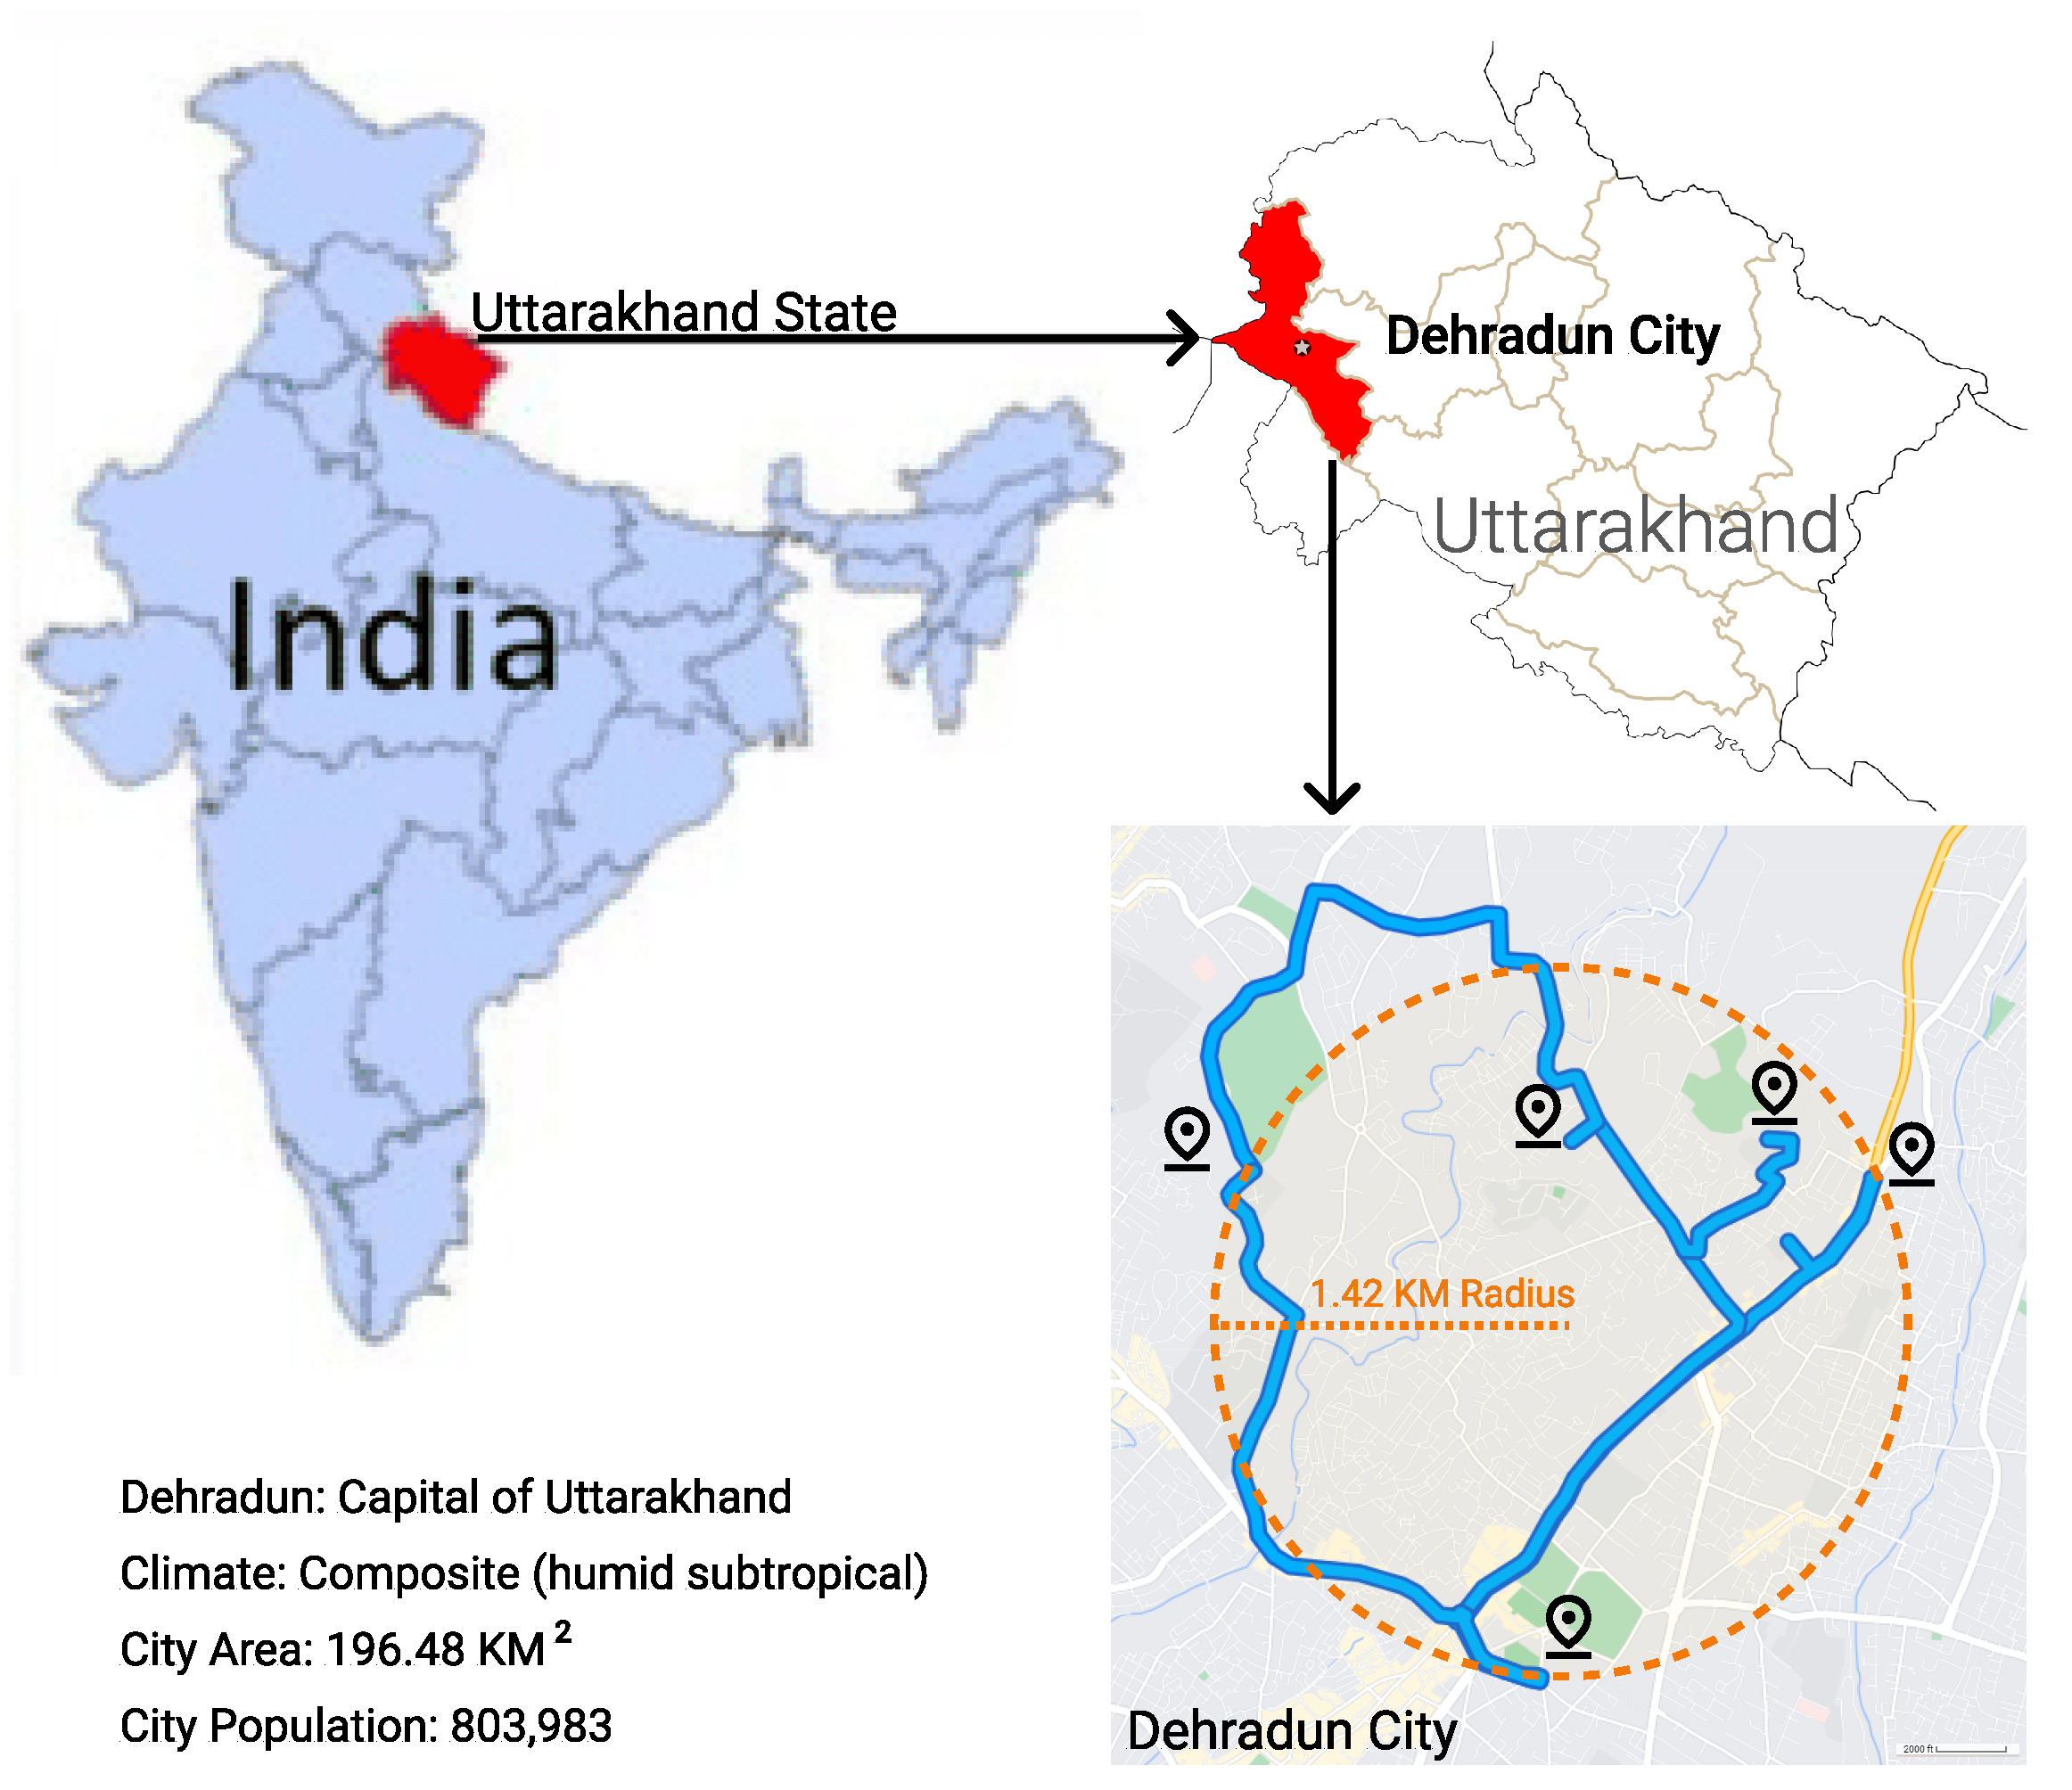
The real-world primary student dataset for the analysis in this work was gathered in the city of Dehradun, which is popularly known as the “School capital of India”.
3.1. Overview of Location, Climate, and Schools
Dehradun city is located in a valley, in the Himalayan state of Uttarakhand, India, as shown in
Figure 4. It has characteristics of both the Himalayan Climate (moderately cold winters) and Humid Subtropical Climate (Cfa), of the Köppen Climate Classification, therefore falling in the category of composite climate. Consequently, the city enjoys pleasant year-round weather, making it an ideal location for learning and academics. The winter temperatures usually fall in the range 1–20 °C and January is historically the coldest month of the year when the daily maximum temperature is 6 °C on average. Bearing these facts in mind, the survey was conducted in January, when the students are likely to experience maximal discomfort due to the cold.
The field experiments and surveys were conducted in five schools, namely, Grace Academy, St Thomas School, Kendriya Vidhyalaya, Cambrian Hall, and Jaswant Model School. The schools lie within a radius of 1.42Km, as shown in the partial map of Dehradun city in
Figure 4.
A few photos of the field experiments and surveys are presented in
Figure 5. To ensure confidentiality, the gathered data is anonymized. Henceforth, the schools are denoted as School
, where
is randomly assigned to a particular school. The surveys were administered during school hours on consecutive days, between 8:30 a.m.–12 p.m. It is the coldest period in a working-day and students are likely to experience the most discomfort. The typical duration of survey and field experiments in each class/session was 30 min.
This study was conducted in 14 naturally ventilated classrooms which makes the thermal comfort prediction more challenging [
5,
6]. Further, the architectural design and construction styles of schools and classrooms considered in this study differ considerably. Notable differences in orientation, the number of stories in the buildings, and the ambient classroom environment were also observed. Therefore, some variation in parameters such as the indoor temperature and relative humidity was recorded across schools and even across classrooms in the same school. Elements of campus planning for composite climates e.g., an open courtyard plan for improved cross-ventilation, can be noticed in the architectural layout of three of the five schools. The schools and classrooms had certain commonalities as well. Similar construction materials like a reinforced concrete structure with a painted wall finish were noticed. In general, building walls and windows were not well insulated, and classrooms lacked cross-ventilation as the ventilators (higher window openings in the corridor-side wall) were closed shut. Further, each classroom was well lit with ample natural and artificial lighting.
The primary school students from class-levels/grade-levels 3rd to 5th, typically belonging to ages 6–13, are the participants of this study. Primary school children are not only more vulnerable to an unfavorable thermal environment due to their limited adaptive capacity, they are also less likely to express their discomfort due to psycho-social constraints [
37,
38,
39,
40]. These factors introduce additional complexity in predicting their thermal comfort perception. The current body of ML-based thermal comfort prediction studies is focused on adult participants aged 20–the 30s [
5]. Recent surveys also highlight the need for a greater research emphasis on studies with children as the primary participants [
5,
6]. Addressing the challenges specific to children that are discussed above will be useful and add meaning to the current state-of-the-art.
This study intends to bridge this gap. The dataset comprises 2039 responses collected from 512 primary school children as unique participants. A school-wise quantitative distribution of the participants is presented in
Table 2.
3.2. Survey Methodology
Research show that even minor changes in metabolic activity for a short duration can impact thermal comfort perception and preference of an occupant [
41]. The study recommends that participants should maintain a stable level of activity for a duration of 15–20 min prior to thermal responses. Therefore, classes following physical activity (e.g., sports, physical education, music, choir practice) were avoided to ensure minimal impact of heightened metabolism on the thermal comfort survey. It is prescribed that the surveys be conducted during early winter mornings when children in naturally ventilated classrooms are likely to experience maximum thermal discomfort [
41]. Therefore, despite logistical and administrative challenges, 93% of the survey responses were collected before 11:00 a.m., during the coldest hours of a winter workday. The study divided the surveys into 6 time slots, each consisting of half-hour duration, from 9:00 a.m. to 12:00 p.m., represented as Slot
, where
. On the first day of the study in every classroom, prior to filling out the questionnaire, students were introduced to the survey and given a brief description of the purpose and aim of the study. Thereafter, a detailed explanation of every question and a list of possible responses/answers were provided, followed by an interactive question-and-answer session to clarify any doubts the children might have had. This was done to minimize errors due to poor understanding of the questions, terminology, and answer options. Further, special care was taken to avoid any bias (e.g., leading the participants, confirmation bias, etc.) through measures such as requesting the teachers to let authors take control of the classroom for the period of the survey and allowing the students to randomly place the filled out survey in the stack to ensure anonymity.
3.3. Survey Questionnaire
A questionnaire is an essential component of a thermal comfort study as accurate responses are extremely necessary for quantitative modeling of subjective responses [
5,
42,
43]. Therefore, the questionnaire designed for this study was in the form of multiple-choice questions (MCQ) and involved the use of simple vocabulary and illustrations like animated characters. Whenever necessary, vernacular language was used to explain the terminology or clarify doubts.
Figure 6 shows an illustration of the survey.
The survey comprised of 21 questions, focusing on qualitative aspects of thermal comfort that vary across individuals, such as the subjective thermal sensation (TSV), preference (TPV), comfort (TCV), thermal acceptability (TA), etc. These terms were simplified into questions that were semantically and linguistically compatible with the cognitive capabilities of the participants, i.e., primary school children. Questions related to layers of clothing (to derive Clothing insulation value) and whether students modified their clothing was also asked. In addition, questions pertaining to the adaptive opportunities available to the participants were also asked to assess how frequently they can adjust themselves to their surroundings or modify the environment itself.
The questionnaire also sought information regarding the age and gender of the participants to assess the impact of age, cognitive ability, and gender-specific clothing, on thermal comfort perception and adaptive ability. The gender distribution of the overall participant group was almost equal, with 52% responses received from male students and 48% from female students. Since the participants were minors, to ensure privacy and confidentiality, the questionnaire did not ask/collect any personal information such as physiological data (e.g., height, weight, etc.), racial and ethnic data, household status (e.g., single/multiple parent(s)), and parental income group. Please note that the questionnaire sought the information that the administrators of all participating schools approved.
3.4. Measurements and Climate Data
The field experiments are accompanied by the “right-here-right-now” questionnaire, specially designed for primary school students. While the students filled in the questionnaire sheet, parameters such as indoor air temperature, relative humidity, and outdoor air temperature were measured every 2 min using IoT devices/sensors, viz., TandD TR72wf-S and TandD TR52-i, respectively. The IoT devices were calibrated prior to the measurements and technical specifications are presented in
Table 3. Finally, the outdoor weather data for daily maximum, minimum, and average temperatures was collected from Indian Meteorological Department (IMD) of the city for the surveyed days.
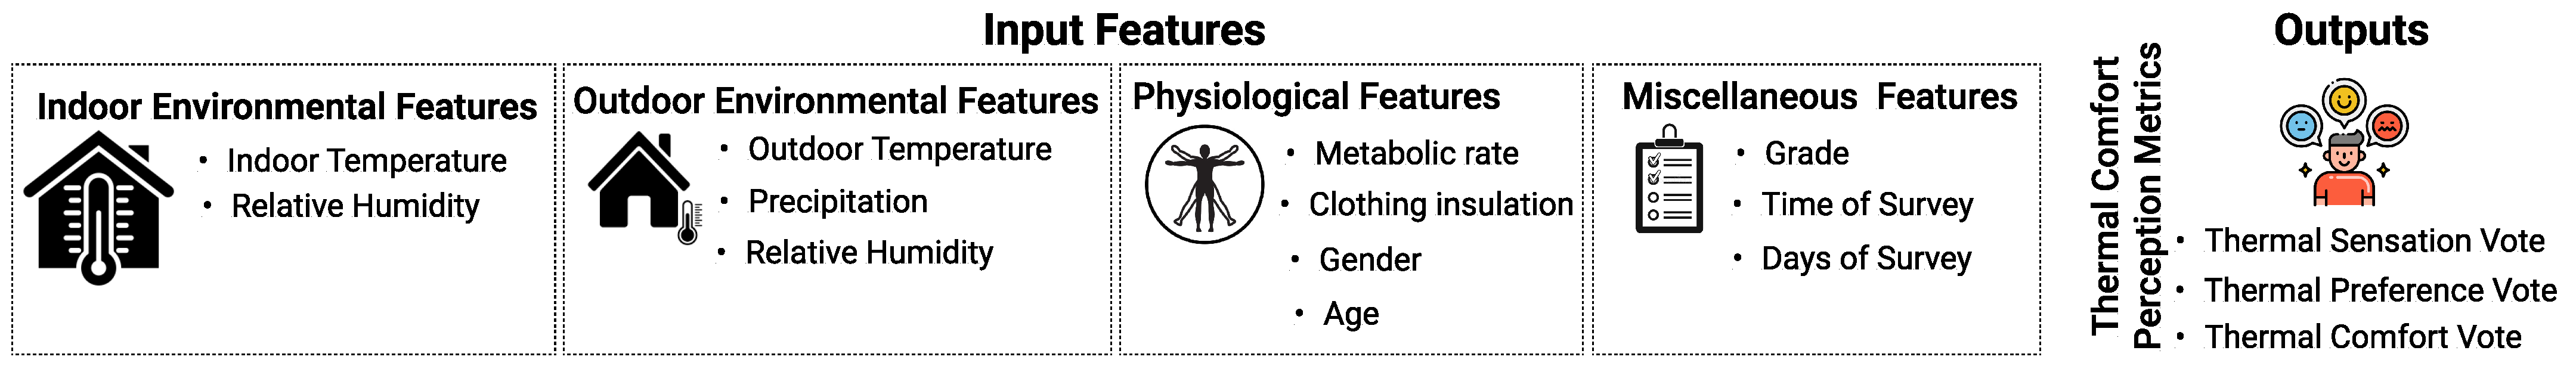
The important features and outputs considered in the analysis and the proposed DeepComfort model are depicted in
Figure 7. These include measured indoor and outdoor parameters, weather data, and survey data (21 subjective questions). Exploratory data analysis of important features and the three TC output metrics is presented ahead.
5. System Vision and Implementation
This study envisions a practical and feasible real-world implementation of a thermal comfort prediction model. The comprehensive large-scale survey was conducted with that vision in mind. However, implementing the proposed DeepComfort model in classrooms will require resources and greater institutional participation. Nevertheless a high-level overview of practical solution is presented next, followed by the technical details of the implementation.
5.1. System Concept and Vision
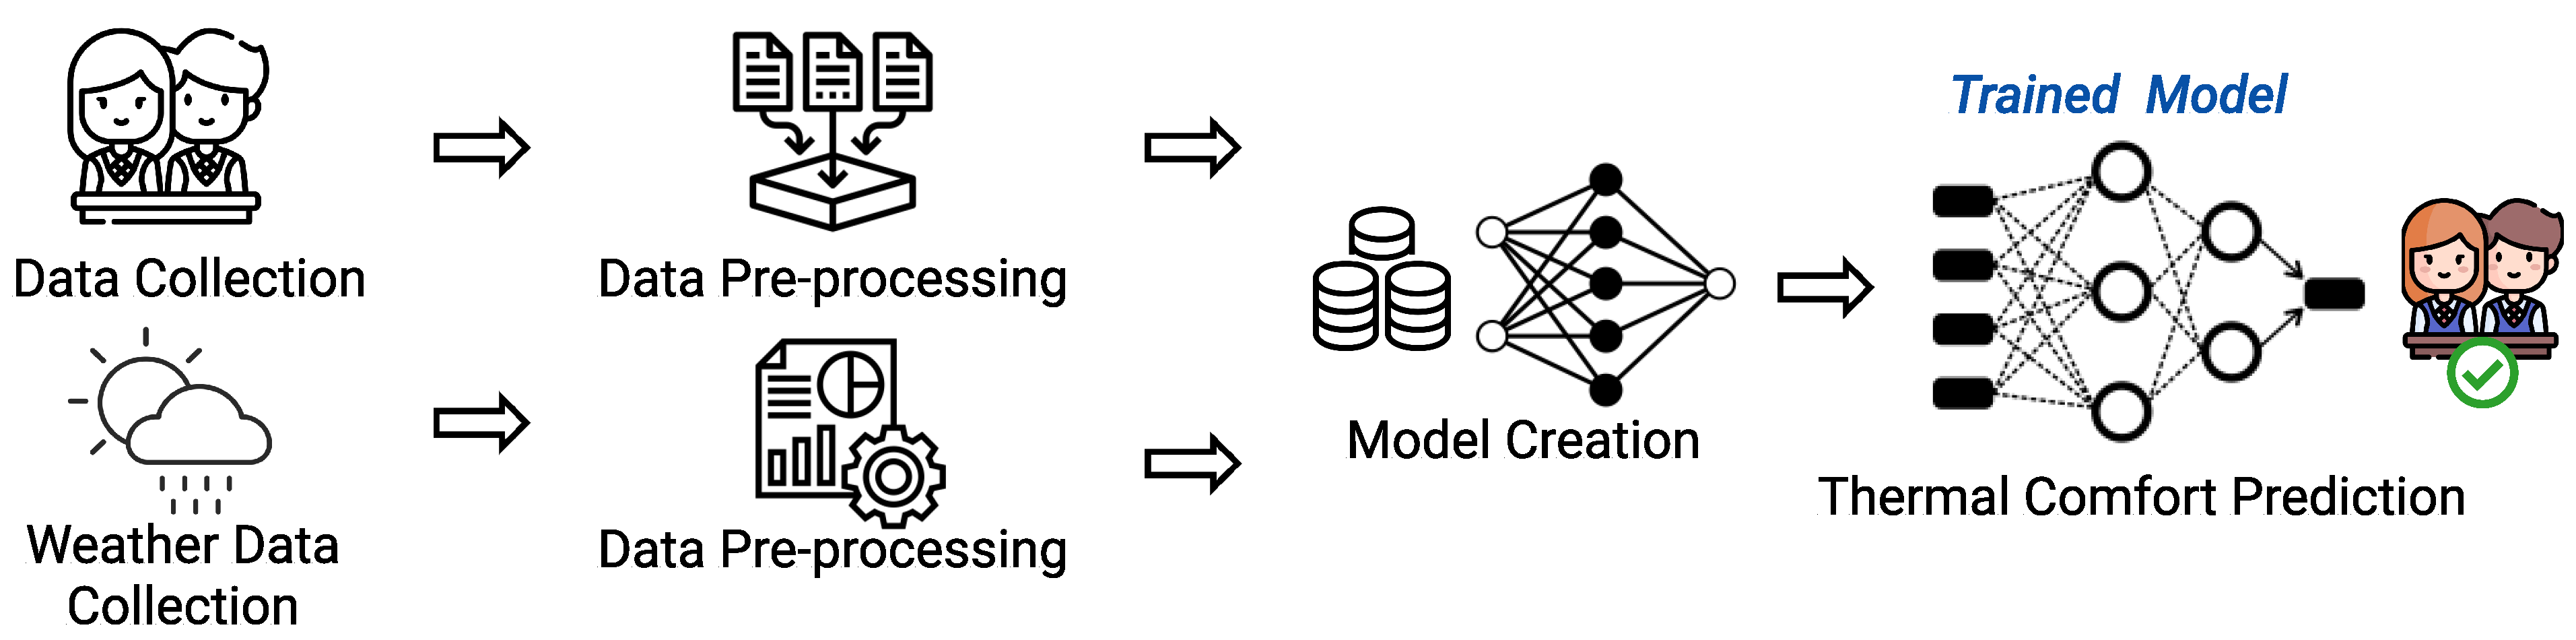
The DeepComfort system architecture is illustrated in
Figure 13. It is conceptualized as a two-stage system with an offline data gathering and training stage and an online thermal comfort prediction stage. DeepComfort initializes the offline stage by data gathering of ambient temperature, relative humidity, clothing level, etc., and students’ subjective thermal comfort responses. The data can typically be collected by a Thermal Collector App running on the student’s tablets in school. In this study, the data was gathered using paper questionnaires at schools as tablets could not be used due to logistical reasons. Thereafter, the collected data is sent to the local server for further processing. The pre-processing modules handle missing information and put the data in a format appropriate for further processing.
Next, the Model Creation module builds and trains a deep learning-based multi-task learning model to accurately predict students’ thermal comfort, thermal sensation, and thermal preference. This module also determines the optimal model hyperparameters (discussed in
Section 6.3). To do so, the module employs
grid search—an exhaustive search that iterates on numerous combinations of parameters’ values until the optimal value, that maximizes the model accuracy, is achieved.
Finally, the trained MTL model is stored for later use in the online phase. During the online phase, the school admins or instructors can at any time estimate the thermal comfort of each student by providing the inputs (e.g., ambient temperature, clothing values etc) to the trained model in the offline stage.
5.2. Model Design and Implementation
We define the prediction of TPV value as a task that require learning and similarly for TSV and TCV. Thus, the aimed prediction model is expected to maximize the likelihood of correct prediction of the joint performance of all targeted tasks at the same time given the input features. This is different from the state-of-the-art techniques that build a single model for each task and thus yield confusing predictions (e.g., too cold and very comfortable).
DeepComfort employs multitask learning of different thermal comfort metrics. The intuition behind this is to effectively and simultaneously boost the learning ability of the trained model for all target thermal comfort metrics leveraging the inherent correlation between them. This leads to a general model that jointly improves the prediction accuracy of each individual metric (task) as well as avoids the model overfitting while training. The state-of-art techniques, usually, build a single model for each target thermal comfort metric which in general leads to overfitting problem and/or partial estimation of thermal comfort.
DeepComfort adopts hard parameter sharing which is the most commonly used approach to training multitask neural networks [
35]. It is generally applied by sharing the hidden layers between all tasks while keeping several task-specific output layers. Hard parameter sharing greatly reduces the risk of overfitting. In fact, it showed that the risk of overfitting the shared parameters is an order
T–where
T is the number of tasks–smaller than overfitting the task-specific parameters, i.e., the output layers. This makes sense intuitively: The greater the number of tasks that are learned simultaneously, the more the proposed model has to find a representation that captures all of the tasks, thereby reducing the chance of overfitting.
To formally state the of proposed multi-task learning model, assume there are T tasks. For each task t, we have N samples; denotes to the sample, where , is the set of features and is corresponding label of the task. A task is an abstraction read from raw data. Typically, each task t has a set of training samples that overlaps with the other tasks in the input features. The most traditional way is to train an individual model for each task t that maximizes the probability of obtaining the true label given the input x, where is the model parameters. However, we build multitask learning over all tasks leading to a tasks-collaborative prediction model where . This ensures that obtained model is more robust since it optimizes the cumulative prediction performance of all tasks together.
Figure 14 shows the proposed deep network structure. We construct a deep fully connected neural network consisting of a common cascaded hidden layers of non-linear processing neurons. Specifically, we use the hyperbolic tangent function (tanh) as the activation function for the hidden layers due to its non-linearity, differentiability (i.e., having stronger gradients and avoiding bias in the gradients), and consideration of negative and positive inputs [
45]. The input layer of the network is also common with a vector of length
d representing the collected features from the students in the school of interest.
The network consists of three subnetworks stacked over the common hidden layers; each subnetwork is dedicated to one of the thermal comfort metrics (TSV, TPV and TCV). The number of neurons at the output of each subnetwork is corresponding to the number of comfort levels (values) of its dedicated metric. For instance, thermal comfort can be reported by three levels of TSV including, −1, 0, 1 for cool, neutral, and warm. Thus the TSV subnetwork is trained to operate as a multinomial (multi-class) classifier by leveraging a softmax activation function in the output layer. This leads to a probability distribution over the reference TSV levels given an input. The same architecture is considered for TPV and TCV.
To increase the model resilience to over-fitting, DeepComfort employs the dropout regularization [
46] which is shown to be feasible for the efficient training of deep neural networks. This technique can sample from many neural networks of different architectures during the training process. This can be realized by stochastically removing (i.e., dropping out) some neurons in addition to their connections from each layer in the network. In effect, each layer has a new “view” different from the original configured layer in each epoch in the training. Dropout has the effect of making the training process noisy, forcing units within every layer to stochastically take on more or less responsibility for the inputs. As a result, it prevents the neurons from co-relying on each other during the training process, leading to a more robust model that is less likely to overfit the training data.
The current implementation and validation of DeepComfort is done locally, and both training and testing of the models ability to predict students’ thermal comfort perception is performed in the offline mode. The proposed deep learning model was implemented using
Keras, which is a high-level neural networks API running on top of the Google TensorFlow framework [
47]. The model is trained on a Lenovo ThinkStation P920 server with Nvidia RTX3080 ti GPU, and 320GB RAM. After running numerous experiments, the deep learning architecture of 20 × 50 × 80 × 100 × 120, delivered the best performance.
6. Evaluation of DeepComfort
This section presents the performance evaluation of the proposed DeepComfort multi-task model and highlights the challenges involved in thermal comfort prediction for primary school students.
6.1. Evaluation Methodology
To evaluate the proposed system and its trained multi-task learning model and confirm its generalization ability, K-fold cross-validation is employed, where . The dataset is partitioned into k subsets i.e., folds. Each time, folds are merged to form a training set and the remaining one is leveraged as the validation set. Hence, every sample of our dataset appears in a validation set exactly once and appears in a training set times. Thereafter, the average error across all k folds is reported and is used to select the model parameters. This significantly reduces the impact of the bias-variance problem due to the interchange of the training and validation sets.
In this section, we quantify DeepComfort’s performance using different criteria including, Accuracy, Precision, Recall, F-Measure, and Confusion Matrix. Accuracy is the percentage of predictions our model correctly obtained. Precision quantifies the number of correct instances out of all predictions as an arbitrary class. Recall quantifies the number of correct predictions made out of all instances of a specific class. F-Measure (F1-score) provides a single score that balances both the concerns of precision and recall in one number, as: .
The overall validation and performance evaluation of DeepComfort is done using Precision, Recall, F-Measure, and Confusion Matrix. However, for the clarity of presentation, the effect of different system parameters and categorical features is presented in terms of Accuracy.
6.2. DeepComfort Validation on ASHRAE II & Our Data
The first step is to evaluate the generalization ability of the proposed DeepComfort model. To that end, the model is trained and tested on the ASHRAE II dataset [
25]. The ASHRAE Global Thermal Comfort Database II is the largest publicly available open-source database, created from landmark thermal comfort field studies in 28 countries, spread across the globe. The database includes over 50 attributes, including objective environment data, subjective TC metrics, built environment characteristics, climate and weather data, and participant information [
25]. However, the ASHRAE II database doesn’t have provide a dataset for primary school students, i.e., for students of age 14 or lower. (Please note that less than 250 samples with only TSV and TPV data are available). Therefore, all data for students under the age of 18 in naturally ventilated classrooms available in ASHRAE II database available was considered for evaluation of DeepComfort.
Figure 15 shows the performance of DeepComfort benchmarked against ASHRAE II data. There are some characteristic differences between the two datasets, which include the number of features, the number of classes of each TC metric, and the number of samples. The comparison is performed in terms of Precision (Accuracy), Recall, and F1-score metrics. Despite the differences in the two test sets, the DeepComfort system demonstrates a consistent performance for all three metrics. The, prediction performance is slightly better for ASHRAE II database. This is justified, as ASHRAE II data participants are young adults (ages 14 to 18) or adults with developed cognition and reasoning. In contrast, our primary student data is mainly gathered from participants in the age range of 6 to 13, and due to children’s cognitive limitations, is likely to have a higher frequency of “illogical votes”, which can be considered to be outliers but can not be ignored or dropped from the model. Nevertheless, DeepComfort overcomes this challenge and demonstrates high prediction Accuracy for all three TC response metrics. The results validate the suitability of multitask learning for thermal comfort prediction even when outliers are present.
6.3. Impact of Hyperparameters
Hyperparameter tuning is vital for a deep neural network’s performance. Recent surveys on the application of machine learning to the domain of thermal comfort have expressed a concern that a deep neural network may become a
black box for the research community if the inner workings of the models are unknown [
5,
6]. It also poses challenges in replicating the proposed models. To address these concerns, this section analyzes the impact of different hyperparameters on DeepComfort performance viz., the number of layers in the network, the number of epochs, and the learning rate.
6.3.1. Number of Layers
One of the salient hyperparameters is the number of layers of the deep network as it reflects the distributed (i.e., hierarchical) capability of the model.
Figure 16a shows the effect of changing the number of hidden layers of the multitask model on DeepComfort accuracy. The figure shows that increasing the number of layers increases the performance due to increased model capacity until it reaches six layers. After that, the model tends to overfit the training data, reducing performance in all TC metrics. Therefore, we choose six layers as the default number of layers in our to multitask thermal comfort model.
6.3.2. Number of Epochs
Training a deep network is a challenging process since overtraining may force the model to stop generalizing and learn to memorize the training data. On the other hand, too little training may lead to underfitting leading to poor performance even on the training set.
Figure 16b shows that 750 epochs is an optimal value which leads to the best performance of DeepComfort.
6.3.3. Learning Rate ()
Tuning the model’s learning rate is an important step as it controls how much the network weights are adjusted with respect to the loss gradient.
Figure 16c shows the impact of changing the learning rate on the DeepComfort performance. The figure shows that a learning rate of
= 0.001 obtains the best performance of DeepComfort in all thermal comfort metrics. This can be justified as the model at this value balances between larger and smaller learning rates. Larger learning rates may lead to a divergent training process. On the other hand, smaller learning rates may conversely lead to non-optimal convergence of the training process.
6.4. Deepcomfort vs. Single-Task Models
An important aspect of evaluation is to compare the performance of DeepComfort with single-task thermal comfort prediction models implemented using state-of-the-art ML techniques. A total of 6 single-task models are considered which include both supervised and unsupervised, shallow and deep algorithms, briefly described below.
In [
15] Support Vector Machine (SVM) is employed to implement single-task models that predict the TSV and TCV individually. Further, a deep neural network (Bayesian Network) approach, denoted as “DNN”, is adopted in [
10] for estimating TSV. DeepComfort is also compared with Decision Tree which is a commonly used technique for single-task TC classification and prediction [
48]. Additionally, Random Forest classifier is also included in the comparison due to its effectiveness as it builds a forest of many decision trees; each of them outputs a class prediction, and the class with the majority votes will be reported by the model [
48]. In K-nearest neighbor (KNN), a class is estimated by its plurality among its neighbors, i.e., the sample is assigned to the class most common among its “k” nearest neighbors [
49]. Finally, the Adaptive Boosting (AdaBoost) technique is an ensemble boosting classifier. It builds a robust classifier by combining multiple weak classifiers ensuring accurate predictions of unusual samples [
6].
Table 4 shows DeepComfort’s performance when compared to these single-task techniques with respect to F1-score, Precision, and Recall. F1-score is chosen for comparison instead of Accuracy because due to the data imbalance in the dataset, prediction of minority classes is not adequately reflected in Accuracy. The results confirm that the proposed multi-task learning model outperforms the other techniques, even the Bayesian deep neural network.
This can be justified for two primary reasons. First, the distributed learning ability of the deep neural network enables automatic feature learning improving the accuracy of prediction. Second, the enhanced generalization ability due to the multi-task learning model further maximizes the prediction accuracy of all tasks simultaneously. The second reason is the main point of distinction when compared to the 6 single-task models. Moreover, the proposed MTL model’s design boosts the learning of general and accurate models through regularization techniques.
6.5. Classification Challenges & Performance
Next, the analysis of the multi-class classification performance of DeepComfort is presented.
Figure 17 shows the confusion matrices of the system performance corresponding to each
task (e.g., TSV, TPV, and TCV). Relevant sections of each TC metric scale are also presented for ease of reference.
The confusion matrices show the robustness of the system in dealing with data bias. For example, since the proposed model is trained with winter data in the composite climate, the majority of samples for TSV are either “Neutral” or “Cool”. This biased data distribution, in general, leads to a biased model that incorrectly estimates other values such as “Cold” or “Warm” as “Neutral” or “Cool”. Despite this challenge, the model shows a good generalization and non-biased capability by leveraging the generalization ability of multi-task learning and through regularization techniques. A similar non-biased performance, across all classes, can be observed for the other two metrics, viz., TPV and TCV in
Figure 17b,c.
It is noteworthy that some false predictions emerge from the unclear boundaries between different classes, e.g., “Slightly Comfortable”, “Comfortable”, and “Very Comfortable” in TCV. The role of cognition is crucial here, which highlights why TC prediction for primary school students in naturally ventilated environments is challenging. Despite the use of illustrations and easy-to-understand language, primary school students seem to find difficulty in assessing their situation with respect to the standard TC metric scales (TCV in this case). Multiple classes with nuanced differentiation achieved through the use of qualifiers such “Slightly” or “Very” seems to confuse young primary students. This lack of clarity also affects the correspondence (if not correlation) between student responses that fall in minority classes for the three metrics. Case in point, in
Figure 17, the number of “Cold” sensation (TSV = −2) labels, are far less than “Much Warmer” preference (TPV = 2) labels, both of which are much higher than “Uncomfortable” and “Very Uncomfortable” comfort labels (TCV = −2, −3). Thus, the inconsistency in responses while filling the survey (the model ground-truth), often results in inaccurate model predictions. Yet, despite these challenges in the multi-task multi-class classification goal, the DeepComfort system is able to simultaneously achieve a prediction Accuracy of 90%, 87%, and 89%, for TSV, TPV, and TCV metrics, respectively.
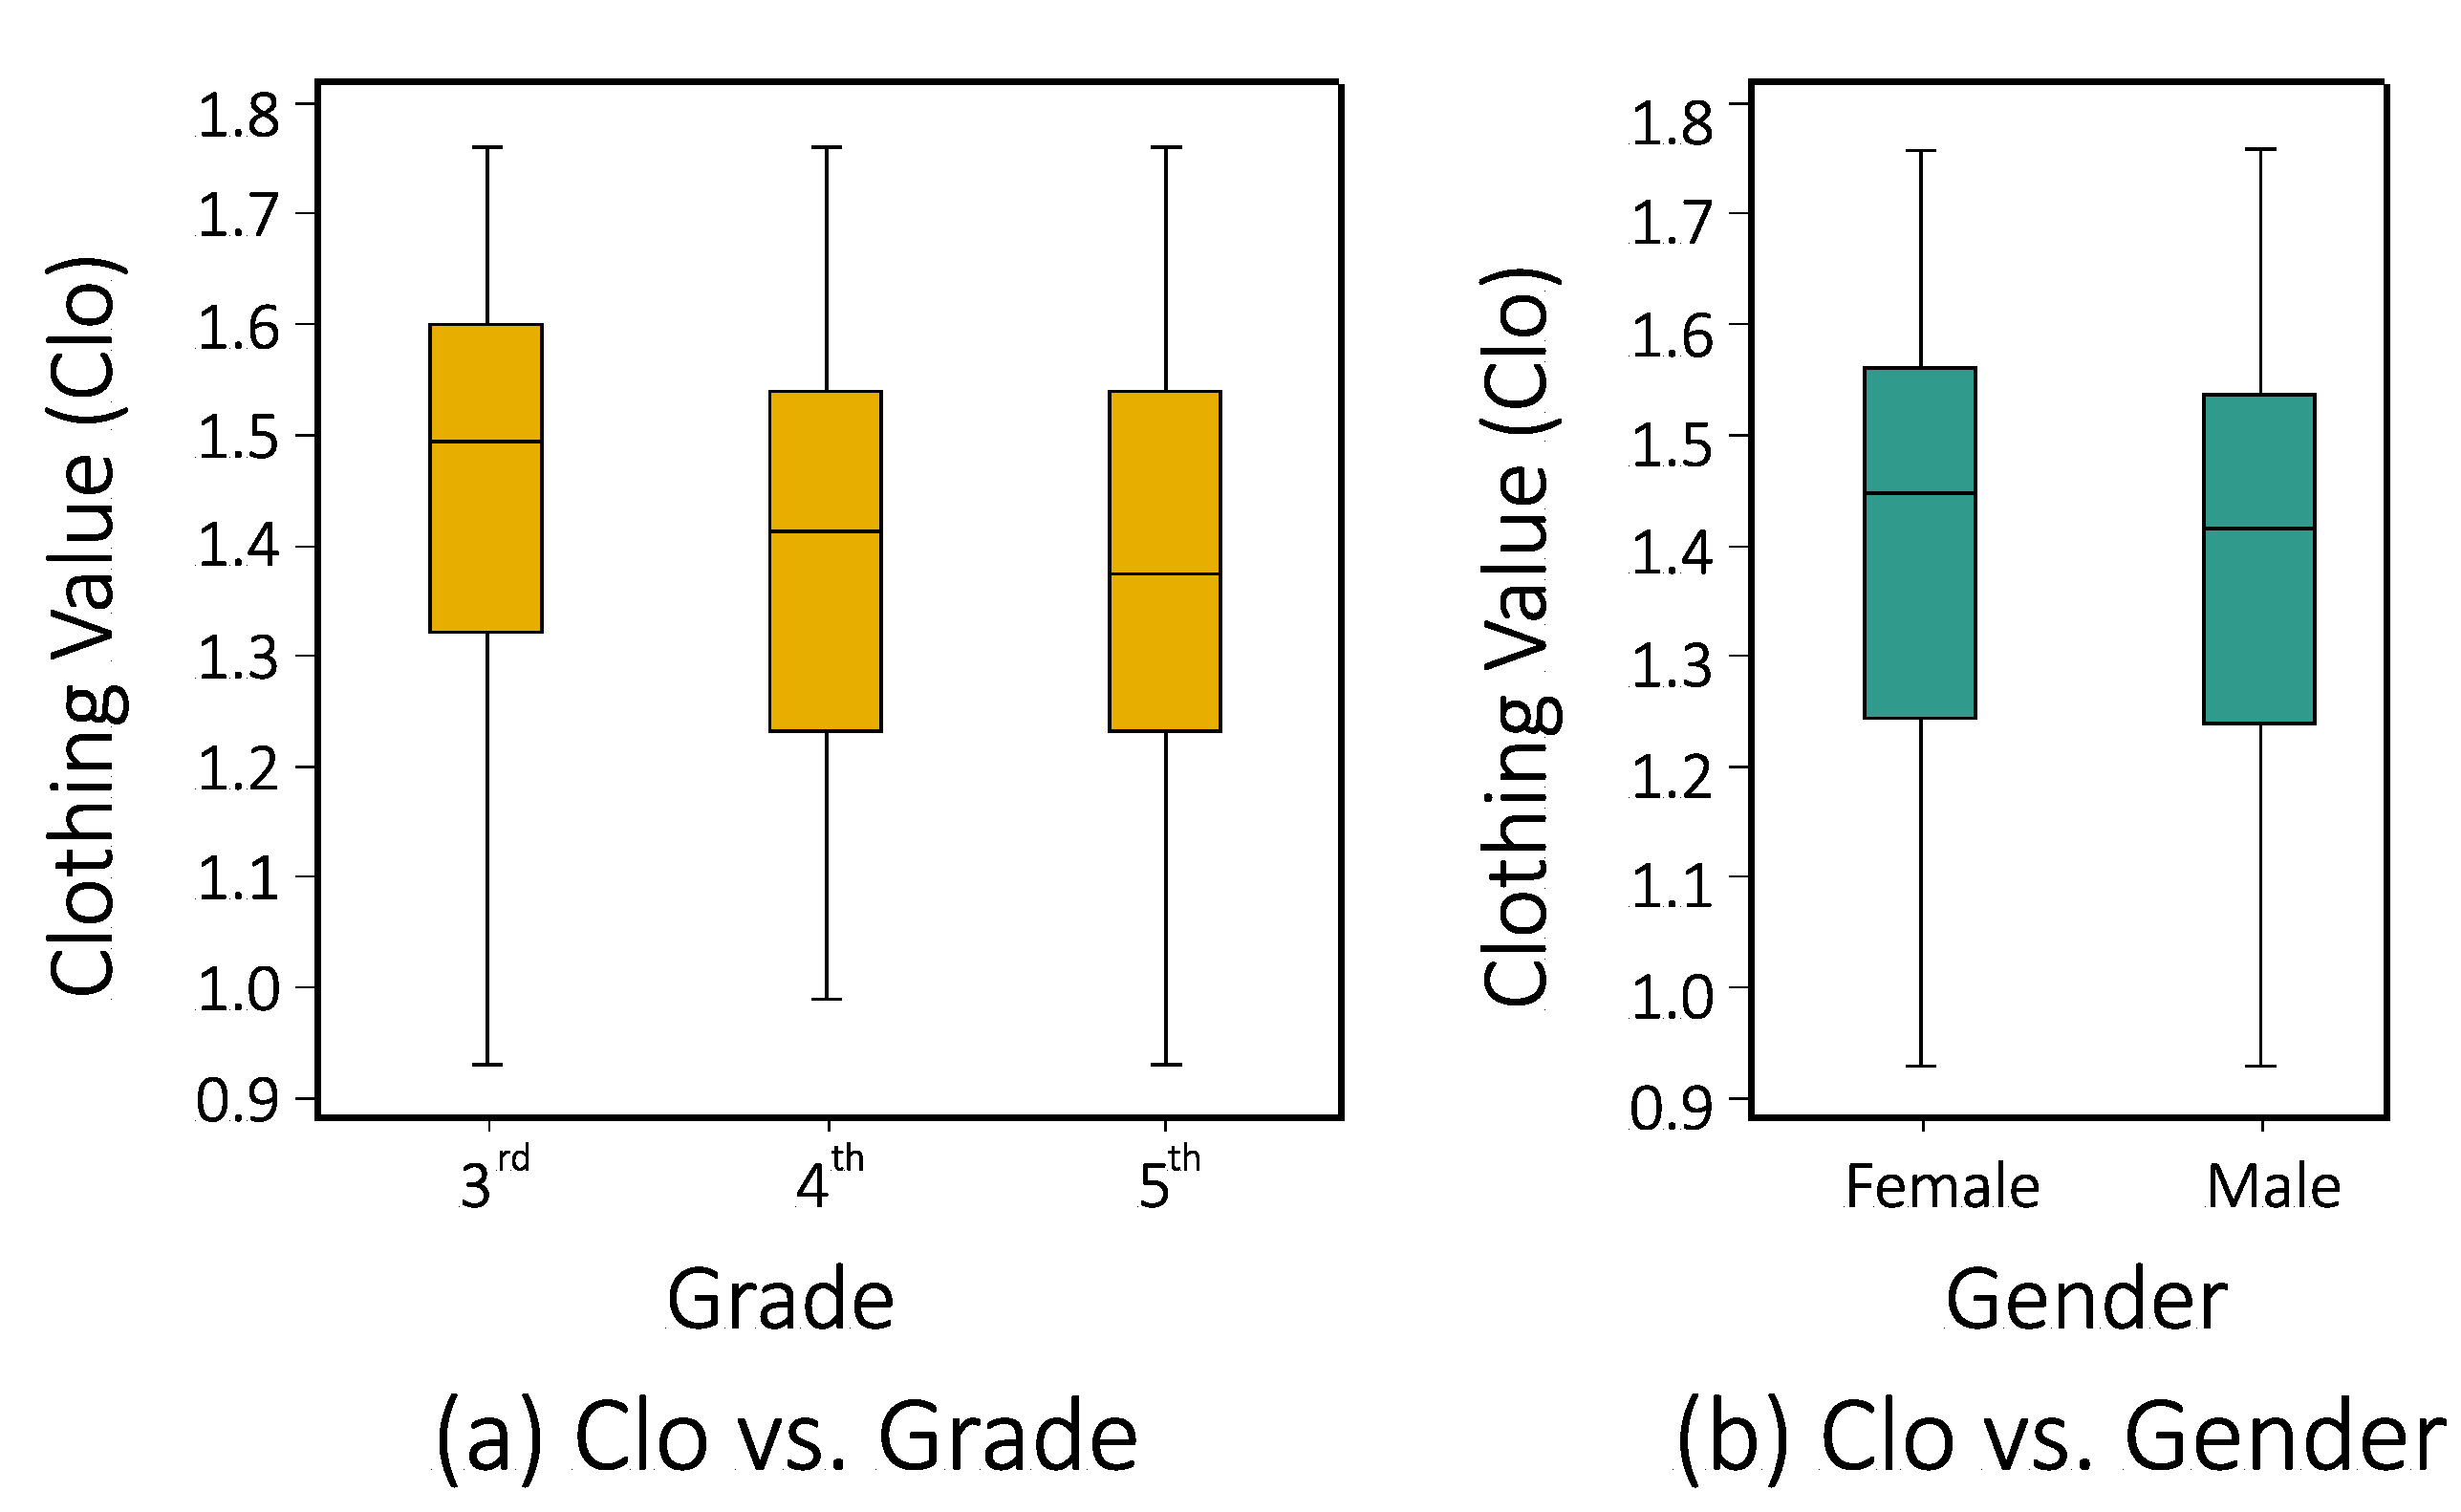
6.6. Categorical Features & Model Accuracy
Figure 18, demonstrates the impact of various features such as clothing, grade, and gender on DeepComfort performance. Two observations can be made. First, the features invariably impact the performance of the classification models. Second, the impact of the feature on a model’s performance i.e.,
feature importance, varies across features.
It is a worthwhile objective for a classification/prediction model to have high generalization capability, i.e., achieve high accuracy regardless of the distribution of features. However, from the perspective of prediction of subjective TC responses, it is important to ensure that the model performance is consistent for all categories of a feature.
Thus, it is desirable, and an objective of this work, to stabilize DeepComfort performance across schools, survey timings, the gender of students, days of the survey, and the grade of students. DeepComfort achieves this objective by precisely training the model for specific variations in the categorical features, e.g, Male and Female students. The complexity of the task lies in the trade-off involved between achieving generalization ability and maintaining high accuracy for all values of categorical features. An alternative goal can be to highlight the differences in the impact of individual features on students’ TC perception, which is beyond the scope of this current work.
The results for the five features analyzed earlier are presented in
Figure 19. DeepComfort is able to achieve high Accuracy (80–96%) in all three metrics, for all features in the feature-category-specific evaluation. There is some variation in Accuracy, which is expected. Further, explanations for the fluctuation in Accuracy in feature categories can be attributed to the unusual distribution of TSV, TPV, and TCV values in those categories.
With respect to Schools as the feature, School 3 and School 4, have the lowest Accuracy. Considering the case of School 4, the fluctuation is due to the fact that a higher proportion of students respond to feeling “Cold” and “Cool” sensations (TSV = −2, −1), yet they also respond to feeling varying levels of comfort (TCV = 1, 2, 3). This ambiguity is less prominent in other schools, where the majority of students experience a “Neutral”, sensation along with varying levels of comfort. In School 3, there exists a lack of congruence between the distribution of sensation, temperature preference, and comfort, votes. For example, School 3 has a high proportion of both “Cold” sensation votes (TSV = −2) and “Very Comfortable” (TCV = 3) votes, which confuses the model, resulting in poor Accuracy.
Considering female and male students as the categories for Gender, a higher proportion of female students responded that they feel “Cold” (TSV = −2) but did not express any discomfort on the TCV scale. As a consequence, the Accuracy for male students is slightly higher. A similar trend is observed in 3rd, 4th, and 5th grades as categories for the grade feature. As the cognitive ability of the students increases with the grade, the number of illogical votes goes down, leading to slightly improved Accuracy.
For days of the survey, the Accuracy results for specific days conform to the trend of TSV, TPV, and TCV distributions, discussed in Section IV. The Accuracy for the first 3 days remains stable, with minor variations, but drops slightly on Day 4 and is highest for Day 5. Another reason for very low Accuracy is high data imbalance. For example, for Slot 6 in survey time-slots, the Accuracy drops down to 80%, which is because of the high data imbalance in this class.
The analysis presented in this section demonstrates that the proposed DeepComfort model offers high generalization capability and stable performance. Based on the results and the challenges encountered, a few inferences and conclusions are presented in the next section.
7. Conclusions and Future Work
This work sought to address the problem of multiple TC prediction models for each indoor space, one specific to each metric. To that end, it proposed multi-task learning inspired deep learning model named “DeepComfort”, which concurrently predicts three TC metrics, viz, TSV, TCV, TPV. Further, this work envisions a real-world implementation of the proposed DeepComfort MTL model. Thus, the model was validated on a large dataset gathered through a month-long comprehensive survey and field experiment involving 5 schools, 14 classrooms, and 512 unique primary school student participants.
The first inference can be made on the suitability of multi-task learning for thermal comfort prediction. The proposed MTL solution requires a single model to simultaneously predict the three subjective TC response metrics, viz., TSV, TPV, and TCV. Deepcomfort is shown to outperform 6 single-task learning models. Further, predicting thermal comfort for primary school students in naturally ventilated environments is challenging because of children’s limited cognitive ability to perceive and assess the classroom environment. Consequently, there is a higher volume of illogical responses in the surveys that typically lower the accuracy of multi-class classification. Despite these challenges, the deep network architecture of DeepComfort allows it to maintain high prediction Accuracy for our primary student data as well as ASHRAE II data, ensuring high generalization capability. The DeepComfort model also demonstrates consistent performance for different categories of categorical features with different characteristics.
Given the satisfactory performance of the proposed multi-task learning model, the next step is to extend the implementation to predict a larger set of TC metrics including Thermal Acceptability, Temperature Satisfaction Levels, etc. The future work also entails including not just TC metrics but also adaptation behaviors such as opening/closing windows and modifying clothing, as prediction “tasks” in the multi-task model. We also intend to address the problem of illogical votes through imbalanced classification, autoencoders, etc. Further, the impact of spatial and temporal variability on thermal comfort prediction will also be explored.


