1. Introduction
Steel-concrete composite girders are the main structural elements for many bridges around the world. The advantages of the rapid construction of steel girders and the cost-effectiveness of the reinforced concrete slab have made it an attractive option for bridge construction. External post-tensioning has been used in steel-concrete composite girders for decades owing to its ease of application. Using this pre-stressing method has been shown to be effective to increase the flexural capacity of composite beams [
1,
2,
3]. The behavior of post-tensioned steel-concrete composite girders is greatly affected by the existence of shear connectors, a key component that plays a vital role in preventing slippage and separation between the concrete slab and steel girder. Thus, when designing stud-connected composite beams, special attention should be paid to the design of the shear stiffness and the longitudinal spacing of shear connectors to obtain the optimal interfacial strength of the composite beam [
4]. The degree of shear connection provided by the shear connectors greatly affects the structural performance and failure mode of composite girders [
2,
5]. Headed stud shear connectors are the most used type of shear connectors in steel-concrete composite girders.
In addition to the static loading, composite bridge members are prone to damage from traffic-induced cyclic loading, which is very detrimental to the integrity of the shear connectors, and hence, to the structural integrity of the overall composite girder. Repeated loads can lead to the initiation of micro-cracks in the shear connectors, which propagate as the cyclic loading continues until the failure of the shear connectors. This failure process, known as fatigue failure, happens suddenly with no significant deformations preceding it [
6]. One of the most common fatigue failure modes of stud shear connectors is the fracture at the base of the stud. This failure mode usually starts in composite girders in the studs located in the beam end regions [
7]. The fracture of studs in only one end of the beam was reported by Wang et al. [
8] as the failure mode of fatigued steel-concrete composite beams. Other common failure modes include cracking of the steel beam around the studs and cracking in the welding zone of the studs, both of which expand until the complete fracture of the studs [
9]. All these failure modes are the consequences of cracks that initiate due to stress concentration and imperfections in the materials used, and propagate during loading until the failure of shear connectors and affect the static capacity and life span of the global composite beams.
Limited research exists on the effects of stud failure on the residual static performance and the remaining fatigue life of externally post-tensioned steel-concrete composite beams. The impact of crack initiation and propagation in studs on the static and fatigue behavior of the steel-concrete composite beam was studied experimentally and numerically [
10]. The residual load-deflection behavior was significantly affected by the cracking of the studs and the reduction of the composite action due to stud cracking caused an 8% reduction in the maximum load capacity of the global steel-concrete beam. Wang et al. [
9] conducted experimental tests where fatigue loading was applied until failure in the form of fractured studs at the end regions of the tested specimens occurred, then the specimens were loaded under static loading to evaluate their residual static performance. The failure modes of all the tested beams were reported to be shear fatigue failure of the studs. In a recent experimental study, conducted by Wang et al. [
8], the residual static capacity of composite beams was evaluated after being subjected to a variable number of fatigue load cycles. The fracture of the studs at the end regions of the beams increased with the increase in the number of fatigue cycles experienced before the static test. This caused the residual static capacity to be reduced to only 70% of the capacity of the reference specimen with intact studs. The ultimate deflection of the composite beam with fractured studs was reduced to only 40% of its reference value.
The current study is an effort to contribute to the understanding of the effect of stud fracture on the behavior of steel-concrete composite girders. Therefore, the objective of this study was to investigate the effects of the failure of stud shear connectors on the residual static performance and remaining fatigue life of post-tensioned steel-concrete composite beams. Moreover, the effects of stud fracture on the steel-concrete interface slippage, shear stress range, and compressive and tensile strains were investigated. Due to the cost and time-consuming nature of the experimental investigation of steel-concrete composite girders, a gap in the literature exists on the topic of the progressive failure of shear connectors. Therefore, this study proposed an FE model that was built and validated to simulate this failure scenario. The proposed FE model offers a non-costly, non-destructive, and creative evaluation method for the behavior of composite beams by simulating stud fracture with consecutive removal of studs (one row after another) and interpreting the changes in the behavior in terms of fatigue life and other important parameters.
2. Finite Element Modeling
The FE software ANSYS (v. 18.1) [
11] was used to develop the numerical models of the post-tensioned steel-concrete girders investigated in this paper. The developed numerical models adopted both geometric and material nonlinearities. The geometric nonlinearity was adopted by activating the large deformation option in the analysis setting of ANSYS. By activating this option, the change of the element stiffness due to the deformation was considered. For large deformation analysis, the tangent stiffness matrix, which is a function in the deformation, was used instead of the constant stiffness matrix [
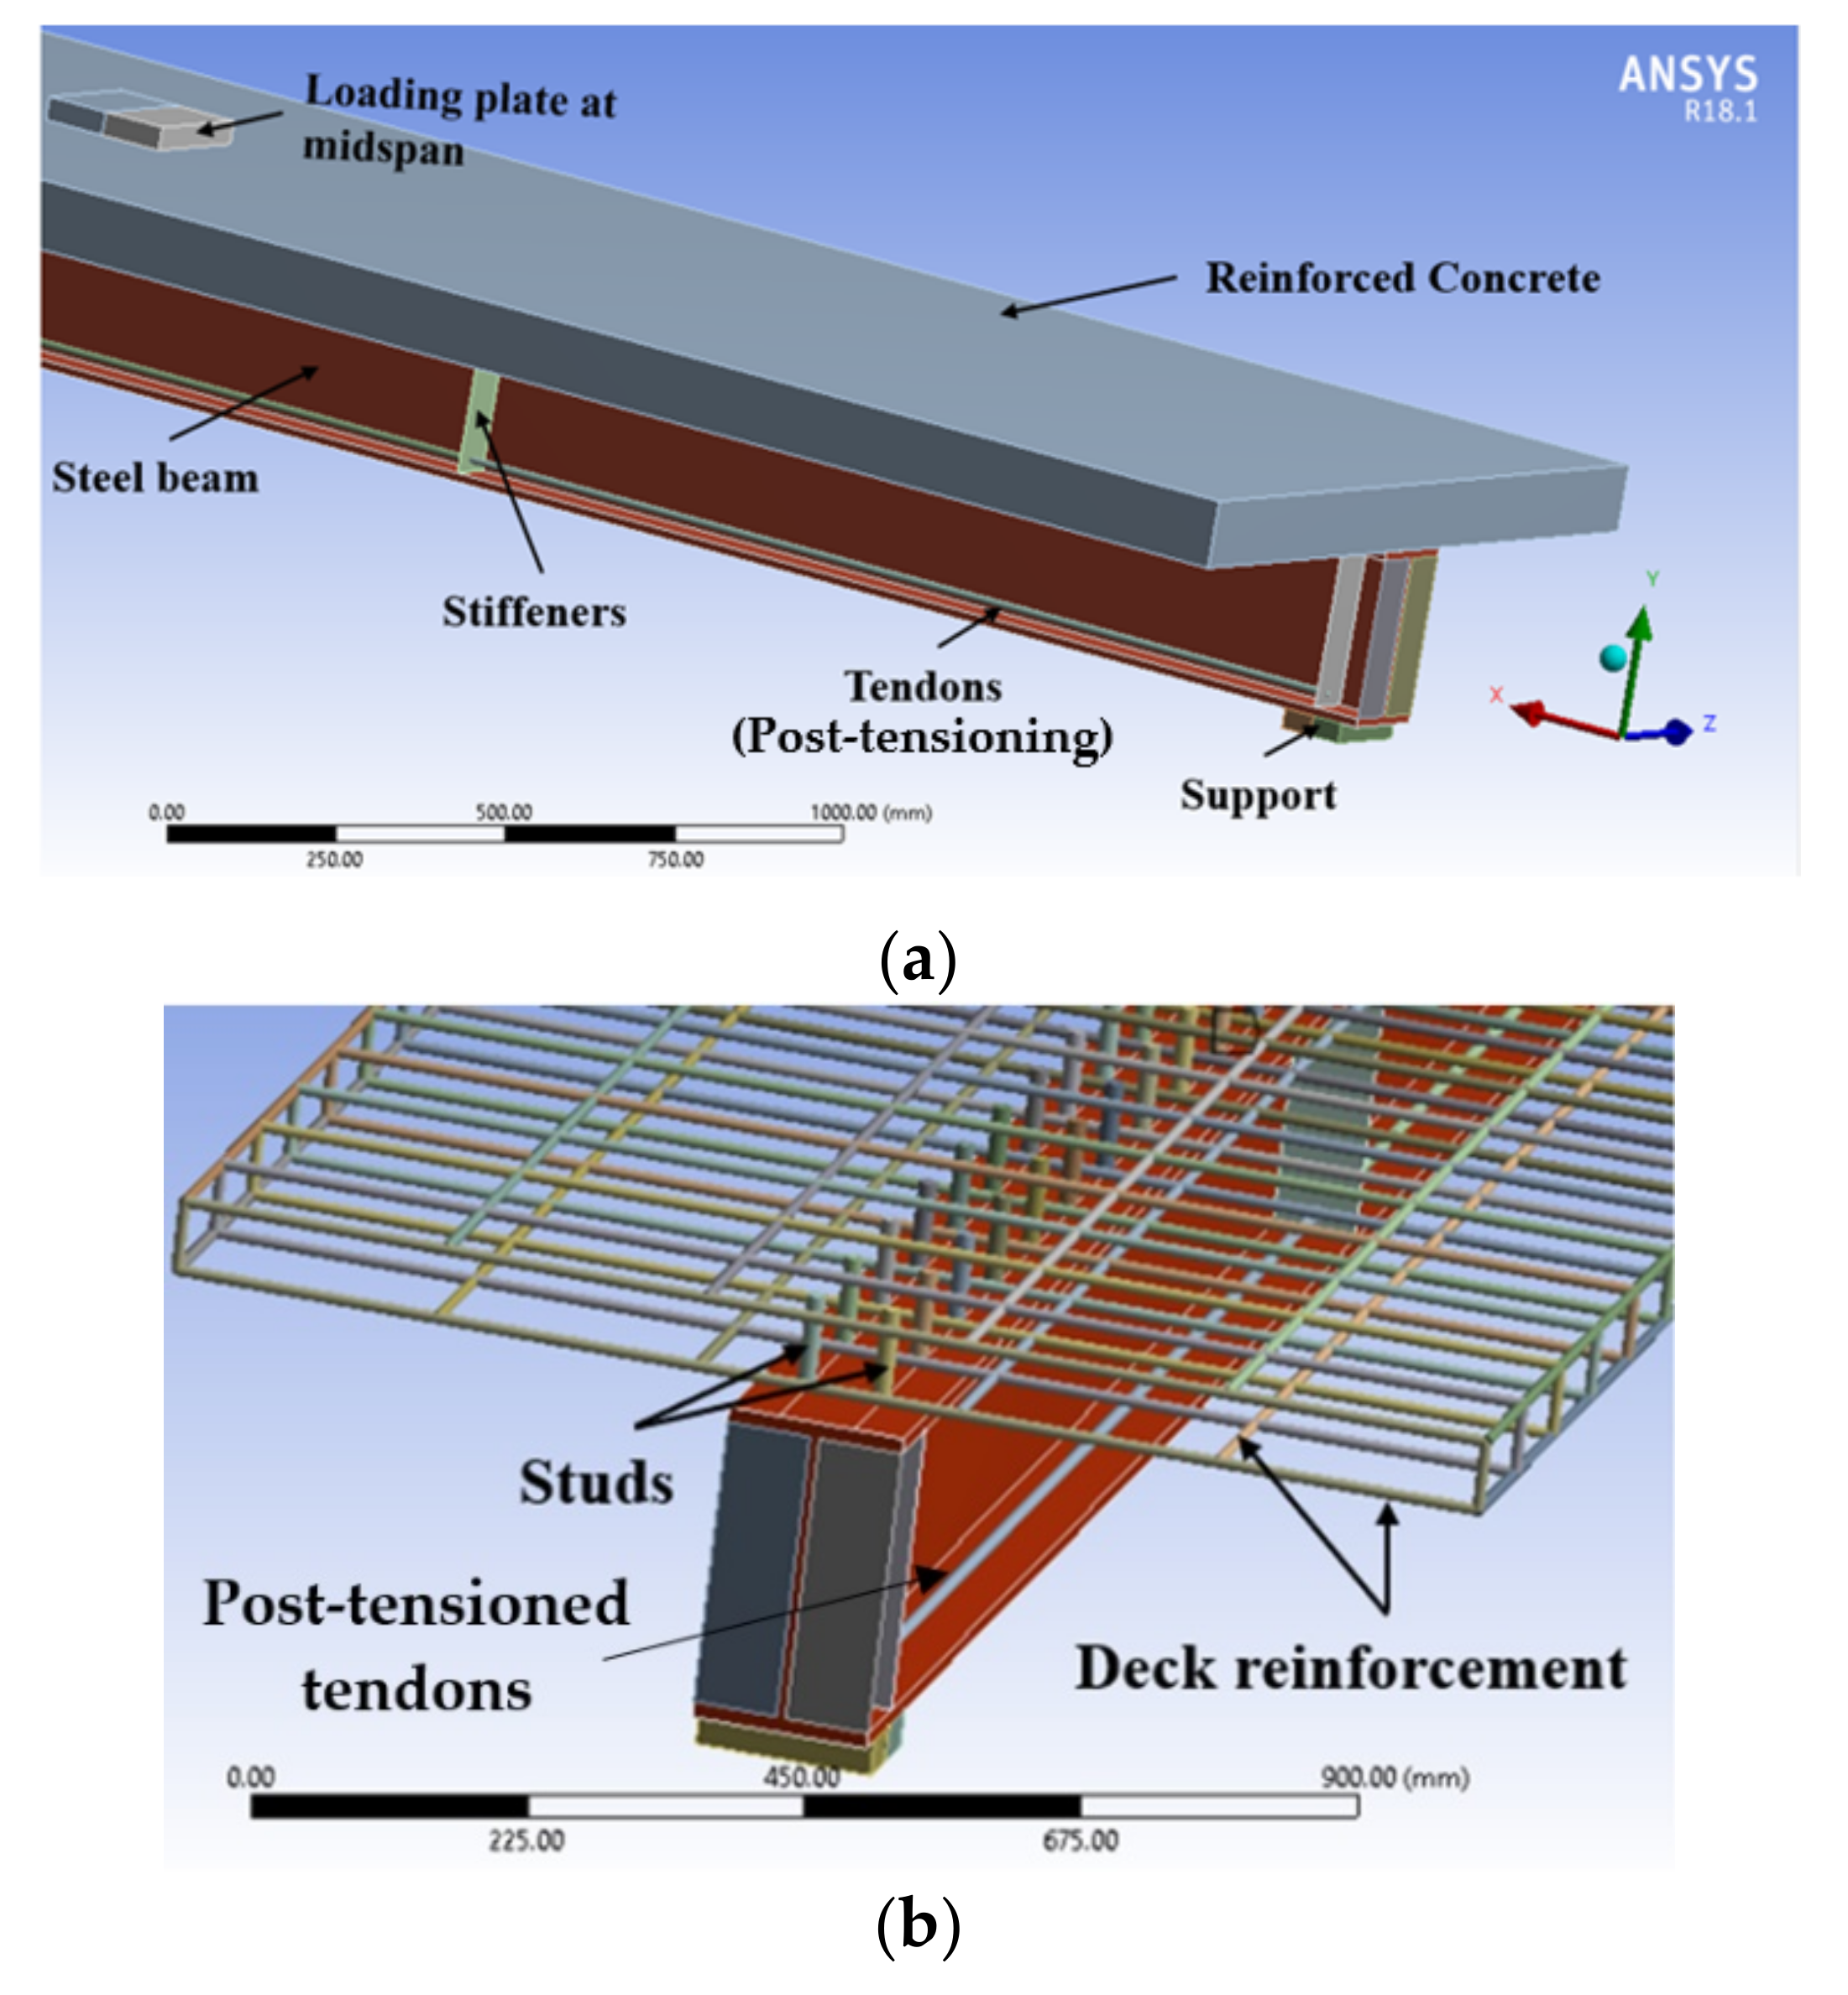
11]. The material nonlinearity was adopted by implementing the nonlinear constitutive models of materials. Moreover, the developed FE models simulated each component of the strengthened composite girders. These components included the web and flanges of the steel beam, concrete deck, headed stud shear connectors, steel reinforcement, and externally post-tensioned tendons. Models of three experimentally tested composite samples were built. The description of these samples and the experimental details are presented in the model validation section.
2.1. Element Selection
The 8-node solid element, SOLID185, was used to model the steel webs and flanges of the steel beams. This element has three degrees of freedom at each node: translations in the x, y, and z directions [
11]. Moreover, its capabilities include plasticity, stress stiffening, large deflection, and large strain. To consider the capability of crushing in compression and cracking in tension, the concrete decks were modeled using the SOLID65 element. This element has three degrees of freedom at each node: translations in the x, y, and z directions [
11]. The shank of the headed stud shear connectors was modeled using beam element BEAM188, which has six degrees of freedom at each node. These include translations in the x, y, and z directions and rotations about the x, y, and z axes [
11]. The longitudinal and transverse deck reinforcements as well as the post-tensioned tendons were modeled using a 2-node link element, LINK180. The composite interaction between the steel beams and the concrete decks was simulated using two different elements. The non-linear spring element, COMBIN39, simulated the relative movement between the two surfaces in contact. To prevent any physical penetration between the two surfaces, 8-node surface-to-surface contact elements, CONTAC174, were used. An example of the loading setup and details of the different components of one of the composite beams are presented in
Figure 1.
2.2. Real Constants
To define the initial post-tensioning force (F) for the post-tensioned composite beams, an equivalent drop in temperature (
ΔT) based on Equation (1) was defined.
where E is the modulus of elasticity of the post-tensioned tendon, A is the cross-section area of the tendon, and α is the coefficient of thermal expansion (10
−5 for steel tendons).
The exponential equation developed by Ollgaard et al. [
12] was used to represent the relative movement between the concrete decks and steel beams (see Equation (2))
where
P is the horizontal shear force in the headed stud shear connector,
Pu is the shear capacity of the headed stud shear connector, δ is the interface slippage between the steel beam and concrete deck, and β and γ are coefficients related to the stiffness of the studs.
2.3. Constitutive Models of Materials
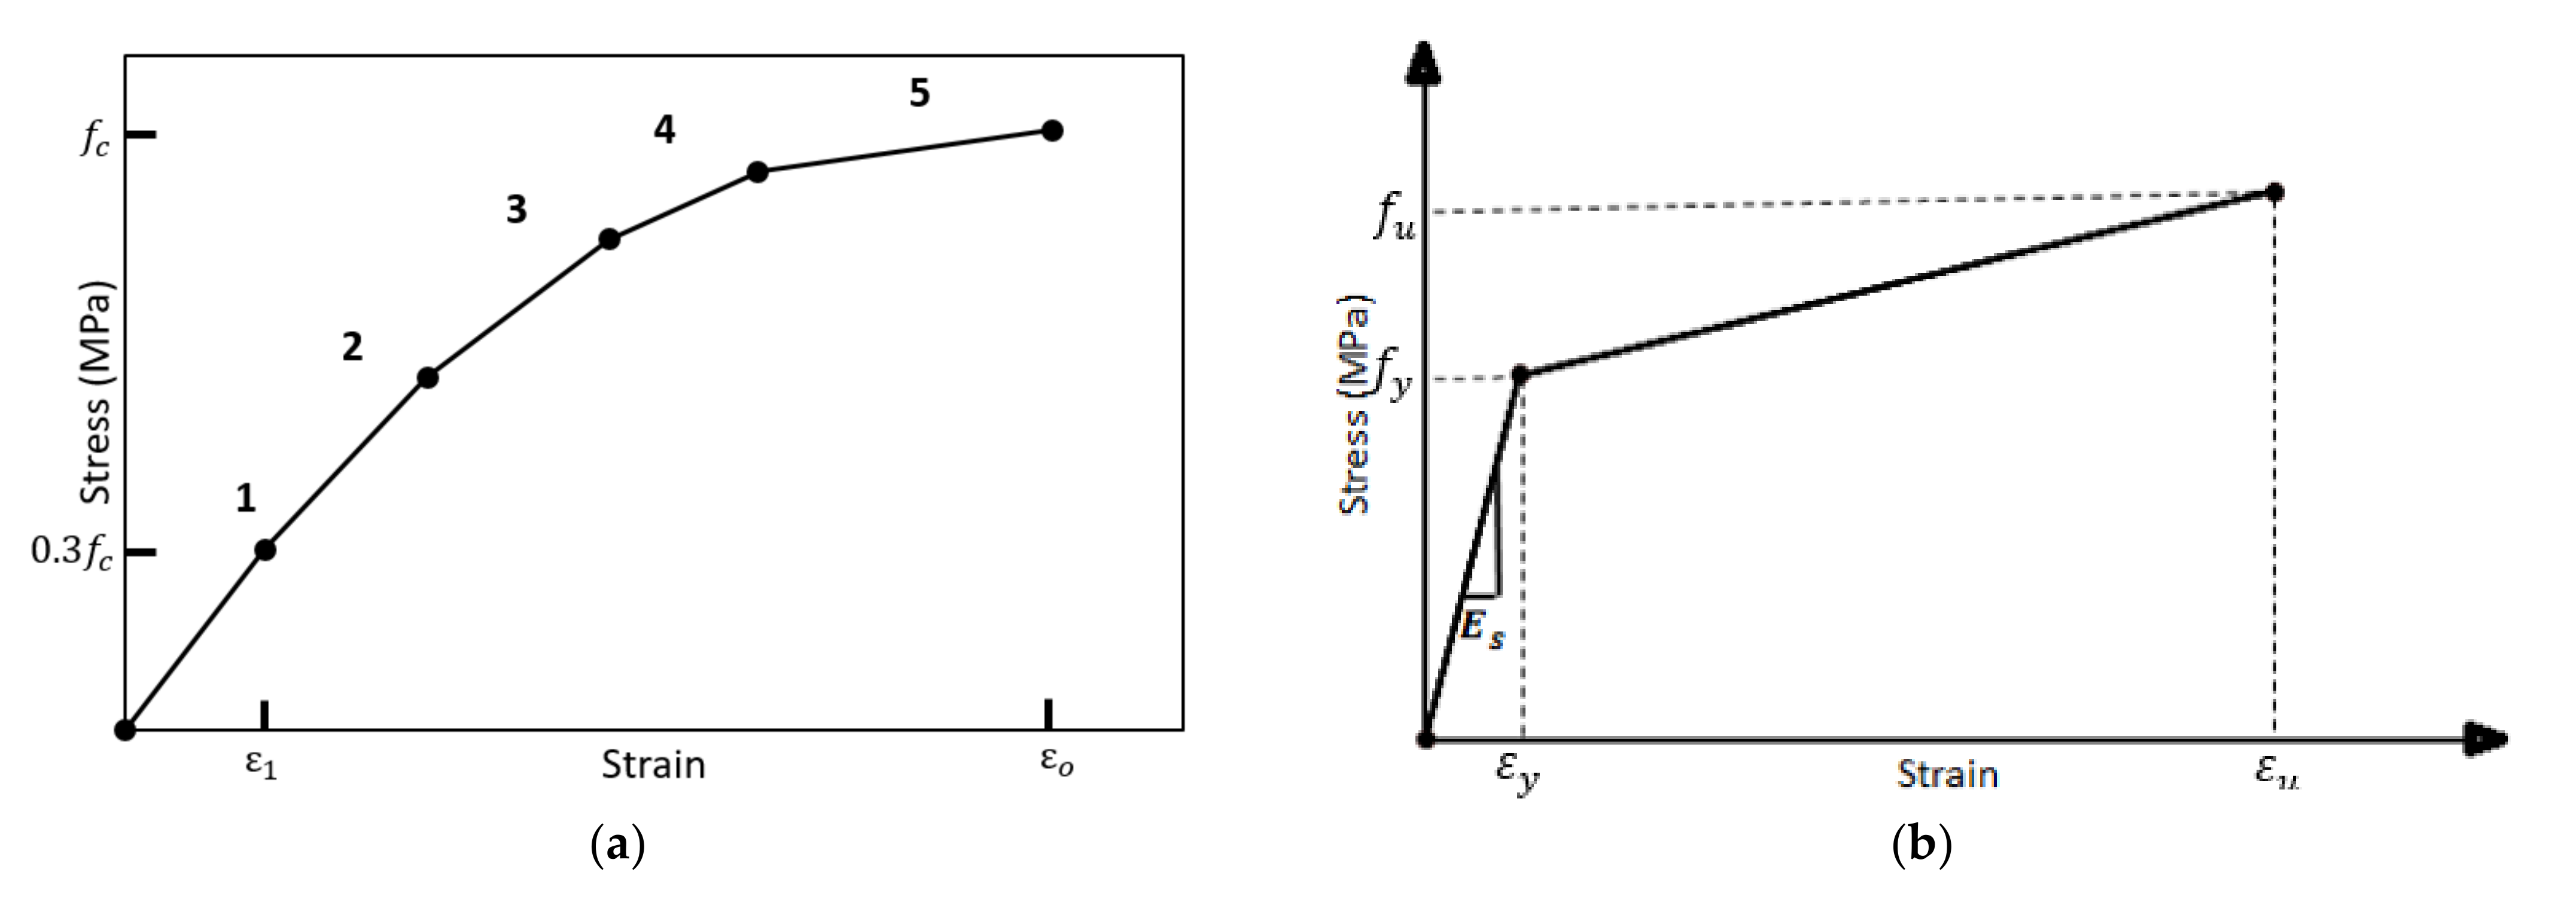
The tensile behavior of concrete was assumed to be linear up to failure and then progressively reduced to zero due to the cracking of concrete. On the other hand, the compressive behavior of concrete was simulated by a uniaxial stress-strain relationship. The constitutive models of concrete in compression were constructed using a few points joined together by straight lines, as shown in
Figure 2a. The first point on the curve is at stress 0.3 f
c and the corresponding strain is computed from Equation (3), while other points were obtained from Equations (4) and (5) [
13].
where f is the compressive stress at any strain ε, E
c is the Young’s modulus of concrete, ε
1 is the strain corresponding to 0.3 f
c, ε
0 is the strain at the ultimate compressive strength (f
c).
The bilinear model, which is adopted in ANSYS, was used to simulate the behavior of steel reinforcement, studs, steel beams, and post-tensioned tendons. For the linear isotropic part, it was defined by the modulus of elasticity and yield stress of the steel reinforcement. Away from this point, the ultimate strain and stress were used to define the material behavior (see
Figure 2b). The stress-strain behaviors in tension and in compression were assumed identical.
The material properties used in the FE model for each beam were identical to those used in the corresponding experimental tests, which will be described in the model validation section.
3. Validation of the FE Model
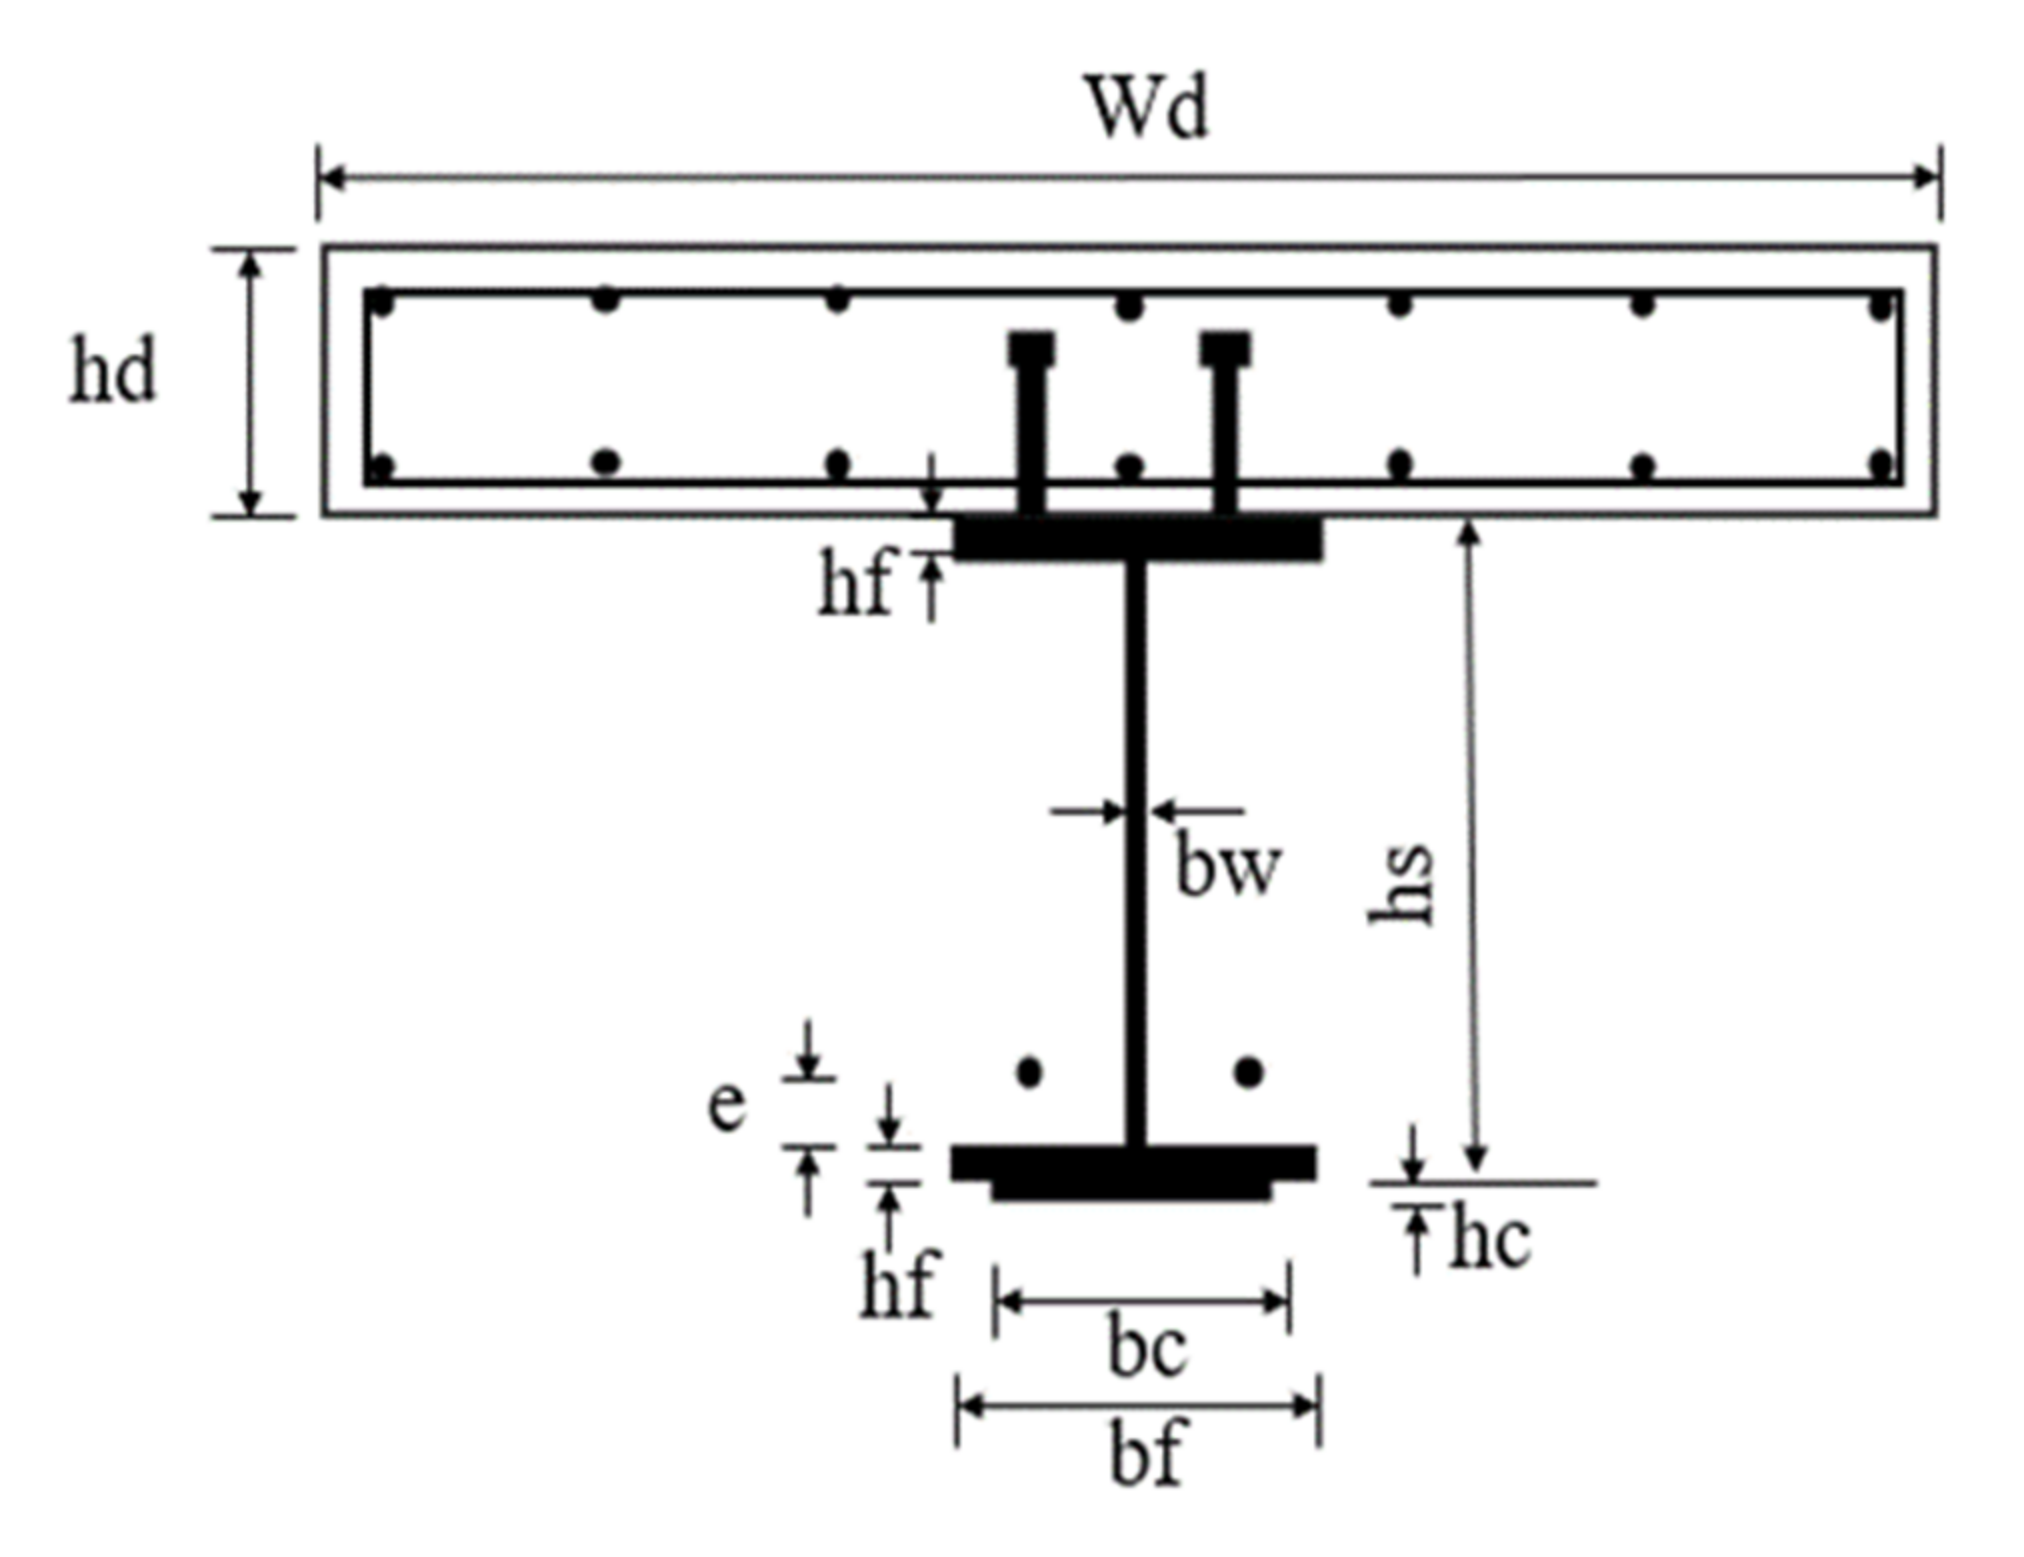
The proposed FE model was validated against the results of three existing experimental tests on simply supported steel-concrete composite beams. The details and dimensions of the cross-sections of the three beams are shown in
Figure 3 and listed in
Table 1. The first beam (B1) was a 4-m-long steel-concrete composite girder without post-tensioning, which was experimentally tested by Prakash et al. [
14]. The static loading was applied at two points that were 600 mm apart, with each point being 300 mm from the mid-span. The second beam (B2) was a post-tensioned beam using external tendons with a clear span of 5.524 m tested by Lorenc and Kubica [
15]. A cover plate of 4.5 m long was welded to the bottom flange of the steel beam starting at 0.512 m from the supports. The static test was set as a four-point bending test with a constant moment span of one meter. The third beam (B3) was a strengthened beam using externally post-tensioned tendons with a clear span of 4.42 m, tested by Alsharari et al. [
16]. This beam was loaded at a single point at the mid-span. Additional details of the different components of the composite girders and material properties are provided in
Table 2.
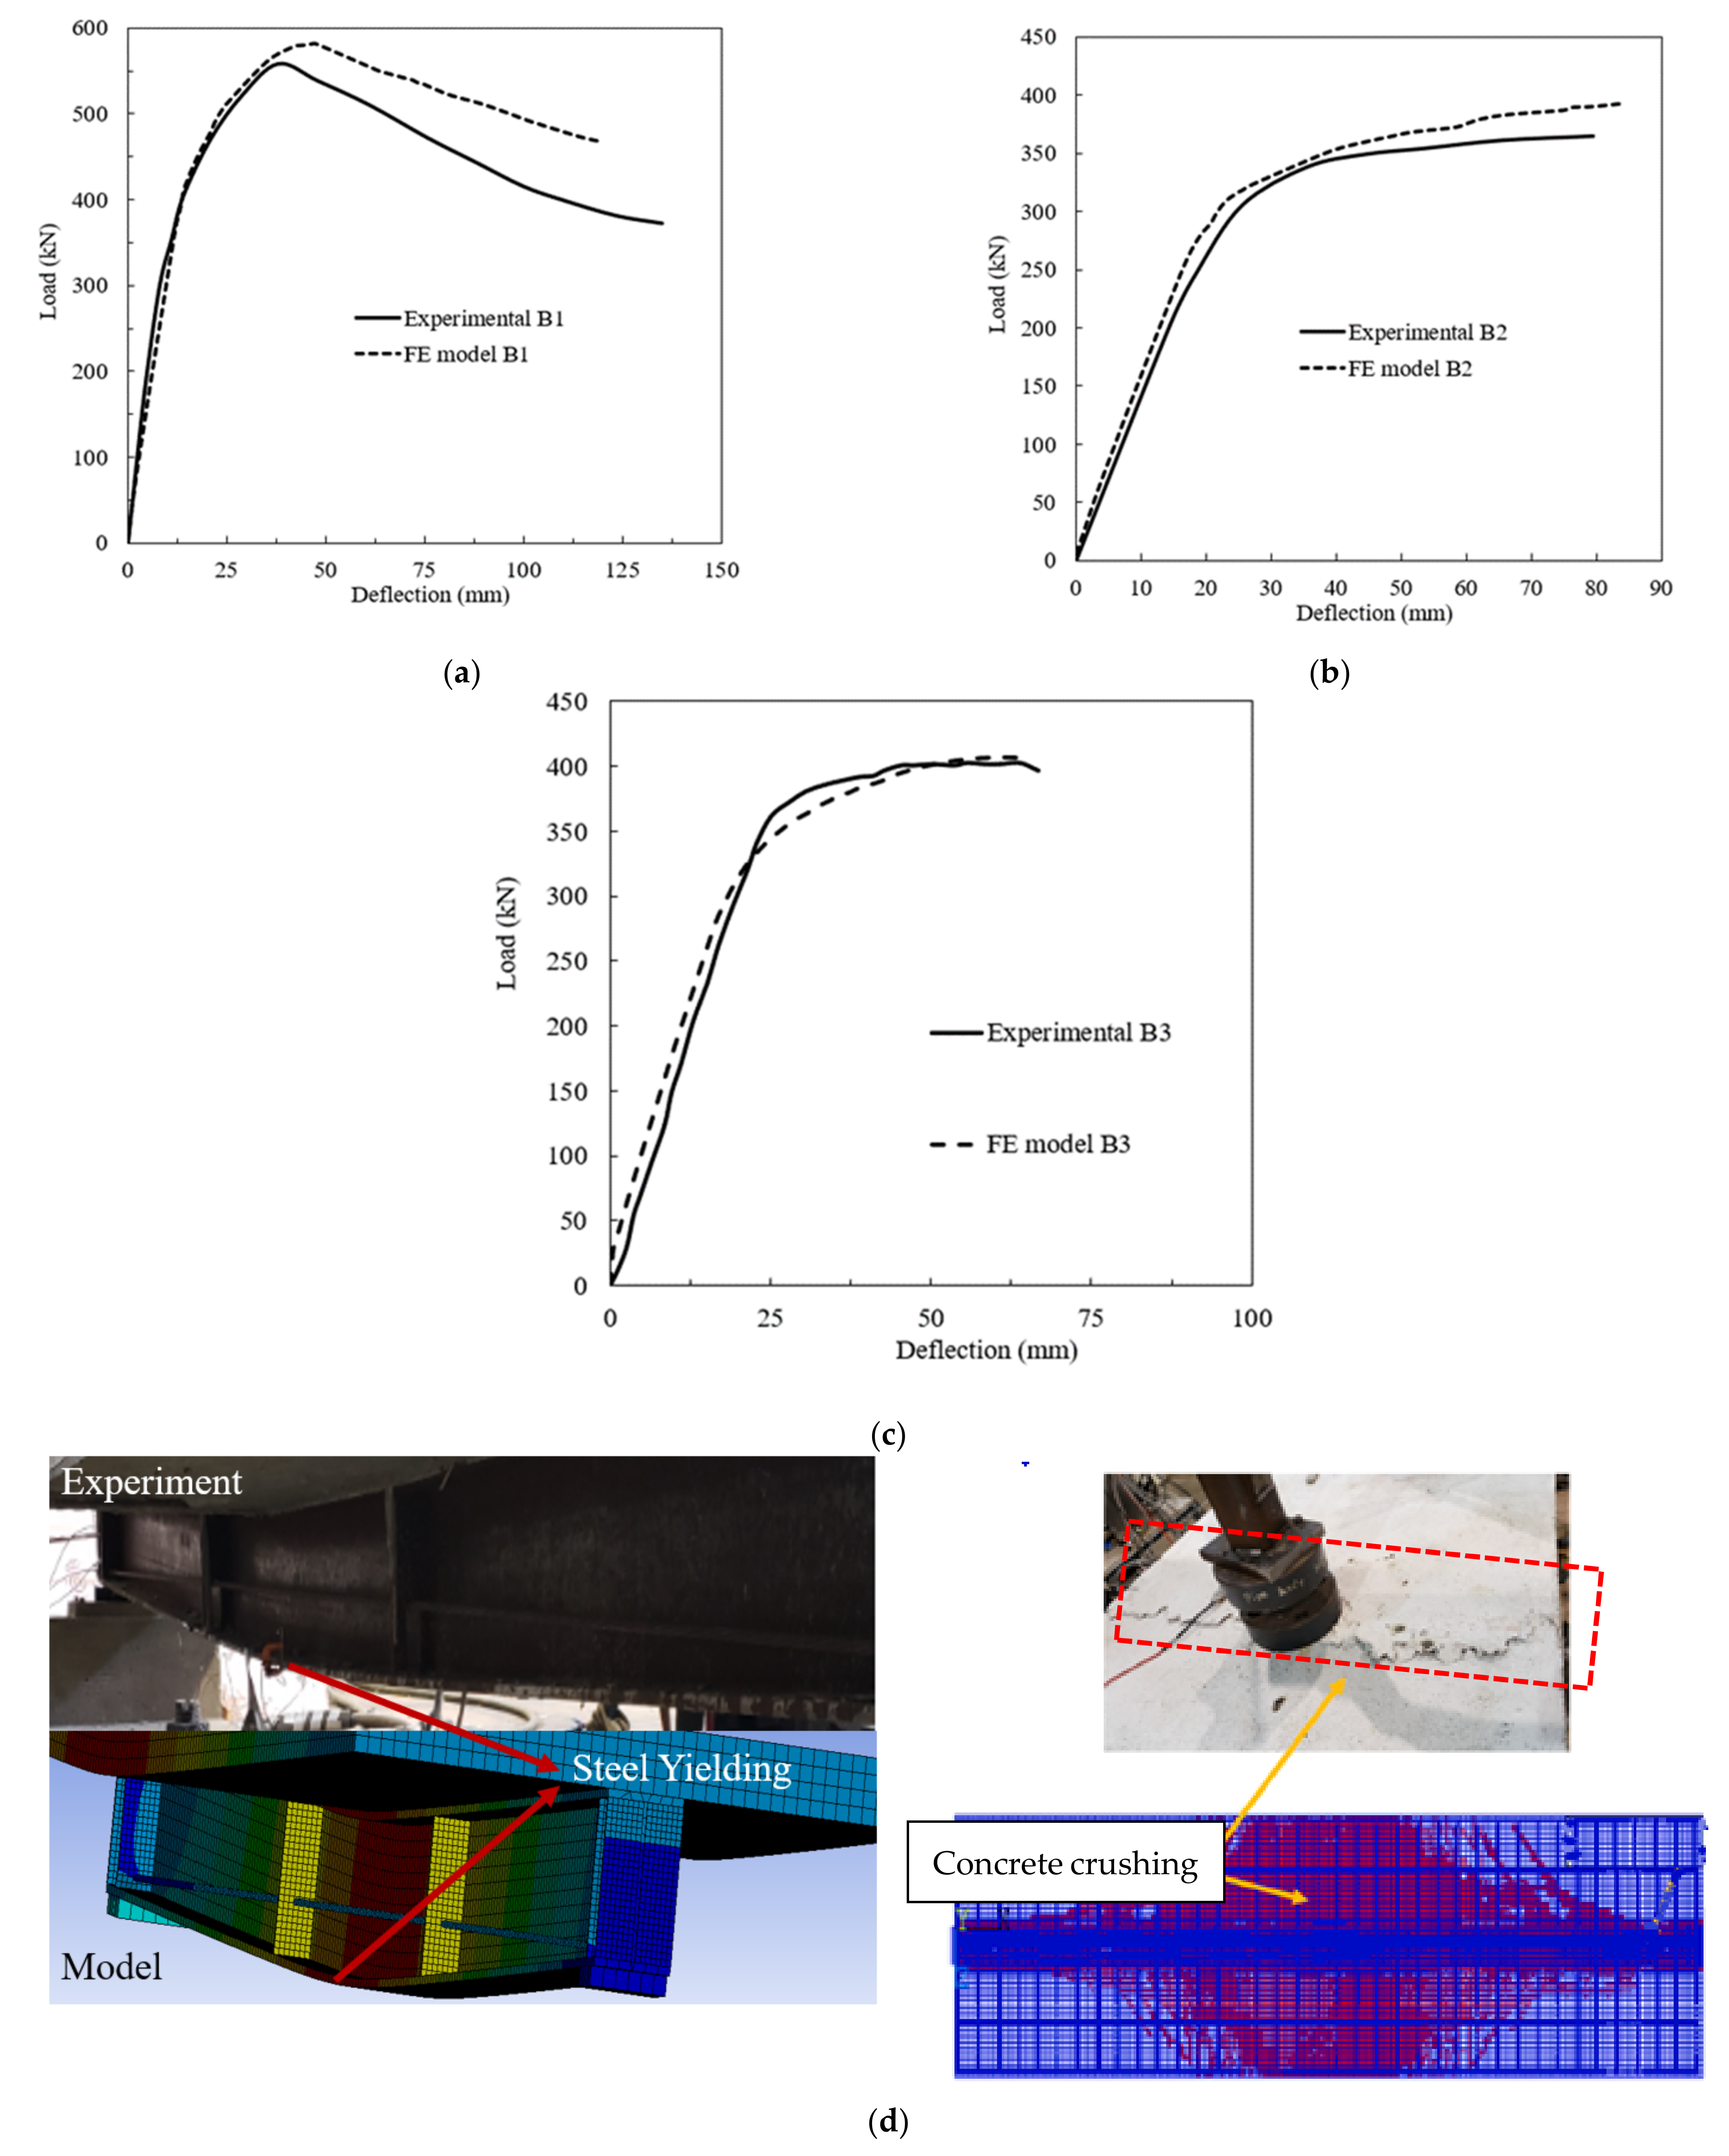
Figure 4 shows the load-deflection curves of the composite girders tested experimentally and compares them to those obtained using the developed FE models. The load-deflection curves for beam B1 are shown in
Figure 4a. The FE model almost perfectly matched the FE model up until the maximum load of the experimental curve. After that, the FE model curve was 18% higher, on average, than the experimental curve. However, the difference between the ultimate loads of both curves was within 4% and the difference between the ultimate deflections was within 10%.
Figure 4b shows the load-deflection curves for beam B2. The FE model results were representative of the experimental results except that the FE model results were slightly stiffer and predicted a 7% higher ultimate load.
Figure 4c shows the load-deflection curves for beam B3. The FE model results were consistent with the experimental load-deflection curve except that, in the linear part of the curve, the FE model predicted slightly higher stiffness than the experimental test. Additionally, the maximum loads of the FE model and experimental test were consistent. The stress distribution over the steel beam and concrete crushing of the concrete slab for B3 are shown in
Figure 4d. The FE model accurately captured the mode of failure of the post-tensioned composite beam.
4. Simulation of the Progressive Failure of Studs
Multiple failures can occur simultaneously when the beam is loaded under fatigue loading. However, after a large number of cycles, the fracture of the shear connectors is the common mode of failure and causes the failure of the composite beams [
10]. The fatigue failure of simply supported composite beams first occurs at the end shear connector and spreads in the proper order [
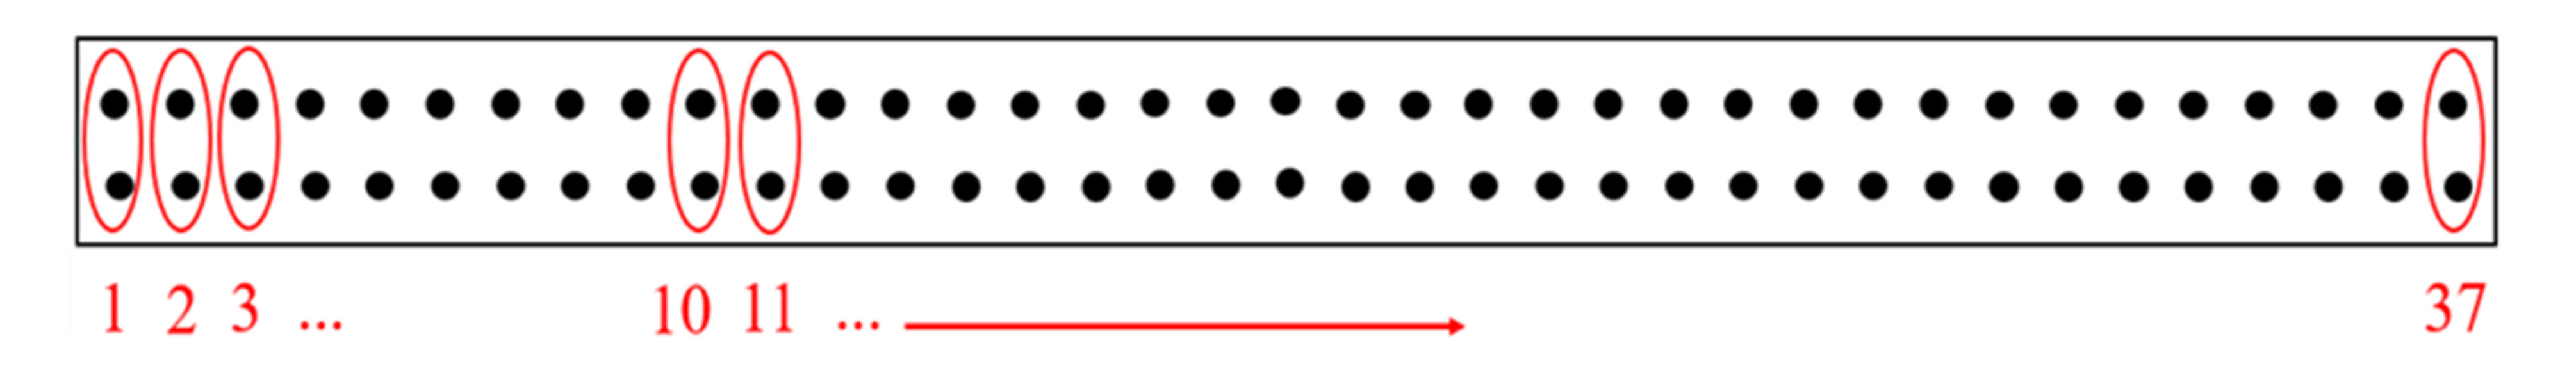
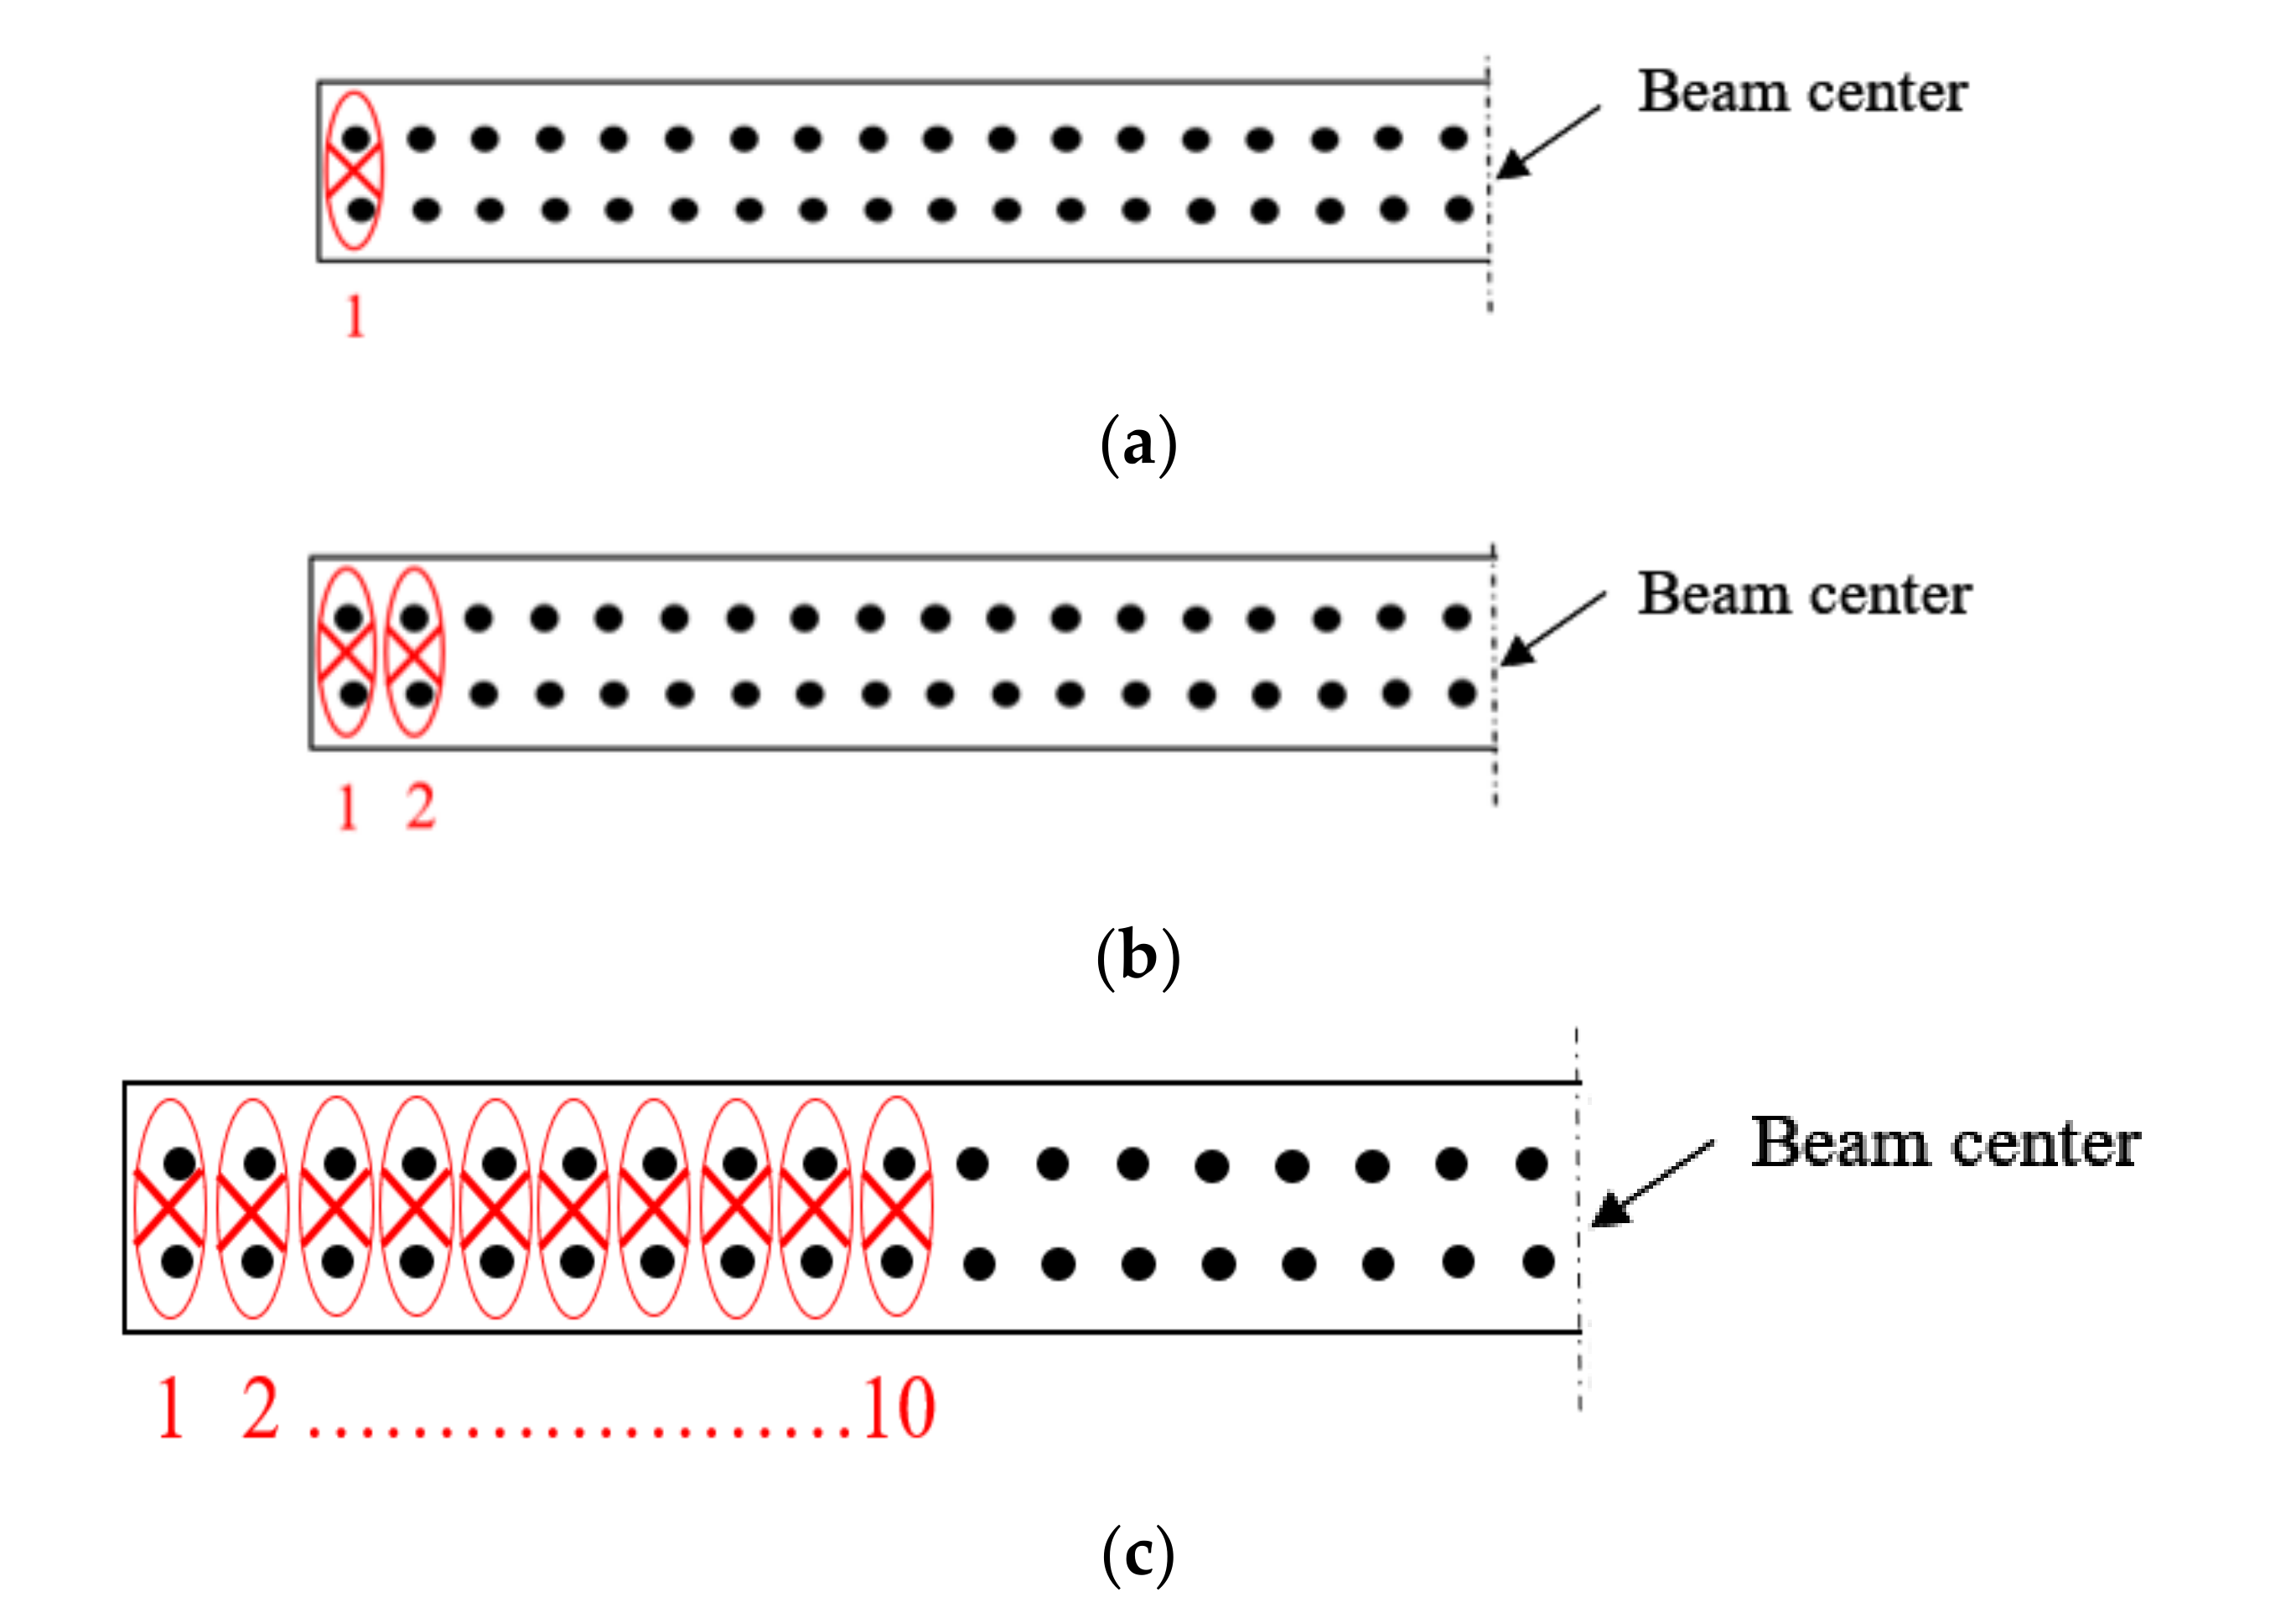
17]. The experimentally validated FE model developed in this paper was used to investigate the effect of the progressive failure of stud shear connectors on the post-tensioned steel-concrete composite girders. Beam B3 was selected for this investigation. The progressive fracture of the studs was simulated by successive removal of rows of the shear studs from one end of the beam. The failure of the shear studs was simulated by removing the nonlinear spring elements that connect the studs to the steel beam. To facilitate evaluating specific shear stud rows, the rows were numbered starting from the end from which the studs were removed as shown in
Figure 5. A preliminary study was conducted, and it was shown that after 10 rows were removed, the applied shear-force of the end studs exceeded their ultimate capacity. Therefore, the stud removal study was limited to the first 10 rows. The removal of the shear studs was done in 10 successive steps by removing one row (two studs) per step (see
Figure 6) until a total of 10 rows were removed.
After each row was removed, the beam was subjected to two loading types. The first loading type applied a load amplitude of 140 kN to simulate a fatigue load cycle, and the second one loaded the beam until failure to evaluate its residual capacity. Damage to shear studs in composite bridge members is more likely to be caused by fatigue cycles in load levels below the yield strength of the beams. The samples were loaded with a minimum and a maximum load of 10 kN and 150 kN, respectively, which represent a fatigue cycle whose maximum load was approximately 40% of the load-carrying capacity of a reference sample. These loading values were chosen such that the load amplitude used in this study was similar to fatigue load amplitudes experimentally applied to similar beams [
14]. The sample was loaded at a single loading point at the mid-span on a 200 mm × 200 mm × 35 mm steel plate.
5. Results and Discussion
The effects of the progressive failure of stud shear connectors on the steel-concrete interface slippage, shear force, shear stress range, compressive and tensile strains at the mid-spans, and the remaining fatigue life of studs were evaluated under a load amplitude of 140 kN for beam B3. In addition, the residual capacity of the composite beams was evaluated by loading the beam until failure. A non-strengthened version of the beam B3 was also modeled, by removing the post-tensioned tendons, to evaluate the effect of strengthening on the responses of the beams. For ease of identification, the strengthened sample was labeled as S, while the non-strengthened sample was labeled as NS.
5.1. The Effect on the Slippage
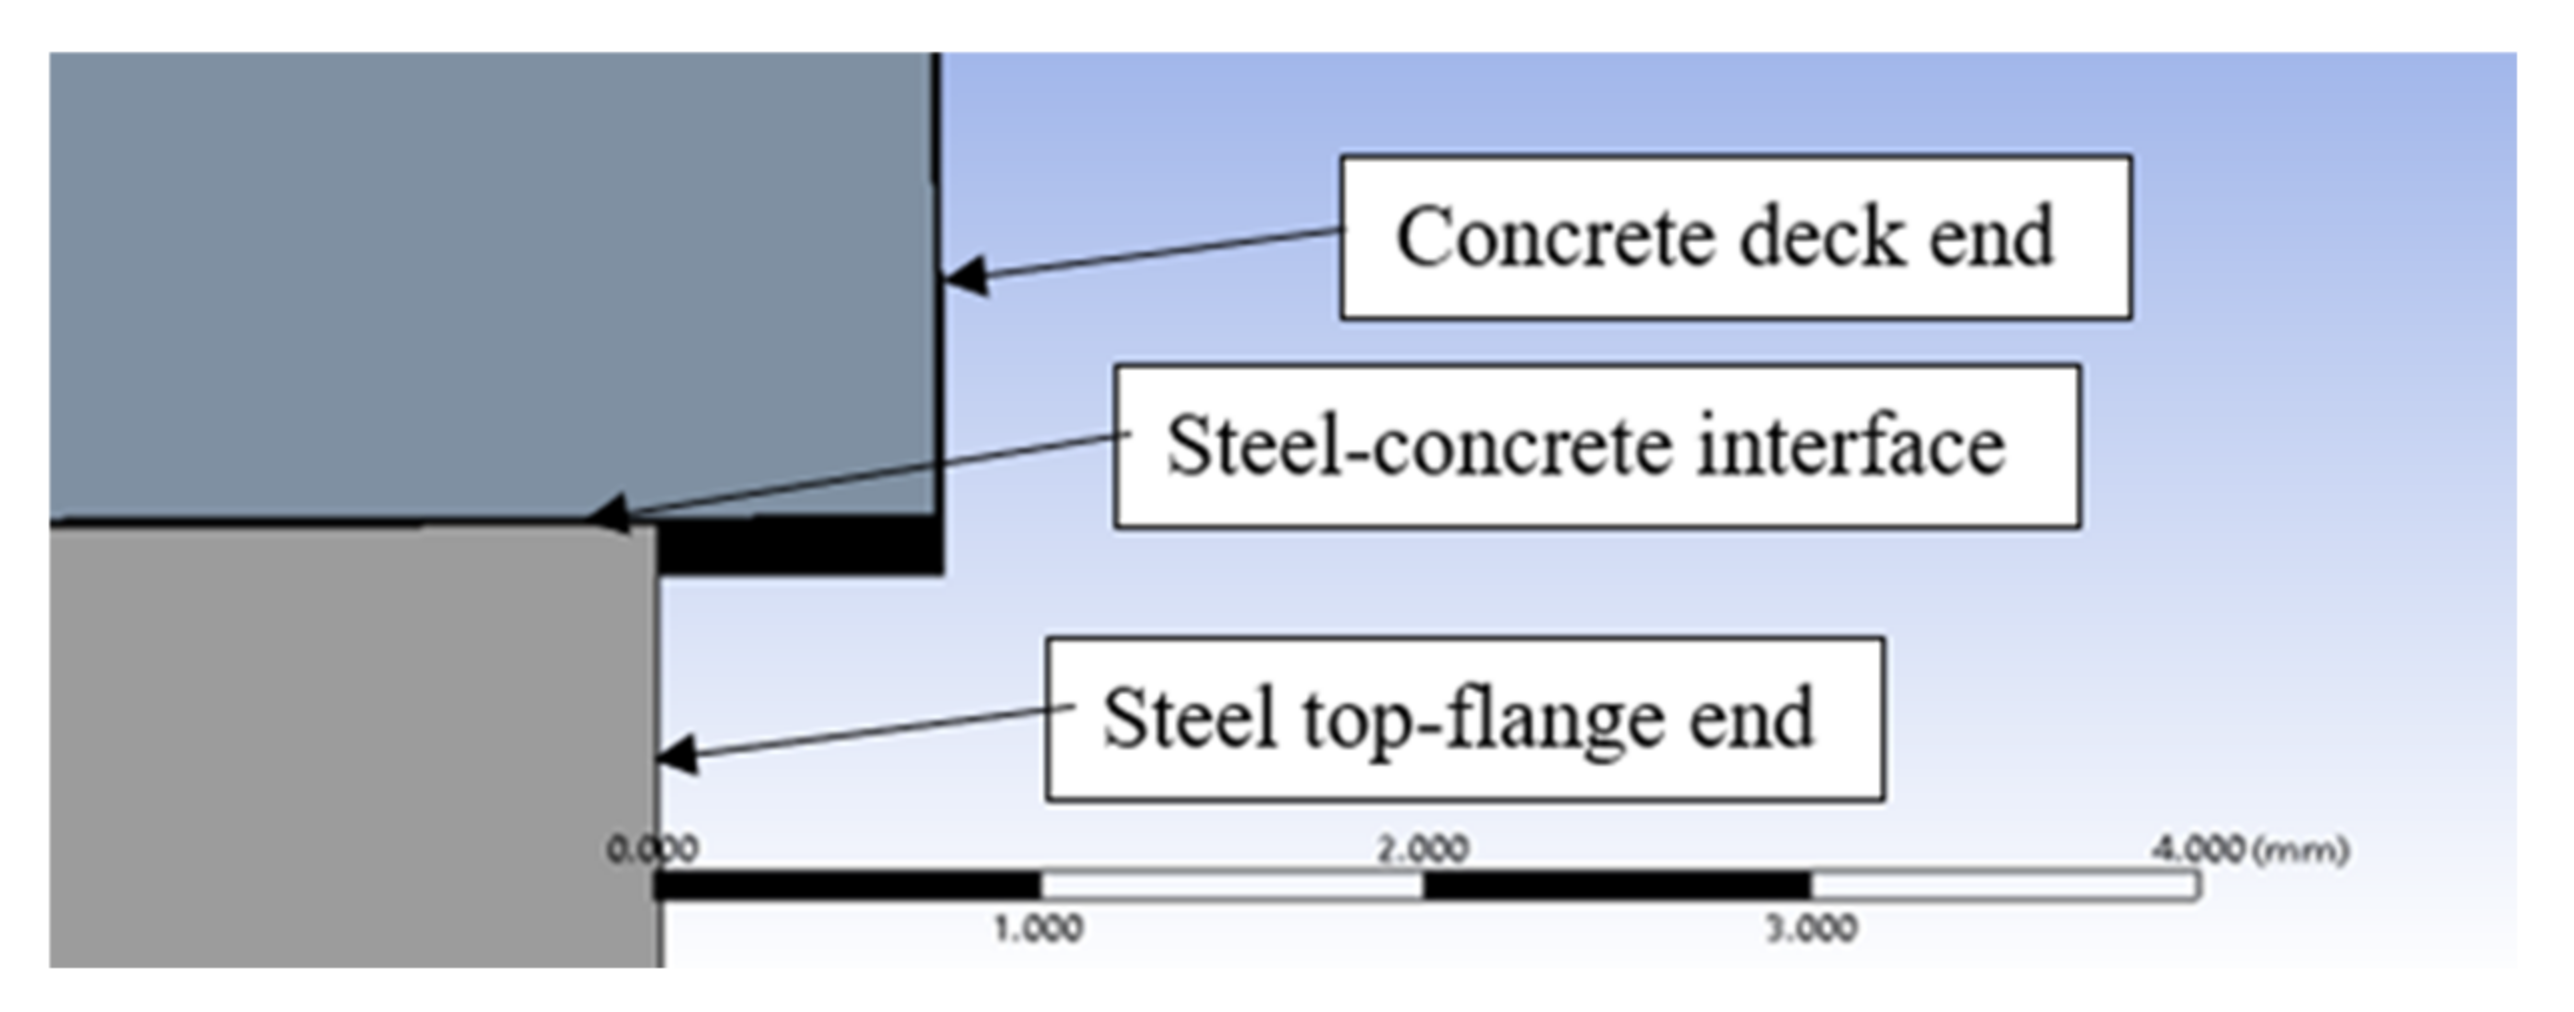
The relative slippage between the steel beam and concrete deck at the beam ends (see
Figure 7) was monitored after the removal of each row. The slippage values corresponding to the maximum load were recorded after each step and the results are presented in
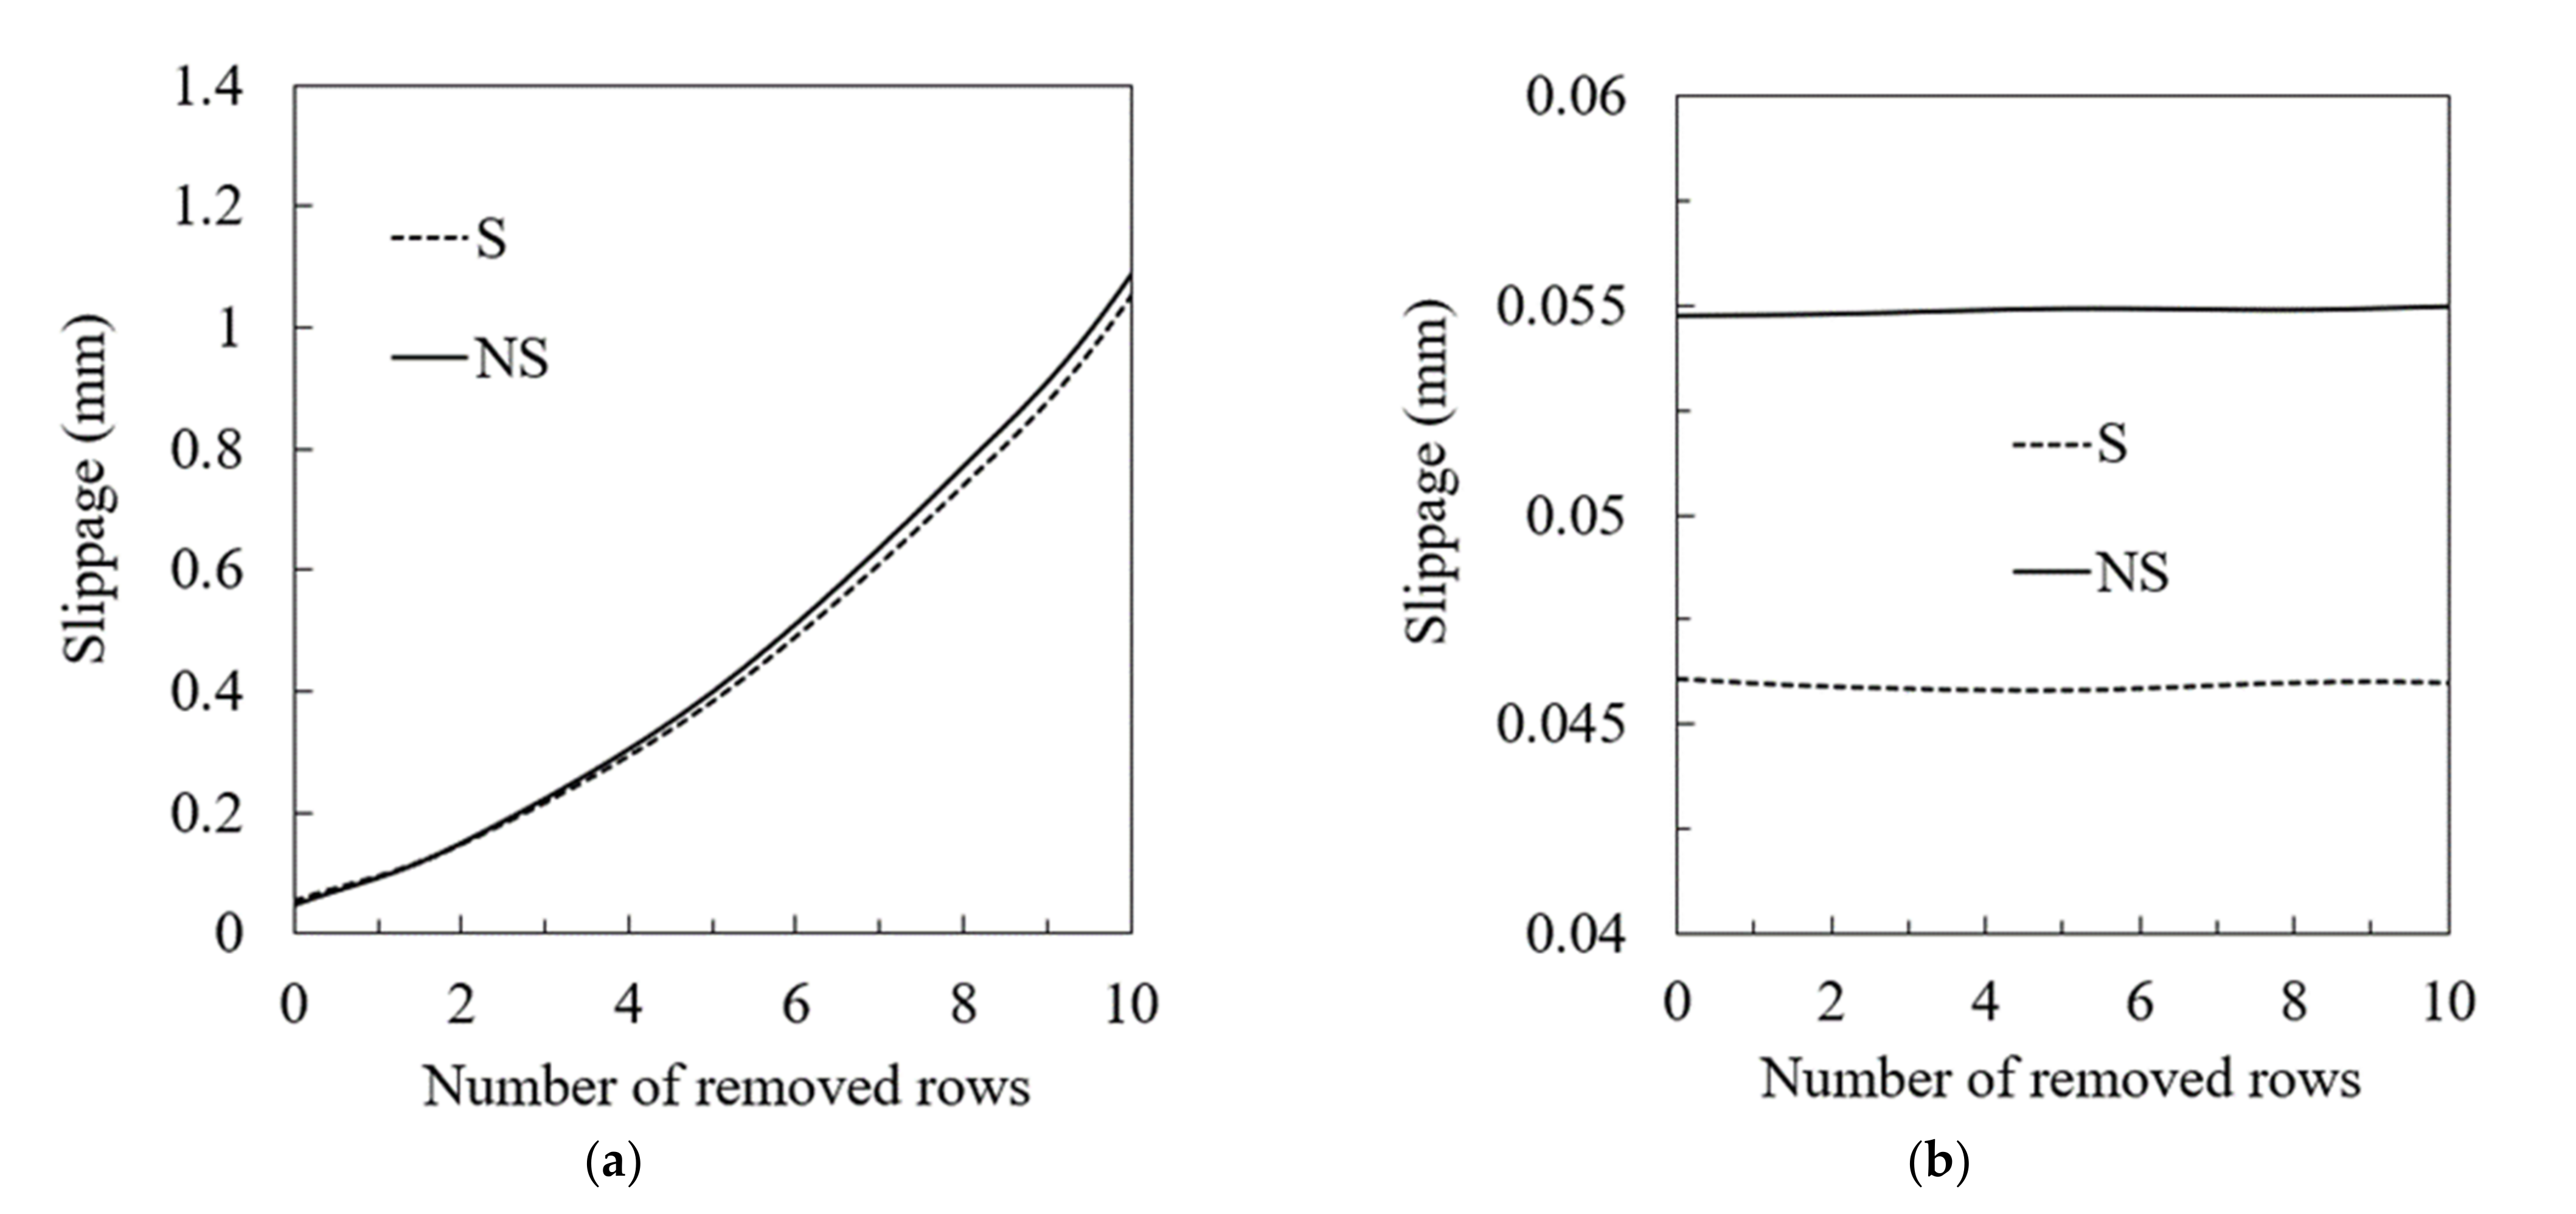
Figure 8 for both the strengthened and non-strengthened samples. The relative slippages at the beam end where the studs were removed are shown in
Figure 8a, while the slippage values at the beam end where no studs were removed are shown in
Figure 8b. The slippage values of the removal side increased significantly as the number of the removed studs increased while almost no change occurred in the slippage values on the non-removal side. The lack of studs at the beam ends to resist the longitudinal shear between the concrete deck and steel beam caused the higher slippage values and the incremental slippage increased at the removal side. The responses of the strengthened and non-strengthened samples were similar at both ends. However, the slippage values for the strengthened sample were slightly lower than those for the non-strengthened sample.
5.2. The Effect on the Stud Shear Force
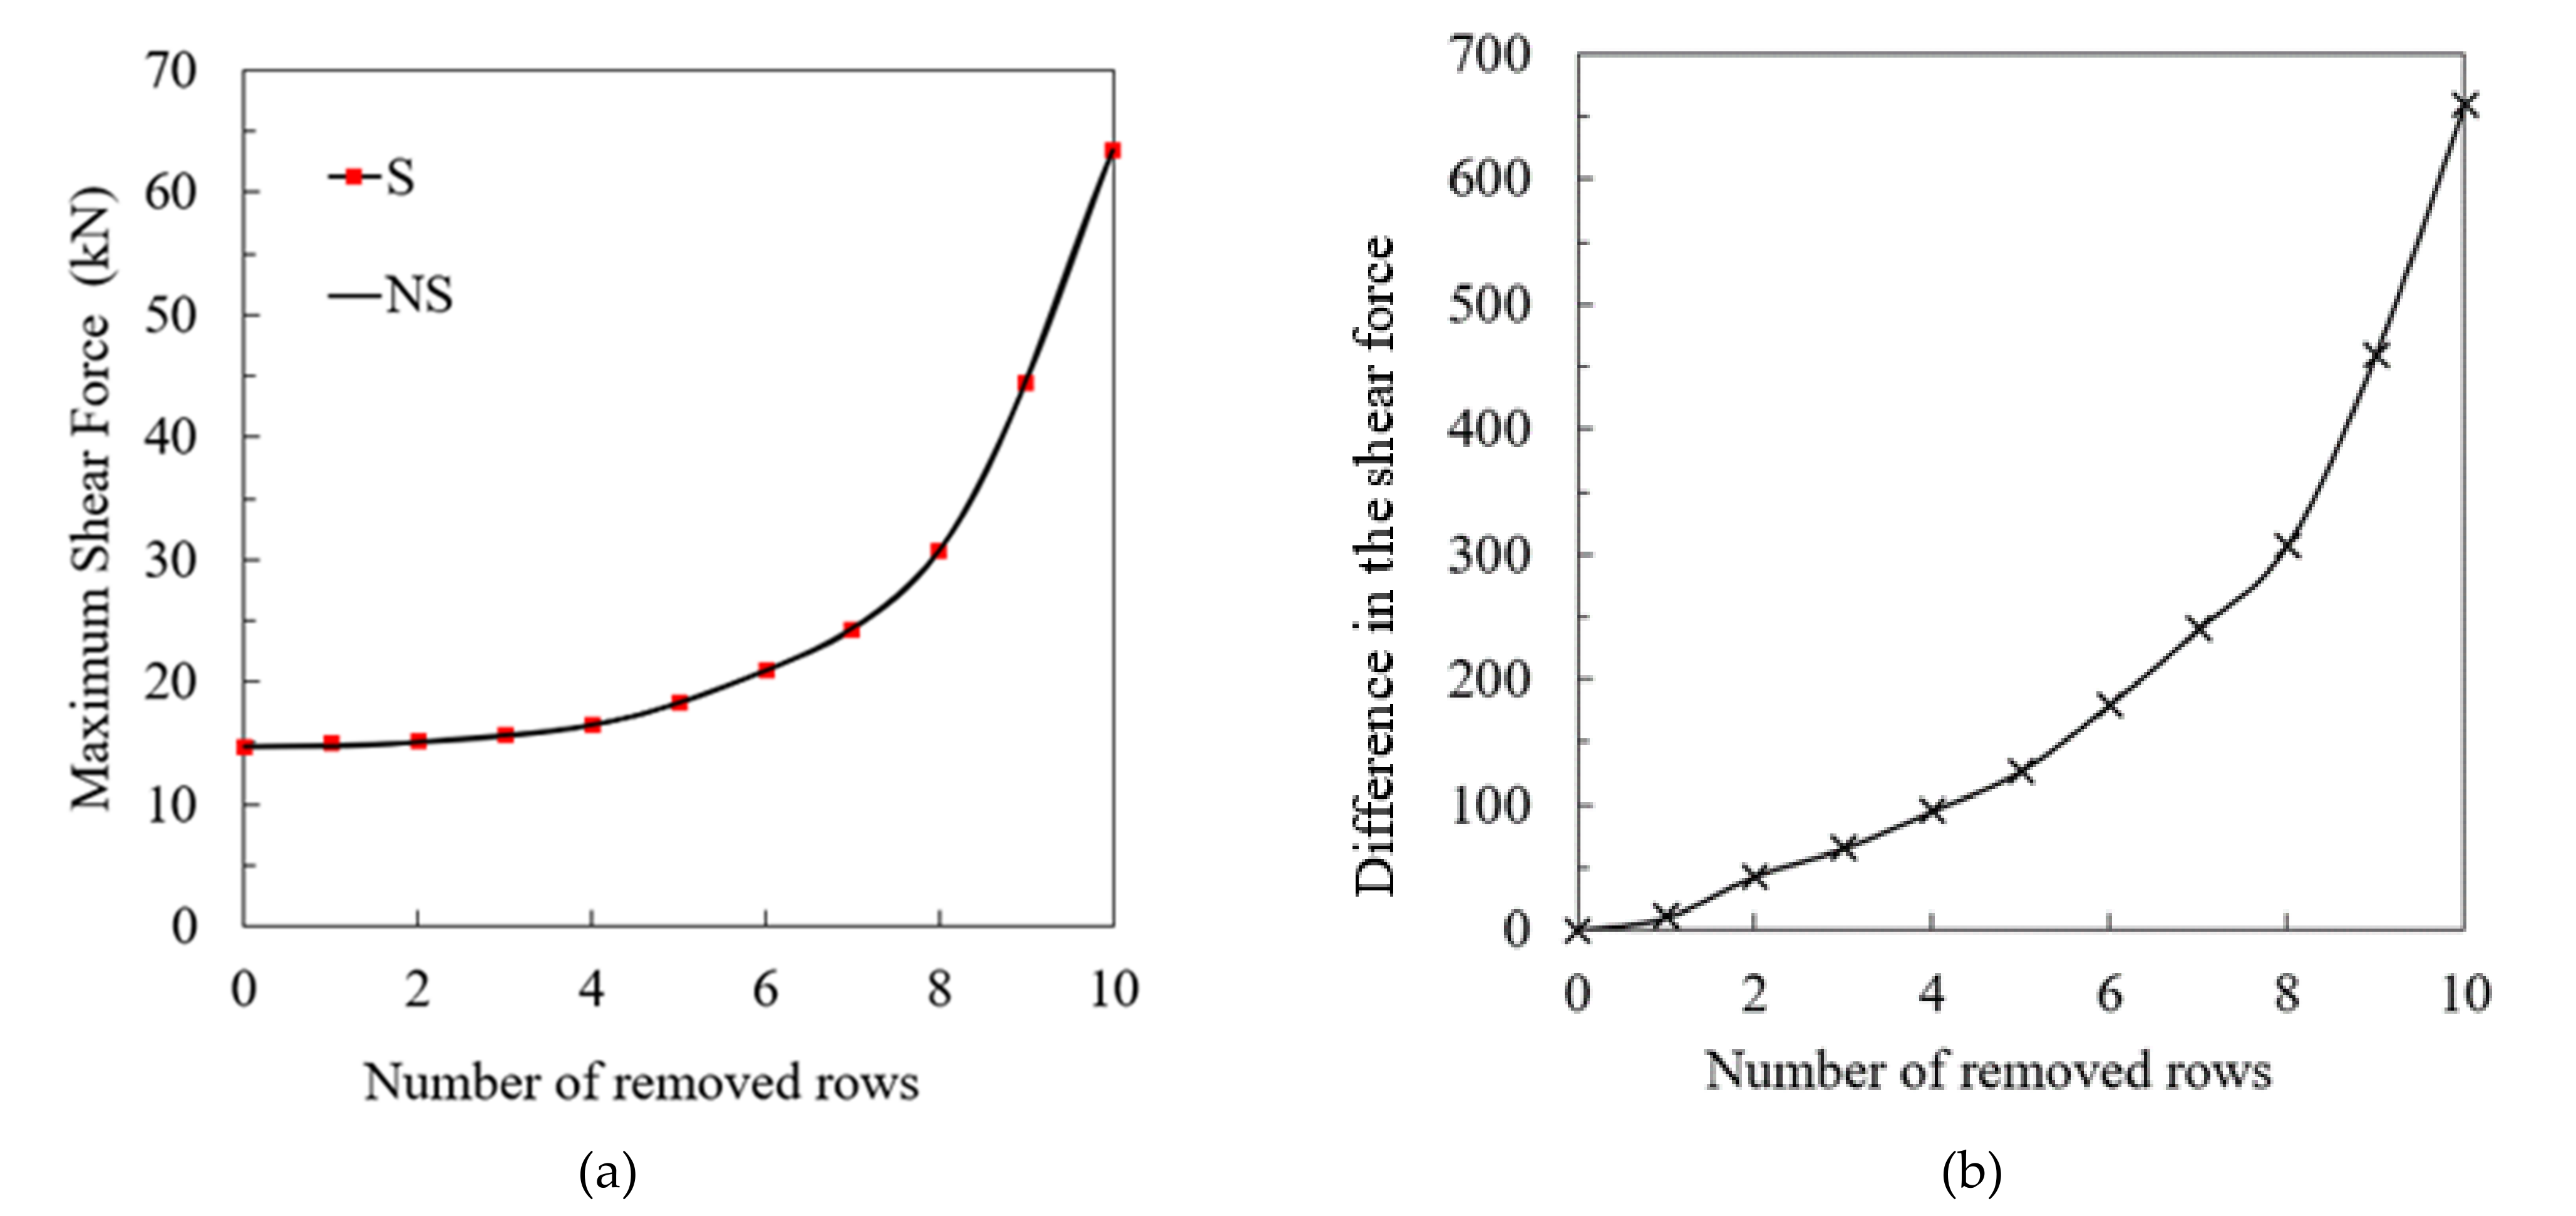
To evaluate the effect of the progressive failure of studs at one end of the beam on the shear force experienced by the shear studs, the results of the maximum and minimum shear forces in the most critical region of the composite beam were monitored. As this study involved removing the first ten rows, the eleventh row (#11 in
Figure 5) is the closest non-removed row to the beam ends, which experiences the highest slippage values. Thus, the results of the eleventh row were used for this study. The shear forces were explored from ANSYS Workbench as the reactions on the non-linear spring elements, COMBIN39, which were used to simulate the connection between the shear connectors and steel beam. To figure out the maximum and minimum shear forces, these reactions were determined at the maximum and minimum applied loads, which were represented as time steps in the model. The maximum and minimum stud shear force values were taken after each row was removed for both the S and NS samples.
Figure 9a shows the maximum shear force results as the number of removed rows increased. The increases in the maximum shear forces for both S and NS samples were slow until the removal of the fifth row, and thereafter the rate of change significantly increased, causing the maximum shear force to reach 63 kN after 10 rows were removed, which represents approximately 70% of the stud shear resistance. The reduction in the maximum shear force due to post-tensioning, which is the difference in the maximum shear forces between the strengthened and non-strengthened beam, increased as the number of removed rows increased. However, the difference was within 1 kN, as can be seen in
Figure 9b.
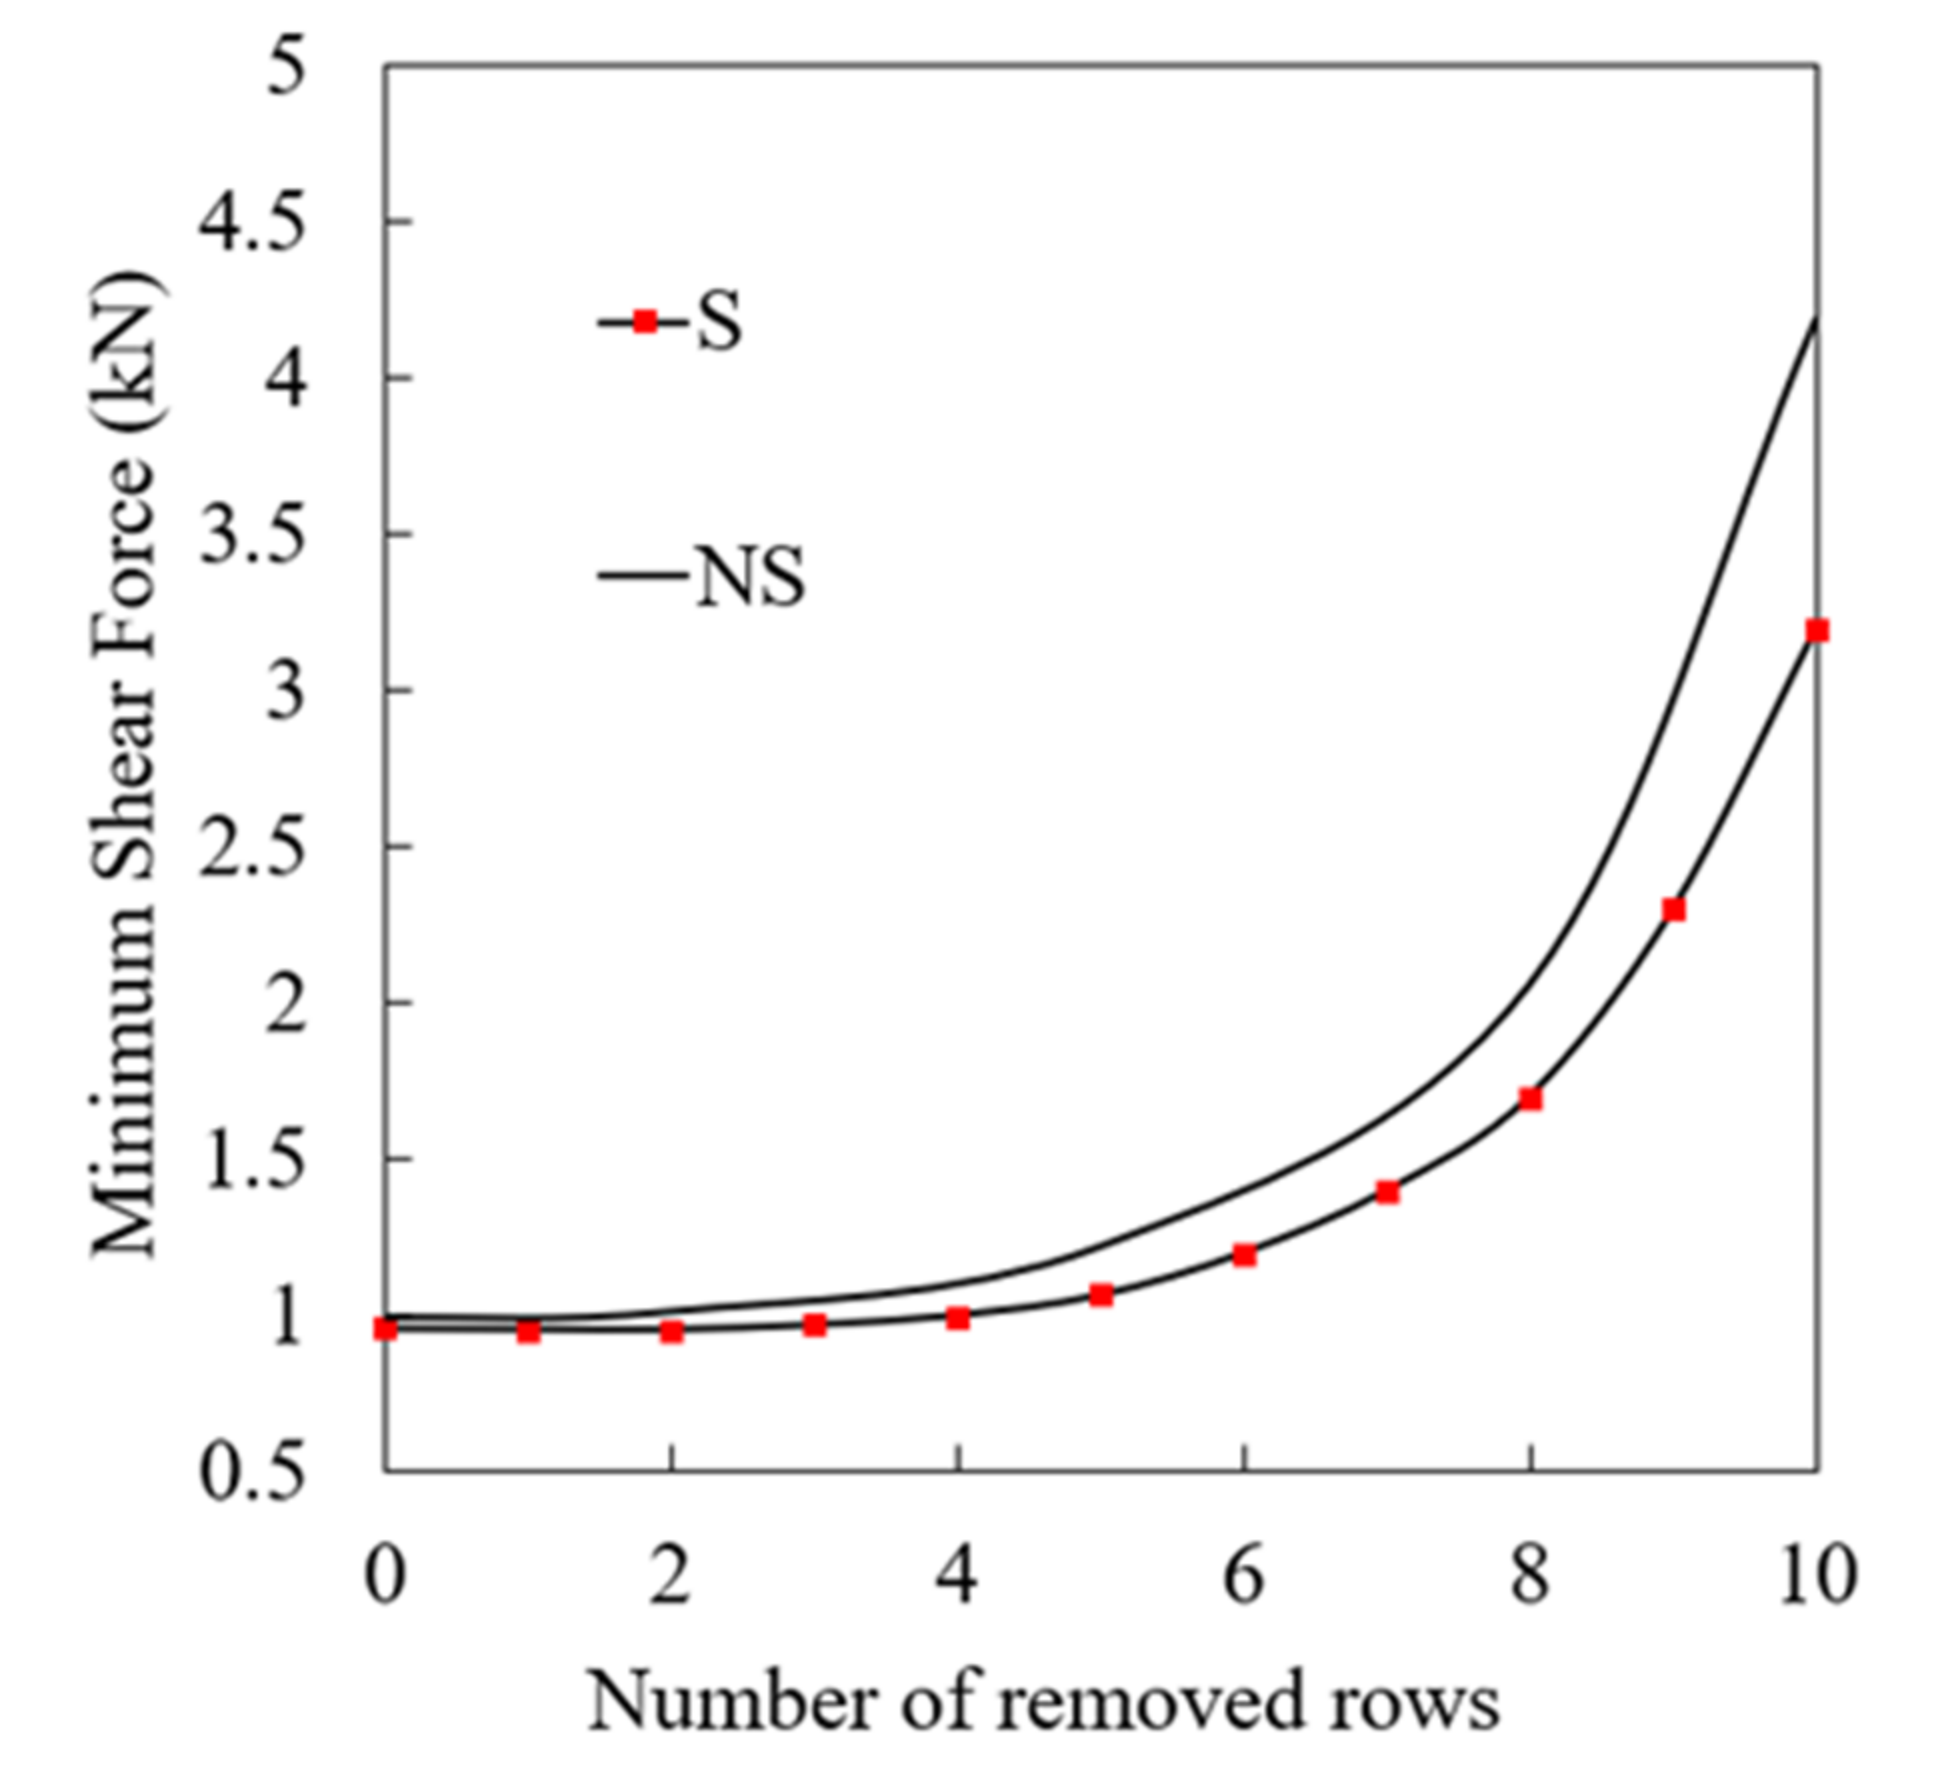
Figure 10 shows the minimum shear force results for the S and NS samples. Like the maximum shear force behavior, the minimum shear force gradually and slightly increased until five rows were removed. After that, the rate of change in the minimum shear force sharply increased with the strengthened sample having 1 kN less minimum shear force compared to the non-strengthened sample.
5.3. The Effect on the Shear Stress Range across the Beam
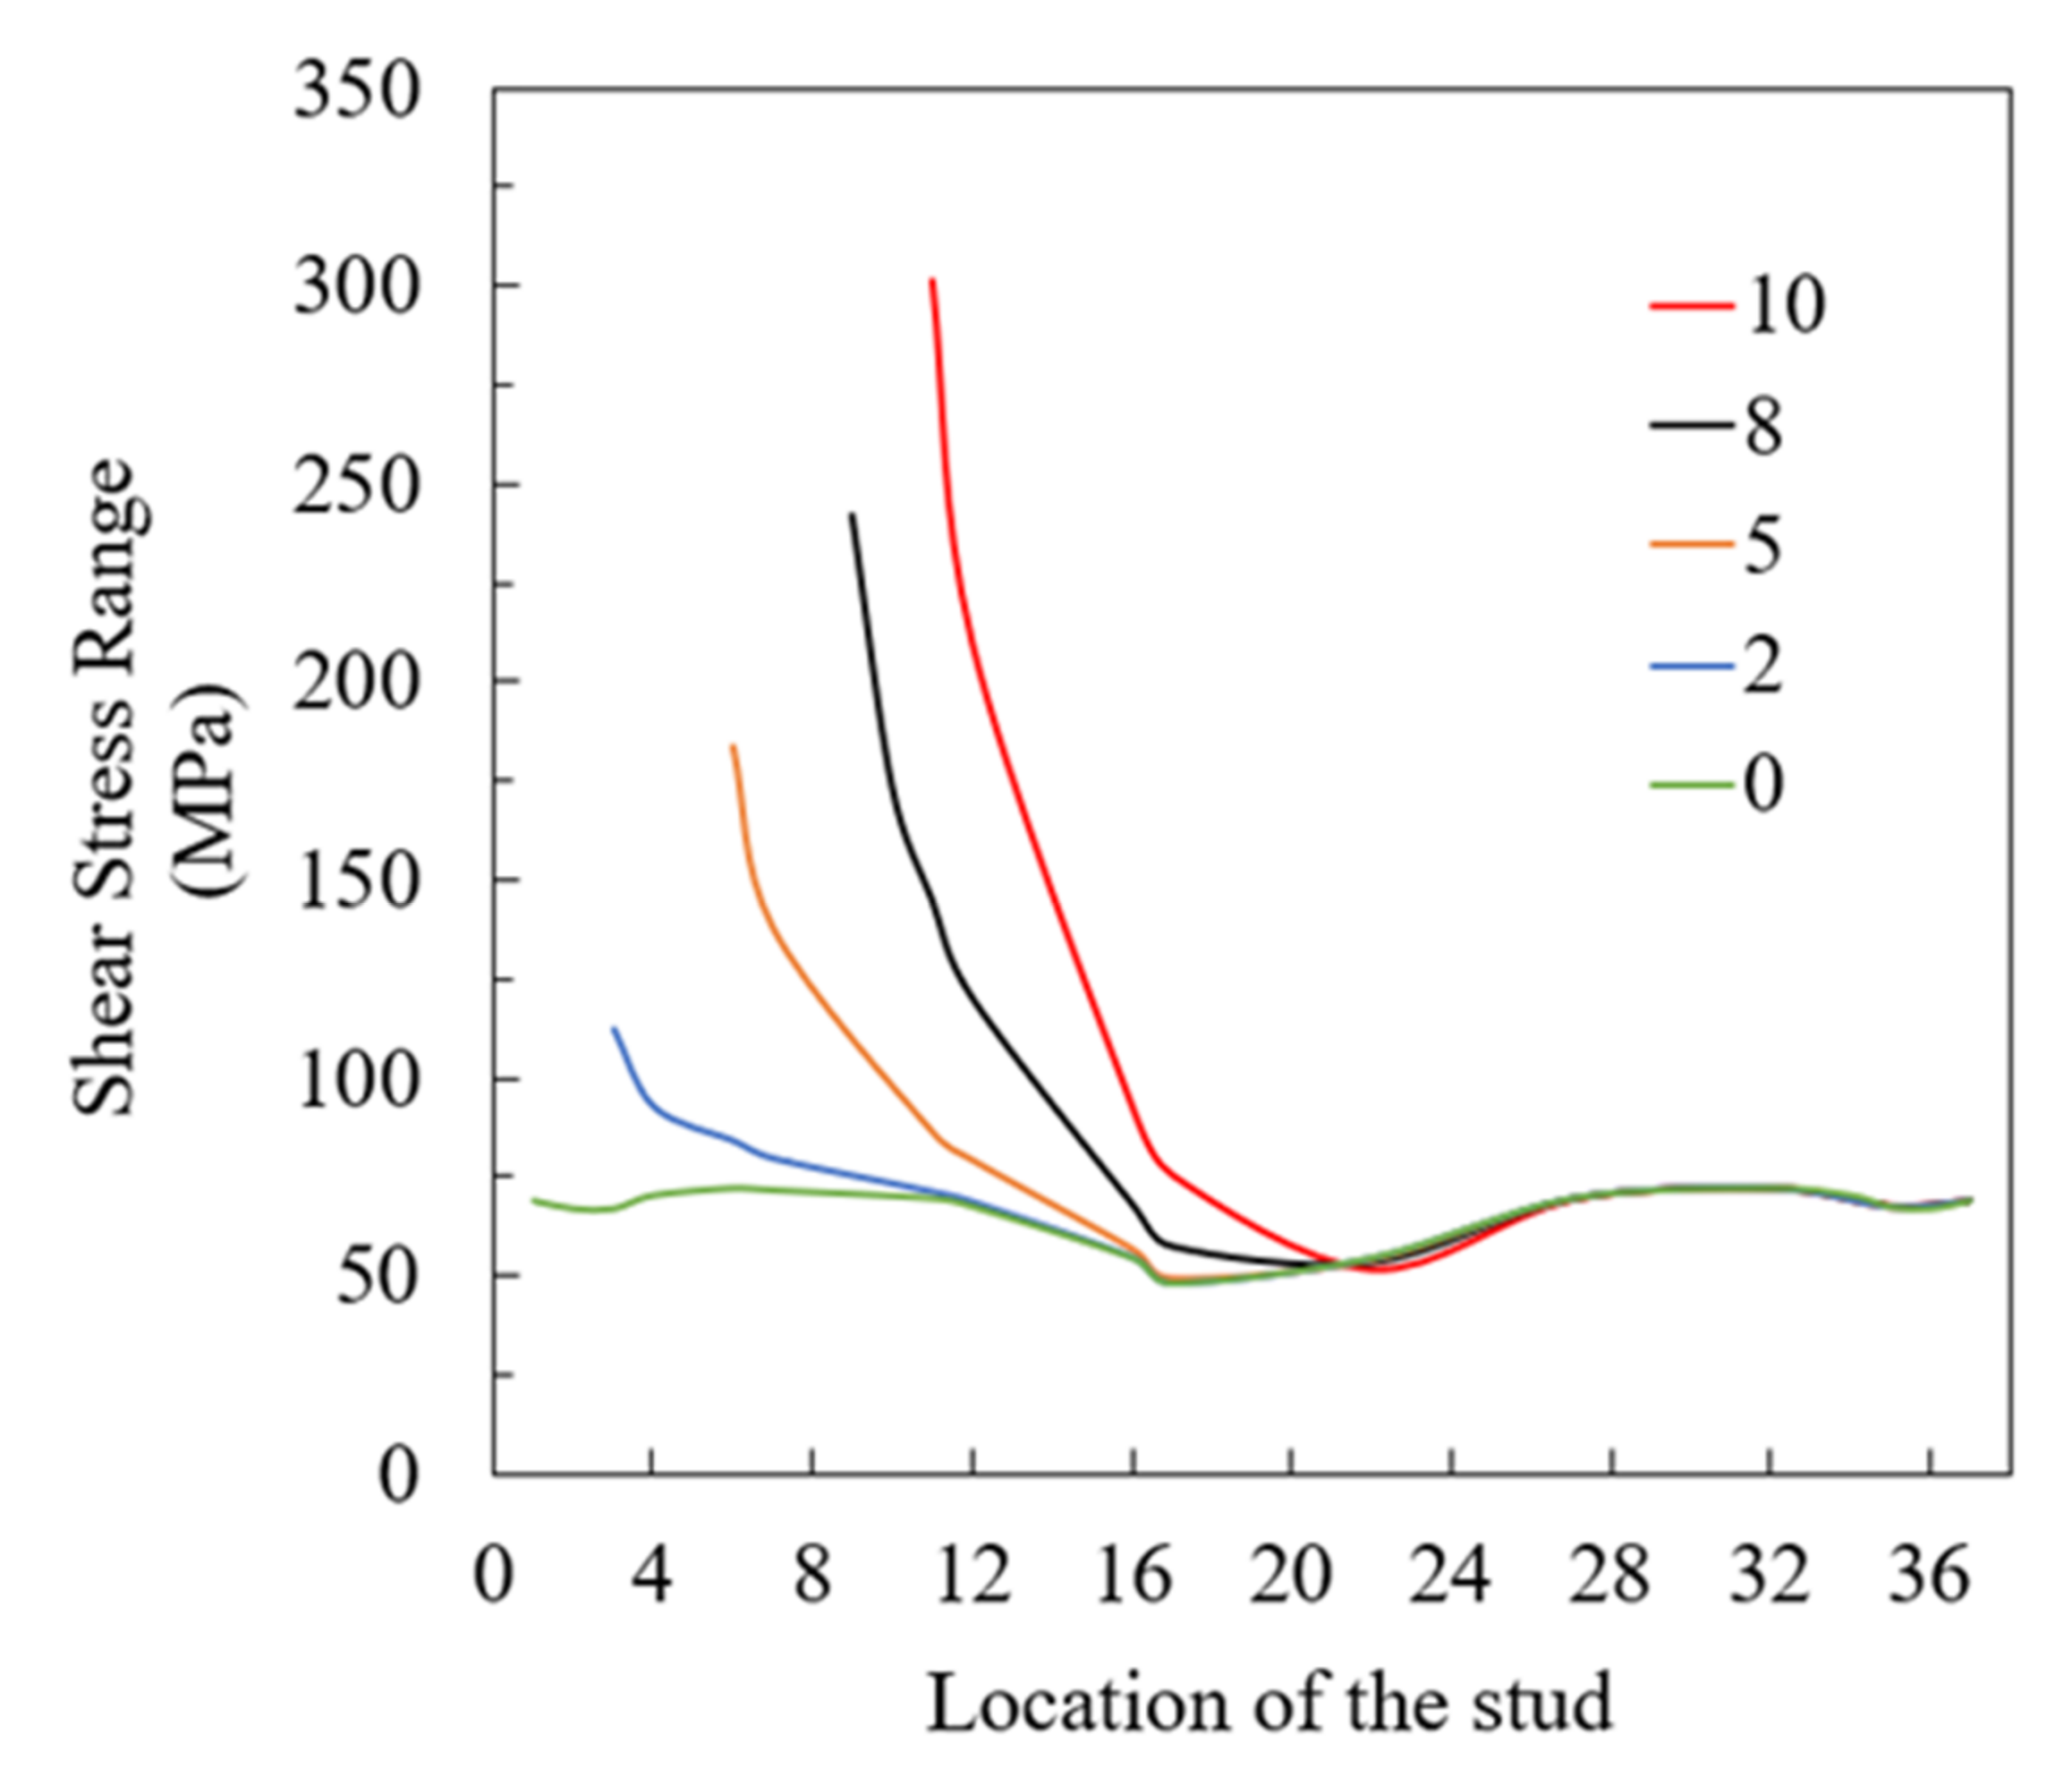
As shown in the previous section, the maximum and minimum shear forces increased at a similar rate for samples S and NS, and hence the shear stress ranges for both the strengthened and non-strengthened samples were the same and were not affected by the post-tensioning. Therefore, the shear stress range results across the composite beam after each step are presented here for the strengthened sample only. The shear stress range applied to the studs across the strengthened composite beam was taken after each step to evaluate the effect of the stud removal on the stress ranges of both sides of the beams.
Figure 11 shows a comparison of the shear stress range results when no rows were removed (step 0) and the shear stress range results after steps 2, 5, 8, and 10. Although, theoretically the shear stress is expected to be constant between the loading point and the beam end, the results obtained from the model show that the end regions of the beam have higher shear stress ranges than those in the midspan region even before any studs were removed. After each removal, the non-removed row closest to the removed studs experienced the highest stress range with the stress range gradually decreasing toward the midspan, and after this the effect of stud removal is negligible. As can be seen in
Figure 11, the shear stress range at any given location increased as the number of removed rows increased. This is attributed to the high steel-concrete interface slippage experienced by the beams at the removal side. This slippage, and consequently the shear stress range, increased as the number of removed studs increased as discussed previously (see
Figure 8a). The stress ranges on the non-removal side were almost the same after each step, which is also consistent with the constant slippage values shown in
Figure 8b.
5.4. The Effect on the Remaining Fatigue Life
The number of fatigue cycles until failure of the shear stud under the applied shear stress range can be calculated using AASHTO’s empirical S-N curve equation [
18], which relates the number of remaining fatigue cycles, N, until failure of the stud to the shear stress range,
Δτ, in the studs as follows:
In this section, the theoretically calculated shear stress ranges of studs in the eleventh row are compared to those obtained from the FE model. Then, using Equation (6), the corresponding remaining fatigue life is evaluated for the theoretical and FE results. The theoretical calculation of shear stress ranges involved using the shear flow equation and properties and dimensions of the sample as in Equation (7) [
19]:
where
q is the shear flow (unit force per unit length) calculated using Equation (8),
s is the spacing between studs, and
As is the cross-section area of the shear connector.
where
V is the shear force,
Q is the first moment of area for the concrete deck about the neutral axis of the transformed cross-section, and
I is the second moment of inertia of the transformed cross-section.
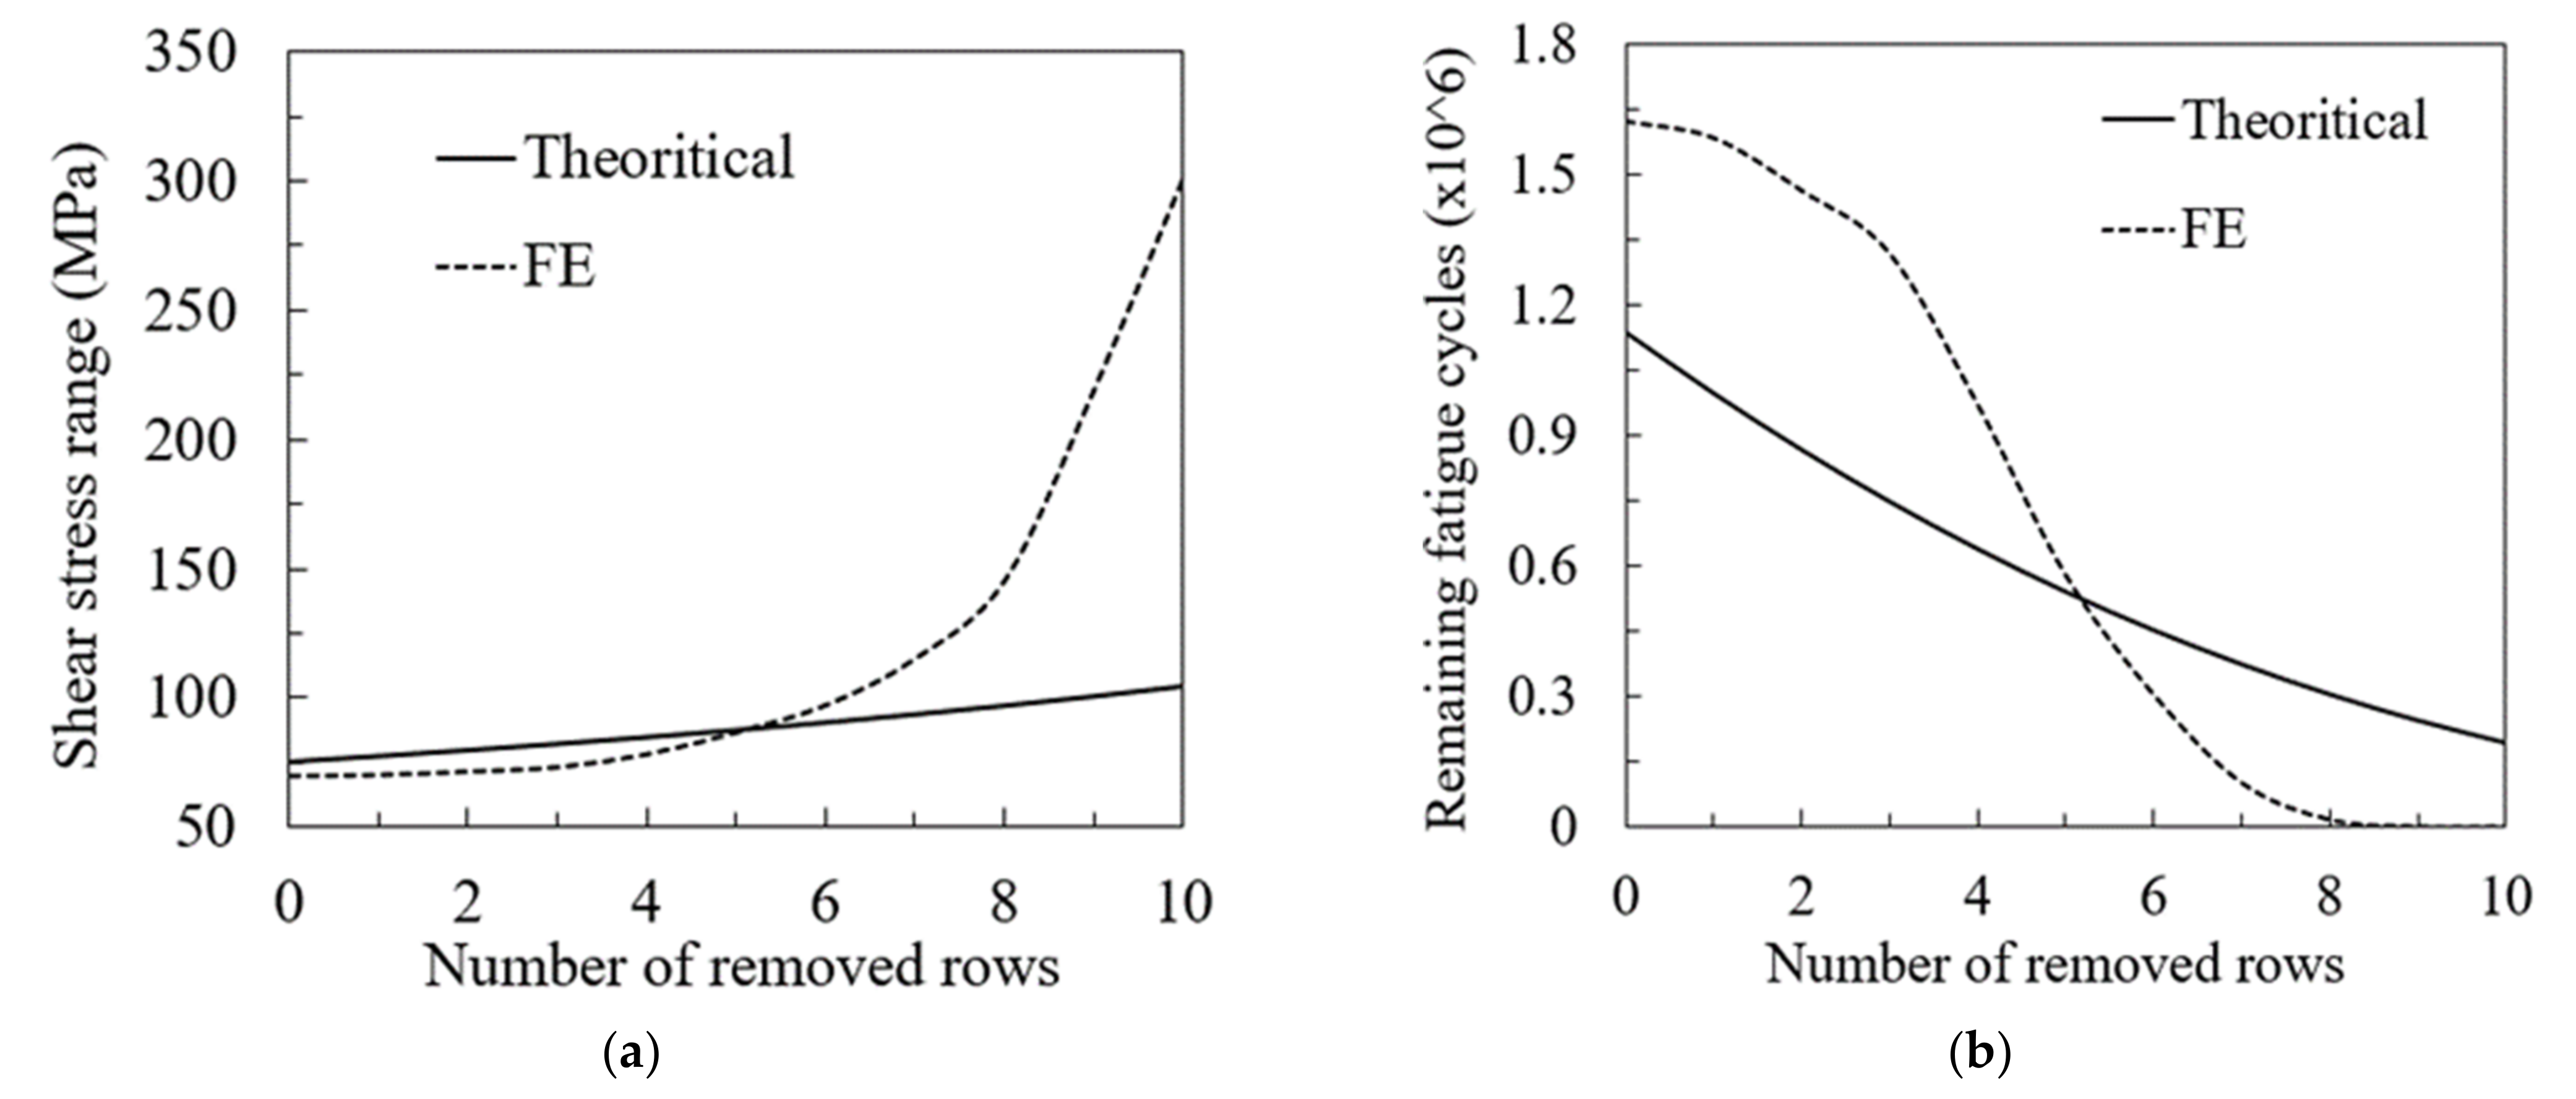
Figure 12a shows the comparison between the theoretical shear stress range after each step and the FE results. As shown in the figure, the theoretical shear stress range increased linearly after the removal of each row with a constant and relatively low rate of change. The shear stress range was 75 MPa when no studs were removed, and it was doubled after the removal of 10 rows. The FE shear stress results, on the other hand, show that the shear stress range was slightly lower than the theoretical values until five rows were removed. After that, the shear stress range started to increase significantly reaching a maximum of 300 MPa after step 10 (the removal of 10 rows). This could be because the theoretical calculation of the shear stress range did not consider the effect of the slippage and assumed a full shear connection between the steel beam and concrete deck. Therefore, until five rows of studs were removed, which represents 15% of the total number of rows, the effect of the slippage was not apparent, and the difference in the stress ranges of the theoretical and FE results was insignificant. As the number of removed studs increased, which resulted in the increase in the slippage, the FE results gave higher shear stress ranges than the theoretical values due to the inclusion of the slippage effect in the model. The FE model provided more accurate results because the slippage effect was included, and that effect was excluded in the theoretical calculations. Thus, the theoretical calculation of the shear stress and fatigue life should be carefully used.
As Equation (6) relates the shear stress range
Δτ to the corresponding fatigue life N, the theoretical and FE shear stress range values in
Figure 12a were used to calculate the estimated remaining fatigue life of the stud.
Figure 12b shows the results of the remaining fatigue life after each removal step. As can be seen in the figure, when no studs were removed, the number of remaining fatigue cycles was theoretically expected to be 1.135 million cycles, while the FE model predicted a fatigue life of 1.62 million cycles, which was 42% more than the theoretical result. Before the number of removed rows reached five, the FE results estimated higher remaining fatigue cycles than the theoretical results with a maximum difference of 75%. After that, the theoretical results were overestimating the fatigue life of the studs, which was because of slippage being neglected in the theoretical calculations.
5.5. The Effect on Strains at the Extreme Fibers of Steel and Concrete
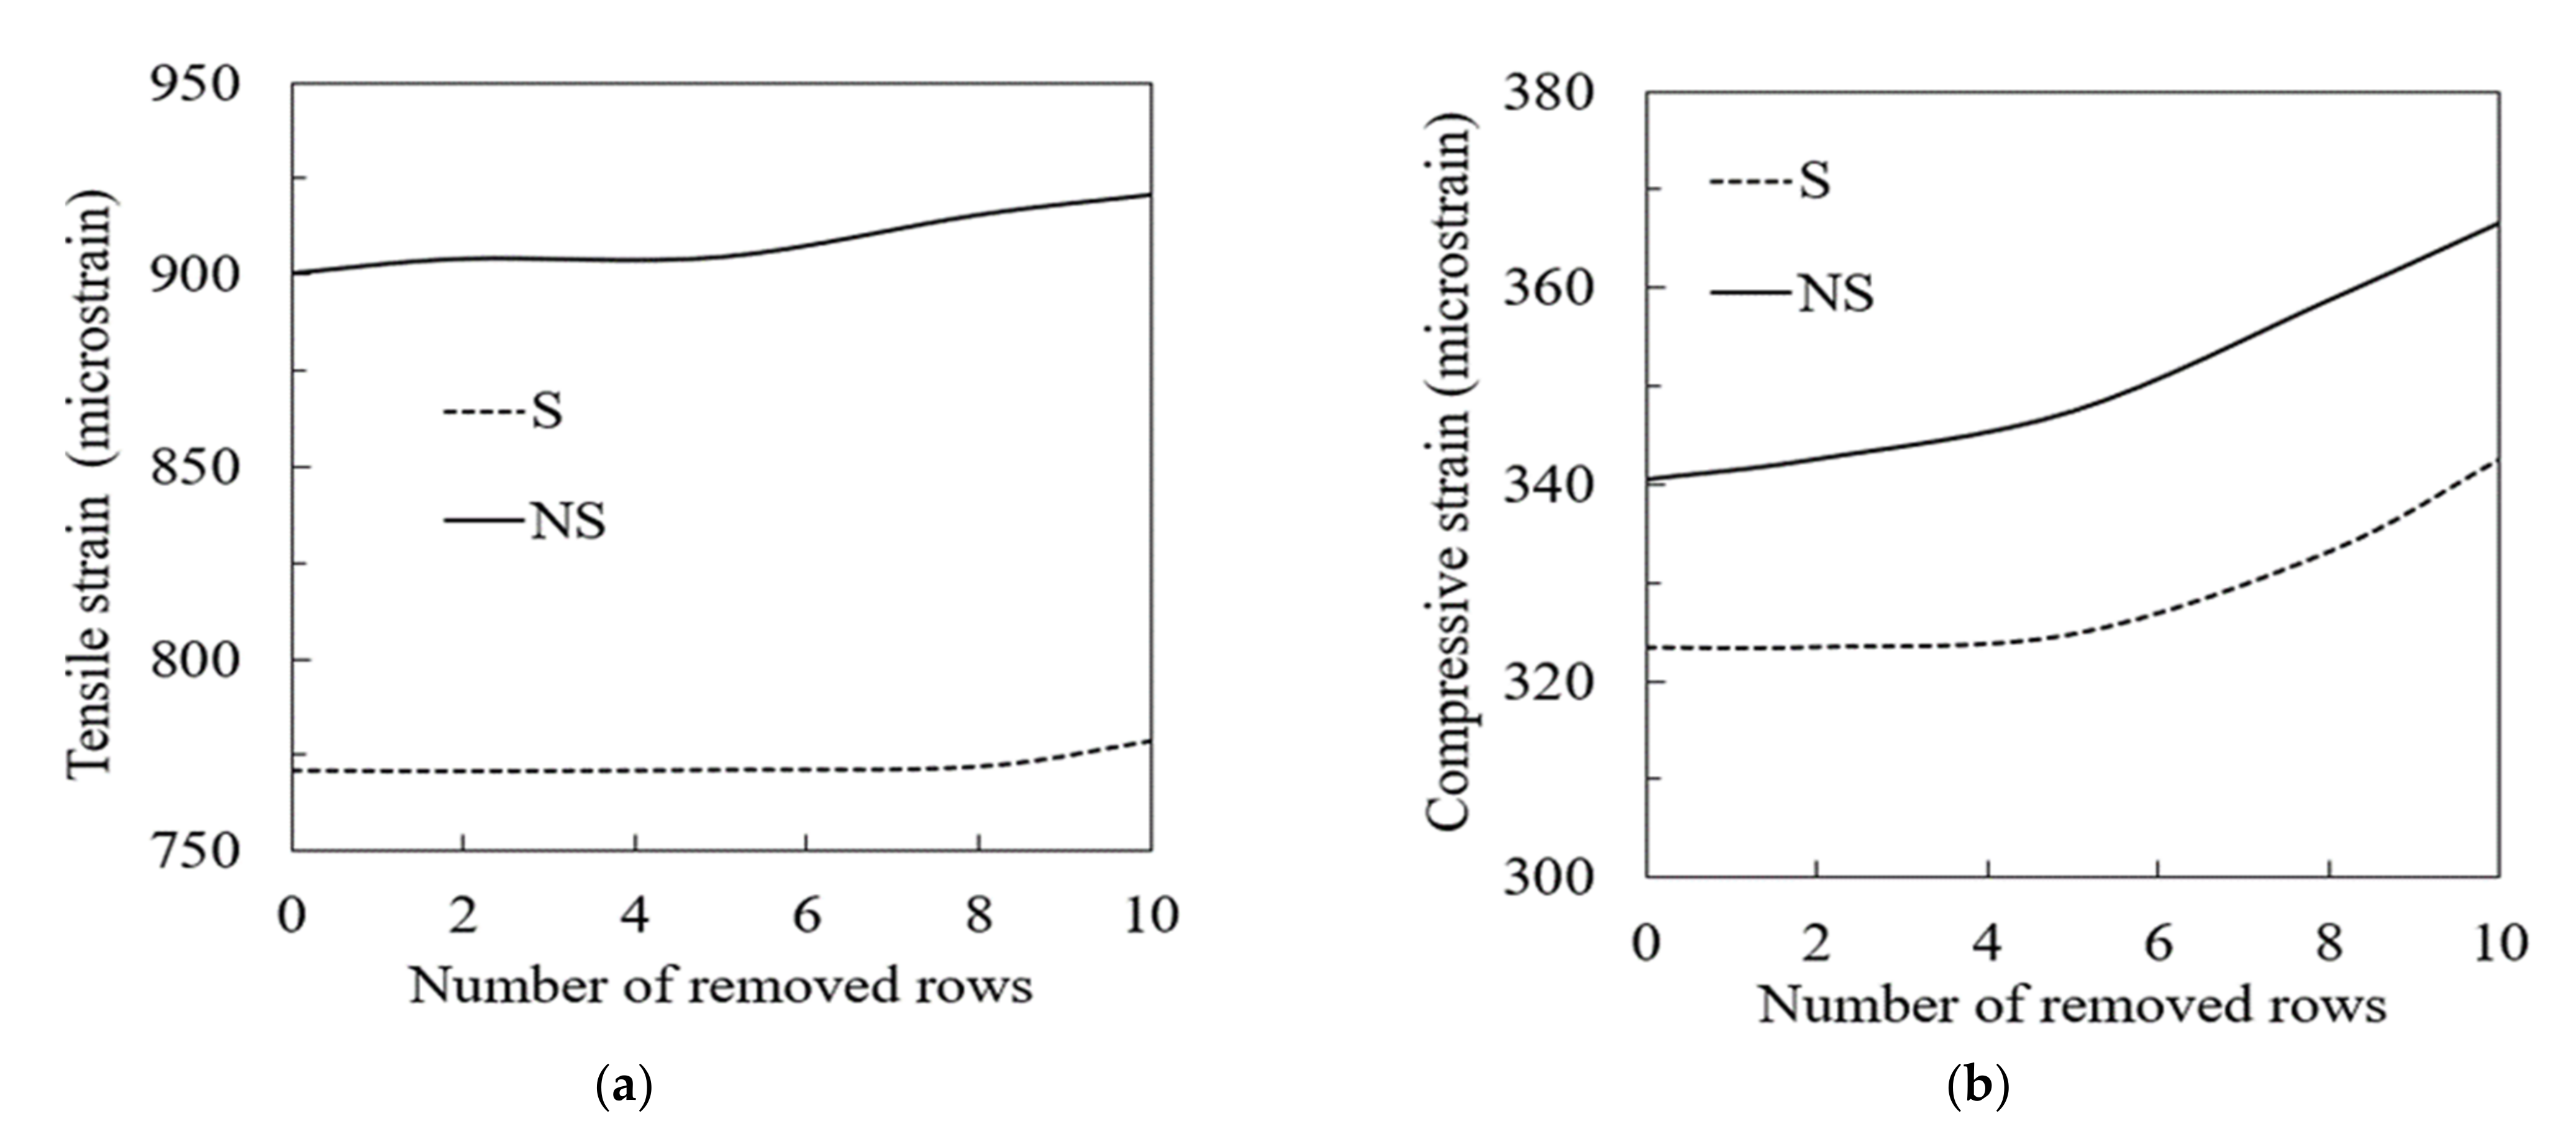
The midspan tensile and compressive strains in the extreme fibers of the composite section corresponding to the maximum load were taken after each stud removal step for both the strengthened and non-strengthened samples.
Figure 13a shows the tensile strains at the bottom flange of the steel beam as a function of the number of removed stud rows. The effect of stud removal was more apparent in the non-strengthened beam where the incremental rate in strains was higher than that of the strengthened sample. The strengthened sample’s tensile strain was constant as the number of removed studs increased and only slightly increased after eight rows were removed. The tensile strain for the non-strengthened sample increased by 2.5% from step 0 (when no studs were removed) to step 10 (when 10 rows were removed). The incremental increase in the tensile strain of the non-strengthened sample was 175% higher than that of the strengthened sample.
Figure 13b shows the compressive strains at the top fiber of the concrete deck. For the non-strengthened sample, the compressive strain increased linearly as the number of removed studs increased with a higher rate of change after five rows were removed. The compressive strains for the strengthened sample, on the other hand, were constant until five rows were removed, and thereafter the strains started to increase at a rate comparable to that of the non-strengthened sample. The overall incremental increases in compressive strains were increased by 8% for the non-strengthened sample and 6% for the strengthened sample. The increases in the tensile and compressive strains were thought to be due to the loss of composite action between the concrete deck and steel beam due to the separation of the two components at the removal side, causing each component to behave individually rather than compositely.
5.6. The Effect on the Flexural Strength
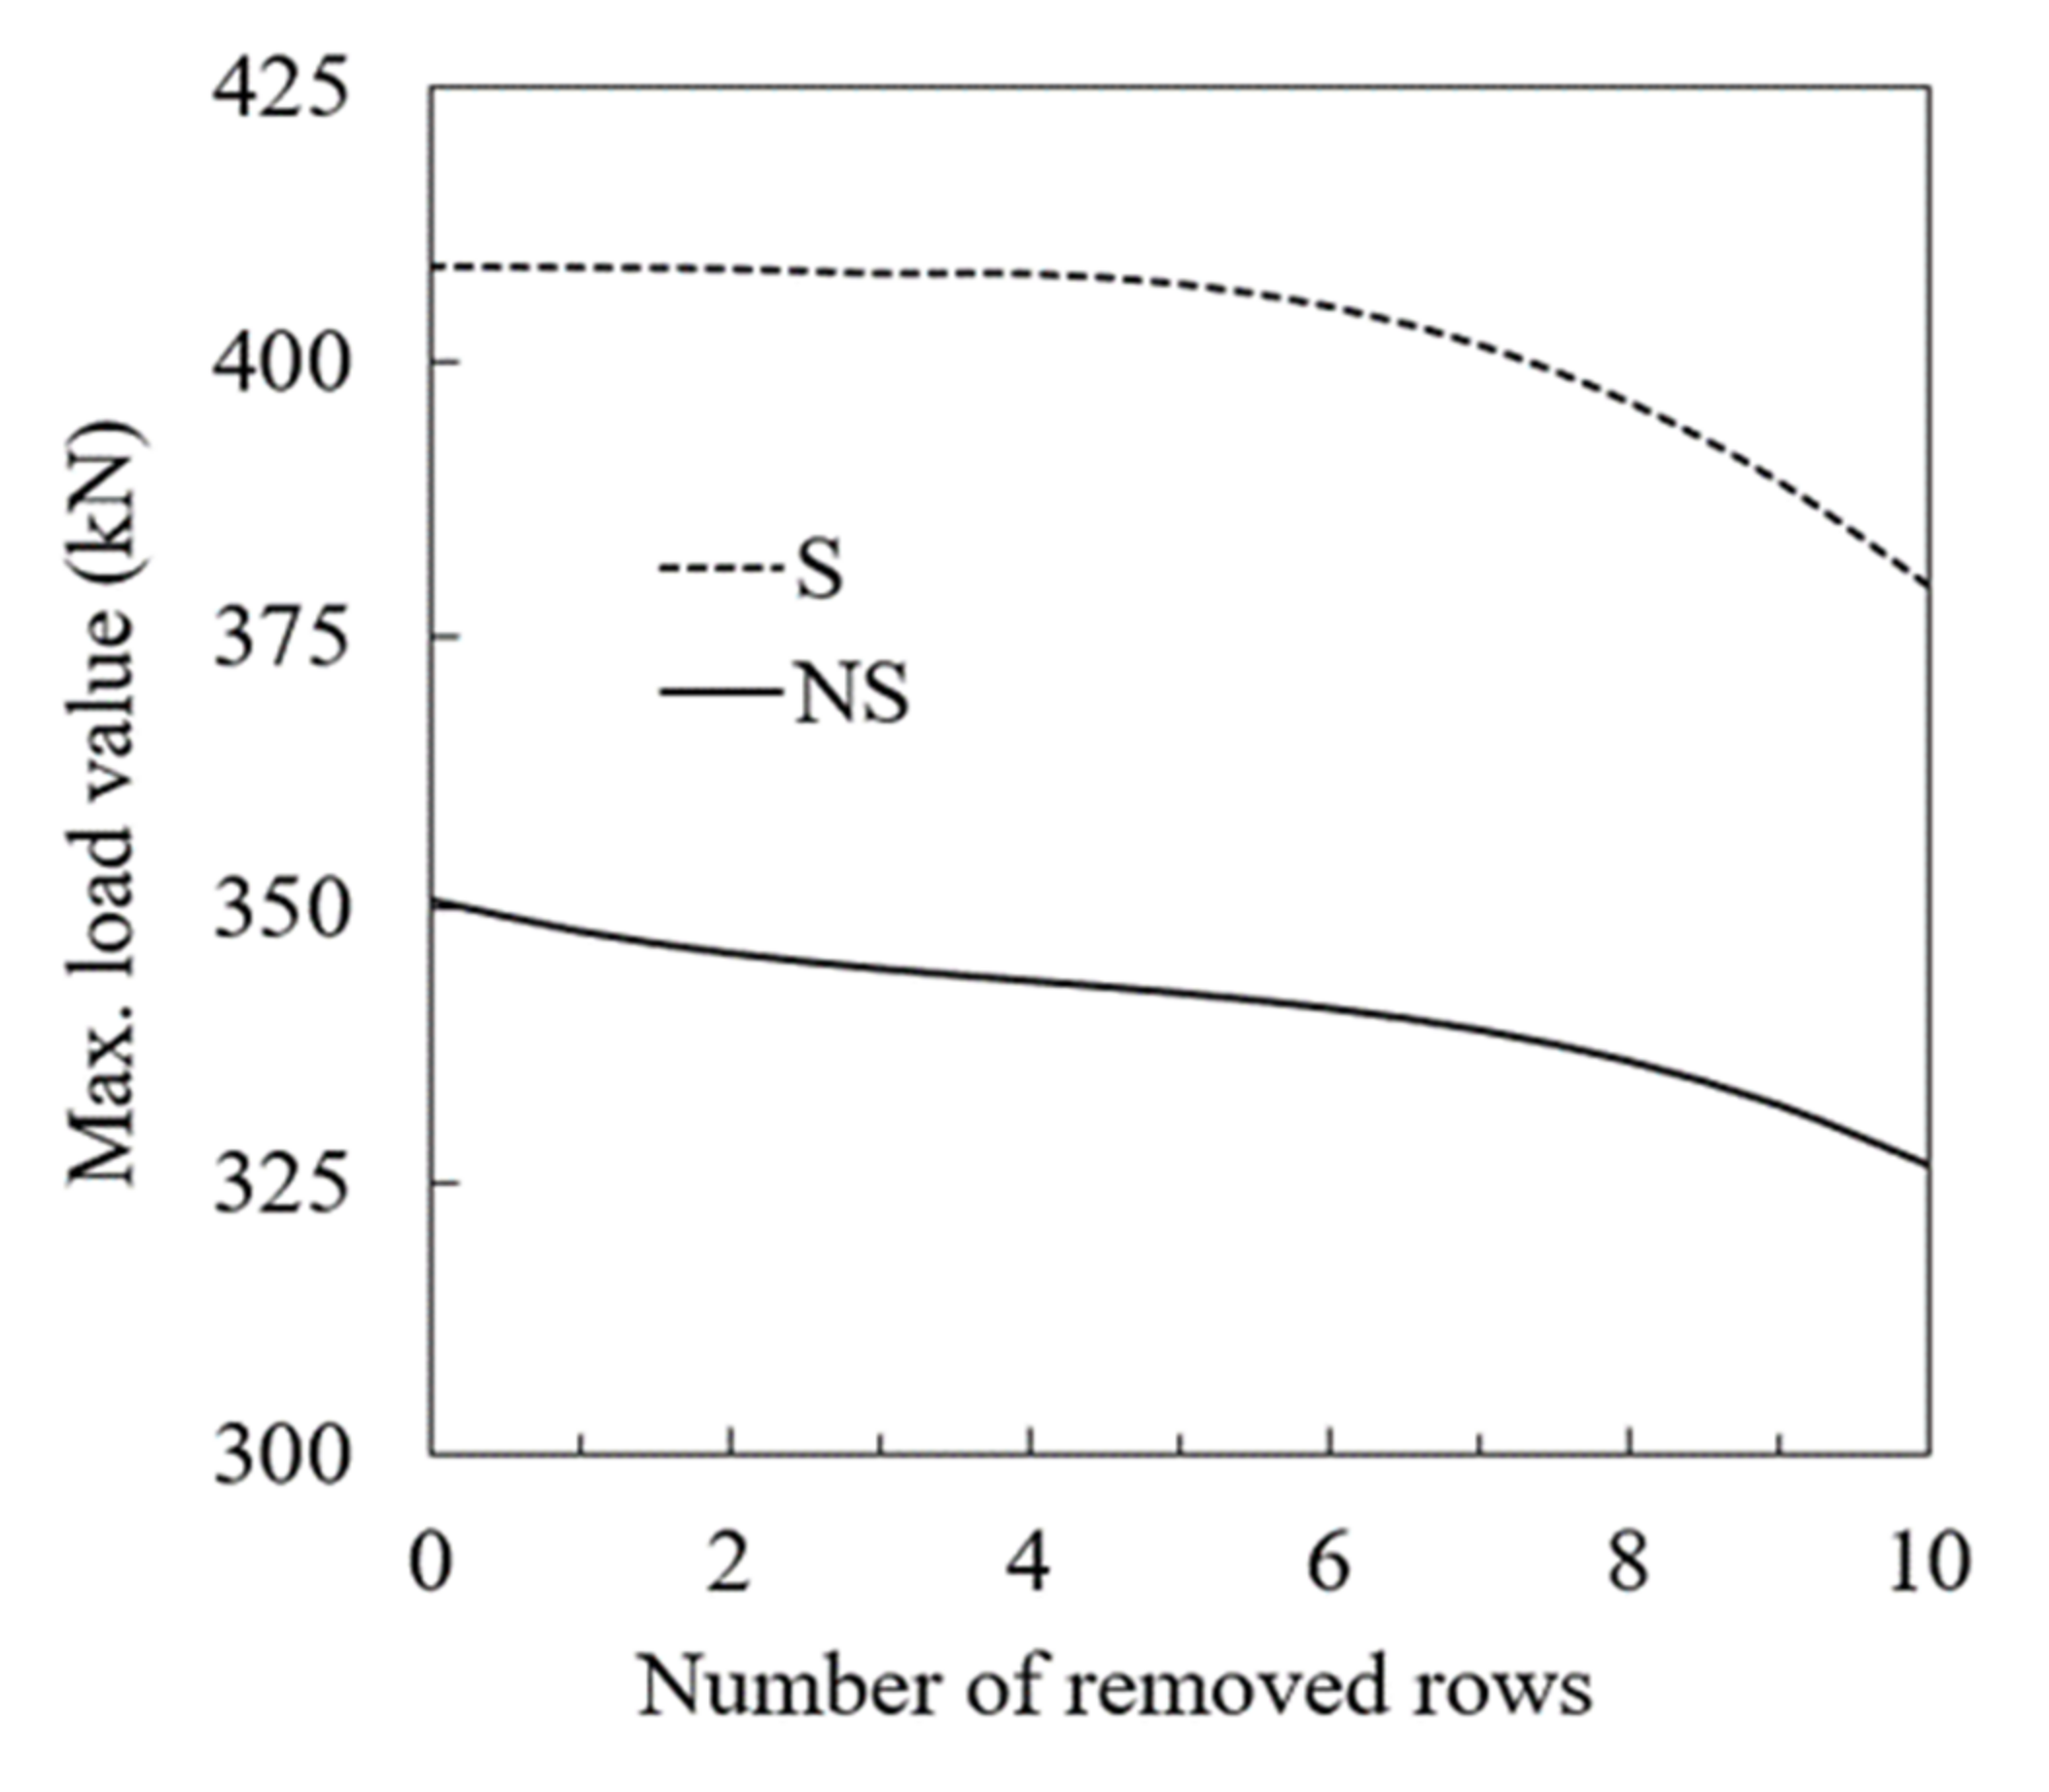
To evaluate the reduction in the flexural capacity caused by the progressive removal of studs, the strengthened and non-strengthened samples were loaded until failure after each row was removed.
Figure 14 shows the maximum load-carrying capacity of each sample as the number of removed studs increased. As shown in the figure, the maximum load-carrying capacities for both S and NS beams decreased as the number of removed studs increased. The maximum loads after five rows were removed were reduced by 8.5 kN for the non-strengthened sample and by 1.6 kN for the strengthened sample, which indicates a higher rate of reduction for the non-strengthened sample.
After that, however, the strengthened beam exhibited a higher rate of reduction. Between steps 5 and 10, the maximum loads were reduced by 27 kN and 15 kN for the S and NS samples, respectively.
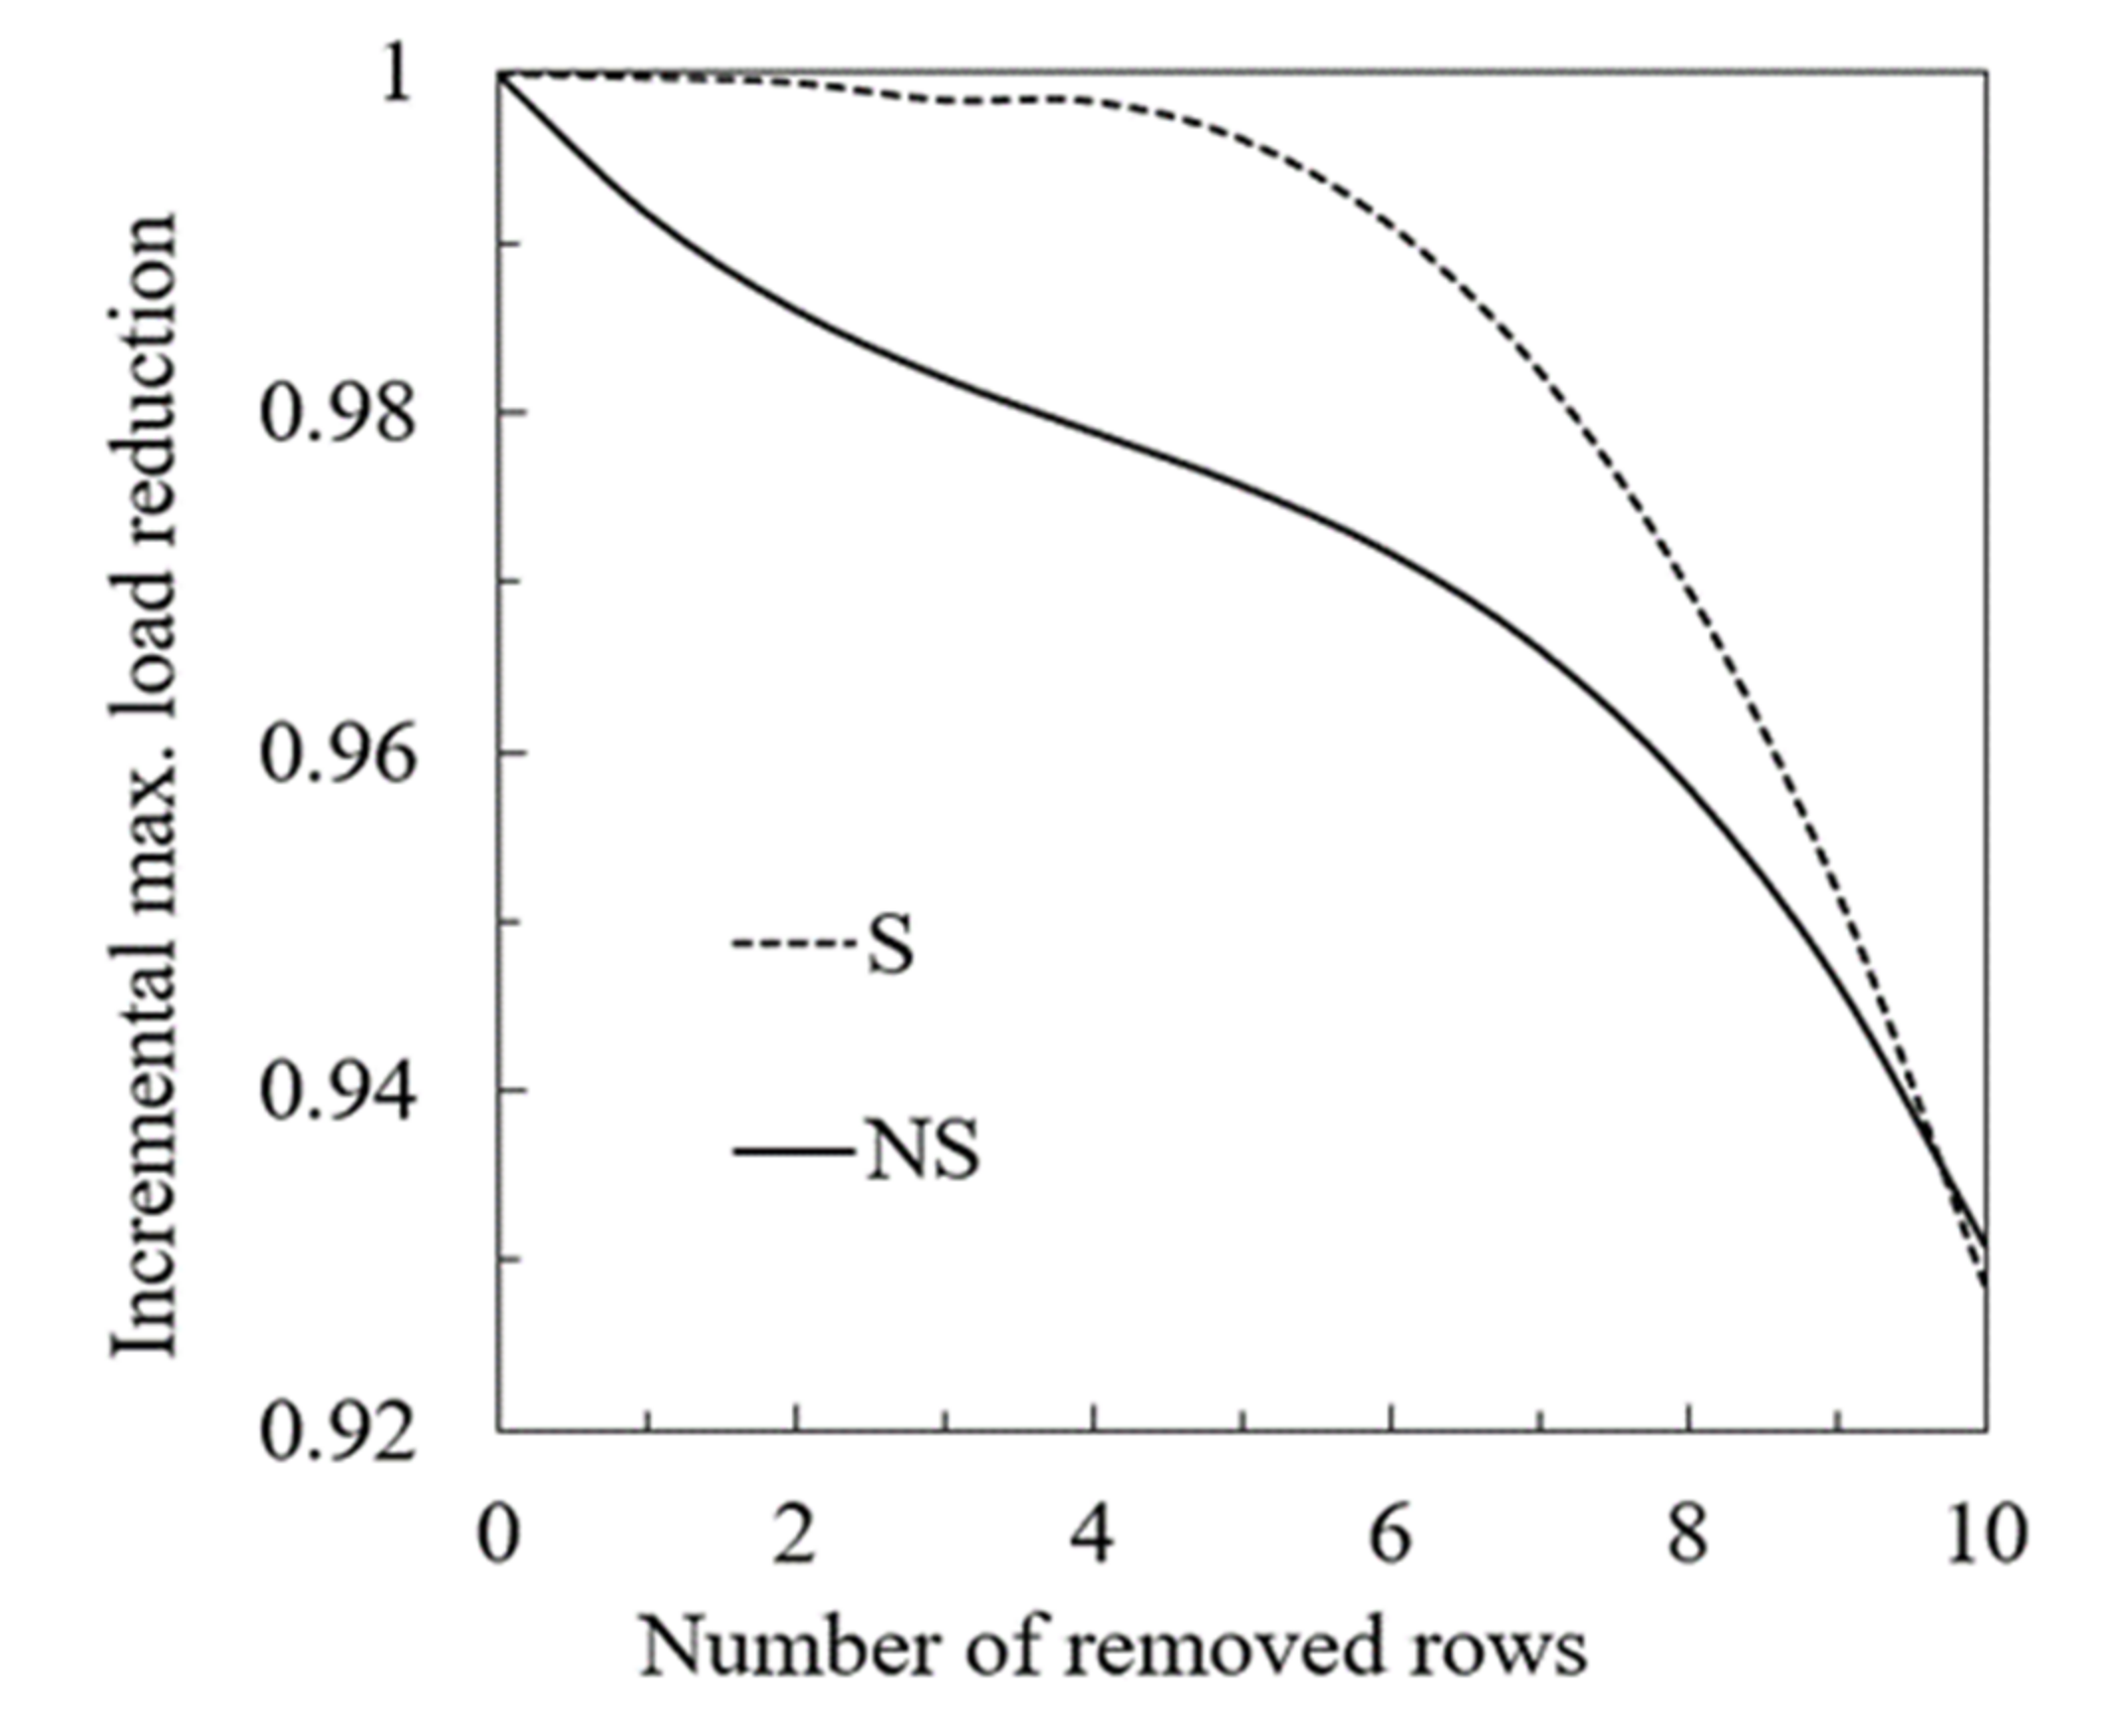
Figure 15 shows the ratio of the maximum load after each row was removed to the maximum load of an intact beam (with no studs removed). Both S and NS samples experienced an overall 7% reduction in the maximum loads after 10 rows were removed.
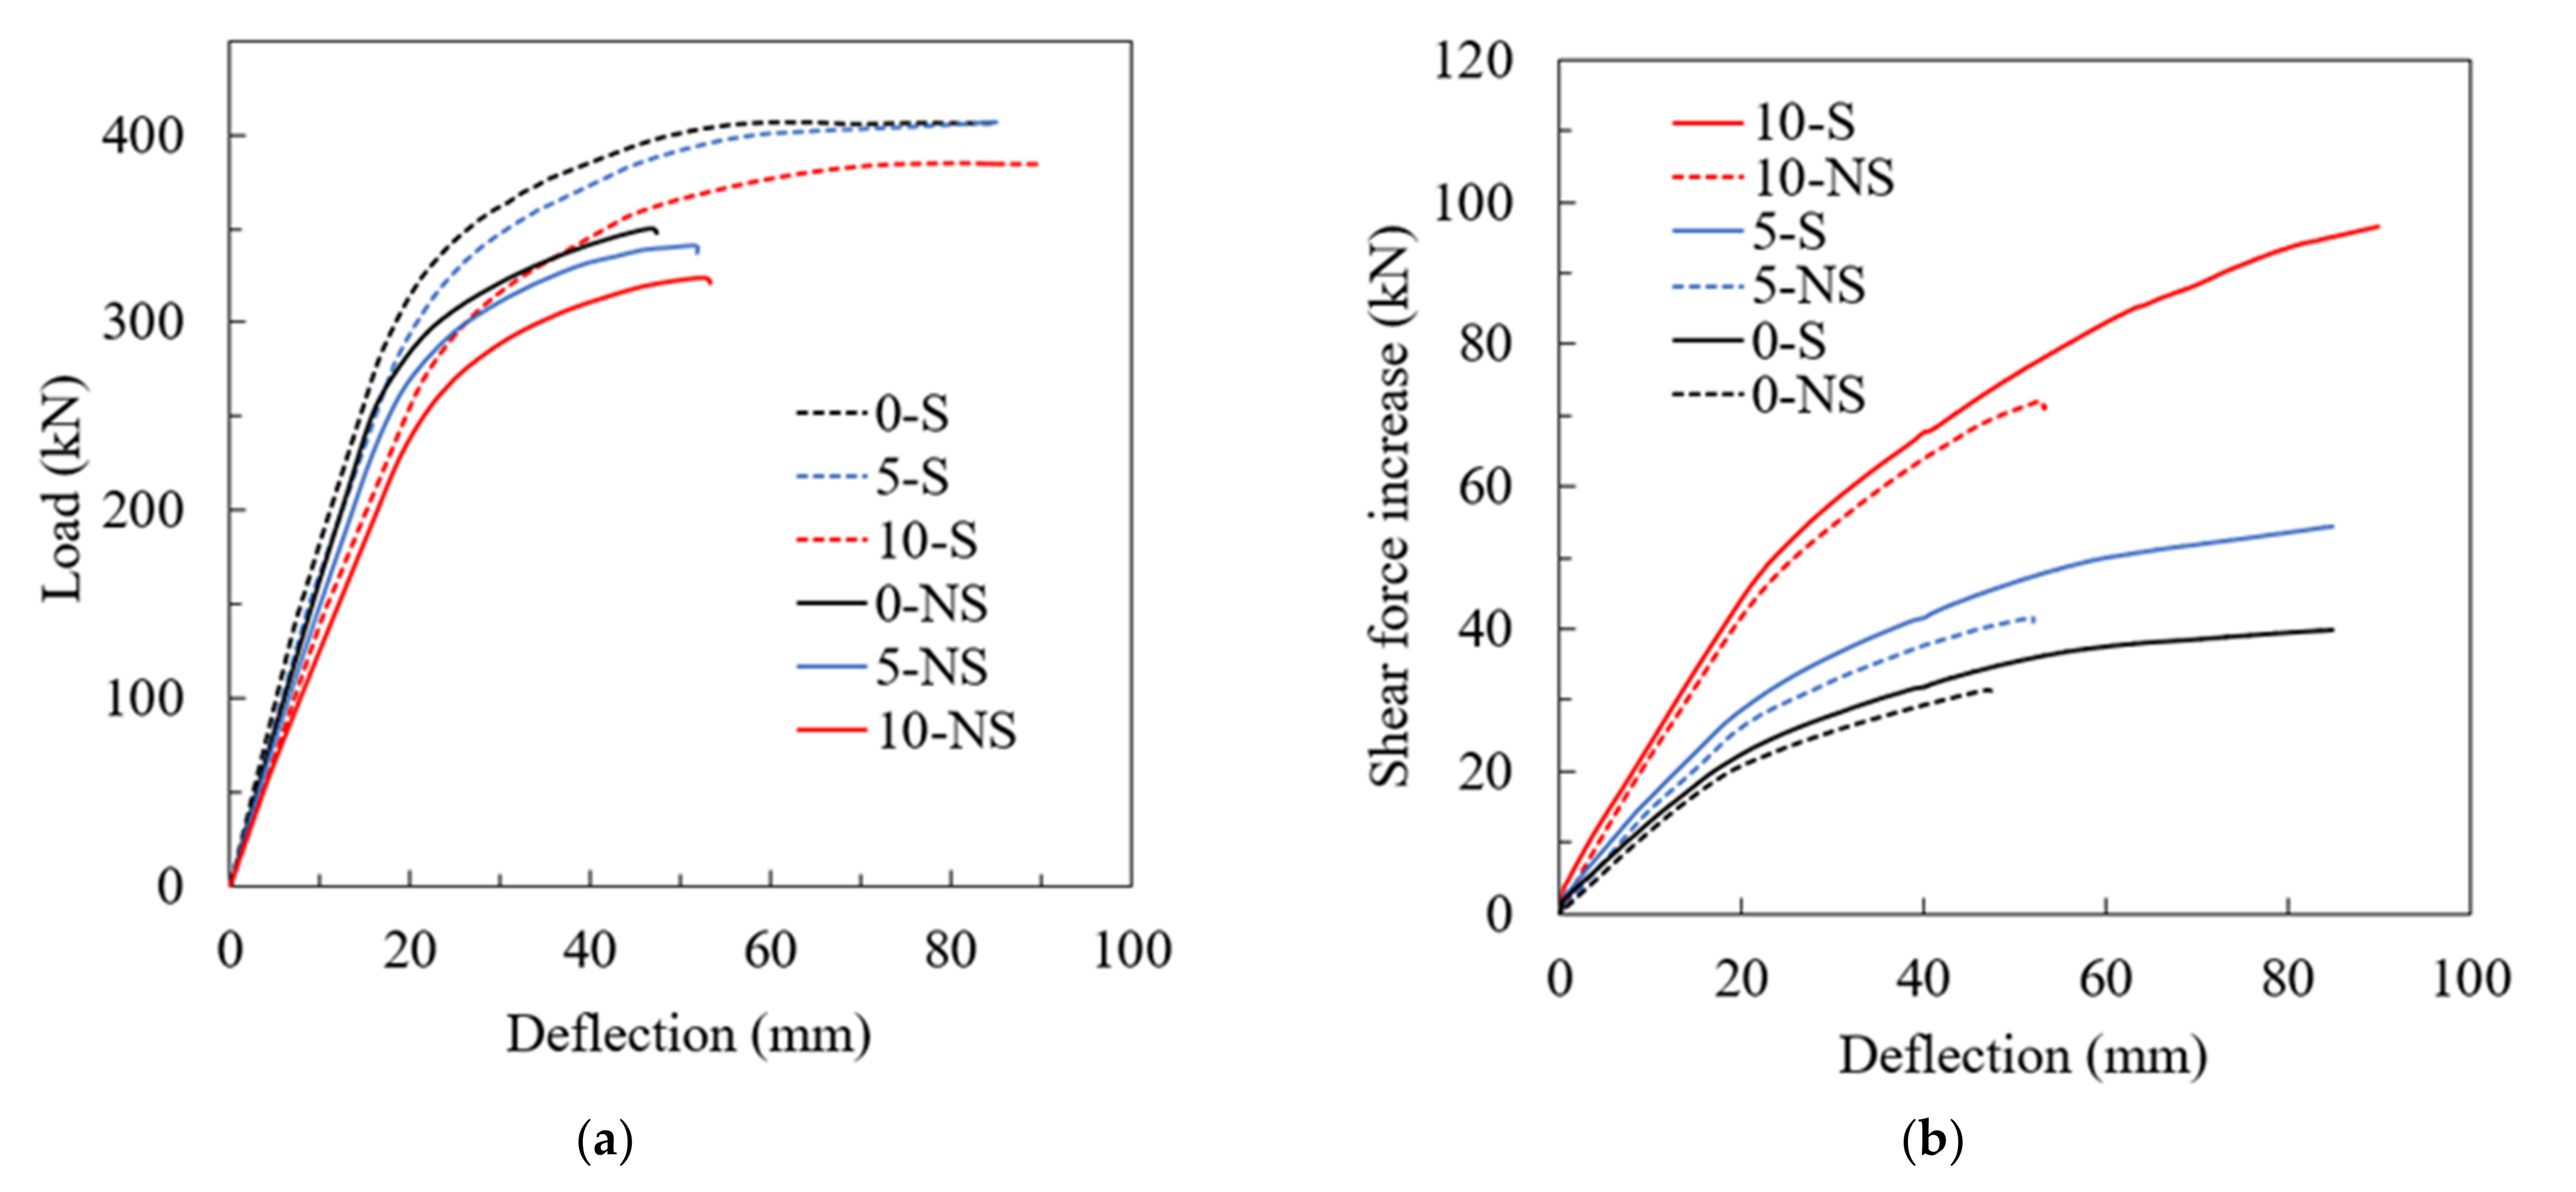
Figure 16a shows the load-deflection curves for the strengthened and non-strengthened samples after steps 0, 5, and 10. The effect of stud removal on the maximum load capacity increased as the number of removed studs increased for both S and NS samples. The stiffness, yield strength, and load capacity of the composite beams decreased as the number of removed studs increased. This could be attributed to the increase in shear force experienced by the remaining studs, as shown in
Figure 16b, which was caused by the loss of composite action.


 ,
, 


