Article

Simulation of Smartphone-Based Public Participation in Earthquake Structural Response Emergency Monitoring Using a Virtual Experiment and AI

1
Faculty of Infrastructure Engineering, School of Civil Engineering, Dalian University of Technology, Dalian 116024, China
2
State Key Laboratory of Coastal and Offshore Engineering, Faculty of Infrastructure Engineering, Dalian University of Technology, Dalian 116024, China
3
School of Innovation and Entrepreneurship, Dalian University of Technology, Dalian 116024, China
4
Faculty of Humanities and Social Sciences, School of Humanities, Dalian University of Technology, Dalian 116024, China
5
Dalian Institute of National Research on Smart Governance of Communities, Dalian University of Technology, Dalian 116024, China
6
Liaoning Provincial Institute of Safety and Science, Shenyang 110004, China
*
Authors to whom correspondence should be addressed.
Buildings 2022, 12(4), 492; https://doi.org/10.3390/buildings12040492
Submission received: 24 March 2022 / Revised: 7 April 2022 / Accepted: 11 April 2022 / Published: 15 April 2022
(This article belongs to the Section Construction Management, and Computers & Digitization)

Abstract

:
Structural health monitoring (SHM) is of great significance for post-earthquake damage assessment. Smartphone-based monitoring techniques provide the possibility to perform crowdsensing for all buildings in urban regions after an earthquake. However, this idea still faces many difficulties and is hard to realize. Fortunately, the development of game engines provides the opportunity for simulating this kind of experiment. The main objective of this study was to use Unity to simulate the whole process when a city is struck by an earthquake that consists of one main shock and one aftershock. During the emergency response, the citizens and the “city brain” in Unity, named Ground Eye, cooperate to finish the task of taking refuge and collecting data for regional damage assessment. Some basic assumptions were made first. Then the city model was established in Unity, and the behaviors of the citizens were directed by the behavior tree artificial intelligence (AI). OpenSees was utilized to determine the monitoring demand and simulate the monitoring results. A GUI was built to exhibit the data during the whole process. The results show that the evacuation and monitoring plan is feasible. The simulation framework presented in this paper can be used in other SHM application scenarios.

1. Introduction

Earthquakes are one of the most destructive natural disasters, and can cause various degrees of damage to buildings. During the main shock, some buildings are seriously damaged and may collapse immediately, while others remain intact. However, some potential damage may exist in these intact buildings that cannot be easily identified [1]. Therefore, it is essential to inspect the buildings and identify any hidden damage.
Structural health monitoring (SHM) plays an important role in building damage detection and localization, in addition to providing information for building condition assessment during emergencies such as earthquakes [2,3]. Currently, structural health monitoring systems are mainly used in specific large structures such as large-scale bridges, long-span structures, and super high-rise buildings. However, structural health monitoring systems cannot be widely applied to general structures due to factors such as high costs and complex arrangements. Furthermore, the previous monitoring method is based on an assessment of individual buildings that are pre-installed with health monitoring systems; however, it is impossible to perform monitoring for all structures in a certain area. Therefore, improving the current structural health monitoring system, and reducing the cost of the operation and maintenance of this monitoring system to allow more people to participate in disaster prevention and mitigation, are important projects that need to be studied in SHM. It is worth noting that not all building condition assessments require professional, high-precision instruments, which creates more possibilities for SHM. That is, ordinary people are encouraged to participate in SHM via smartphones, which provides the possibility to perform large-scale crowdsensing for a large number of buildings in an urban area.
Smartphones, which integrate numerous sensors, provide a solution to this problem due to their popularity [4,5]. The sensing, data storage, data transmission, and data processing are all integrated into a single smartphone. Yu et al. proposed the concept of smartphone-based cloud detection in 2012, and showed that smartphones can be used in a SHM system [6]. Since then, many advances have been made in the application of smartphones in the field of civil engineering.
Initially, smartphones were mainly used to collect acceleration data of structures. For example, Dashti et al. developed an app named iShake in 2011, which applies the smartphone’s built-in accelerometer to acquire ground vibration responses in different areas caused by earthquakes [7]. In 2014, Vittorio et al. used the acceleration sensor and GPS inside the smartphone to obtain the vibration response of vehicles running on a road, and formed an automatic sensing system of the road’s surface quality [8]. Zhao et al. developed Orion-CC mobile software based on the acceleration sensor and gyroscope of a smartphone, and used this software to measure the cable force of the suspenders on the main span of the Dalian Xinghai Bay Bridge [9].
In addition, smartphones have also been applied to measure structural displacement. Zhao et al. developed software called D-Viewer in 2016, which utilizes a smartphone camera to monitor the interlayer displacement response of structures in real-time [10]. Jo et al. took images with a smartphone and performed template matching and matrix processing on the images to achieve multi-point measurement of bridge vibration and displacement [11]. Zhang et al. used a smartphone to collect a dataset, and then developed a low-cost structural multi-point displacement monitoring technique through fully convolutional neural network (FCN) training [12]. Similar to displacement measurement, Li et al. used a smartphone camera to measure the inter-story drift of building structures during earthquakes [13]. Pan et al. used a smartphone camera to collect images of prefabricated speckles on the surface of a structure, and then combined digital image correlation (DIC) technology to achieve the measurement of the in-plane displacement and strain on the surface of the structure [14,15]. Xie et al. designed a measurement method to obtain structural surface strain based on a smartphone camera and microscope [16].
For crack measurement, Oraczewski et al. applied nonlinear acoustic methods to an Android-based smartphone for crack detection in aluminum plates [17]. Wang et al. developed a smartphone-based damage inspection system for brick masonry buildings using the Fast R-CNN method, and realized real-time detection of surface damage in brick masonry buildings [18]. Ruggieri et al. presented a machine-learning based framework for vulnerability analysis of existing buildings, in which structural information is extracted through a database of photos automatically downloaded, using a transfer learning technique [19].
There have been many recent studies on the application of smartphones to construction management [20,21,22]. Han et al. built a mini smartphone monitoring system and used a smartphone gyroscope to monitor the tilt angle of the platform of the main span of the Dalian Xinghai Bay Bridge during construction hoisting, and synchronized the results back to the hoisting crew to guarantee construction safety [23]. Dzeng et al. applied smartphone acceleration sensors to monitor the falls and fall signs of workers within a construction site [24].
However, the idea of mobilizing the wider population to use smartphones for post-earthquake structural health monitoring still faces many difficulties, which make it difficult to be implemented in practical scenarios. Possible difficulties are discussed in the following. The first aspect is the installation of the mobile phones. Secure installation and a stable power supply are hard to maintain during the monitoring process. The second aspect is the mobilization of the wider population. Without a proper incentive mechanism, it is hard to popularize a crowd monitoring app. It is also difficult to mobilize crowd participants so that they can follow the command from the “city brain” after an earthquake and go to a specific location for post-earthquake detection, or to implement monitoring arrangements before aftershocks. Furthermore, when citizens go to the inspection sites, they may encounter possible danger caused by post-earthquake structural damage. The third aspect is the development of the city brain. In order to efficiently mobilize the general public to monitor or evacuate, a city brain is necessary that can predict the damage of structures in an area through simplified model simulation as soon as possible after the earthquake. The information related to damaged buildings, in addition to information about the main shock and aftershocks, and routes to shelters, will be transmitted to people through smartphones. After the earthquake, the citizens will follow the instructions from the city brain to finish the monitoring tasks. To date, this kind of city brain has not been implemented. The final aspect relates to the experimental difficulties. In order to verify the theory, a real-world earthquake is necessary. The large scale and catastrophic consequence of such experiment make it nearly impossible to be carried out in the real world.
Fortunately, the recent development of several powerful simulation platforms, such as game engines, provides an opportunity to simulate experiments that cannot be easily performed in reality, in a virtual space. For example, Unity is the world’s leading real-time 3D interactive content creation-and-operation platform. It has superior cross-platform performance and is a comprehensive development tool. BMW Group, the world’s top car manufacturer, has introduced Unity into the development of assistance and scenario testing of autonomous driving, where nearly 95% of the test mileage is completed by vehicles in a virtual world [25]. Skanska, the world’s fifth largest construction company, uses Unity-based virtual reality (VR) technology to train construction workers with the goal of reducing accidents and creating safer construction sites [26]. VirtaMed is a developer of mixed reality simulators for medical education in Switzerland. It leverages Unity’s digital twin technology to recreate complex surgical training scenarios, and reduces the risks associated with traditional surgical training [27]. Unreal Engine is another game engine that is globally popular. For the past two decades, Unreal Engine has supported development in cutting-edge real-time 3D technologies, including gaming, film, television, visualization, and computer graphics. HTX Labs participates in the U.S. Air Force’s Next Generation Pilot Training (PTN) program, providing Unreal Engine-based VR Emergency Procedures (EP) training for student pilots. Flight instructors can set up emergency situations in VR and use it to inspect and train new pilots. In reality, most of these situations are difficult or impossible to demonstrate without putting the trainee at risk [28]. Carolina Biological Supply Company has realistically recreated an open-world setting of a biology lab with Unreal Engine. This simulator provides an environment second only to a fully equipped laboratory, allowing students to perform experiments without leaving home. Experiments may succeed or fail, but in a virtual environment, students always have the opportunity to retry [29]. These examples provide evidence for the feasibility of using game engines for simulating smartphone-based public participation in earthquake response emergency monitoring.
In summary, the main objective of this study was to use a game engine such as Unity to simulate the whole process when a city is struck by an earthquake consisting of one main shock and one aftershock. During the emergency response, the citizens and the city brain, named Ground Eye in this paper, cooperate to implement the task of taking refuge and collecting data for regional damage assessment. The relevant steps are listed as follows:
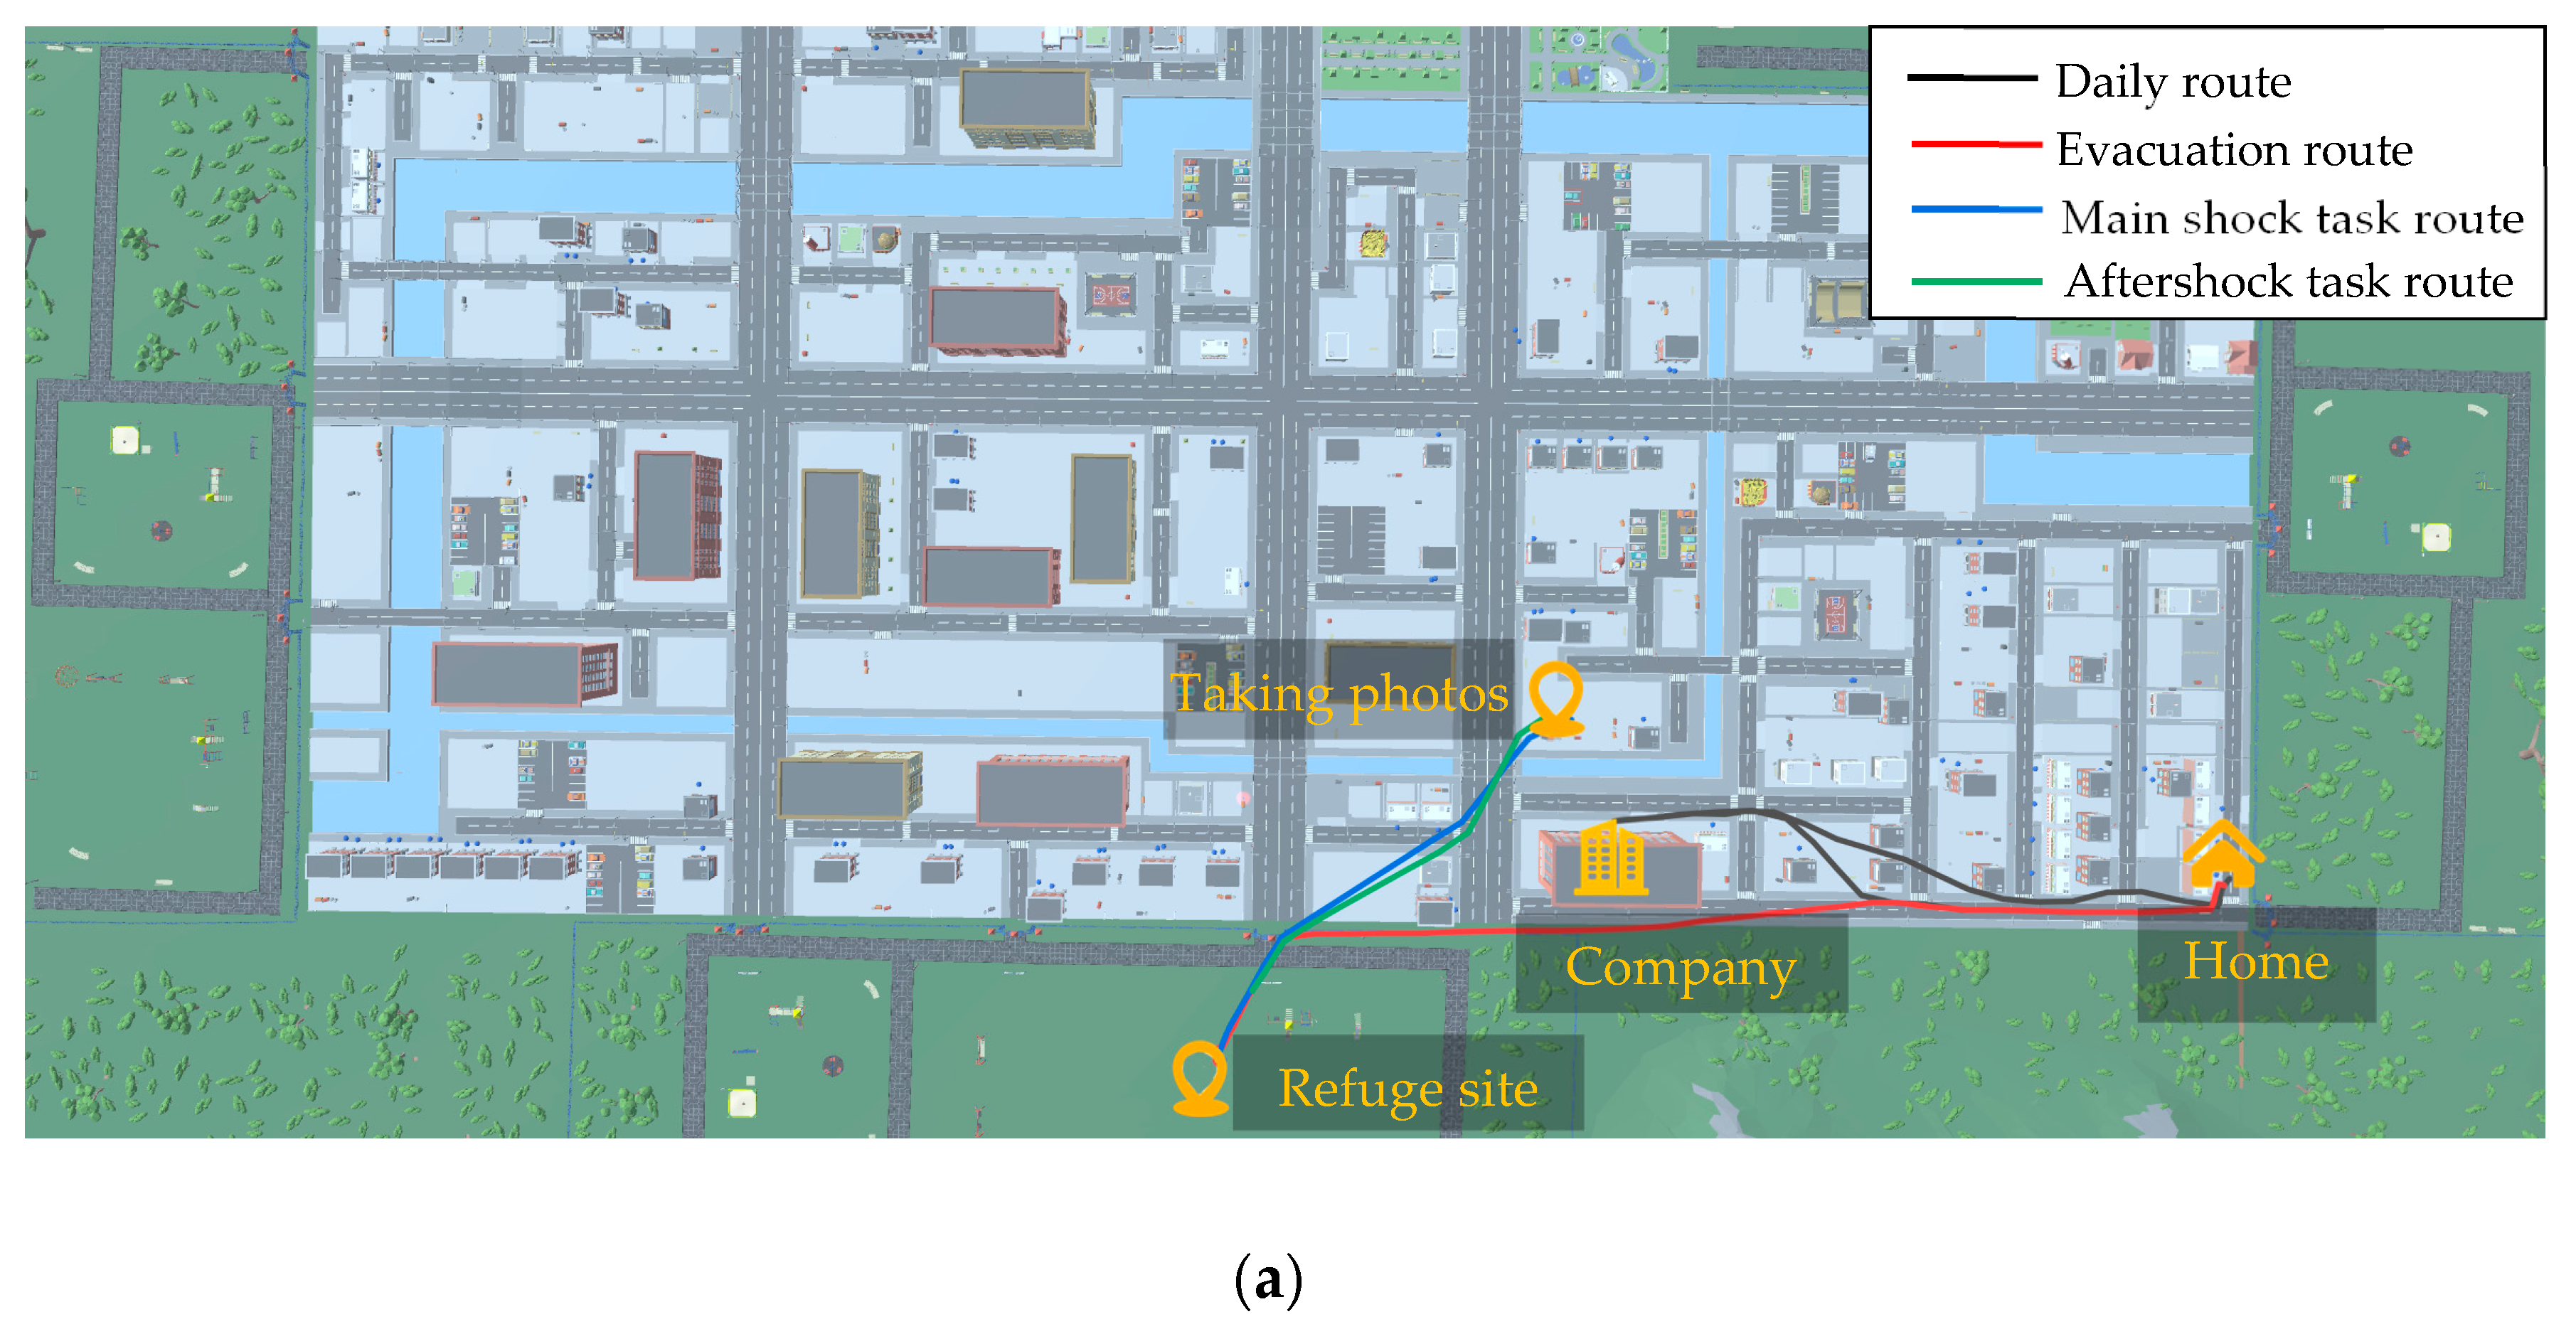
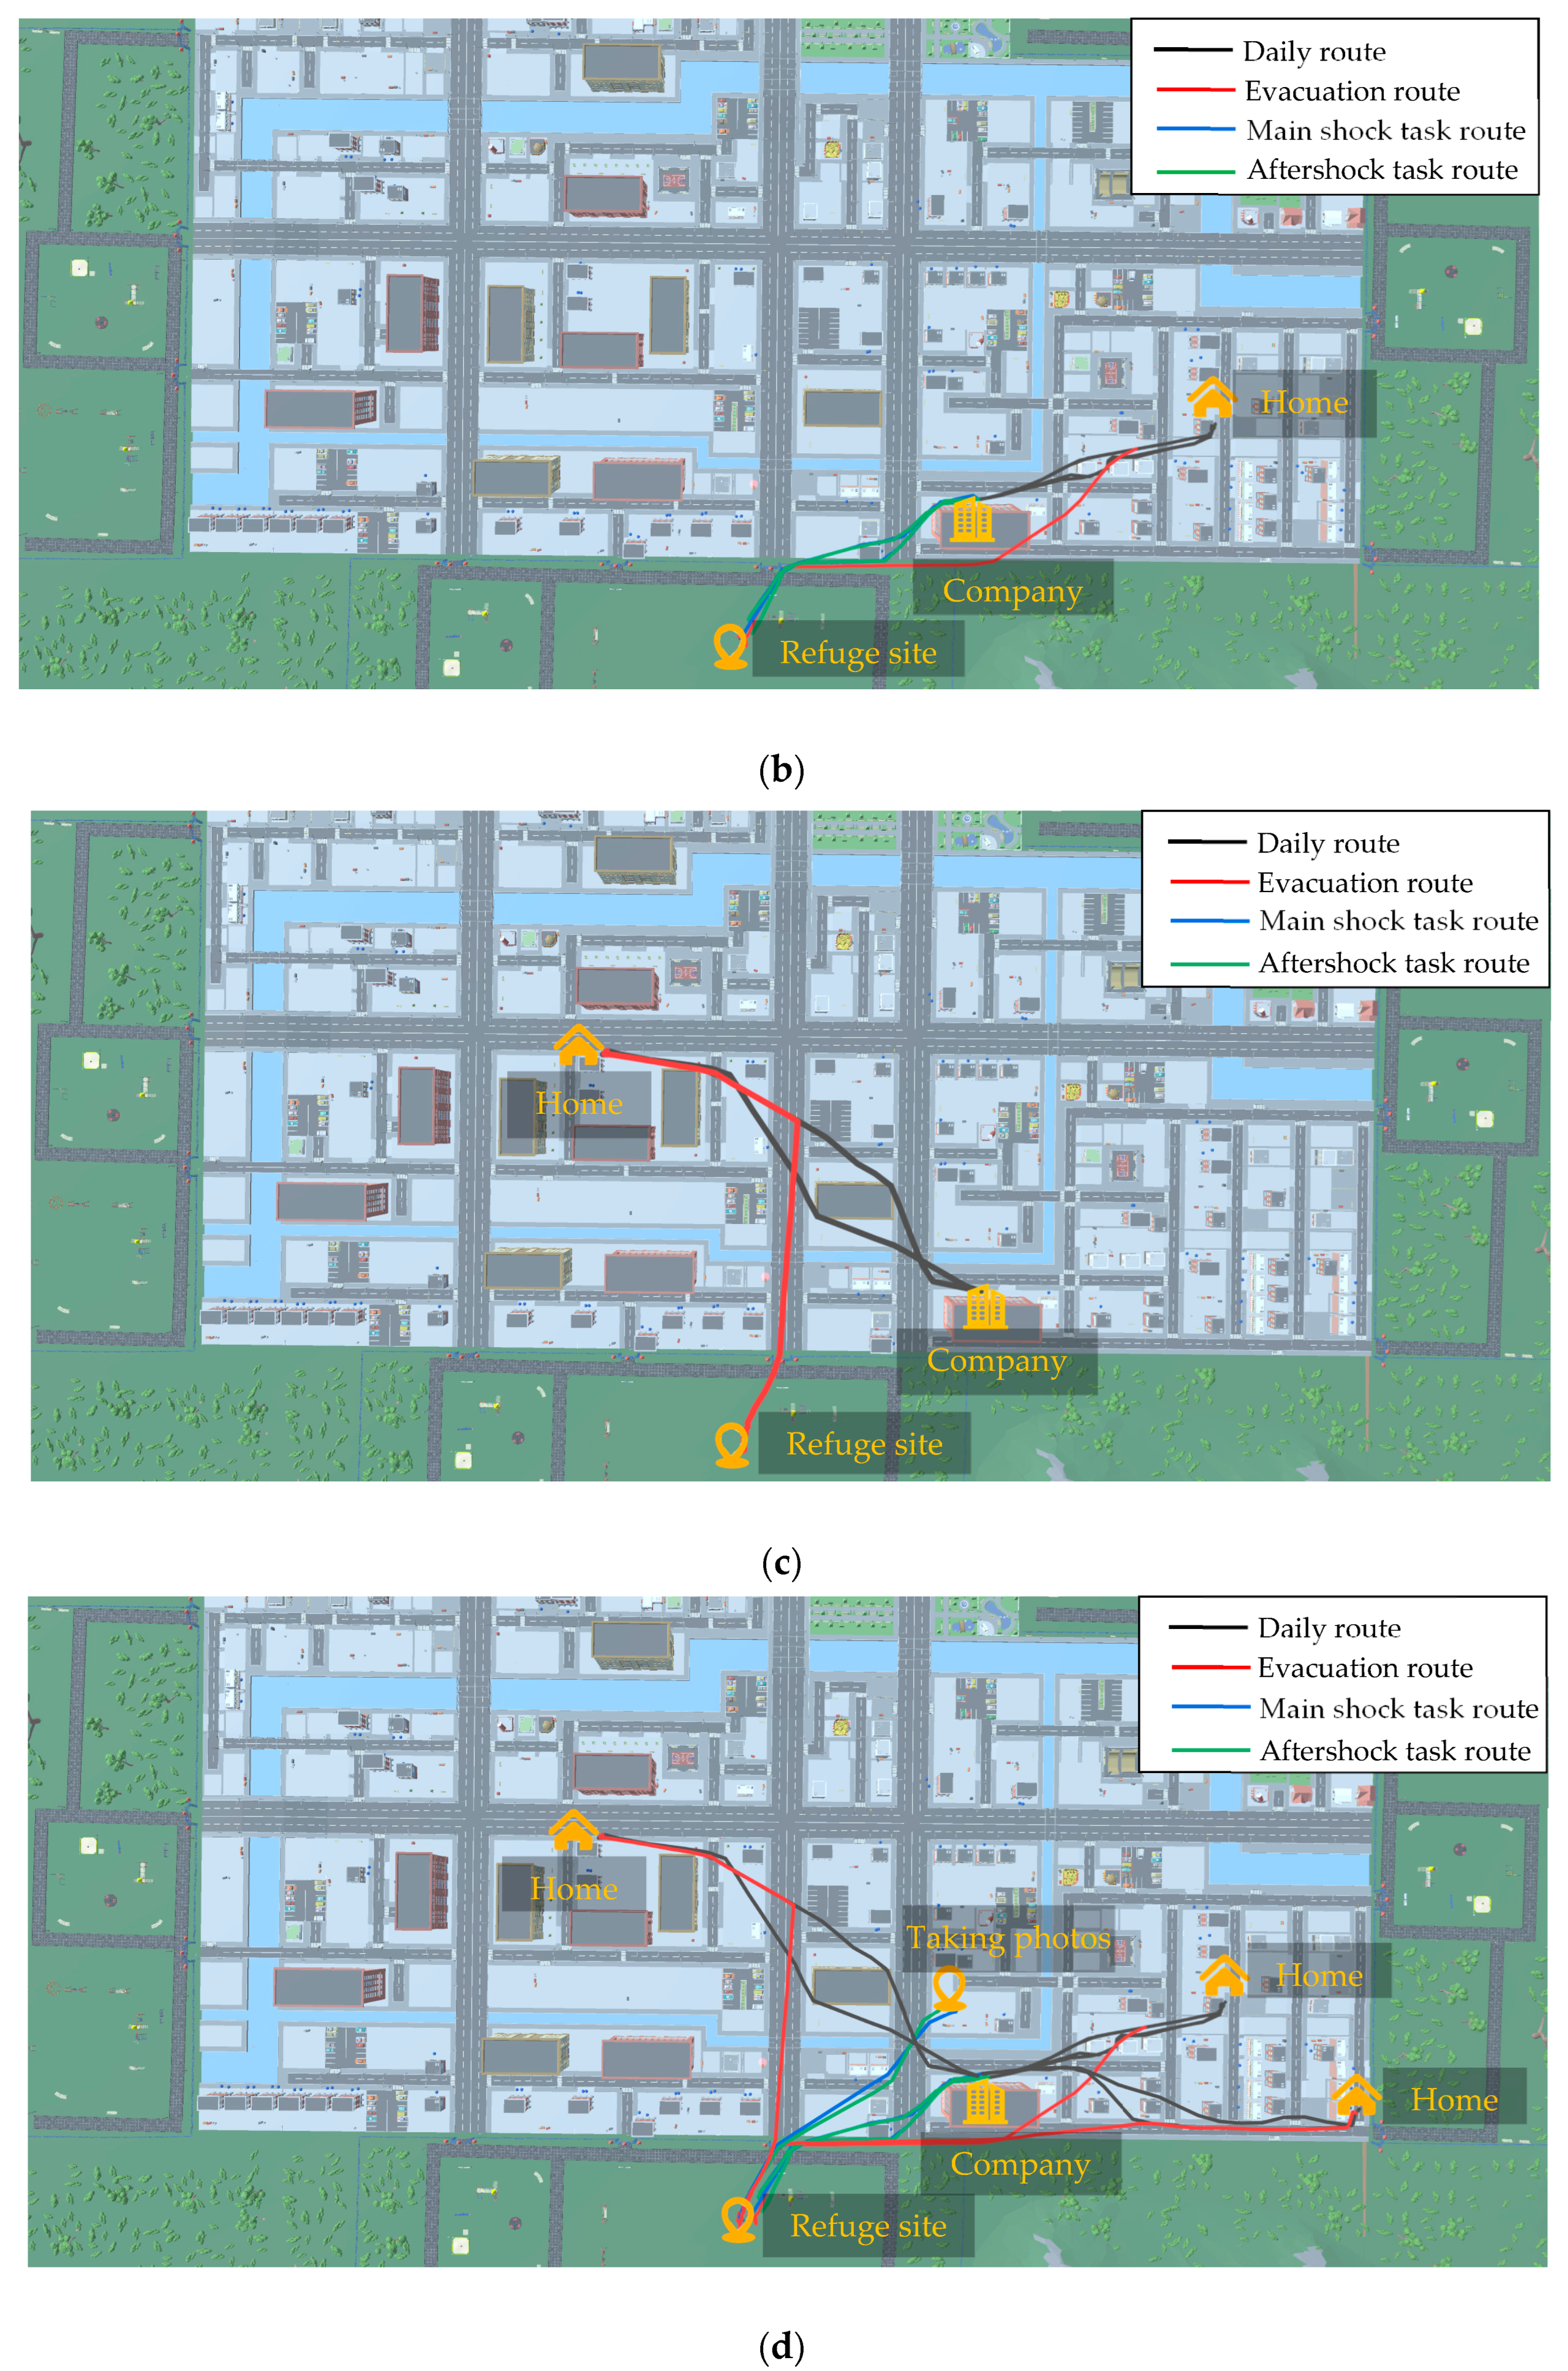
  • Before the earthquake occurs, citizens act in a cycle of going to work and returning home.
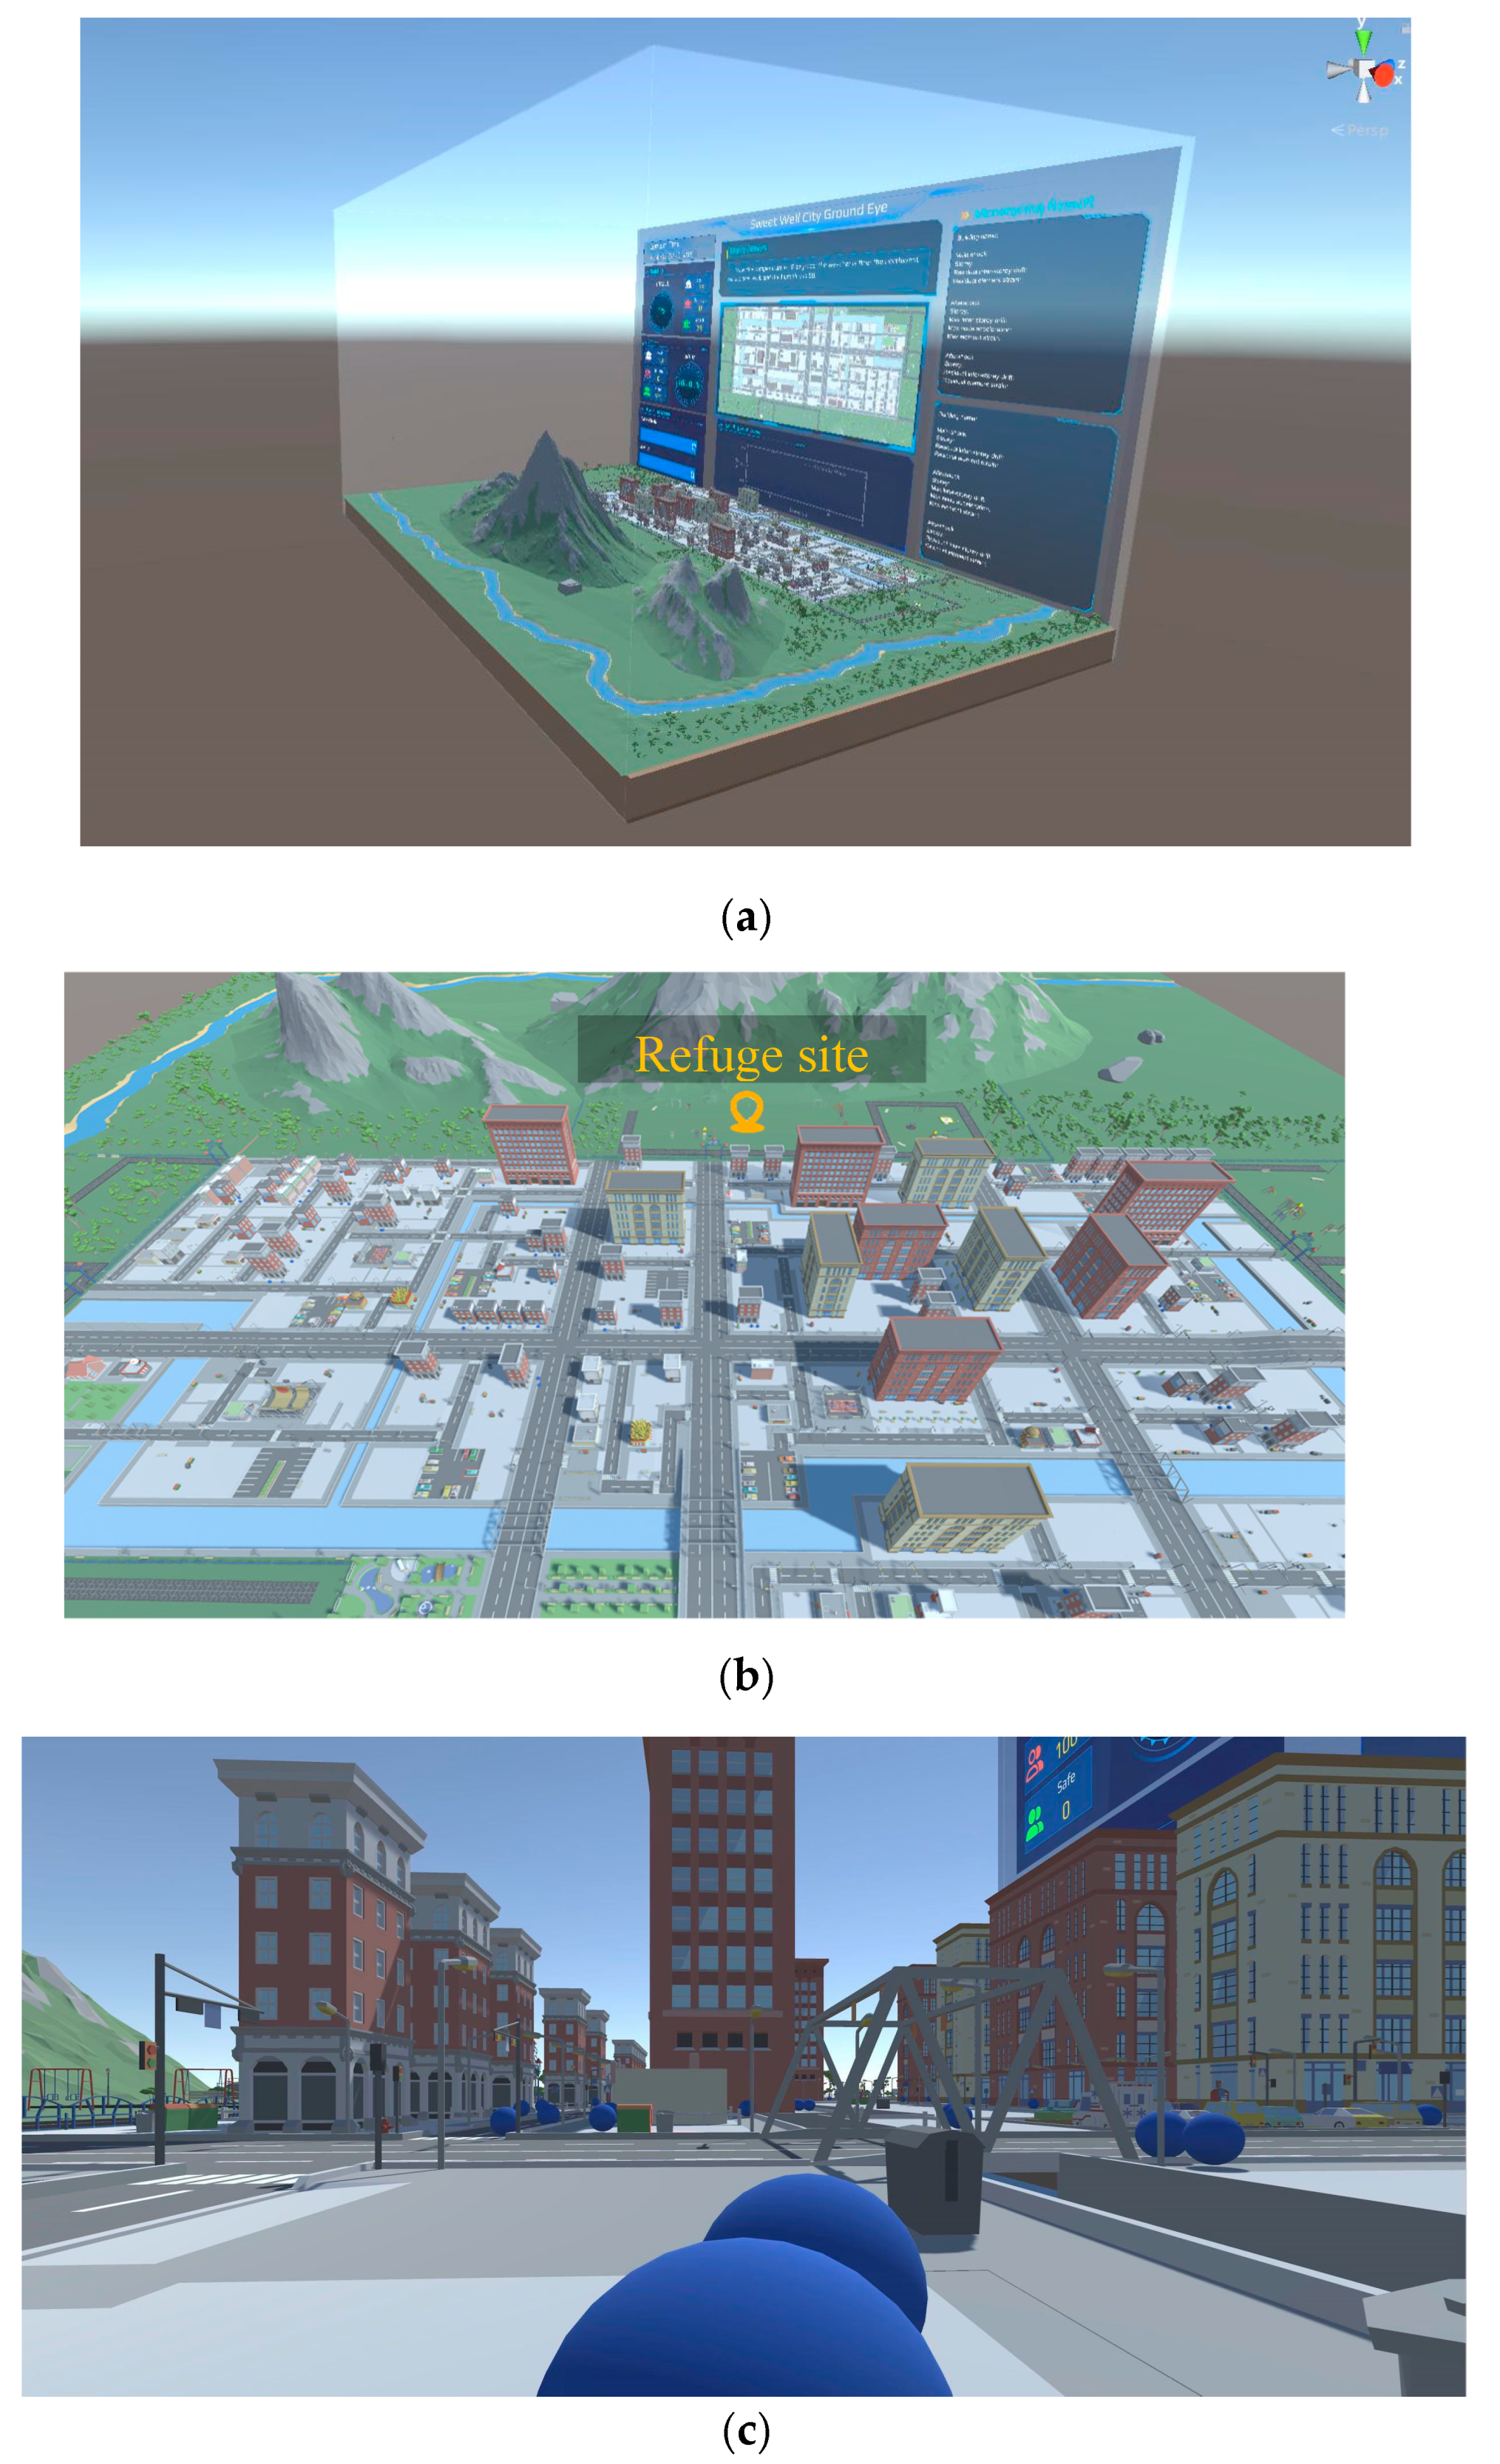
  • As soon as the main shock occurs, the Ground Eye sends the routes to the refuge site to all citizens via smartphones, and citizens start moving to these sites.
  • After the main shock ends, the Ground Eye calculates the maximum inter-story drift of all the buildings in that region via simplified models. Buildings with a maximum inter-story drift exceeding the code limit value are considered to be damaged, and require damage detection.
  • The Ground Eye determines the task assignment for the citizens, and the locations of the damaged buildings are transmitted to the citizens’ smartphones. Then citizens locate the damaged buildings and perform their tasks, such as taking photos and installing the smartphones for monitoring. After finishing their job, they return to the refuge site, with the monitoring smartphones left in the damaged buildings. The residual deformation data is sent back to the Ground Eye.
  • During the aftershock, the structural response time-history data collected by the in-site smartphones are sent back to the Ground Eye, while all the citizens remain in the refuge site.
  • After the aftershock, the steps similar to those after the main shock are carried out, except the step of leaving the smartphones in the buildings for real-time monitoring. The Ground Eye analyzes all the data and conducts regional damage assessment.
This paper presents the following key contributions:
  • The idea that citizens can participate in earthquake response emergency monitoring via smartphones is presented, making it possible for large-scale monitoring and damage assessment of buildings at a city scale.
  • The difficulty of realizing smartphone-based public participation in earthquake response emergency monitoring is circumvented via the virtual experiments, and further research can be conducted in advance.
  • The simplified behavior models of citizens and the city brain are established, and a preliminary discussion of the information transmission between citizens and the city brain is presented. The whole process of taking refuge and monitoring is verified in a Unity scene. The simulation framework presented in this paper can be used in other SHM application scenarios using smartphones.

2. Materials and Methods

2.1. Basic Assumptions

Before further discussion, some basic assumptions are established, as follows. The goal of these assumptions is to simplify the simulation process.
  • About the site: The rock layers under the city are continuous, uniform, and isotropic; the ground motion inputs at the bottom of all buildings are the same.
  • About the buildings: The buildings will not collapse, so that citizens have no difficulty going into the buildings for monitoring, and the city roads will not be blocked by collapsed buildings.
  • About the Ground Eye: A powerful city brain, Ground Eye, is already established in this city; it can predict which buildings may be damaged by calculation via simplified models. The data transmission between the citizens’ smartphones and the Ground Eye is in real-time.
  • About citizen behavior: Citizens have access to the Ground Eye during the whole process and always follow its commands; the citizens will not be placed in danger during monitoring.
  • About the time when the aftershock occurs: The interval between the main shock and the aftershock is enough for the citizens to finish their tasks and return to the refuge site.
  • About the monitoring techniques of smartphones: There is no difficulty in collecting all the damage parameters; the reference data for residual deformation measurement are already acquired before the main shock.
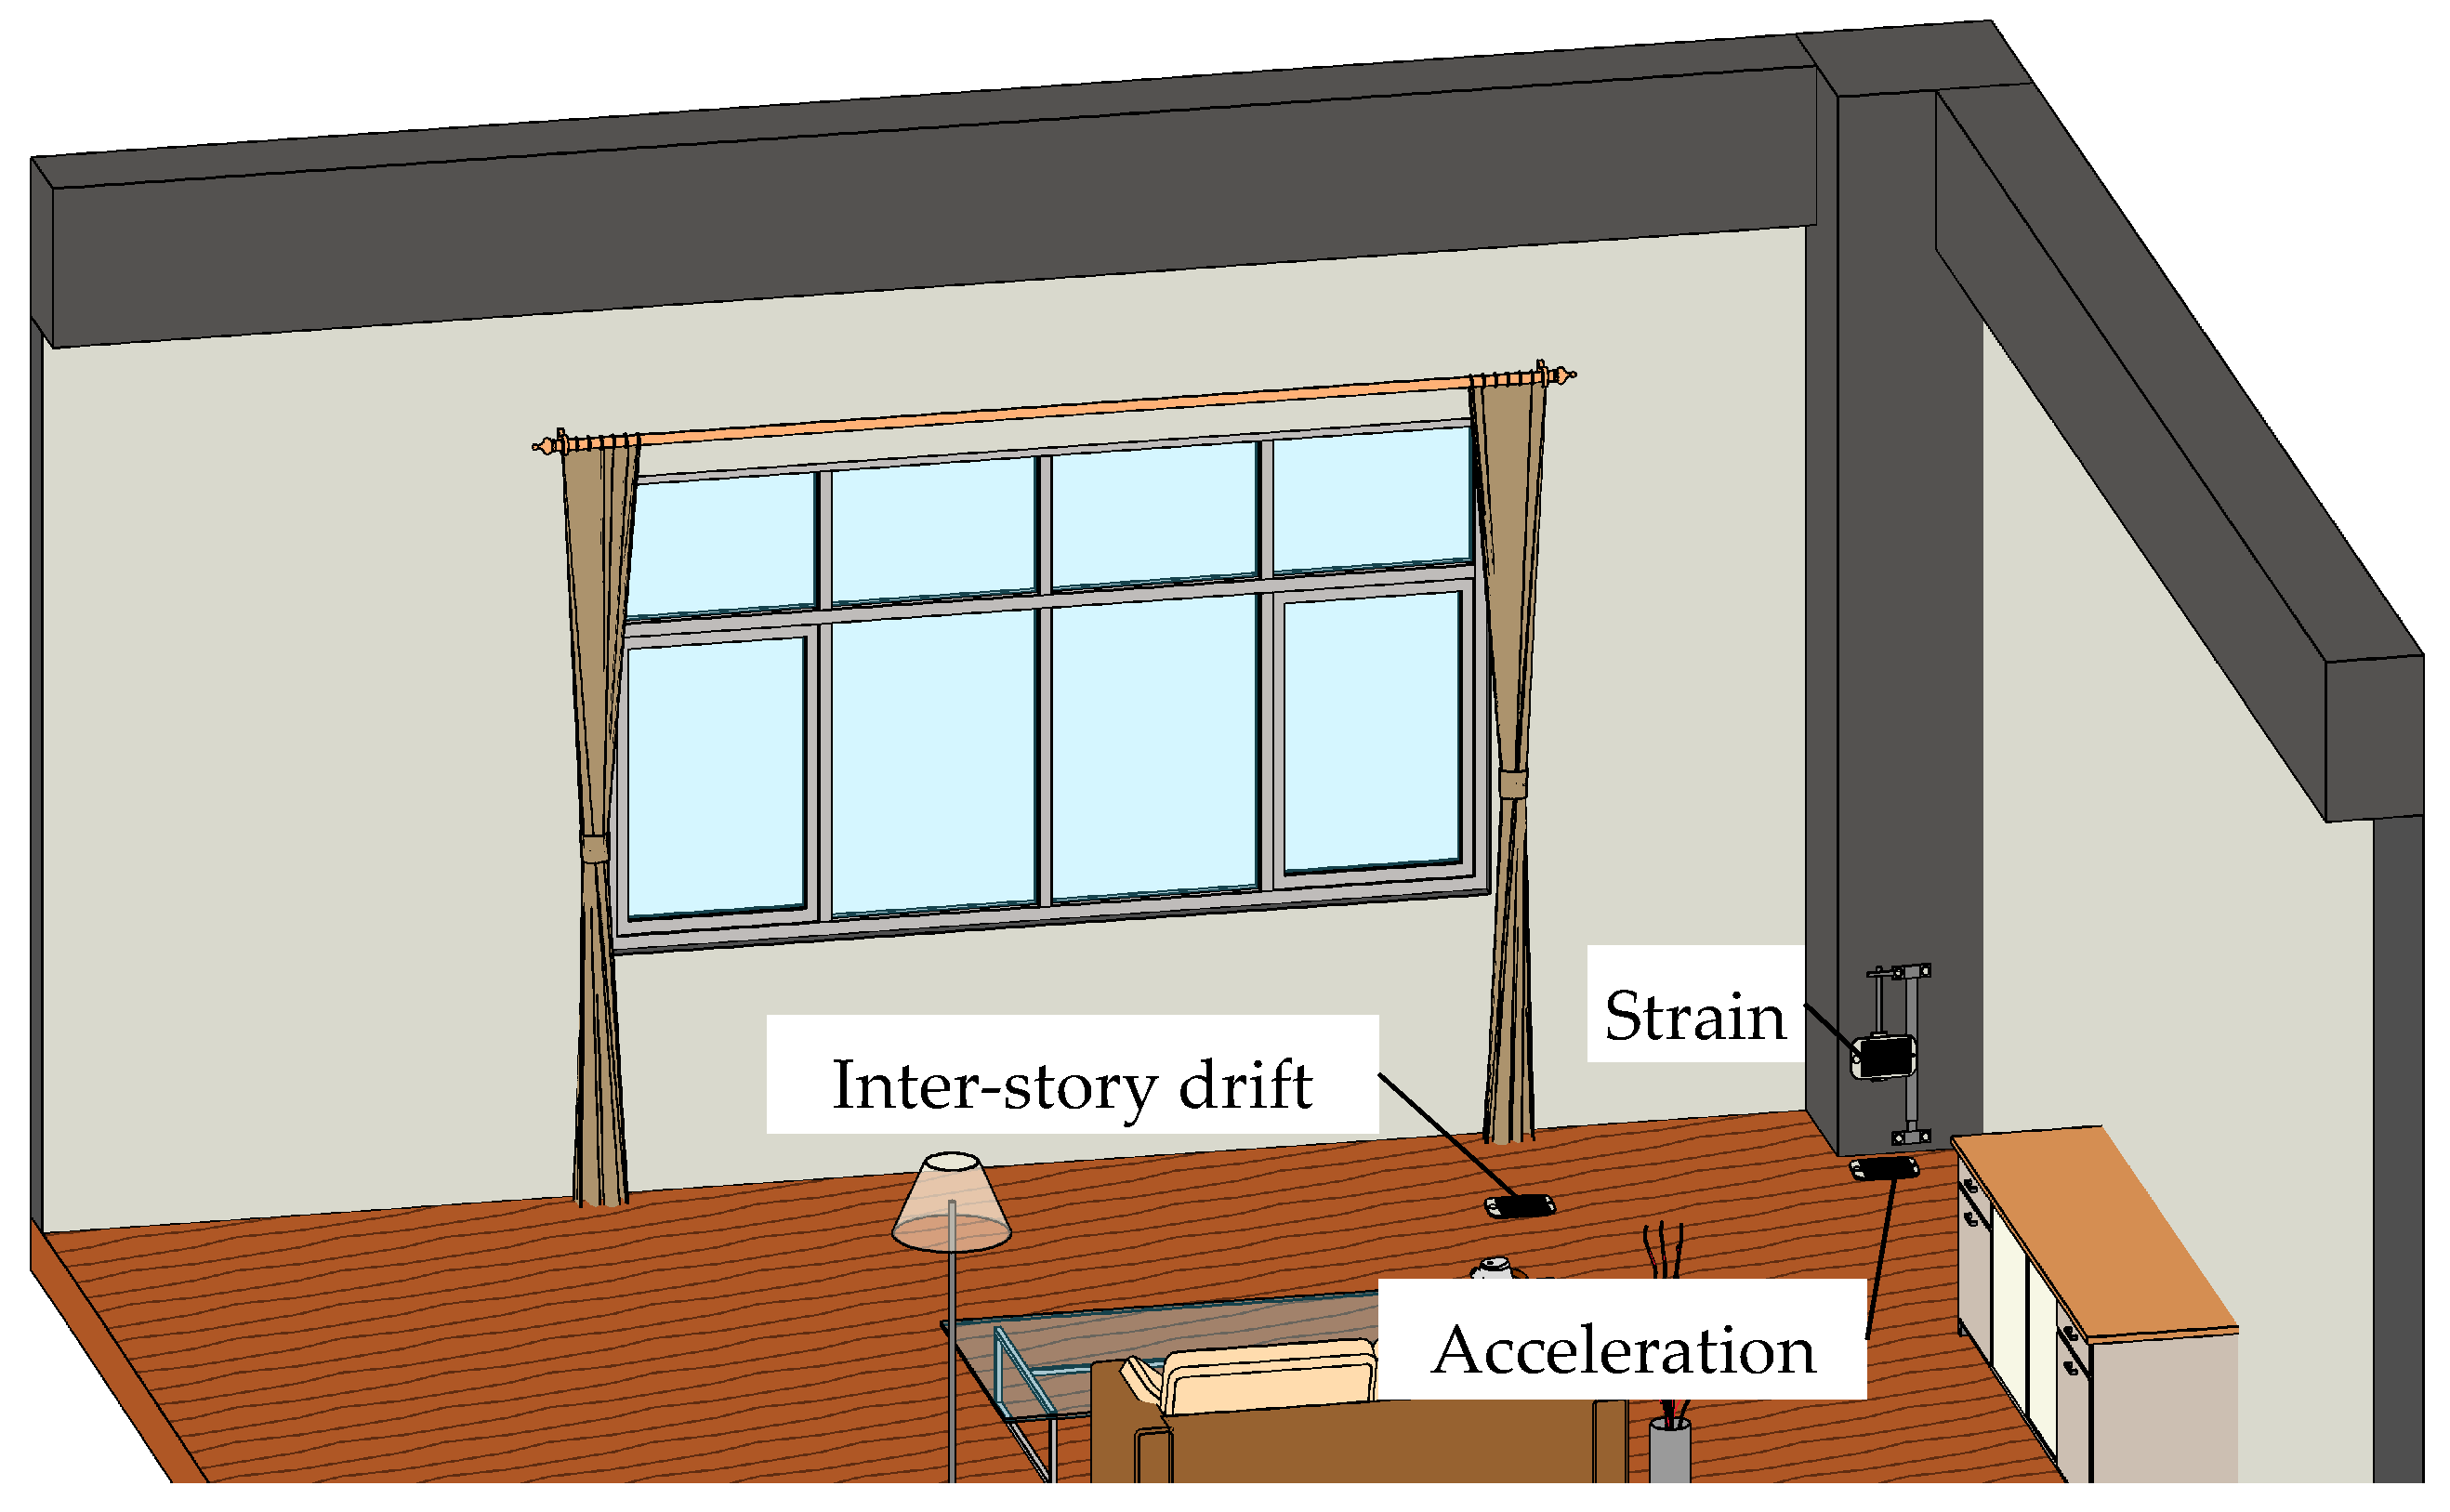
  • About the arrangement of smartphones in the damaged structure: Only the floor with the largest maximum inter-story drift during the main shock is chosen for the installation of the smartphones. Three smartphones are necessary for monitoring this floor: one for node acceleration, one for inter-story drift, and one for element strain; this means that three citizens are enough to handle the monitoring task of a single damaged building. One column on the corner of that floor is selected to install the smartphones. The smartphone for acceleration measurement is installed on the slab near the bottom of this column. The smartphone for strain measurement is installed on the surface that is perpendicular to the earthquake propagation direction, and is near the bottom of this column. This is because, among the common destruction forms of columns during an earthquake, with the exception of shear destruction, which should be avoided in the design, the concrete cover at the two ends of the column usually cracks first, as shown in Figure 1.

2.2. The Response Parameters That Smartphones can Capture

In this research, three types of structural response parameters were considered: acceleration, strain, and inter-story drift. The monitoring techniques using smartphones are briefly introduced. In addition, taking photos is also a part of the inspection process because the photos can reflect the macroscopic condition of the structure surface. By comparing the photos taken before the main shock, between the main shock and the aftershock, and after the aftershock, the variation in macroscopic damage is shown.

2.2.1. Acceleration

The acceleration is acquired via the phone’s built-in accelerometer. The monitoring process starts from fixing the smartphone to the structure to be measured, and then the phone’s built-in accelerometer is called by the program to acquire acceleration information in three axes (X, Y, Z). The collected data is stored on the mobile phone or uploaded to the server. In Unity simulation, citizens are supposed to install the smartphones on the damaged structure between the main shock and the aftershock in order to acquire node acceleration time-history data. The sampling rate is 100 Hz.

2.2.2. Strain

Strain is obtained using a smartphone and a new piston-type Microscopic Image Strain Sensor (MISS) [16]. The MISS sensor is fixed to the surface of the structure, and the sensor’s piston-like transmission mechanism can transmit the strain information to changes in images captured by the smartphone camera. Then, the feature point matching algorithm is used to obtain the surface strain parameters of the structure. In the Unity simulation, citizens are supposed to install the smartphones on the damaged structure between the main shock and the aftershock in order to obtain element strain time-history data, and to measure residual strains after the main shock and the aftershock. The data recording rate is related to the frame rate of the smartphone camera, which can be 30 frames/s or 60 frames/s.

2.2.3. Inter-Story Drift

Inter-story drift: The inter-story drift is measured using the front camera of the smartphone [13]. The smartphone needs to be installed on the floor during real-time data acquisition, and the smartphone’s front camera is then used to take photos or videos of the ceiling. In the image captured by the smartphone, the already existing markers on the ceiling (e.g., fluorescent lights) are used as feature recognition objects. The actual inter-story drift parameter of the structure is the pixel displacement of the feature points multiplied by the calibrated magnification factor. In the Unity simulation, citizens are supposed to install the smartphones on the damaged structure between the main shock and the aftershock in order to obtain inter-story drift time-history data, in addition to measuring residual inter-story drift after the main shock and the aftershock. The data recording rate is related to the frame rate of the smartphone camera, which is 30 frames/s.

2.3. Establishing the Scene in Unity

The simulation platform used in this research is Unity, which is a real-time 3D interactive content creation and operation platform. Using the abundant resources downloaded from the Unity Asset Store and scene building modules in Unity Editor, users can easily establish different types of complex scenes. Furthermore, Unity supports using multiple programming languages, including Java, C#, and Boo, to write scripts. Script development has great significance in the Unity simulation, making it possible for the game objects in the scene to act as they are designed to do.

2.3.1. Overall Information
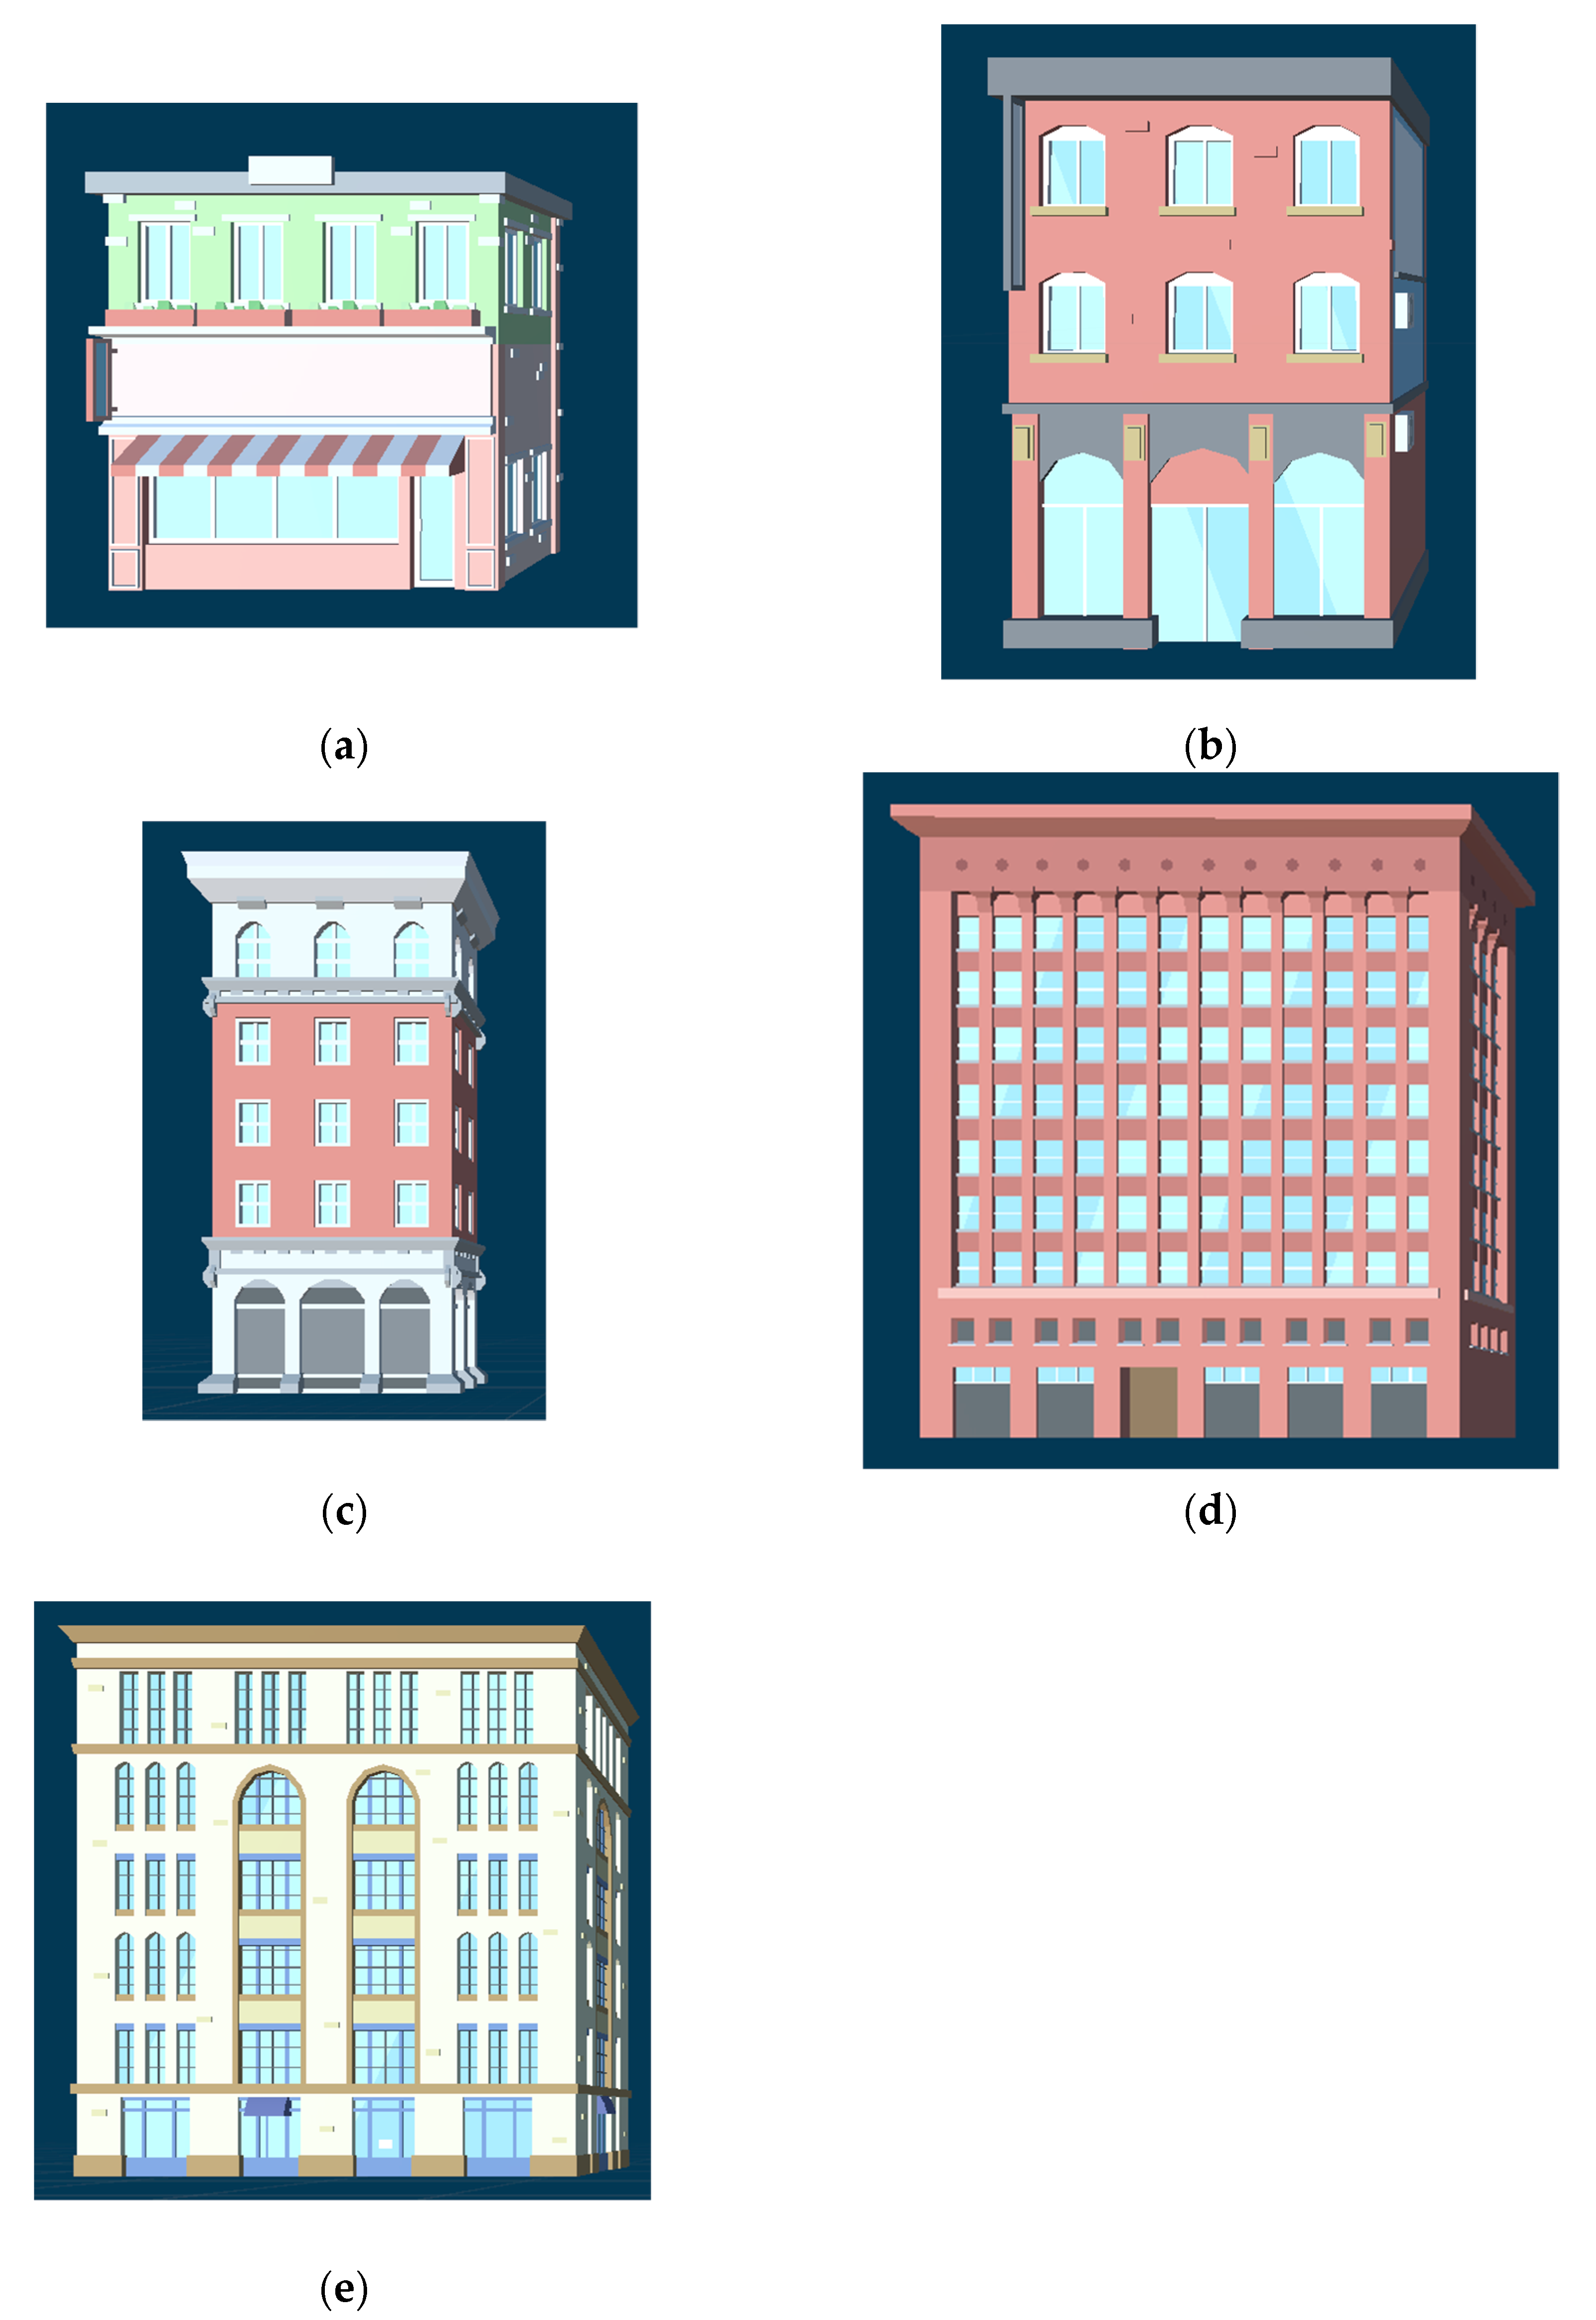
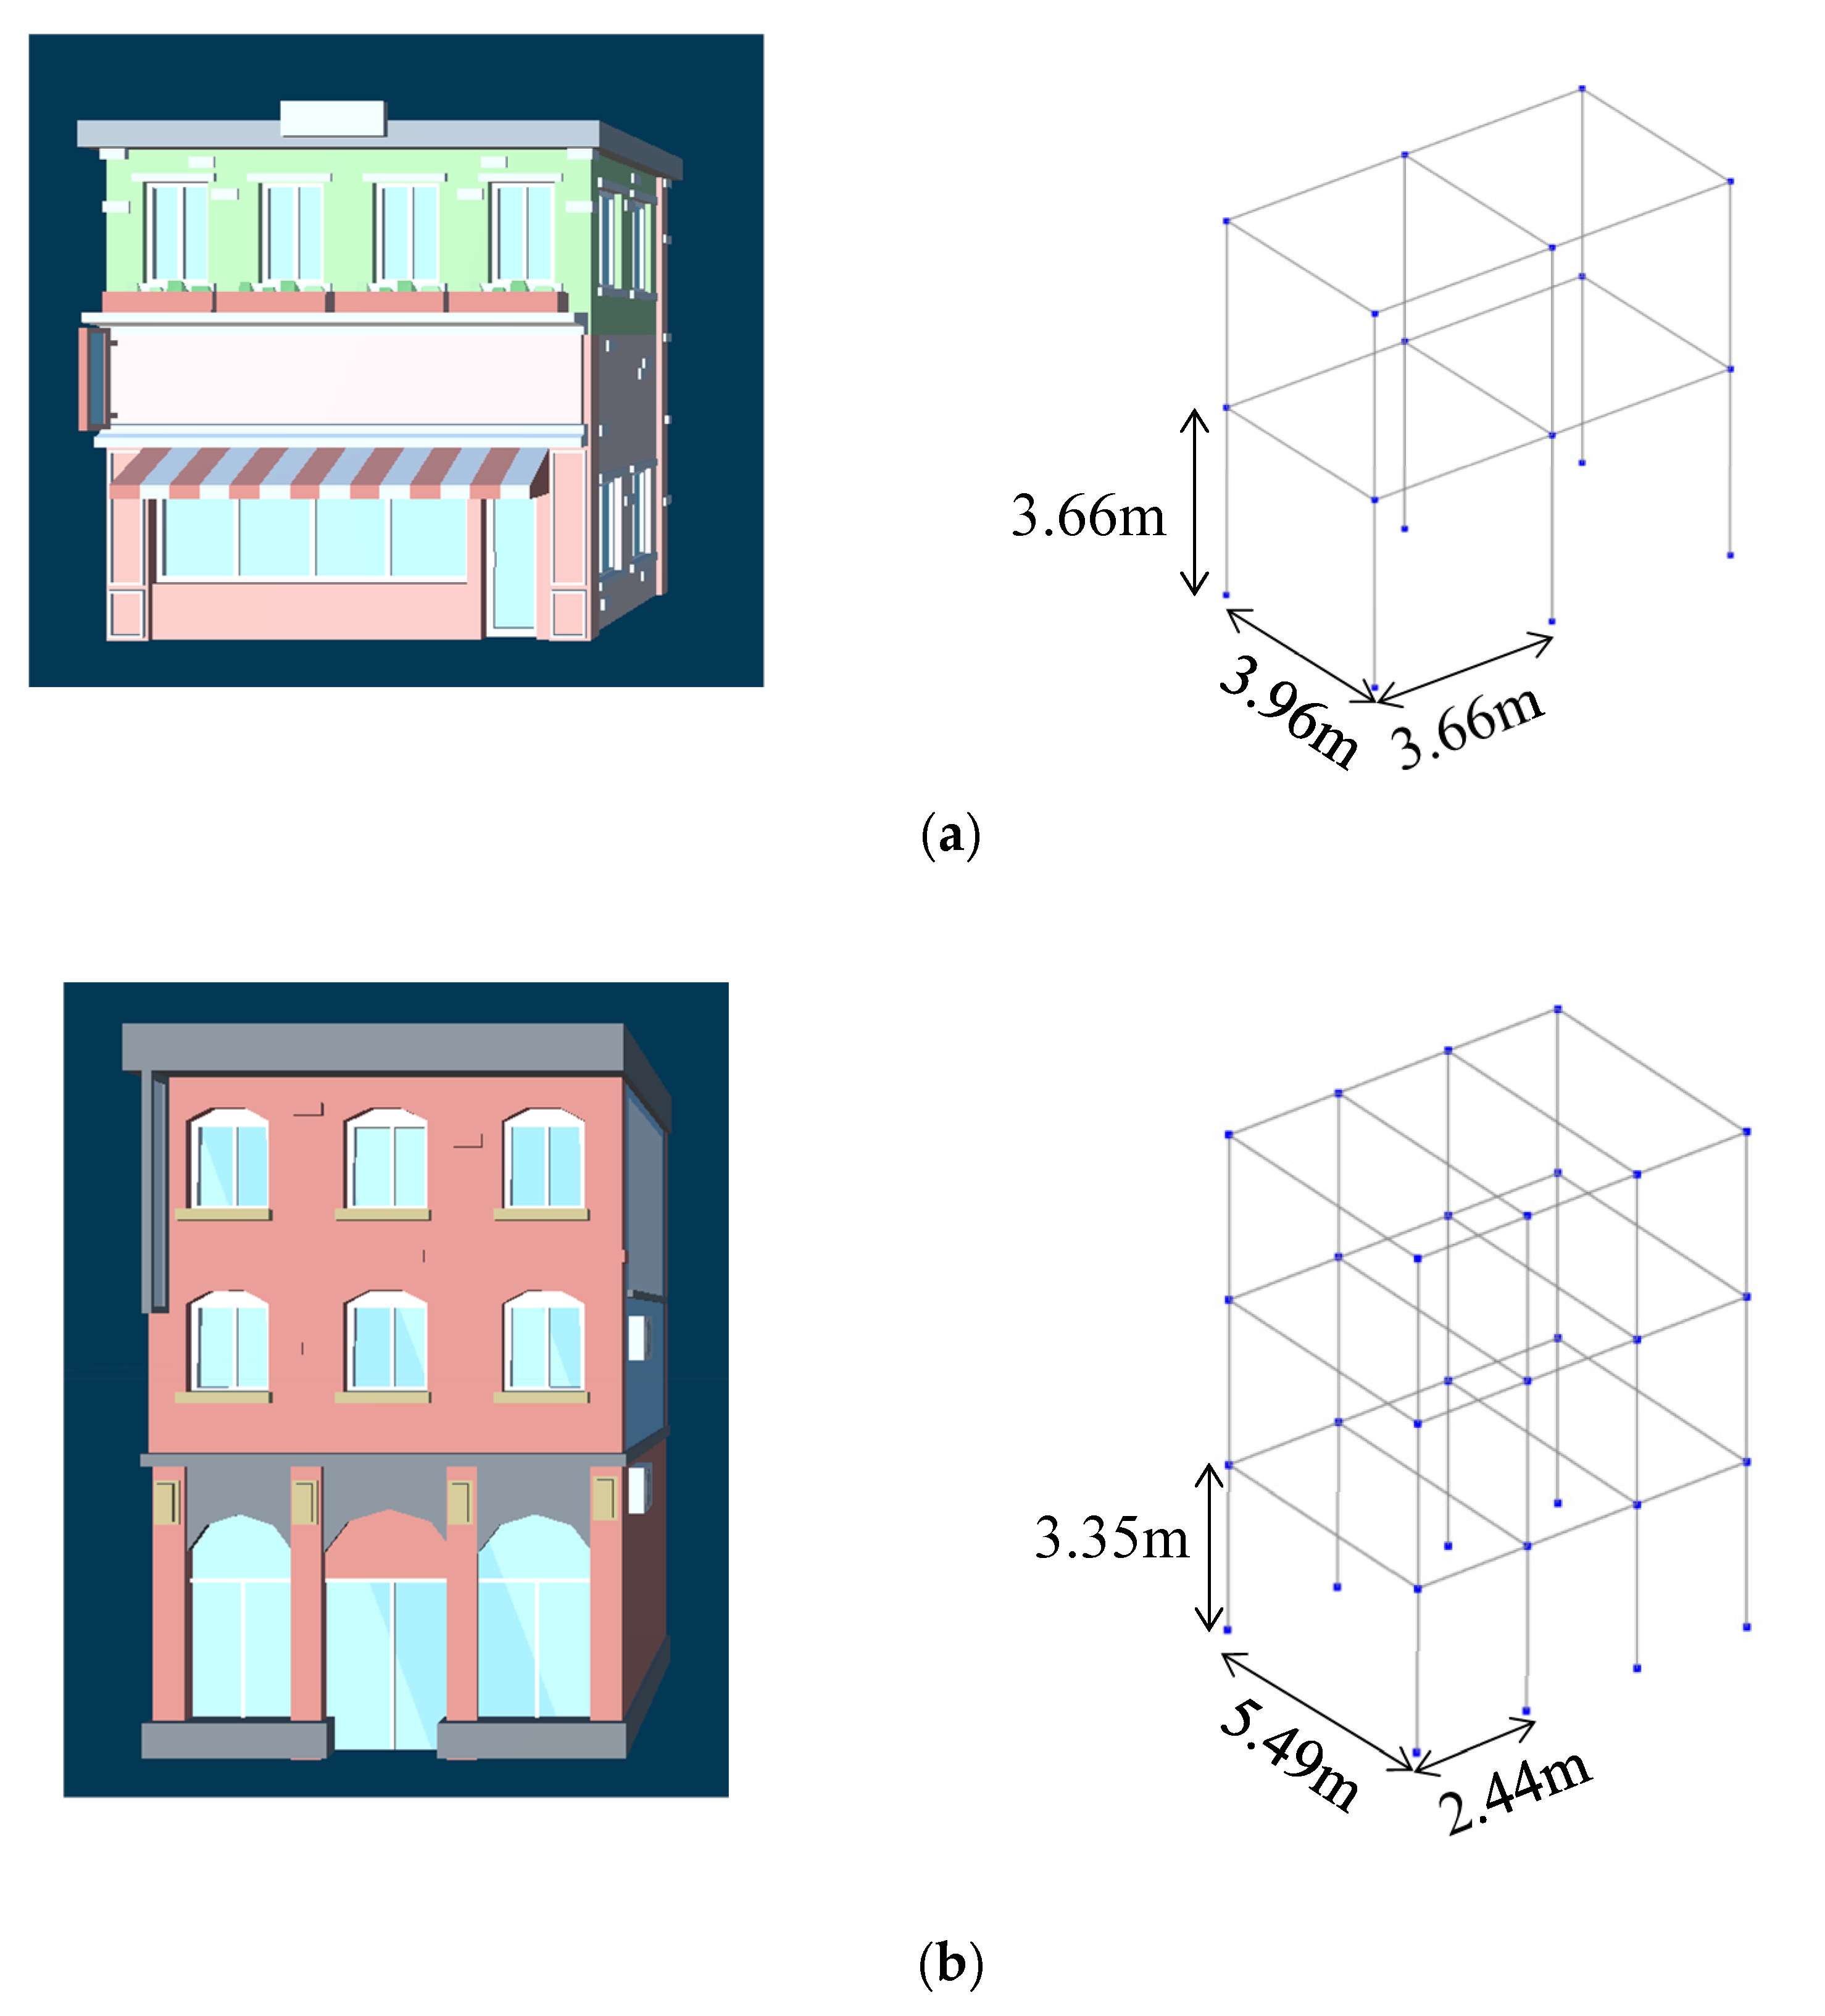
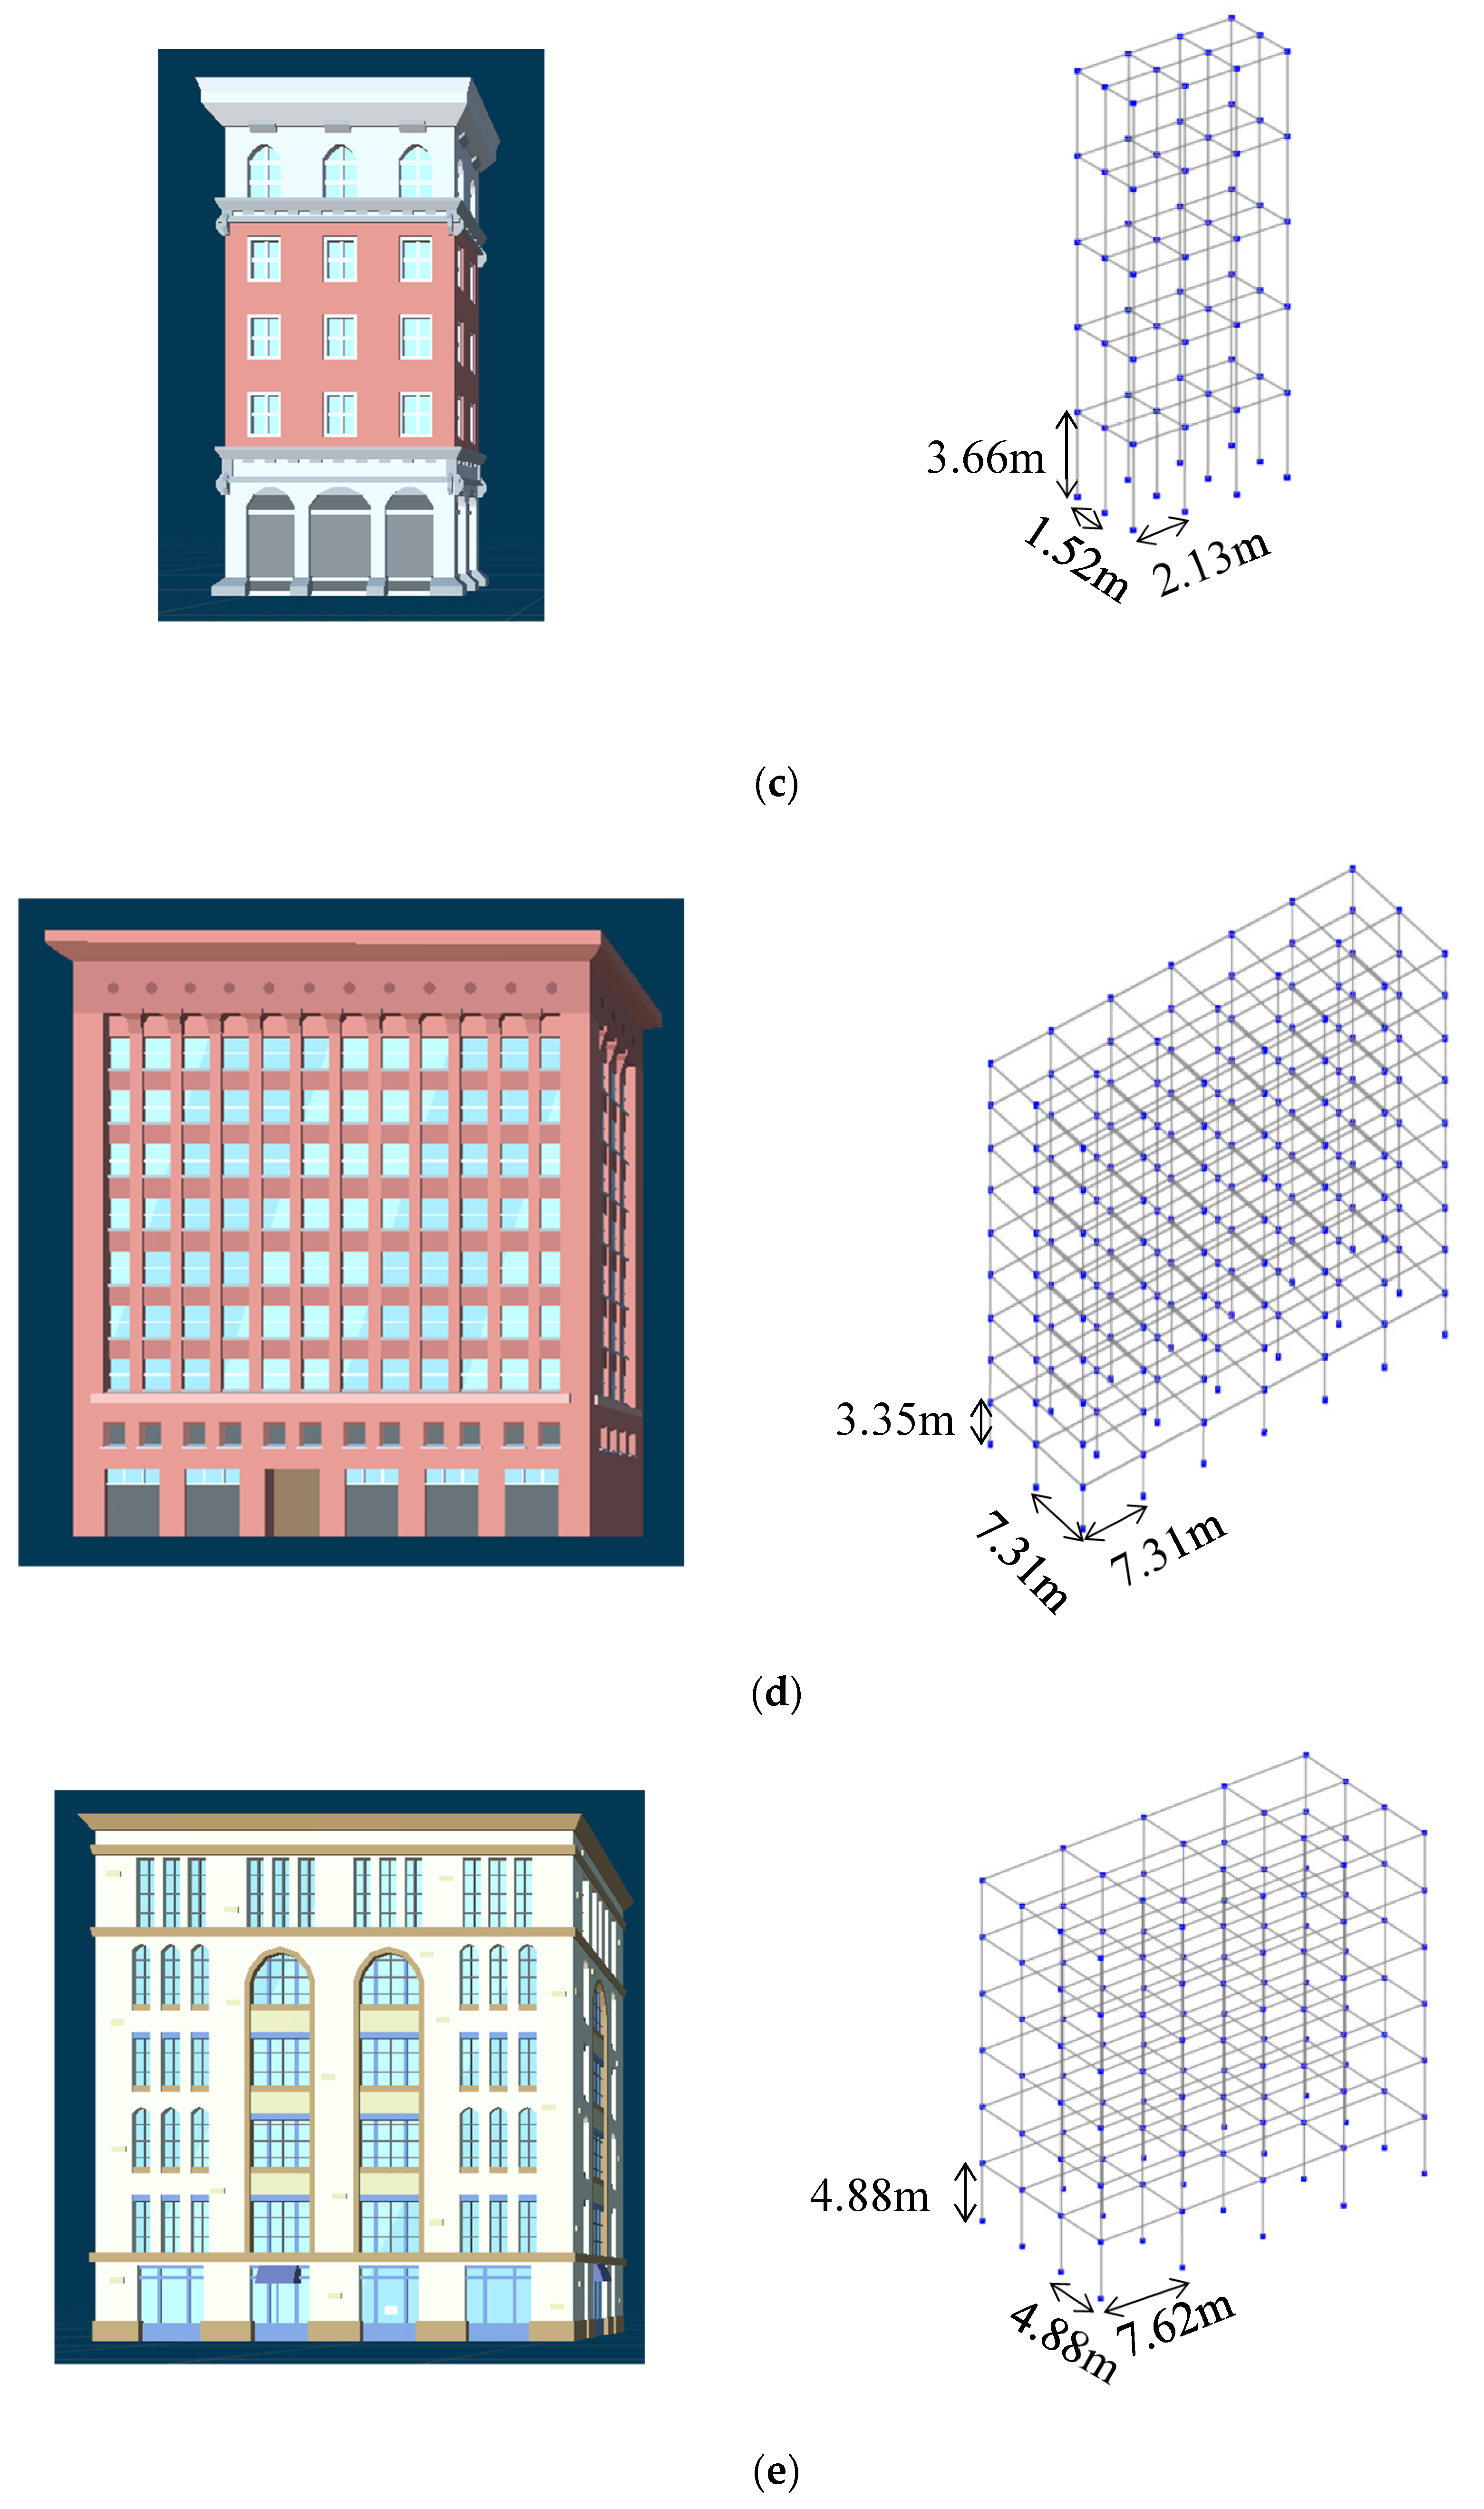
The city model (named Sweet Well City) established in the Unity scene has an area of 405,000 m2, as shown in Figure 2. The site has a rectangular shape, and its sides are parallel to the X and Z axes in the Unity scene (Z is the vertical axis). We assume that the main shock and aftershock both strike the city along the X direction in the Unity scene. Models of different components of the city (buildings, roads, pavements, parks, etc.) were downloaded from the Unity Asset Store as prefabs, and then the prefabs were assembled to form the whole city model. The model includes 1 Ground Eye Graphic User Interface (GUI), 67 residential buildings, 11 office buildings, 100 citizens, 1 refuge site, and several city roads and rivers.

2.3.2. Buildings

There are two main types of buildings in the scene: residential buildings and office buildings. According to the differences in dimensions, residential buildings are classified into HomeType1, HomeType2 and HomeType3, and office buildings are classified into CompanyType1 and CompanyType2. The models in Unity are shown in Figure 3. Note that, in this research, the building models are all solid, which means they do not have interior space, and citizens represented by spheres cannot go into these models. Information about the residential buildings is shown in Table 1, and that of office buildings is shown in Table 2.

2.3.3. Citizens

In the Unity scene, the model of the citizen is simplified to a sphere having a center at the height of 1.6 m above the ground. This simplification is reasonable since all the citizen behaviors are reflected only by the routes taken by the citizen. Initially, all the citizens are assigned a HomeType building as his/her home, and a CompanyType building as his/her workplace. The navigation of the citizen is realized by the NavMesh function in Unity. The whole city model is selected and set as “Navigation Static”, and the NavMesh is established after the button “Bake” is pressed in the “Navigation” menu. A component called the NavMesh agent is linked to each citizen, which enables the citizen to find its path under the commands in the scripts. Parameters of the NavMesh agent are adjusted so that its athletic ability matches that of a person in reality; for example, it cannot jump across rivers or jump over fences in the scene. The realization of citizen behavior is discussed in detail in 2.5.

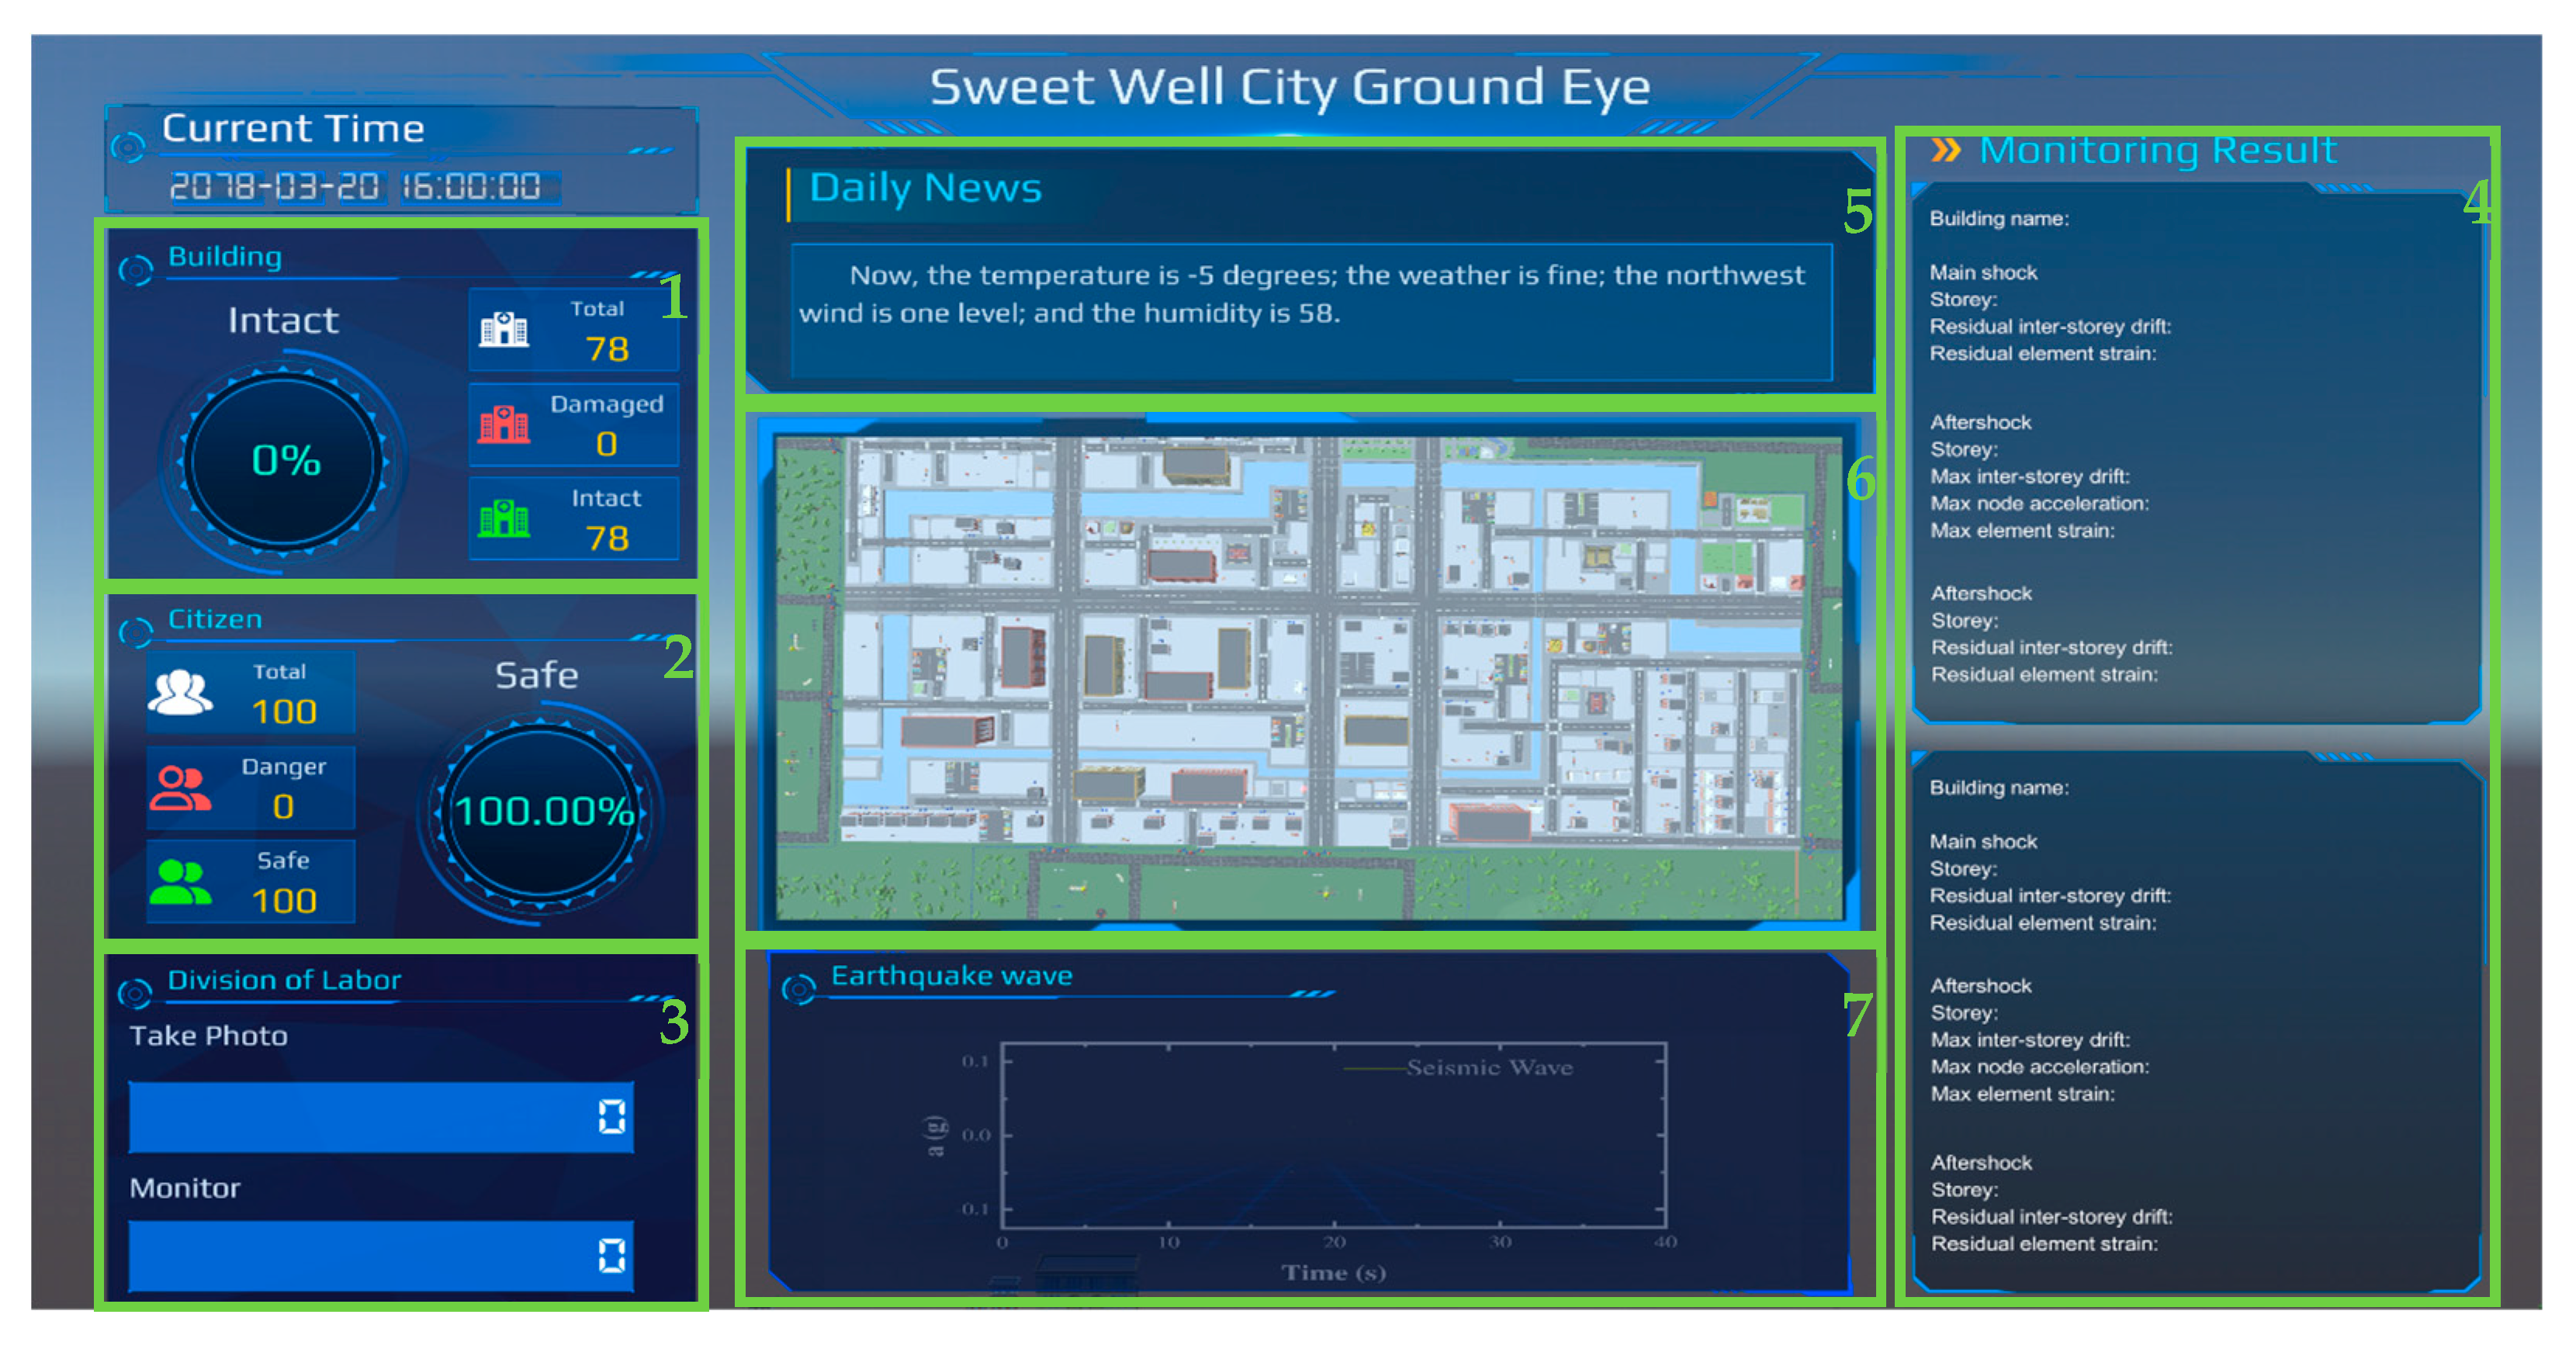
2.3.4. Ground Eye GUI

The Ground Eye is responsible for the collection and exhibition of building information, assignment of citizen tasks, and counting citizen evacuations. All information of the Ground Eye is displayed on a Graphic User Interface (GUI), which is also shown on the smartphone of citizens. The GUI shown in Figure 4 consists of the following modules:
  • Overall Building Information Module: This module exhibits the total number of buildings, the number of damaged buildings, the number of intact buildings, and the percentage of intact buildings. Each building is marked with a tag that represents the current condition of the building. Damaged buildings are marked “Damaged”, and undamaged buildings are marked “Intact”. The Ground Eye can obtain the overall damage information of city buildings in real-time by counting the tags via C# scripts.
  • Citizen Information Module: This module exhibits the total number of citizens, the number of citizens outside the refuge site, the number of citizens in the refuge site, and the refuge rate. Each citizen is marked with a tag representing the citizen’s evacuation status. After the earthquake, the citizens who have not reached the shelter are marked as “Danger”, and the citizens who have reached the shelter are marked as “Safe”.
  • Division of Labor Module: The number of citizens with different task divisions is summarized in this module. After the main shock or aftershock, the Ground Eye assigns the task of monitoring and photographing to the citizens in the shelter by changing their tags. The Ground Eye counts the number of citizens involved in each task via their tags in real-time.
  • Building Monitoring Result Module: The monitoring results and photos of damaged buildings are displayed in this module. The contents of txt files generated by MATLAB are read by C# scripts and exhibited on the GUI.
  • News Module: The daily news of the city is displayed in the News Module. After the earthquake, the News Module broadcasts warning information to alert citizens. The monitoring and evacuation process is also exhibited in this module.
  • City Map Module: The city map is projected by the camera onto the control panel of the Ground Eye. The real-time location of the citizens can be observed in the City Map Module.
  • Seismic Wave Module: The main shock and aftershock seismic waves are displayed cyclically in the Seismic Wave Module.

2.3.5. Realization of Taking Photos

In order to simulate the acquisition of photos of all of the damaged buildings after the main shock and aftershock, a camera is attached to each building as a child object, as shown in Figure 5. The location and orientation of this camera are adjusted so that a whole front view of the building can be obtained. Citizens with the task of taking photos are supposed to seek the location of this camera during the monitoring process. The camera image is saved as a picture and shown on GUI.

2.4. OpenSees Calculation

Although Unity already has a very real physics engine to provide support for simulating gravity, adding force and torque to game objects, and performing collision inspection, it does not include the function of finite element calculation. The numerical simulation of structural seismic response still needs to be handled by finite element method software, such as OpenSees (Version used in this study: 2.5.0; Manufacturer: University of California, Berkeley; Berkeley, CA, USA).
OpenSees, the Open System for Earthquake Engineering Simulation, is an object-oriented, open-source software framework. There are two reasons for applying OpenSees in this study: First, the Ground Eye needs to use the main shock seismic wave and simplified model of the building to preliminarily estimate the maximum inter-story drift of the building after the main shock. The calculation here needs to be realized by OpenSees. Second, although it is supposed that the citizens can collect data via smartphones, the response of buildings under earthquakes cannot be simulated in Unity, so we choose to use OpenSees to calculate the response based on the data obtained by monitoring. These data are only used for display, indicating that citizens in Unity have completed the inspection/monitoring process, and citizens can see these results on their mobile phones during the whole process. Thus, the data calculated by OpenSees provides the basis and results for the behavior of citizens and the Ground Eye; however, it is the existence of the data, not the accuracy of the data, that enables further design of the behavior of citizens and the Ground Eye.
An important clarification should be made before discussing the calculations. Unlike ordinary research about FEM simulation, the accuracy of the OpenSees calculation is beyond the scope of this research, since all the conditions can be changed arbitrarily in the virtual world of Unity. Moreover, no previous results exist for comparison (whether real-world experimental results or simulated results via other modeling methods). The key point here is to determine how these calculation results influence the behavior of the Ground Eye and citizens, and OpenSees only plays the role of providing the data calculated under assumptions.
The structural response parameters involved in OpenSees are listed in Table 3. These are the response parameters that citizens are supposed to collect using smartphones, with the exception of the first issue, i.e., the maximum inter-story drift during the main shock. Some research papers have provided several methods for simultaneously estimating the inter-story drift of multiple buildings, in which the simplified models only need the floor number, total height, year of construction, structural type, and site classification for calculation [30,31]. However, as mentioned above, the calculation of the maximum inter-story drift during the main shock is trivial. For convenience, the maximum inter-story drift during the main shock is also calculated via OpenSees FEM.
In the Unity scene there are five types of structures, the models of which are shown in Figure 6. Assume that all these buildings are frame structures, and buildings in a same type share the same parameters. Because the Unity city model in this study is not modeled for a real city, it does not consider whether the structural information of the buildings can be obtained in advance, or whether the structural information matches that of real buildings, etc. The authors set the structural type, structural layout, component size, and material based on assumptions, all of which can be changed arbitrarily, because in the virtual world in Unity, all conditions can be preset. With the exception of making the overall dimensions of the building models in Unity and the models in OpenSees roughly the same, the geometric and mechanical characteristics are all based on assumptions.
Five frame models are established in OpenSees.
  • The rigid diaphragm assumption is adopted.
  • Ground motions are input at all the support nodes (dynamic uniform earthquake ground motion).
  • For nonlinear modeling assumptions, in this study, all beams and columns are fiber sections. The bond slip between the reinforcement and concrete at beam–column joints and in beam–column sections is neglected, and the shear deformation in beam–column elements is ignored. The reinforcement is evenly distributed around the concrete core, and the outside is covered with a concrete protective layer. The confinement effect of stirrups on the core concrete was taken into consideration. The materials of the concrete and reinforcement are Concrete02 and Steel02, respectively. The element type is a Force-based Beam–Column Element, and the number of Gaussian integration points for the non-linear curvature distribution is 5.
The first step is to calculate the inter-story drift time-history during the main shock for all these models. The seismic wave record H-e12140, which was downloaded from the Peer Strong Motion Database [32], was adopted in this research as the main shock input. The result was then processed by MATLAB, by which the maximum inter-story drift was calculated and compared with 1/550, the elastic inter-story drift limit of a frame structure in Chinese Code GB 50011-2010 (Code for seismic design of buildings). Note that in the Unity scene, the seismic waves propagate along the X direction, whereas building models are placed with their X axis either parallel or perpendicular to the Unity X axis. Among all the combinations of structural types and earthquake input directions, three combinations exceed the limit: the 4 × 3 × 6 frame with a seismic wave in the X direction; the 4 × 3 × 6 frame with a seismic wave in the Z direction; and the 6 × 2 × 9 frame with a seismic wave in the X direction. In other words, all the CompanyType buildings are considered to be damaged and to need further monitoring. The following calculation only involves these three combinations.
Next, the residual inter-story drift and residual element strain after main shock are calculated. Although OpenSees does not have a function for directly outputting residual deformations, this is made possible by adding a large number of zeros to the end of the ground motion document, indicating that after the main shock ends, the building will vibrate freely for a period of time. The velocity time-history of a free node, which was chosen to be at the top of the building in this research, is recorded. When the velocity is close enough to zero, that means the free vibration is over, and the subsequent stable deformation value is the residual deformation.
For time-history data during the aftershock, it is worth noting that a loadConst command is necessary in order to maintain the analysis results (both load and deformation) under the main shock. The calculation of residual inter-story drift and residual element strain after the aftershock follows the same steps as in the above paragraph. The aftershock input record is RSN1_HELENA.A_A-HMC180, which was downloaded from the Peer NGA Strong Motion Database.
Before the response data are exhibited on the Ground Eye GUI, as mentioned in Section 2.3.4, a random deviation within the range of ±5% is applied to all these values in order to simulate the measurement error.

2.5. Design of the Behaviors of Citizens and the Ground Eye

2.5.1. Introduction of Behavior Tree

In Section 2.3, the application of C# scripts in Unity is introduced; however, there may be some situations in which the logic is too complex to be realized if only C# script is adopted, for example, describing the AI behaviors. In order to simulate the reactions to different environment conditions that the AI may take, the huge required amount of C# programming work may become an obstacle for non-professional C# programmers.
A tool called the behavior tree allows the much simpler realization of the complex AI behavior. A behavior tree is a mathematical model of plan execution used in computer science, robotics, control systems, and video games. It describes the switching between a finite set of tasks. Originating from the video game industry, the behavior tree has become a powerful tool to describe the behavior of non-player characters (NPCs) [33], and is now widely used in game engines such as Unity and Unreal Engine.
In this research, a behavior tree plugin in Unity called Behavior Designer was adopted. A behavior tree consists of a root, control flow nodes, and execution nodes. In Behavior Designer, there are two main types of control flow nodes: composites (such as “sequence”, which means “and”, and “selector”, which means “or”) and conditionals (which return “true” or “false”). They form an upside-down tree-like logic flow, with the root on the top and execution nodes called “tasks” at the bottom. All these nodes are C# scripts, enabling this behavior tree to manipulate the game objects in the Unity scene like a combination of C# scripts.

2.5.2. Realization of the Behaviors

The behaviors of citizens mainly include daily life, emergency evacuation, and post-earthquake detection. Indeed, citizen behavior has been simplified to a considerable extent, so that citizens all perform the tasks assigned by the Ground Eye according to the same relatively simple logic. The reason for this is that the purpose of this study was to propose a preliminary framework to simulate the interaction of citizens, the Ground Eye, and earthquake events, paving the way for future public participation in earthquake response monitoring research. If citizen behavior is not simplified, it will be difficult to carry out even this very first step. Furthermore, whether or not citizen behavior is complex and diverse will not fundamentally change the general trend that most citizens complete inspection work and take refuge in an orderly manner under the command of the Ground Eye.
In the default state, all citizens keep cyclically moving back and forth between their home and their workplace. As soon as the main shock occurs, the Ground Eye sends evacuation commands to all citizens. The daily life cycle is interrupted and all the citizens start moving to the refuge site. Once they arrive at the refuge site, their tags are changed from default to “CitizenRefuge”, so that the GUI can use the tags for counting.
After the main shock ends and the calculation of the maximum inter-story drift during the main shock is finished, each citizen is assigned a number called CitizenID, which is from 1 to 100 without repetition. At the same time, the damaged buildings are identified and sequenced. The calculation results show that all the 11 CompanyType buildings require inspection, which contains two parts: taking photos and monitoring. The order of the list of damaged buildings is: CompanyType1-1, CompanyType1-2, CompanyType1-3, CompanyType2-1, …, CompanyType2-8. Each of these buildings is also assigned a number called BuildingID from 1 to 11. Then, the Ground Eye can determine the citizens’ division of labor according to CitizenID and BuildingID.
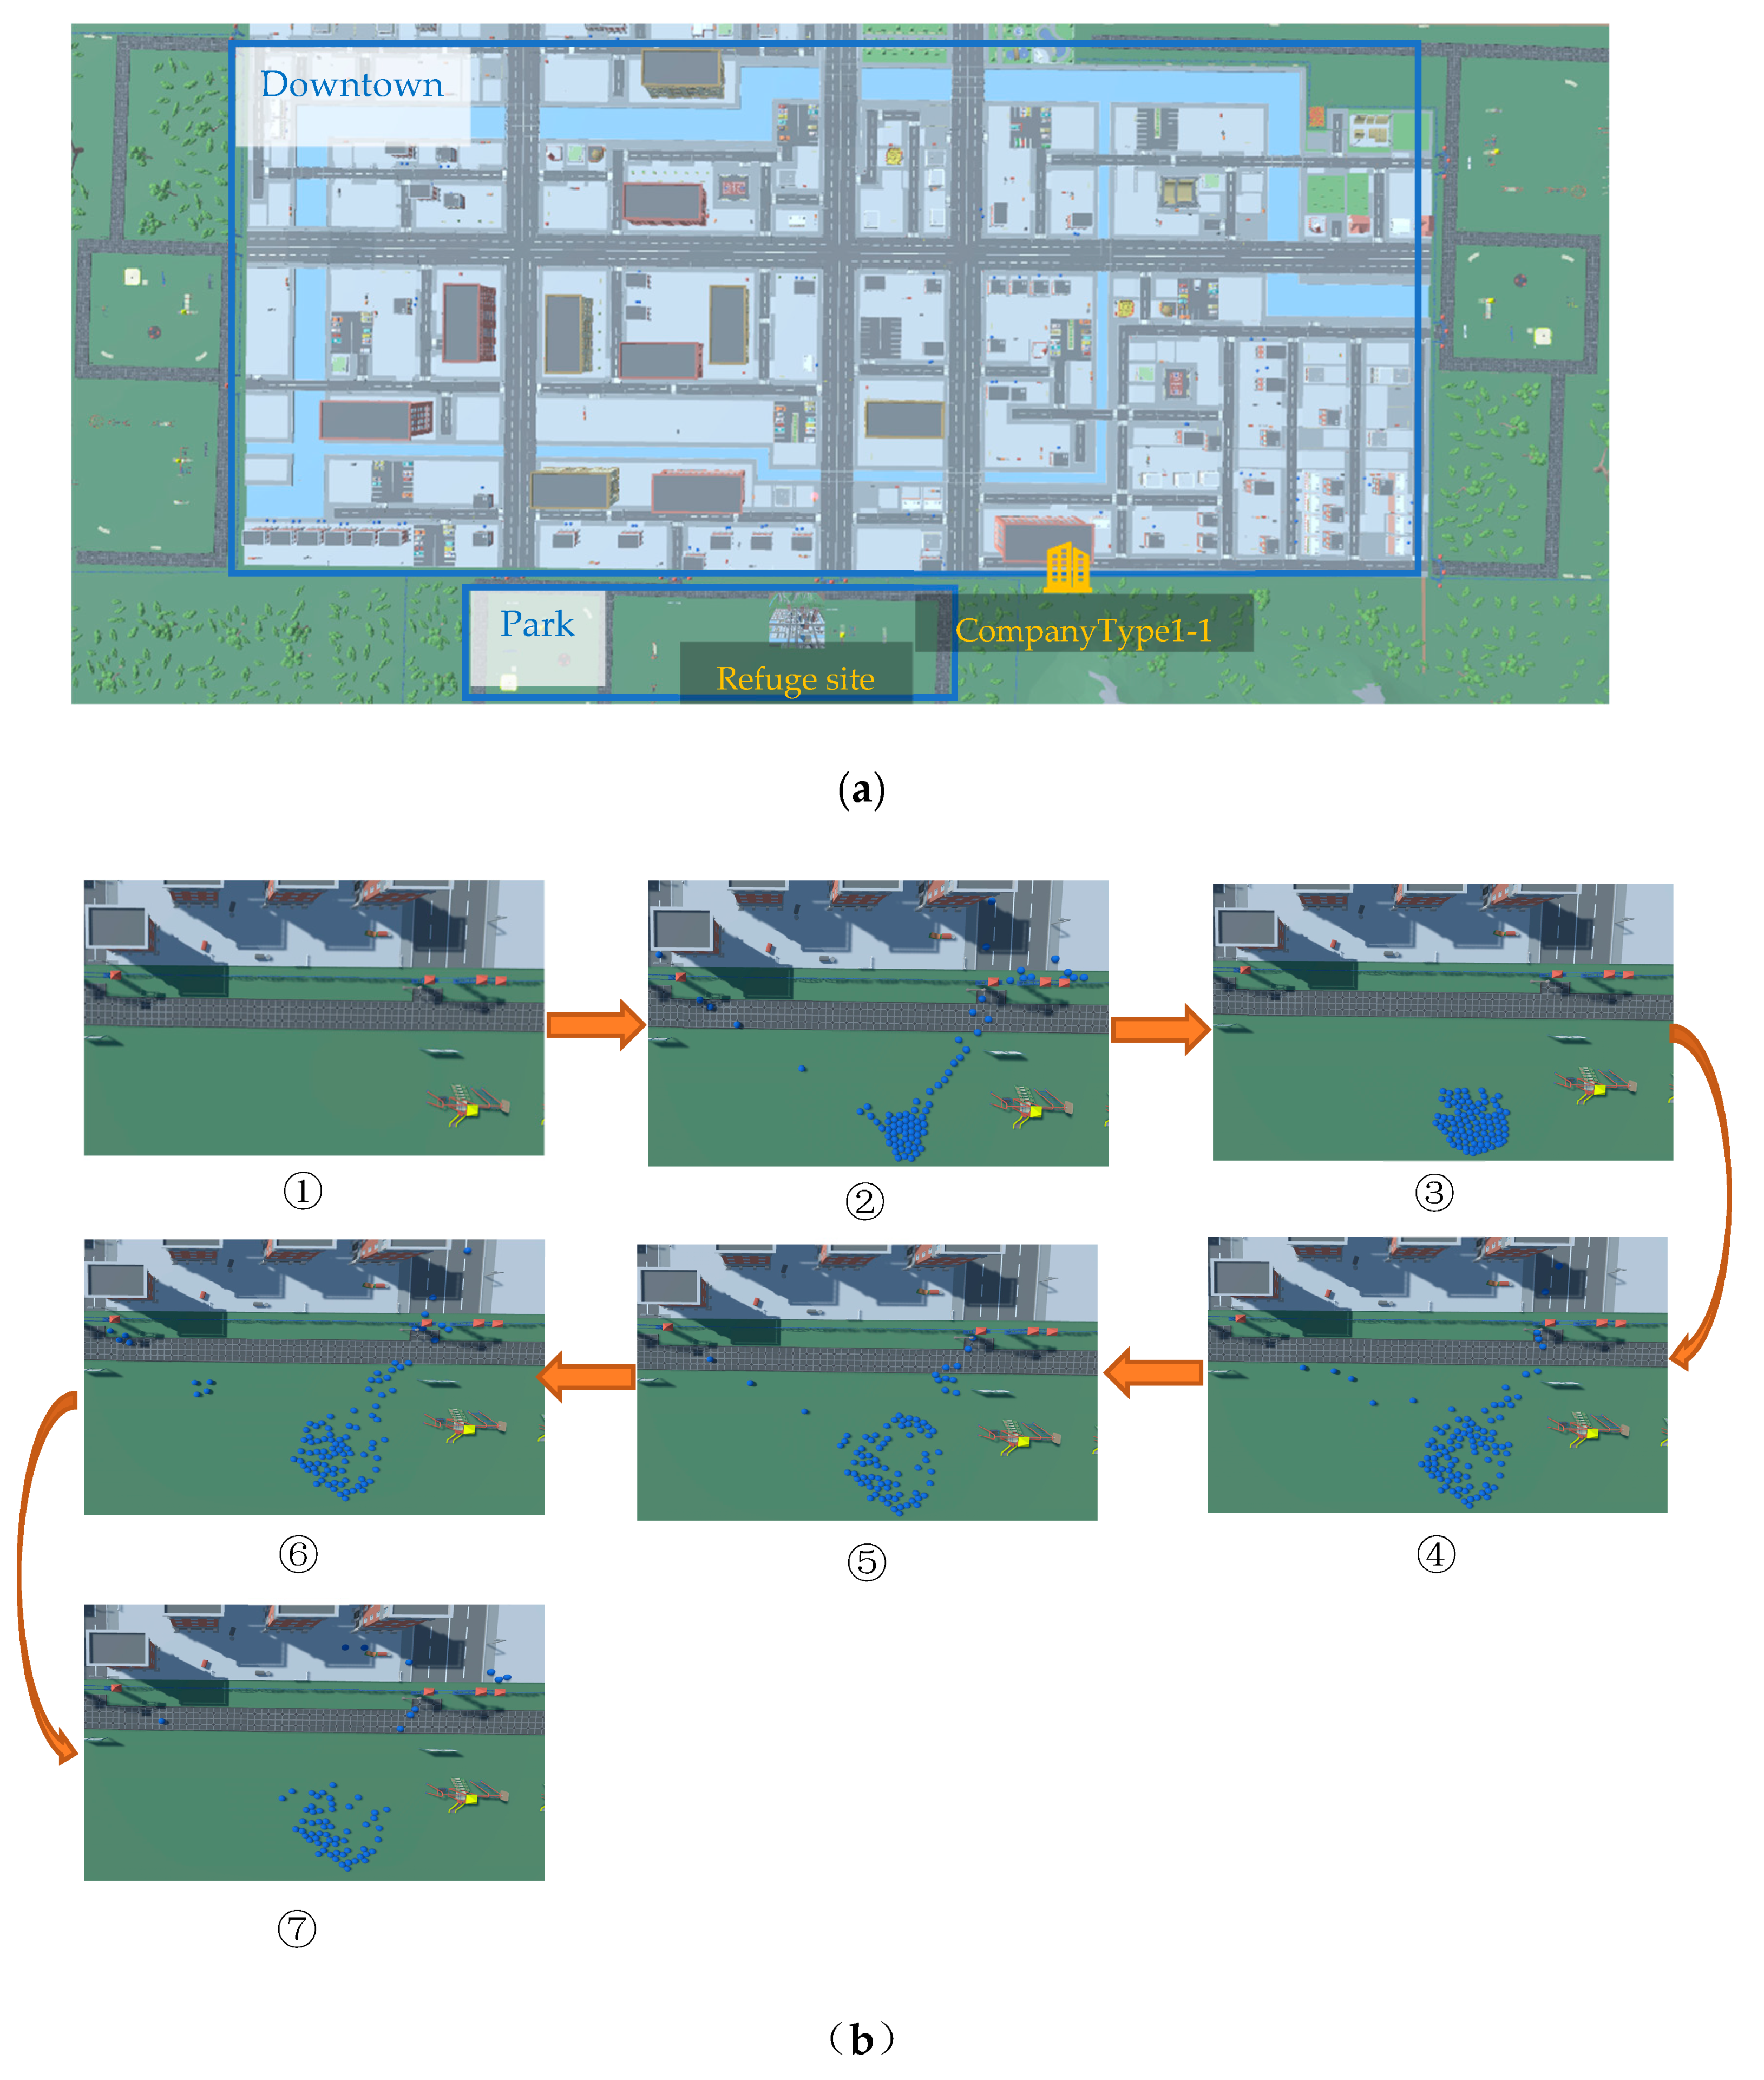
  • Citizens with CitizenID from 1 to 11 (11 in total) are assigned the task of taking photos. In detail, the citizen goes to the building which has the same ID number as his CitizenID. For example, citizen 1 should go to CompanyType1-1, and citizen 11 should go to CompanyType2-8.
  • Citizens with CitizenID from 12 to 44 (33 in total) are assigned the task of monitoring, and 3 citizens are each responsible for a damaged building. The remainder of CitizenID is checked to determine if it can be divided by 11, 22, or 33. The citizen goes to the building whose BuildingID is equal to this remainder. For example, citizen 12 should go to CompanyType1-1, citizen 24 should go to CompanyType1-2, and citizen 36 should go to CompanyType1-3.
  • Citizens with CitizenID from 45 to 100 (56 in total) do not have any tasks. They stay in the refuge site after the main shock.
After arrival, citizens with CitizenID from 1 to 44 wait for a short period of time at the bottom of the damaged building, indicating they are arranging the smartphones for monitoring. After finishing their tasks, they return to the refuge site.
After the aftershock ends, the process is the same as that mentioned above.

3. Results

It is assumed that an earthquake strikes Sweet Well City at 10:30 on March 17, 2078. The Ground Eye is responsible for the safety of all buildings and citizens in Sweet Well City. The results obtained from the experiment are as follows.

3.1. Distribution of Citizens

The distribution of citizens in the city at different moments is shown in Figure 7. Figure 7a shows a map of a full view of Sweet Well City. A park is located on the edge of the city, and is considered a refuge site. Figure 7b illustrates the distribution of citizens in the refuge site at different moments. The change in the number of citizens consists of the following stages:
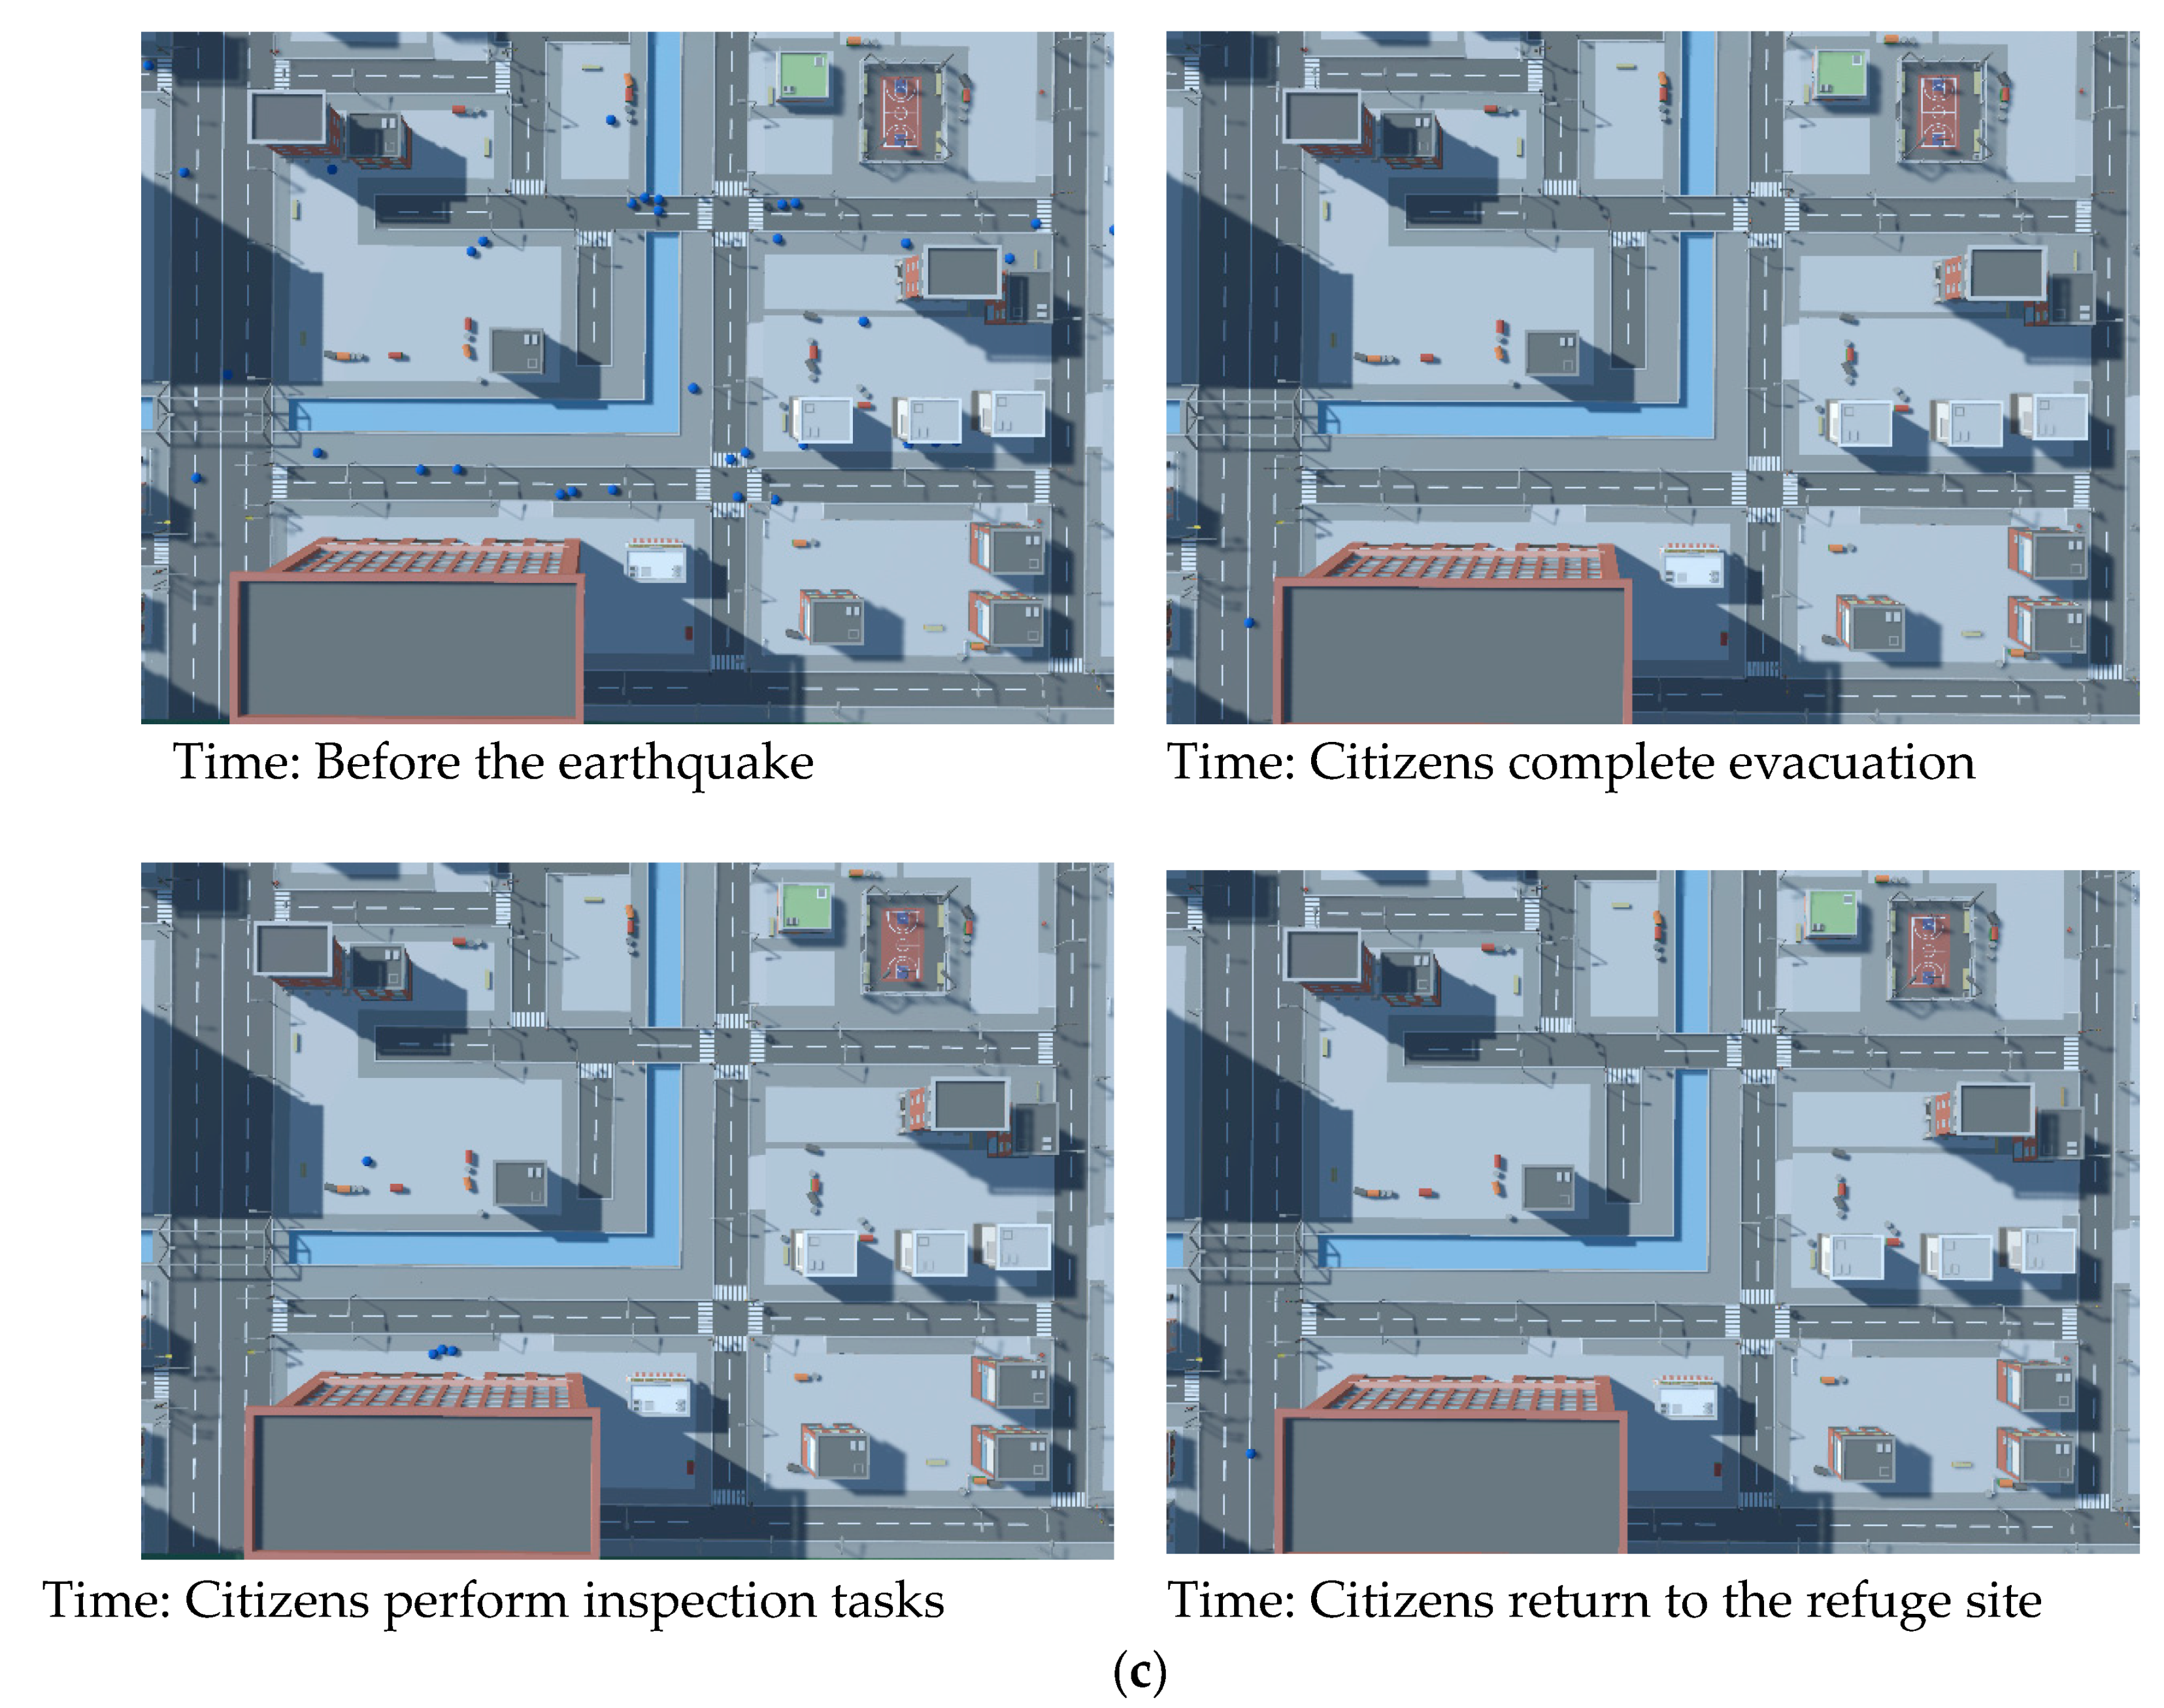
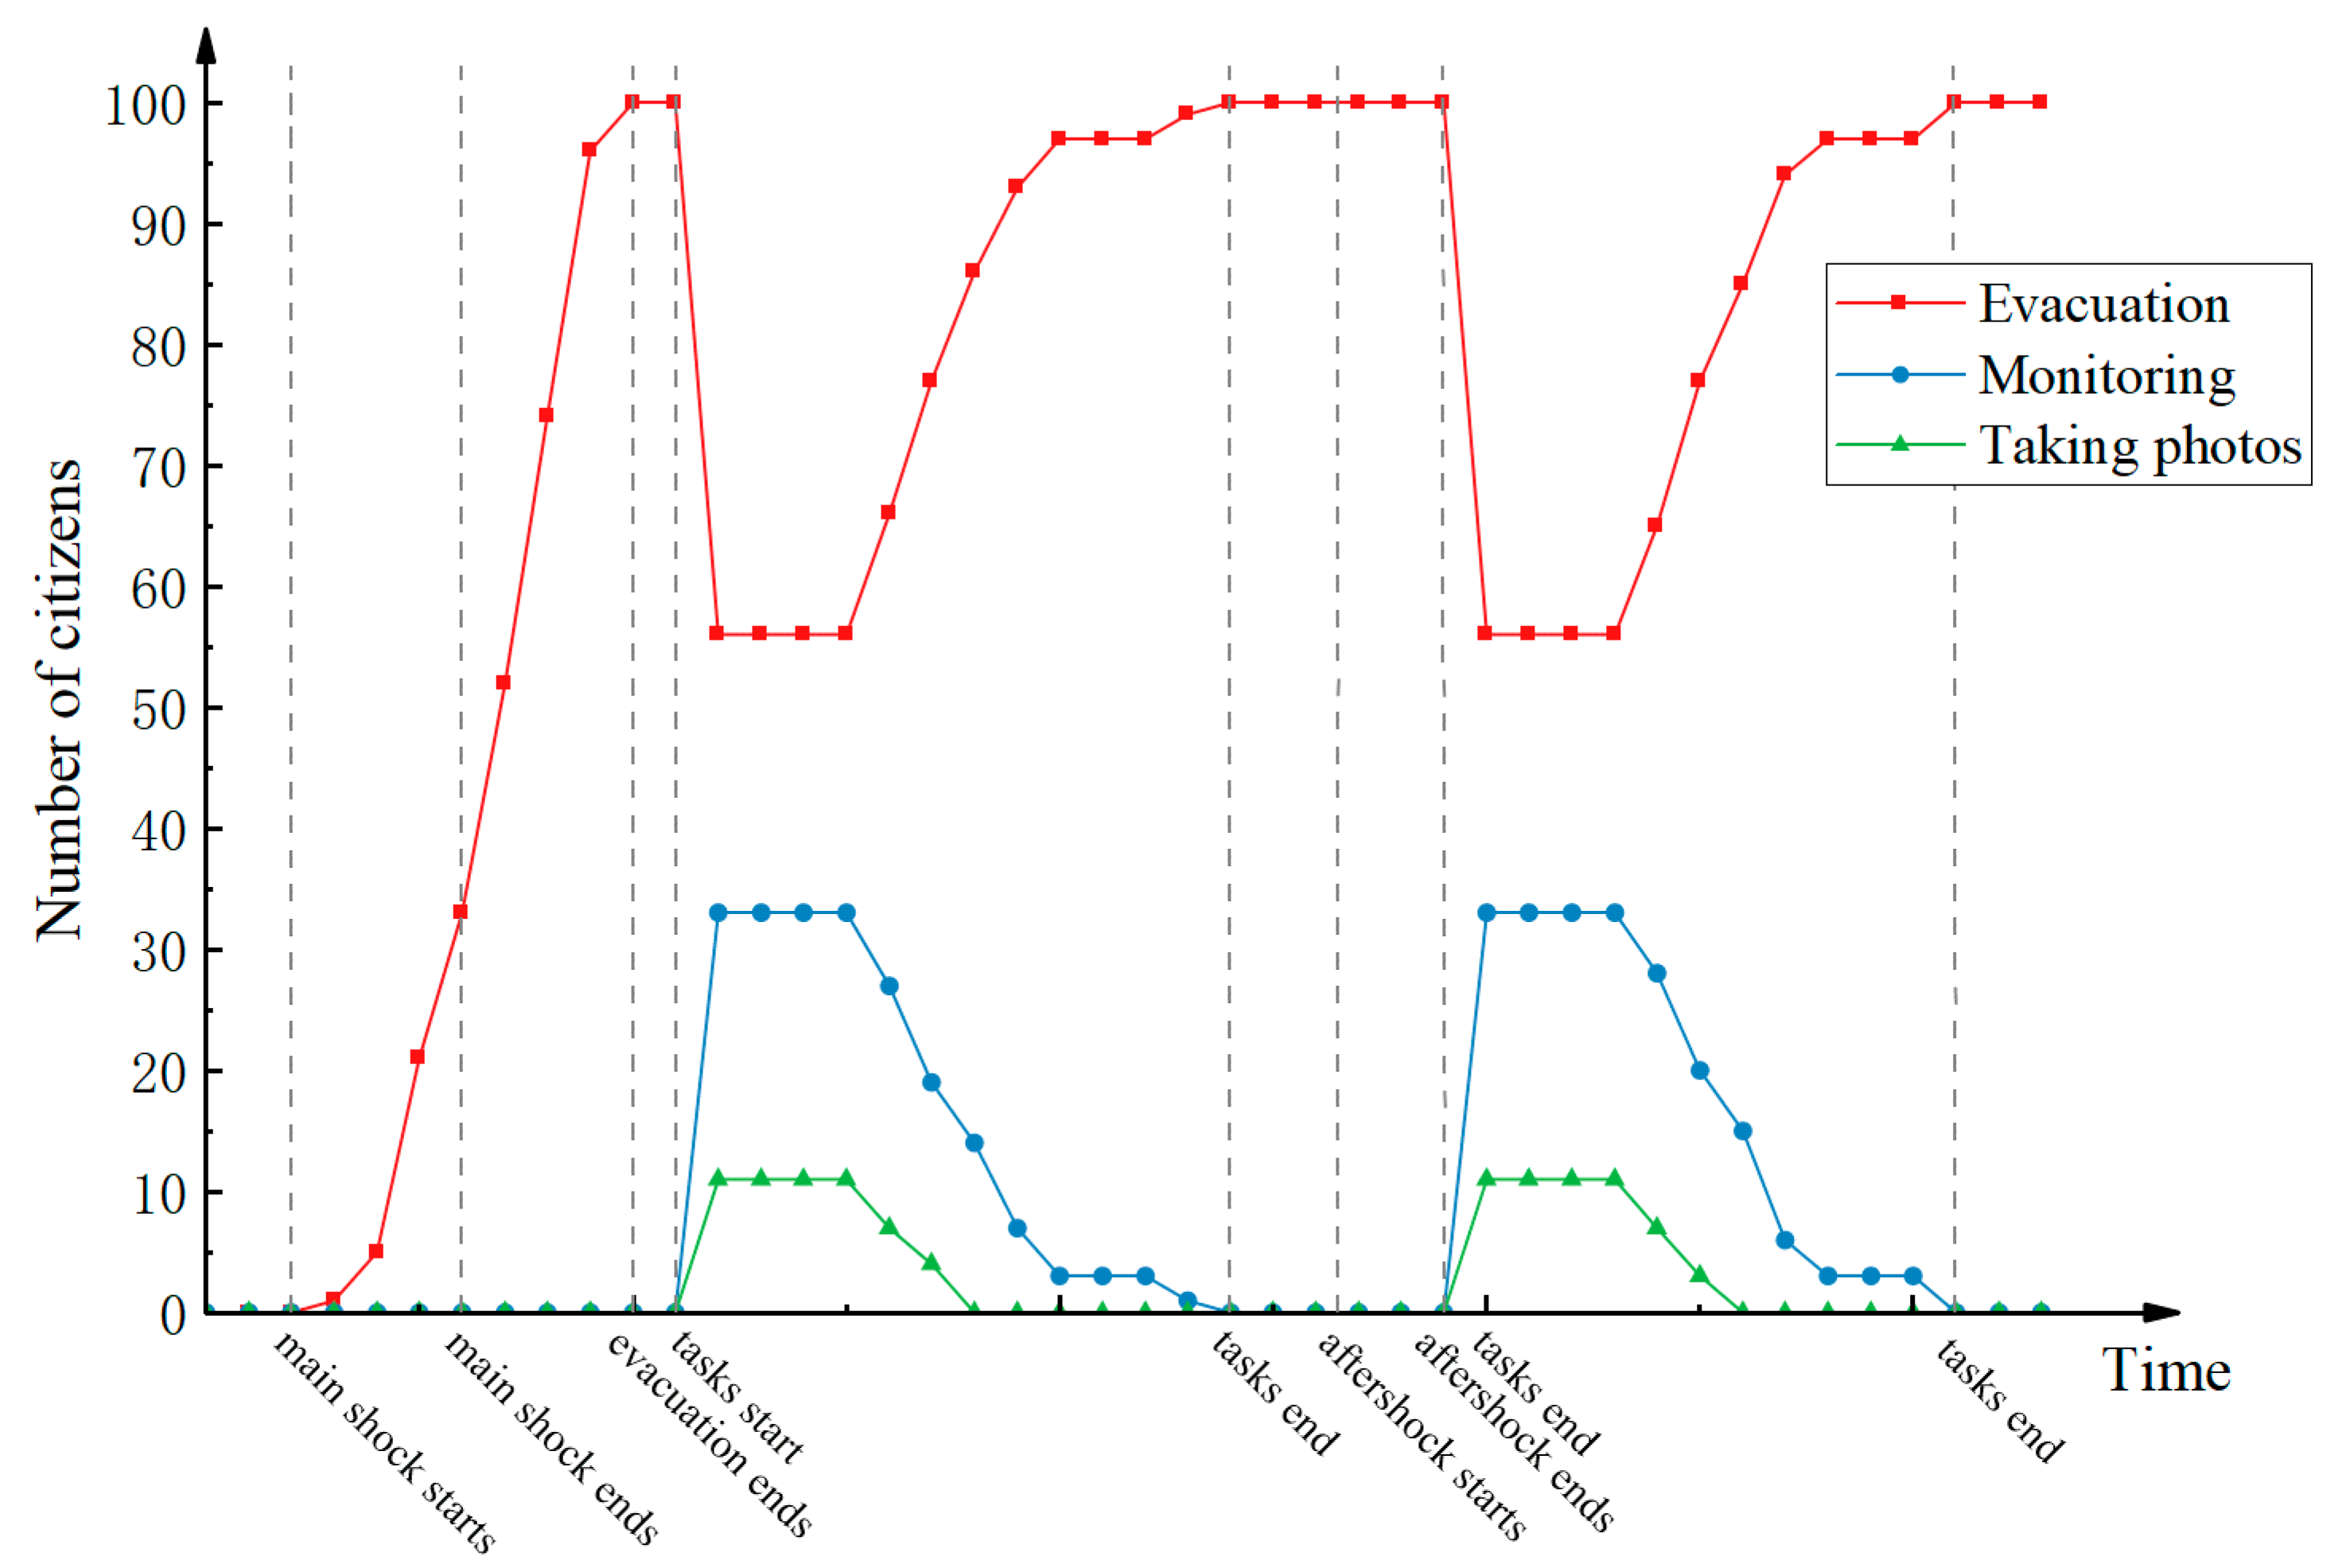
  • Before the main shock, citizens lived and worked normally in the city, and the number of citizens in the refuge area is 0.
  • When the main shock occurred, citizens received the alarm and evacuation route delivered by the Ground Eye. The number of citizens in the refuge site increased as citizens moved to the refuge site.
  • All citizens reach the refuge site and the number of citizens in the refuge site is equal to the total number of citizens in Sweet Well City.
  • The Ground Eye assigns inspection tasks for citizens and transmits the location of damaged buildings to citizens’ smartphones. Citizens leave the refuge site to perform the task of inspecting buildings.
  • Citizens return to the refuge site after completing their inspection tasks.
  • The aftershock occurs in Sweet Well City. The Ground Eye once again assigns tasks to citizens. Citizens leave the refuge site to carry out inspection tasks.
  • Citizens complete the task of inspecting buildings after the aftershock and return to the refuge site.
Figure 7b shows a top view of CompanyType1-1 and the surroundings. Before the earthquake, the daily behavior of citizens was a cycle of two processes: going to work and returning home; thus, the citizens could be seen around the buildings. When the main shock occurred, citizens immediately rushed to the refuge site. Once all citizens reached the refuge site, there were no citizens in the vicinity of the buildings. After a period of time, citizens performed the inspection tasks assigned by the Ground Eye. Therefore, four citizens performing inspection tasks can be seen around that building, consisting of one citizen taking photos in the distance and a group of three citizens performing monitoring. After the citizens completed their tasks, they returned to the refuge site and there are no citizens around the building.

3.2. Routes of Citizens

Citizens were divided into three types according to their assigned tasks: those who take pictures, those who inspect, and those who have no tasks other than evacuation. Figure 8 presents the movement routes of three representative citizens performing different tasks. Figure 8a shows the movement route of a citizen who was assigned to take photos. The black line indicates their behavior in a daily state. The starting point is home and the end point is the company. The red line is the evacuation route for a citizen, ending at the refuge site. The blue and green lines are the routes for taking photos after the main shock and aftershock, respectively. Figure 8b,c illustrate the routes of citizens whose task is monitoring and those who do not have any task, respectively. Routes of these three citizens are shown together in Figure 8d.

3.3. Change in the Number of Citizens with Different Tasks

Figure 9 displays the fluctuations in the number of citizens with different tasks. After the main shock, citizens followed the routes given by the Ground Eye to the refuge site. As a result, the number of refugees rose until the maximum number was reached when all the citizens arrived at the refuge site. After a period of time, some citizens were assigned to photo taking and detection tasks by the Ground Eye, so the number of citizens taking photos and monitoring increased. Citizens left the refuge sites to carry out their tasks and the number of evacuated citizens decreased. Citizens returned to the refuge site after completing their mission. Thus, when citizens completed their task, their task status changed from taking photos or monitoring to evacuation. During this process, the number of citizens taking photos and monitoring decreased, while the number of evacuees rose and finally become 100 (the total number of citizens). The process of monitoring buildings for aftershocks is similar to that of the main shock.

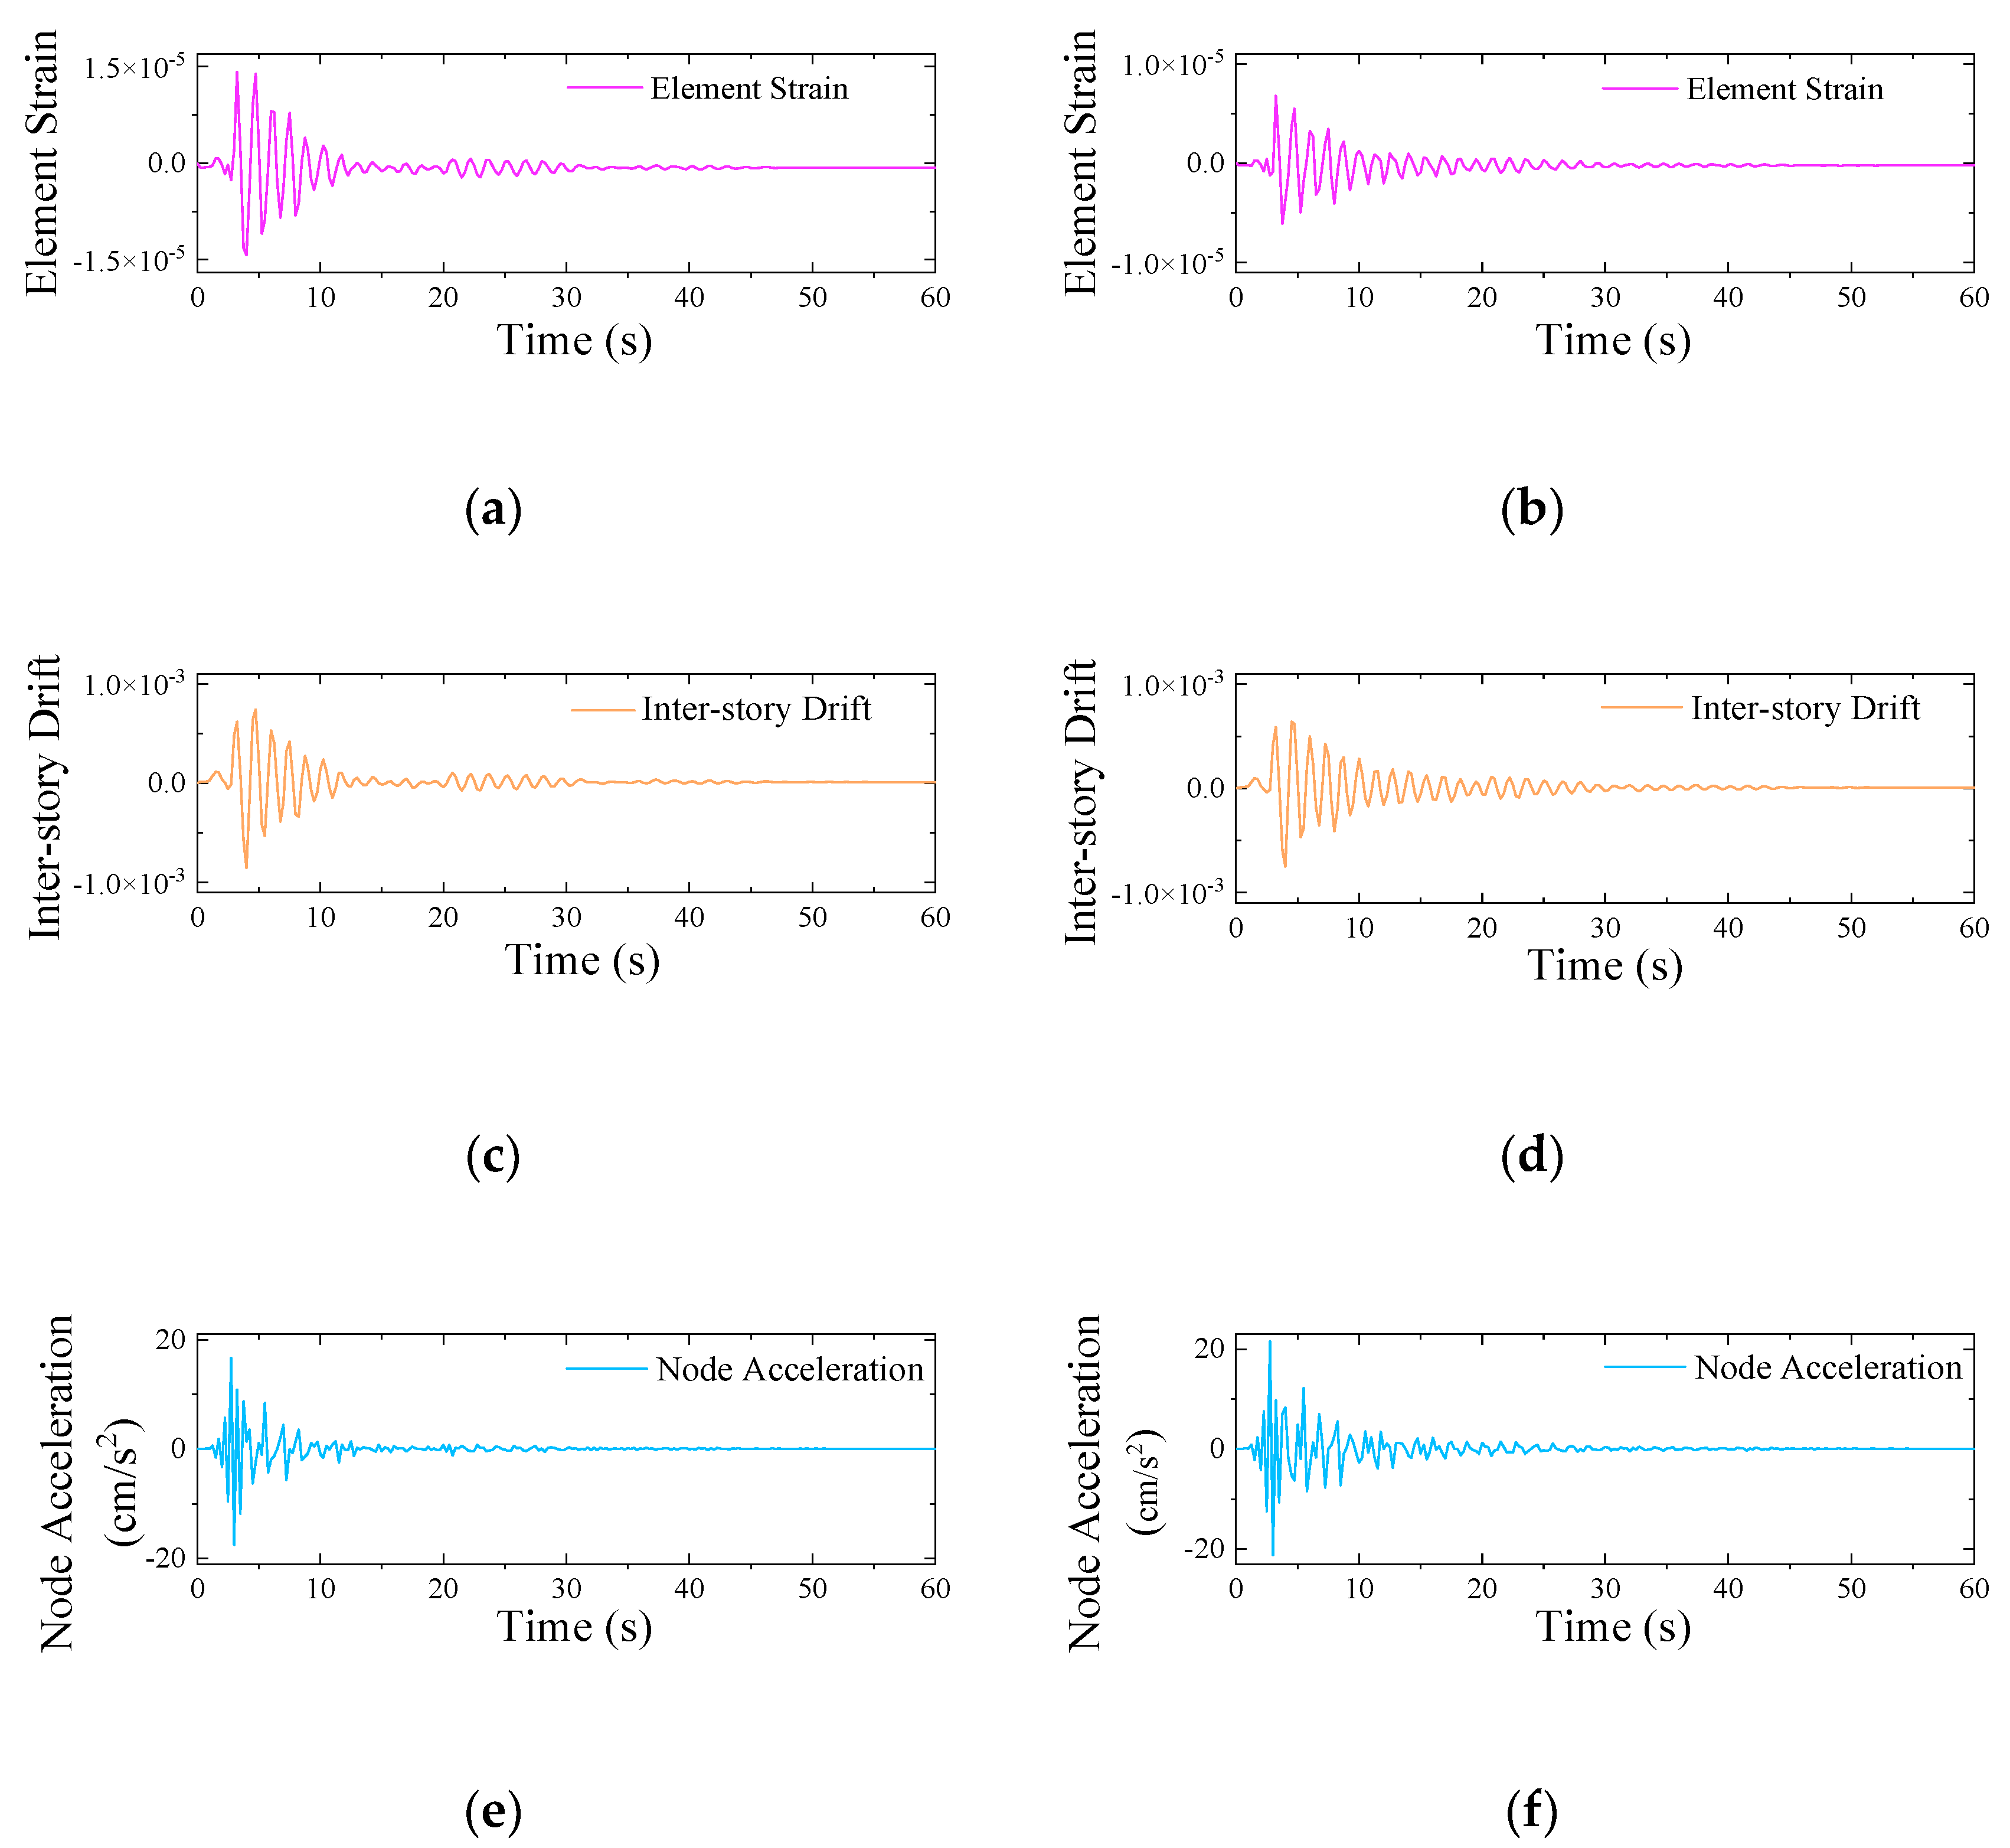
3.4. Structural Response

Taking CompanyType1-1 and CompanyType2-1 as examples, the values of the structural response parameters, which are assumed to be measured by citizens, are shown in Table 4. The time-history curves of inter-story drift, node acceleration, and element strain of these two buildings are shown in Figure 10. Note that all these parameters are assumed to be measured on the floor with the largest value of maximum inter-story drift during the main shock. Although many studies have been conducted on damage assessment, such as using node acceleration [34], the main subject of this research is not earthquake response simulation, and discussion of damage assessment is beyond the scope of this paper.
The residual strain data listed in this table were calculated by OpenSees; thus, these are only calculation results, in which the accuracy achieved by the sensor was not taken into consideration. It is considered that the data are obtained by citizens using MISS [16] and smartphones, and that this method cannot reach an accuracy of smaller than 10−6. As a result, the absolute values of any residual element strain data that are smaller than 10−6 in Table 4 are modified to 10−6.

4. Discussion

Although the results matched the plans very well, there are still some limitations of this research. Most of these are related to the behavior of citizens and the Ground Eye. First, the citizens’ behavior models in this research lack diversity of types. The difference between citizens’ behavior trees is limited to the CitizenID, which divides citizens into three groups. However, in reality, citizens having different ages, genders, occupations, characters, etc., may act using various types of logic. The interaction between their own logic and commands from the Ground Eye may create a large amount of uncertainty. Second, although in reality communication between citizens is an important means of information transmission during emergency events, only communication between the citizens and the Ground Eye was considered. Third, the framework of the Ground Eye was simplified in this research. In recent years, research and applications of the city brain have mainly focused on security, city planning, or traffic regulation. Discussions about the earthquake emergency response and structural health monitoring have not yet been closely related to the city brain.
Some future research directions are highlighted:
  • More complex behavior model, or AI, of the citizens. In the future, different types of behavior models of humans in sociology shall be adopted, which describe probabilistic models of citizen behavior in various environments; for example, whether the citizens follow the commands of the city brain, or the priority of women and children in an evacuation.
  • Cooperation and information transmission between different groups of agents. In this research, only the communication between citizens and the Ground Eye is considered, thus neglecting the possible influence on efficiency due to cooperation.
  • Frameworks of the Ground Eye.
  • Introduction of reinforcement learning. The logic of citizens and the Ground Eye is fixed in this research; however, there is a possible method in which the agents can interact with the environment and identify a more efficient approach.
  • Some of the citizens may be able to be manipulated by the operator, and thus cooperate with all other citizens to perform the earthquake emergency response and structural health monitoring tasks. Due to the sociology and reinforcement learning this would involve, the behavior of the agents/citizens will be more complex, and possibly closer to reality. Together with the operator, we may gain more insights into public emergency response monitoring.

5. Conclusions

Smartphone-based monitoring techniques enable crowdsensing for all buildings in urban regions after an earthquake. This paper proposes a method of simulating the post-earthquake evacuation and smartphone-based monitoring process of citizens under the instructions from a city brain in Unity. The simplified behavior models of citizens and the city brain are established; a feasible task assignment is presented; the information transmission between citizens and the city brain is discussed; and the whole process of taking refuge and monitoring is verified in the Unity scene. The distribution of citizens in the city, routes of representative citizens performing different tasks, and the change in the number of citizens with different tasks all agree well with the plans. The simulation framework presented in this paper can be used in other SHM application scenarios using smartphones. Further research on complex citizen behavior model, information transmission between citizens, frameworks of the city brain, and reinforcement learning will be carried out in the future.

Author Contributions

Conceptualization, X.Z., H.L., W.L. and X.C.; methodology, X.Z., Z.H.; software, H.L., H.C. and B.W.; validation, X.C.; investigation, H.L., X.C., H.C., B.W., Z.Q., P.L. and S.L.; writing—original draft preparation, H.L., X.C., H.C. and W.L.; writing—review and editing, H.L., W.L. and X.Z.; visualization, X.C, H.C., B.W.; supervision, X.Z., W.L. All authors have read and agreed to the published version of the manuscript.

Funding

This research was funded by National key research & development programs of China “strategic international cooperation in scientific and technological innovation” key special project of 2016 annual project, grant number 2016YFE0202400, and by National Social Science Foundation of China, grant number 19BZZ043.

Institutional Review Board Statement

Not applicable.

Informed Consent Statement

Not applicable.

Data Availability Statement

Not applicable.

Conflicts of Interest

The authors declare no conflict of interest.

References

  1. Raghunandan, M.; Liel, A.B.; Luco, N. Aftershock collapse vulnerability assessment of reinforced concrete frame structures. Earthq. Eng. Struct. Dyn. 2015, 44, 419–439. [Google Scholar] [CrossRef]
  2. Spencer, B.F. Opportunities and challenges for smart sensing technology. In Proceedings of the 1st International Conference on Structural Health Monitoring and Intelligent Infrastructure, Tokyo, Japan, 13–15 November 2003. [Google Scholar]
  3. Farrar, C.R.; Worden, K. An introduction to structural health monitoring. Philos. Trans. R. Soc. A Math. Phys. Eng. Sci. 2007, 365, 303–315. [Google Scholar] [CrossRef] [PubMed]
  4. Ozer, E.; Feng, M.Q.; Feng, D. Citizen Sensors for SHM: Towards a Crowdsourcing Platform. Sensors 2015, 15, 14591–14614. [Google Scholar] [CrossRef] [PubMed]
  5. Can, Z.; Demirbas, M. Smartphone-based data collection from wireless sensor networks in an urban environment. J. Netw. Comput. Appl. 2015, 58, 208–216. [Google Scholar] [CrossRef]
  6. Yu, Y.; Zhao, X.; Ou, J. A new idea: Mobile structural health monitoring using Smart phones. In Proceedings of the 2012 Third International Conference on Intelligent Control and Information Processing, Dalian, China, 15–17 July 2012. [Google Scholar]
  7. Dashti, S.; Reilly, J.; Bray, J.D.; Bayen, A.; Glaser, S.; Mari, E.; Bray, P.J. iShake: Using Personal Devices to Deliver Rapid Semi-Qualitative Earthquake Shaking Information; GeoEngineering Report; Department of Civil and Environment Engineering, University of California: Berkeley, CA, USA, 2011. [Google Scholar]
  8. Vittorio, A.; Rosolino, V.; Teresa, I.; Vittoria, C.M.; Vincenzo, P.G. Automated sensing system for monitoring of road surface quality by mobile devices. Procedia-Soc. Behav. Sci. 2014, 111, 242–251. [Google Scholar] [CrossRef] [Green Version]
  9. Zhao, X.; Han, R.; Ding, Y.; Yu, Y.; Guan, Q.; Hu, W.; Li, M.; Ou, J. Portable and convenient cable force measurement using smartphone. J. Civ. Struct. Health Monit. 2015, 5, 481–491. [Google Scholar] [CrossRef]
  10. Shrestha, A.; Dang, J.; Wang, X. Development of a smart-device-based vibration-measurement system: Effectiveness examination and application cases to existing structure. Struct. Control Health Monit. 2018, 25, e2120. [Google Scholar] [CrossRef]
  11. Jo, B.-W.; Lee, Y.-S.; Jo, J.H.; Khan, R.M.A. Computer Vision-Based Bridge Displacement Measurements Using Rotation-Invariant Image Processing Technique. Sustainability 2018, 10, 1785. [Google Scholar] [CrossRef] [Green Version]
  12. Zhang, Y.; Zhao, X.; Liu, P. Multi-Point Displacement Monitoring Based on Full Convolutional Neural Network and Smartphone. Ieee Access 2019, 7, 139628–139634. [Google Scholar] [CrossRef]
  13. Li, J.; Xie, B.; Zhao, X. Measuring the interstory drift of buildings by a smartphone using a feature point matching algorithm. Struct. Control Health Monit. 2020, 27, e2492. [Google Scholar] [CrossRef]
  14. Pan, B.; Qian, K.; Xie, H.; Asundi, A. Two-dimensional digital image correlation for in-plane displacement and strain measurement: A review. Meas. Sci. Technol. 2009, 20, 062001. [Google Scholar] [CrossRef]
  15. Pan, B. Digital image correlation for surface deformation measurement: Historical developments, recent advances and future goals. Meas. Sci. Technol. 2018, 29, 082001. [Google Scholar] [CrossRef]
  16. Xie, B.; Chen, X.; Ding, M.; Zhou, G.; Zhao, X. Design and development of a new strain measuring method based on smartphone and machine vision. Measurement 2021, 182, 109724. [Google Scholar] [CrossRef]
  17. Oraczewski, T.; Staszewski, W.J.; Uhl, T. Nonlinear acoustics for structural health monitoring using mobile, wireless and smartphone-based transducer platform. J. Intell. Mater. Syst. Struct. 2016, 27, 786–796. [Google Scholar] [CrossRef]
  18. Wang, N.; Zhao, X.; Zhao, P.; Zhang, Y.; Zou, Z.; Ou, J. Automatic damage detection of historic masonry buildings based on mobile deep learning. Autom. Constr. 2019, 103, 53–66. [Google Scholar] [CrossRef]
  19. Ruggieri, S.; Cardellicchio, A.; Leggieri, V.; Uva, G. Machine-learning based vulnerability analysis of existing buildings. Autom. Constr 2021, 132, 103936. [Google Scholar] [CrossRef]
  20. Li, J.; Zhao, X.; Zhou, G.; Zhang, M. Standardized use inspection of workers’ personal protective equipment based on deep learning. Saf. Sci. 2022, 150, 105689. [Google Scholar] [CrossRef]
  21. Akhavian, R.; Behzadan, A.H. Smartphone-based construction workers’ activity recognition and classification. Autom. Constr. 2016, 71, 198–209. [Google Scholar] [CrossRef]
  22. Genders, W.; Wang, J.; Razavi, S. Smartphone construction safety awareness system: A cyber-physical system approach. In Proceedings of the 16th International Conference on Computing in Civil and Building Engineering (ICCCBE2016), Osaka, Japan, 6–8 July 2016. [Google Scholar]
  23. Han, R.; Zhao, X.; Yu, Y.; Guan, Q.; Hu, W.; Li, M. A Cyber-Physical System for Girder Hoisting Monitoring Based on Smartphones. Sensors 2016, 16, 1048. [Google Scholar] [CrossRef] [Green Version]
  24. Dzeng, R.-J.; Fang, Y.-C.; Chen, I.C. A feasibility study of using smartphone built-in accelerometers to detect fall portents. Autom. Constr. 2014, 38, 74–86. [Google Scholar] [CrossRef]
  25. BMW Applies Real-Time 3D to Autonomous Driving. Available online: https://unity.cn/madewithunity/bmw (accessed on 11 March 2022).
  26. VR Reduces Risk and Improves Operator Safety. Available online: https://unity.cn/madewithunity/skanska (accessed on 11 March 2022).
  27. Mixed Reality Surgical Training with the VirtaMed LaparoS Simulator. Available online: https://blog.unity.com/manufacturing/mixed-reality-surgical-training-with-the-virtamed-laparos-simulator (accessed on 11 March 2022).
  28. HTX Labs uses Unreal Engine to Develop Immersive VR Training Simulations. Available online: https://www.unrealengine.com/zh-CN/spotlights/htx-labs-delivers-immersive-vr-training-simulations-using-unreal-engine (accessed on 11 March 2022).
  29. Raising the Next Generation of Biologists with a Virtual Lab. Available online: https://www.unrealengine.com/zh-CN/spotlights/virtual-lab-ushers-in-next-generation-of-biologists (accessed on 11 March 2022).
  30. Miranda, E. Approximate seismic lateral deformation demands in multistory buildings. J. Struct. Eng. 1999, 125, 417–425. [Google Scholar] [CrossRef]
  31. Xiong, C.; Lu, X.Z.; Guan, H.; Xu, Z. A nonlinear computational model for regional seismic simulation of tall buildings. Bull. Earthq. Eng. 2016, 14, 1047–1069. [Google Scholar] [CrossRef]
  32. PEER Ground Motion Database. Available online: https://ngawest2.berkeley.edu/ (accessed on 6 April 2022).
  33. Agis, R.A.; Gottifredi, S.; Garcia, A.J. An event-driven behavior trees extension to facilitate non-player multi-agent coordination in video games. Expert Syst. Appl. 2020, 155, 113457. [Google Scholar] [CrossRef]
  34. Vukobratović, V.; Ruggieri, S. Floor Acceleration Demands in a Twelve-Storey RC Shear Wall Building. Buildings 2021, 11, 38. [Google Scholar] [CrossRef]
Figure 1. Arrangement of smartphones.
Buildings 12 00492 g001
Figure 2. City model—Sweet Well City: (a) overview; (b) close-up; (c) third-person perspective of a citizen.
Buildings 12 00492 g002
Figure 3. Five types of buildings in the Unity scene: (a) HomeType1; (b) HomeType2; (c) HomeType3; (d) CompanyType1; (e) CompanyType2.
Buildings 12 00492 g003
Figure 4. Ground Eye GUI.
Buildings 12 00492 g004
Figure 5. Realization of taking photos.
Buildings 12 00492 g005
Figure 6. Five types of structures in the scene of Unity: (a) 2 × 1 × 2 frame; (b) 3 × 2 × 3 frame; (c) 3 × 2 × 5 frame; (d) 6 × 2 × 9 frame; (e) 4 × 3 × 6 frame.
Buildings 12 00492 g006aBuildings 12 00492 g006b
Figure 7. (a) Map of Sweet Well City; (b) distribution of citizens in the refuge site at different moments; (c) distribution of citizens around CompanyType1-1.
Buildings 12 00492 g007aBuildings 12 00492 g007b
Figure 8. Routes of three representative citizens performing different tasks (a) taking photos; (b) monitoring; (c) without a task; (d) all three citizens.
Buildings 12 00492 g008aBuildings 12 00492 g008b
Figure 9. Number of citizens with different tasks.
Buildings 12 00492 g009
Figure 10. Time-history curves during the aftershock measured by citizens: (a) element strain of CompanyType1-1; (b) element strain of CompanyType2-1; (c) inter-story drift of CompanyType1-1; (d) inter-story drift of CompanyType2-1; (e) node acceleration of CompanyType1-1; (f) node acceleration of CompanyType2-1.
Buildings 12 00492 g010
Table 1. Residential building information.
TypeNumberSize
HomeType1147.3 × 4.0 × 7.3 m3
HomeType2257.3 × 5.5 × 10.1 m3
HomeType3286.4 × 3.0 × 18.3 m3
Table 2. Office building information.
TypeNumberSize
CompanyType1343.9 × 14.6 × 30.2 m3
CompanyType2830.5 × 14.6 × 29.3 m3
Table 3. Structural response parameters at different stages.
TimelineResponse Parameters
During the Main ShockMax. Inter-story Drift (Estimation)
After the Main ShockResidual Inter-story Drift
Element Residual Strain
During the AftershockMax. Inter-story Drift
Max. Node Acceleration
Max. Element Strain
After the AftershockResidual Inter-story Drift
Element Residual Strain
Table 4. Response values that are assumed to be measured by citizens.
ParameterCompanyType1-1CompanyType2-1
Main shockResidual inter-story drift1.06 × 10−57.28 × 10⁻⁶
Residual element strain−1 × 10⁻⁶−1 × 10⁻⁶
AftershockMax. inter-story drift−8.12 × 10⁻⁴−7.50 × 10⁻⁴
Max. node acceleration (cm/s2)−17.5221.61
Max. element strain −1.46 × 10−56.80 × 10−6
Residual inter-story drift1.06 × 10−57.44 × 10⁻⁶
Residual element strain −1 × 10⁻⁶−1 × 10⁻⁶
Publisher’s Note: MDPI stays neutral with regard to jurisdictional claims in published maps and institutional affiliations.

