Article

A Simplified Thermal Comfort Calculation Method of Radiant Floor Cooling Technology for Office Buildings in Northern China

1
School of Thermal Engineering, Shandong Jianzhu University, Jinan 250101, China
2
School of Architecture and Urban Planning, Shandong Jianzhu University, Jinan 250101, China
*
Authors to whom correspondence should be addressed.
First two authors contributed equally to this paper and should be considered co-first authors.
Buildings 2022, 12(4), 483; https://doi.org/10.3390/buildings12040483
Submission received: 1 March 2022 / Revised: 8 April 2022 / Accepted: 11 April 2022 / Published: 13 April 2022
(This article belongs to the Special Issue Indoor Environmental Quality and Occupant Comfort)

Abstract

:
The increasing application of floor heating technology promotes the development of floor radiant cooling technology (abbreviated as FRC technology). Many office buildings in northern China try to use FRC technology to cool in summer, but thermal comfort is the key problem restricting the promotion of this technology. The thermal comfort problems of an office room with floor radiant cooling were studied in this paper by the methods of numerical simulation, control variable, and data fitting, and the experimental results were verified in multiple ways. It was found that, for an office room using floor radiant cooling, the effect of the floor surface temperature on thermal comfort was about 16%, while the effect of indoor air temperature was about 84%, and relative humidity had little effect on thermal comfort. A simplified thermal comfort calculation model was proposed, which could be used as an indicator to adjust the floor surface and indoor air temperature, or could be used to calculate the PMV-PPD value. The findings have guiding significance for the design and control of FRC technology.

1. Introduction

Under the background of creating a low-carbon, healthy, and comfortable building environment [1,2], floor radiant cooling technology (following abbreviation as FRC technology) has attracted more and more attention all over the world. Compared with typical all-air conditioning, FRC technology is feasible for high-temperature cooling to achieve the purpose of energy saving [3], and it can also effectively use natural energy, such as surface water (groundwater/soil) cold, to realize “free cooling” or zero carbon emissions [4]. Many buildings have combined FRC technology with convective air conditioning, and proposed a new type of radiation–convection air conditioning, which creates nearly zero-carbon-emission buildings [5,6]. However, the thermal comfort of the indoor thermal environment is the key problem, which is also the main factor restricting the development of FRC technology [7].
The concept of floor radiant cooling comes from floor radiant heating technology (following abbreviation as FRH technology). People try to use the same coil in the floor structure of heating in the winter to pass high-temperature chilled water to cool the indoor thermal environment in the summer [8]. FRH has gradually replaced the traditional cast-iron radiator and has been widely used in urban residential buildings in the cold areas of China [9] and other regions [10,11]. More and more practical engineering experience is feeding back the floor heating technology and forming a virtuous circle, which makes the FRH technology very developed and mature [12], and also stimulates research interest in the thermal comfort of floor heating. Garcia [13] explored the possibilities of using radiant floor heating systems (RFHS) in removable glazed enclosed patios from the optimal range of the predicted mean vote (PMV) and predicted percentage of dissatisfaction (PPD). Zhang et al. [14] proposed an external wall radiant heating technology in passive buildings, that is, a wall implanted with heat pipes that can improve the utilization of absorbed solar energy, in this way increasing the PMV value in the transition season and reducing the dissatisfaction rate of people. Cho et al. [15] evaluated the response time of the intermittent operation of PB-Model (polybutylene pipe) floor heating and CT-Model (capillary tube) floor heating with initial water supply temperatures of 55 °C and 40 °C by measuring the time taken for the initial indoor air temperature to rise by 4 °C, which provided a reference basis for the start-up time of the indoor thermal environment with a low temperature, but this theory is not suitable for continuous central heating. Karacavus and Aydin [16] selected the thermal comfort of an office environment as the research object and evaluated the compliance of the office’s general and local comfort levels with ISO 7730 [17]. The above thermal comfort analysis mainly focuses on the advantages of floor radiant heating, but when FRH technology is coupled with other heating methods, or when the floor receives solar radiation [18], it may also have the disadvantage of overheating [19], which can adversely affect thermal comfort. It can be seen that the indoor thermal comfort of rooms with FRH systems is good, and the advantages far outweigh the disadvantages. The indoor vertical temperature difference also meets the physiological functional requirements of “feet like heat and head like cool” [20,21]. This is also an important reason for the popularization and application of FRH technology.
Different from the heat-transfer process of floor heating, when the floor is used for cooling in the summer, the floor temperature is lower, and the human body has more exposed parts in the summer, so the traditional thermal comfort theory of floor heating is no longer suitable for floor cooling. Whether the vertical distribution of the indoor air temperature is contrary to the human body’s thermal feeling, whether the asymmetric radiation temperature will cause discomfort in the exposed part of the human body, and how the human body can tolerate the FRC system cannot copy the findings related to “floor heating”, which has stimulated extensive discussion and research. Zhang et al. [22] discussed the current application cases using FRC technology in China, and discussed the special characters and in relation to the topic of comfort and energy saving. Gu et al. [23] studied the thermal comfort of a conventional intermittently operating FRC system in hot and humid regions, and found that, when the system is subjected to sudden increases in the heat and moisture loads, a slow thermal response may occur. FRC systems are suitable for residential homes or offices with non-centralized air conditioning systems to handle transient heat and moisture load variations. The FRC system needs to be combined with other cooling or dehumidification systems to adapt to offices with non-centralized air conditioning systems to handle transient heat and moisture load variations. Du et al. [19] compared the thermal comfort of radiant cooling technology and convective air conditioning, and found that there is little practical difference in human subjective responses between the two systems in the continuous operating mode. Kwong et al. [24] subjectively and objectively evaluated the indoor thermal comfort of office buildings using a floor radiation and fresh air coupled cooling system, and found that the difference between the PMV and Actual Mean Vote (AMV) was greater than 0.5. Hu et al. [25] analyzed the intermittent operation of a radiant cooling system, and found that indoor comfort in the occupied period can be guaranteed with a reasonable pre-start time. Liu et al. [26] conducted a series of numerical simulations to evaluate the thermal comfort performance of a FRC system when combined with different ventilation systems, including mixed ventilation (MV), stratum ventilation (SV), displacement ventilation (DV), and ductless personalized ventilation (DPV). Most of the above analysis focuses on the deficiency of the thermal comfort of FRC systems and shows that the thermal comfort of a single FRC system is not up to the standard, which needs to be combined with other convection cooling ends to form a coupled cooling mode with complementary disadvantages.
To sum up, a large case of studies on floor heating have provided valuable practical experience and new methods for research on the thermal comfort problems of FRH and FRC systems, but still have several problems restricting the good thermal comfort of FRC systems to be solved. Existing researches on the thermal comfort of FRC systems were mainly based on the numerical simulation method [27], the human body sensation method (questionnaire survey method) [28], and the human body measurement method [29], and a few used the theoretical analysis method [30]. For the FRC system, the thermal comfort index is difficult to calculate and the contribution of the floor cooling end to thermal comfort is difficult to be evaluated for the following three reasons.
  • The floor surface cools the indoor thermal environment in two ways coupling convection and radiation, and the heat transfer process is very complex [31];
  • It is very complicated to calculate the radiation angular coefficient and average radiation temperature;
  • Lack of practical application feedback and fitting empirical formulas.
How to quantitatively find the influence of indoor environmental factors on thermal comfort has become the primary problem to be solved. For this research goal, the following issues will be focused on for research and discussion.
  • The effect of the changes of the main factors of the indoor thermal environment on the thermal comfort indicator in a room with floor cooling;
  • Quantitative evaluation of the contribution of the floor cooling end to indoor thermal environment comfort;
  • Finding a simplified calculation model of the thermal comfort indicator for FRC systems, which can be used to adjust the temperature value of the indoor thermal environment or calculate the value of the indoor thermal comfort indicator quickly.
The findings based on the thermal comfort evaluation indicator can provide a theoretical basis for the design of FRC systems and the control of the surface temperature of the floor cooling end.

2. Methods

2.1. Thermal Comfort Index and Influencing Factors

The Predicted Mean Vote (PMV) of human thermal comfort is a commonly used thermal comfort evaluation method in office buildings [32]. This method was first proposed by Fanger [33], and its calculation expression is:
P M V = 0.0303 exp 0.036 M + 0.0275 · f M ,   I c l ,   t a ,   γ , v a , θ m r t
where M is the metabolic rate of the human body and I c l is the thermal resistance of clothing. These two variables do not belong to the indoor thermal environment control variables. t a is the indoor air temperature, γ is the indoor relative humidity, v a is the air speed, and θ m r t is the average radiation temperature, which represents the radiation heat transfer of each inner surface of envelopes to the human body and the asymmetrical radiation. The above four variables are the indoor thermal environment variables and also the key variables for the quantitative analysis of PMV.
The PMV index is divided into 7 levels that quantify the human thermal sensation, as shown in Table 1. The recommended value of PMV is −0.5~+0.5 [34].
The PMV index also can be used to quantitatively evaluate the indoor thermal environment of office buildings in northern China, which use radiant floors for cooling in the summer. Considering the usage characteristics of office buildings, in the choice of PMV independent variable parameters, M takes the energy metabolism rate during sitting and I c l uniformly takes the thermal resistance of summer clothing, as shown in Table 2.
For the independent variable v a , different from the traditional convection air conditioner, in a room with a FRC system, fan coil units or displacement ventilation are usually used to deal with fresh air, and people are in the return air area. At this time, the floor cooling end bears most of the cooling load [36], and the cooling load provided by the fresh air is small, so the wind speed around the human body is very small (<0.1 m/s) and changing the air velocity between 0 and 0.1 m/s has little impact on the indoor air distribution and PMV [37], so v a can be set as a constant close to 0 m/s. For the average radiation temperature θ m r t , this parameter is the key variable affecting the thermal comfort of a radiant air-conditioned room; it is also the calculation difficulty of using Equation (1) to calculate PMV [38], and it has a functional relationship with the internal surface temperature of the floor, ceiling, window, and four walls, which can be written in the form of the k function as Equation (2).
θ m r t = k t s , t d , t c , t w 1 ~ 4 = t s 4 · F p s + t d 4 · F p d + t c 4 · F p c + t w 1 4 · F p w 1 + + t w 4 4 · F p w 4 4
where F p i is the angle factor between a person and surface i, t s is the surface temperature of the floor, t d is the inner surface temperature of the ceiling, t c is the inner surface temperature of the inner shading of the window, and t w 1 ~ 4 is the inner surface temperature of four walls (the outer and the inner walls) of a room, respectively.
Different from the large vertical temperature difference in a floor-heated room, there is no significant vertical temperature gradient in a room using floor cooling [39], which is because the thermal pressure movement of indoor air and the floor surface with a low temperature have the opposite effect on the inner surface temperature of the ceiling; the rising of hot air causes t d to increase, while the floor surface is facing the inner surface of the ceiling and is cooled by radiant heat transfer. These two aspects work together, resulting in uniform indoor air temperature; the vertical temperature gradient can be ignored. An office room is not a large-space building, the indoor space is limited, with the disturbance of personnel and air supply, and the inner surface temperature of each envelope is also restricted by the floor surface temperature t s and indoor air temperature t a , so the uncooled internal surface temperature has little difference. Variable t i can be used to represent t d , t c , t w 1 , t w 2 , t w 3 and t w 4 [5]. Equation (2) of variable θ m r t can be expressed as follows:
θ m r t = t s 4 · F p s + t i 4 · F p d + F p c + F p w 1 + + F p w 4 4
During the service time of office buildings from 9:00 to 17:00, t i can also be expressed as a function q related only to the internal disturbance t s and t a [5], as follows:
t i = q t s , t a
Combining Equations (3) and (4), θ m r t can be considered as the dependent variable of indoor air temperature t a and floor surface temperature t s , which can be expressed in the form of the h function, as shown as Equation (5).
θ m r t = k t s , t i = k t s , q t s , t a = h t a , t s
Through the above variable analysis and substituting Equation (5) into Equation (1), the functional expression of PMV can be written in the form of the following g function, as follows.
P M V = A · f t a , γ , θ m r t = A · f t a , γ , h t a , t s = g t a , t s , γ
where A is a constant that can be calculated from 0.0303 exp 0.036 M + 0.0275 .
From Equation (6), PMV can be expressed as a dependent variable, with only the air temperature t a , floor surface temperature t s , and relative humidity γ as the independent variables. The expression of PMV can be obtained by solving Equation (6).
To solve the function with few independent variables, the controlled variable method is a commonly used method. This method can keep other parameters unchanged and study the relationship between a single independent variable and the dependent variable.

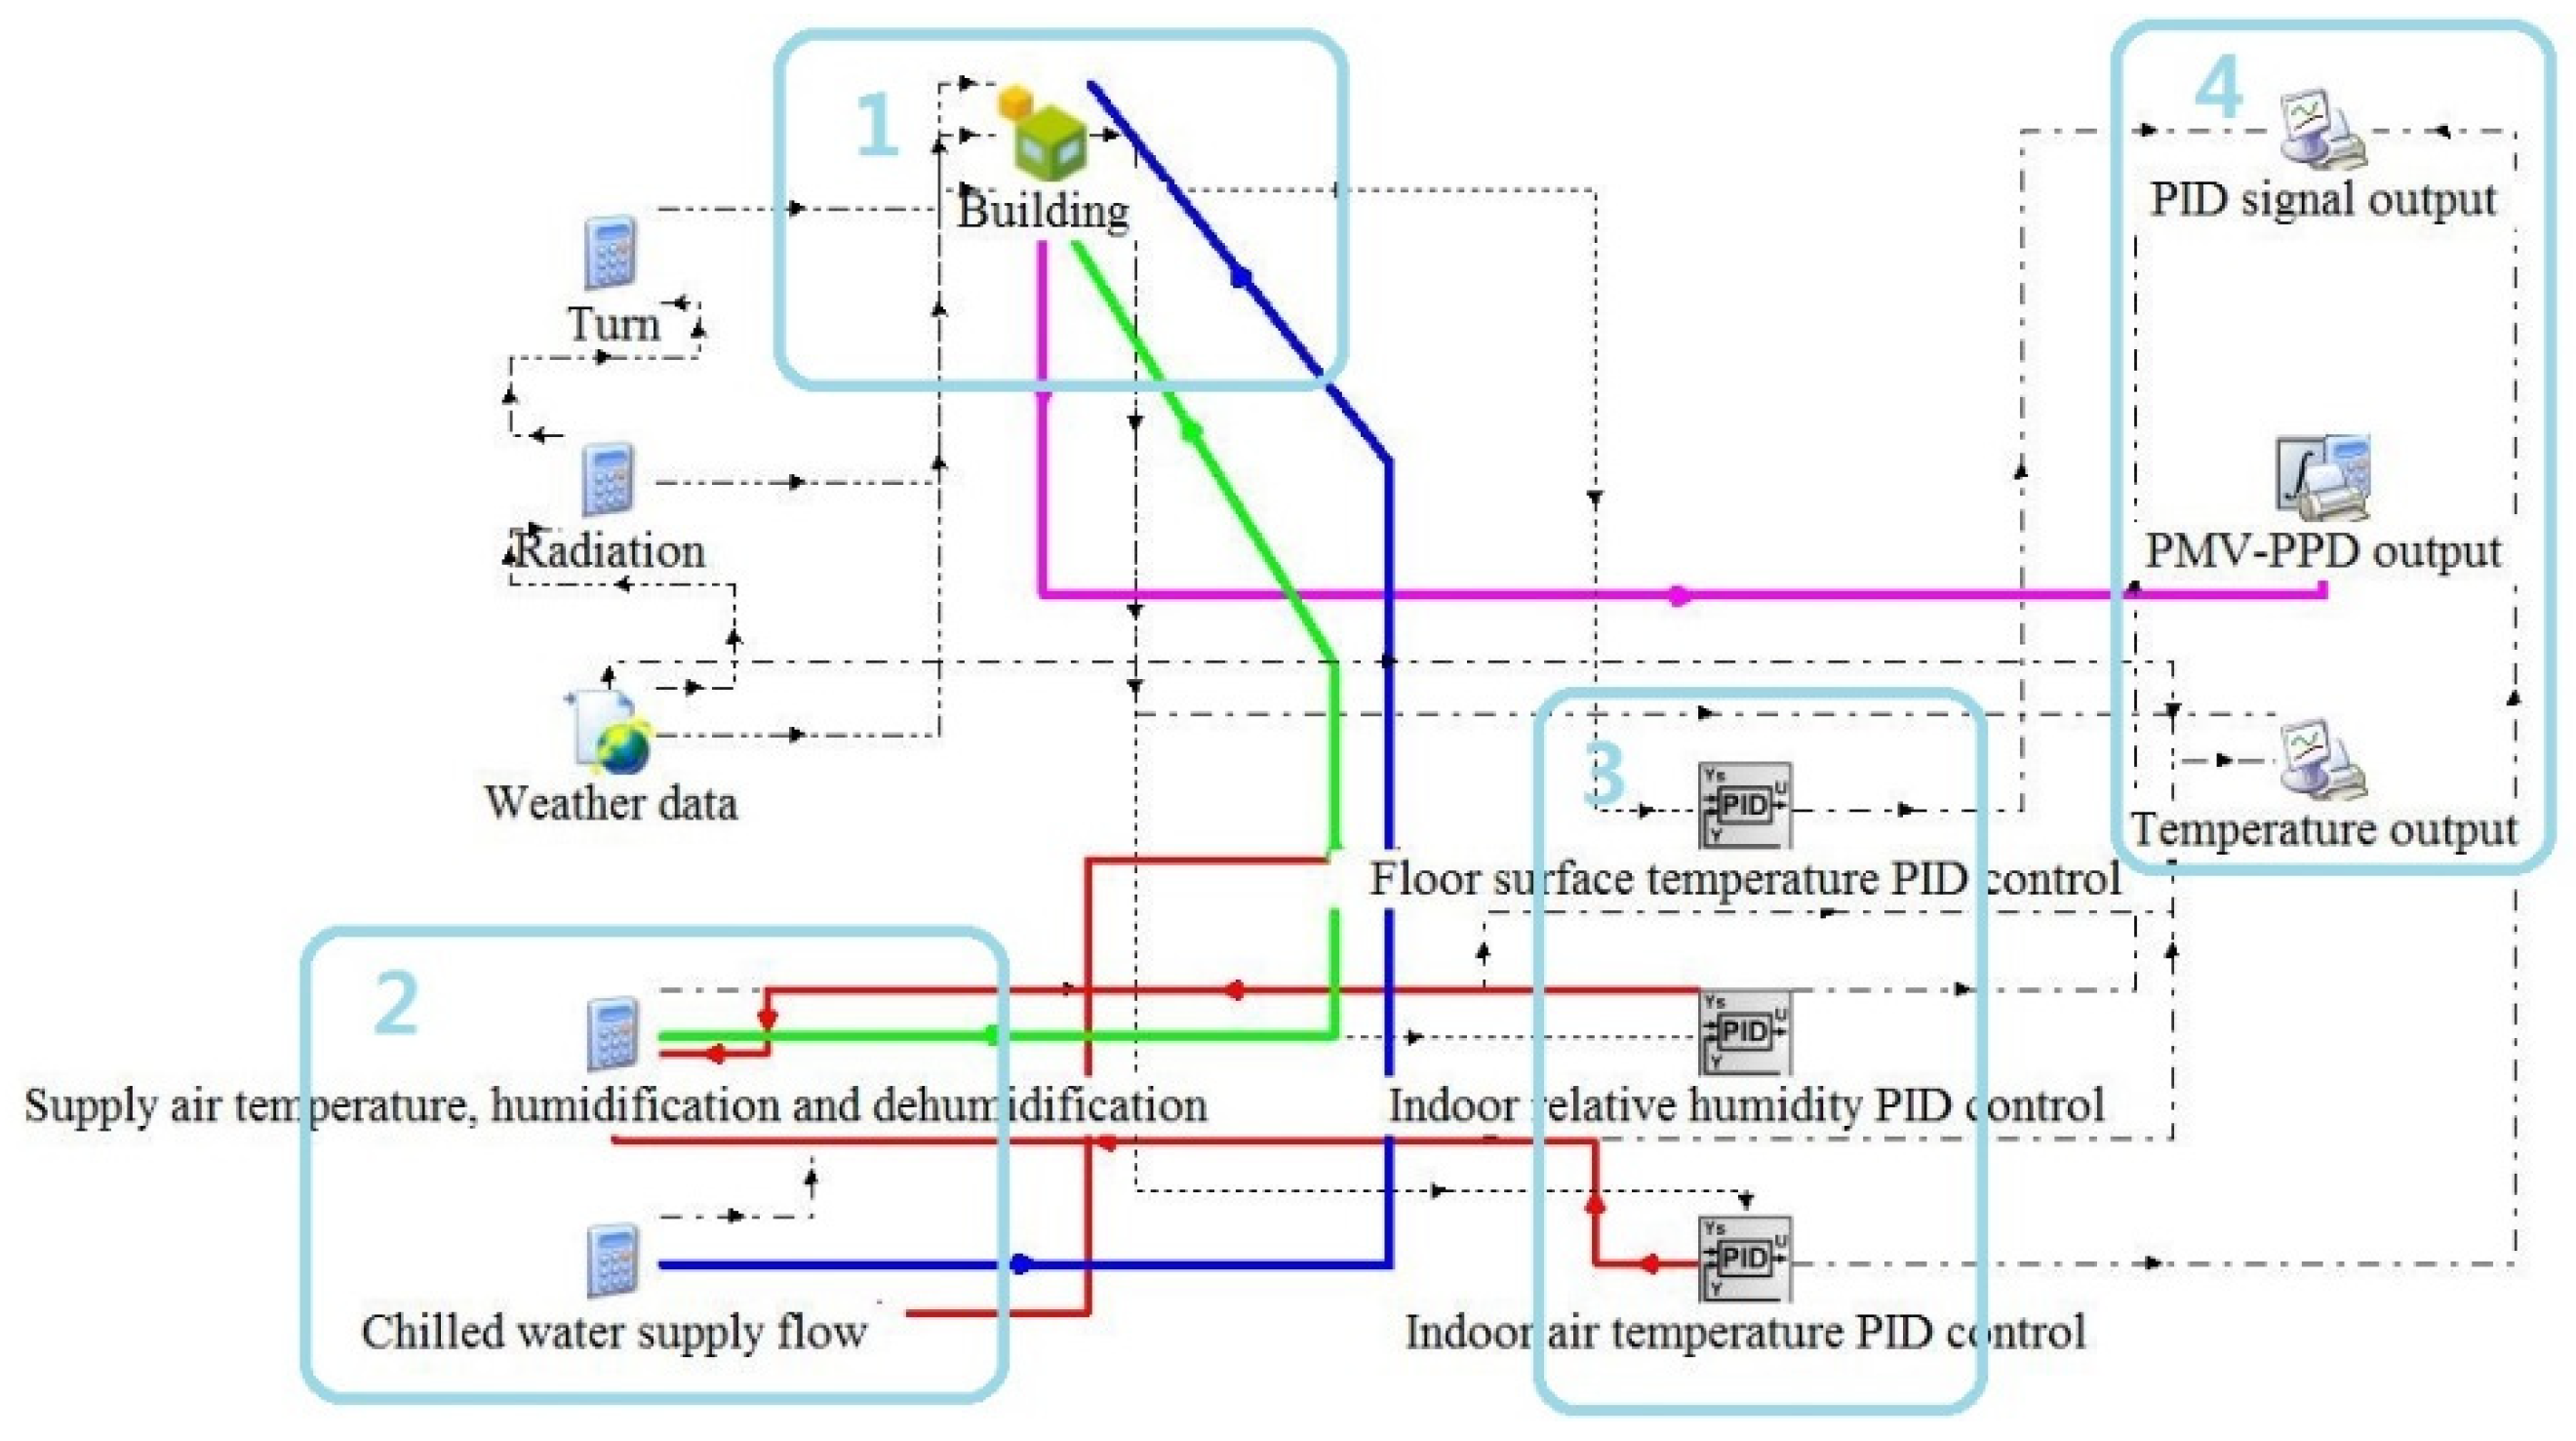
2.2. Numerical Simulation Methods

Numerical simulation is a good method for variable control analysis and finding the relationship between variables due to its flexibility, rapidity, and controllability. In this study, the TRNSYS (Transient System Simulation Program) [40] is used as the simulation software to discuss the relationships between three independent variables ( t s , t a , and γ ) and PMV in turn, and try to solve function g . The TRNSYS is an extremely flexible, visualized, and modularized transient process simulation software, which is mainly used to simulate the energy systems of buildings, especially radiant ceiling cooling systems and FRC technology, and can also be used to research the thermal comfort problems of PMV-PPD [3,40].
An original scale model of an office room in northern China was established in TRNBuild, and two cooling ends of the floor surface and fresh air were established in TRNSYS, as shown in Figure 1.
Figure 1 is mainly divided into four parts, and the key summary of numerical simulation is described as follows.
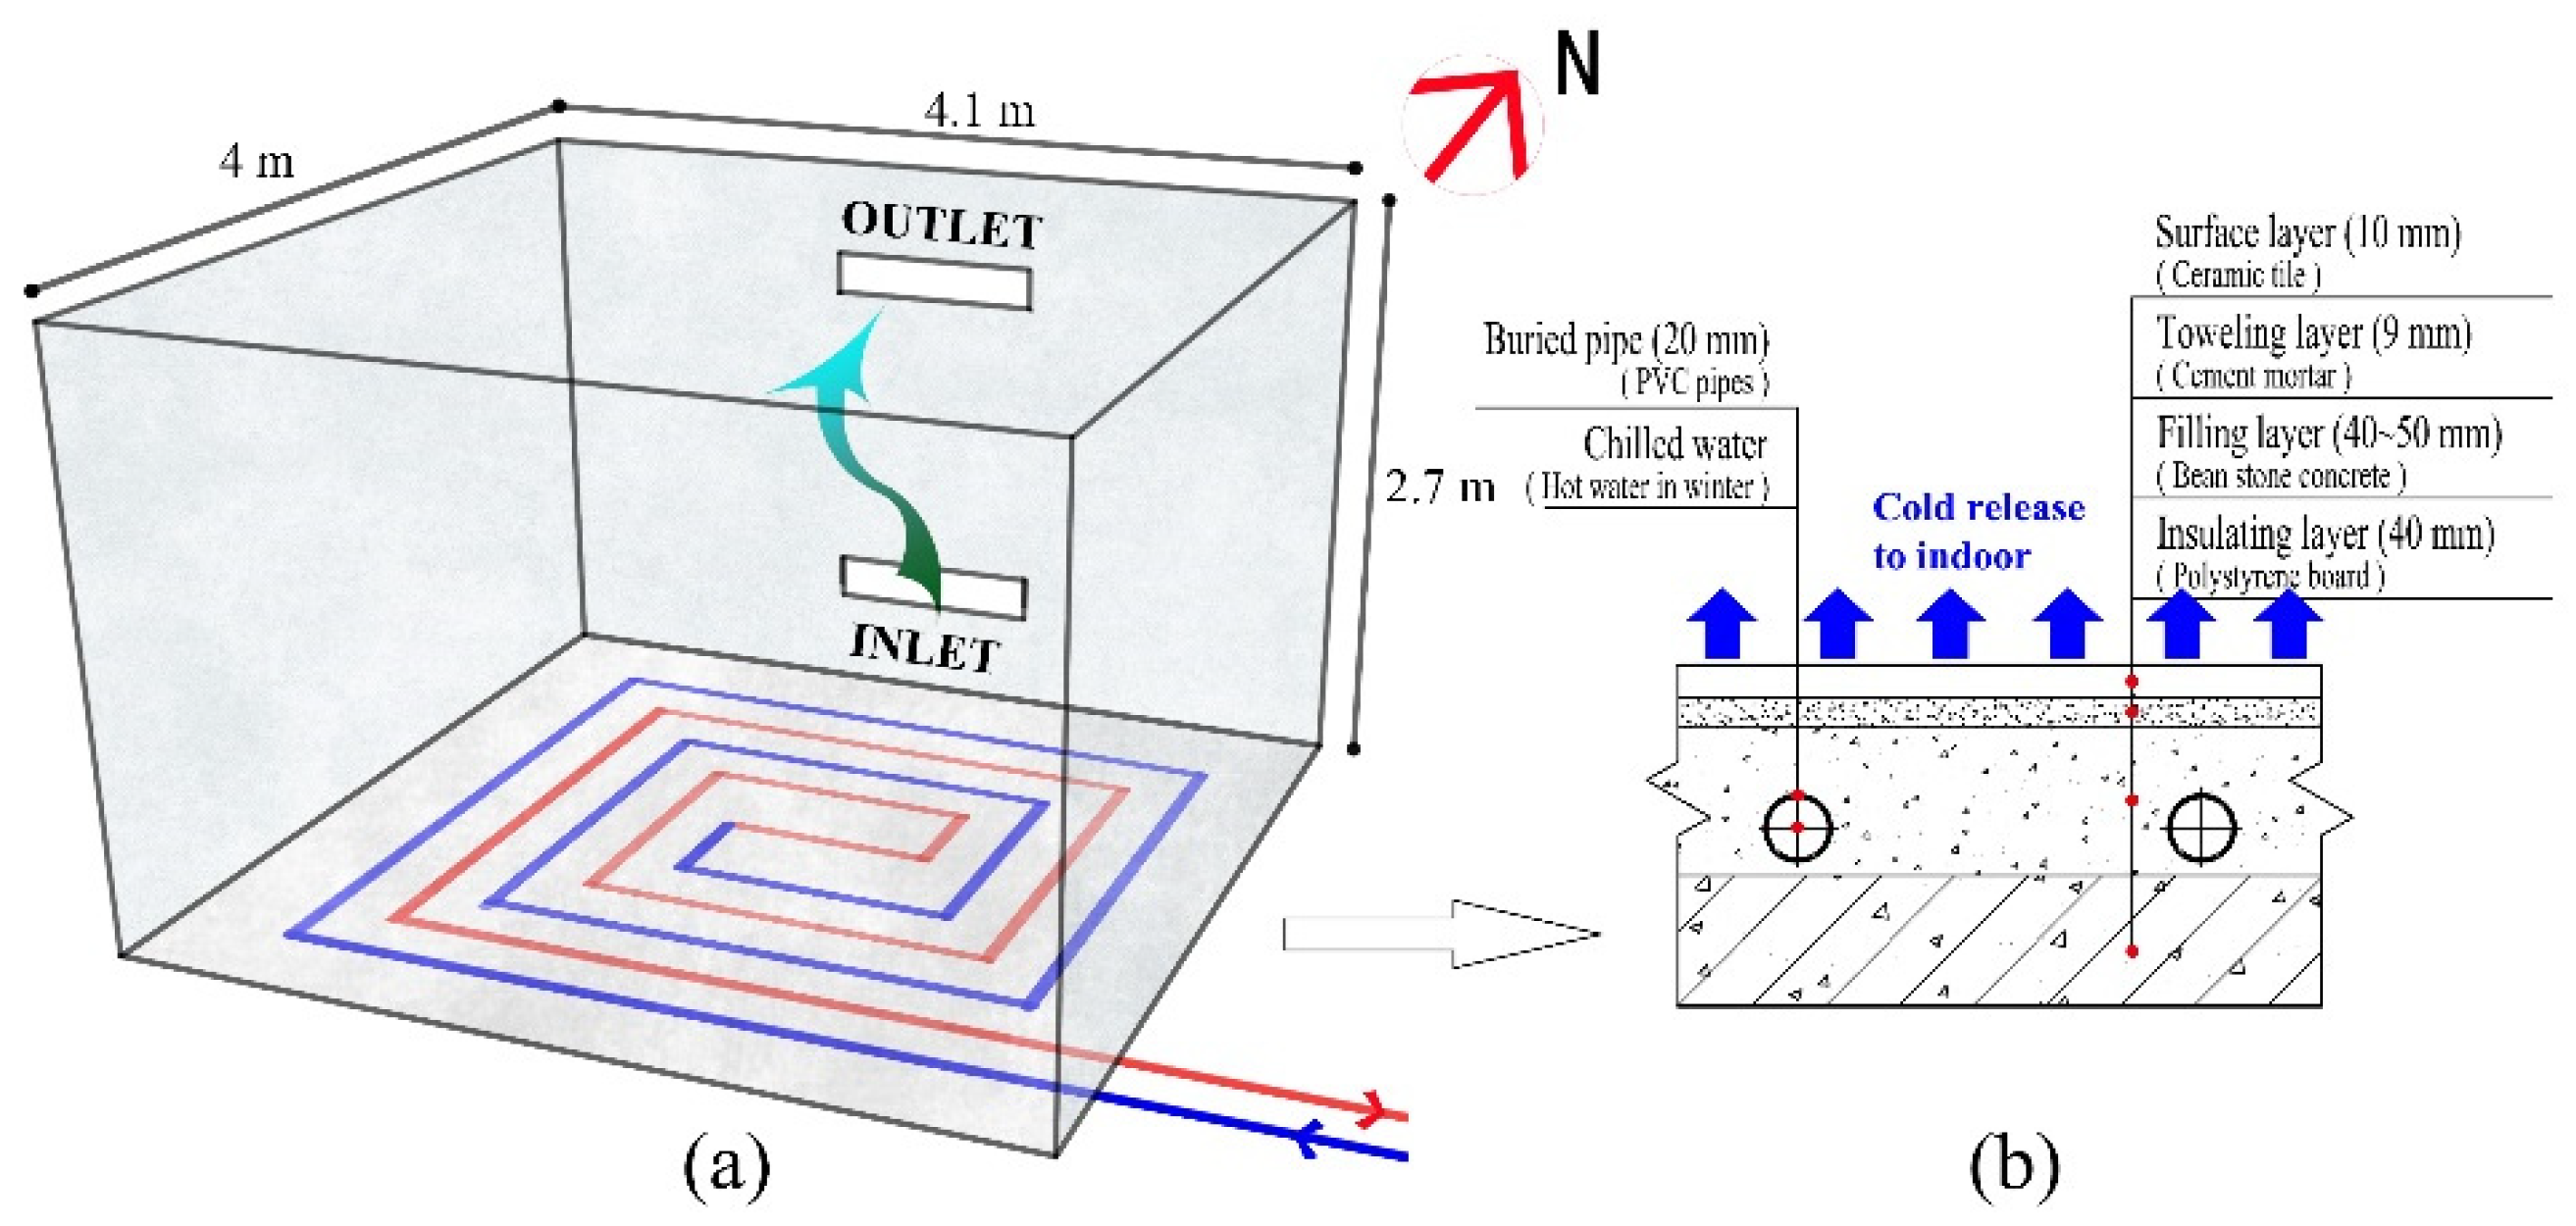
  • Room model and two cooling ends (Part 1):
A typical office building in Jinan, China, was selected as the actual physical model, and the room size, buried pipe arrangement form, and floor structure are shown in Figure 2. Jinan is a cold region with the characteristics of a hot summer and cold winter. The office room belongs to the public buildings, its envelope structure parameters need to meet Table 3, and it faces south–north. The heat transfer coefficient of building envelopes is 0.45 W / m 2 K [41], and they have great thermal inertia. Because the office buildings in northern areas have winter heating needs, the exterior walls are usually equipped with external insulation. The room has good insulation performance, good internal shading performance, and the ability to resist climate changes from the outdoor environment.
The setting of floor structure of floor heating or cooling does not use a certain module of the TRNSYS, although the TRNSYS is a modular simulation software [42]; the setting is completed in Part 1 (TRNBuild). Heating/cooling pipes are laid in the floor structure of a room, as shown in Figure 2. Chilled water is passed through the laying pipes for floor cooling, and the room also uses fresh air to cool the indoor environment together in the summer.
  • Control of the indoor thermal environment (Part 2 and Part 3):
The cooling system has three PID controls, which respectively control the floor surface temperature t s , indoor air temperature t a , and indoor relative humidity γ . The floor surface temperature is controlled by chilled water variable flow regulation, and the indoor temperature is controlled by variable air supply temperature regulation. In practice, variable flow regulation can also be used to control the indoor air temperature. For the control of the relative humidity of indoor air, humidification and dehumidification are both allowed. The accuracy of the floor surface temperature and indoor air temperature can be controlled within ±0.05 °C, and the accuracy of the indoor relative humidity can be controlled within ±0.1%.
  • Results output (Part 4):
Part 4 is the results output part, which shows the values of the PMV-PPD indicators of people in the room and the values of each temperature index of the indoor thermal environment. It is also necessary to output the PID control signal (0~1) because the PID control parameters need to be continuously adjusted according to the changes in the PID signal, and finally determine the PID control capability range in Part 2 and Part 3.
  • Outdoor environmental meteorological parameters:
The typical daytime climate parameters of Jinan in the summer are selected as the outdoor climate changes.
  • Work schedule:
The working schedule of people in office buildings is generally from 9:00 to 17:00.

3. Results and Discussions

3.1. Solution of PMV

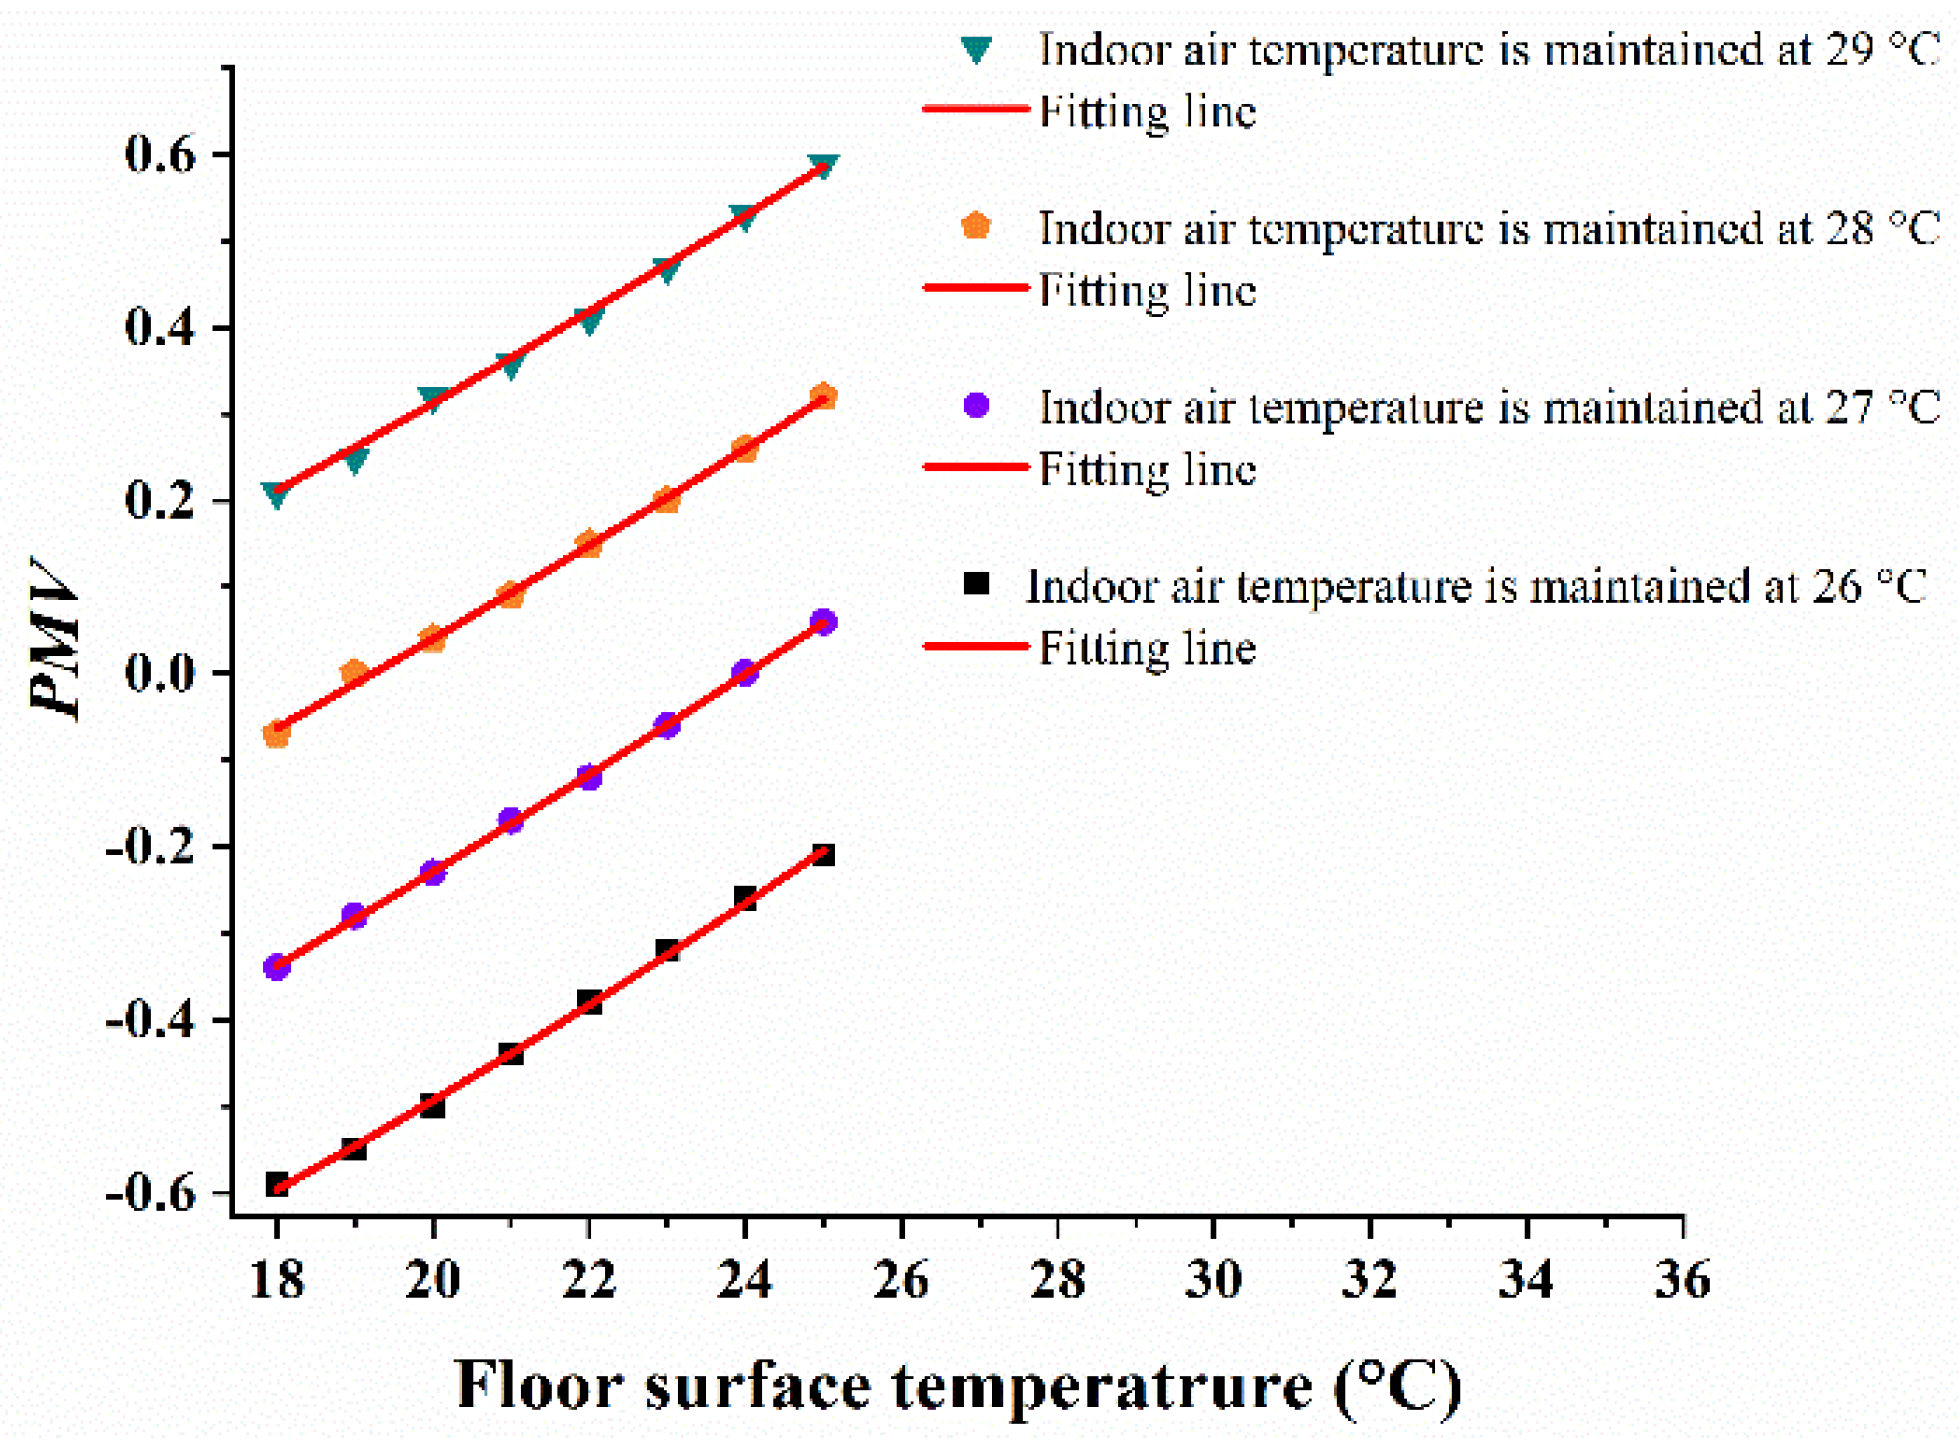
3.1.1. Effect of Floor Surface Temperature Changes on PMV

In rooms using radiant floors to cool, people usually set the indoor air temperature above 26 °C, but not higher than 29 °C, in the summer [41]. The surface temperature of the floor varies widely, and it can range from 18 °C to 25 °C (condensation is not considered in this paper). The indoor relative humidity is generally about 50% [43].
Using PID control to maintain the indoor relative humidity at 50% and to maintain the indoor air temperature at 26 °C, 27 °C, 28 °C, and 29 °C, the variation law of PMV with the floor surface temperature can be obtained by changing the floor surface temperature every 1 °C from 18 °C to 25 °C, as shown in Table 4.
From Table 4, it can be seen that the PMV increases monotonically with the increase in the floor surface temperature when the indoor air temperature remains constant, which indicates that people’s warm feeling increases.
When the indoor air temperature was at 26 °C, all of the PMVs were negative values, no matter how the floor surface temperature changed, which meant that the indoor air temperature was too low. When the indoor air temperature was at 29 °C, all of the PMVs were positive values, no matter how the floor surface temperature changed, which meant that the indoor air temperature was too high and the single floor radiant cooling end gad the problem of insufficient cooling capacity; thus, it needs to cooperate with other cooling ways to reduce the indoor air temperature. When the indoor air temperatures were 27 °C and 28 °C, the PMV values changed from negative to positive with the temperature rise of the floor’s surface.
As described above, the indoor air temperature of the room using FRC technology should be maintained at 27~28 °C. In the design of coupled cooling of floor radiation and fresh air, the indoor design temperature should be 1~2 °C higher than that of traditional convection air conditioning.
The finding is consistent with the results in [44,45], which proves the reliability and accuracy of the parameter setting of the numerical calculations.

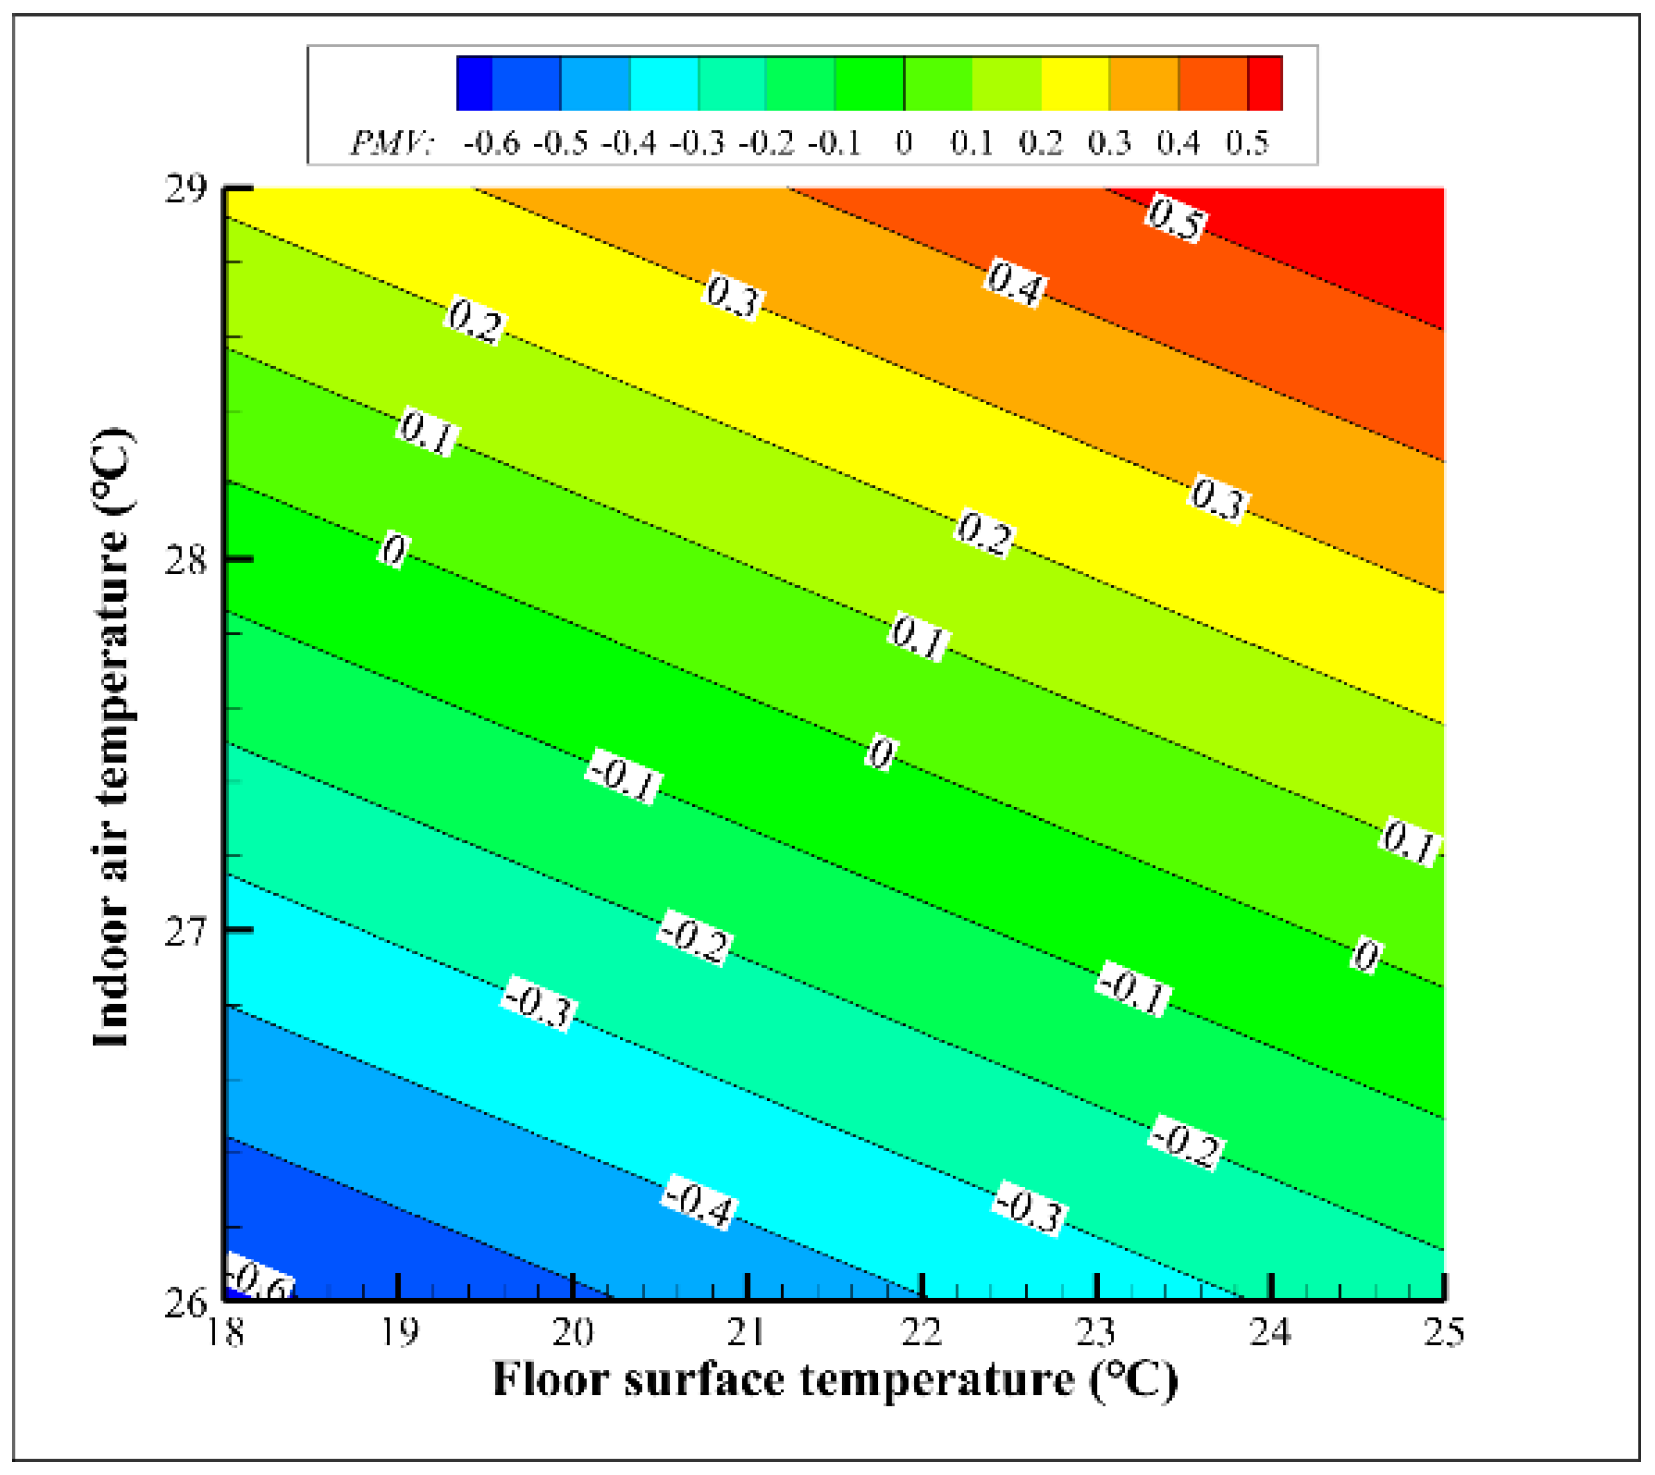
3.1.2. Simplified Calculation Model of PMV

In order to find the functional relationship between t s and PMV, the least-square method was used to fit the sample data in Table 4, as shown in Figure 3.
It can be seen from Figure 3 that t s and PMV are linear, and the relationship of each function is as follows.
When the indoor air temperature is 29 °C, the relational formula is
P M V = 0.0543 t s 0.7746
When the indoor air temperature is 28 °C, the relational formula is
P M V = 0.0544 t s 1.0460
When the indoor air temperature is 27 °C, the relational formula is
P M V = 0.0567 t s 1.3608
When the indoor air temperature at 26 °C, the relational formula is
P M V   = 0 . 0561 t s 1.6118
The coefficient of determination R2 is often used as an index to comprehensively measure the goodness of fit of a regression equation to sample observations, and its value range is 0 to 1—the closer to 1, the better the fit [46]. The determination coefficients R2 of the above Equations (7)–(10) were all above 0.99, and the degree of fitting was very high. By observing Figure 3, it can be found that the slope of Equations (7)–(10) is almost equal, and the intercept is also linearly related to the indoor air temperature t a . Based on this law, a function expression of PMV with the floor surface temperature t s and indoor air temperature t a can be obtained by combining the above four formulas:
P M V = g t s , t a , 50 % = 0.2826 t a + 5.5375 × 10 2 t s 8.9709 t a 26 , 29 ,   t s 18 , 25
As can be seen from Equation (11), PMV has a power relation with t a and t s . The coefficient before t s is 5.5375 × 10 2 , while the coefficient before t a is 0.2826 . t a and t s are both the parameters characterizing temperature (the unit is °C), and both are positive. The former coefficients of t a and t s can be used for weighting the calculation to represent the effect on the PMV. The coefficient weighted calculation shows that the effect of t s on the PMV is only 16%, while the influence of t a on PMV is about 84%. The effect of t a on PMV is much greater than that of t s . The effect of the floor surface temperature on PMV is only about one-fifth of the indoor air temperature.
The results indicate that the indoor air temperature plays a leading role in PMV. For FRC technology, people are less sensitive to changes in the floor surface temperature, but more sensitive to indoor air temperature. The PMV changed by only about 0.055 for every 1 °C change in the floor surface temperature, and about 0.28 for every 1 °C change in the indoor air temperature.
Equation (11) can realize the following two functions:
(1).
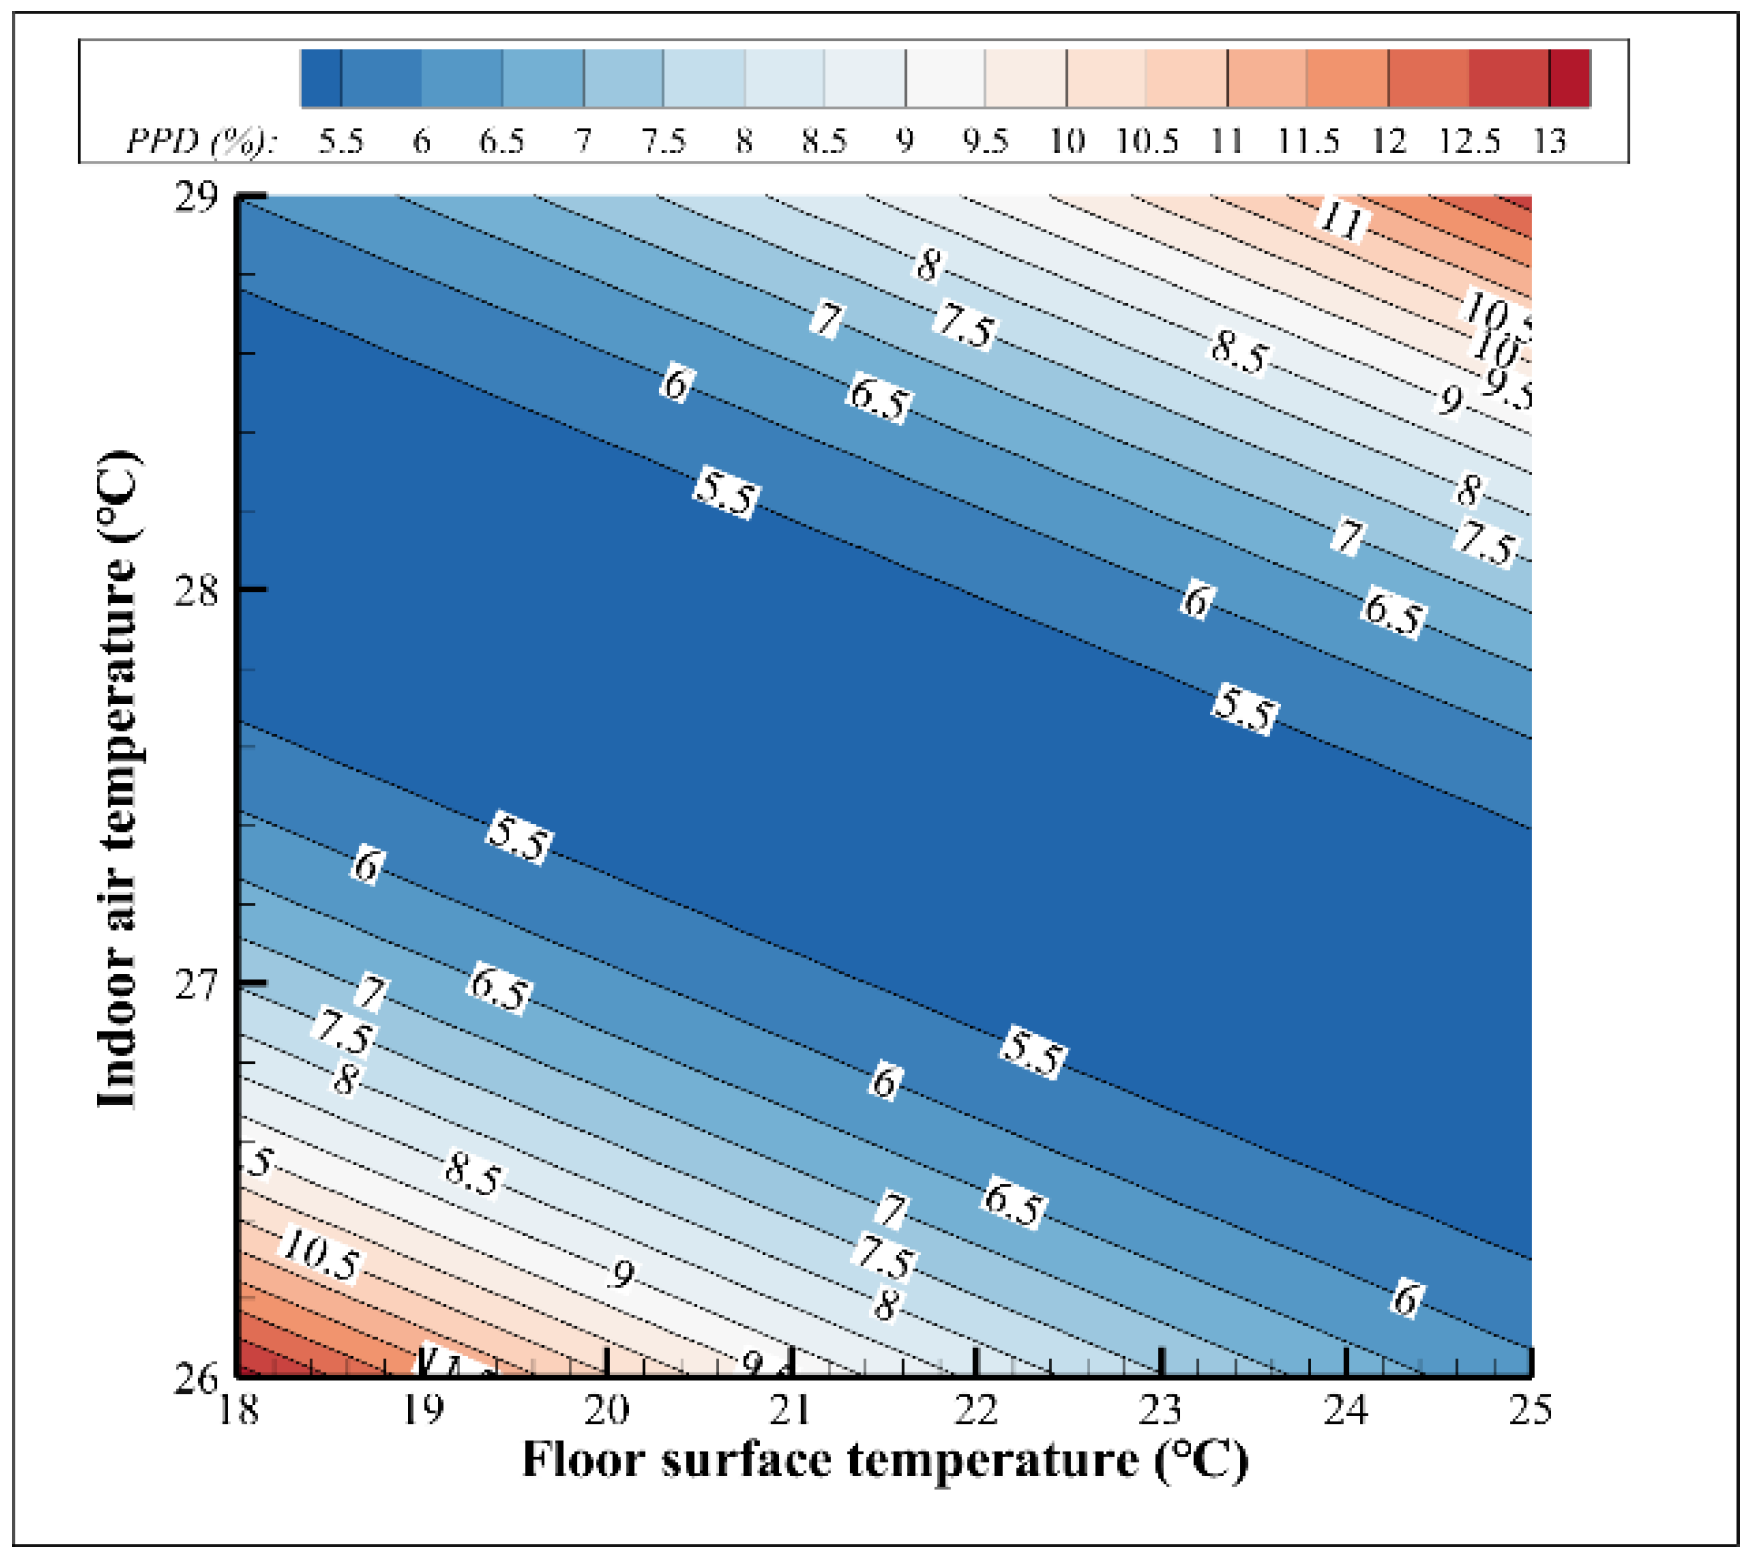
In the room using FRC technology, using Equation (11), the current PMV value can be calculated according to the current floor surface temperature and indoor air temperature so as to monitor the indoor thermal environment. The PMV value can also be obtained by referring to Figure 4.
(2).
Equation (11) or Figure 4 can be used as a theoretical basis for regulating the floor surface temperature or indoor air temperature in a room using FRC technology, and can also be used to control the floor surface temperature and indoor air temperature to achieve the desired PMV.

3.2. Solution of PPD and Verification of Numerical Simulation

3.2.1. Solution of PPD

The PMV index represents the feelings of most people in the same environment, but there are physiological differences between people, so the PMV index does not necessarily represent the feelings of all people. For this, Fanger [47] proposed the predicted percent dissatisfied (PPD) index to indicate the dissatisfaction rate of the population with the thermal environment, and gave the quantitative relationship between PPD and PMV by the probability analysis method. PPD has the following relationship with PMV [48]:
P P D = 100 95 · exp 0.2179 P M V 2 0.03353 P M V 4
Bring Equation (11) into Equation (12). The visual relationship between the PPD and indoor air temperature t a and floor surface temperature t s is shown in Figure 5.
It can be seen from Figure 5 that the relationship between PPD and two temperature variables ( t a and t s ) is also a group of parallel lines. When the floor surface temperature and indoor air temperature are extremely distributed (both very high or low), the PPD value is large. When the floor surface temperature and indoor air temperature are extremely distributed (both high or low), the PPD value is large. Only by maintaining the dynamic balance between t a and t s can the PPD value be minimized; that is, when the indoor air temperature is very high, a lower floor surface temperature is required, and when the indoor air temperature is low, a higher floor surface temperature is required. For an ideal PPD value (5~5.5%), t a and t s should be distributed in the ideal range of Figure 5, which satisfies the following inequality Equation (13):
0.1936 · t s + 31.143 < t a < 0.1955 · t s + 32.282 t s 18 ,   25   ° C

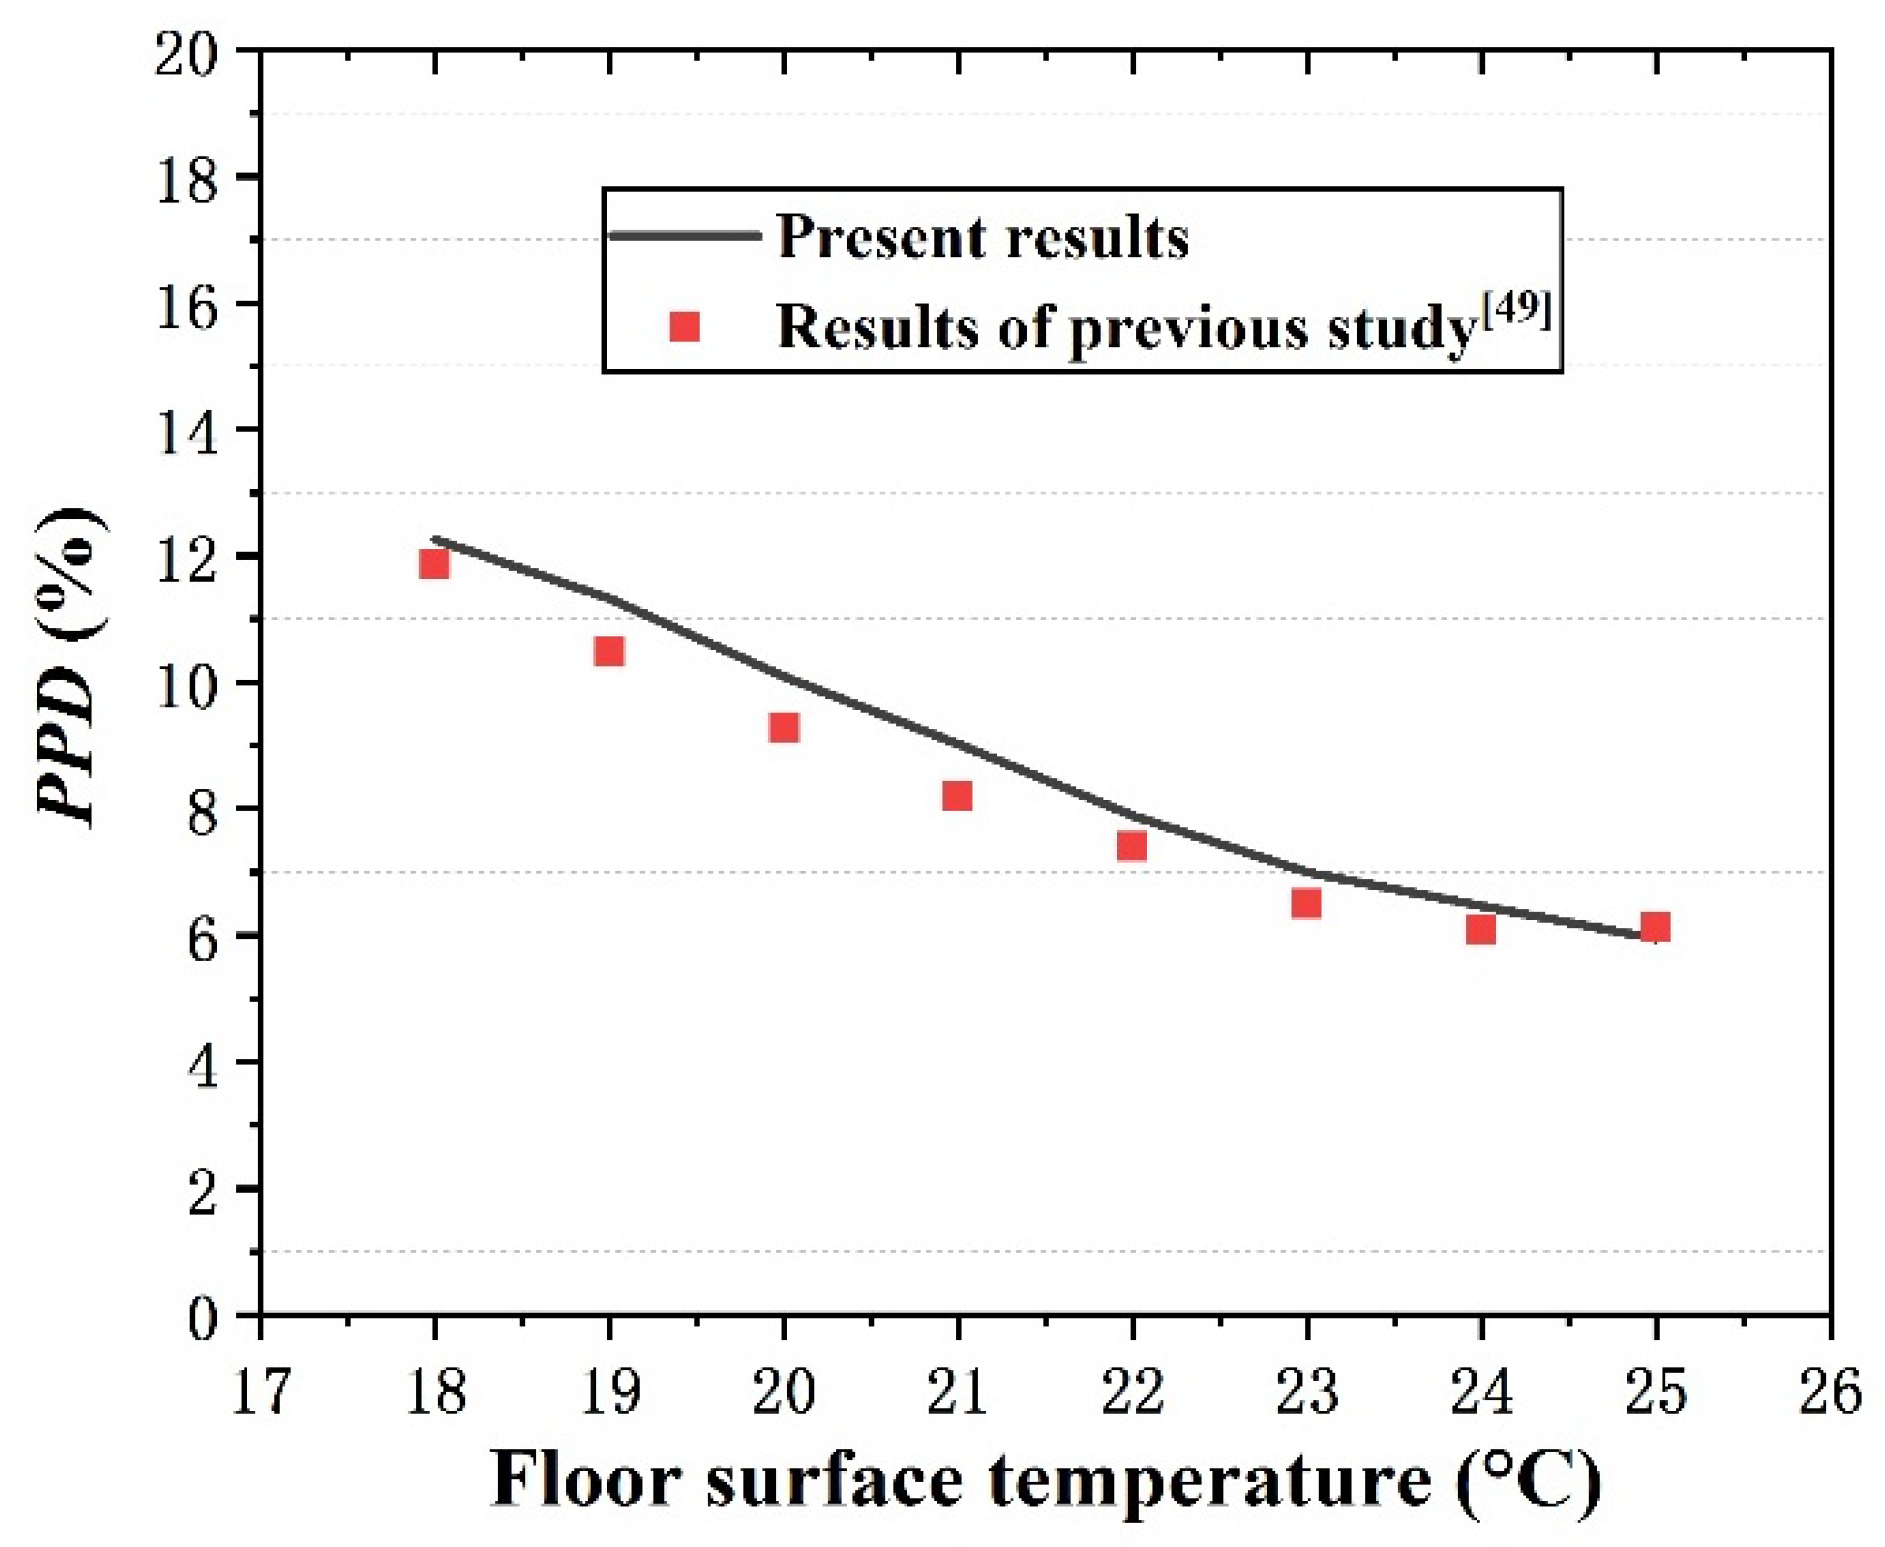
3.2.2. Verification and Error Analysis

According to the usage habits of air conditioning, people generally set the indoor air temperature as an integer temperature. When the indoor air temperature is 26 ° C , the PPD results of the numerical simulation of the present study are compared with a previous study [49]. The comparison is illustrated in Figure 6.
A good agreement was achieved between the data of the previous study and present results, which showed the same trend of changes, and the maximum relative error was about 8.49%.
The mean absolute percentage error (MAPE) and the root mean square error (RMSE) [50] are employed to evaluate the accuracy of numerical simulation calculation models and boundary condition settings. The values of MAPE and RMSE were 6.64% and 0.60 respectively, which is acceptable.
This fully proves the rationality of the theoretical model and parameter settings used in the numerical simulations of the present study, and verifies the high reliability of the numerical results of this study. The numerical calculation model of the TRNSYS is verified.

3.3. Correction Equation of PMV

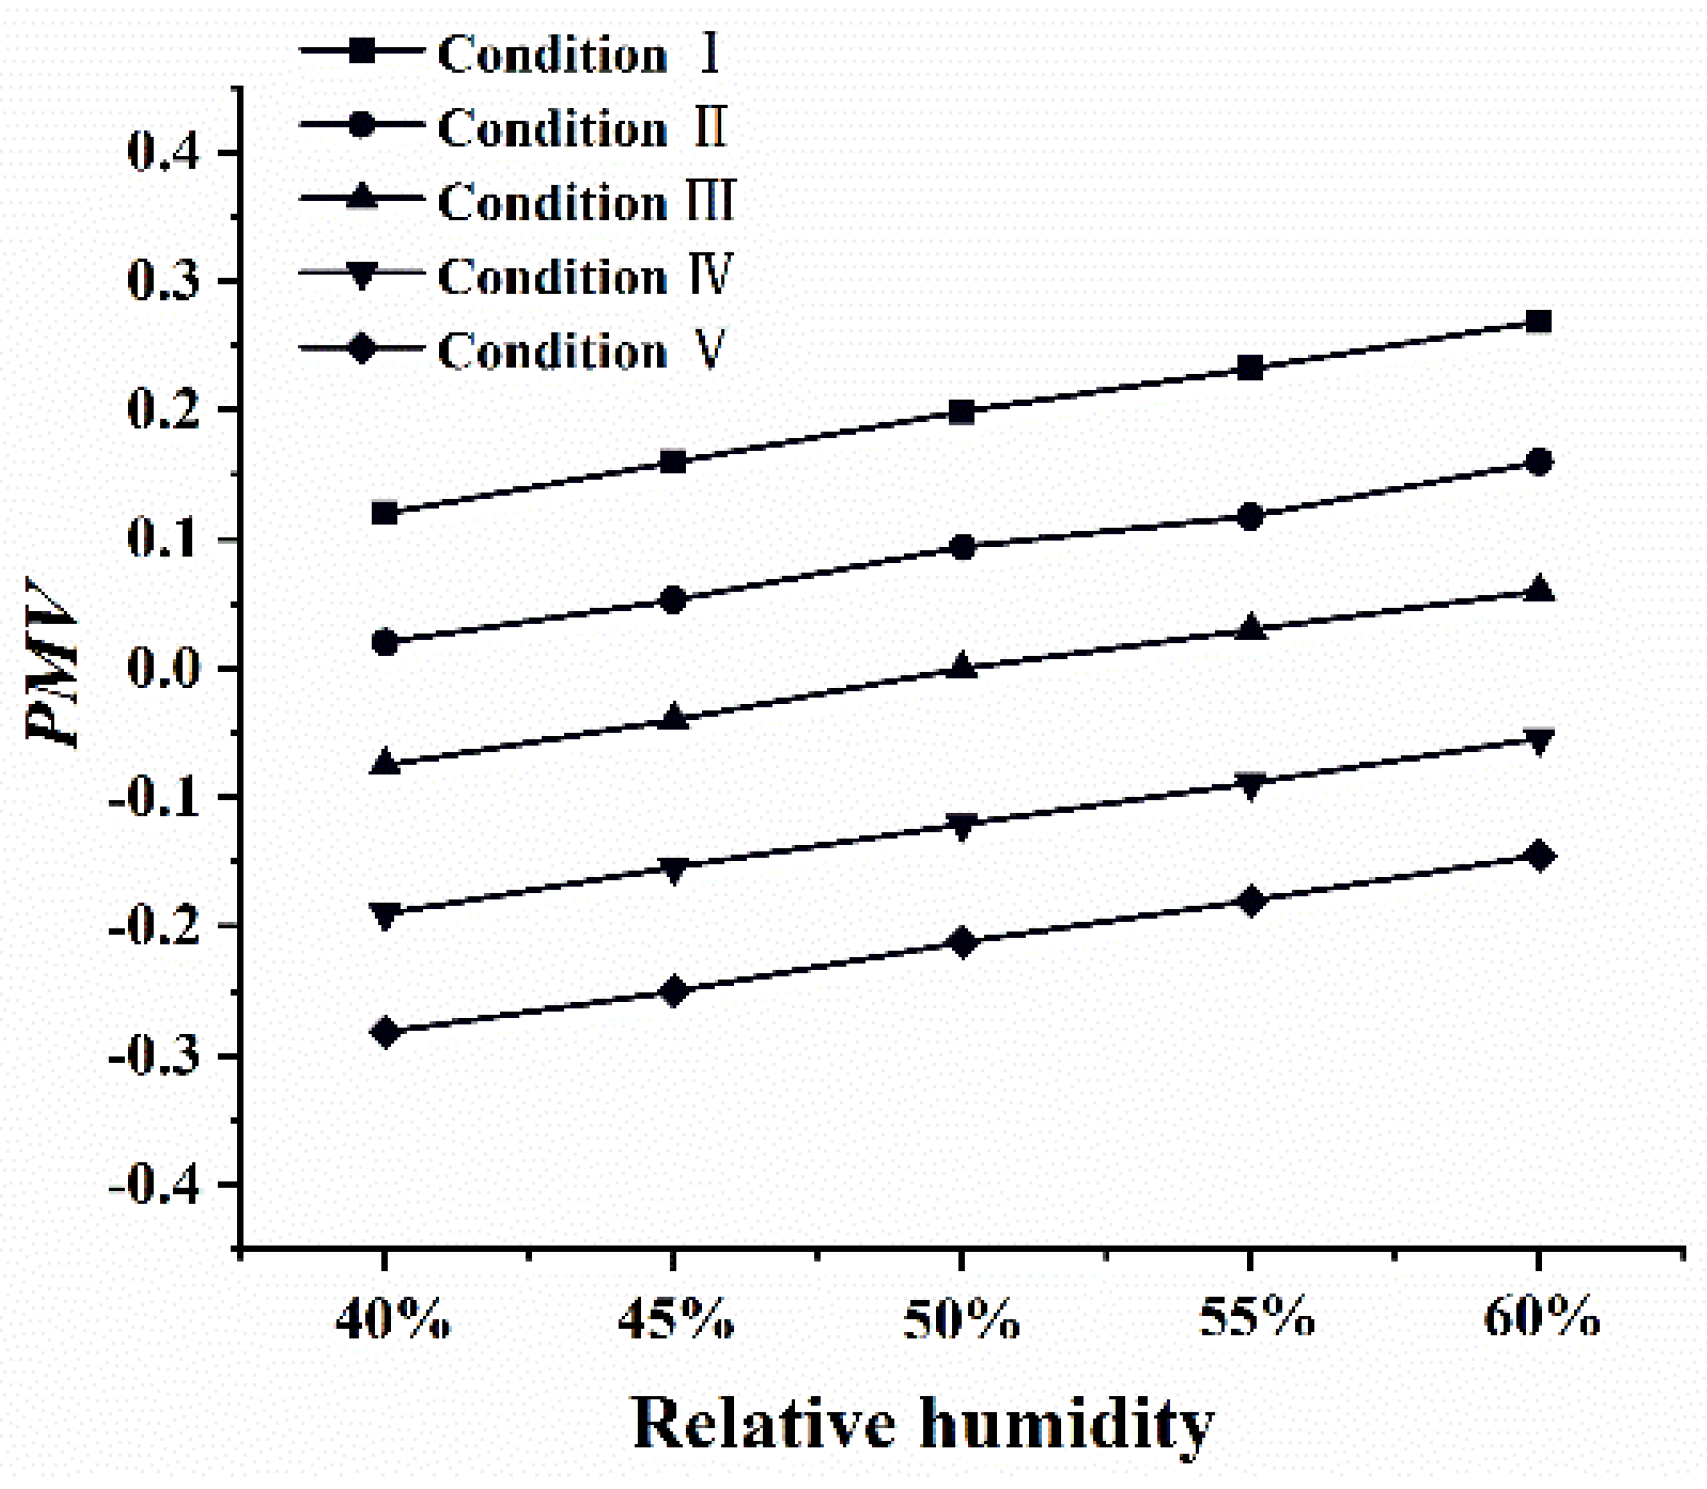
3.3.1. Effect of Relative Humidity on PMV

Changes in the relative humidity also have an impact on human thermal comfort. This section discusses the influence of changes in independent variable γ on the PMV and corrects the calculation expression of PMV to obtain a calculation model containing independent variable γ .
Using the control variable method, fix the values of the value of t a   and t s , and select the working conditions of t a = 28   ° C ,   t s = 23   ° C as condition I, t a = 28   ° C ,   t s = 21   ° C as condition II, t a = 27   ° C ,   t s = 24   ° C as condition III, t a = 27   ° C ,   t s = 22   ° C as condition IV, and t a = 26   ° C ,   t s = 25   ° C as condition V. For working conditions I~V, the indoor air relative humidity changes from 40% to 60% (in the summer, the relative indoor humidity of office buildings is generally between 40% and 60%), and a PMV value is output every 5% change in the relative humidity of the indoor air. The changes in the PMV are shown in Figure 7.
As can be seen from Figure 7, the PMV value increases with the increase in the relative humidity, which indicates that an increase in the relative humidity will increase people’s warm feeling. This conclusion is consistent with the conclusion in [51], which verifies the reliability of numerical simulation from the side.
For each working condition in Figure 7, the changes in relative humidity had little impact on the PMV, and the maximum deviation (compared with the relative humidity at 50%) of the PMV under each working condition is less than 0.1.
It can be seen from Equation (12) that the PMV is the independent variable of PPD, and the change of the PMV is very small, so the change of PPD is also smaller.

3.3.2. Complete Calculation Expression of PMV

In Figure 7, it can be found that the sample points of each working condition are approximately connected in a straight line, and the five straight lines are almost parallel to each other. This shows that the effect of the change in the relative humidity on each working condition is almost the same. A straight line or a formula can be used to represent the deviation of the PMV caused by a change in the relative humidity. When the indoor relative humidity changes, the offset value of the PMV under each working condition is shown in Table 5. When the relative humidity deviation is the same, the average offset ¯ of PMV is also given in Table 5.
It can be found from Table 5 that, when the indoor relative humidity deviation is the same, the PMV deviation of each working condition is almost the same, and the average deviation value can be used to replace the actual deviation value. The average offset ¯ can be used to correct the PMV when the relative humidity is not 50%. Through data fitting, the functional relationship between ¯ and γ is found:
¯ = 0.6944 · γ 50 % 0.0031
Equation (14) is the correction formula for PMV, and the complete calculation formula of PMV is as follows:
P M V = g t s , t a , γ = g t s , t a , 50 % + ¯ = 0.2826 t a + 5.5375 × 10 2 t s 8.9709 + 0.6944 · γ 50 % 0.0031 = 0.2826 t a + 5.5375 × 10 2 t s + 0.6944 · γ 9.3195 t a 26 ,   29   ° C ,   t s 18 ,   25   ° C ,   γ 40 % , 60 %
where t a and t s participate in the calculation with °C as the unit.
For Equation (15), because the relative humidity has no unit, the indoor air temperature and the floor surface temperature are in °C, so the coefficient before γ can no longer be used for weight calculation; however, according to this coefficient, we can know that, for every 5% change in relative humidity, PMV will change by about 0.0347.
Equation (15) is the complete expression form of g t s , t a , γ . PMV can be calculated according to the indoor air temperature t a , floor surface temperature t s , and indoor relative humidity γ . Among the three variables that affect PMV, air temperature is the main factor affecting PMV, floor surface temperature is a secondary factor affecting PMV, and relative humidity has little effect on PMV.

4. Conclusions

Some office buildings in northern China try to use radiant floors for cooling in the summer. Indoor thermal comfort is the key problem of a room using FRC technology, which was explored by the TRNSYS numerical simulation, control variable, and data fitting methods in this paper. The main conclusions are as follows.
(1).
The indoor air temperature is the main factor affecting the PMV value. In rooms with floor radiant cooling, the indoor air temperature shall not be lower than 26 °C or higher than 29 °C. The floor surface temperature is the secondary factor affecting the PMV. The relative humidity of indoor air has little effect on the PMV;
(2).
In the design of air conditioning engineering, the design temperature of the indoor air of a room using FRC technology should be 1~2 °C higher than the indoor design temperature of convective air conditioning.
A simplified calculation model of PMV for indoor thermal environment using floor radiant cooling was obtained. This simplified calculation model is suitable for changes in the indoor relative humidity, which contains three independent variables: the indoor air temperature t a , floor surface temperature t s , and indoor relative humidity   γ . These three variables are the main factors affecting the indoor thermal environment. People can quickly calculate the PMV value based on this formula, or adjust one of the three variables with the PMV as an indicator to achieve the desired PMV value.
Additionally, the limitation of the adjusted temperature range of indoor air and floor surface caused by condensation on the floor surface has not been considered, which can be a research topic in the future.

Author Contributions

Conceptualization, L.Z. (Linhua Zhang); methodology, X.W.; software, X.W.; validation, T.M.; formal analysis, X.W.; investigation, T.M.; resources, L.Z. (Linhua Zhang); data curation, L.Z. (Lili Zhang); writing—original draft preparation, X.W.; writing—review and editing, W.Z.; visualization, X.W.; supervision, L.Z. (Linhua Zhang); project administration, W.Z.; funding acquisition, W.Z. All authors have read and agreed to the published version of the manuscript.

Funding

This research was funded by the Plan of Guidance and Cultivation for Young Innovative Talents of Shandong Provincial Colleges and Universities.

Institutional Review Board Statement

The study was conducted in accordance with the Declaration of Helsinki, and approved by the School of Thermal Engineering, Shandong Jianzhu University.

Informed Consent Statement

Informed consent was obtained from all subjects involved in the study.

Data Availability Statement

Data are not publicly available due to restrictions regarding the privacy of the participants.

Conflicts of Interest

The authors declare no conflict of interest.

Abbreviations

  M  Metabolic rate W/m2 (met)
  Icl  Thermal resistance of clothing m 2 · K / W (CLO)
   γ   Relative humidity
  va  Air velocity m/s
   θ m r t   Mean radiant temperature °C
   F p i   Angle factor between a person and surface i
  ta  Indoor air temperature °C
  ts  Floor surface temperature °C
  td
  tc
  Inner surface temperature of ceiling °C
  Inner surface temperature of internal sunshade for the window °C
  tw1~4  Internal surface temperature of four walls °C
  ti  Average temperature of inner surfaces of other envelopes except floor °C
     Offset
   ¯   Average offset
  FRC  Floor radiant cooling
  FRH  Floor radiant heating
  PMV  Predicted mean vote
  PPD  Predicted percentage of dissatisfaction
  MAPE  Mean absolute percentage error
  RMSE  Root mean square error

References

  1. Chen, M.; Ma, M.; Lin, Y.; Ma, Z.; Li, K. Carbon Kuznets Curve in China’s Building Operations: Retrospective and Prospective Trajectories. Sci. Total Environ. 2022, 803, e150104. [Google Scholar] [CrossRef] [PubMed]
  2. Yuan, F.; Yao, R.; Sadrizadeh, S.; Li, B.; Cao, G.; Zhang, S.; Zhou, S.; Liu, H.; Bogdan, A.; Croitoru, C.; et al. Thermal Comfort in Hospital Buildings—A Literature Review. J. Build. Eng. 2022, 45, e103463. [Google Scholar] [CrossRef]
  3. Vangtook, P.; Chirarattananon, S. Application of Radiant Cooling as a Passive Cooling Option in Hot Humid Climate. Build. Environ. 2007, 42, 543–556. [Google Scholar] [CrossRef]
  4. Wang, X.; Zhang, W.; Li, Q.; Wei, Z.; Lei, W.; Zhang, L. An Analytical Method to Estimate Temperature Distribution of Typical Radiant Floor Cooling Systems with Internal Heat Radiation. Energy Explor. Exploit. 2021, 39, 1283–1305. [Google Scholar] [CrossRef]
  5. Wang, X.; Lei, W.; Zhang, W.; Zhang, Y.; Zhang, L. Simplified Calculation and Control Method of Floor Surface Temperature for Radiant Floor and Fresh Air Coupled Cooling Systems in Steady-State. Case Stud. Therm. Eng. 2021, 27, e101320. [Google Scholar] [CrossRef]
  6. Dong, J.; Lan, H.; Liu, Y.; Wang, X.; Yu, C. Indoor Environment of Nearly Zero Energy Residential Buildings with Conventional Air Conditioning in Hot-Summer and Cold-Winter Zone. Energy Built Environ. 2021, 3, 129–138. [Google Scholar] [CrossRef]
  7. Xing, D.; Li, N.; Zhang, C.; Heiselberg, P. A Critical Review of Passive Condensation Prevention for Radiant Cooling. Build. Environ. 2021, 205, e108230. [Google Scholar] [CrossRef]
  8. Wang, X.; Man, Y.; Zhang, L.; Zhang, W.; Zhang, L. Dynamic Research on Cold Storage Performance of a Standard Radiant Floor Cooling System for Office Buildings in Northern China. J. Therm. Sci. 2022, 1–11. [Google Scholar] [CrossRef]
  9. Yan, H.; Yang, L.; Dong, M.; Hu, B.; Sun, Z.; Shi, F.; Yuan, G.; Bi, X. Thermal Comfort in Residential Buildings Using Bimetal Radiator Heating vs. Floor Heating Terminals. J. Build. Eng. 2022, 45, e103501. [Google Scholar] [CrossRef]
  10. Shin, M.S.; Rhee, K.N.; Jung, G.J. Optimal Heating Start and Stop Control Based on the Inferred Occupancy Schedule in a Household with Radiant Floor Heating System. Energy Build. 2020, 209, e109737. [Google Scholar] [CrossRef]
  11. Borinaga- Treviño, R.; Cuadrado, J.; Canales, J.; Rojí, E. Lime Mud Waste from the Paper Industry as a Partial Replacement of Cement in Mortars Used on Radiant Floor Heating Systems. J. Build. Eng. 2021, 41, e102408. [Google Scholar] [CrossRef]
  12. Jiang, C.; Xie, G.; Wu, D.; Yan, T.; Chen, S.; Zhao, P.; Wu, Z.; Li, W. Experimental Investigation on an Energy-Efficient Floor Heating System with Intelligent Control: A Case Study in Chengdu, China. Case Stud. Therm. Eng. 2021, 26, e101094. [Google Scholar] [CrossRef]
  13. Garcia, D.A. Can Radiant Floor Heating Systems Be Used in Removable Glazed Enclosed Patios Meeting Thermal Comfort Standards? Build. Environ. 2016, 106, 378–388. [Google Scholar] [CrossRef]
  14. Zhang, Z.; Wu, M.; Yao, W. Performance of the Wall Implanted with Heat Pipes on Indoor Thermal Environment. Indoor Built Environ. 2021, 31, 878–894. [Google Scholar] [CrossRef]
  15. Cho, J.; Park, B.; Lim, T. Experimental and Numerical Study on the Application of Low-Temperature Radiant Floor Heating System with Capillary Tube: Thermal Performance Analysis. Appl. Therm. Eng. 2019, 163, e114360. [Google Scholar] [CrossRef]
  16. Karacavus, B.; Aydin, K. Numerical Investigation of General and Local Thermal Comfort of an Office Equipped with Radiant Panels. Indoor Built Environ. 2019, 28, 806–824. [Google Scholar] [CrossRef]
  17. Sirhan, N.; Golan, S. Efficient PMV Computation for Public Environments with Transient Populations. Energy Build. 2021, 231, e110523. [Google Scholar] [CrossRef]
  18. Li, T.; Merabtine, A.; Lachi, M.; Martaj, N.; Bennacer, R. Experimental Study on the Thermal Comfort in the Room Equipped with a Radiant Floor Heating System Exposed to Direct Solar Radiation. Energy 2021, 230, e120800. [Google Scholar] [CrossRef]
  19. Du, H.; Lian, Z.; Lai, D.; Duanmu, L.; Zhai, Y.; Cao, B.; Zhang, Y.; Zhou, X.; Wang, Z.; Zhang, X.; et al. Comparison of Thermal Comfort between Radiant and Convective Systems Using Field Test Data from Chinese Thermal Comfort Database. Build. Environ. 2021, 209, 108685. [Google Scholar] [CrossRef]
  20. Liu, J.; Kim, M.K.; Srebric, J. Numerical Analysis of Cooling Potential and Indoor Thermal Comfort with a Novel Hybrid Radiant Cooling System in Hot and Humid Climates. Indoor Built Environ. 2021, 31, 929–943. [Google Scholar] [CrossRef]
  21. Tan, J.; Liu, J.; Liu, W.; Yu, B.; Zhang, J. Performance on Heating Human Body of an Optimised Radiant-Convective Combined Personal Electric Heater. Build. Environ. 2022, 214, e108882. [Google Scholar] [CrossRef]
  22. Zhang, F.; Guo, H.A.; Liu, Z.; Zhang, G. A Critical Review of the Research about Radiant Cooling Systems in China. Energy Build. 2021, 235, e110756. [Google Scholar] [CrossRef]
  23. Gu, X.; Cheng, M.; Zhang, X.; Qi, Z.; Liu, J.; Li, Z. Performance Analysis of a Hybrid Non-Centralized Radiant Floor Cooling System in Hot and Humid Regions. Case Stud. Therm. Eng. 2021, 28, e101645. [Google Scholar] [CrossRef]
  24. Kwong, Q.J.; Arsad, M.A.; Adam, N.M. Evaluation of Indoor Thermal Environment in a Radiant-Cooled-Floor Office Building in Malaysia. Appl. Mech. Mater. 2014, 564, 228–233. [Google Scholar] [CrossRef]
  25. Hu, Y.; Xia, X.; Wang, J. Research on Operation Strategy of Radiant Cooling System Based on Intermittent Operation Characteristics. J. Build. Eng. 2022, 45, e103483. [Google Scholar] [CrossRef]
  26. Liu, J.; Li, Z.; Kim, M.K.; Zhu, S.; Zhang, L.; Srebric, J. A Comparison of the Thermal Comfort Performances of a Radiation Floor Cooling System When Combined with a Range of Ventilation Systems. Indoor Built Environ. 2020, 29, 527–542. [Google Scholar] [CrossRef]
  27. Kastner, P.; Dogan, T. Eddy3D: A Toolkit for Decoupled Outdoor Thermal Comfort Simulations in Urban Areas. Build. Environ. 2022, 212, e108639. [Google Scholar] [CrossRef]
  28. Wang, Z.; Cao, B.; Zhu, Y. Questionnaire Survey and Field Investigation on Sleep Thermal Comfort and Behavioral Adjustments in Bedrooms of Chinese Residents. Energy Build. 2021, 253, e111462. [Google Scholar] [CrossRef]
  29. Zhou, X.; Liu, Y.; Zhang, J.; Ye, L.; Luo, M. Radiant Asymmetric Thermal Comfort Evaluation for Floor Cooling System—A Field Study in Office Building. Energy Build. 2022, 260, e111917. [Google Scholar] [CrossRef]
  30. Ricciardi, P.; Ziletti, A.; Buratti, C. Evaluation of Thermal Comfort in an Historical Italian Opera Theatre by the Calculation of the Neutral Comfort Temperature. Build. Environ. 2016, 102, 116–127. [Google Scholar] [CrossRef]
  31. Li, Q.; Zhang, Y.; Guo, T.; Fan, J. Development of a New Method to Estimate Thermal Performance of Multilayer Radiant Floor. J. Build. Eng. 2021, 33, e101562. [Google Scholar] [CrossRef]
  32. Zheng, Z.; Zhang, Y.; Mao, Y.; Yang, Y.; Fu, C.; Fang, Z. Analysis of SET* and PMV to Evaluate Thermal Comfort in Prefab Construction Site Offices: Case Study in South China. Case Stud. Therm. Eng. 2021, 26, e101137. [Google Scholar] [CrossRef]
  33. Park, J.; Choi, H.; Kim, D.; Kim, T. Development of Novel PMV-Based HVAC Control Strategies Using a Mean Radiant Temperature Prediction Model by Machine Learning in Kuwaiti Climate. Build. Environ. 2021, 206, e108357. [Google Scholar] [CrossRef]
  34. Broday, E.E.; Ruivo, C.R.; Gameiro da Silva, M. The Use of Monte Carlo Method to Assess the Uncertainty of Thermal Comfort Indices PMV and PPD: Benefits of Using a Measuring Set with an Operative Temperature Probe. J. Build. Eng. 2021, 35, e101961. [Google Scholar] [CrossRef]
  35. Omidvar, A.; Kim, J. Modification of Sweat Evaporative Heat Loss in the PMV/PPD Model to Improve Thermal Comfort Prediction in Warm Climates. Build. Environ. 2020, 176, e106868. [Google Scholar] [CrossRef]
  36. Hesaraki, A.; Huda, N. A Comparative Review on the Application of Radiant Low-Temperature Heating and High-Temperature Cooling for Energy, Thermal Comfort, Indoor Air Quality, Design and Control. Sustain. Energy Technol. Assess. 2022, 49, e101661. [Google Scholar] [CrossRef]
  37. Gao, S.; Ooka, R.; Oh, W. Experimental Investigation of the Effect of Clothing Insulation on Thermal Comfort Indices. Build. Environ. 2021, 187, e107393. [Google Scholar] [CrossRef]
  38. Alfano, F.R.D.A.; Palella, B.I.; Riccio, G. Notes on the Calculation of the PMV Index by Means of Apps. Energy Procedia 2016, 101, 249–256. [Google Scholar] [CrossRef]
  39. Zhang, D.L.; Wang, Z.J.; Zhang, X. Experimental Study on Dry Radiant Floor Cooling System Combined with Displacement Ventilation System. Build. Sci. 2009, 25, 38–42. [Google Scholar]
  40. Brough, D.; Ramos, J.; Delpech, B.; Jouhara, H. Development and Validation of a TRNSYS Type to Simulate Heat Pipe Heat Exchangers in Transient Applications of Waste Heat Recovery. Int. J. Thermofluids 2021, 9, e100056. [Google Scholar] [CrossRef]
  41. Ministry of Housing and Urban-Rural Development of the People’s Republic of China. Design Standard for Energy Efficiency of Public Buildings; China Architecture & Building Press: Beijing, China, 2015. [Google Scholar]
  42. Bordignon, S.; Emmi, G.; Zarrella, A.; De Carli, M. Energy Analysis of Different Configurations for a Reversible Ground Source Heat Pump Using a New Flexible TRNSYS Type. Appl. Therm. Eng. 2021, 197, e117413. [Google Scholar] [CrossRef]
  43. Liu, C.; Zhang, Y.; Sun, L.; Gao, W.; Jing, X.; Ye, W. Influence of Indoor Air Temperature and Relative Humidity on Learning Performance of Undergraduates. Case Stud. Therm. Eng. 2021, 28, e101458. [Google Scholar] [CrossRef]
  44. Qin, S.Y.; Cui, X.; Yang, C.; Jin, L.W. Thermal Comfort Analysis of Radiant Cooling Panels with Dedicated Fresh-Air System. Indoor Built Environ. 2021, 30, 1596–1608. [Google Scholar] [CrossRef]
  45. Zhang, C.Y.; Wang, Z.J. Influence of Radiant Cooling Floor Surface on Inner Surface Temperature of Building Envelopes and Indoor Thermal Comfort. Build. Sci. 2008, 24, 79–84. [Google Scholar]
  46. Dougherty, E.R.; Kim, S.; Chen, Y. Coefficient of Determination in Nonlinear Signal Processing. Signal Processing 2000, 80, 2219–2235. [Google Scholar] [CrossRef]
  47. Fanger, P. Calculation of Thermal Comfort, Introduction of a Basic Comfort Equation. ASHRAE Trans. 1967, 73, III.4.1–III.4.20. [Google Scholar]
  48. Cheung, T.; Schiavon, S.; Parkinson, T.; Li, P.; Brager, G. Analysis of the Accuracy on PMV—PPD Model Using the ASHRAE Global Thermal Comfort Database II. Build. Environ. 2019, 153, 205–217. [Google Scholar] [CrossRef] [Green Version]
  49. Spielvogel, L. Thermal Environmental Conditions for Human Occupancy; ASHRAE: Atlanta, GA, USA, 2005. [Google Scholar]
  50. Ahamed, M.S.; Guo, H.; Tanino, K. Evaluation of a Cloud Cover Based Model for Estimation of Hourly Global Solar Radiation in Western Canada. Int. J. Sustain. Energy 2019, 38, 64–73. [Google Scholar] [CrossRef]
  51. d’Ambrosio Alfano, F.R.; Palella, B.I.; Riccio, G. The Role of Measurement Accuracy on the Thermal Environment Assessment by Means of PMV Index. Build. Environ. 2011, 46, 1361–1369. [Google Scholar] [CrossRef]
Figure 1. Numerical simulation diagram of the TRNSYS.
Buildings 12 00483 g001
Figure 2. Schematic diagram of laying pipes and floor structure. (a) Layout form of floor laying pipe. (b) Floor structure and materials.
Buildings 12 00483 g002
Figure 3. Fitting functional relationship between t s and PMV.
Buildings 12 00483 g003
Figure 4. Temperature regulation diagram with PMV as the index.
Buildings 12 00483 g004
Figure 5. Relationship between PPD and two temperature indexes.
Buildings 12 00483 g005
Figure 6. Results of the present study compared with a previous study [49].
Buildings 12 00483 g006
Figure 7. Influence of relative humidity changes on PMV under conditions I~V.
Buildings 12 00483 g007
Table 1. PMV level and human thermal sensation.
Thermal SensationHotWarmSlightly WarmModerateSlightly CoolCoolCold
PMV value+3+2+10−1−2−3
Table 2. Parameter settings of office staff [35].
Personnel StatusThermal Resistance of Summer Clothing
(Shorts, Long Thin Pants, Short Sleeved Cardigan, Thin Socks, and Shoes)
Metabolic Rate
Sitting 0.080   m 2 · K / W   ( 0.5 CLO) 58.15   W / m 2   ( 1.0 met)
Table 3. Thermal performance limit of a public building’s envelope in cold areas [41].
Envelopes of Public BuildingsBuilding Shape Coefficient ≤ 0.300.30 < Building Shape Coefficient ≤ 0.50
Heat Transfer CoefficientHeat Transfer Coefficient
Roof 0.45   W / m 2 · K 0.40   W / m 2 · K
Exterior wall (including non-transparent curtain wall) 0.50   W / m 2 · K 0.45   W / m 2 · K
Window to wall ratio0.40.3
Table 4. PMV values for different indoor air temperatures and floor surface temperatures.
Indoor Air Temperature/°CFloor Surface Temperature Changes/°C
1819202122232425
26−0.59−0.55−0.50−0.44−0.38−0.32−0.26−0.21
27−0.34−0.28−0.23−0.17−0.12−0.060.000.06
28−0.070.000.040.090.150.200.260.32
290.210.250.320.360.410.470.530.59
Table 5. PMV deviation with relative humidity deviation (compared to 50%).
Indoor Relative HumidityRelative Humidity Deviation 1 2 3 4 5 ¯
40%−10%−0.0800−0.0700−0.0750−0.0700−0.0720−0.0734
45%−5%−0.0400−0.0370−0.0400−0.0340−0.0400−0.0382
50%0%−0.00100.00400.0000−0.0007−0.00200.0001
55%+5%0.03200.02800.03000.03100.03000.0302
60%+10%0.06900.07000.06000.06600.06500.0660
Publisher’s Note: MDPI stays neutral with regard to jurisdictional claims in published maps and institutional affiliations.

