Article

Behavior of Corroded Thin-Walled Concrete-Filled Steel Tubular Stub Columns

1
Department of Civil Engineering, Zhejiang University of Science and Technology, Hangzhou 310023, China
2
Department of Civil Engineering, Zhejiang University, Hangzhou 310058, China
3
Department of Civil Engineering, Shaoxing University, Shaoxing 312000, China
*
Author to whom correspondence should be addressed.
Buildings 2022, 12(4), 481; https://doi.org/10.3390/buildings12040481
Submission received: 19 March 2022 / Revised: 6 April 2022 / Accepted: 8 April 2022 / Published: 13 April 2022
(This article belongs to the Section Building Materials, and Repair & Renovation)

Abstract

:
The behavior of two series of corroded thin-walled concrete-filled steel tubes (CFSTs) was investigated in this paper. One series, called the CT series, consists of fourteen CFST specimens corroded by NaCl solution, while the other, called the AT series, consists of six test pieces corroded in the atmosphere. Outer surfaces of corroded steel tubes were scanned using a 3D scanner machine, and a complete surface profile of each specimen was obtained for corrosion evaluation using different methods in this study. Entire test pieces were compressed to failure, and their behaviors under loading were recorded. It is shown that corrosion has a fractal feature, and it has a significant effect on the ductility of specimens. In addition, FEA models of corroded CFST specimens were established based on the 3D scanning profile results using the ABAQUS program and verified against column test results.

1. Introduction

Concrete-filled steel tubes (CFSTs) have been widely used recently due to their high performance, such as in bridge structures, offshore structures, and electric transmission towers [1,2,3,4,5,6,7,8]. These structures suffer from corrosion due to environmental attack, especially from chloride ingression. The thickness of steel tubes decreased compared with traditional steel structures, thanks to the contribution of concrete; this could result in a significantly high corrosion rate at the usual corrosion depth. Therefore, it is important to investigate the effect of corrosion on the behavior of CFST structures.
Behavior of corroded CFST specimens under axial loading [9], sustained loading [10], tension [11], and eccentric loading [12,13] were investigated by Han et al. Corrosion of CFST specimens was accelerated by electrochemical method in 3.5% NaCl solution. Finite element simulation of the corroded CFST specimens was also conducted by Han et al. [10,11,12,13], where the uniform corrosion of steel tubes was simulated by reducing the stiffness of the corroded steel elements. Deterioration of the bond stress between the steel and the concrete interface, as well as concrete performance, were also considered. Research results indicated that the CFST specimens were generally uniformly corroded under the electrochemical accelerating method. The thickness of the steel tube decreased due to corrosion, which lead to a reduction in the constraint effect on concrete. Furthermore, the buckling resistance of the steel tube also decreased.
Corrosion of steel structural elements has been investigated for decades. Nowadays innovative methods have been used, such as a 3D scanning method for corrosion of structural steel [14], aluminum alloy [15], bridge wires [16], and butt-welded joints [17]. The coordinate data of a corroded surface is usually obtained by this 3D scanning method, and thus, the geometry size of the remaining part would be accurately described. Parameters, such as the maximum depth of corrosion pits, the area of pits, and the shape of pits, could be obtained by data analysis [17]. Meanwhile, it has been shown that 3D scanning results can be used to establish the finite element of corroded tensile coupon specimens and that the cracks in the corroded tensile coupon specimens could be predicted using the FEA model by incorporating the ductile fracture criterion of steel. Based on the aforementioned, this study is going to use the 3D scanning method to analyze the situation of the corroded CFST specimens and, simultaneously, to establish their corresponding FEA models.
A total of 20 test pieces, including 14 CFST specimens corroded by 5 wt % NaCl solution and 6 CFST specimens corroded in atmosphere, without external applied current, were investigated in this study, in order to obtain the similar corrosion condition in engineering reality. Structural steel grade Q235 and Q420, as well as concrete grades C35, C50, and C60, were used. The outer surfaces of all steel tubes are prepared by using 3D scanner machine. Then, all test specimens are compressed under axial loading. In addition, FEA models of the corroded CFST specimens become established and verified against test results. Finally, the suitability of the current design methods are evaluated against test and numerical results.

2. Experimental Program

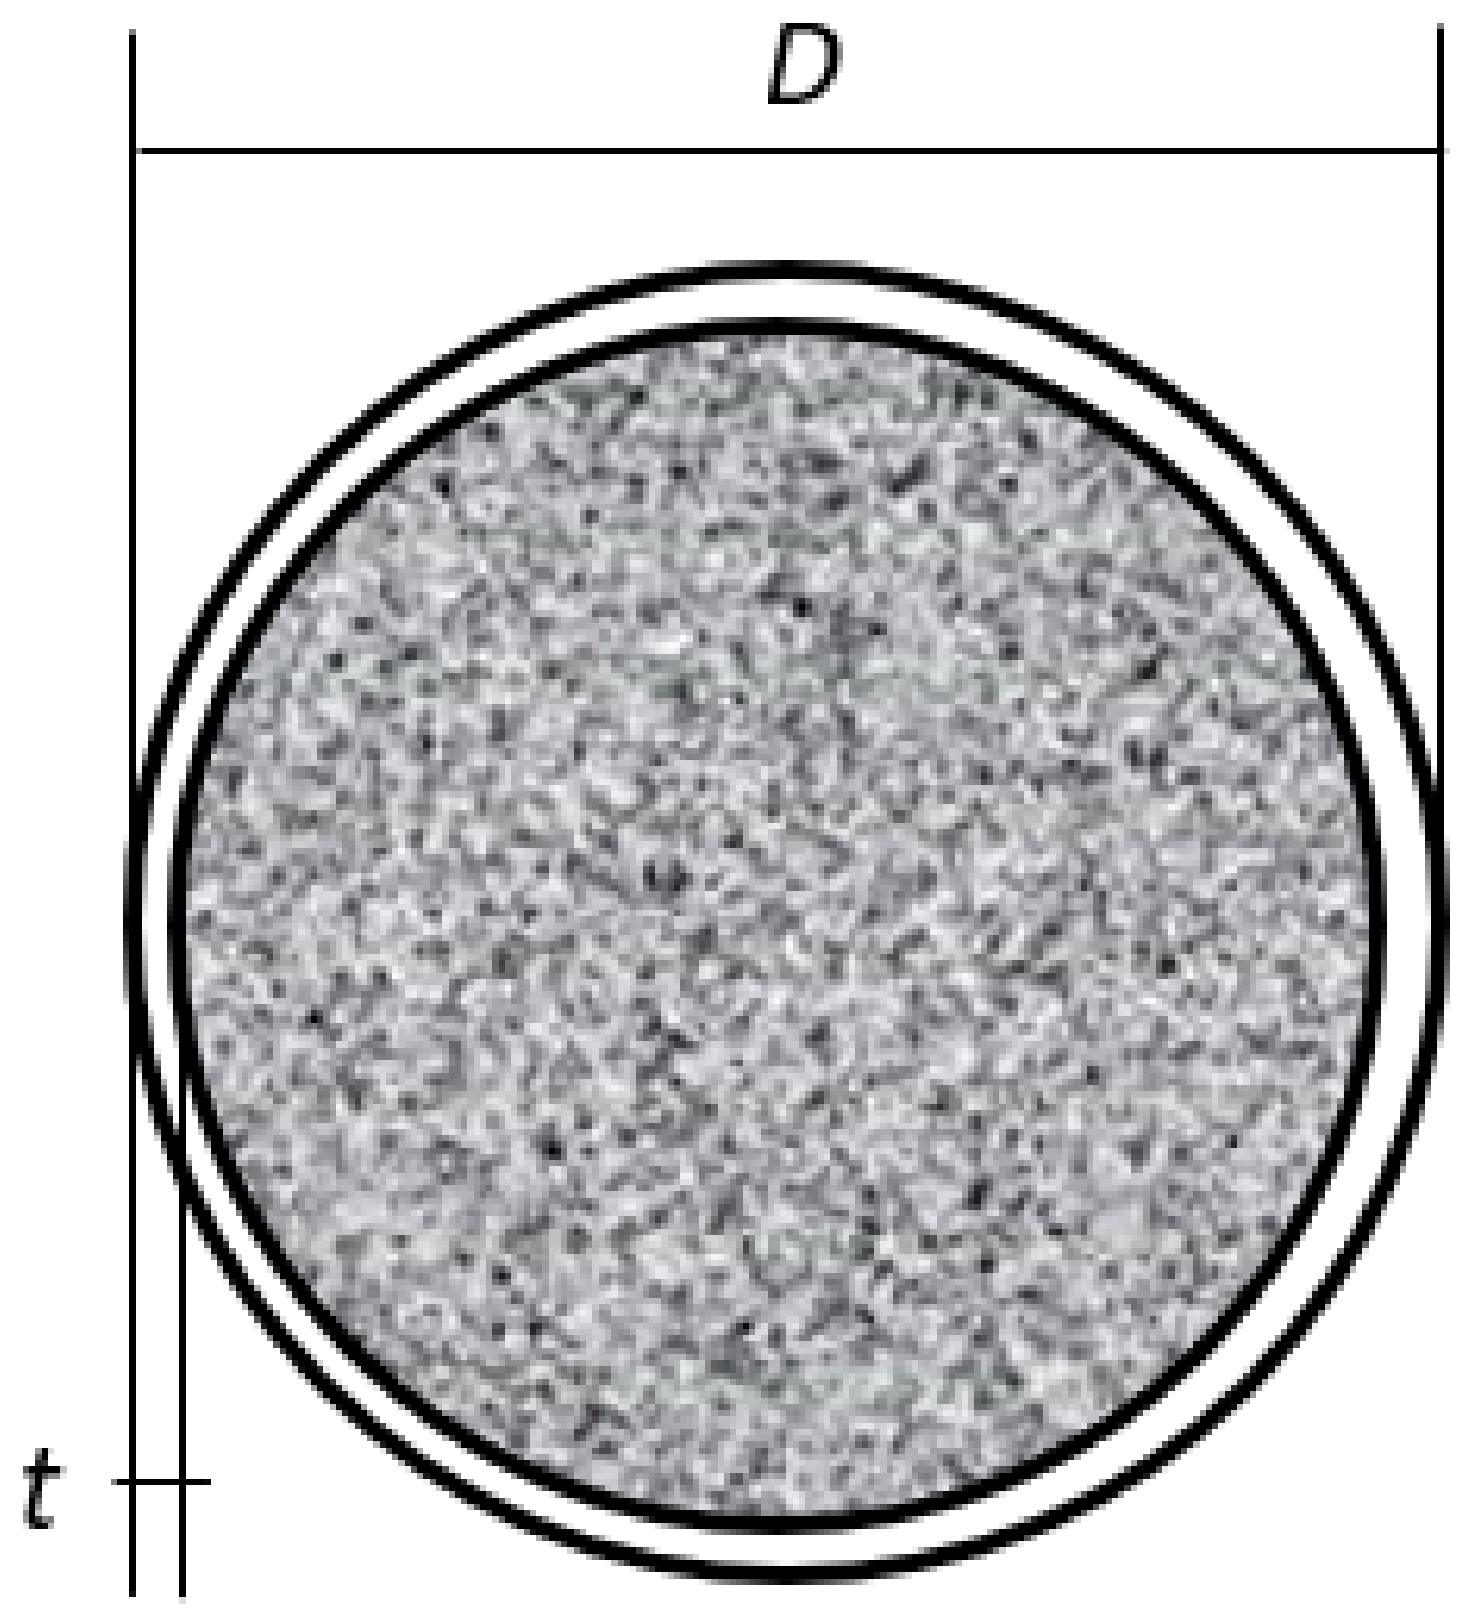
2.1. Test Specimen Configuration

In this study, concrete filled in the steel tube before welding the top ending plate. Test specimens are labelled such that the type and time of the corrosion, as well as concrete grade, could be identified from the label. For example, the label “CT90C60B” defines the specimens as follow:
  • The first letter indicates the type of corrosion, where the prefix letter “C” refers to chloride corrosion, and “A” refers to the atmospheric corrosion.
  • The following letter, “T”, with two digits “90”, indicates the corrosion time in days.
  • The following letter, “C”, with two digits “60”, refers to the concrete grade.
  • The last character, “B”, refers to the repeated test piece.

2.2. Materials

2.2.1. Concrete and Steel Tubes

The concrete elastic modulus (Ec) and compressive strength (fcu) obtained on 150-mm cubes at 28 days are presented in Table 1. The material properties of the steel tubes were obtained through tensile coupon tests. The coupons were taken from the same batch of steel tubes as the column test specimens in the longitudinal direction. The 12.5-mm-wide coupon dimensions conformed to Australian Standard AS 1391 [18] for tensile testing of metals. A displacement-controlled test machine with friction grips was used for the coupon tensile test in accordance with AS 1391 [18]. A calibrated 50-mm gauge length extensometer was used to measure the tensile strain. The values for Young’s modulus (Es), yield stress (Fy), and ultimate tensile strength (Fu), based on the coupon test results, are shown in Table 2.

2.2.2. Specimen Design

A total of 20 CFST column specimens were designed, among which 14 specimens were prepared for the chloride corrosion condition, namely the CT series, and the other 6 were prepared for atmospheric corrosion condition, namely the AT series, as shown in Table 3. Seamless steel tubes, labeled S, and welded steel tubes, labeled W, were prepared for the CT series and AT series, respectively. The geometry and dimensions of the concrete-filled steel tubes are presented in Table 3 using the symbols plotted in Figure 1. For the CT series, two 15-mm-thick steel plates were welded on opposite ends with the purpose of preventing the chloride solution from affecting the inner surface of column specimens, while for the AT series, each has one 15-mm-thick steel plate welded on end for the convenience of scanning, as seen in Figure 2. For the AT series, there are four 50 × 6 mm angle bars inside the concrete considering the preparation method in Xu et al. [2]. Those angles have no effect on the corrosion of the AT specimens according to previous research.

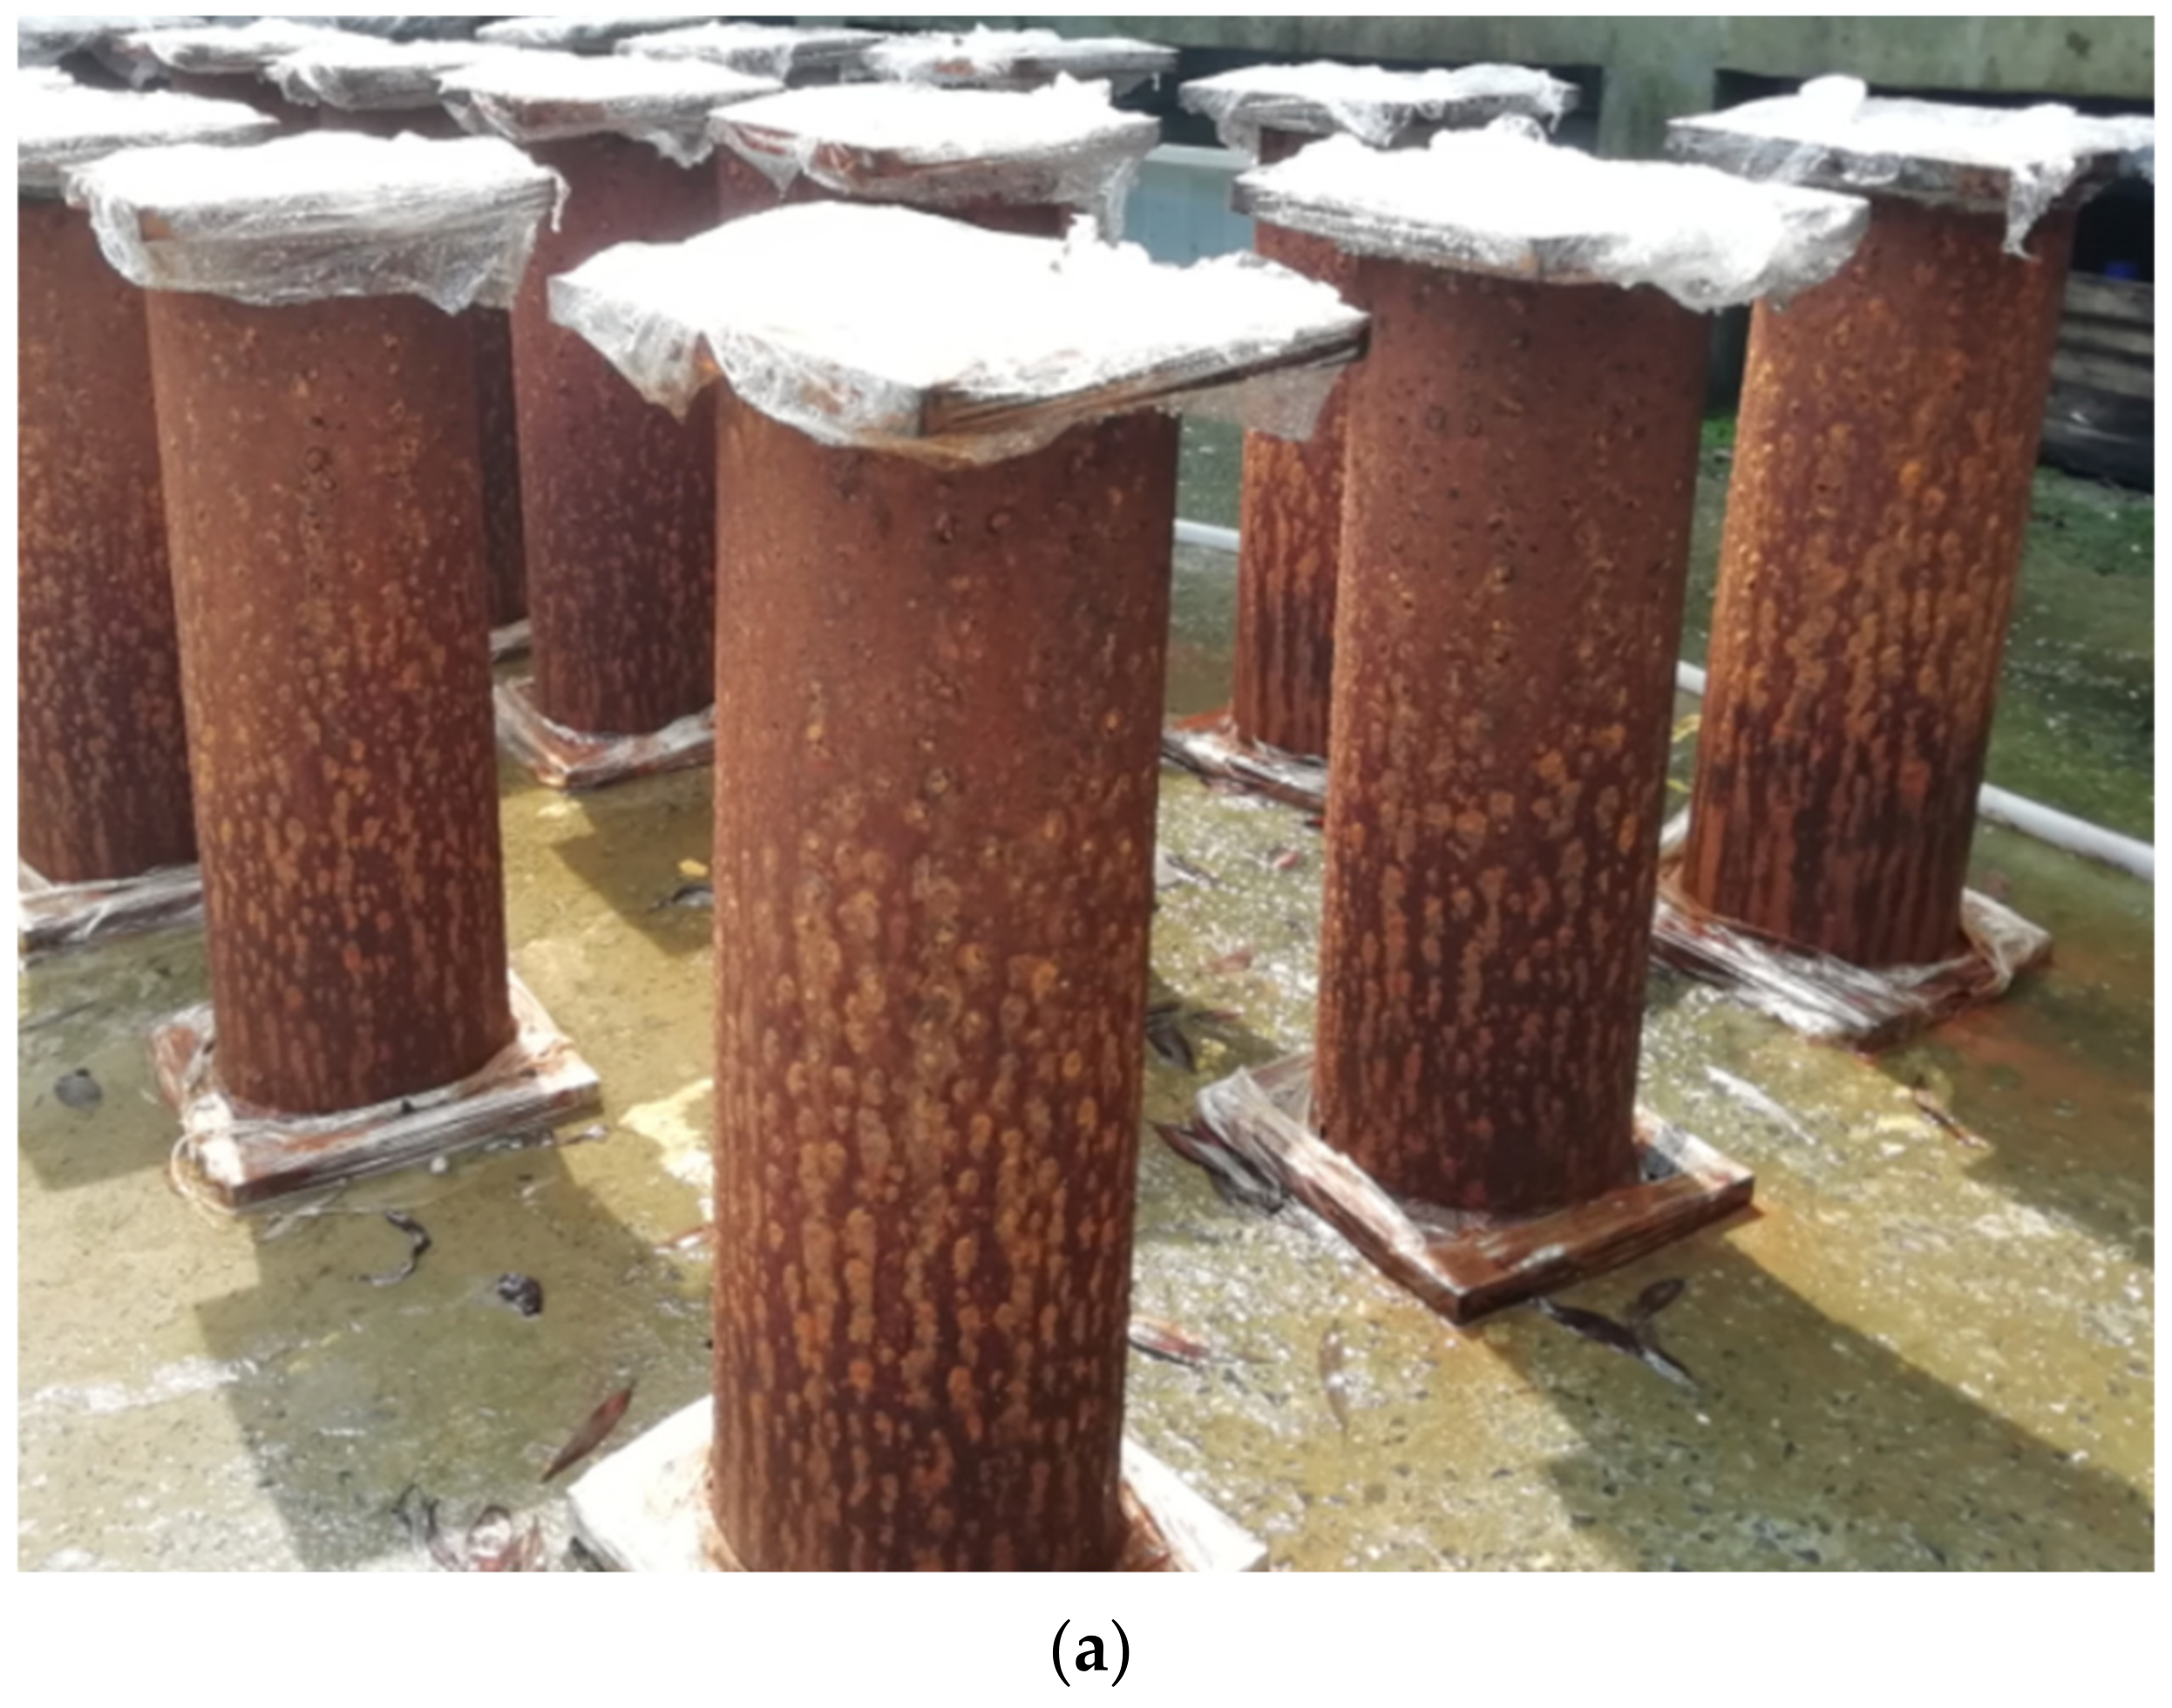
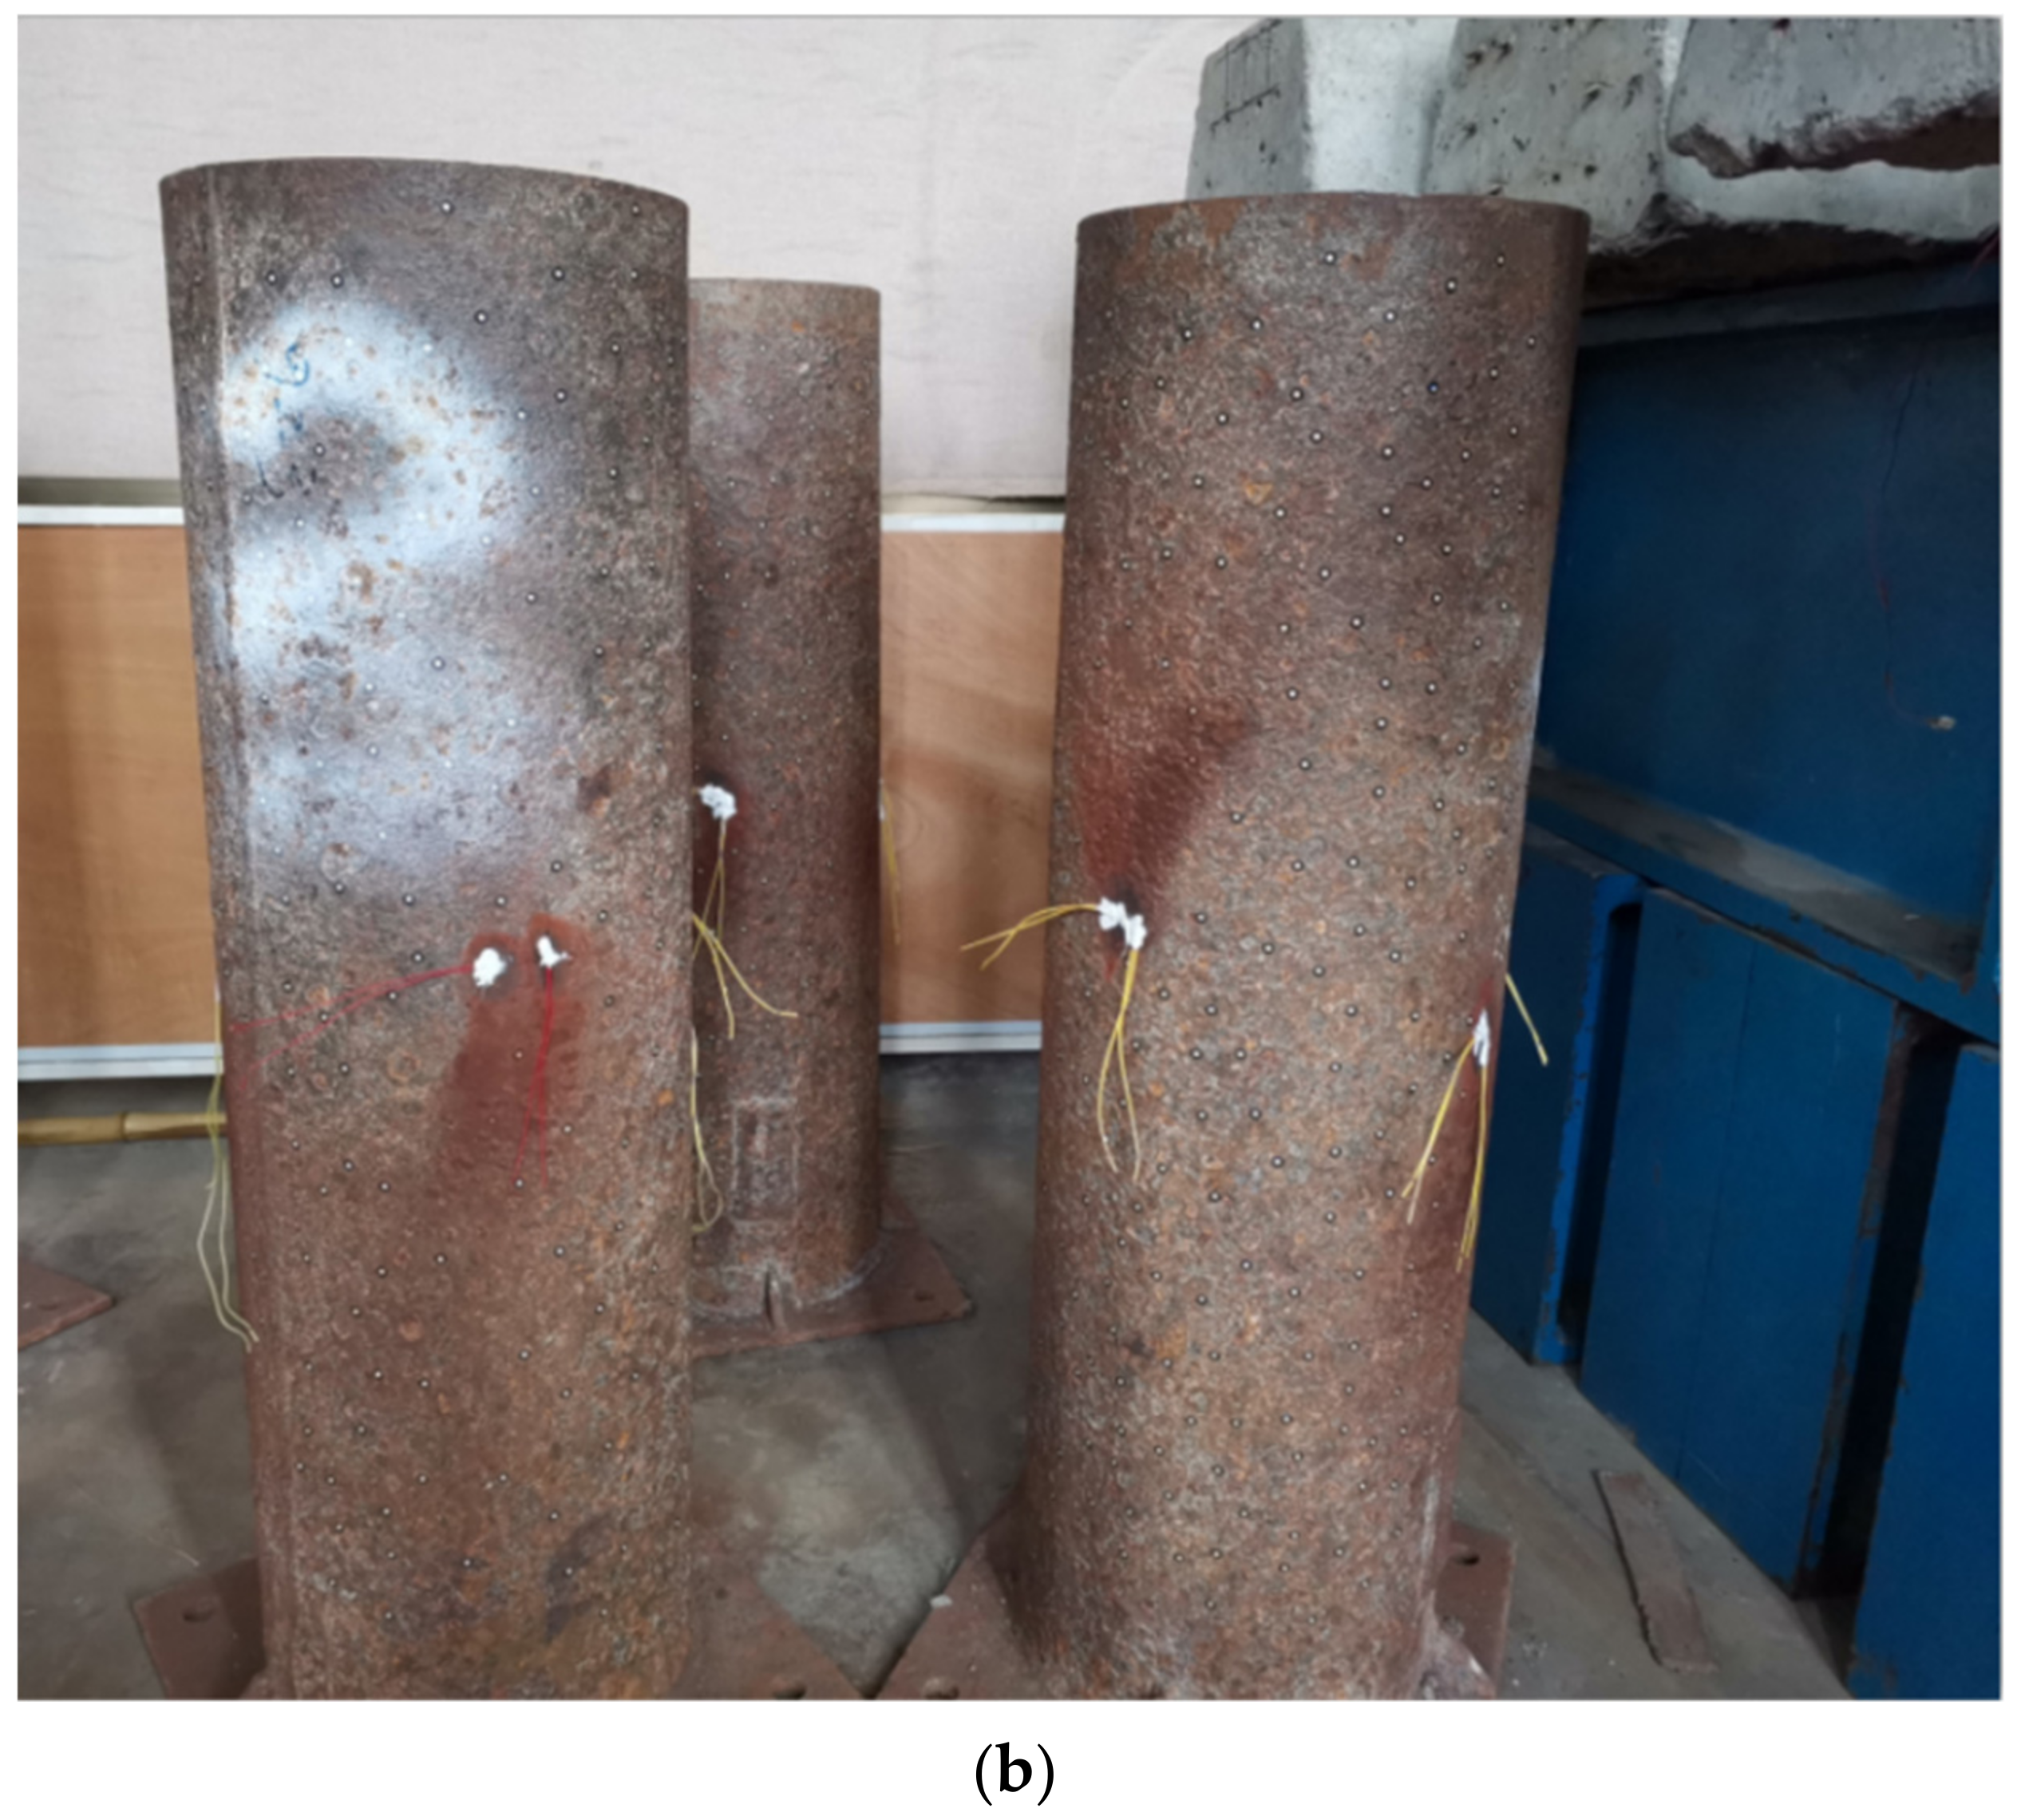
2.3. Corrosion Process

Neither the AT series nor the CT series were coated on the outer surface of the steel tubes in this study. The AT specimens were simply placed in the laboratory after a casting of concrete for about 1100 days. Afterwards, scanning detection was carried out. Dust on the test pieces was manually removed before the process of scanning. The CT specimens were exposed to a chloride erosion environment where 5 wt % NaCl solution was sprayed on the outer surface of the steel tubes six times every day. Specimens of the CT series were divided into four batches according to the sprayed time of 30, 60, 90, and 120 days. Deruster was used to remove the dust before scanning.

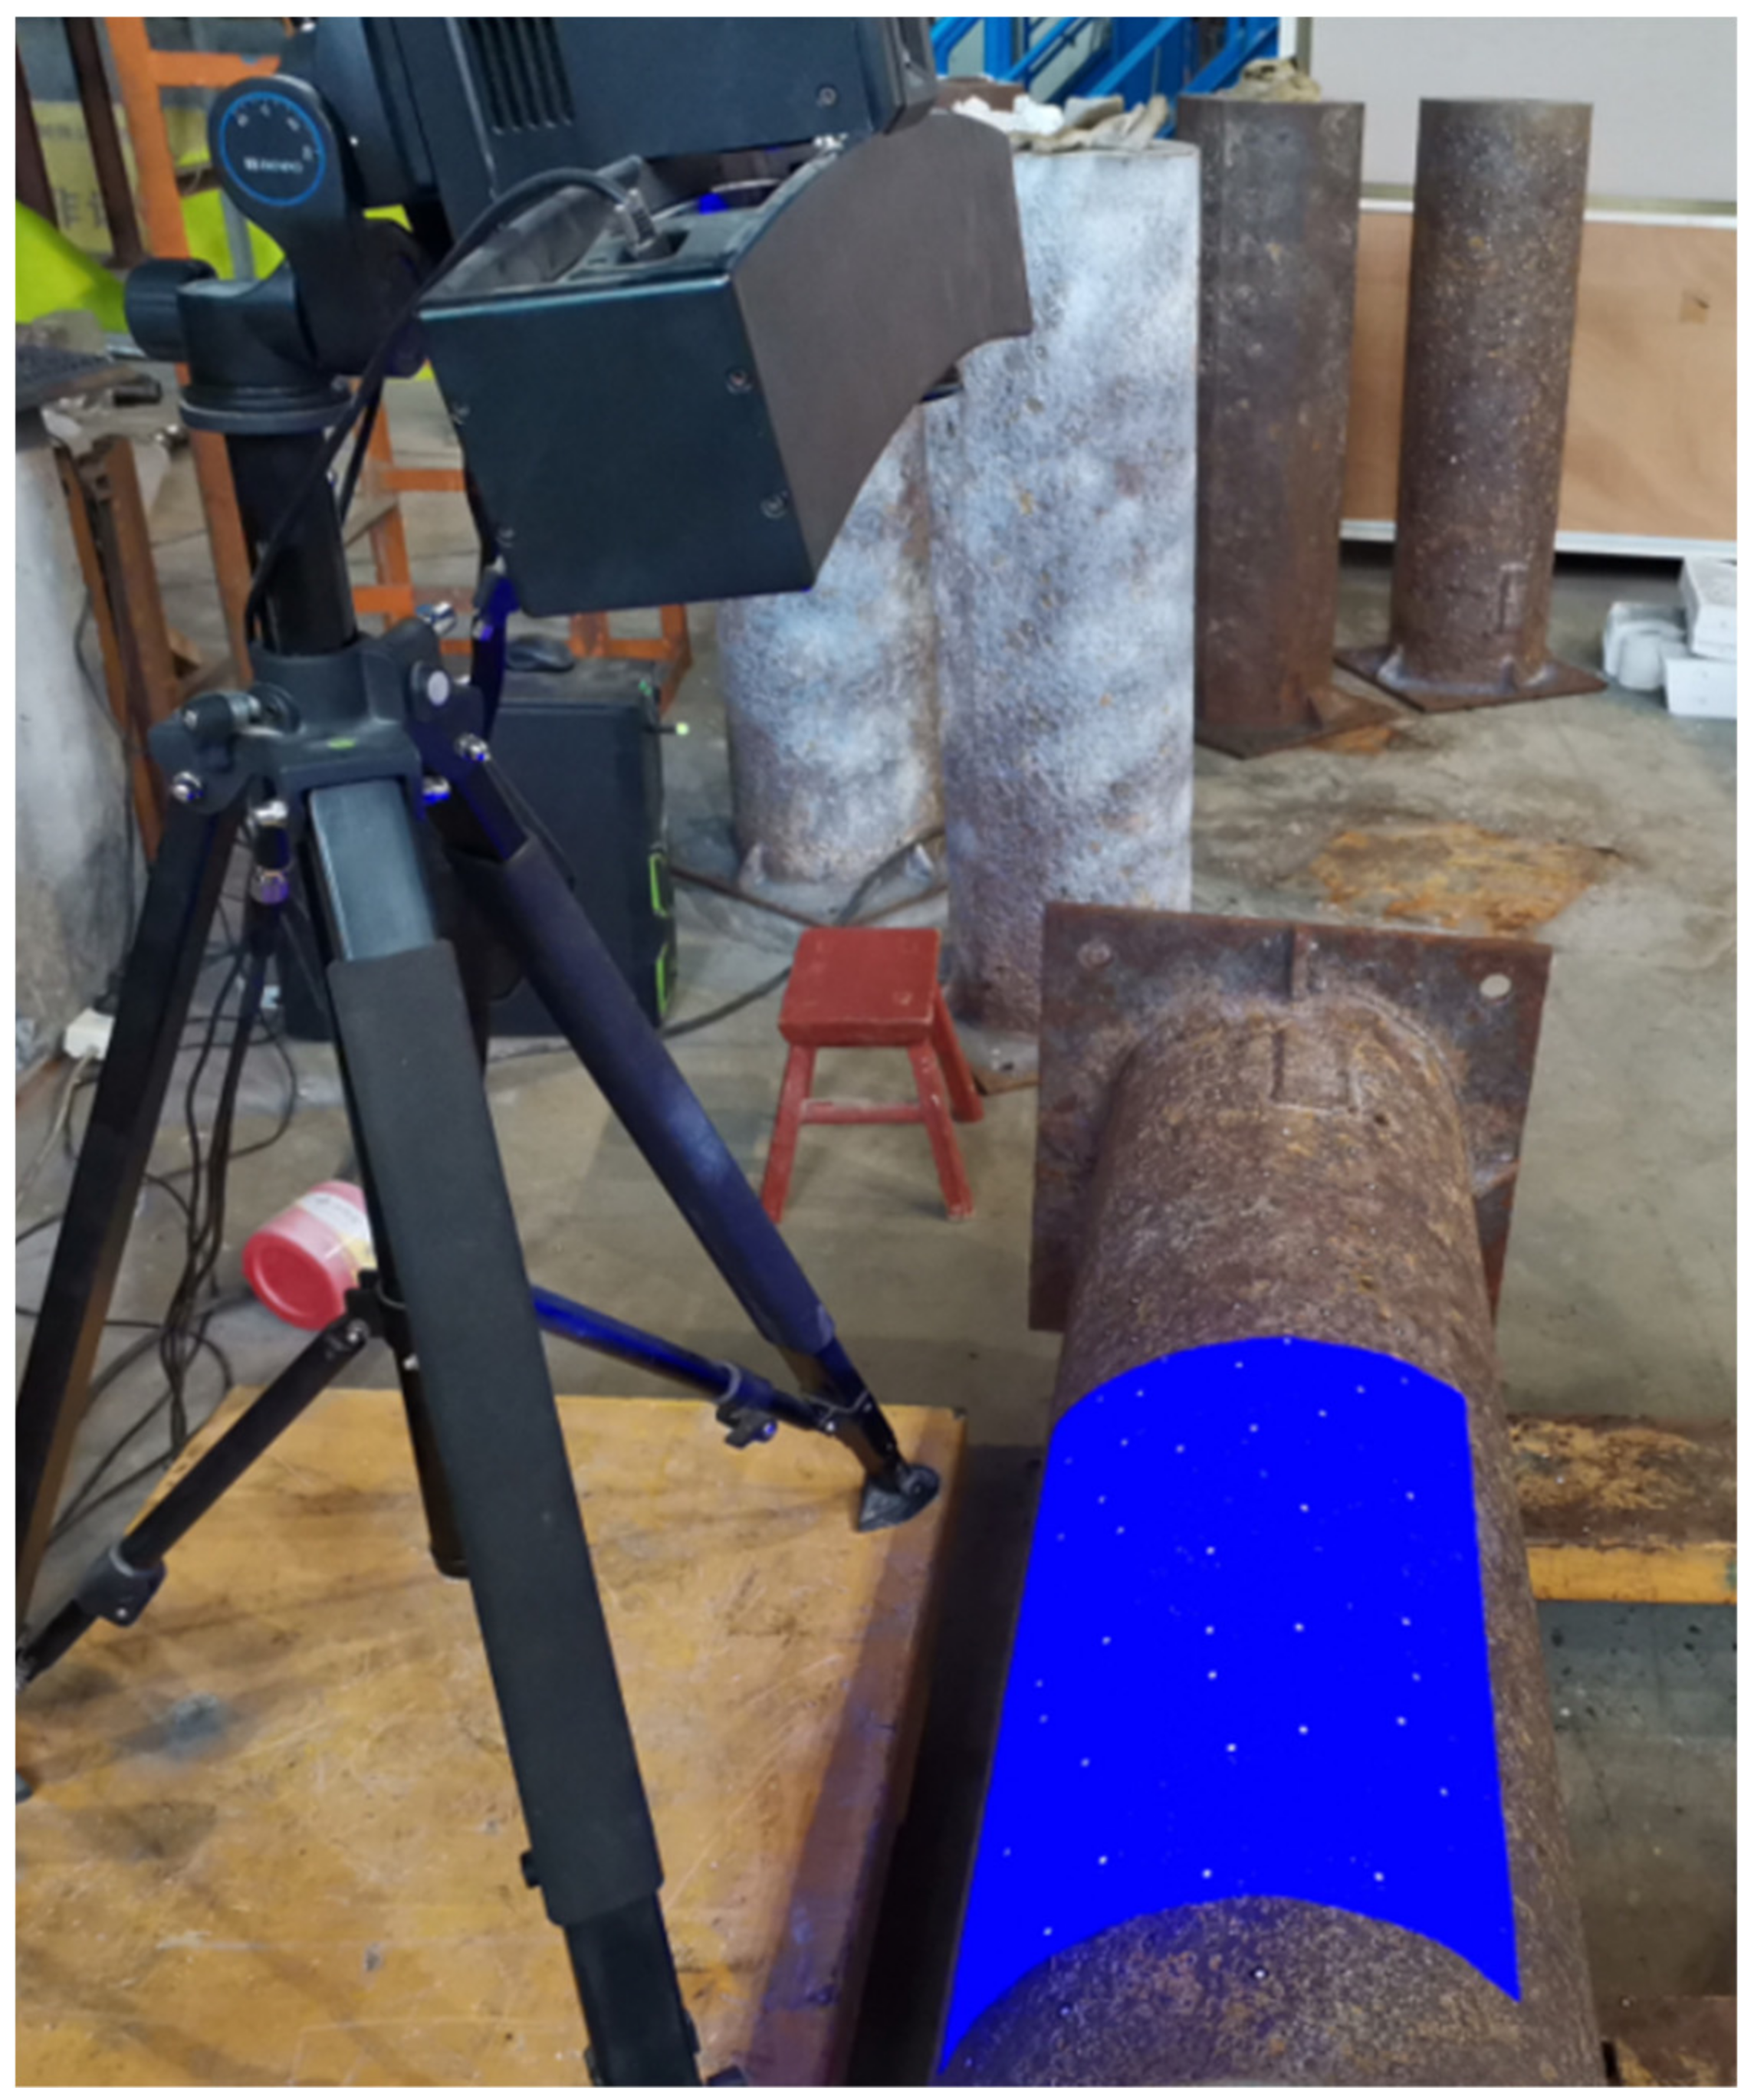
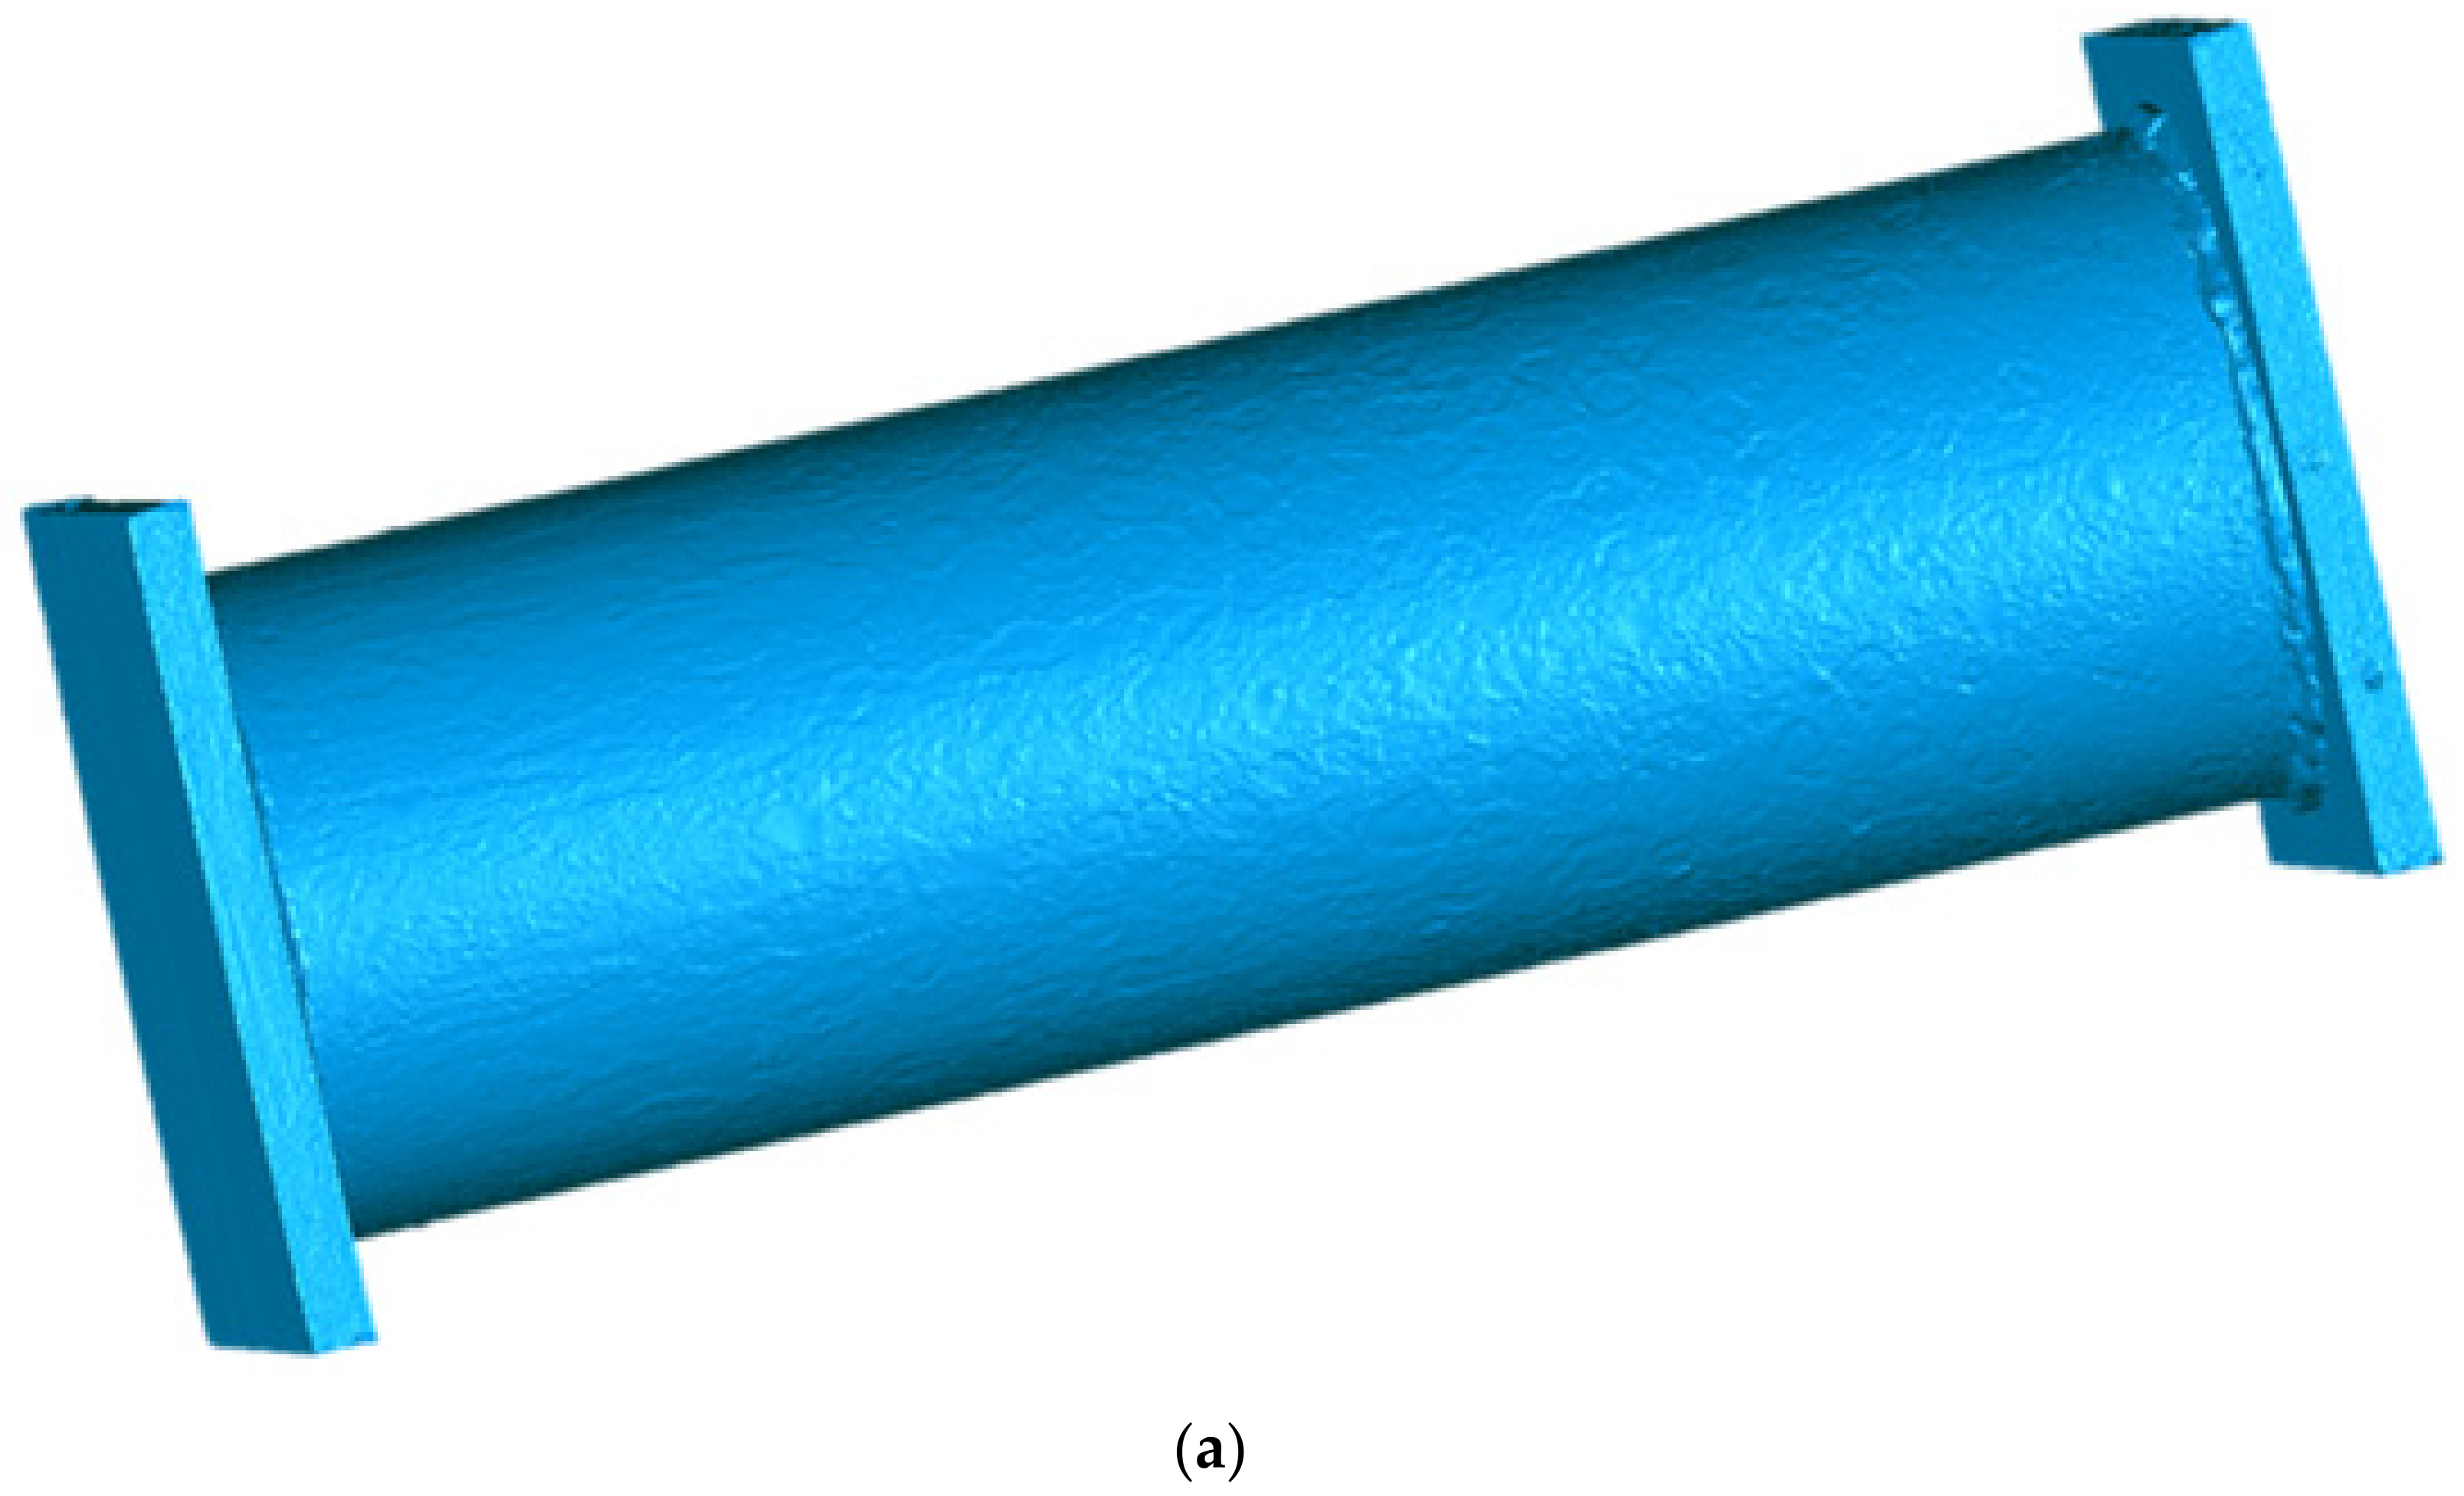
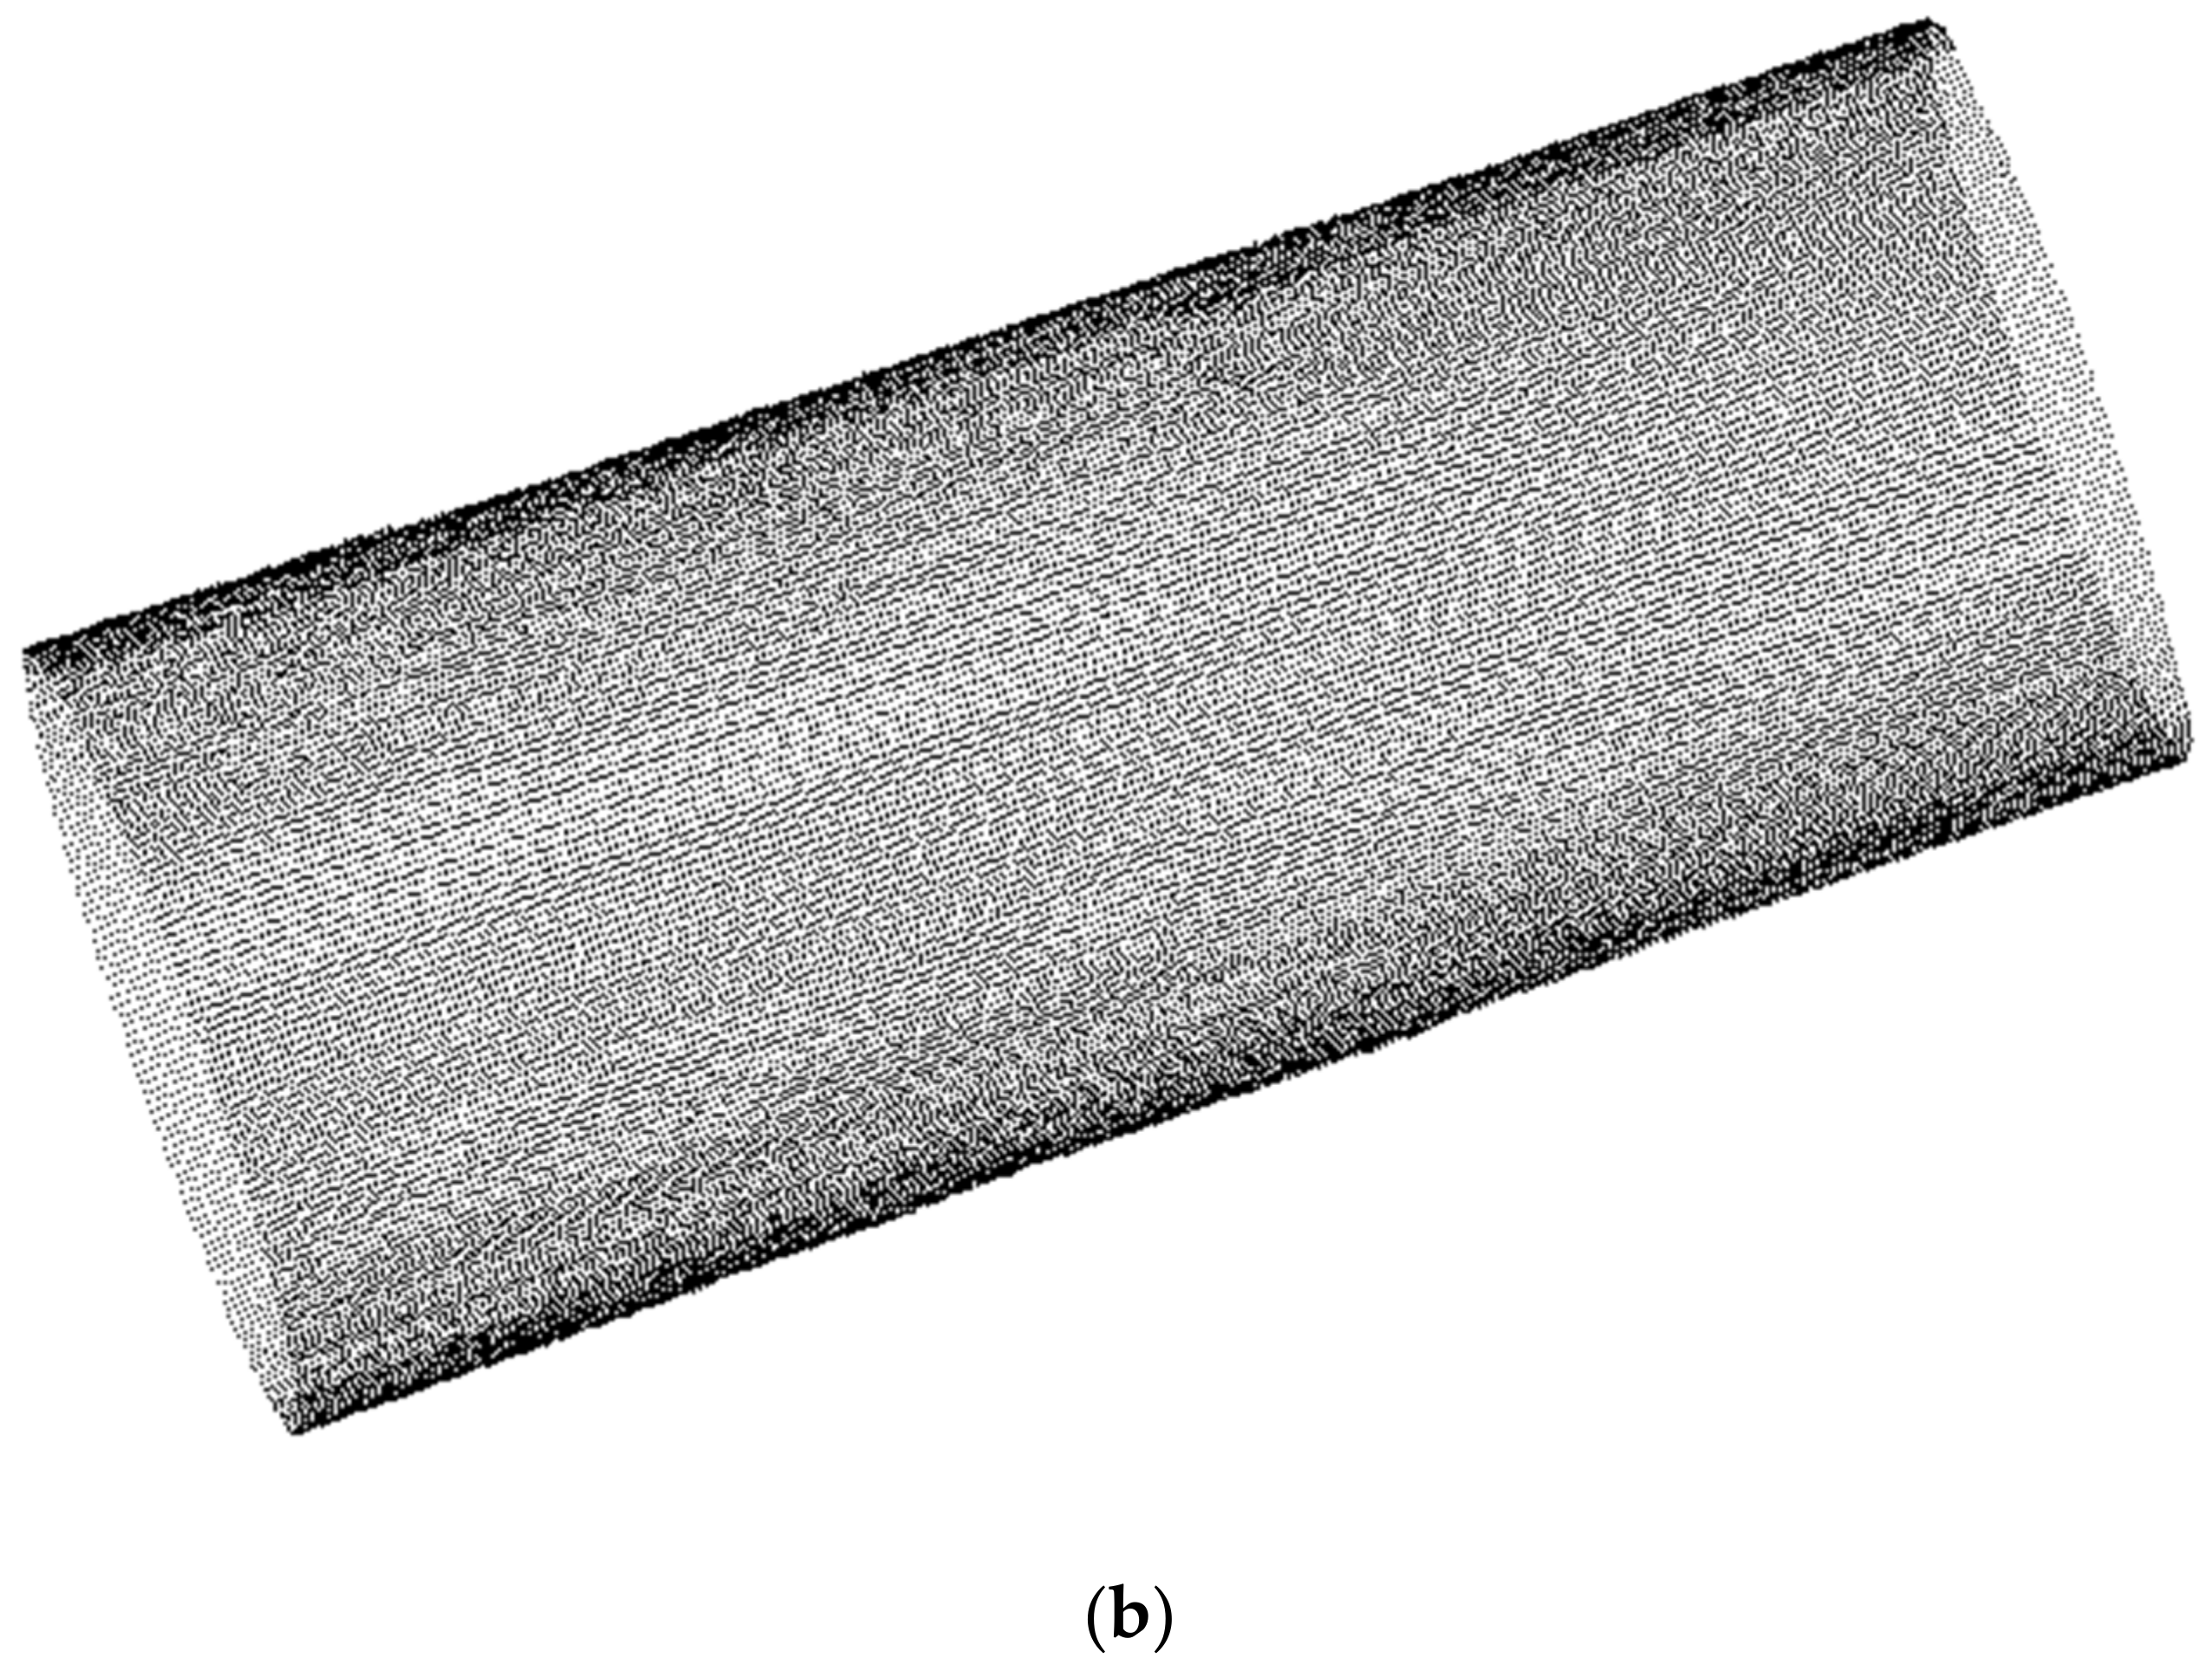
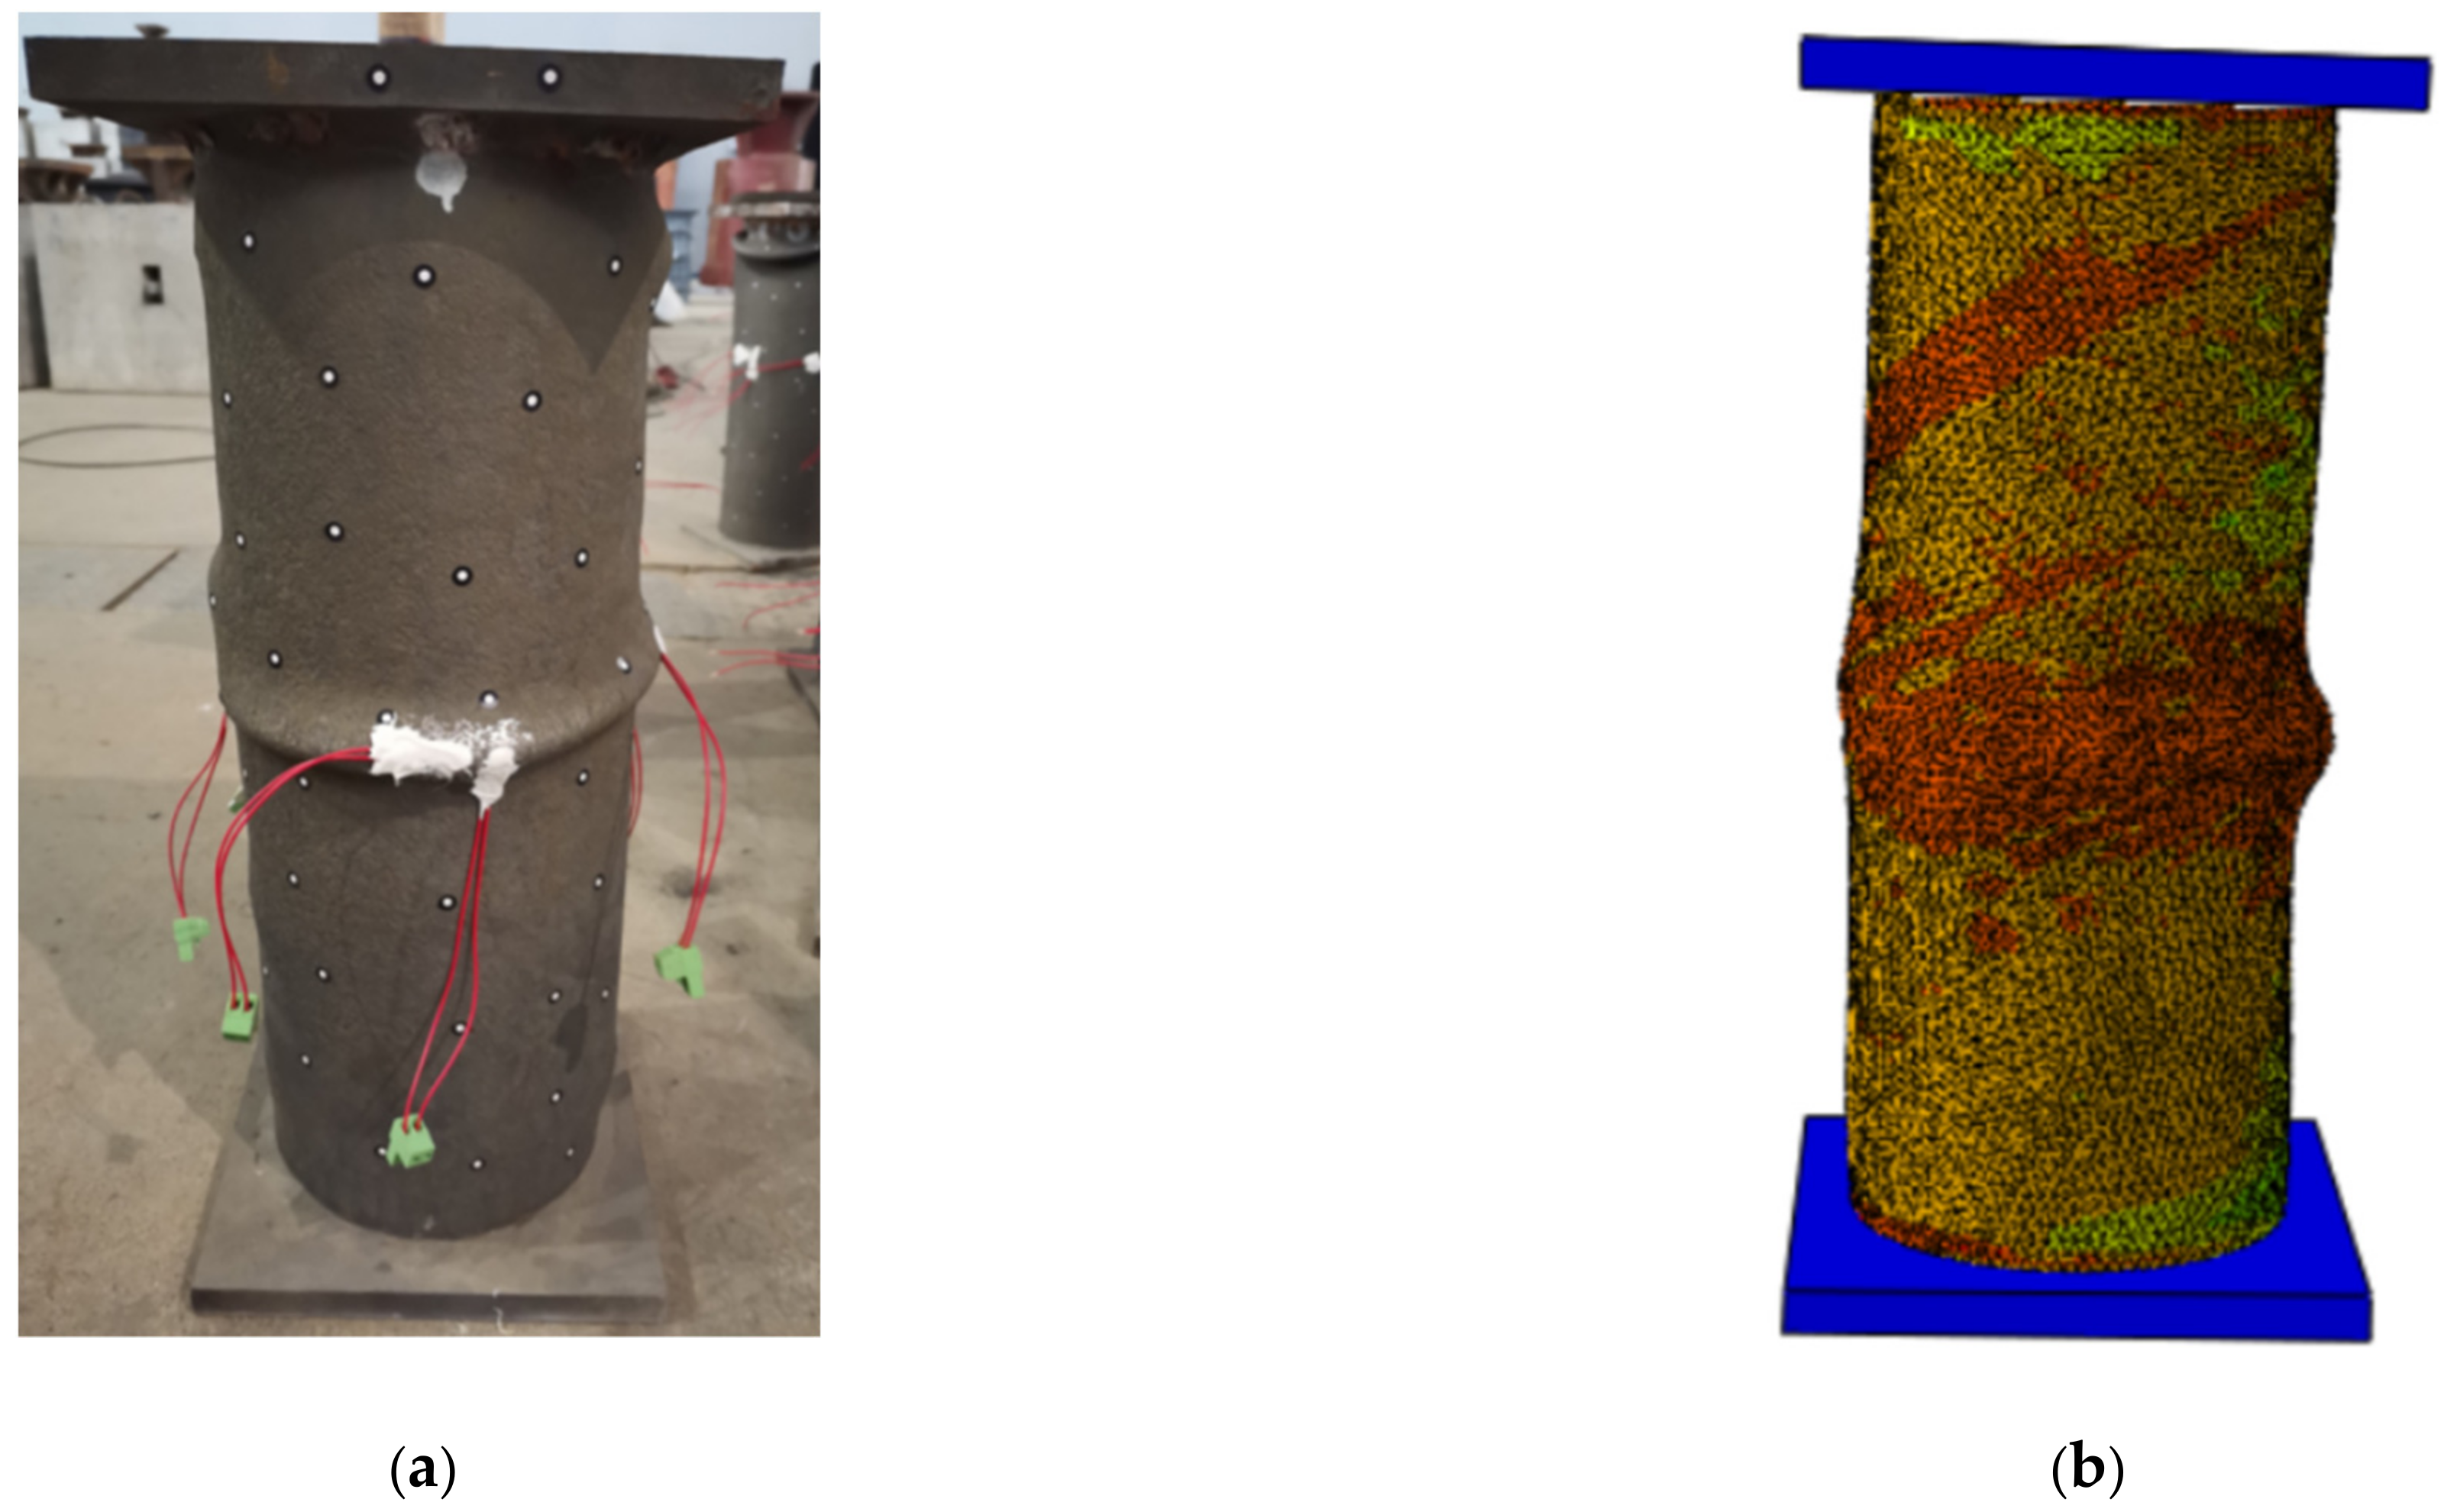
2.4. 3D Scanning Process

Shining 3D-Scanner equipment with the accuracy of 0.015–0.035 mm was used for the specimens’ outer surface corrosion tests as shown in Figure 3. Scanning was performed after the rust cleaning process was performed on the test specimens. An area of 200 mm × 150 mm could be scanned each time to form a figure of the surface profile. Multiple scanned figures could be merged into a complete surface profile of a specimen, as shown in Figure 4a. The coordinate data of each spot were obtained from the scanning results, as shown in Figure 4b.

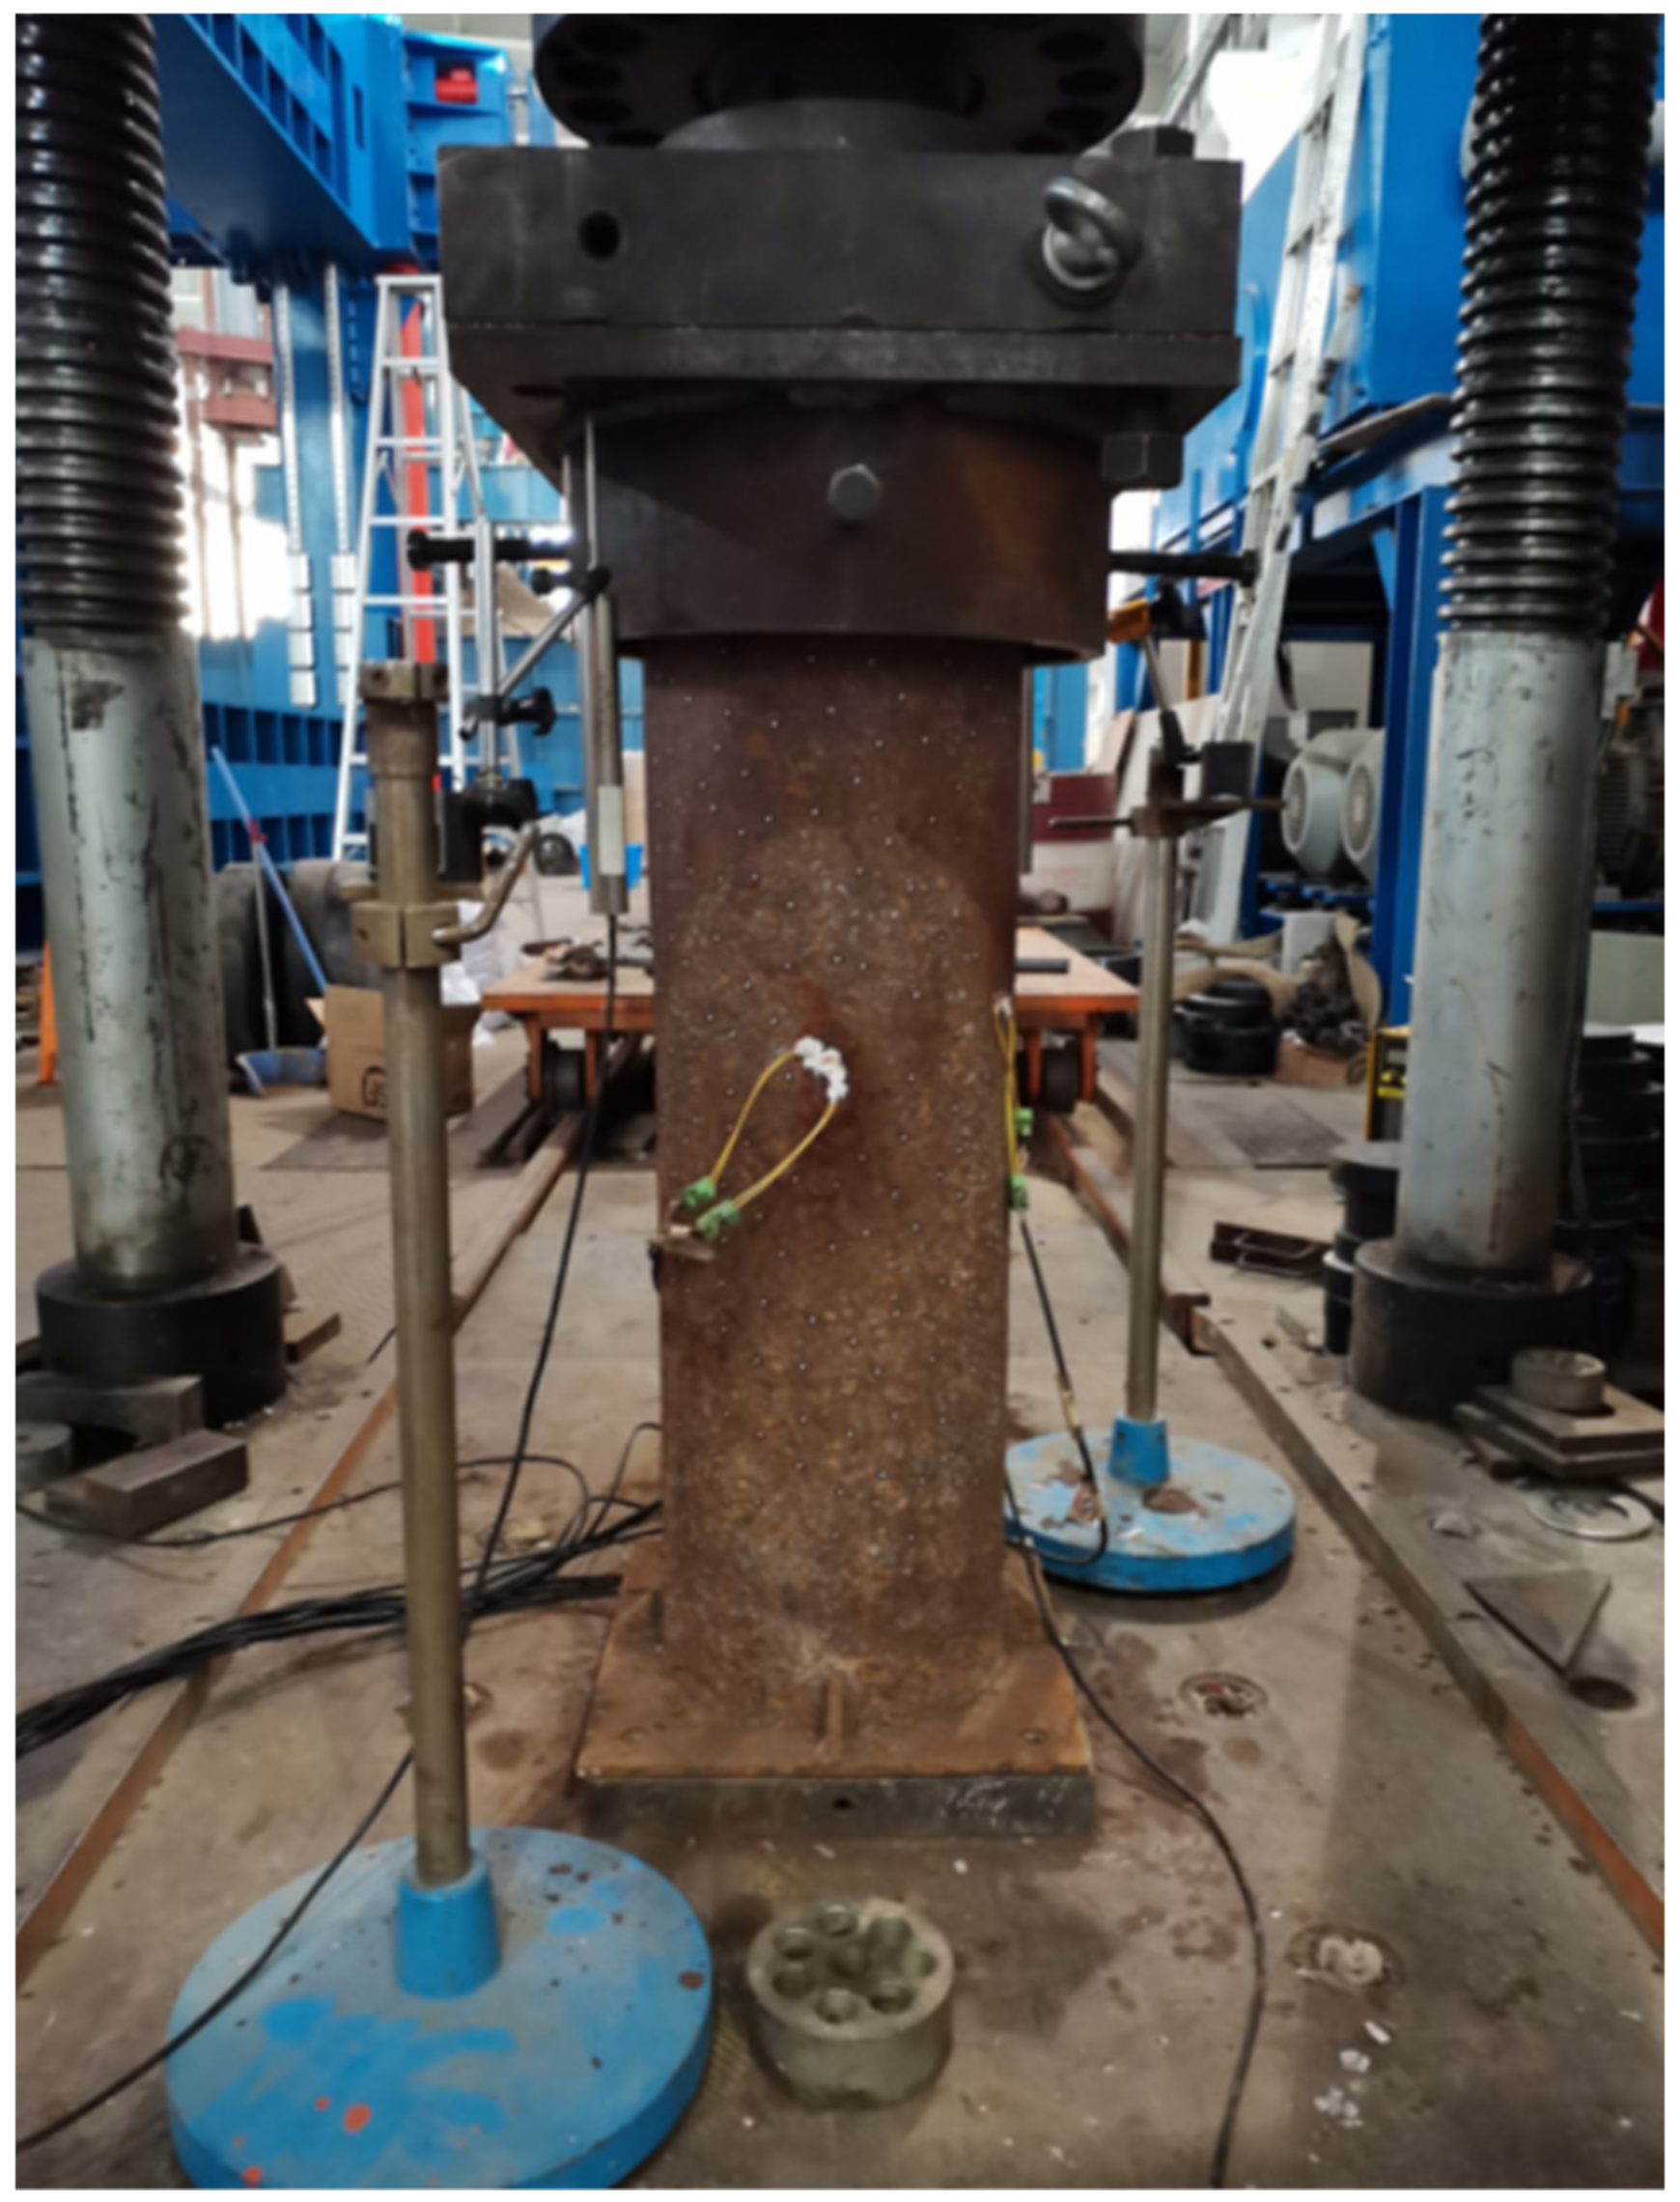
2.5. Loading and Data Acquisition

The test rig and the test set-ups are shown in Figure 5. A 10,000 kN hydraulic testing machine was used to apply compressive axial force to the column specimens by the displacement control at a rate of 1.0 mm/min. Three LVDTs (linear variable differential transformers) were positioned on the top end plate of the column specimen to measure the axial shortening. In addition, eight strain gauges were attached at mid-length of the columns to measure the strain. Four strain gauges were attached vertically, while the other four strain gauges were attached horizontally. A data acquisition system was used to record the readings of the strain and the compressive load at regular intervals during the tests.

3. Test Results

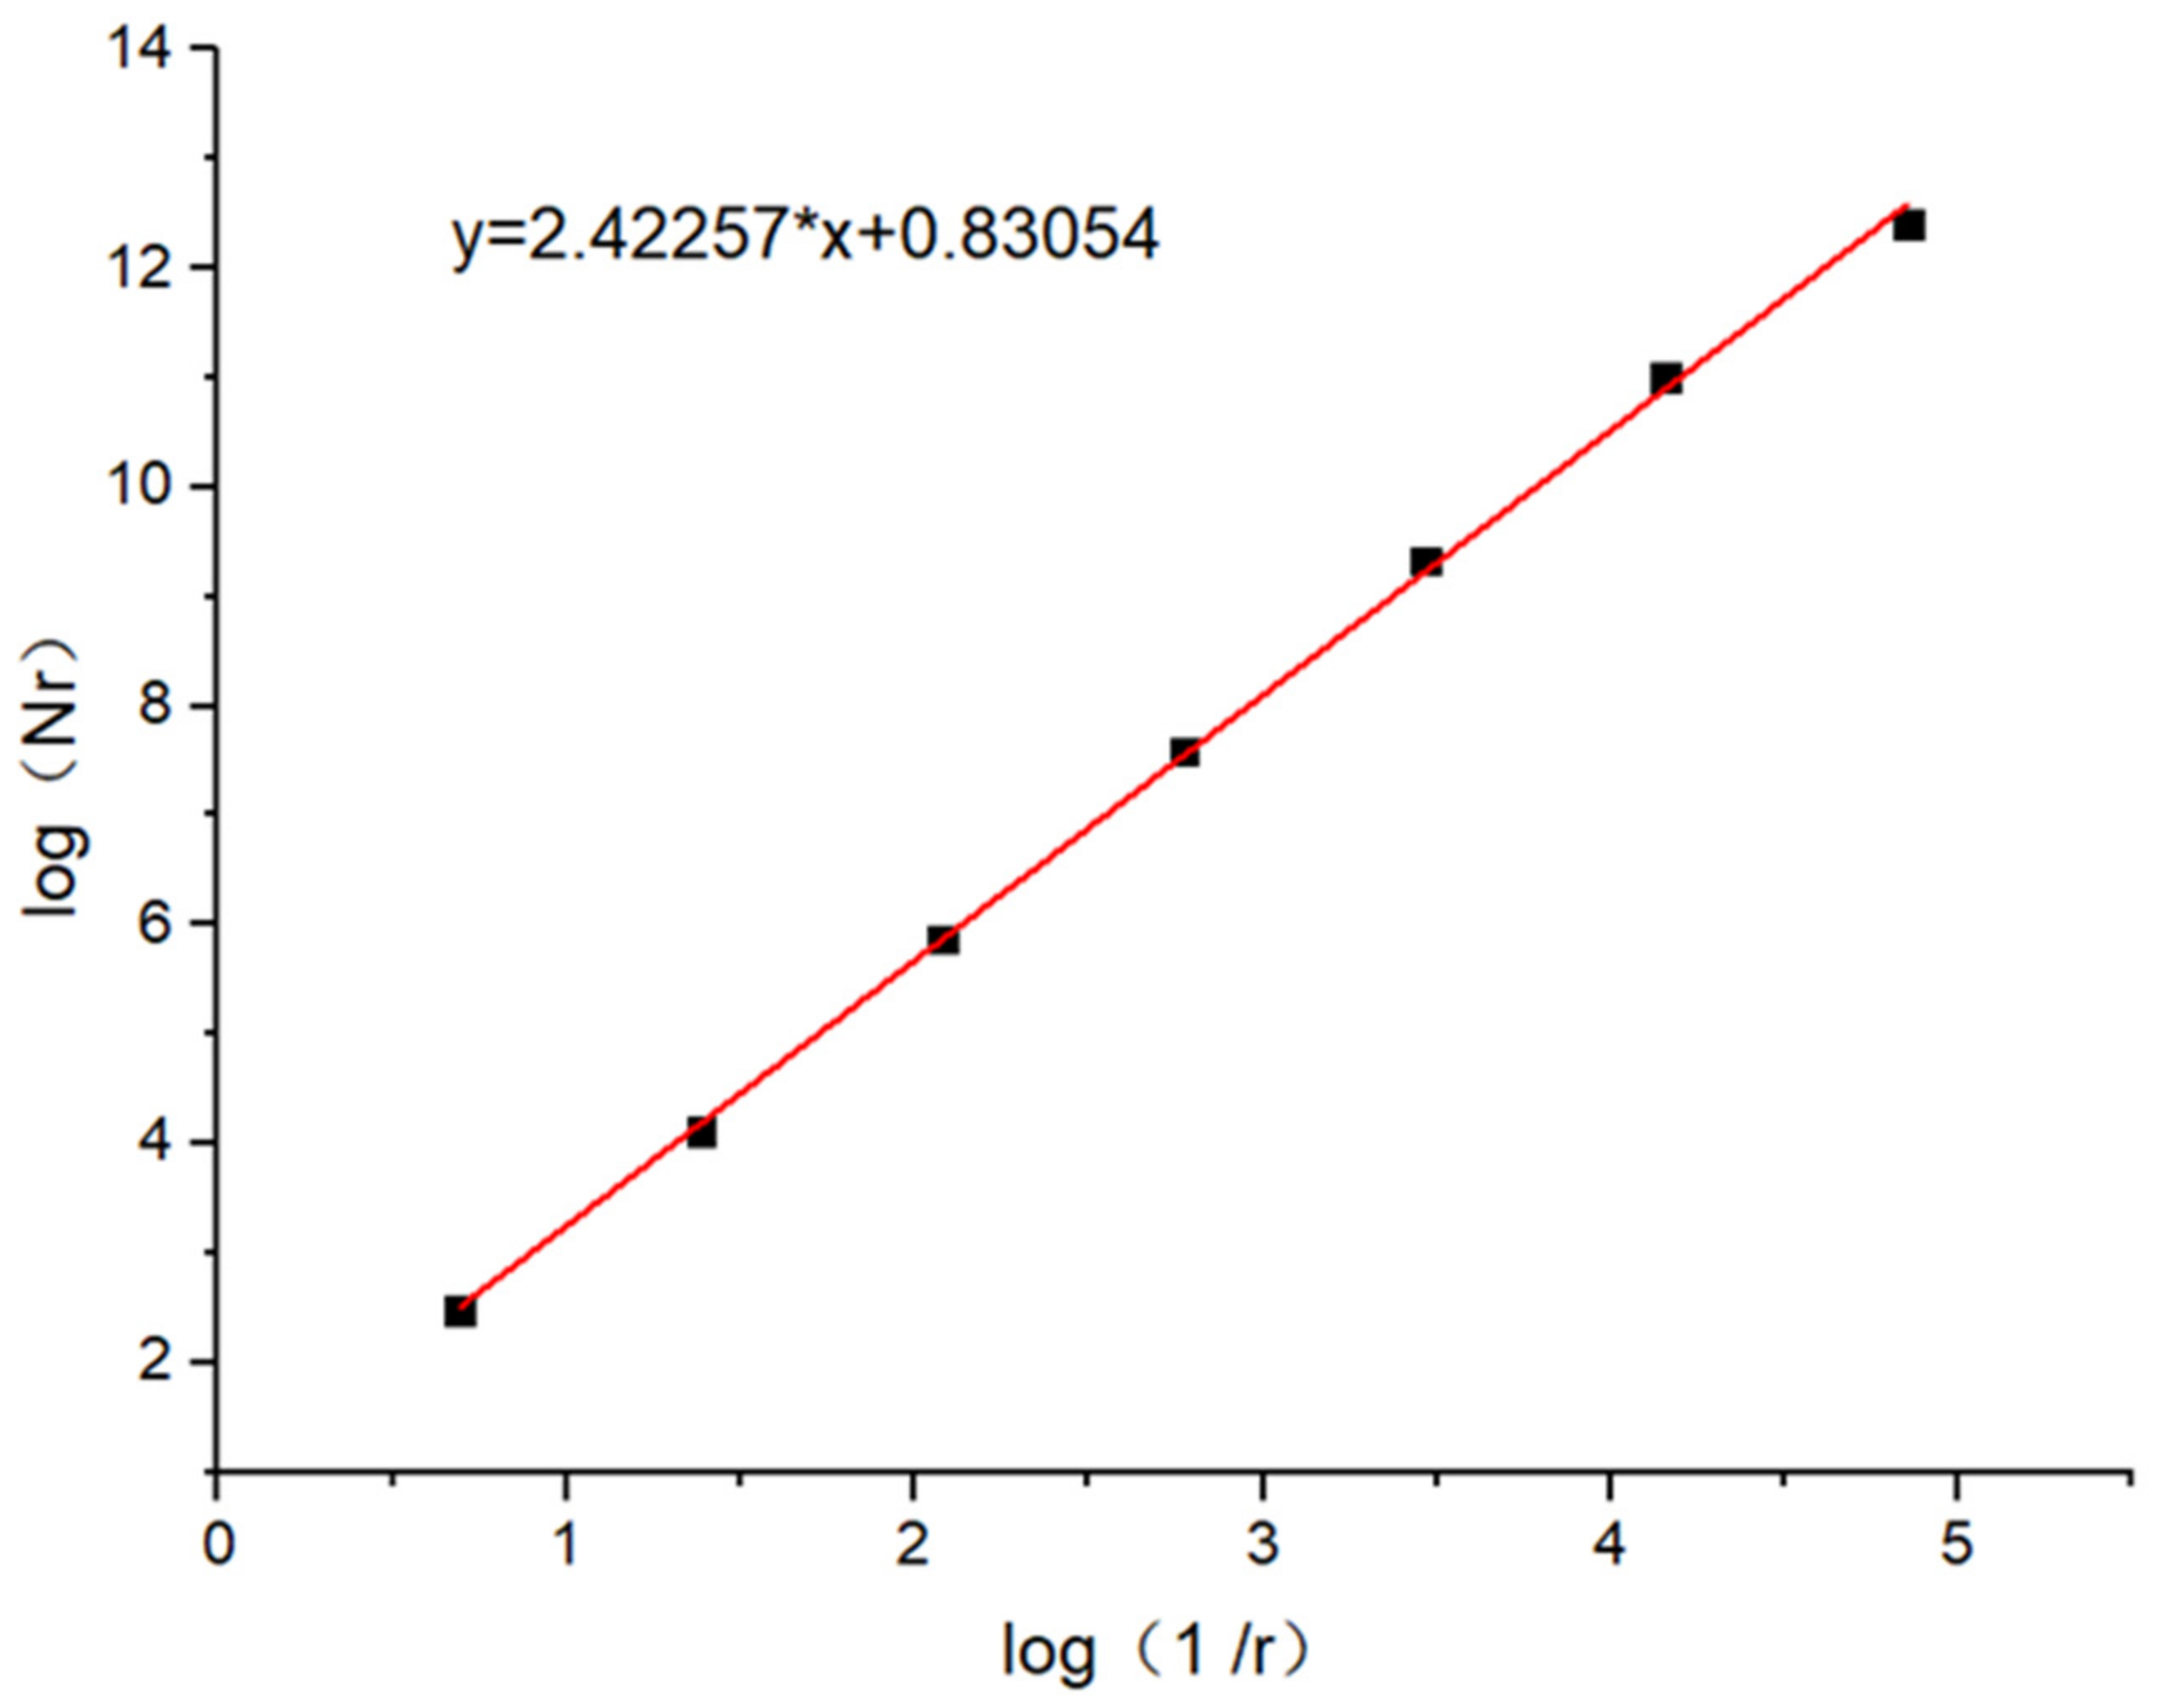
3.1. Corrosion Evaluation

Current ASTM Standard G46 [19] provided the method for evaluation of corrosion based on its density, size, and pit depth. Evaluation results of corrosion pits on the outer surface of the specimens were presented in Table 4. It is found that the corrosion evaluation of the ASTM results was approximately the same for each individual series. According to ASTM Standard G46, A-2, B-5 and C-1 are evaluated as carrion for the CT series, except for the individuals CT30C60 and CT90C60B, while the result is A-3, B-5 and C-3 for the entire AT series. It is reasonable for the AT specimens have close results thanks to their significantly identical corrosion condition. Nevertheless, the density, size, and depth of the corrosion pits are a little different for the CT test pieces, which might indicate a relatively short corrosion time, as one of the corrosion conditions is weakened once among the complete test condition parameters.
Since the density of steel remains the same after corrosion, volume loss is used to evaluate the corrosion rate in this study. The corrosion rates Ψ are calculated based on the weight of the steel tubes, seen in Equation (1), where A and A′ denote the volume of the steel tube before and after corrosion, respectively. As shown in Table 4, the corrosion differs for specimens with the same ASTM evaluation results.
ψ = ( A A ) / A %
As can be obtained from the above equation, the ASTM method and weight evaluation method are unable to evaluate the corrosion sufficiently, thus fractal dimension was also used to evaluate the corrosion in this study. The differential box-counting approach proposed by Sarkar and Chaudhuri [20] was adopted based on 3D scanning profile results. Boxes of different sizes were used to overlap the volume of steel tubes that remained after corrosion, while the fractal dimension was calculated using Equation (2), where D is the fractal dimension, r is the edge length of box, and N is the number of boxes. It has been shown that there is linear relationship between log N r and log 1 / r , such as specimen AT1100C50A in Figure 6, which illustrates that the corrosion has the fractal feature. The fractal dimensions of the corrosion of test specimens were calculated and presented in Table 4. It is shown that the fractal dimensions of corrosion were different for the specimens. It shows that the fractal dimension value generally increases with increasing corrosion time for the CT series specimens, while the fractal dimension value exhibits a 5% variation though the specimens that have identical corrosion times. Meanwhile, the average value of a fractal dimension for the AT series specimens is 2.3487, which is close to that of the CT120 specimens, conveying that the fractal dimension of the atmospheric corrosion over three years is approximately equal to that of the chloride corrosion over about 120 days in this study.
D = log N ( r ) log ( 1 / r )

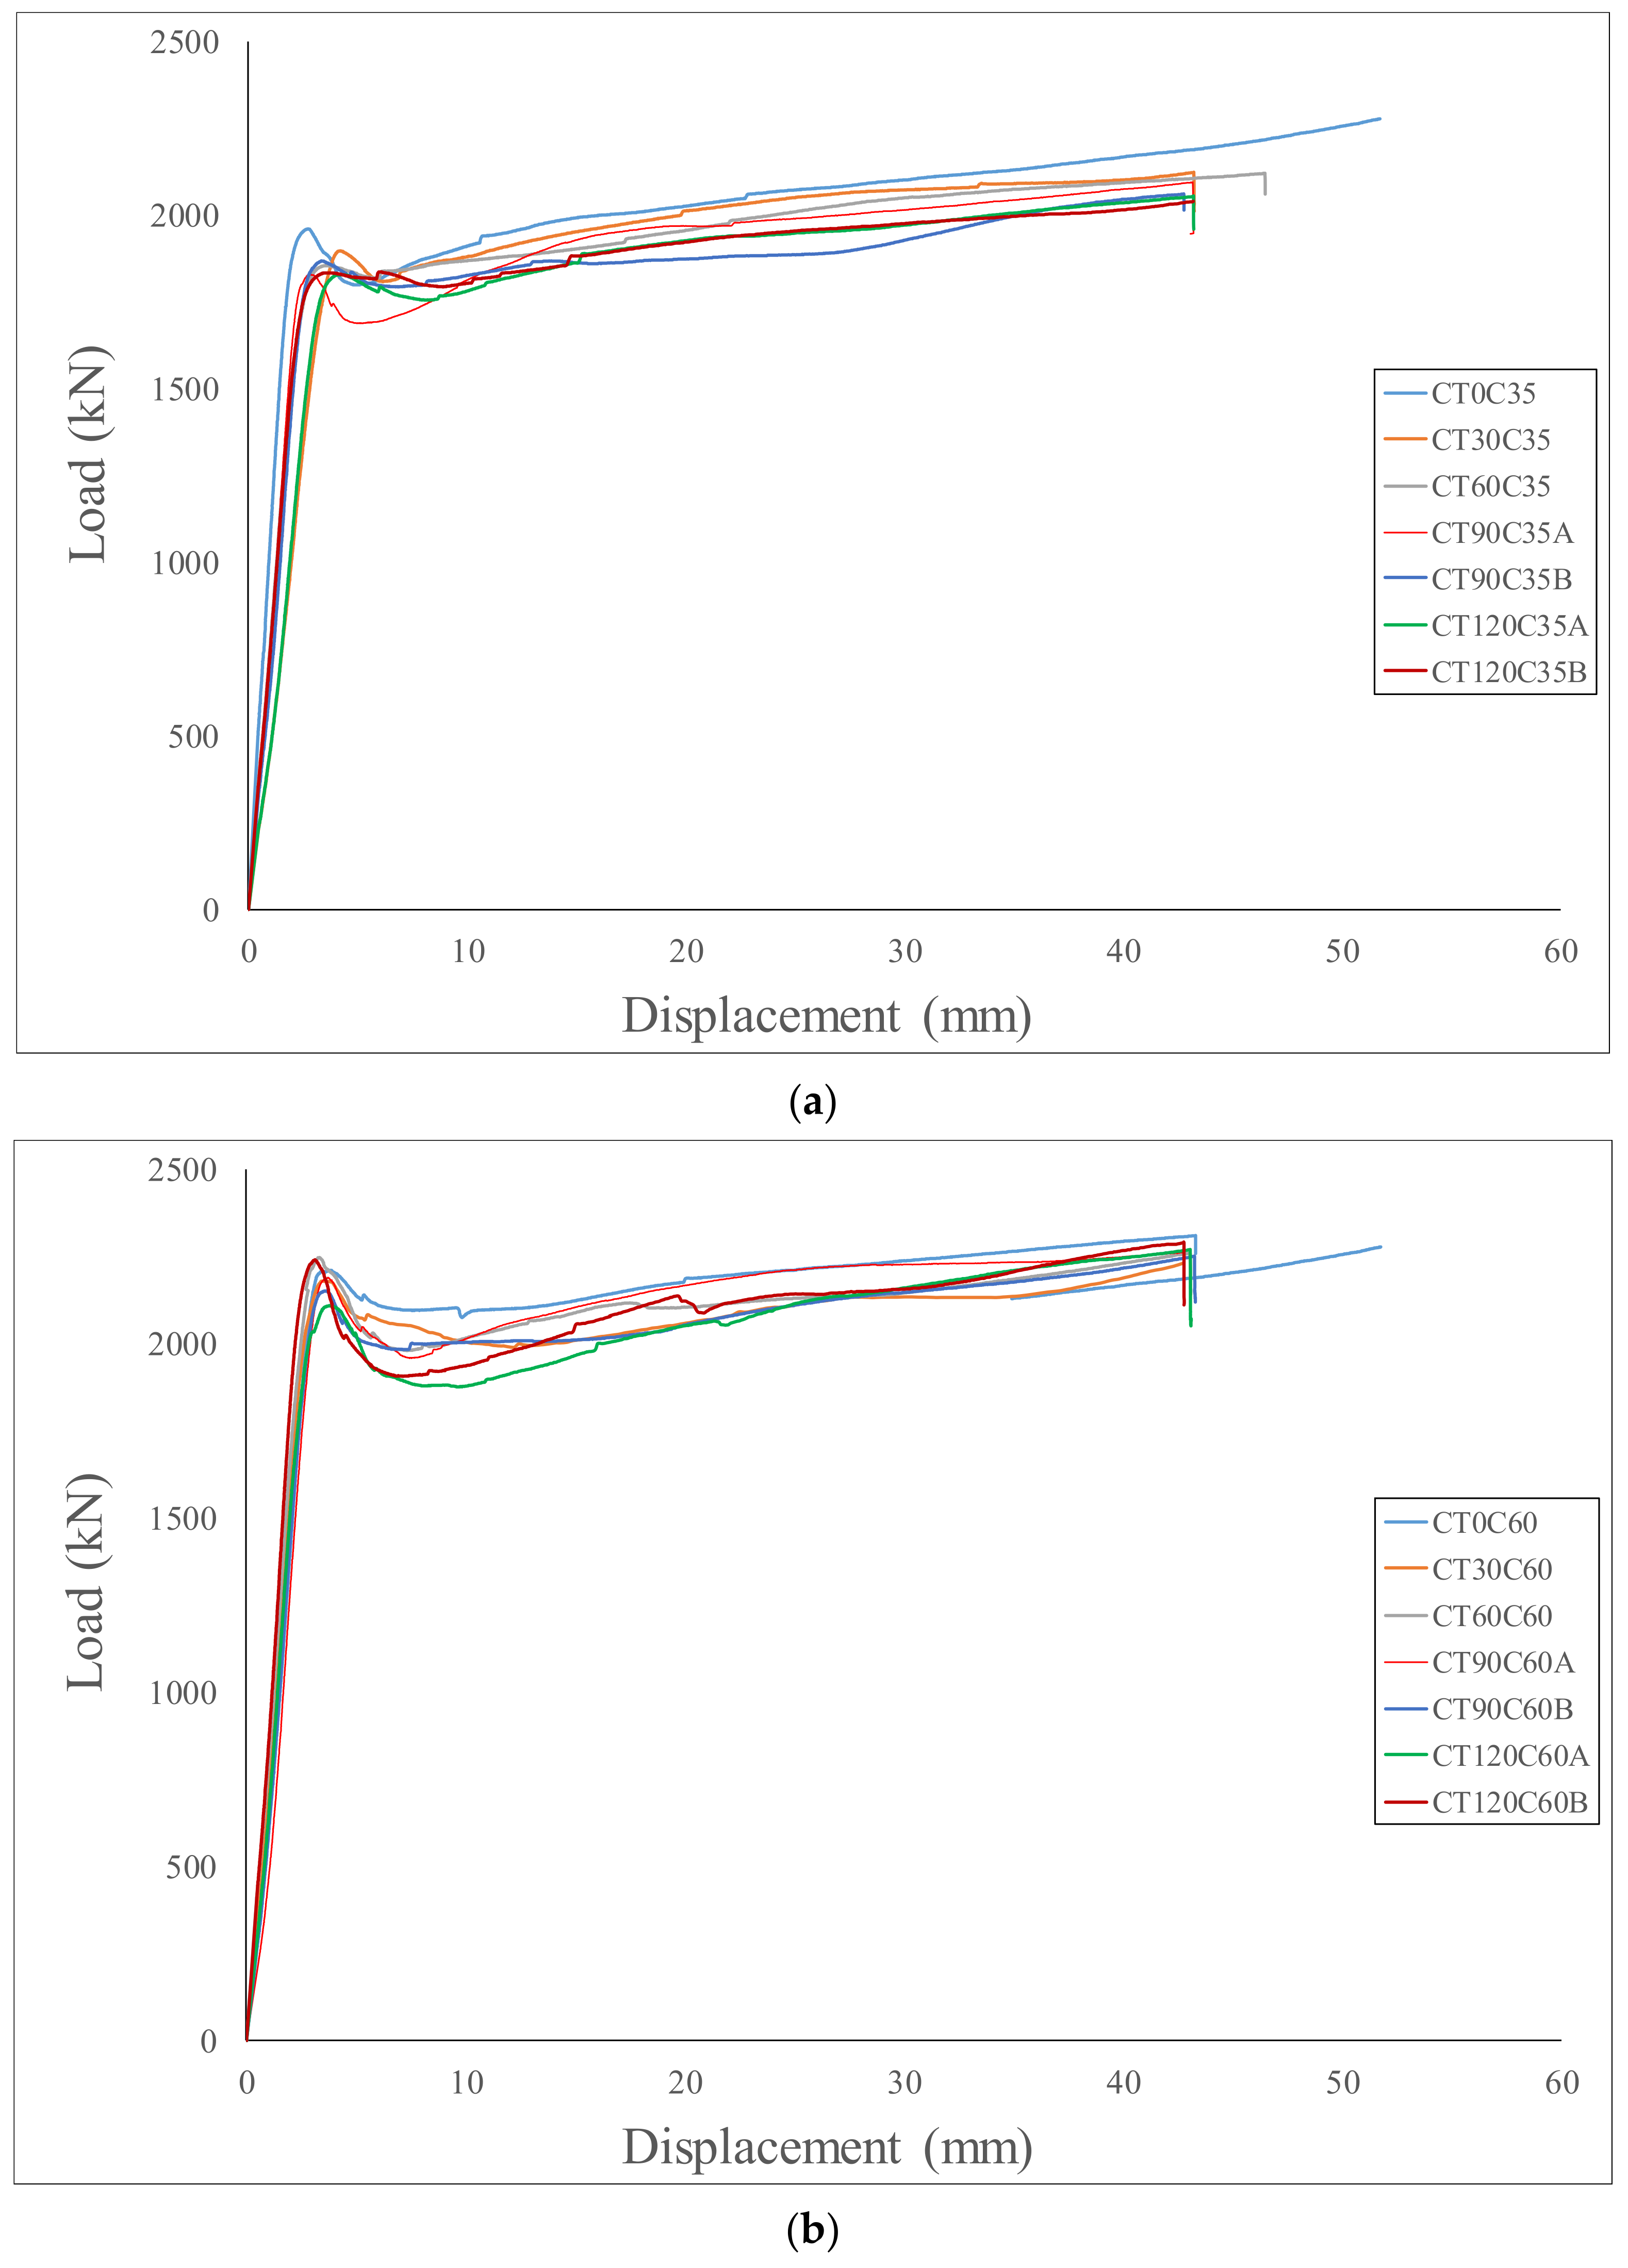
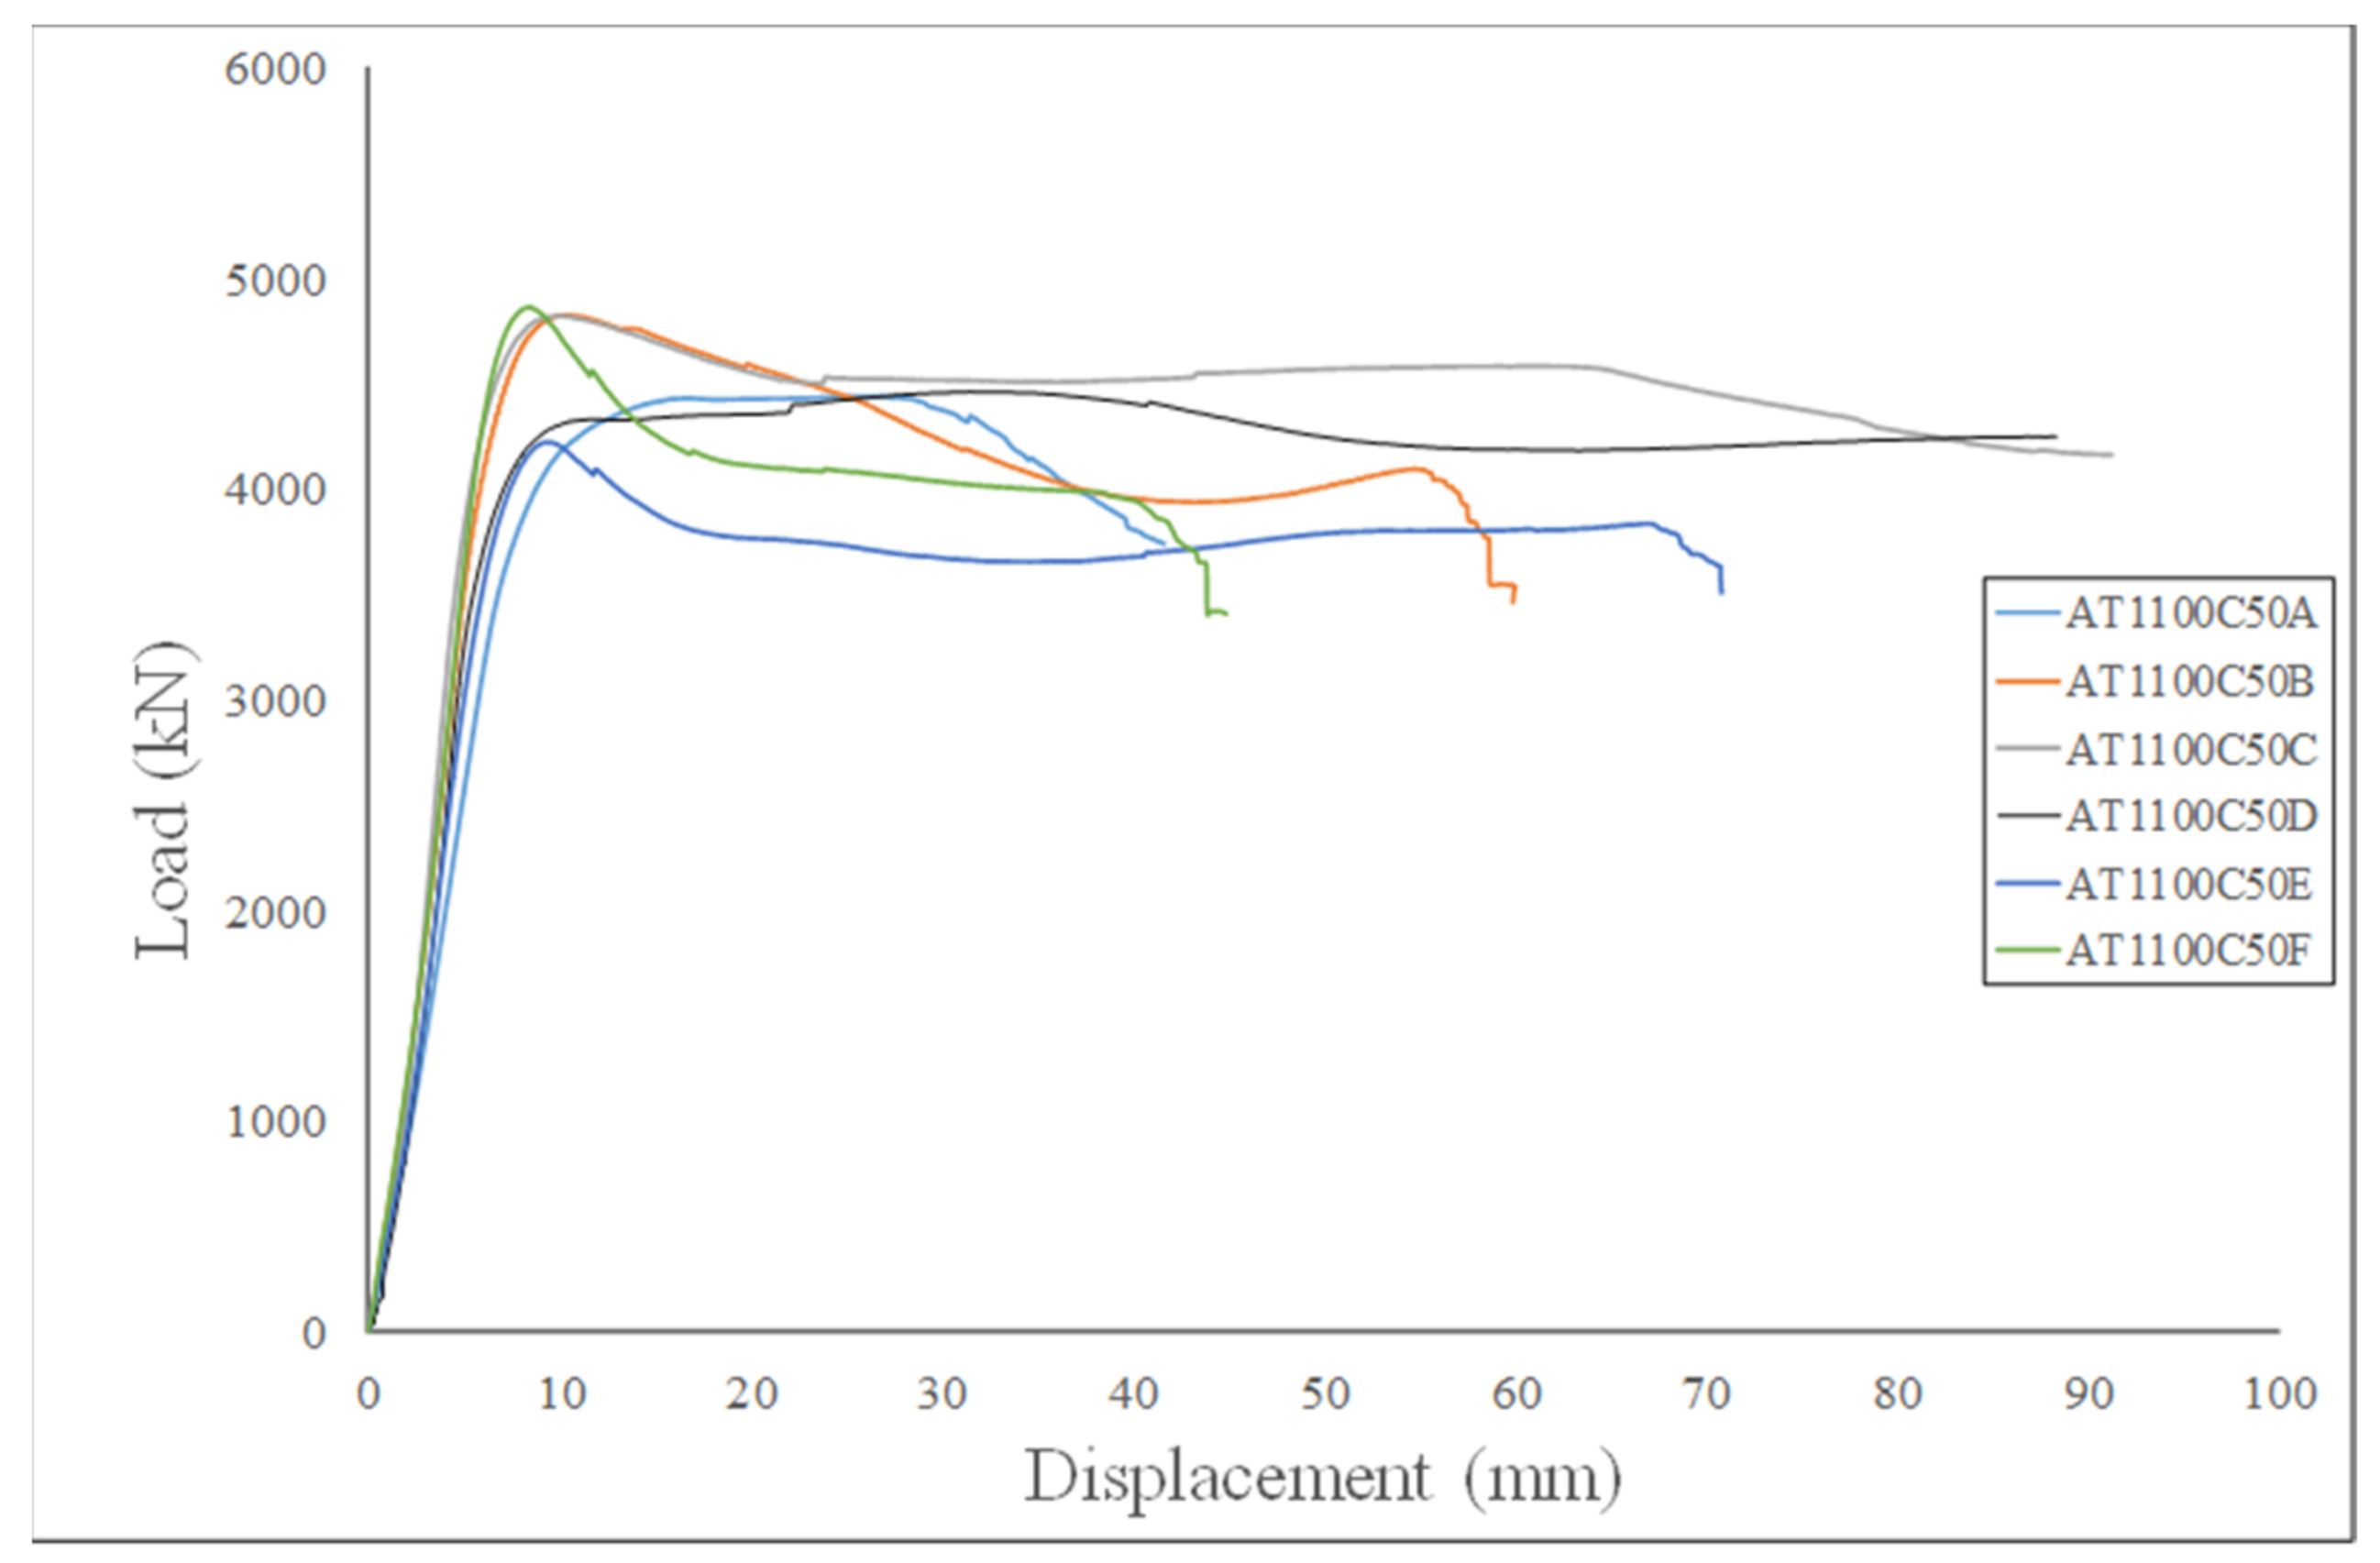
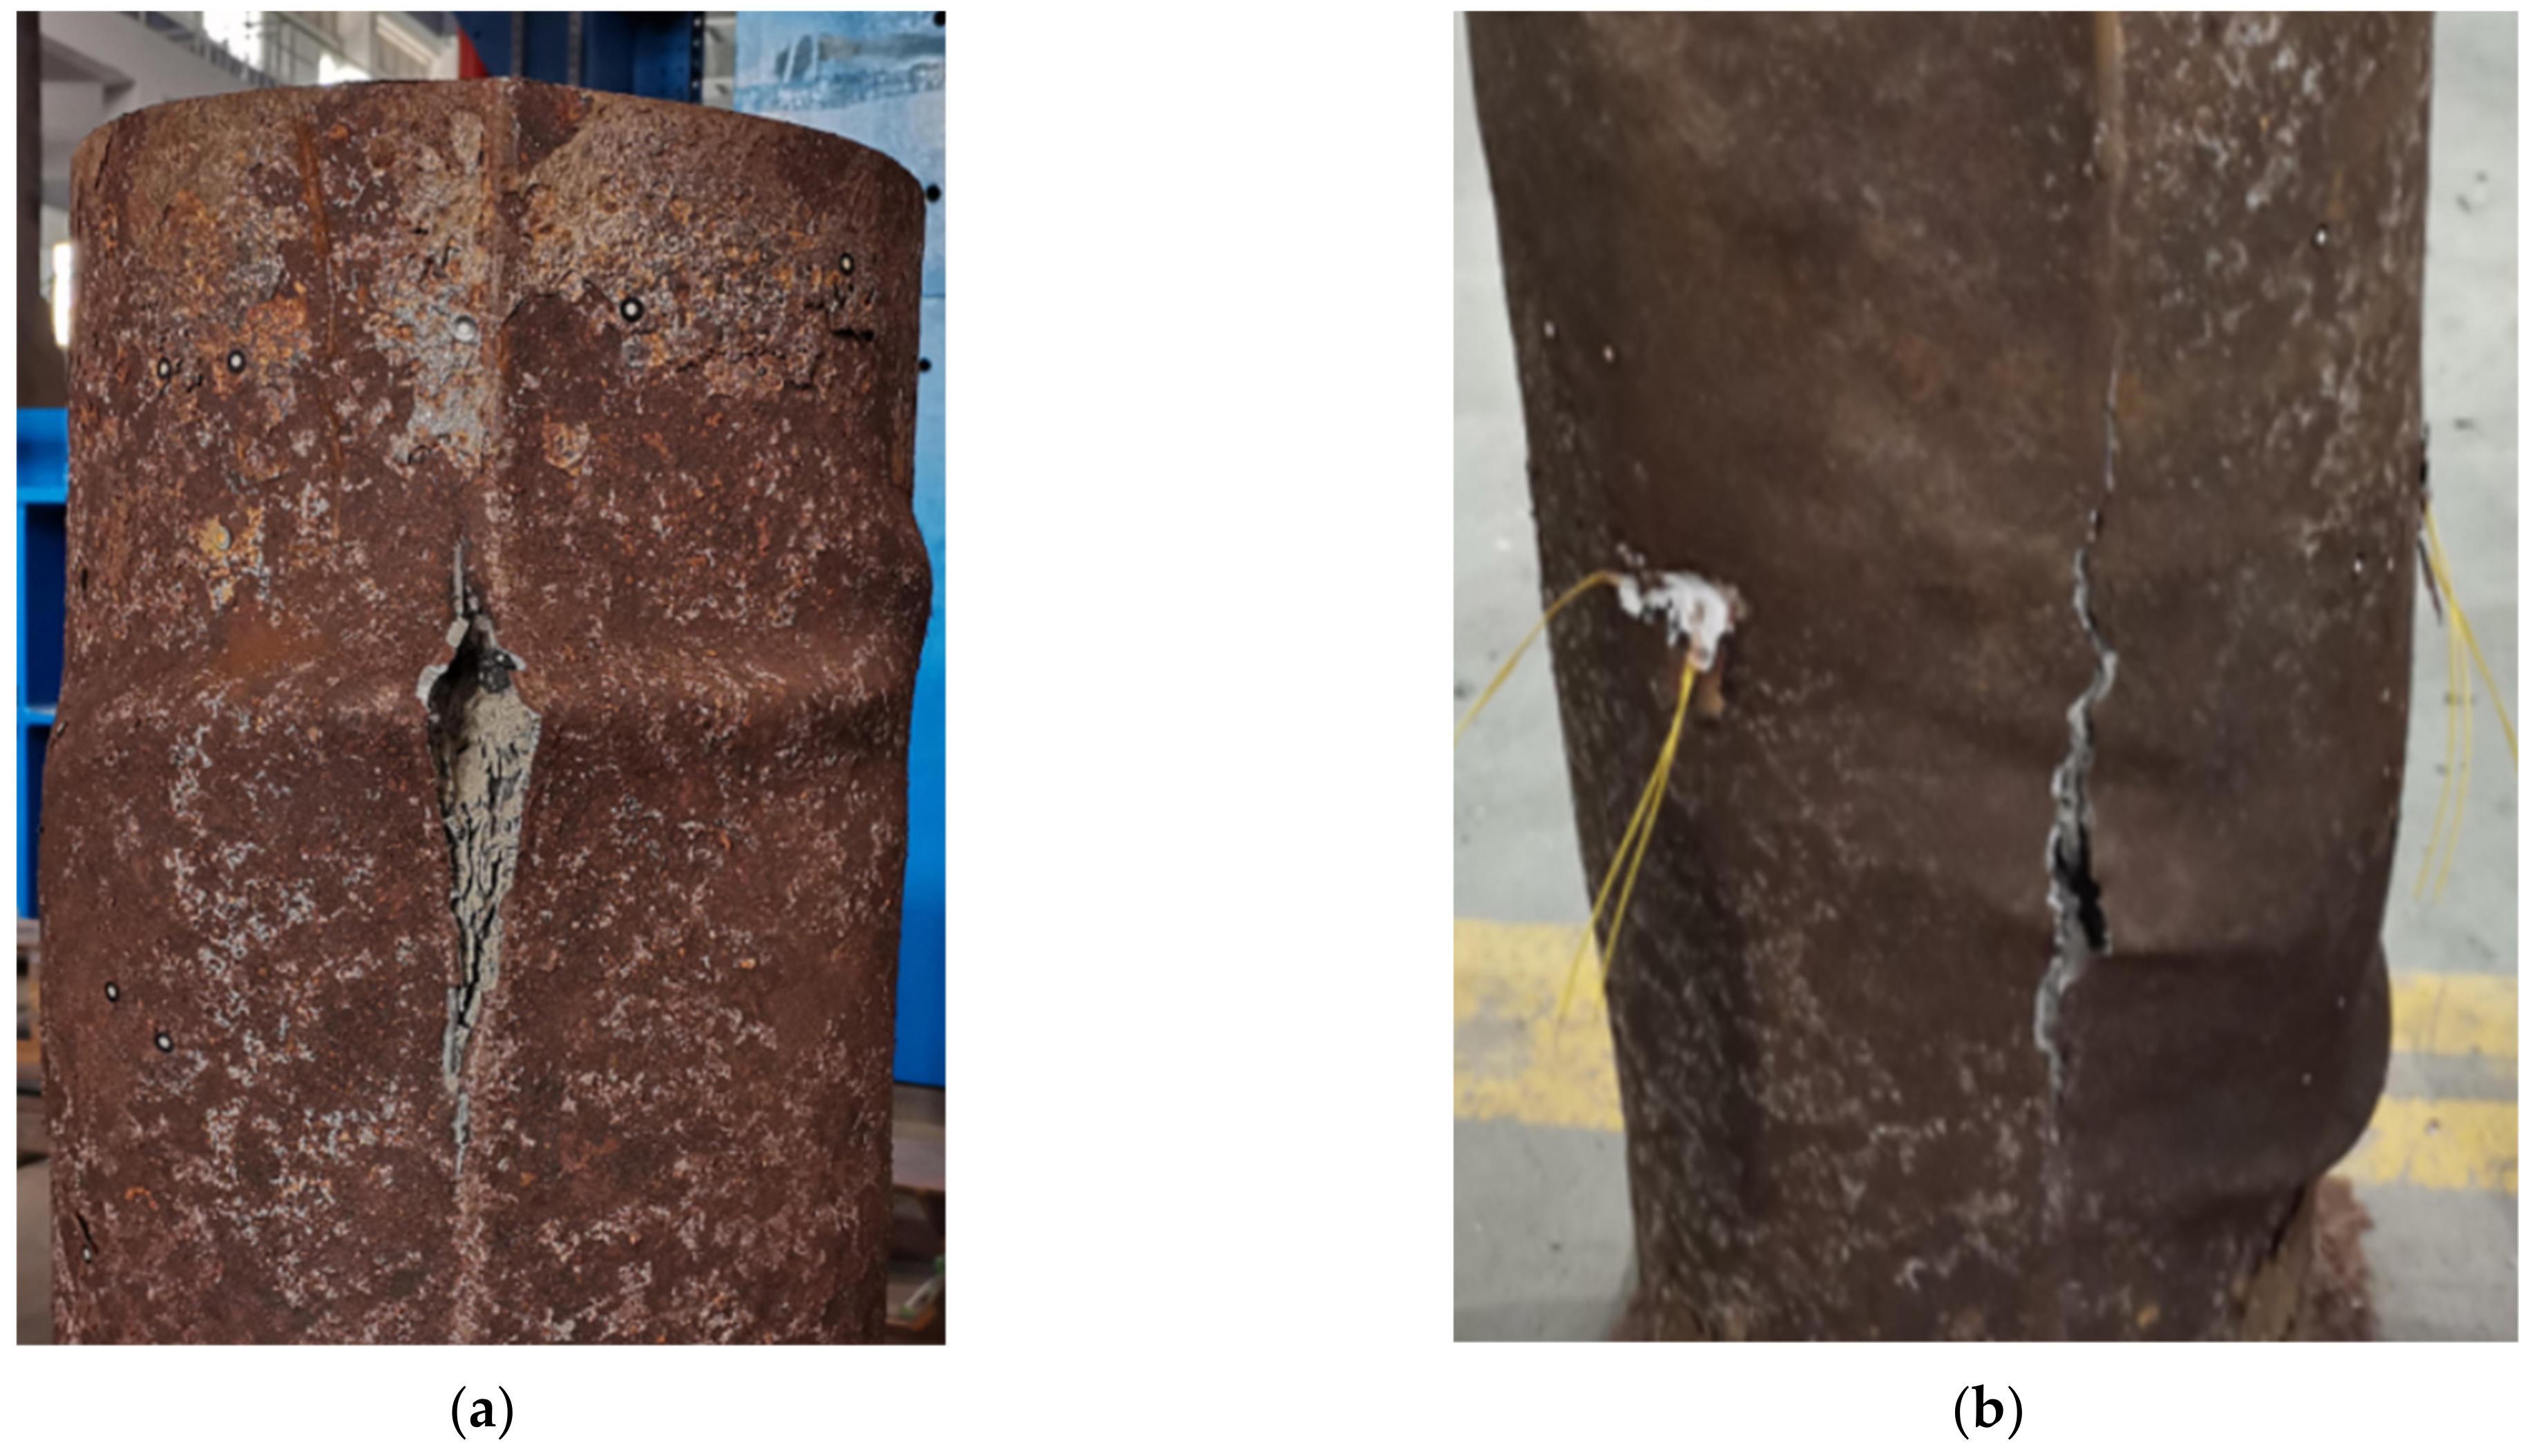
3.2. Loading Test Results

The load-displacement curves of the test specimens are plotted in Figure 7 and Figure 8. Based on observation during the test process and the analysis of test data, the specimens are thought to experience two stages under loading. In the initial stage, the concrete and steel tube work together before reaching the first peak load. During the second stage, the load generally continues to increase after undergoing a short decrease. In the latter phase, large deformation of the steel tubes could be clearly observed as shown in Figure 9. It is worth mentioning that since the load increase in the second stage may lead to a cross-section increase for stub columns, the peak load in the first stage was considered the ultimate load in this study. If no peak load was found at the first test stage, the maximum load would be considered the ultimate load, as in AT1100C50C and AT1100C50D. Both of the small value differences between the repeated tests and the first value of each test set demonstrated the reliability of the test results, which has been presented in Table 5. It is shown that the corroded CFST specimens have a relatively lower ultimate load compared with the non-corroded counters, with up to a 10% reduction at most. A clear relationship between the ultimate load and corrosion rates has not been shown, which may relate to the variations in concrete strengths of specimens.
The test observed that the steel tubes of columns, which experienced ultimate loading, eventually displayed final buckling failure. However, for test specimens AT1100C50A, AT1100C50B, AT1100C50E, and AT1100C50F, a fracture of the steel tube was observed at the second stage of the L-D curves, as seen in Figure 10. Displacements corresponding to their fracture point were 42 mm, 44 mm, 60 mm, and 70 mm for specimens AT1100C50A, AT1100C50B, AT1100C50E, and AT1100C50F, respectively. Generally, the fracture occurred at the welding, which suffers the most severe corrosion, as shown in Figure 10. As shown, the welded steel tube is fractured due to the tensile stress caused by hoop expansion. Load versus average hoop strain curves of specimens from the AT series were plotted in Figure 11. Average hoop strains corresponding to their fracture points were 2912, 2584, 2232, and 3303 με, respectively. The results demonstrate that corrosion has a significant effect on the ductility of the CFST column specimens with welded steel tubes. It should be noted that the effect of corrosion on the fracture of a steel tube due to horizontal tensile force has not been reported previously.

3.3. Comparison with Design Predictions

In order to investigate the suitability of the design equation for normal CFST columns for the corroded members, the design strengths of uncorroded specimens were predicted. Current AISC standards [21] and the design method proposed by Xu et al. [2] were used for the predictions. Table 5 has shown the compared results. It is found that the design predictions are conservative, especially for 480-mm CFST columns, which may be due to the end constraint effect [2], as shown in Table 5. The mean value and corresponding COV of PDesign/PTest are 0.75 and 0.169, respectively. Comparison indicated that the design equations for normal CFST columns are able to predict the column strengths of the corroded members in this study. Since the stub CFST columns are able to resist the compression load after yielding of steel tubes, the design predictions are conservative compared with the ultimate strengths obtained from the test results.

4. Finite Element Simulation

4.1. Finite Element Model

The finite element (FE) models were developed using ABAQUS/Standard [22]. Coordinate data obtained from the 3D scanning process were used to establish a model of the corroded steel tubes. The solid elements C3D8R were adopted for the steel end plate parts and the filled concrete, while the solid elements C3D10 were adopted for the steel tubes. The element size for the steel tube was approximately 1.0 mm, while the coarse mesh with an element size of 20 mm was used for concrete part. All degrees of freedom at both ends of the column specimens were fixed, except for the loading direction, as the boundary conditions in the test. Displacement was applied to the top end of the specimens to simulate the axial compression.
The true stress–strain curves obtained from the tensile coupon tests were used for the steel tubes. The constitutive model of steel was defined as von Mises yield criterion, associated with a flow rule with isotropic strain hardening [23,24]. The weld was assumed to have the same material properties as those of the steel. The concrete damaged plasticity model [22] was adopted for the concrete part. The equations suggested by Han et al. [25] were used to obtain the uniaxial compressive stress–strain relationship of the confined concrete. The Poison’s ratio was taken as 0.2 for the infill concrete. A linear stress-strain relationship was used for the concrete tensile behavior before reaching the tensile strength. For the concrete-to-steel surface-to-surface contact model, the hard contact behavior was set in the normal direction. In the tangential direction, the isotropic Coulomb frictions with a frictional factor of 0.6 [3] were adopted.

4.2. Verification

The deformations under the ultimate loads in the simulation were compared with the test results, as shown in Figure 9. Typical load versus displacement curves are compared in Figure 12. It is shown that the developed FE models were capable of predicting the initial stiffness and peak loads, while, for the plastic stage, a moderate discrepancy was observed, as shown in Figure 12. Ultimate strengths of the test and FE analysis are compared in Table 5. The average values of PFEA/PTest and the coefficient of variation (COV) were 1.02 and 0.035, respectively. In general, the established FE models incorporated with the steel fracture criterion can predict the mechanical behaviour of corroded CFST specimens with reasonable accuracy.

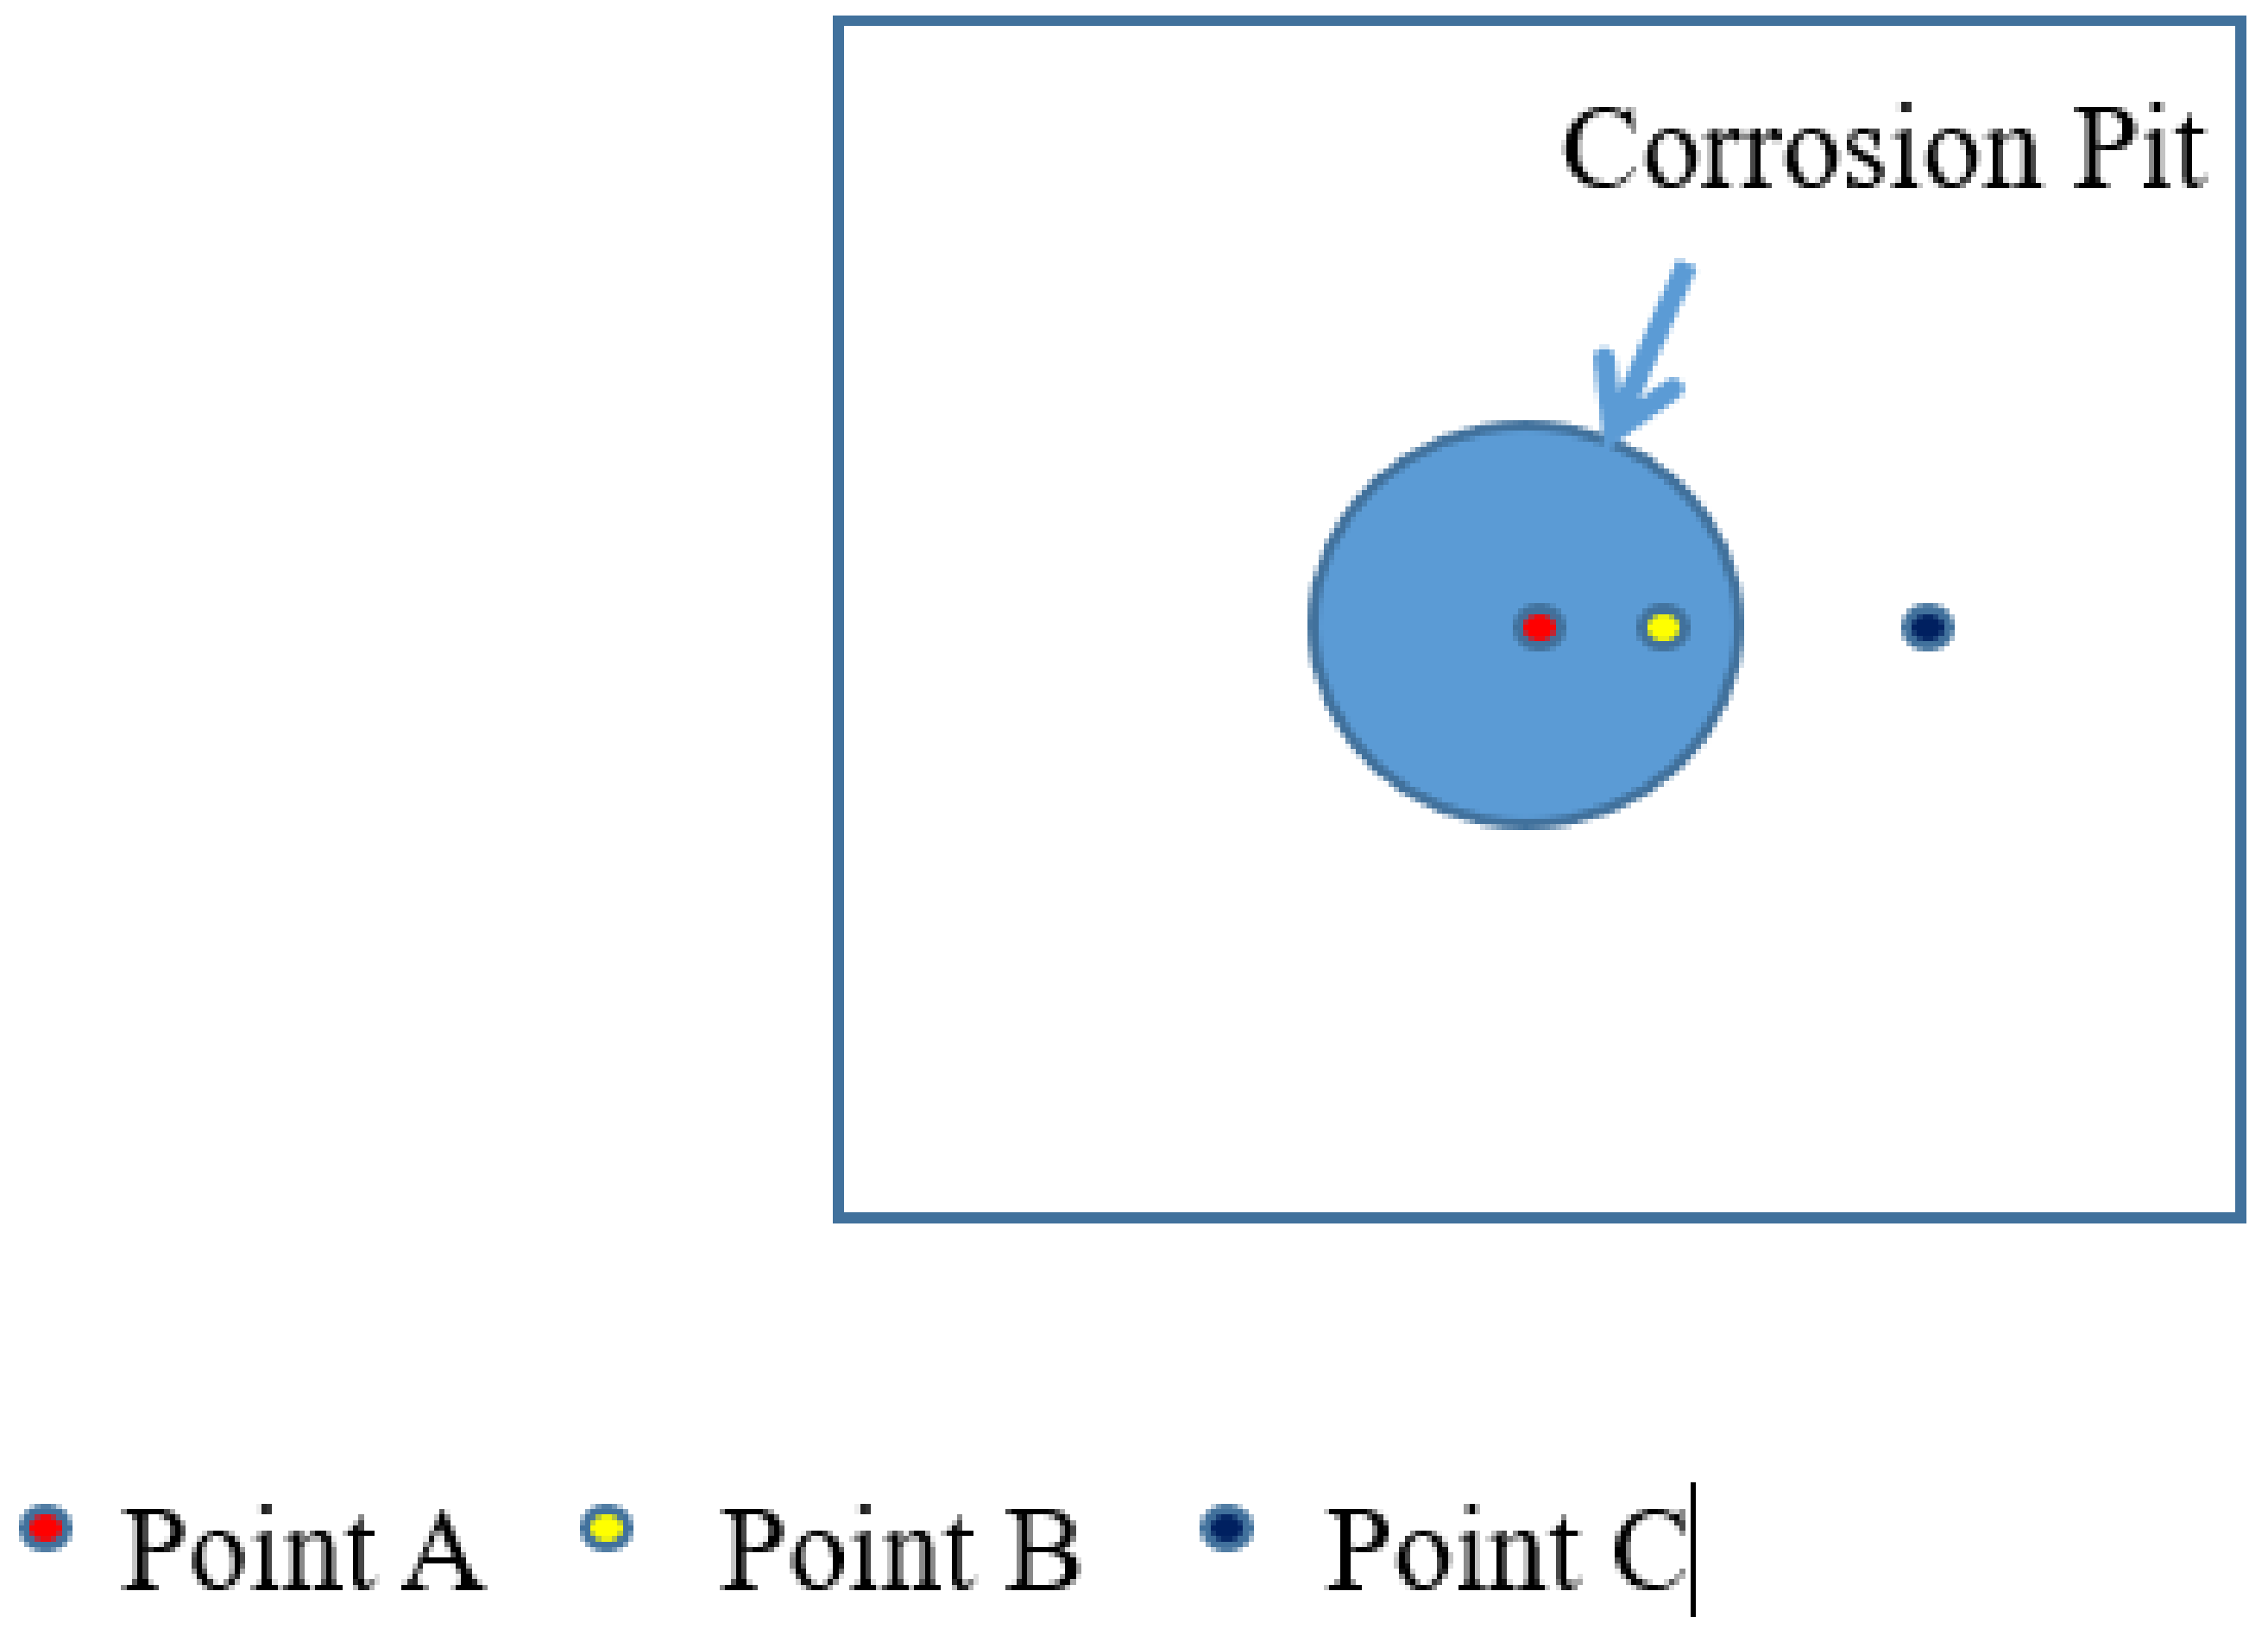
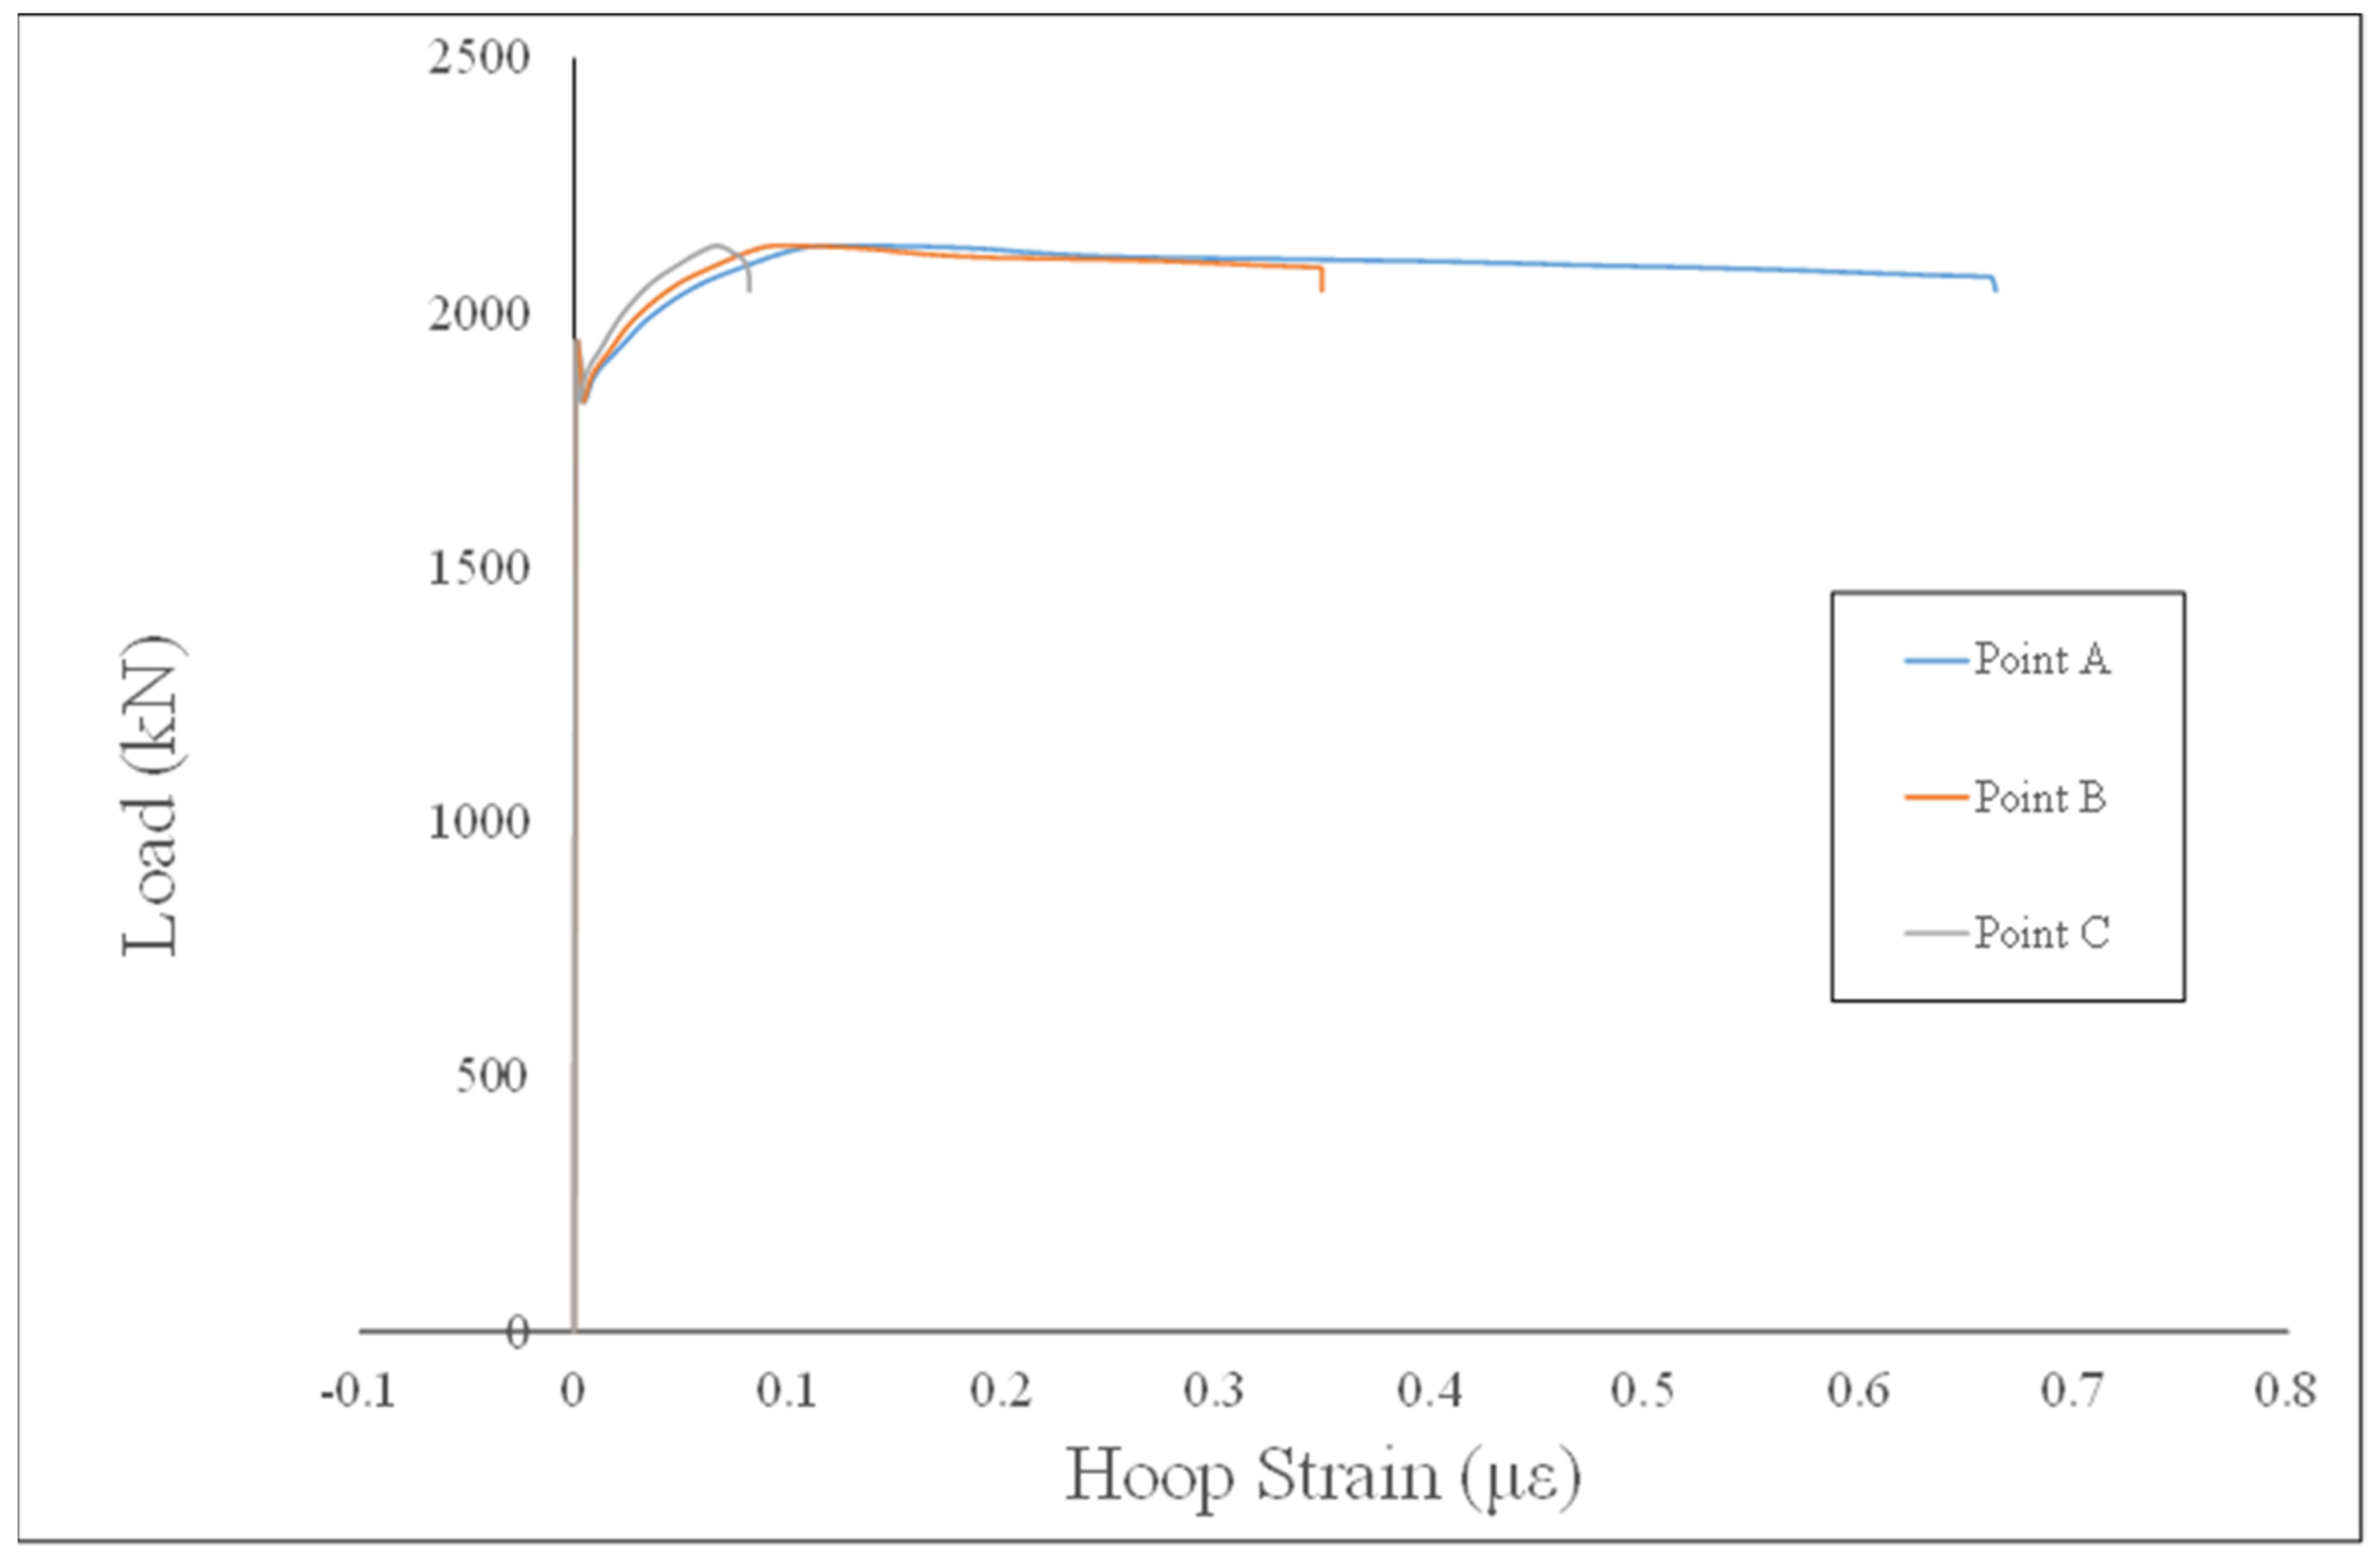
4.3. Corrosion Pits Effect Analysis

For the uncorroded specimens, stress generally developed uniformly when the load increased, while those of the corroded ones were in non-uniform development, as shown in Figure 13. The stress states of test specimen AT1100C50A, corresponding to the 50% and 80% of ultimate load, are present in Figure 13a,b, respectively. The FEA simulation results in Figure 13a indicated that when the maximum stress reached a yield stress of 462 MPa, the minimum stress was only 330 MPa. The hoop strain states of specimen CT30C35 at points A, B, and C were obtained for illustration (shown in Figure 14). Point A is located in the center of the corrosion pit, and Point B is located inside the corrosion pit close to Point A. Point C is located in the uncorroded region. It is shown that stress distribution is obviously non-uniform. The hoop strain development at different points on specimens of CT30C35 can be seen in Figure 15. It is shown that the hoop strain develops rapidly when it reaches the yield load; then, the strain of Point A develops much faster than that of Point C.

5. Conclusions

In this study, the compression behavior of the corroded CFST specimens was investigated by both a loading test and numerical method. Specimens that respectively suffered chloride ingression corrosion and atmosphere corrosion were examined, while a 3D scanning method was employed to obtain the profile of the steel tubes’ surfaces. Corrosion evaluation was conducted based on the scanning results. It shows that the current ASTM method and the weight loss method are insufficient for estimation of the corrosion of test specimens. Therefore, a fractal method was developed for the corrosion evaluation in this study. Meanwhile, corrosion shows an effect on the ultimate strength of the CFST specimens in this study through exhibition of a reduction in the maximum strength of approximately 10%. However, corrosion may induce fracture of the welded steel tube under hoop expansion, which leads to a significant loss of ductility for these CFST pieces. Moreover, fracturing generally occurred at welding sites, which suffered the most severe corrosion. Furthermore, 3D scanning results to simulate the corrosion used in the finite element model show the developed method is available, and it presents a series of non-uniform stress versus strain curves of the steel tubes thanks to their corrosion condition. However, the high stress portion of the steel tube is able to resist the loading after its yielding until fracture. Therefore, design equation has access to predict the strengths of the generally corroded CFST stub columns in this study, and formulation for a safer operation of the analyzed structures should be developed in the future.

Author Contributions

Conceptualization, W.X., J.C. and F.X.; methodology, W.X. and F.X.; software, W.X.; validation, W.X., J.C. and F.X.; formal analysis, W.X.; investigation, W.X., C.Y. and C.L. resources, J.C. and F.X.; data curation, W.X. and F.X.; writing—original draft preparation, W.X.; writing—review and editing, F.X.; visualization, W.X.; supervision, J.C.; project administration, J.C.; funding acquisition, J.C. and F.X. All authors have read and agreed to the published version of the manuscript.

Funding

This research was funded by a grant of National Natural Science Foundation of China (grant number 52078249), the Key-Area Research and Development Program of Guangdong Province (grant number 2019B111107002), and International Science and Technology Program from Zhejiang Qinye Construction Industry Group Co., Ltd., 312000, China (grant number USX-UPC-2021330001000082).

Institutional Review Board Statement

Not applicable.

Informed Consent Statement

Not applicable.

Acknowledgments

The research work described in this paper was supported by a grant from the National Natural Science Foundation of China (52078249), the Key Area Research and Development Program of Guangdong Province (2019B111107002), and the International Science and Technology Program from Zhejiang Qinye Construction Industry Group Co., Ltd., Zhejiang 312000, China (USX-UPC-2021330001000082).

Conflicts of Interest

The authors declare no conflict of interest.

References

  1. Young, B.; Ellobody, E. Experimental investigation of concrete-filled cold-formed high strength stainless steel tube columns. J. Constr. Steel Res. 2006, 62, 484–492. [Google Scholar] [CrossRef]
  2. Xu, F.; Chen, J.; Jin, W.L. Experimental investigation of thin-walled concrete-filled steel tube columns with reinforced lattice angle. Thin-Walled Struct. 2014, 84, 59–67. [Google Scholar] [CrossRef]
  3. Xu, F.; Chen, J.; Chan, T.M. Numerical investigation on compressive performance of CFST columns with encased built-up lattice-angles. J. Constr. Steel Res. 2017, 137, 242–253. [Google Scholar] [CrossRef]
  4. Wang, Y.H.; Lu, G.B.; Zhou, X.H. Experimental study of the cyclic behavior of concrete-filled double skin steel tube columns subjected to pure torsion. Thin-Walled Struct. 2018, 122, 425–438. [Google Scholar] [CrossRef]
  5. Xu, F.; Chen, J.; Guo, Y.; Ye, Y. Innovative design of the world’s tallest electrical transmission towers. Proc. Inst. Civ. Eng. 2019, 172, 9–16. [Google Scholar] [CrossRef]
  6. Xue, W.; Chen, J.; Xie, F.; Feng, B. Orientation of Steel Fibers in Magnetically Driven Concrete and Mortar. Materials 2018, 11, 170. [Google Scholar] [CrossRef] [Green Version]
  7. Chen, J.; Wang, J.; Xie, F.; Duan, A. Behavior of thin-walled dodecagonal section double skin concrete-filled steel tubular beam-columns. Thin-Walled Struct. 2016, 104, 135–143. [Google Scholar] [CrossRef]
  8. Chen, J.; Wang, J.; Xie, F.; Jina, W. Behavior of thin-walled dodecagonal section double skin concrete-filled steel tubes under bending. Thin-Walled Struct. 2016, 98, 293–300. [Google Scholar] [CrossRef]
  9. Han, L.H.; Hou, C.; Wang, Q.L. Square concrete filled steel tubular (CFST) members under loading and chloride corrosion: Experiments. J. Constr. Steel Res. 2012, 72, 11–25. [Google Scholar] [CrossRef]
  10. Han, L.H.; Hou, C.C.; Wang, Q.L. Behavior of circular CFST stub columns under sustained load and chloride corrosion. J. Constr. Steel Res. 2014, 103, 23–36. [Google Scholar] [CrossRef]
  11. Han, L.H.; Hua, Y.X.; Hou, C.; Wang, Q.L. Circular Concrete-Filled Steel Tubes Subjected to Coupled Tension and Chloride Corrosion. J. Struct. Eng.-ASCE 2017, 143, 04017134. [Google Scholar] [CrossRef]
  12. Hua, Y.X.; Han, L.H.; Wang, Q.L.; Hou, C. Behaviour of square CFST beam-columns under combined sustained load and corrosion: Experiments. Thin-Walled Struct. 2019, 136, 353–366. [Google Scholar] [CrossRef]
  13. Hou, C.; Han, L.H.; Zhao, X.L. Full-range analysis on square CFST stub columns and beams under loading and chloride corrosion. Thin-Walled Struct. 2013, 68, 50–64. [Google Scholar] [CrossRef]
  14. Xu, S.; Wang, Y.; Xue, Q. Evaluation indicators and extraction method for pitting corrosion of structural steel. J. Harbin Inst. Technol. (NewSeries) 2015, 22, 15–21. [Google Scholar]
  15. Lv, S.; Mu, Q.; Gao, X. Influence of morphology of corrosion on fracture imitation in an aluminum alloy. Mater. Des. 2013, 45, 96–102. [Google Scholar] [CrossRef]
  16. Li, S.L.; Xu, Y.; Li, H.; Guan, X. Uniform and Pitting Corrosion Modeling for High-Strength Bridge Wires. J. Bridge Eng. 2014, 19, 04014025. [Google Scholar] [CrossRef]
  17. Xu, S.H.; Wang, H.; Li, A.B.; Wang, Y.; Su, L. Effects of corrosion on surface characterization and mechanical properties of butt-welded joints. J. Constr. Steel Res. 2016, 126, 50–62. [Google Scholar] [CrossRef]
  18. AS 1391; Australian Standard. Methods for Tensile Testing of Metals. Standards Association of Australia: Sydney, Australia, 1991.
  19. ASTM G46-94; Standard Guide for Examination and Evaluation of Pitting Corrosion. ASTM International: West Conshohocken, PA, USA, 2008.
  20. Sarkar, N.; Chaudhuri, B.B. An efficient differential box-counting approach to compute fractal dimension of image. IEEE Trans. Syst. Man. Cybern. 1994, 24, 115–120. [Google Scholar] [CrossRef] [Green Version]
  21. AISC 360; Specification for Structural Steel Buildings. AISC Committee on Specifications: Chicago, IL, USA, 2016.
  22. Hibbitt, H.D.; Karlsson, B.I.; Sorensen, E.P. ABAQUS Documentation Collection, USA. 2010. Available online: https://www.osti.gov/biblio/6459203-abaqus-epgen-general-purpose-finite-element-code-volume-example-problems-manual (accessed on 18 March 2022).
  23. Xu, L.Y.; Fan, J.S.; Yang, Y.; Tao, M.X.; Tang, Z.Y. An improved elasto-plastic constitutive model for the exquisite description of stress-strain hysteresis loops with cyclic hardening and softening effects. Mech. Mater. 2020, 150, 103590. [Google Scholar] [CrossRef]
  24. Wang, C.; Fan, J.S.; Xu, L.Y.; Nie, X. Cyclic hardening and softening behavior of the low yield point steel: Implementation and validation. Eng. Struct. 2020, 210, 110220. [Google Scholar] [CrossRef]
  25. Han, L.H. Flexural behavior of concrete-filled steel tubes. J. Constr. Steel Res. 2004, 60, 313–337. [Google Scholar] [CrossRef]
Figure 1. Cross section of CFST specimens.
Buildings 12 00481 g001
Figure 2. Corroded CFST specimens: (a) specimens corrosion accelerated by NaCl (CT series); (b) specimens corrosion in atmosphere (AT series).
Buildings 12 00481 g002aBuildings 12 00481 g002b
Figure 3. Scanning of corroded CFST specimens.
Buildings 12 00481 g003
Figure 4. Surface profile and coordinate data obtained from 3D scanning results: (a) surface profile; (b) coordinate data.
Buildings 12 00481 g004aBuildings 12 00481 g004b
Figure 5. Load tests.
Buildings 12 00481 g005
Figure 6. Fractal dimension of specimen AT1100C50A.
Buildings 12 00481 g006
Figure 7. Load versus displacement curves of specimen CT series: (a) C35 Series; (b) C60 series.
Buildings 12 00481 g007
Figure 8. Load versus displacement curves of specimen AT series.
Buildings 12 00481 g008
Figure 9. Comparison of failure mode of specimen CT90C35A: (a) test observed deformation; (b) FEA analysis deformation.
Buildings 12 00481 g009
Figure 10. Cracks in corroded CFST specimens with welded steel tubes: (a) AT1100C50A; (b) AT1100C50B; (c) AT1100C50E; (d) AT1100C50F.
Buildings 12 00481 g010aBuildings 12 00481 g010b
Figure 11. Load versus hoop strain curves of specimen AT series.
Buildings 12 00481 g011
Figure 12. Comparison of typical load versus displacement curves.
Buildings 12 00481 g012
Figure 13. Stress development of specimen AT1100C50A: (a) 50% ultimate load; (b) 80% ultimate load.
Buildings 12 00481 g013
Figure 14. Illustration of Points A, B, and C.
Buildings 12 00481 g014
Figure 15. Hoop strain of different points on specimen CT30C35.
Buildings 12 00481 g015
Table 1. Material properties of concrete.
ComponentTest Value
Concrete gradeC35C50C60
Ec (MPa)31,42034,23035,574
fcu (MPa)34.851.954.8
Table 2. Material properties of steel.
ComponentCT SeriesAT Series
Nominal thickness/diameter (mm)4.06.0
Yield strength Fy (MPa)460.0280.9
Ultimate strength Fu (MPa)640.04.0
Young’s modulus Es (MPa)1.98 × 1052.03 × 105
Table 3. Test specimens.
SpecimensConcreteT (Day)Dt (mm)t (mm)L (mm)Tube
CT0C35C3501604480S
CT0C60C6001604480S
CT30C35C35301604480S
CT30C60C60301604480S
CT60C35C35601604480S
CT60C60C60601604480S
CT90C35AC35901604480S
CT90C35BC35901604480S
CT90C60AC60901604480S
CT90C60BC60901604480S
CT120C35AC351201604480S
CT120C35BC351201604480S
CT120C60AC601201604480S
CT120C60BC601201604480S
AT1100C50AC5011003006.01000W
AT1100C50BC5011003006.01000W
AT1100C50CC5011003006.01000W
AT1100C50DC5011003006.01000W
AT1100C50EC5011003006.01000W
AT1100C50FC5011003006.01000W
Table 4. Corrosion evaluation of specimens.
SpecimensDensitySize
(mm2)
Depth
(mm)
ASTM ResultsΨ
(%)
D
CT30C3518028.270.35A-2, B-5, C-12.932.2867
CT30C6020010.560.4A-2, B-4, C-11.052.2981
CT60C3519025.50.45A-2, B-5, C-17.562.3659
CT60C6023020.430.4A-2, B-5, C-110.352.3263
CT90C35A15030.110.6A-2, B-5, C-19.192.3724
CT90C35B13045.370.55A-2, B-5, C-110.072.3696
CT90C60A12419.630.4A-2, B-5, C-11.362.2847
CT90C60B19512.230.35A-2, B-4, C-11.992.2878
CT120C35A20022.120.45A-2, B-5, C-17.912.3247
CT120C35B19524.630.5A-2, B-5, C-18.992.3294
CT120C60A14037.390.6A-2, B-5, C-111.912.3453
CT120C60B16035.560.5A-2, B-5, C-19.432.3080
AT1100C50A50024.521–2A-3, B-5, C-327.22.4226
AT1100C50B40026.341–2A-3, B-5, C-331.02.3031
AT1100C50C40025.031–2A-3, B-5, C-323.12.3203
AT1100C50D40027.301–2A-3, B-5, C-326.12.4226
AT1100C50E40023.651–2A-3, B-5, C-320.12.3031
AT1100C50F40025.211–2A-3, B-5, C-330.82.3203
Table 5. Ultimate load comparison between test results and FEA results.
SpecimensPTest (kN)PFEA
(kN)
PDesign
(kN)
PFEA/PTestPDesign/PTest
CT0C351960199712371.02 0.63
CT0C602310225015060.97 0.65
CT30C351897198712371.05 0.65
CT30C602179239015061.10 0.69
CT60C351829192412371.05 0.68
CT60C602244210915060.94 0.67
CT90C35A1828189812371.04 0.68
CT90C35B1868189215061.01 0.81
CT90C60A2189229212371.05 0.57
CT90C60B2151227415061.06 0.70
CT120C35A1828189812371.04 0.68
CT120C35B1836184515061.00 0.82
CT120C60A2109224412371.06 0.59
CT120C60B2240227215061.01 0.67
AT1100C50A4438452041701.02 0.94
AT1100C50B4823472241700.98 0.86
AT1100C50C4781486141701.02 0.87
AT1100C50D4460450041701.01 0.93
AT1100C50E4222432441701.02 0.99
AT1100C50F4860478541700.98 0.86
Mean1.020.75
COV0.0350.169
Publisher’s Note: MDPI stays neutral with regard to jurisdictional claims in published maps and institutional affiliations.

