Article

Spatiotemporal Impact of Urbanization on Urban Heat Island and Urban Thermal Field Variance Index of Tianjin City, China

School of Architecture, Tianjin University, Tianjin 300272, China
*
Author to whom correspondence should be addressed.
These authors contributed equally to this work.
Buildings 2022, 12(4), 399; https://doi.org/10.3390/buildings12040399
Submission received: 13 February 2022 / Revised: 16 March 2022 / Accepted: 21 March 2022 / Published: 24 March 2022
(This article belongs to the Special Issue Thermal Comfort in Built Environment)

Abstract

:
The rapid infrastructure development in densely populated areas has had several negative impacts. Increases in urbanization have led to increased LST, and urban ecological systems have been negatively affected. Urban heat islands (UHIs) can be mitigated by understanding how current and future LST phenomena are linked to changes in landscape composition and land use cover (LUC). This study investigated the multi-scale spatial analysis of LUC and LST in Tianjin using remote sensing and GIS data. We used Landsat data from 2005 to 2020 to examine the effects of LUC on LST in urban agglomeration. According to the Urban Thermal Field Variance Index (UTFVI), the city’s ecological evaluation was carried out. Results show that changes in LUC and other anthropogenic activities affect the spatial distribution of LST. For the study years (2004–2009), the estimated mean LST in Tianjin was 25.32 °C, 26.73 °C, 27.62 °C, and 27.93 °C. Between LST and urban areas with other infrastructures, and NDBI, significant positive correlation values were found about 0.53, 0.48, and 0.76 (p < 0.05), respectively. Temperatures would almost certainly increase by 3.87 °C to 7.26 °C as a result of decreased plant cover and increased settlements. These findings strongly imply a correlation between LST and the vegetation index. Between 2005 and 2020, the anticipated increase in LST of 3.39 °C is expected to harm urban environmental health. This study demonstrates how Tianjin and other cities can achieve ecological sustainability.

1. Introduction

Land use cover (LUC) change occurs primarily due to the alteration of natural vegetation at various scales due to logging, vast urban development, and agricultural expansion activities [1]. These changes contribute to various environmental problems, including biodiversity loss, increased greenhouse gas concentrations [2,3,4,5,6], fluctuation in land surface temperature (LST), and favored precipitation anomaly. Urbanization, associated with population growth, industrial/infrastructural development, and landscape composition, has become a global challenge. As a result of urbanization, LUC changes are one of the major causes of fluctuating LST in urban areas [6,7,8,9]. As a result of LST’s adverse effects on the urban environment, the relationship between LUC and LST is gaining significant attention within the scientific community [10,11]. As the second-largest economy globally, China is experiencing rapid urbanization, with a dramatic expansion of built-up areas, residential neighborhoods, and new cities [12,13,14]. As a result, appropriate urbanization policies to modify land-use and landscape patterns are critical [15,16,17]. Understanding the relationship between urbanization and these patterns may help inform the development of more sustainable urban environmental management policies [14,18,19,20]. The vast majority of people who relocate to new cities and their activities put a lot of strain on housing, infrastructure, food security, ecosystem services, and natural resources management [7,14,17,21,22,23].
Urban areas have higher air temperatures and LST than rural areas nearby. The morning peak occurs during the transition between daylight and nocturnal conditions. This shift occurs when sunlight begins to warm the atmosphere. During this time, a more stable surface layer may form, trapping anthropogenic waste heat [13,14,24]. This occurrence is predicted to occur more frequently during the winter. Anthropogenic activity is at its peak over the weekend, which implies that surface temperatures in large cities are predicted to be high. In most temperate climates, the evening peak hour is before or just after sunset throughout the summer [24,25]. And low evapotranspiration [10,25]. Changing urban concentrations affect regional temperatures, increasing the UHI effect in cities. Investigations into the relationship between landscape patterns and UHI have ranged from local to global. Built-up areas and barren lands exacerbate UHI, while open spaces and water mitigate it [6,26]. Landscape composition and configuration are dominant patterns in LST [15,27,28,29]. Social and economic factors influence LST trends [8,22,30,31,32].
Numerous studies on LST have been conducted. Additionally, studies incorporating UHIs or LSTs can be explained in three ways, depending on their methods and scales [5,33,34,35,36]. The first set of studies engages larger scales and satellite imagery to examine an entire city or its immediate surroundings [5,37,38]. In the meantime, studies in the second group, known as observation studies, compare data from meteorological stations in urban and rural areas [32,39,40,41]. They are based on data analysis from established stations or monitoring devices. Based upon the number of stations or sensors used in the measurements, these studies can involve a portion of a city, the entire town, or a specific axis [1,42]. Finally, numerical modeling is used in the third group of studies, mainly at the sub-scale, territory, or residential extent [43].
Tianjin is a city of rich historical, cultural, and commerce backgrounds. Tianjin’s land cover types are changing rapidly due to rapid population growth. The city’s natural landscapes have been transformed into stone and concrete surfaces, leaving green areas further from the city’s core [44,45,46,47]. More industrial, commercial, and transportation services are being built to meet the growing city’s needs. The city’s most significant issue is unplanned and uncontrolled growth, which means more impervious surfaces and less green space. Impervious surfaces such as parking lots and roofs generate much heat, as do buildings made of concrete or steel [5,16,21,34,48,49]. As a result, heat rises and concentrates near or in Tianjin. There are also issues with urbanization and climate, significantly when temperatures rise due to the increased population. Temperatures in cities are higher since buildings disrupt natural vegetation and reduce green space [25,50,51,52,53,54]. As a result of these factors, Tianjin’s air temperatures are much higher in densely populated areas. The primary reasons for the formation of UHIs in Tianjin are the reduction of green spaces in urban areas and the materials used in building construction [19,20,21,33,55,56].
Rapid economic growth, particularly in megacities such as Tianjin, has radically altered the function and structure of urban ecosystems. Regular monitoring at both macro and mid-range scales is required to assess the effects of LUC change land indexes on LST and UHI. The region is currently the country’s growing urbanization hotspot. The objective of this study was to: (1) investigate the effects of LUC change on LST by analyzing LULC changes, LST distributions, and UHI intensity for Tianjin and its vicinity from 2005 to 2020 using Landsat 5 TM and Landsat 8 OLI data; (2) correlate LST with LUC, NDVI, and NDBI for the entire Tianjin region and generate the ecological evaluation index (EEI) for the city; and (3) establish a relationship between UHI and the town’s built-up area/bare land areas.

2. Materials and Methods
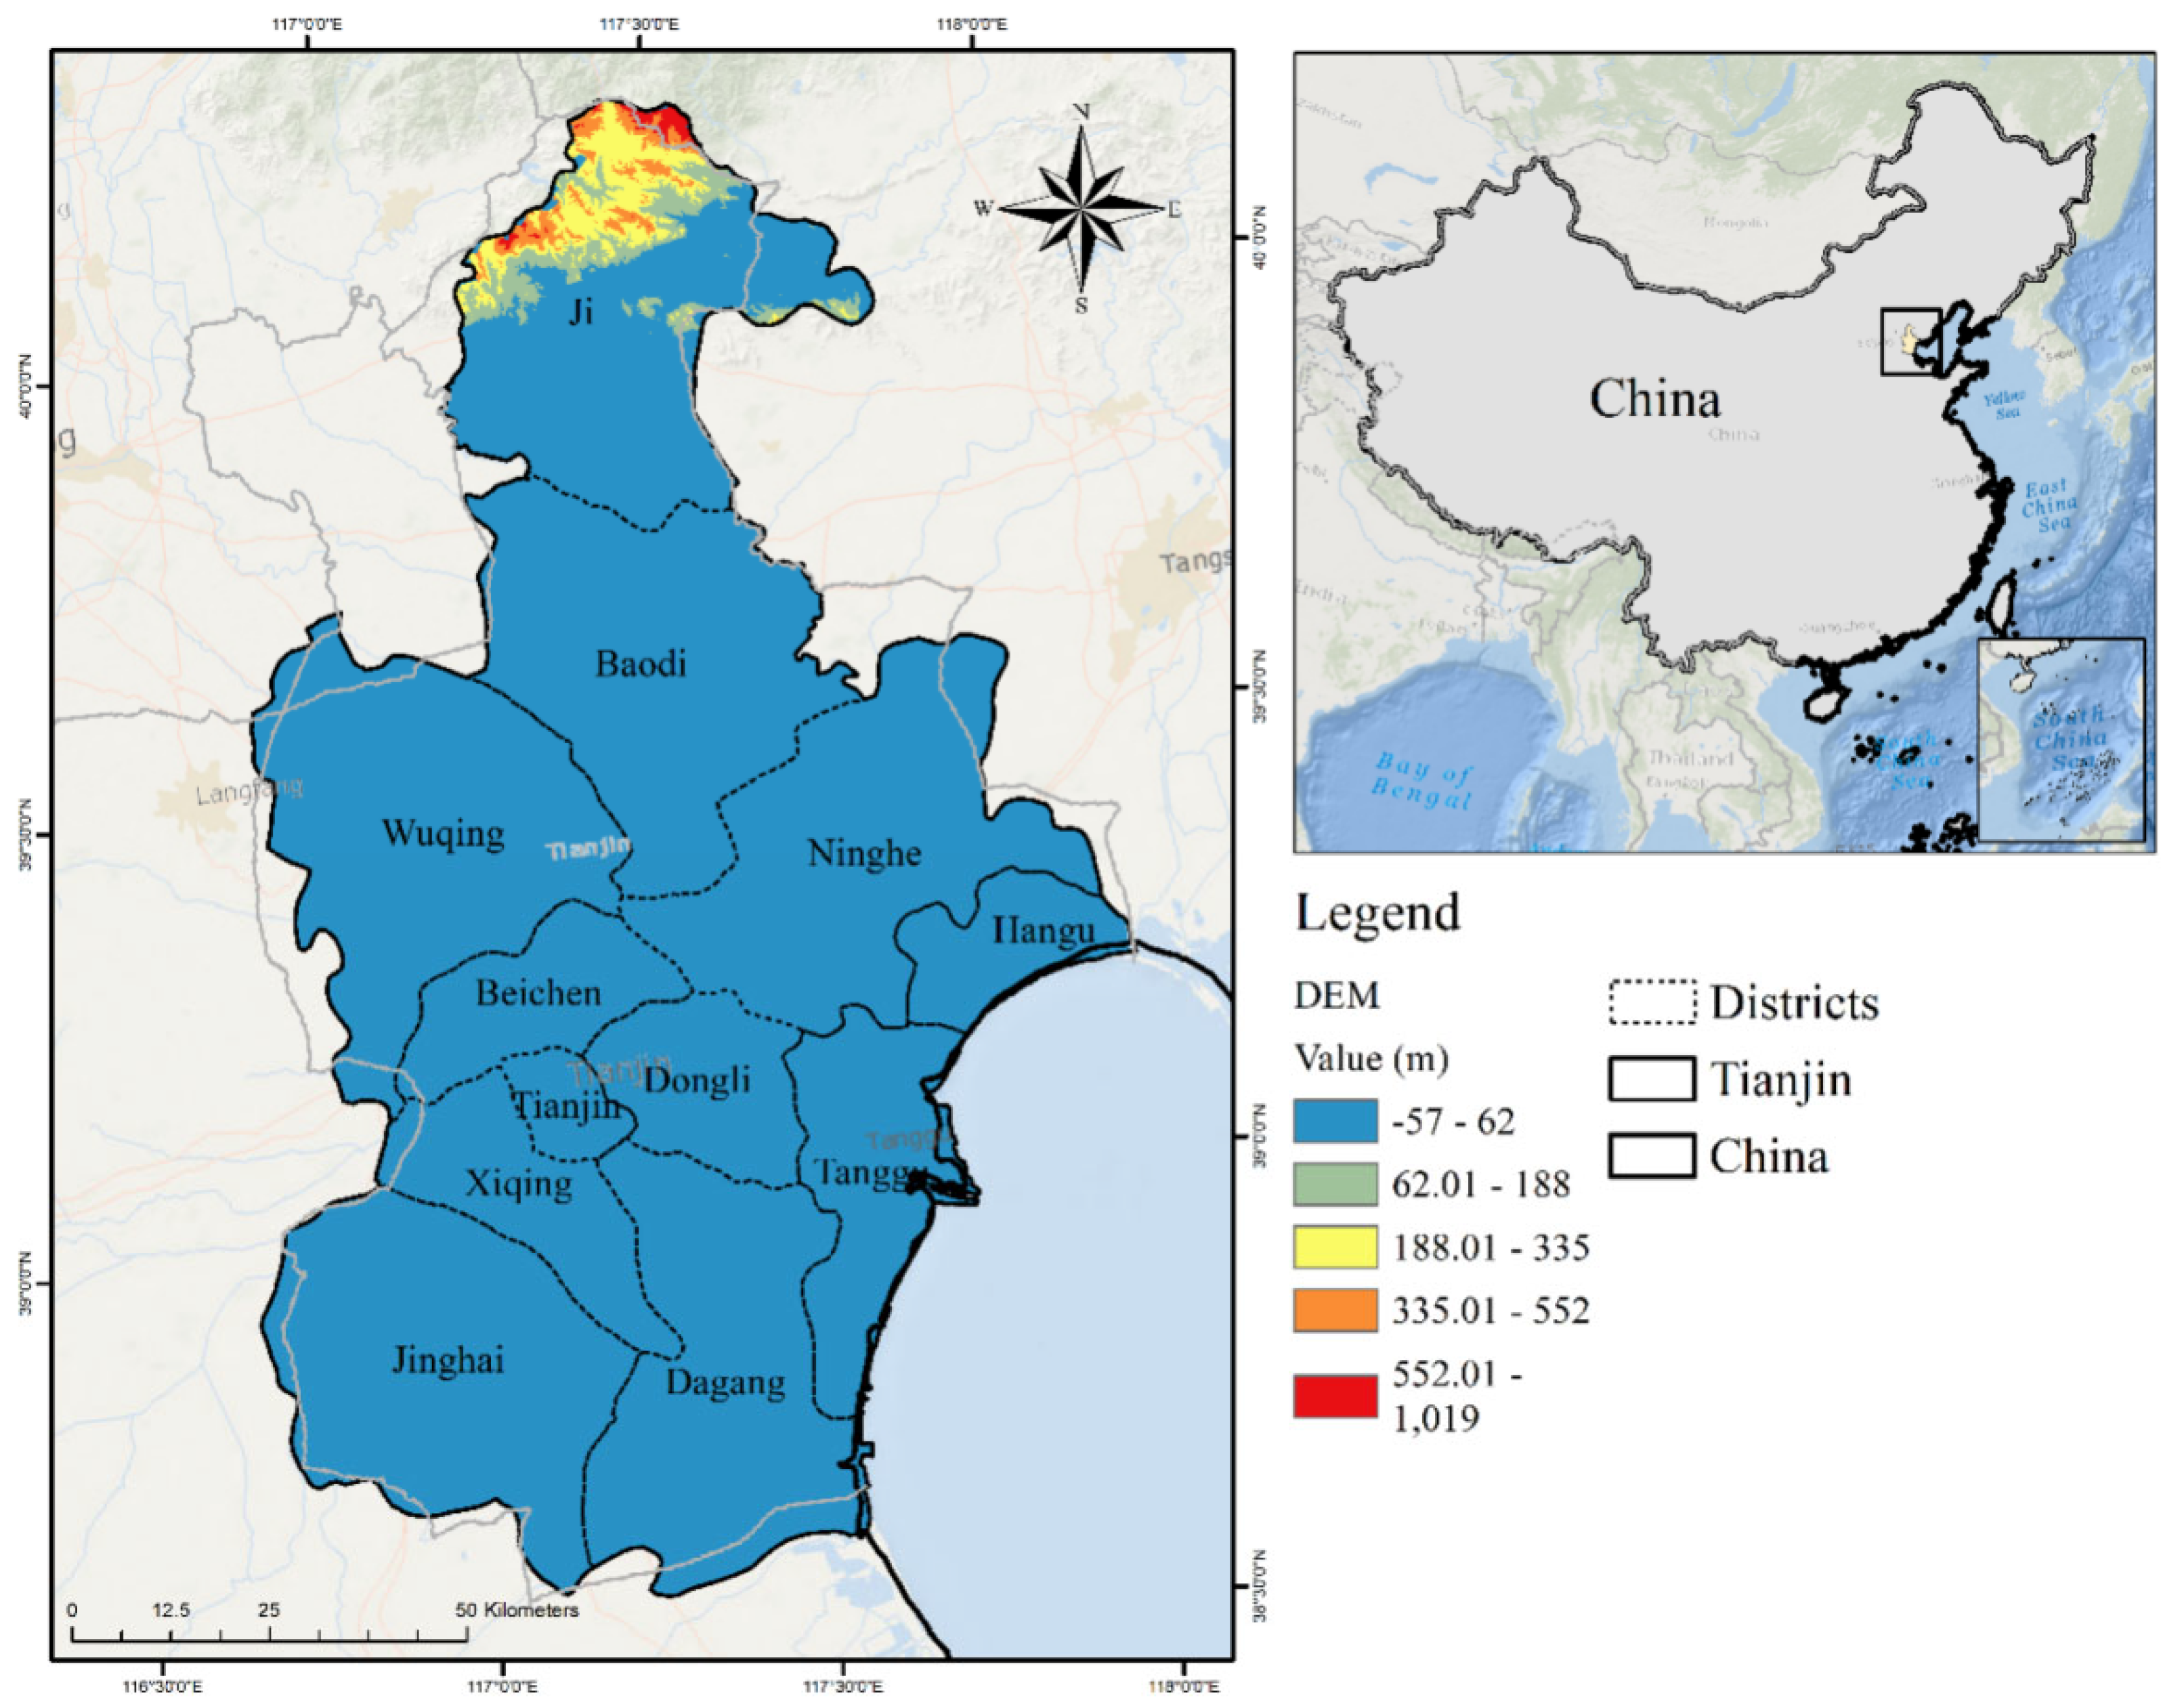
2.1. Study Area

Tianjin, China, is a global beta second-tier city with over 13.86 million people [57] and an urban built-up area of approximately 1156 km2. It is located at 39°N and 117°E. (Figure 1). Tianjin has undergone long-term evolution in urban spaces such as other world metropolises, particularly in replacing its primary, secondary, and tertiary industries over the last twenty-five years. Changes in urban development from a single center to multiple centers [38]; and significant spatial differences in factors such as UHI-related green coverage, building height, building density, hardened pavements, and sky wideness [15,58]. Thermal comfort levels have decreased due to these changes. We chose Tianjin as an example of a mega-urban space for this study.

2.2. Data Source and Pre-Processing

For LST and LUC estimation, a series of remote-sensed images with a spatial resolution of 30 m were collected from Landsat-5 (Landsat Thematic Mapper-TM) and Landsat 8 (Operation Land Imager-OLI) over various periods between 2005 and 2020 [4,30,38,59,60,61]. The primary objective was to use Google Earth Engine to select cloud-free images acquired during the same season of each sample year (Table 1). (GEE). Before LUC identification, a pre-treatment procedure was used to extract atmospheric effects from Landsat images [5,62,63]. For each land cover class, 500 ground control points were collected during a ground survey to assess the accuracy of the thematic layer. The US Geological Survey’s web data portal provided the digital elevation model (DEM) data. Each Landsat scene has been enhanced using the histogram equalization technique to increase the image contrast [40,64].

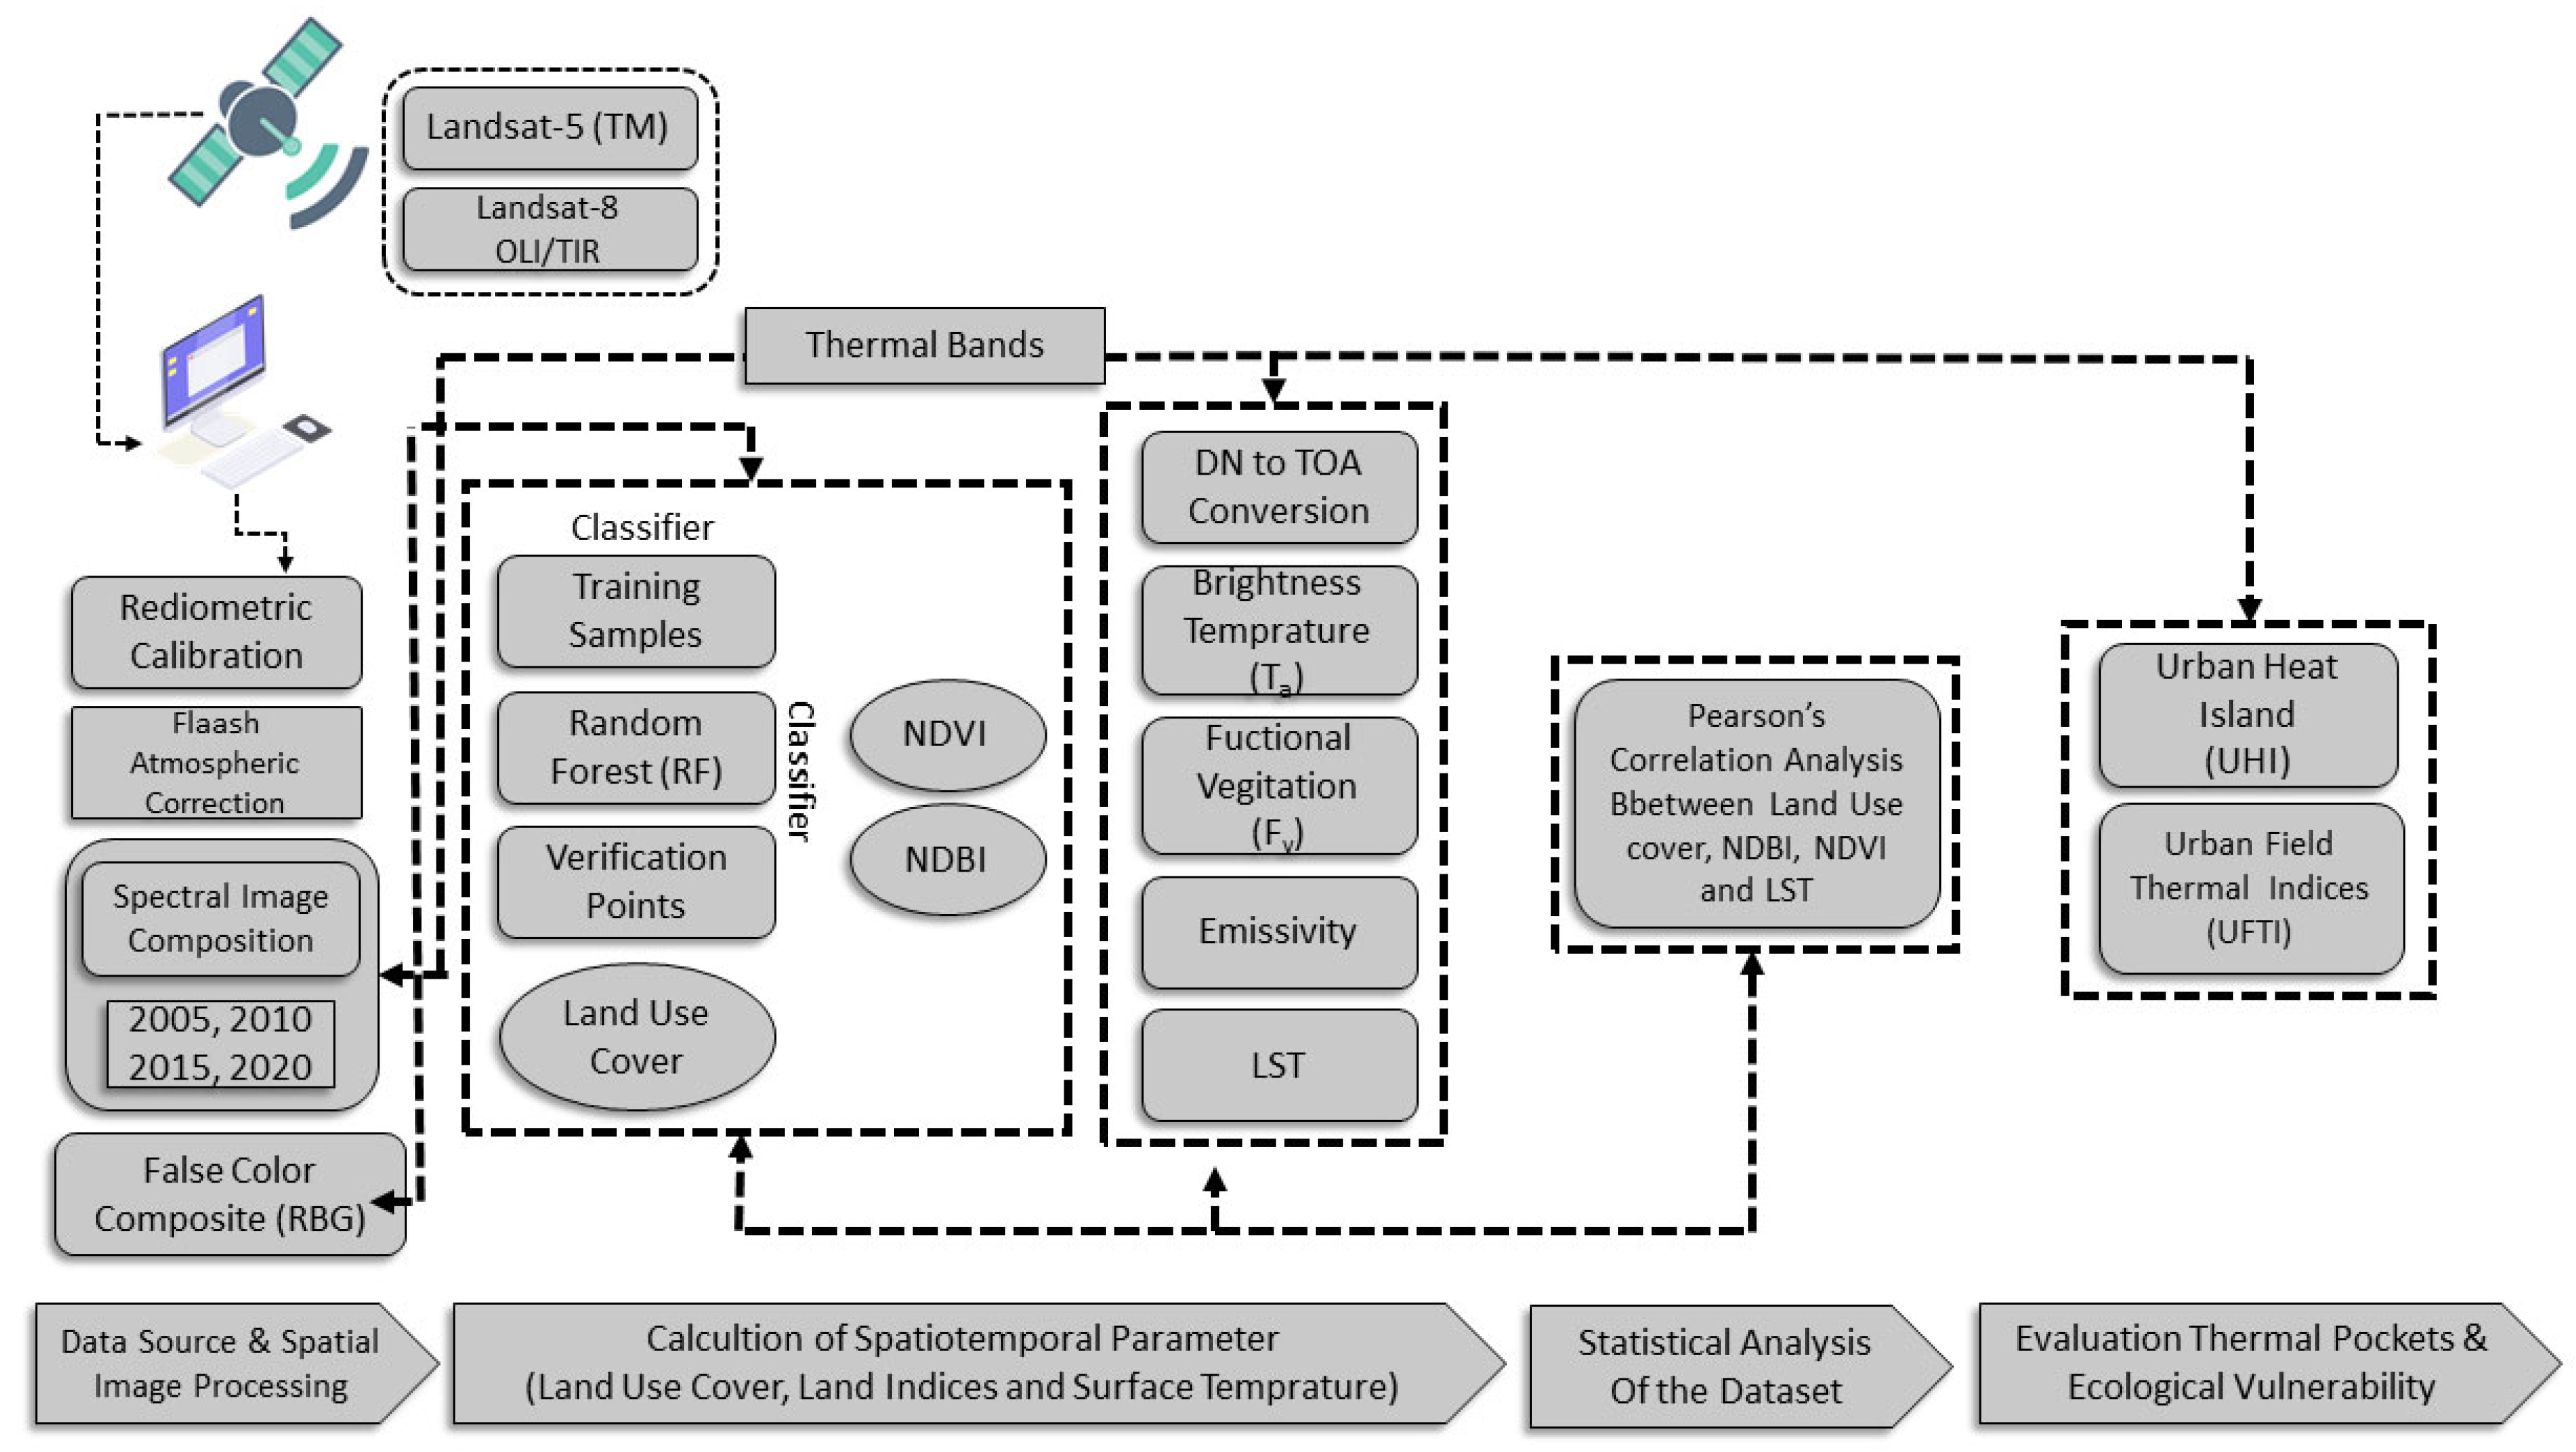
2.3. Experimental Design

The data sets were processed in Google Earth Engine (GEE) according to the specified methodology (Figure 2) to create a false color composite (FCC). The following procedure involved determining the presence of an urban heat island (UHI) within the city to figure out the Normalized Difference Vegetation Index (NDVI), the Normalized Difference Vegetation Index (NDBI), and the land surface temperature (LST) [3,4,38,63,65]. The supervised image classification method was then used to classify each scene. Pearson correlation analysis was used to derive statistical inferences from the mean LST and the relative percentages of various land cover types, as well as the NDVI and NDBI values [34,56,66,67]. The Ecological Evaluation Index (EEI) for Tianjin City was mapped using UTFVI. ArcGIS Pro-2.5, Adobe illustrator, and R-studio generated all spatial maps and statistical illustrations.

2.4. Computation of Land Use Cover Change (LUCC)

This study’s land cover classification data was generated using an advanced supervised machine learning classification algorithm called random forest (RF) using 10–20 multiple DTs. RF is used to process spectral images in remote sensing-related fields [6,55]. Five different Landsat satellite images from the summer period (May–September) 2005 to 2020 were used to classify each reference year. Between May–September 2005 and 2010, Landsat-5 TM multispectral images were acquired, and Landsat-8 OLI multispectral images were developed in 2015 and 2020 [7,8,11,21]. For all spatial scenes, an image classifier was used to classify the LUC types into five classes: urban, water, cropland, forest, lowland [34,58,60]. A confusion matrix was generated from the classified image and signature file to evaluate accuracy. The image classification was carried out using the GEE platform’s code editor.

2.5. NDVI and NDBI Calculation

The Normalized Difference Vegetation Index (NDVI) is the most frequently used vegetation index worldwide. Equation (1) is commonly used to verify the condition of vegetation by calculating the ratio of near-infrared (NIR) and red bands [6,28,53]. NDVI values range between −1 and +1, depending on the objects visible at ground level. Typically, green vegetation has a value between 0.2 and 0.8 [28,59].
NDVI = ( NIR RED / NIR + RED )
where NIR corresponds to Band 4 (Landsat TM) and Band 5 (Landsat 8) and RED corresponds to Band 3 (Landsat TM) and Band 4 (for Landsat 8).
Normalized Difference Build-up Index (NDBI) can be calculated using the following formula (2) [68]. NDBI values range from −1 to +1. A negative value of NDBI corresponds to water bodies, whereas a positive value corresponds to developed areas. Vegetation has a low NDBI value [10,28,68,69].
NDBI = ( SWIR NIR / SWIR + NIR )
where SWIR denotes Band 5 (Landsat TM) and Band 6 (Landsat 8) and NIR denotes Band 4 (Landsat TM) and Band 5 (Landsat 8).

2.6. Retrieval of Land Surface Temperature (LST)

LST can be derived from Landsat data with a thermal infrared band (Band-6) that has been radiometrically corrected. There is a procedure for converting digital numbers (DNs) at the satellite level that takes atmospheric absorption, re-emissive heat, and a collection of surface emission corrections into account [50]. The reflectance and brightness temperature of the top of the atmosphere (TOA) should be converted from the spectral radiance [9,22,29] and then calculated land surface temperature (LST) with the following equation (Equation (3)) [4,29,48]
LST = T B 1 + ( λ σ T B / ( hc ) ) ln ε
where, brightness temperature TB, λ is the effective wavelength (10.9 mm for band 10 in Landsat 8 data), σ is Boltzman constant (1.38 × 10⁻²³ J/K), h is Plank’s constant (6.626 × 10⁻³⁴ Js), c is the velocity of light in a vacuum (2.998 × 10+8 m/sec), and ε is emissivity. For this study, land surface temperature (LST) is expressed in degrees Celsius (°C).

2.7. Mapping Urban Heat Island (UHI)

Urban heat island (UHI) was identified from the range values of LST by using Equations (Equation (4)) [10,44,70].
UHI = ( T T min T min )
T is the LST raster value, while Tmin is the minimum temperature value.

2.8. The Urban Thermal Field Variance Index (UTFVI)

Tianjin City’s urban heat island (UHI) was also studied using the UTFVI to understand its effects better. The LST value is directly related to the amount of heat generated [4,65]. Thermal comfort indices can be used to assess the impact of urban heat islands (UHI) on the quality of life in the city. The UHI zones of Tianjin were evaluated for their environmental impact using UTFVI. Which was calculated using the following equation (Equation (5)) [15,44,61,71,72]:
UTFVI = T s T mean T mean
where, UTFVI is the Urban Thermal Field Variance Index; Ts = LST (°C); and Tmean mean LST (°C).

3. Results

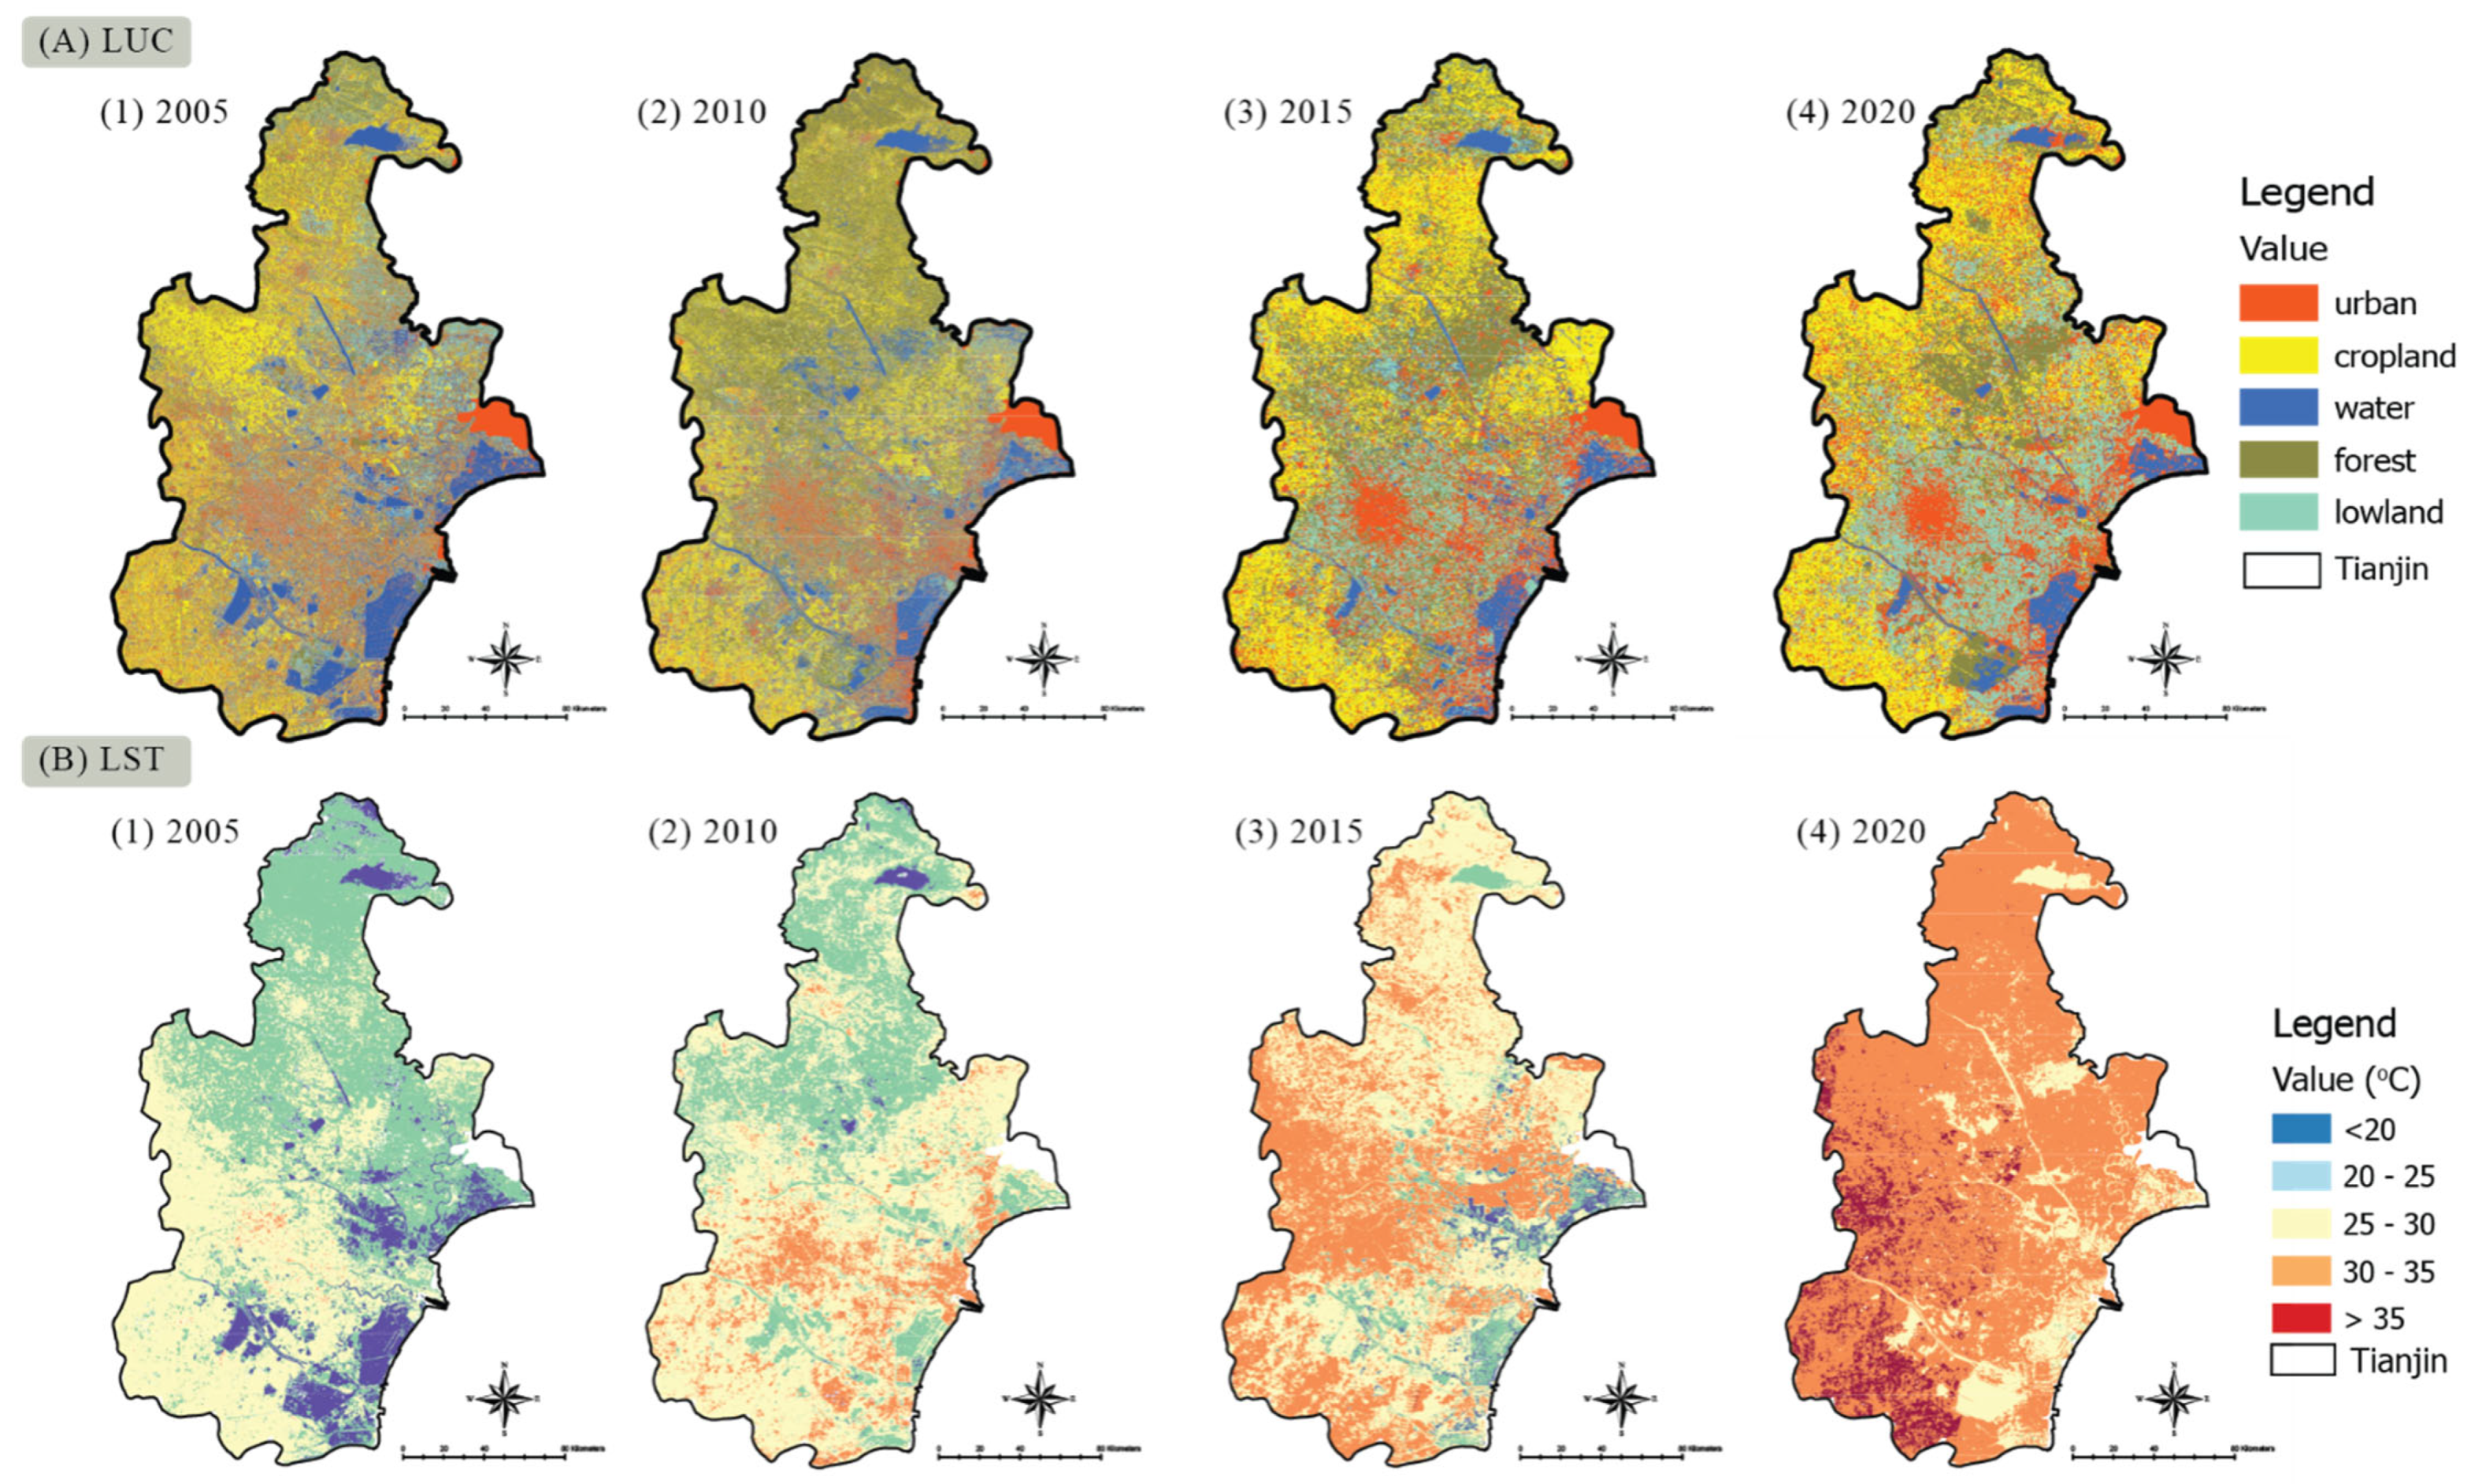
3.1. Land Use Cover and Changes Analysis

LUC generated spatially detailed maps for five thematic categories: (i) urban, (ii) cropland, (iii) water, (iv) forest, and (v) lowland (Figure 3A) for 2005, 2010, 2015, and 2020. Urban area covered 2425.187 km2 in 2005 and 3043.35 km2 in 2020. (Table 2). Between 2005 to 2020, the water area decreased significantly (711.11 km2). In 2005, the cropland was 2796.23 Km2, while in 2020, it was 3288.52 km2. Between 2005 and 2020, the area covered by forest and lowland was 2794.63 km2, 2308.22 km2, 2043.86 km2, and 2659.69 km2, respectively.
The urban area increased significantly by about 146.32 km2 during this period, while water and forest area decreased by 191.98 km2 and 191.98 km2. Similarly, cropland and lowland increased by 492.28km2 and 351.46 km2, representing an inverse accumulative change of 13% during 2005–2020.
Urban area increased by 662.48 km2 and 466.38 km2 between 2010 and2015 and between 2015 and2020, respectively. A similar trend was observed for lowland 29.04 km2 and 632.97 km2. Cropland increased 4.05% in 2010–2015. However, water area decreased continuously 661.20 km2 and 230.54 km2 from 2010 to 2020. Lastly, the forest area fell by about 586 km2 in 2010–2015, and the same declining trend of about 809.56 km2 was observed in 2015–2020 (Table 3).

3.2. Accuracy Assessment of LUC

These land-use classifications’ Kappa coefficient was calculated about 0.91%, 0.96%, 0.84% and 0.97%, respectively. For all four classified images, the kappa coefficient value was greater than 0.85, indicating the accuracy of the classification estimations and the reliability of the RF algorithm utilized in this investigation.

3.3. Land Surface Temperature (LST)

The spatial distribution of LST in 2005, 2010, 2015, and 2020 across Tianjin (Figure 3B). The LST values were categorized into five classes: (i) 20 °C; (ii) 20–25 °C; (iii) 25–30 °C; (iv) 30–35 °C; and (v) >35 °C, defining the temperature pattern in study area (Figure 3B).
The total area with temperatures below 20 °C and 20–25 °C was estimated to be approximately 1239.40 km2, 4961.73 km2 in 2005, 3911.36 km2, 5946.67 km2 in 2010, 110.32 km2 and 3237.27 km2 in 2015, 792.66 & 2119.04 km2 in 2020. Within the range of 25–30 °C, there are approximately 4672.72 km2, 747.58 km2, 5982.67 km2, and 1313.66 km2 in 2005, 2010, 2015, and 2020 respectively (Table 4). The respective areas for 30–35 °C were approximately 450.07 km2 and 220.74 km2, 1268.14 km2 and 657.99 km2, from 2005 to 2020. Similarly, the values for areas classified as >35 °C are 102.02 km2 (2005), 140.00 km2 (2010), 197.96 km2 (2015), and 340.37 km2 (2020).

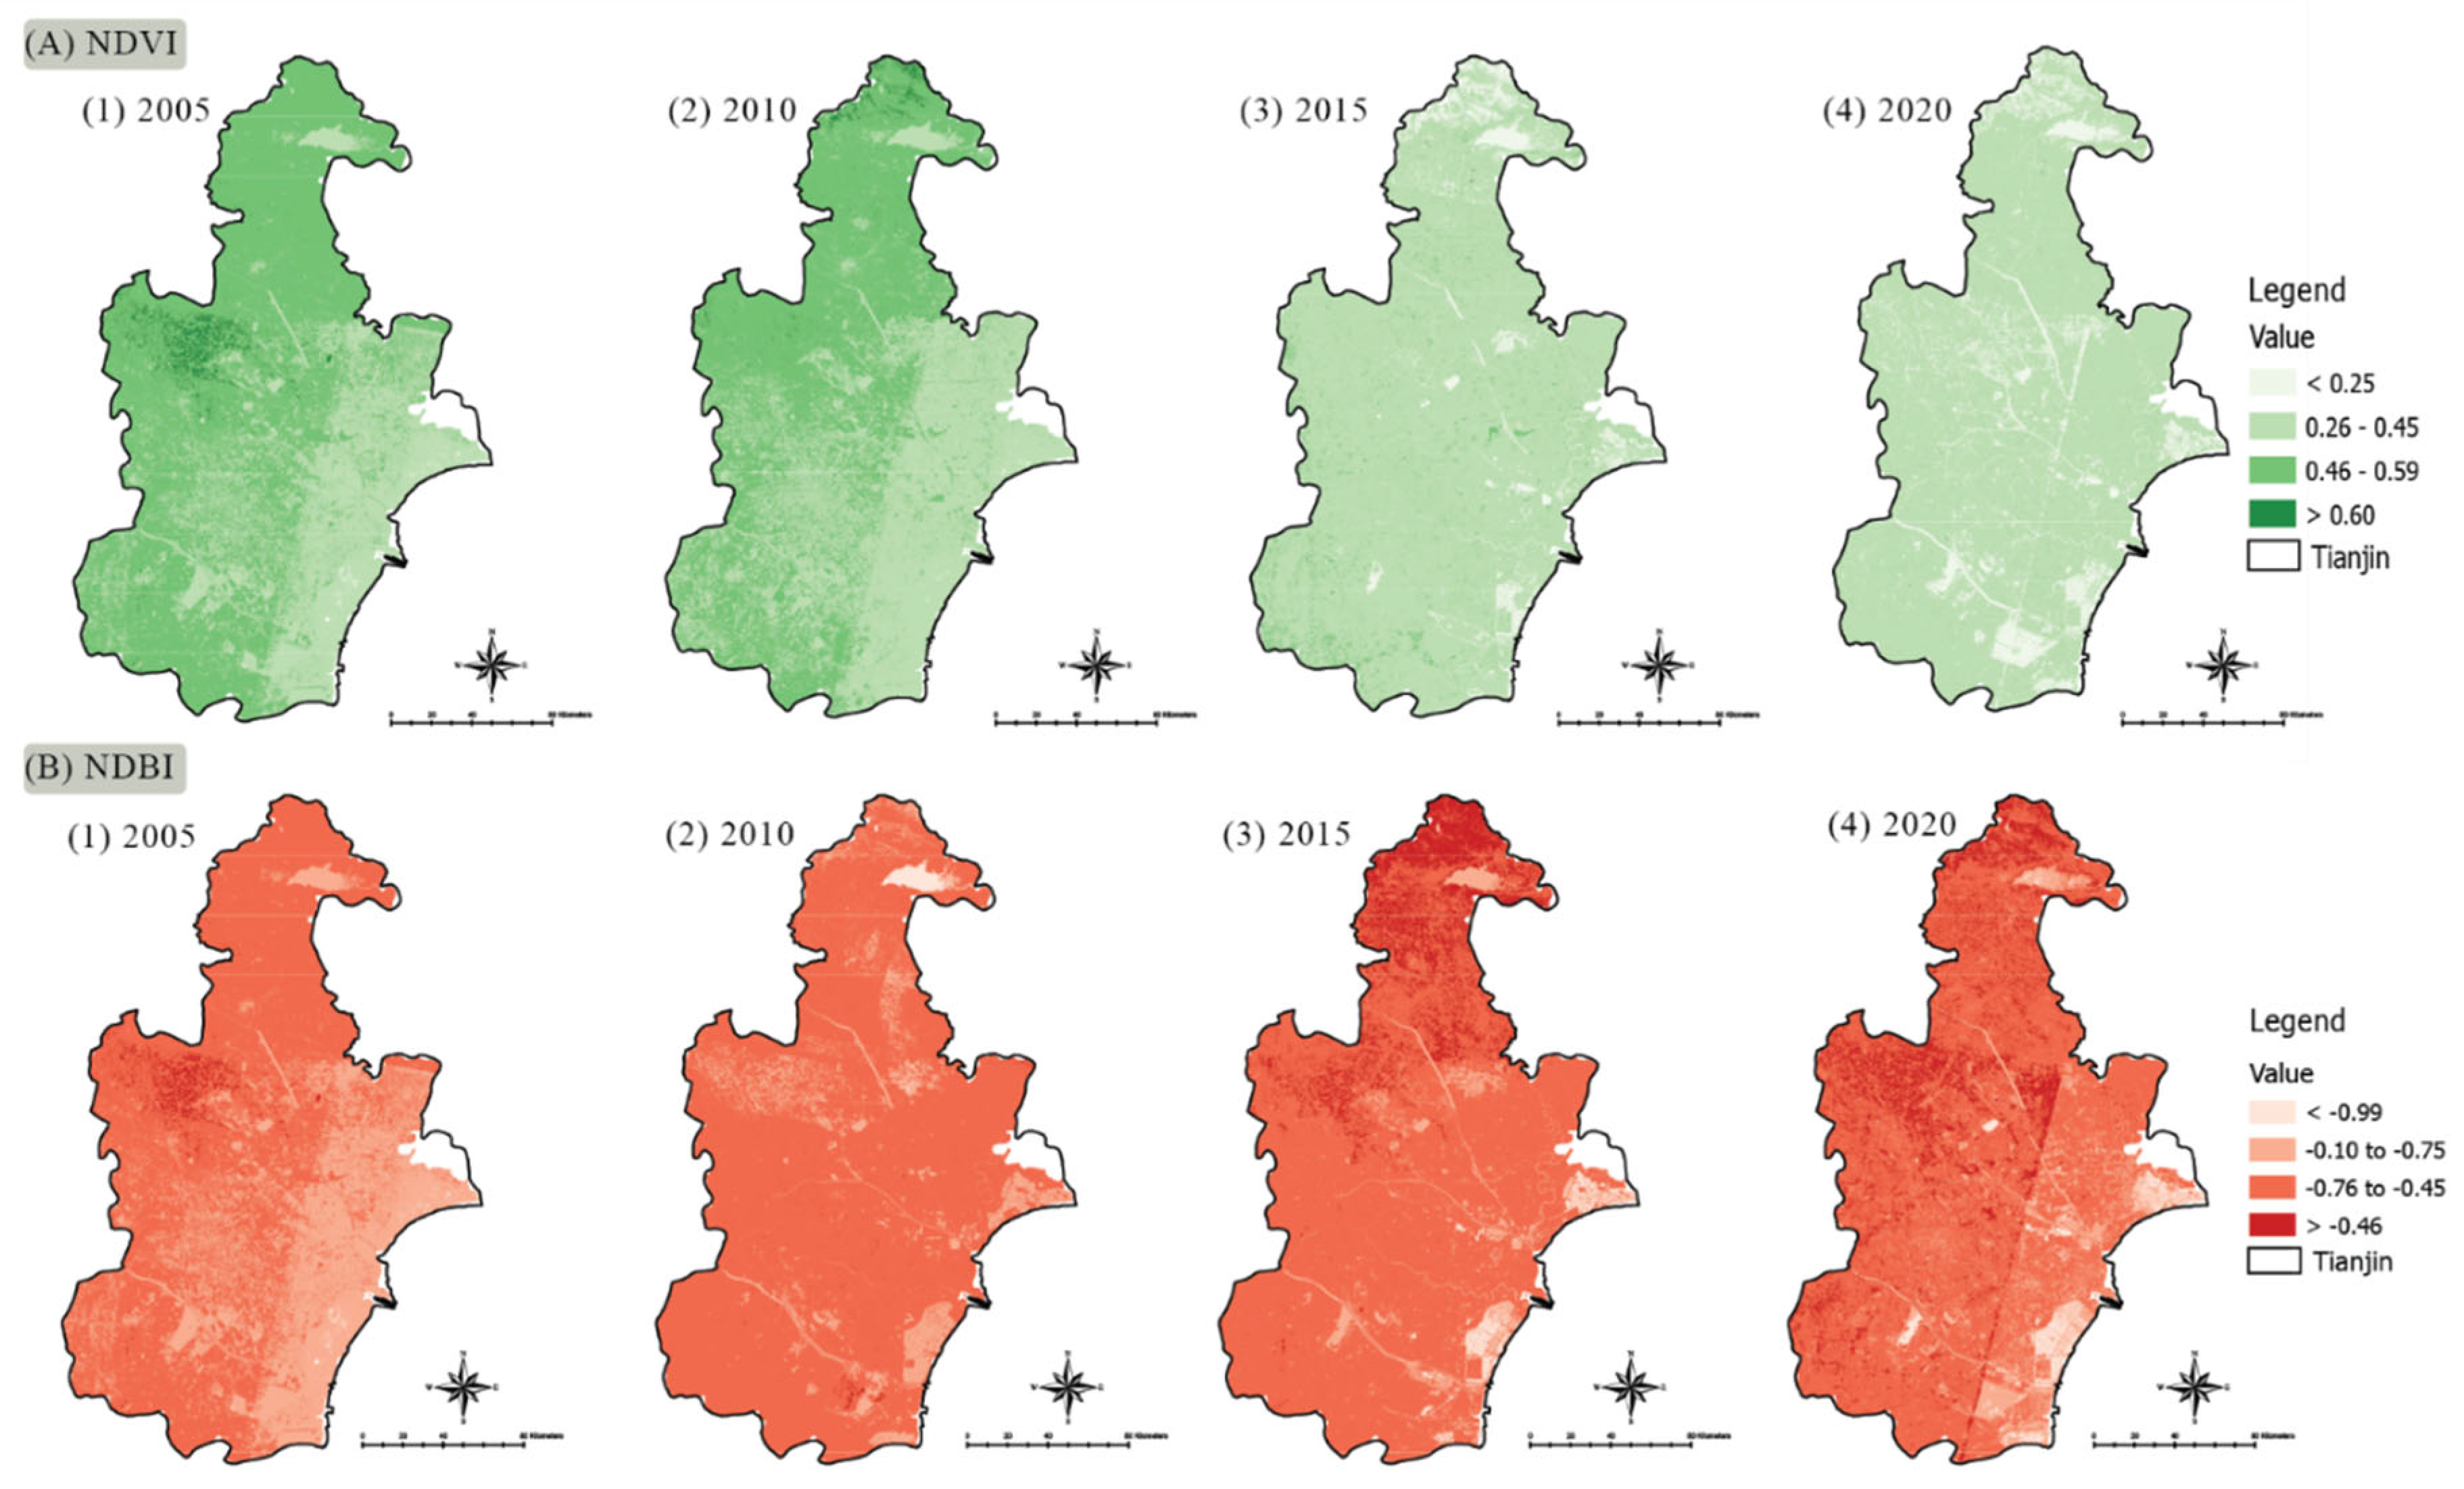
3.4. Normalize Difference of Vegetation Index (NDVI) and Build-Up Index (NDBI)

We categories Normalize Difference of Vegetation Index (NDVI) into four different classes (i) <0.25; (ii) 0.26–0.45; (iii) 0.46–0.59; and (iv) >0.60 to evaluate the vegetation index in the study area (Figure 4A).
The total area covered in <0.25 was estimated to be 32.98 km2, 92.85 km2, 195.99 km2, 314.82 km2 during 2005–2020. Area in the category of (0.26–0.45) were determined in 3880.11km2, 1236.99 km2, 895.57 km2 and 1516.09 km2, and third category (0.46–0.59) in 7234.43 km2, 9987.26 km2, 8998.417 km2 and 7913.16 km2. The values for areas classified as >0.60 are 204.62 km2, 35.43, 1258.44 km2 and 1607.21 km2 during 2005, 2010, 2015, and 2020, respectively (Table 5).
We classify the Normalized Difference of Build-up Index (NDBI) into four different categories (Figure 4B); the total area in the category <−0.99 was estimated to be 32.98, 92.85, 195.99, and 14.82 km2 during 2005, 2010, 2015, and 2020. Area in the (−0.10 to −0.75) category was determined in 3880.10, 1236.94, 895.57, and 1516.09 km2. Similarly, the area 7234.43, 9987.26, 8998.42, and 7913.16 were categorized as third category (0.46–0.59). The values for areas classified as >−0.46 were 204.62, 35.43, 1258.44 and 1607.21 km2 during 2005 to 2020.

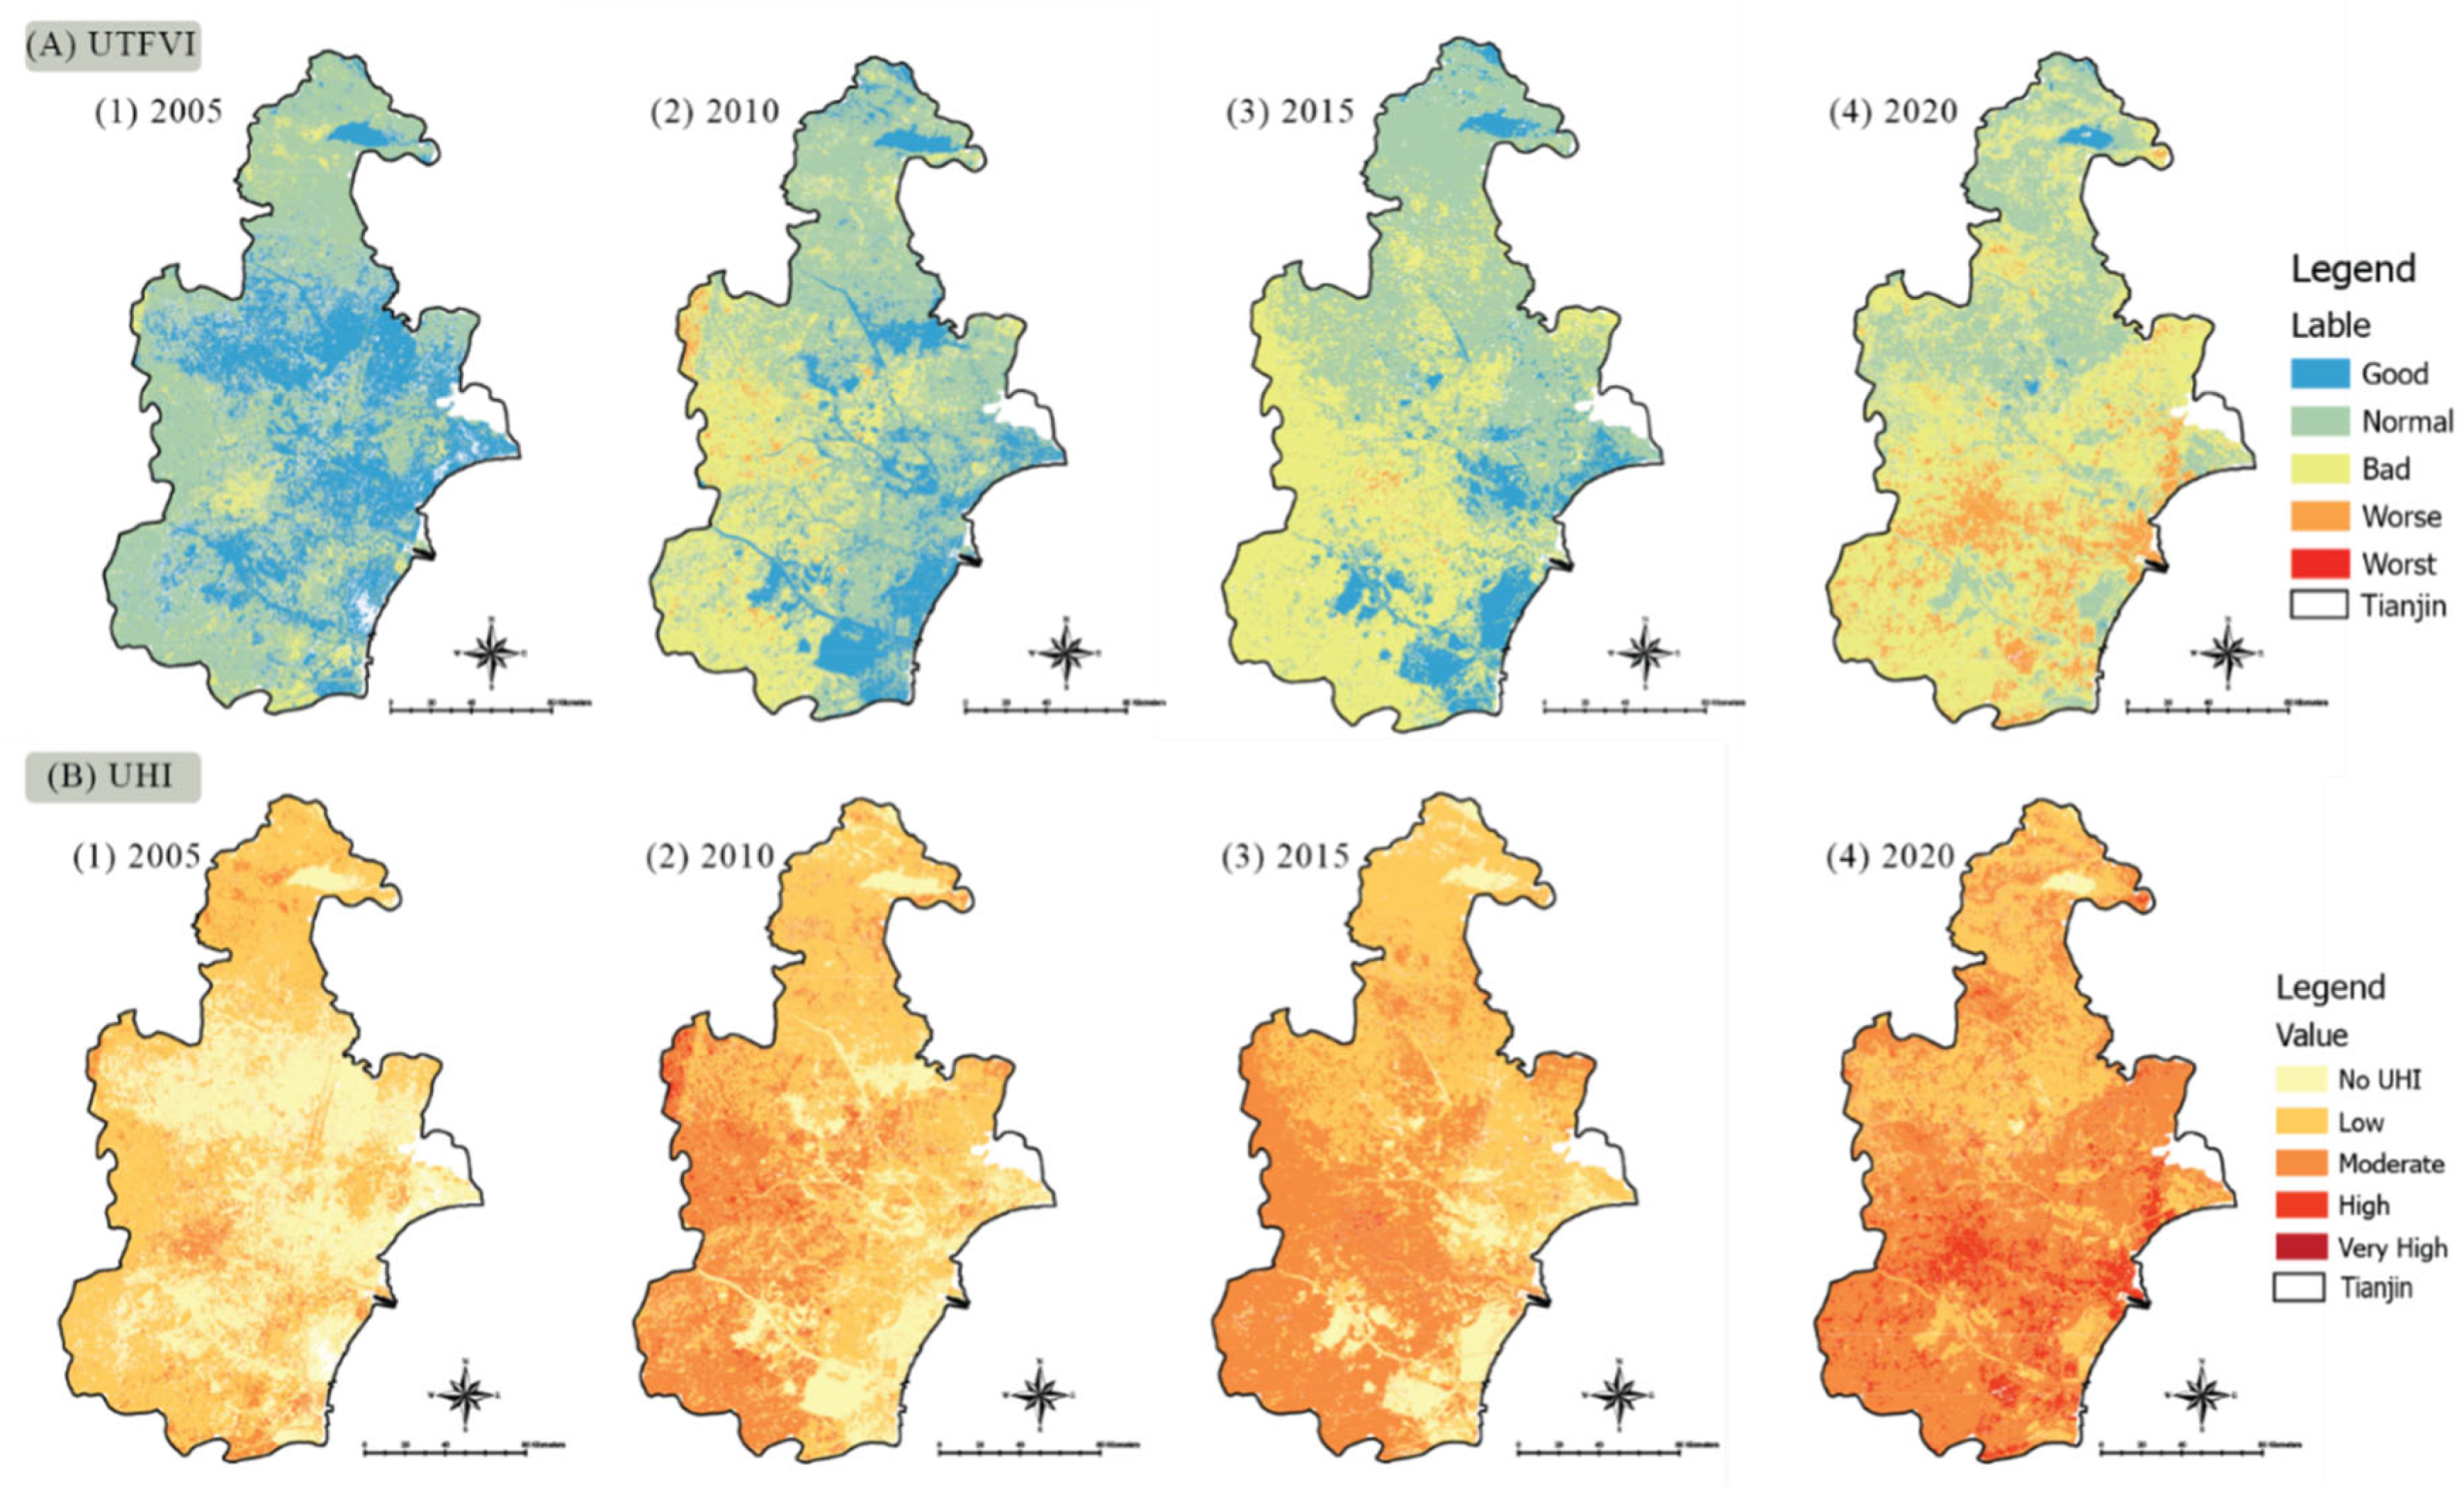
3.5. Determination of Urban Heat Island (UHI)

Urban heat island (UHI) was categorized into five various categories: (i) no UHI, (ii) low, (iii) moderate, (iv) high, and (v) very high (Figure 5A) for 2005 to 2020. No UHI area covered 294.29 km2 which was 3.36%, and low UHI area was 2699.61 km2, moderate UHI area was 3710.06 km2, area covered in high UHI was 40.95 km2, and tiny patches were observed in highly high UHI in 2005. (Table 6). From 2005 to 2020, the non and low UHI area increased up to 12% and 10%, covering almost 1715.98 km2 and 2662.85 km2. Moderate UHI class observed a massive decrease of up to 16% and a total area of 381.34 km2.
Similarly, high UHI and very high/extremely high UHI category areas were increased by 124.09 km2 and 93.98 km2, representing an accumulative change of 0.8% and 0.63%, respectively, during 2005–2020.

3.6. Evaluation of Urban Thermal Field Variance Index (UTFVI)

UTFVI for the area was divided into five different categories according to the ecological indexing as (i) good, (ii) normal, (iii) bad, (iv) worse, and (v) worst in the period 2005 to 2020 (Figure 5B). The area with the good and normal condition was 1166.09 km2 and 4891.97 km2, 9.98% and 41.89% in 2005, and bad index area was 4557.55 km2 (39.02%). The worse and worst situation observed were 743.68 km2 (6.37%) and 320.00 km2 (2.74%). In 2020, the good index area covered 2010.27 km2 (16.02%), the normal area was 5362.46 km2 (42.74%), the bad index area was 3328.72 km2 (26.53%), and the area covered in worse condition was 1165.04 km2 (9.29%). The most critical condition area was observed in the worst index, about 680.78 km2 which was 5.43% of the whole study area. (Table 7).
We also observed the severe changes in good and normal were 844.18 km2 and 470.49 km2, which was 97% and 54% increment in these indices during the period 2005-2020. the worse and worst condition area grew by 421.35 km2 (49%) and 360.78 km2 (42%), respectively. During 2005 and 2020, Bad index area showed a massive decrease of about 1228.83 km2. Still, it turned to the most critical condition. It increased the proportion in the study region’s worse and worst condition area, which shows the extreme heat condition due to rapid urbanization and development.

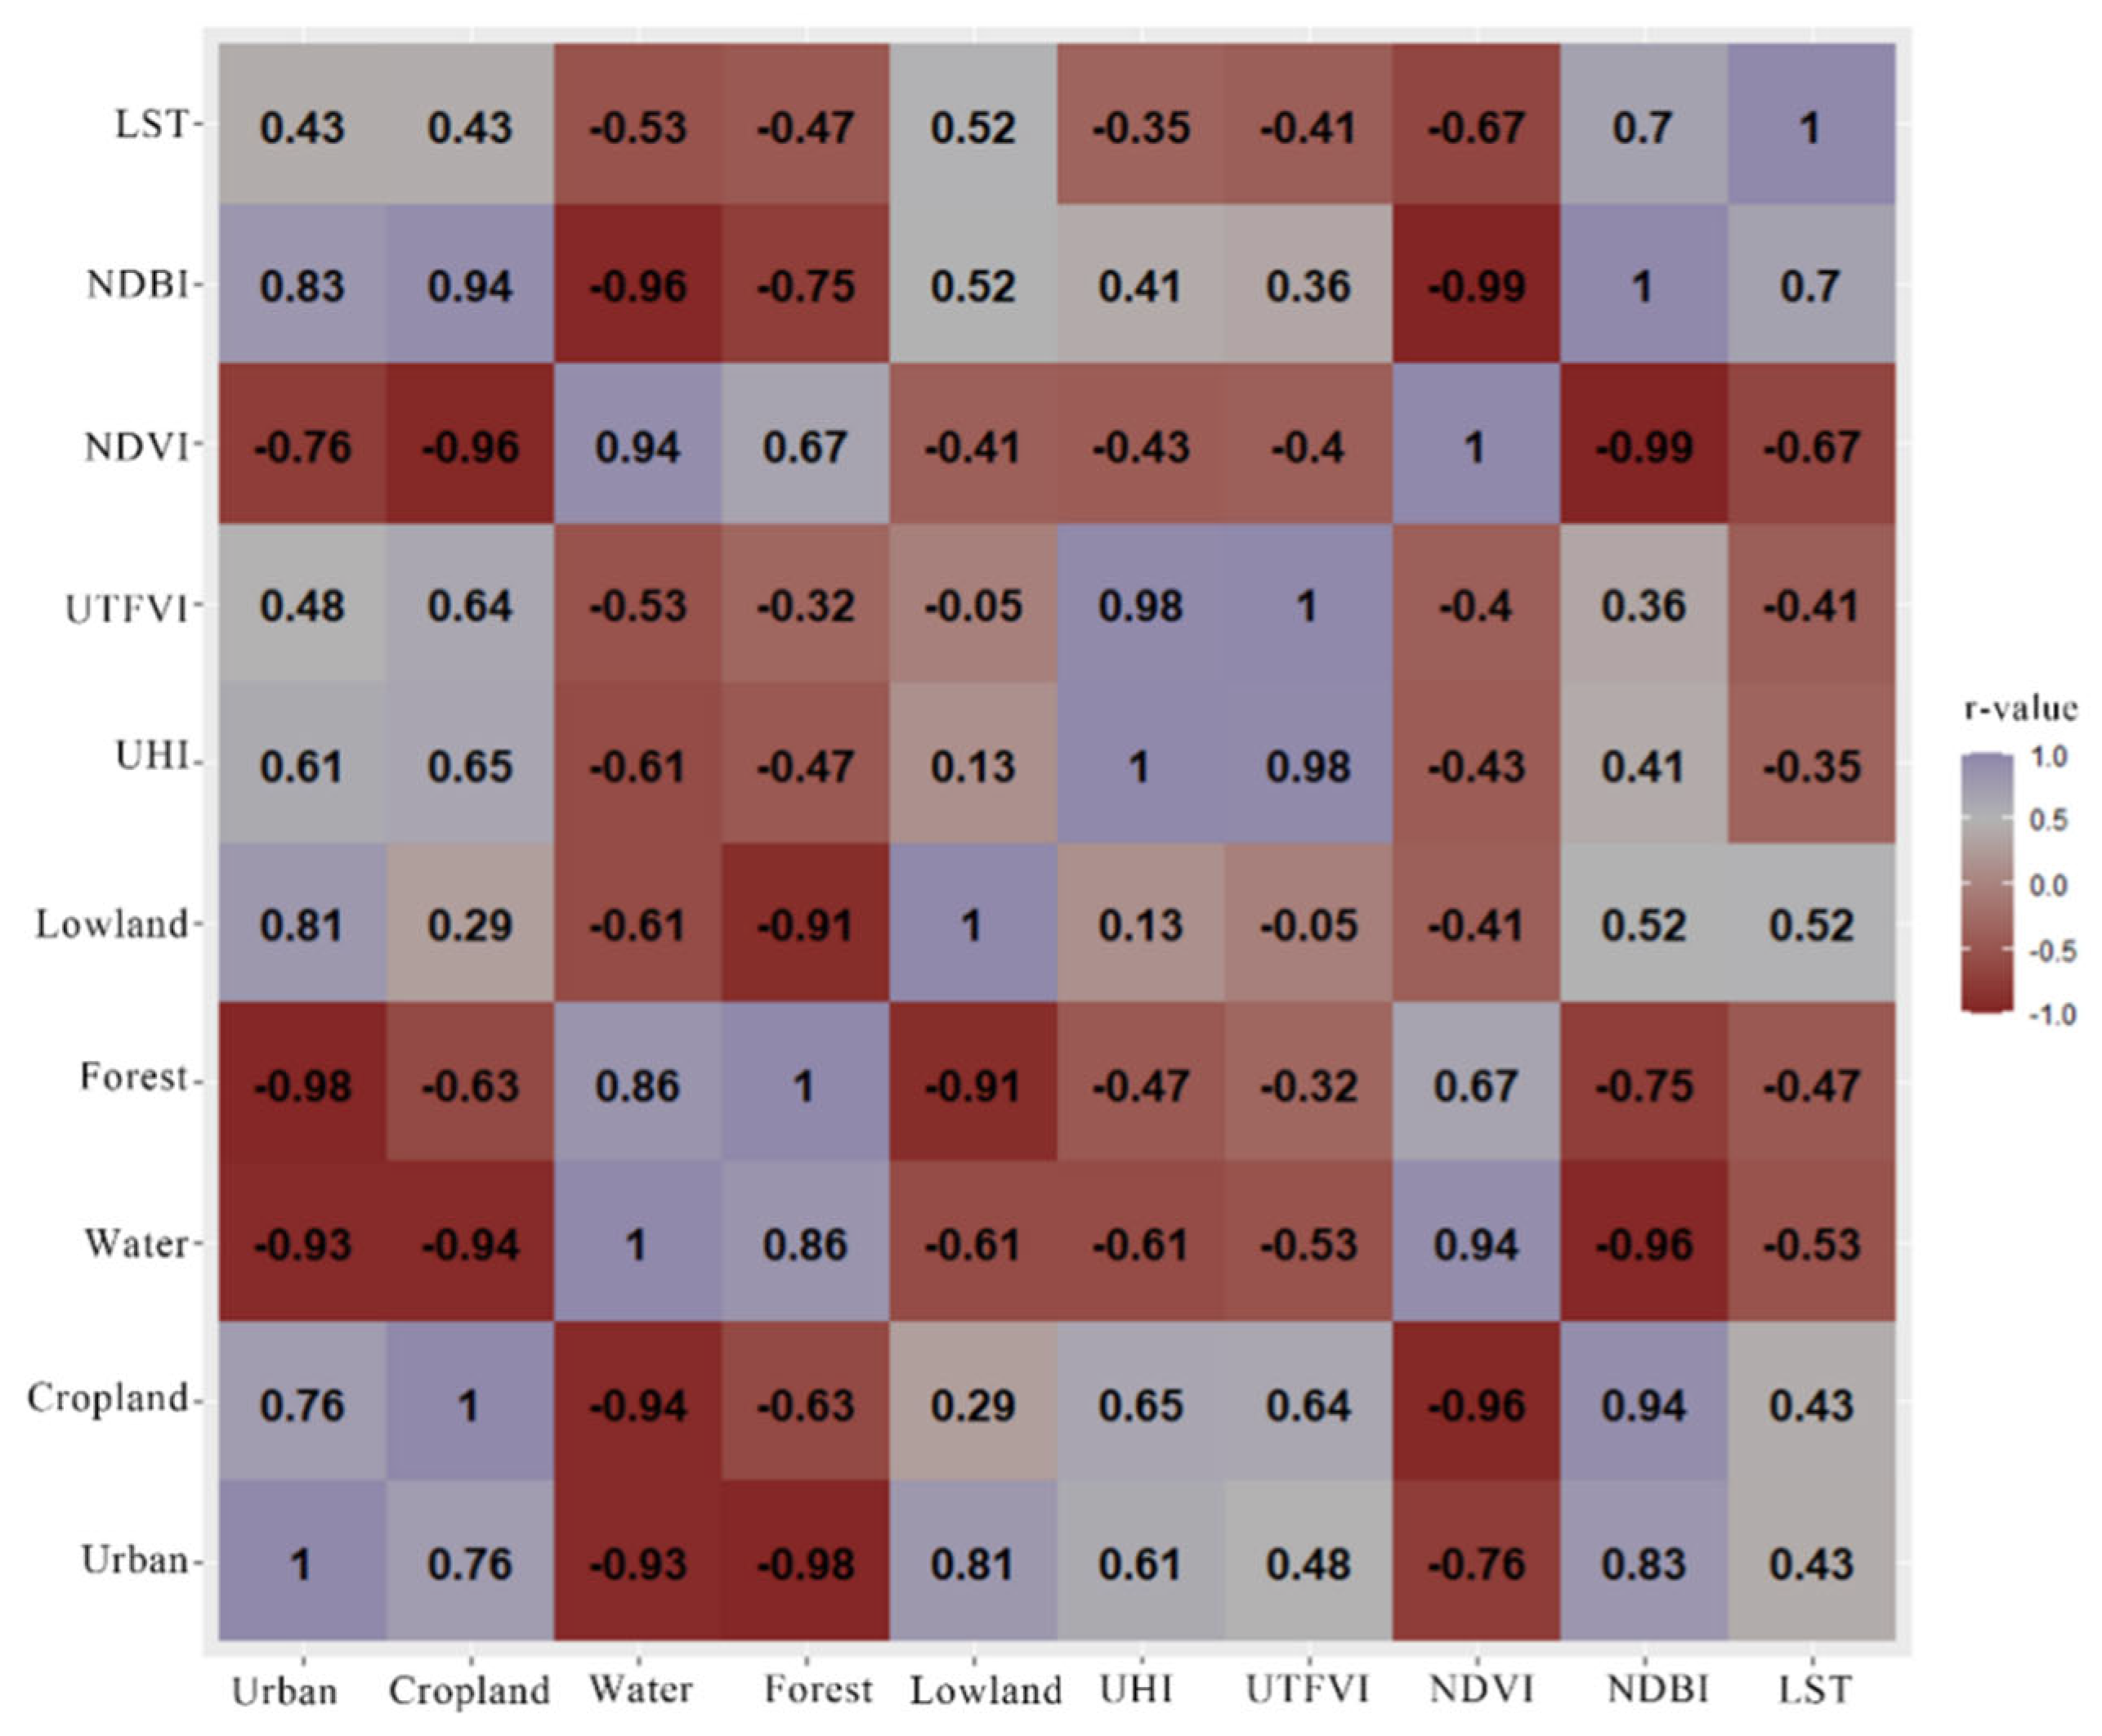
3.7. Statistical Analysis

Pearson’s Correlation Analysis is used to determine the relationship between all LUC variables and different LST indices. The NDVI had a negative and statistically insignificant relationship with the LST. At the same time, the LST association between NDBI was positive and negligible. There was a strong positive significant correlation between urban areas, NDBI, and low land with LST (Figure 6). This measure was also found a negative and insignificant relationship with water, cropland, and Forest.
Similarly, the UHI and UTFVI had a significant positive association with urban Areas, NDBI, and low land, while the negative and insignificant association with water, cropland, Forest, and NDVI, including urban vegetation. The Pearson correlation coefficient confirms the positive and robust relationship between urban/constructed areas with LST, UHIs, and UTFVIs. As a result, it could be a hot climate in a metropolitan area if more infrastructure, highways, businesses, and industrial zones are built. Agricultural/cropland has a positive and significant relationship, while lowland has a negative and insignificant relationship with the LST.

4. Discussion

The objective of this study was to summarize the various factors that influence UHI density. A review of the elements was then carried out to identify the pros and cons. It was also concluded that planning and designing for UHI reduction are interrelated. Due to the rapid growth of Tianjin city’s urban population and industrialization, land use changes dramatically. The climate also changes due to the presence of more people. As a result of unregulated development and anthropogenic heat, the density of UHI increases. This study established that planning and designing for reduced UHI might be accomplished by modifying the features of the surrounding environment [4,73,74,75]. Urbanization and industrialization in Tianjin produce higher temperatures in the city. Natural processes do not cause this phenomenon but result from human actions.

4.1. LUC, Impervious & Green Space versus Temperature

Land use cover (LUC) classification can assist in estimating the relationship between LST and a variety of land use indices [30,72,76]. Additionally, macro/anthropogenic climate [9], meso- and oscillating climate, the land-use landscape, urban expansion [22,77,78], spatial transitions, human pressures on the ecosystem [3,75,79,80], energy transition, general macro- and urbanized environments, and socioeconomic and biophysical conditions may all be associated with the UHI [9,15,75,81]. From 2005 to 2020, this study discovered a highly discordant and out-of-the-ordinary trend in LUC change. The rapid urbanization may explain this abrupt change in LUC. The extensive deforestation and cropland destruction associated with various development projects (housing and industrial development) may have resulted in a decline in total vegetation cover [5,58,65,73]. This rapid loss of vegetation cover (VC) has far-reaching implications for reducing natural cooling effects due to shading and plant evapotranspiration [34,40,48]. This study discovered a negative correlation between NDVI and LST and the presence of VC and its impact on UHI. Transpiration and evaporation of plants may become extinct as a result [12,16,76]. Grasslands and ornamental plants have a lower impact on LST reduction than other types of vegetation, such as forest/urban treebanks and gardens, according to earlier research [32,48]. Our findings indicate that LUC significantly affects LST in the urban environment, particularly in urban areas. The effect varies according to the proportion of green space, blue space (constructed areas), and water bodies [35,73], indicating that vegetation contributes to the city’s cooling. Since buildings, streets, concrete and asphalt roads, and other components of the landscape [25,82], built-up areas contribute significantly to urban heat fluxes. Since natural evaporation from water surfaces helps cool the surrounding air, lowering overall air temperature in the region, the study’s findings also show a positive linear relationship between LST and the built-up area [65,83,84]. This study found that UHI was not good for the NDVI [12,48,65]. Changes have been made to the city’s downtown area and Tianjin’s growth as a city. Many lands in these areas have been turned around by the government or private businesses to build new homes, businesses, and factories on top of it [25,53,83]. In certain situations, new industries were erected alongside secondary infrastructure on well-maintained cropland/forest areas, lowering the number of cropland and forest areas while raising LSTs in such places [83,85]. These areas were supposed to function as a buffer between urban and rural regions, absorbing surplus heat from vehicles and industry [11,52].
According to the findings, urban expansion is a key contributor to LST, which causes uneven thermal fluxes in metropolitan regions. This radiation/heat exchange is thought to be an essential contribution to UHI and to urban climate change. As a result, it can be stated that LUC has a significant impact on a location’s surface radiant temperature and that human-induced LUC change is the key mechanism influencing LST rises in the urban micro-atmosphere.

4.2. LUC, Impervious & Green Space Vs. UTFVI

Spatial fluctuations in LST are significant climatic variables employed by remote sensing data to estimate the urban thermal environment using UTVFI. It has been shown that growing population density and transitions in the city’s urban climate, notably in terms of urban development and vegetation cover loss, are the significant causes of oscillations in urban thermal conditions [4,7,65,77]. Land-use change is the driving factor of environmental deterioration and changes in urban EEI values in its aggregate spatiotemporal evaluation of LUC, NDVI, BUI, and UTFVI [28,70,74]. According to quantitative research, the increase in urban temperatures and changes in the urban and regional climate result from fast urban/built-up area expansion and various building materials and other key structures in city development [78].

4.3. Current Research Trends in UHI Mitigation and Adaptation

The world’s natural resources are depleting yearly, while temperatures are rising. Most scientists are now attempting to avoid the production of this so that people can live in more pleasant environments [8,38,58]. The open and green surfaces are the most significant regulating element in decreasing UHIs. It is important to note that green areas do not have to be of a specific type. Green roofs roof gardens may now contribute to the urban environment [4,10,23].
Similarly, the location and shape of settlements are significant considerations for urban heat. To lessen urban heat, buildings must be placed in such a manner that they do not obstruct the breeze [43,58,69,82]. The study’s findings will be shared with appropriate institutions/policymakers, and LUC Layout may be recommended for Tianjin. For example, additional green space should be added to metropolitan areas. According to the study’s findings, smaller green patches are calmer than larger green ones. As a result, green zones should be developed in cities by constructing parks and tiny plant communities, effectively countering the rise in surface temperatures [12,18,31,36,40]. The critical issue that must be addressed in Tianjin’s rural areas is preserving existing green spaces. Agricultural policy should be reviewed for Tianjin and its surroundings, and agricultural development should not be permitted in places with existing vegetation. High LSTs can be avoided by increasing green space in rural regions. Furthermore, any new settlements should be developed on impermeable or unoccupied land rather than green space. Green spaces in cities can bring long-term advantages if specific criteria are followed.

5. Conclusions

Environmental scientists and urban planners are currently concerned about the impact of the LST surge in urban areas, as it can cause serious health problems. According to scientific evidence, rapid growth raises the Earth’s average surface temperature. This study looked into the issues of urban heat evaluation and land-use change in Tianjin, China. The UTFVI Index and Google Earth Engine (GEE), a web-based remote sensing tool, were used to analyze the region’s thermal pattern on Landsat Time Series data estimated for LST’s spatial distribution. The findings show that urbanization changed the spatial distribution of LST between 2005 and 2020 and that temperatures in Tianjin’s central region soared. Simultaneously, temperatures were relatively low in areas far from densely populated areas. The city’s eco-environmental changes were induced by changes in vegetation cover from 2005 to 2020, as demonstrated by the lowering NDVI trend. As a result, Tianjin was discovered to have the most severe urban heat island phenomenon and the worst ecological state, indicating that a more acceptable city layout and improved urban planning regulations should be implemented as soon as possible. The city’s Urban Thermal Field Variance Index was used to determine Tianjin’s ecological status (UTFVI). The worst Environmental Evaluation Index (EEI) has occurred in highly dense urban areas, contributing to a degraded and thermal eco-environment over time. According to the study, remote sensing techniques are appropriate for evaluating UHI and non-UHI sites. Still, high-resolution imagery with the same atmospheric and surface conditions is challenging to obtain and select. Tianjin has become the most severe urban heat island as a result of this environmental issue. The Urban Thermal Field Variance Index was used to calculate the city’s worst ecological index. It demonstrated how, throughout time, the increasing density of dense metropolitan areas has contributed to the development of deteriorated and heated ecosystems. The study’s limitations are that it only uses ground-based data and cannot be utilized to determine UHI zones.

Author Contributions

Conceptualization, N.U., M.A.S. and Y.H.; data curation, N.U., M.A.S., M.D., S.G. and T.Z.; formal analysis, N.U., M.A.S. and M.D; funding acquisition, Y.H.; methodology, N.U., M.A.S. and S.G.; project administration, Y.H.; software, N.U. and M.A.S.; supervision, Y.H.; visualization, N.U., M.A.S., T.Z. and Y.H.; writing-original draft, N.U. and M.A.S.; writing-review and editing, N.U., M.A.S. and Y.H. All authors have read and agreed to the published version of the manuscript.

Funding

Reconstructing the Architecture System based on the coherence mechanism of “Architecture human-environment” in the Chinese context, Key project of national natural science foundation of China, Grant Number 52038007, 2021-01-2025-12.

Institutional Review Board Statement

Not applicable.

Informed Consent Statement

Not applicable.

Data Availability Statement

On request, the authors will provide the data from this study.

Acknowledgments

The author wishes to express his appreciation and gratitude to the anonymous reviewers and editors for their insightful comments and suggestions to improve the paper’s quality.

Conflicts of Interest

The authors declare no conflict of interest.

Abbreviations

LUCLand use cover
LSTLand surface temperature
UHIUrban heat islands
NDVINormalized Difference Vegetation Index
NDBINormalized Difference Building Index
TMThematic Mapper
TIRSThermal Infrared Sensor
OLIOperation Land Imager
UTFVIUrban Thermal Field Variance Index
EEIEcological Evaluation Index
RFRandom Forest
GEEGoogle Earth Engine
VCVegetation cover

References

  1. Beckline, M.; Yujun, S.; Yvette, B.; John, A.B.; Mor-Achankap, B.; Saeed, S.; Richard, T.; Wose, J.; Paul, C. Perspectives of remote sensing and GIS applications in tropical forest management. Am. J. Agric. For. 2017, 5, 33–39. [Google Scholar]
  2. Buyantuyev, A.; Wu, J. Urban heat islands and landscape heterogeneity: Linking spatiotemporal variations in surface temperatures to land-cover and socioeconomic patterns. Landsc. Ecol. 2010, 25, 17–33. [Google Scholar]
  3. Khan, T.U.; Mannan, A.; Hacker, C.E.; Ahmad, S.; Amir Siddique, M.; Khan, B.U.; Din, E.U.; Chen, M.; Zhang, C.; Nizami, M. Use of GIS and Remote Sensing Data to Understand the Impacts of Land Use/Land Cover Changes (LULCC) on Snow Leopard (Panthera uncia) Habitat in Pakistan. Sustainability 2021, 13, 3590. [Google Scholar]
  4. Amir Siddique, M.; Wang, Y.; Xu, N.; Ullah, N.; Zeng, P. The Spatiotemporal Implications of Urbanization for Urban Heat Islands in Beijing: A Predictive Approach Based on CA–Markov Modeling (2004–2050). Remote Sens. 2021, 13, 4697. [Google Scholar]
  5. Ullah, S.; Tahir, A.A.; Akbar, T.A.; Hassan, Q.K.; Dewan, A.; Khan, A.J.; Khan, M. Remote Sensing-Based Quantification of the Relationships between Land Use Land Cover Changes and Surface Temperature over the Lower Himalayan Region. Sustainability 2019, 11, 5492. [Google Scholar]
  6. Zhang, X.; Wang, D.; Hao, H.; Zhang, F.; Hu, Y. Effects of Land Use/Cover Changes and Urban Forest Configuration on Urban Heat Islands in a Loess Hilly Region: Case Study Based on Yan’an City, China. Int. J. Environ. Res. Public Health 2017, 14, 840. [Google Scholar] [CrossRef] [Green Version]
  7. Li, J.; Zhang, C.; Zheng, X.; Chen, Y. Temporal-Spatial Analysis of the Warming Effect of Different Cultivated Land Urbanization of Metropolitan Area in China. Sci. Rep. 2020, 10, 2760. [Google Scholar] [CrossRef] [Green Version]
  8. Sannigrahi, S.; Rahmat, S.; Bhatt, S. Urban biophysical composition and its impact on thermal changes and ecosystem production. In Proceedings of the EGU General Assembly Conference Abstracts, Vienna, Austria, 23–28 April 2017; p. 7641. [Google Scholar]
  9. Li, Y.; Zhu, L.; Zhao, X.; Li, S.; Yan, Y. Urbanization impact on temperature change in China with emphasis on land cover change and human activity. J. Clim. 2013, 26, 8765–8780. [Google Scholar]
  10. Firozjaei, M.K.; Sedighi, A.; Kiavarz, M.; Qureshi, S.; Haase, D.; Alavipanah, S.K. Automated built-up extraction index: A new technique for mapping surface built-up areas using LANDSAT 8 OLI imagery. Remote Sens. 2019, 11, 1966. [Google Scholar]
  11. Chapa, F.; Hariharan, S.; Hack, J. A New Approach to High-Resolution Urban Land Use Classification Using Open Access Software and True Color Satellite Images. Sustainability 2019, 11, 5266. [Google Scholar] [CrossRef] [Green Version]
  12. Zhang, Q.; Su, S. Determinants of urban expansion and their relative importance: A comparative analysis of 30 major metropolitans in China. Habitat Int. 2016, 58, 89–107. [Google Scholar]
  13. Debbage, N.; Shepherd, J.M. The urban heat island effect and city contiguity. Comput. Environ. Urban Syst. 2015, 54, 181–194. [Google Scholar]
  14. Earl, N.; Simmonds, I. Spatial and temporal variability and trends in 2001–2016 global fire activity. J. Geophys. Res. Atmos. 2018, 123, 2524–2536. [Google Scholar]
  15. Liu, L.; Zhang, Y. Urban heat island analysis using the Landsat TM data and ASTER data: A case study in Hong Kong. Remote Sens. 2011, 3, 1535–1552. [Google Scholar]
  16. Zullo, F.; Fazio, G.; Romano, B.; Marucci, A.; Fiorini, L. Effects of urban growth spatial pattern (UGSP) on the land surface temperature (LST): A study in the Po Valley (Italy). Sci. Total Environ. 2019, 650, 1740–1751. [Google Scholar] [PubMed]
  17. Earl, N.; Simmonds, I. Variability, trends, and drivers of regional fluctuations in Australian fire activity. J. Geophys. Res. Atmos. 2017, 122, 7445–7460. [Google Scholar]
  18. Sexton, J.O.; Song, X.-P.; Huang, C.; Channan, S.; Baker, M.E.; Townshend, J.R. Urban growth of the Washington, DC–Baltimore, MD metropolitan region from 1984 to 2010 by annual, Landsat-based estimates of impervious cover. Remote Sens. Environ. 2013, 129, 42–53. [Google Scholar]
  19. Liu, W.; Ji, C.; Zhong, J.; Jiang, X.; Zheng, Z. Temporal characteristics of the Beijing urban heat island. Theor. Appl. Climatol. 2007, 87, 213–221. [Google Scholar]
  20. Chen, X.-L.; Zhao, H.-M.; Li, P.-X.; Yin, Z.-Y. Remote sensing image-based analysis of the relationship between urban heat island and land use/cover changes. Remote Sens. Environ. 2006, 104, 133–146. [Google Scholar]
  21. Li, P.; Siddique, M.S.; Fan, B.; Huang, H.; Liu, D. Effects of land surface type changes on urban heat island: A case study of Chaoyang District, Beijing. J. Beijing For. Univ. 2020, 42, 99–109. [Google Scholar] [CrossRef]
  22. Tariq, A.; Riaz, I.; Ahmad, Z.; Yang, B.; Amin, M.; Kausar, R.; Andleeb, S.; Farooqi, M.A.; Rafiq, M. Land surface temperature relation with normalized satellite indices for the estimation of spatio-temporal trends in temperature among various land use land cover classes of an arid Potohar region using Landsat data. Environ. Earth Sci. 2019, 79, 40. [Google Scholar] [CrossRef]
  23. Jain, S.; Sannigrahi, S.; Sen, S.; Bhatt, S.; Chakraborti, S.; Rahmat, S. Urban heat island intensity and its mitigation strategies in the fast-growing urban area. J. Urban Manag. 2019, 9, 54–66. [Google Scholar]
  24. Earl, N.; Simmonds, I.; Tapper, N. Weekly cycles in peak time temperatures and urban heat island intensity. Environ. Res. Lett. 2016, 11, 074003. [Google Scholar]
  25. Thanh Hoan, N.; Liou, Y.-A.; Nguyen, K.-A.; Sharma, R.C.; Tran, D.-P.; Liou, C.-L.; Cham, D.D. Assessing the effects of land-use types in surface urban heat islands for developing comfortable living in Hanoi City. Remote Sens. 2018, 10, 1965. [Google Scholar]
  26. Sannigrahi, S.; Bhatt, S.; Paul, S.K.; Sen, S.; Rahmat, S.; Uniyal, B. The Spatial Variations and Hotspots of Ecosystem Service Values in India During 1985–2005. In Proceedings of the AGU Fall Meeting Abstracts, New Orleans, LO, USA, 11–15 December 2017. [Google Scholar]
  27. Lambin, E.F.; Geist, H.J.; Lepers, E. Dynamics of land-use and land-cover change in tropical regions. Annu. Rev. Environ. Resour. 2003, 28, 205–241. [Google Scholar]
  28. Macarof, P.; Statescu, F. Comparasion of NDBI and NDVI as Indicators of Surface Urban Heat Island Effect in Landsat 8 Imagery: A Case Study of Iasi. Present Environ. Sustain. Dev. 2017, 11, 141. [Google Scholar] [CrossRef] [Green Version]
  29. Amir Siddique, M.; Dongyun, L.; Li, P.; Rasool, U.; Ullah Khan, T.; Javaid Aini Farooqi, T.; Wang, L.; Fan, B.; Rasool, M.A. Assessment and simulation of land use and land cover change impacts on the land surface temperature of Chaoyang District in Beijing, China. PeerJ 2020, 8, e9115. [Google Scholar] [CrossRef] [PubMed]
  30. Oluseyi, I.O.; Fanan, U.; Magaji, J. An evaluation of the effect of land use/cover change on the surface temperature of Lokoja town, Nigeria. Afr. J. Environ. Sci. Technol. 2009, 3, 86–90. [Google Scholar]
  31. Yang, P.; Ren, G.; Liu, W. Spatial and temporal characteristics of Beijing urban heat island intensity. J. Appl. Meteorol. Climatol. 2013, 52, 1803–1816. [Google Scholar]
  32. Yu, Z.; Xu, S.; Zhang, Y.; Jorgensen, G.; Vejre, H. Strong contributions of local background climate to the cooling effect of urban green vegetation. Sci. Rep. 2018, 8, 6798. [Google Scholar] [CrossRef]
  33. Buyadi, S.N.A.; Mohd, W.M.N.W.; Misni, A. Impact of land use changes on the surface temperature distribution of area surrounding the National Botanic Garden, Shah Alam. Procedia-Soc. Behav. Sci. 2013, 101, 516–525. [Google Scholar]
  34. Xiong, Y.; Huang, S.; Chen, F.; Ye, H.; Wang, C.; Zhu, C. The Impacts of Rapid Urbanization on the Thermal Environment: A Remote Sensing Study of Guangzhou, South China. Remote Sens. 2012, 4, 2033–2056. [Google Scholar]
  35. Verburg, P.H.; Veldkamp, A.; Willemen, L.; Overmars, K.P.; Castella, J.-C. Landscape level analysis of the spatial and temporal complexity of land-use change. Ecosyst. Land Use Chang. 2004, 153, 217–230. [Google Scholar] [CrossRef]
  36. Huff, F.; Changnon, S., Jr. Climatological assessment of urban effects on precipitation at St. Louis. J. Appl. Meteorol. 1972, 11, 823–842. [Google Scholar]
  37. Mumtaz, F.; Arshad, A.; Mirchi, A.; Tariq, A.; Dilawar, A.; Hussain, S.; Shi, S.; Noor, R.; Noor, R.; Daccache, A. Impacts of reduced deposition of atmospheric nitrogen on coastal marine eco-system during substantial shift in human activities in the twenty-first century. Geomat. Nat. Hazards Risk 2021, 12, 2023–2047. [Google Scholar]
  38. Tariq, A.; Shu, H.; Gagnon, A.S.; Li, Q.; Mumtaz, F.; Hysa, A.; Siddique, M.A.; Munir, I. Assessing burned areas in wildfires and prescribed fires with spectral indices and SAR images in the Margalla Hills of Pakistan. Forests 2021, 12, 1371. [Google Scholar]
  39. Walawender, J.P.; Szymanowski, M.; Hajto, M.J.; Bokwa, A. Land surface temperature patterns in the urban agglomeration of Krakow (Poland) derived from Landsat-7/ETM+ data. Pure Appl. Geophys. 2014, 171, 913–940. [Google Scholar]
  40. Wu, L.; Sun, B.; Zhou, S.; Huang, S.-E.; Zhao, Q. A new fusion technique of remote sensing images for land use/cover. Pedosphere 2004, 14, 187–194. [Google Scholar]
  41. Xiao, R.-b.; Ouyang, Z.-Y.; Zheng, H.; Li, W.-F.; Schienke, E.W.; Wang, X.-K. Spatial pattern of impervious surfaces and their impacts on land surface temperature in Beijing, China. J. Environ. Sci. 2007, 19, 250–256. [Google Scholar]
  42. Guha, S.; Govil, H.; Mukherjee, S. Dynamic analysis and ecological evaluation of urban heat islands in Raipur city, India. J. Appl. Remote Sens. 2017, 11, 036020. [Google Scholar]
  43. Tali, J.; Emtehani, M.; Murthy, K.; Nagendra, H. Future Threats to CBD: A Case Study of Bangalore CBD. N. Y. Sci. J. 2012, 5, 22–27. [Google Scholar]
  44. Singh, P.; Kikon, N.; Verma, P. Impact of land use change and urbanization on urban heat island in Lucknow city, Central India. A remote sensing based estimate. Sustain. Cities Soc. 2017, 32, 100–114. [Google Scholar]
  45. Tonkaz, T.; Çetin, M. Effects of urbanization and land-use type on monthly extreme temperatures in a developing semi-arid region, Turkey. J. Arid Environ. 2007, 68, 143–158. [Google Scholar]
  46. Turner, B.L.; Lambin, E.F.; Reenberg, A. The emergence of land change science for global environmental change and sustainability. Proc. Natl. Acad. Sci. USA 2007, 104, 20666–20671. [Google Scholar] [PubMed] [Green Version]
  47. Morris, C.; Simmonds, I. Associations between varying magnitudes of the urban heat island and the synoptic climatology in Melbourne, Australia. Int. J. Climatol. A J. R. Meteorol. Soc. 2000, 20, 1931–1954. [Google Scholar]
  48. Wu, Q.; Tan, J.; Guo, F.; Li, H.; Chen, S. Multi-scale relationship between land surface temperature and landscape pattern based on wavelet coherence: The case of metropolitan Beijing, China. Remote Sens. 2019, 11, 3021. [Google Scholar]
  49. Morris, C.; Simmonds, I.; Plummer, N. Quantification of the influences of wind and cloud on the nocturnal urban heat island of a large city. J. Appl. Meteorol. Climatol. 2001, 40, 169–182. [Google Scholar]
  50. Kleerekoper, L.; Van Esch, M.; Salcedo, T.B. How to make a city climate-proof, addressing the urban heat island effect. Resour. Conserv. Recycl. 2012, 64, 30–38. [Google Scholar]
  51. Morabito, M.; Crisci, A.; Messeri, A.; Orlandini, S.; Raschi, A.; Maracchi, G.; Munafò, M. The impact of built-up surfaces on land surface temperatures in Italian urban areas. Sci. Total Environ. 2016, 551, 317–326. [Google Scholar]
  52. Huang, Y.; Qiu, Q.; Sheng, Y.; Min, X.; Cao, Y. Exploring the Relationship between Urbanization and the Eco-Environment: A Case Study of Beijing. Sustainability 2019, 11, 6298. [Google Scholar] [CrossRef] [Green Version]
  53. Li, H.; Meier, F.; Lee, X.; Chakraborty, T.; Liu, J.; Schaap, M.; Sodoudi, S. Interaction between urban heat island and urban pollution island during summer in Berlin. Sci. Total Environ. 2018, 636, 818–828. [Google Scholar] [CrossRef] [PubMed]
  54. Kassomenos, P.; Kissas, G.; Petrou, I.; Begou, P.; Khan, H.S.; Santamouris, M. The influence of daily weather types on the development and intensity of the urban heat island in two Mediterranean coastal metropolises. Sci. Total Environ. 2022, 819, 153071. [Google Scholar] [PubMed]
  55. Connors, J.P.; Galletti, C.S.; Chow, W.T. Landscape configuration and urban heat island effects: Assessing the relationship between landscape characteristics and land surface temperature in Phoenix, Arizona. Landsc. Ecol. 2013, 28, 271–283. [Google Scholar]
  56. Ren, G.; Chu, Z.; Chen, Z.; Ren, Y. Implications of temporal change in urban heat island intensity observed at Beijing and Wuhan stations. Geophys. Res. Lett. 2007, 34, 1–5. [Google Scholar] [CrossRef]
  57. Tianjin Municipal Bureau of Statistics & Survey Office of the Nation Bureau of Statistics in Tianjin. Available online: http://stats.tj.gov.cn/nianjian/2019nj/zk/indexeh.htm (accessed on 27 November 2019).
  58. Tian, G.; Wu, J.; Yang, Z. Spatial pattern of urban functions in the Beijing metropolitan region. Habitat Int. 2010, 34, 249–255. [Google Scholar]
  59. Wang, R.; Hou, H.; Murayama, Y.; Derdouri, A. Spatiotemporal Analysis of Land Use/Cover Patterns and Their Relationship with Land Surface Temperature in Nanjing, China. Remote Sens. 2020, 12, 440. [Google Scholar]
  60. He, C.; Shi, P.; Xie, D.; Zhao, Y. Improving the normalized difference built-up index to map urban built-up areas using a semiautomatic segmentation approach. Remote Sens. Lett. 2010, 1, 213–221. [Google Scholar]
  61. Zhang, Y.; Yu, T.; Gu, X.; Zhang, Y.; Chen, L. Land surface temperature retrieval from CBERS-02 IRMSS thermal infrared data and its applications in quantitative analysis of urban heat island effect. J. Remote Sens. 2006, 10, 789. [Google Scholar]
  62. Landsat, N. Science Data Users Handbook. Available online: https://d9-wret.s3.us-west-2.amazonaws.com/assets/palladium/production/s3fs-public/atoms/files/LSDS-1927_L7_Data_Users_Handbook-v2.pdf (accessed on 27 November 2019).
  63. Sobrino, J.A.; Jiménez-Muñoz, J.C.; Paolini, L. Land surface temperature retrieval from LANDSAT TM 5. Remote Sens. Environ. 2004, 90, 434–440. [Google Scholar]
  64. Chen, B.; Zhang, X.; Tao, J.; Wu, J.; Wang, J.; Shi, P.; Zhang, Y.; Yu, C. The impact of climate change and anthropogenic activities on alpine grassland over the Qinghai-Tibet Plateau. Agric. For. Meteorol. 2014, 189, 11–18. [Google Scholar]
  65. Xu, J.; Zhao, Y.; Sun, C.; Liang, H.; Yang, J.; Zhong, K.; Li, Y.; Liu, X. Exploring the Variation Trend of Urban Expansion, Land Surface Temperature, and Ecological Quality and Their Interrelationships in Guangzhou, China, from 1987 to 2019. Remote Sens. 2021, 13, 1019. [Google Scholar] [CrossRef]
  66. Almazroui, M.; Islam, M.N.; Jones, P. Urbanization effects on the air temperature rise in Saudi Arabia. Clim. Chang. 2013, 120, 109–122. [Google Scholar]
  67. Cai, G.; Du, M.; Xue, Y. Monitoring of urban heat island effect in Beijing combining ASTER and TM data. Int. J. Remote Sens. 2011, 32, 1213–1232. [Google Scholar]
  68. Zha, Y.; Gao, J.; Ni, S. Use of normalized difference built-up index in automatically mapping urban areas from TM imagery. Int. J. Remote Sens. 2003, 24, 583–594. [Google Scholar]
  69. Hansen, M.C.; Loveland, T.R. A review of large area monitoring of land cover change using Landsat data. Remote Sens. Environ. 2012, 122, 66–74. [Google Scholar]
  70. Guha, S.; Govil, H.; Dey, A.; Gill, N. Analytical study of land surface temperature with NDVI and NDBI using Landsat 8 OLI and TIRS data in Florence and Naples city, Italy. Eur. J. Remote Sens. 2018, 51, 667–678. [Google Scholar]
  71. Michishita, R.; Jiang, Z.; Xu, B. Monitoring two decades of urbanization in the Poyang Lake area, China through spectral unmixing. Remote Sens. Environ. 2012, 117, 3–18. [Google Scholar]
  72. Simmonds, I.; Li, M. Trends and variability in polar sea ice, global atmospheric circulations, and baroclinicity. Ann. N. Y. Acad. Sci. 2021, 1504, 167–186. [Google Scholar]
  73. Valdiviezo-N, J.C.; Téllez-Quiñones, A.; Salazar-Garibay, A.; López-Caloca, A.A. Built-up index methods and their applications for urban extraction from Sentinel 2A satellite data: Discussion. JOSA A 2018, 35, 35–44. [Google Scholar]
  74. Pandey, D.; Tiwari, K. Extraction of urban built-up surfaces and its subclasses using existing built-up indices with separability analysis of spectrally mixed classes in AVIRIS-NG imagery. Adv. Space Res. 2020, 66, 1829–1845. [Google Scholar]
  75. Jiang, J.; Tian, G. Analysis of the impact of land use/land cover change on land surface temperature with remote sensing. Procedia Environ. Sci. 2010, 2, 571–575. [Google Scholar]
  76. Kang, P.; Chen, W.; Hou, Y.; Li, Y. Spatial-temporal risk assessment of urbanization impacts on ecosystem services based on pressure-status—response framework. Sci. Rep. 2019, 9, 16806. [Google Scholar] [CrossRef] [PubMed]
  77. Rouibah, K.; Belabbas, M. Applying Multi-Index approach from Sentinel-2 Imagery to Extract Urban Area in dry season (Semi-Arid Land in North East Algeria). Rev. Teledetección 2020, 56, 89–101. [Google Scholar] [CrossRef]
  78. Guo, L.; Liu, R.; Men, C.; Wang, Q.; Miao, Y.; Zhang, Y. Quantifying and simulating landscape composition and pattern impacts on land surface temperature: A decadal study of the rapidly urbanizing city of Beijing, China. Sci. Total Environ. 2019, 654, 430–440. [Google Scholar] [CrossRef] [PubMed]
  79. Sobrino, J.A.; Jiménez-Muñoz, J.C. Minimum configuration of thermal infrared bands for land surface temperature and emissivity estimation in the context of potential future missions. Remote Sens. Environ. 2014, 148, 158–167. [Google Scholar]
  80. Weng, Q.; Lo, C. Spatial analysis of urban growth impacts on vegetative greenness with Landsat TM data. Geocarto Int. 2001, 16, 19–28. [Google Scholar]
  81. Sannigrahi, S.; Zhang, Q.; Pilla, F.; Joshi, P.K.; Basu, B.; Keesstra, S.; Roy, P.; Wang, Y.; Sutton, P.C.; Chakraborti, S. Responses of ecosystem services to natural and anthropogenic forcings: A spatial regression based assessment in the world’s largest mangrove ecosystem. Sci. Total Environ. 2020, 715, 137004. [Google Scholar]
  82. Chen, W.; Zhang, Y.; Pengwang, C.; Gao, W. Evaluation of urbanization dynamics and its impacts on surface heat islands: A case study of Beijing, China. Remote Sens. 2017, 9, 453. [Google Scholar]
  83. Sidhu, N.; Pebesma, E.; Câmara, G. Using Google Earth Engine to detect land cover change: Singapore as a use case. Eur. J. Remote Sens. 2018, 51, 486–500. [Google Scholar]
  84. Faqe Ibrahim, G. Urban land use land cover changes and their effect on land surface temperature: Case study using Dohuk City in the Kurdistan Region of Iraq. Climate 2017, 5, 13. [Google Scholar]
  85. Feng, H.; Liu, H.; Wu, L. Monitoring the relationship between the land surface temperature change and urban growth in Beijing, China. IEEE J. Sel. Top. Appl. Earth Obs. Remote Sens. 2014, 7, 4010–4019. [Google Scholar]
Figure 1. Geographic location and characterization of the study area.
Buildings 12 00399 g001
Figure 2. Methodology flow chart for the study.
Buildings 12 00399 g002
Figure 3. (A) Land use cover (LUC) maps of Tianjin and. (B) represents the land surface temperature (LST) maps of the Tianjin area during 2005, 2010, 2015, and 2020.
Buildings 12 00399 g003
Figure 4. (A) Normalize Difference of Vegetation Index (NDVI) maps of Tianjin and. (B) represents the Normalize Difference of Build-up Index (NDBI) maps of the Tianjin area during 2005, 2010, 2015, and 2020.
Buildings 12 00399 g004
Figure 5. (A) Urban heat island (UHI) and. (B) represents the Tianjin area’s urban thermal field variance index (UTFVI) maps during 2005, 2010, 2015, and 2020.
Buildings 12 00399 g005
Figure 6. The correlation matrix of all variables was calculated with the Pearson’s correlation (p < 0.05) method in R. Numbers ranging from −1 to +1 are Pearson’s rank correlation coefficients (r) of variables. Color depth indicates the correlation strength, while numbers show the R-values.
Buildings 12 00399 g006
Table 1. Details of the Landsat data used in this study.
Images PeriodeSpacecraftSensor Resolution
May–September 2005Landsat-5TM30, 15, 100 m
May–September 2010Landsat-5TM30, 15, 100 m
May–September 2015Landsat-8OLI_TIRS30, 15, 100 m
May–September 2020Landsat-8OLI_TIRS30, 15, 100 m
Table 2. Land use cover (LUC) details from 2005 to 2020.
Land Cover2005201020152020
Area (km2)%AgeArea (km2)%AgeArea (km2)%AgeArea (km2)%Age
urban2425.1921%1914.4816%2576.9722%3043.3526%
cropland2796.2324%2791.5524%3347.7629%3288.5228%
water1345.7112%1526.8613%865.127%634.595%
forest2794.6424%3439.4329%2853.4224%2043.8618%
lowland2308.2320%1997.6717%2026.7117%2659.6923%
Table 3. Land use cover (LUC) change statistics from 2005 to 2020.
Land CoverChange 2000–2010%AgeChange 2010–2015%AgeChange 2015–2020%Age
urban−510.704−4%662.4856%466.3804%
cropland−4.6790%556.2095%−59.240−1%
water181.1512%−661.736−6%−230.540−2%
forest644.7936%−586.008−5%−809.560−7%
lowland−310.561−3%29.0460%632.9705%
Table 4. Details of land surface temperature (LST) from 2005 to 2020.
LST (°C)
Categories
2005201020152020
Area km2%AgeArea km2%AgeArea km2%AgeArea km2%Age
<201239.39911%3911.36137%110.3201%792.66418%
20–254961.73045%5946.67356%3237.27334%2119.03847%
25–304672.71743%747.5847%5982.67363%1313.65929%
30–3545.0650%32.7420%168.1392%265.9936%
>3510.0220%20.0040%39.9600%50.3701%
Table 5. Details of Normalize Difference of Vegetation (NDVI) and Build-up Index (NDBI) from 2005 to 2020.
Classes2005201020152020
Area (km2)Area (km2)Area (km2)Area (km2)
NDVI<0.2532.9892.86195.99314.83
0.26–0.453880.111237.00895.581516.10
0.46–0.597234.449987.268998.427913.16
>0.60204.6335.431258.441607.22
NDBI<−0.9932.9892.86195.99314.83
−0.10 to −0.7538801237.00895.581516.10
−0.76 to −0.457234.449987.268998.427913.16
>−0.46204.6335.431258.441607.22
Table 6. Descriptive statistics of the urban heat island (UHI) during the study period for Tianjin.
UHI
Classes
2005201020152020
Area km2%AgeArea km2%AgeArea km2%AgeArea km2%Age
No UHI294.293.35198.762.19112.941.032010.2715.46
Low2699.6130.765992.0565.923326.9130.485362.4641.23
Moderate3710.0642.28750.048.256109.3955.963328.7225.59
High40.950.4792.721.021308.1111.98165.041.27
Very High26.020.3046.780.5159.470.54120.000.92
Table 7. Detailed Ecological Evaluation Index (EEI) of the study period for Tianjin.
UTFVIEEI2005201020152020
Area km2%AgeArea km2%AgeArea km2%AgeArea km2%Age
<0.005Good1166.099.983914.3834.40112.941.002010.2716.02
0.005–0.010Normal4891.9741.895992.0552.663326.9129.355362.4642.74
0.010–0.015Bad4557.5539.02750.046.596109.3953.893328.7226.53
0.015–0.020Worse743.686.37452.823.981308.1111.541165.049.29
>0.020Worst320.002.74270.012.37478.874.22680.785.43
Publisher’s Note: MDPI stays neutral with regard to jurisdictional claims in published maps and institutional affiliations.

