Article

Architectural Simulations on Spatio-Temporal Changes of Settlement Outdoor Thermal Environment in Guanzhong Area, China

1
School of Architecture, Chang’an University, Xi’an 710046, China
2
Faculty of Environmental Engineering, The University of Kitakyushu, Fukuoka 808-0135, Japan
3
School of Building Services Science and Engineering, Xi’an University of Architecture and Technology, Xi’an 710055, China
4
iSMART, Qingdao University of Technology, Qingdao 266033, China
*
Authors to whom correspondence should be addressed.
Buildings 2022, 12(3), 345; https://doi.org/10.3390/buildings12030345
Submission received: 10 January 2022 / Revised: 3 March 2022 / Accepted: 8 March 2022 / Published: 12 March 2022
(This article belongs to the Special Issue Thermal Comfort in Built Environment)

Abstract

:
This paper aims to provide data support for rural sustainable development through analyzing the spatio-temporal characteristics of the interactions of the outdoor thermal environment. The ordinary and representative rural settlements in the Guanzhong area were selected to analyze the dynamic process of the rural thermal environment through field measurements and numerical simulations. RMSE (root mean square error) and MAPE (mean absolute percentage) were used to verify the numerical simulation model, and physiological equivalent temperature (PET) was used to evaluate the outdoor thermal environment. Results show that the ENVI-met model reliably predicts the thermal environment of a rural settlement, as the air temperature and relative humidity values range of the RMSE and MAPE were 0.85–1.79 and 2.04–5.11%, respectively. Moreover, the air temperature rose by 3.08% and relative humidity dropped by 4.42% from 2003 to 2018 as the amount of artificial surfaces increased by 35.4% and the PET index gradually increased by 27.43% at daytime and 34.03% at nighttime. Furthermore, trees could improve the outdoor thermal environment significantly, mainly because the average air temperature decreased by 3.6% and relative humidity increased by 8%, and the PET index decreased by 12.4% and 13.1%, respectively, for daytime and nighttime. This case study is representative of rural settlements in the Guanzhong plain, and thus is an appeal to rural planners to pay attention to the thermal environment issues caused by increased artificial underlay surfaces and to focus on trees in rural areas.

1. Introduction

Urbanization itself is a complex process of rural-to-urban transformation with corresponding changes to social structures, economic structures, and way of life [1,2]. China has undergone an unprecedented urbanization process since the reform and opening up in 1978 [3,4]. Rapid urbanization has not only boosted the incomes of rural residents, but also changed the rural settlement landscape in China [5]. More specifically, natural surfaces (vegetation, water surface, etc.) have been replaced by artificial surfaces (impermeable surfaces) due to chaotic and disorderly rural planning caused by a lack of reasonable policy guidance and planning strategies [6,7]. Moreover, the air temperature near impermeable ground will increase due to impermeable surfaces (concrete, etc.) promoting ground radiation compared to natural surfaces (soil, etc.) [8], especially in hot summer. Artificial surfaces change the original energy distribution balance (the decrease in latent heat and increase in sensible heat) because the thermodynamic properties of artificial surfaces are different from natural surfaces [9].
According to the state of the Global Climate 2020 from the World Meteorological Organization (WMO) (https://public.wmo.int/en, accessed on 27 October 2021), the global mean temperature of 2020 was 1.2 °C beyond the baseline from 1850 to 1900, indicating that the issue of global warming is getting worse. In addition, serious problems such as the emission of greenhouse gases [10], atmospheric pollution [11,12], and building energy consumption [13] will become more serious because of global warming. Moreover, higher temperatures accelerate blood circulation and increase skin temperature in the human body, which can easily cause heat stroke and even death [14]. Air temperatures also have significant effects on respiratory diseases, such as childhood asthma [15]. Thus, creating a more comfortable settlement living environment has become a research hotspot through improving the outdoor thermal environment [16,17]. Organizations, institutions, and scholars have conducted various studies on the urban heat island phenomenon caused by global warming, such as how to mitigate the urban heat island [10,18], the cooling effect of urban greens on the urban heat island [19,20,21], etc. However, few studies have focused on the outdoor thermal environment in rural settlements.
China, as the world’s largest developing country, has the largest number of rural villages, with about 45.23% of its total population were living in rural areas. Recent studies about rural planning are mainly about the rural landscape [22], architecture style, rural revitalization [23,24], rural tourism [25], etc. Exploring rural planning from the perspective of the thermal environment has never been given attention, and is the focus of this paper.
In general, the shading of tree crowns and ventilation are the major factors that can improve outdoor human comfort [26,27]. This is mainly because plants reduce the mean radiant temperature and improve environmental conditions through the phenomenon of evapo-transpiration and the control and reflection of radiant light [27]. Greenspaces planted with trees have been considered a more effective way of cooling per unit area than grass-covered greenspaces [28]. Meanwhile, a previous study indicated that the mean street temperature reductions are due to tree cover being considered more beneficial than grass cover in Hong Kong (China) [29]. Moreover, [30] indicated that a climate-adapted design has to include trees to maximize shaded surface areas. [31] revealed the most microclimate and human thermal comfort benefits in a neighborhood are due to shading by trees, following by clustered tree arrangements without canopy overlap. Thus, it can be seen that shading by trees is more beneficial for the outdoor thermal environment to improve human comfort [21,32].
As the most populous nation, China has undergone rapid and intense socio-economic transformations since the economic reforms of 1978 [4]. More specifically, Chinese urbanization entered an acceleration phase after reaching 25% in the 1980s, and then increasing by 1.43–1.44% annually for 8 consecutive years (between 1996 and 2003) [33]. With the government’s proposal of coordinated urban and rural development in 2002, urbanization was unprecedentedly active. Urbanization levels exceeded 50% in 2013 with the average annual growth rate of 4.0%, marking it as a stage of ultra-high-speed urbanization. In 2014, the government promulgated the “National New Urbanization Plan (2014–2020)” to guide national urbanization development from a macro, strategic, and fundamental perspective [34]. By 2018, urbanization reached 59.58%, with average annual growth rate that will reach 1.19%, indicating that urbanization has entered a new era [3]. Clearly, there were three development stages after 1978 that including acceleration (2003), ultra-high-speed urbanization (2013), and a new era (2018). Thus, we selected 2003, 2013, and 2018 as the time axis to investigate the spatio-temporal changes of the thermal environment.
In order to explore the temporal and spatial mechanisms of rural outdoor thermal environments from 2003 to 2018, the typical rural settlement of the Guanzhong plain has been selected as the object of study. Firstly, we verify the simulation software through field measurements; secondly, we explore the temporal-spatial mechanisms of the rural thermal environment; thirdly, we discuss the ways to improve the outdoor thermal environment; and finally, we provide suggestions for local rural policymakers. The purpose of this article is to provide data support for rural planning from the perspective of the thermal environment.

2. Materials and Methods
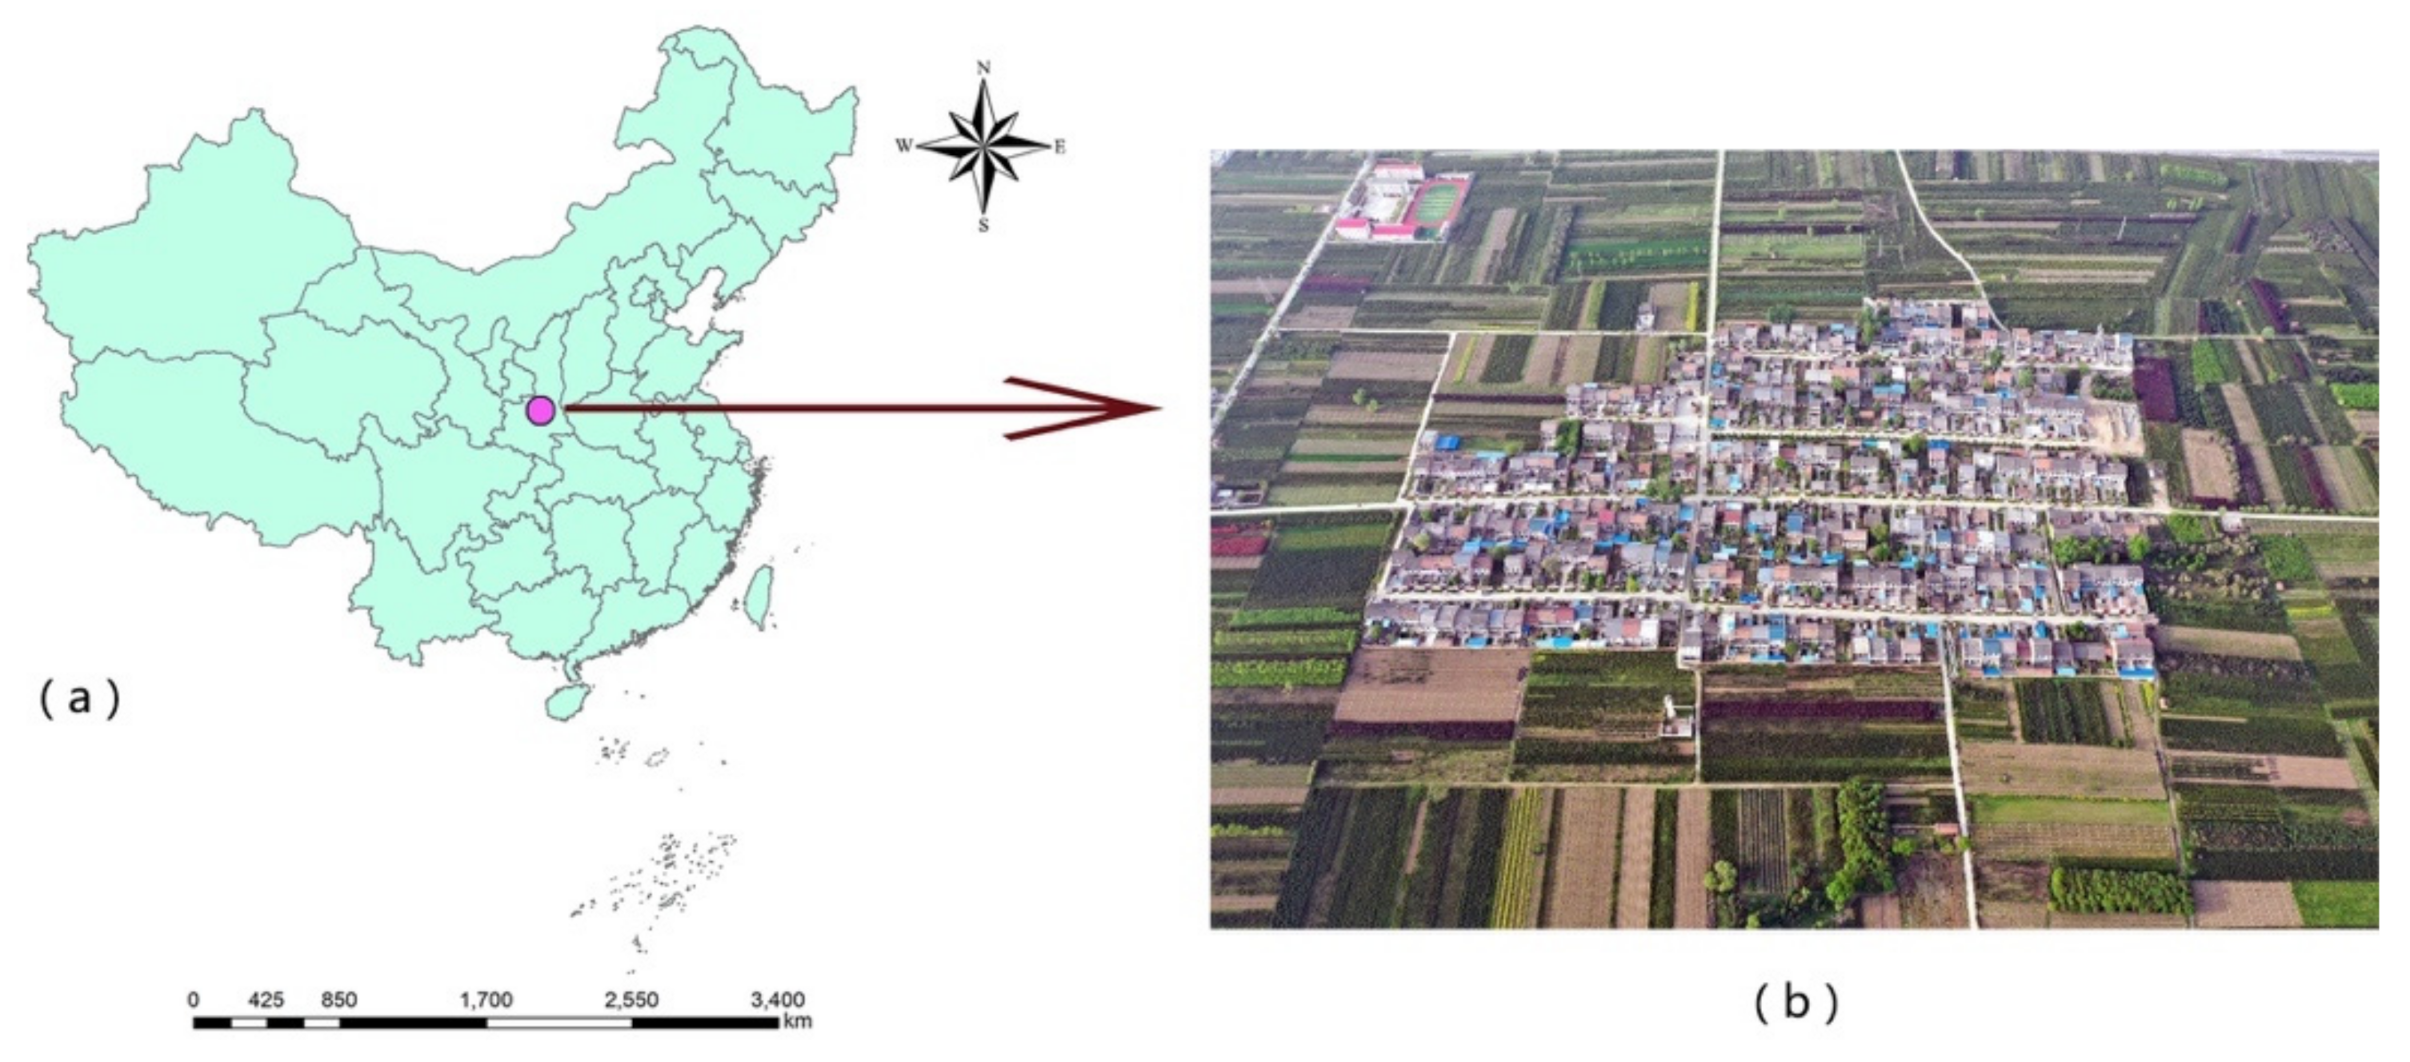
2.1. Study Area

Guanzhong plain (33°35′–33°52′ N, 105°48′–110°35′ E) is located between the Loess Plateau in northern Shaanxi and the Qinling Mountains, which is the abbreviation of the Guanzhong Plain in Shaanxi, as illustrated in Figure 1a. The total area of Guanzhong is about 55,000 km2. Its east–west length is 420 km and the north-south width, which is famous for the phrase “eight hundred miles of Qinchuan”, is 120 km, and it has a warm, temperate, monsoon climate [12]. In our study, the Caijia settlement was selected as the case study. It belongs to Weihe Plain Aggregate in Guanzhong plain, as illustrated in Figure 1b.

2.2. Data

The ENVI-met model (v4.4.5 summer20), which is a non-commercial numerical simulation software developed by German scholars, was used to investigate the outdoor thermal environment in 2003, 2013, and 2018 [35]. It is an integrated, three-dimensional, non-hydrostatic model for simulating air–plant interaction on the ground, with a horizontal resolution of 0.5 to 10 m, a typical time of 24 to 48 h, and time step of 1 to 5 s. More specifically, the main function of ENVI-met is to simulate the numerical distribution of the microclimate and explore the impact of various factors on the thermal environment [11,36,37].

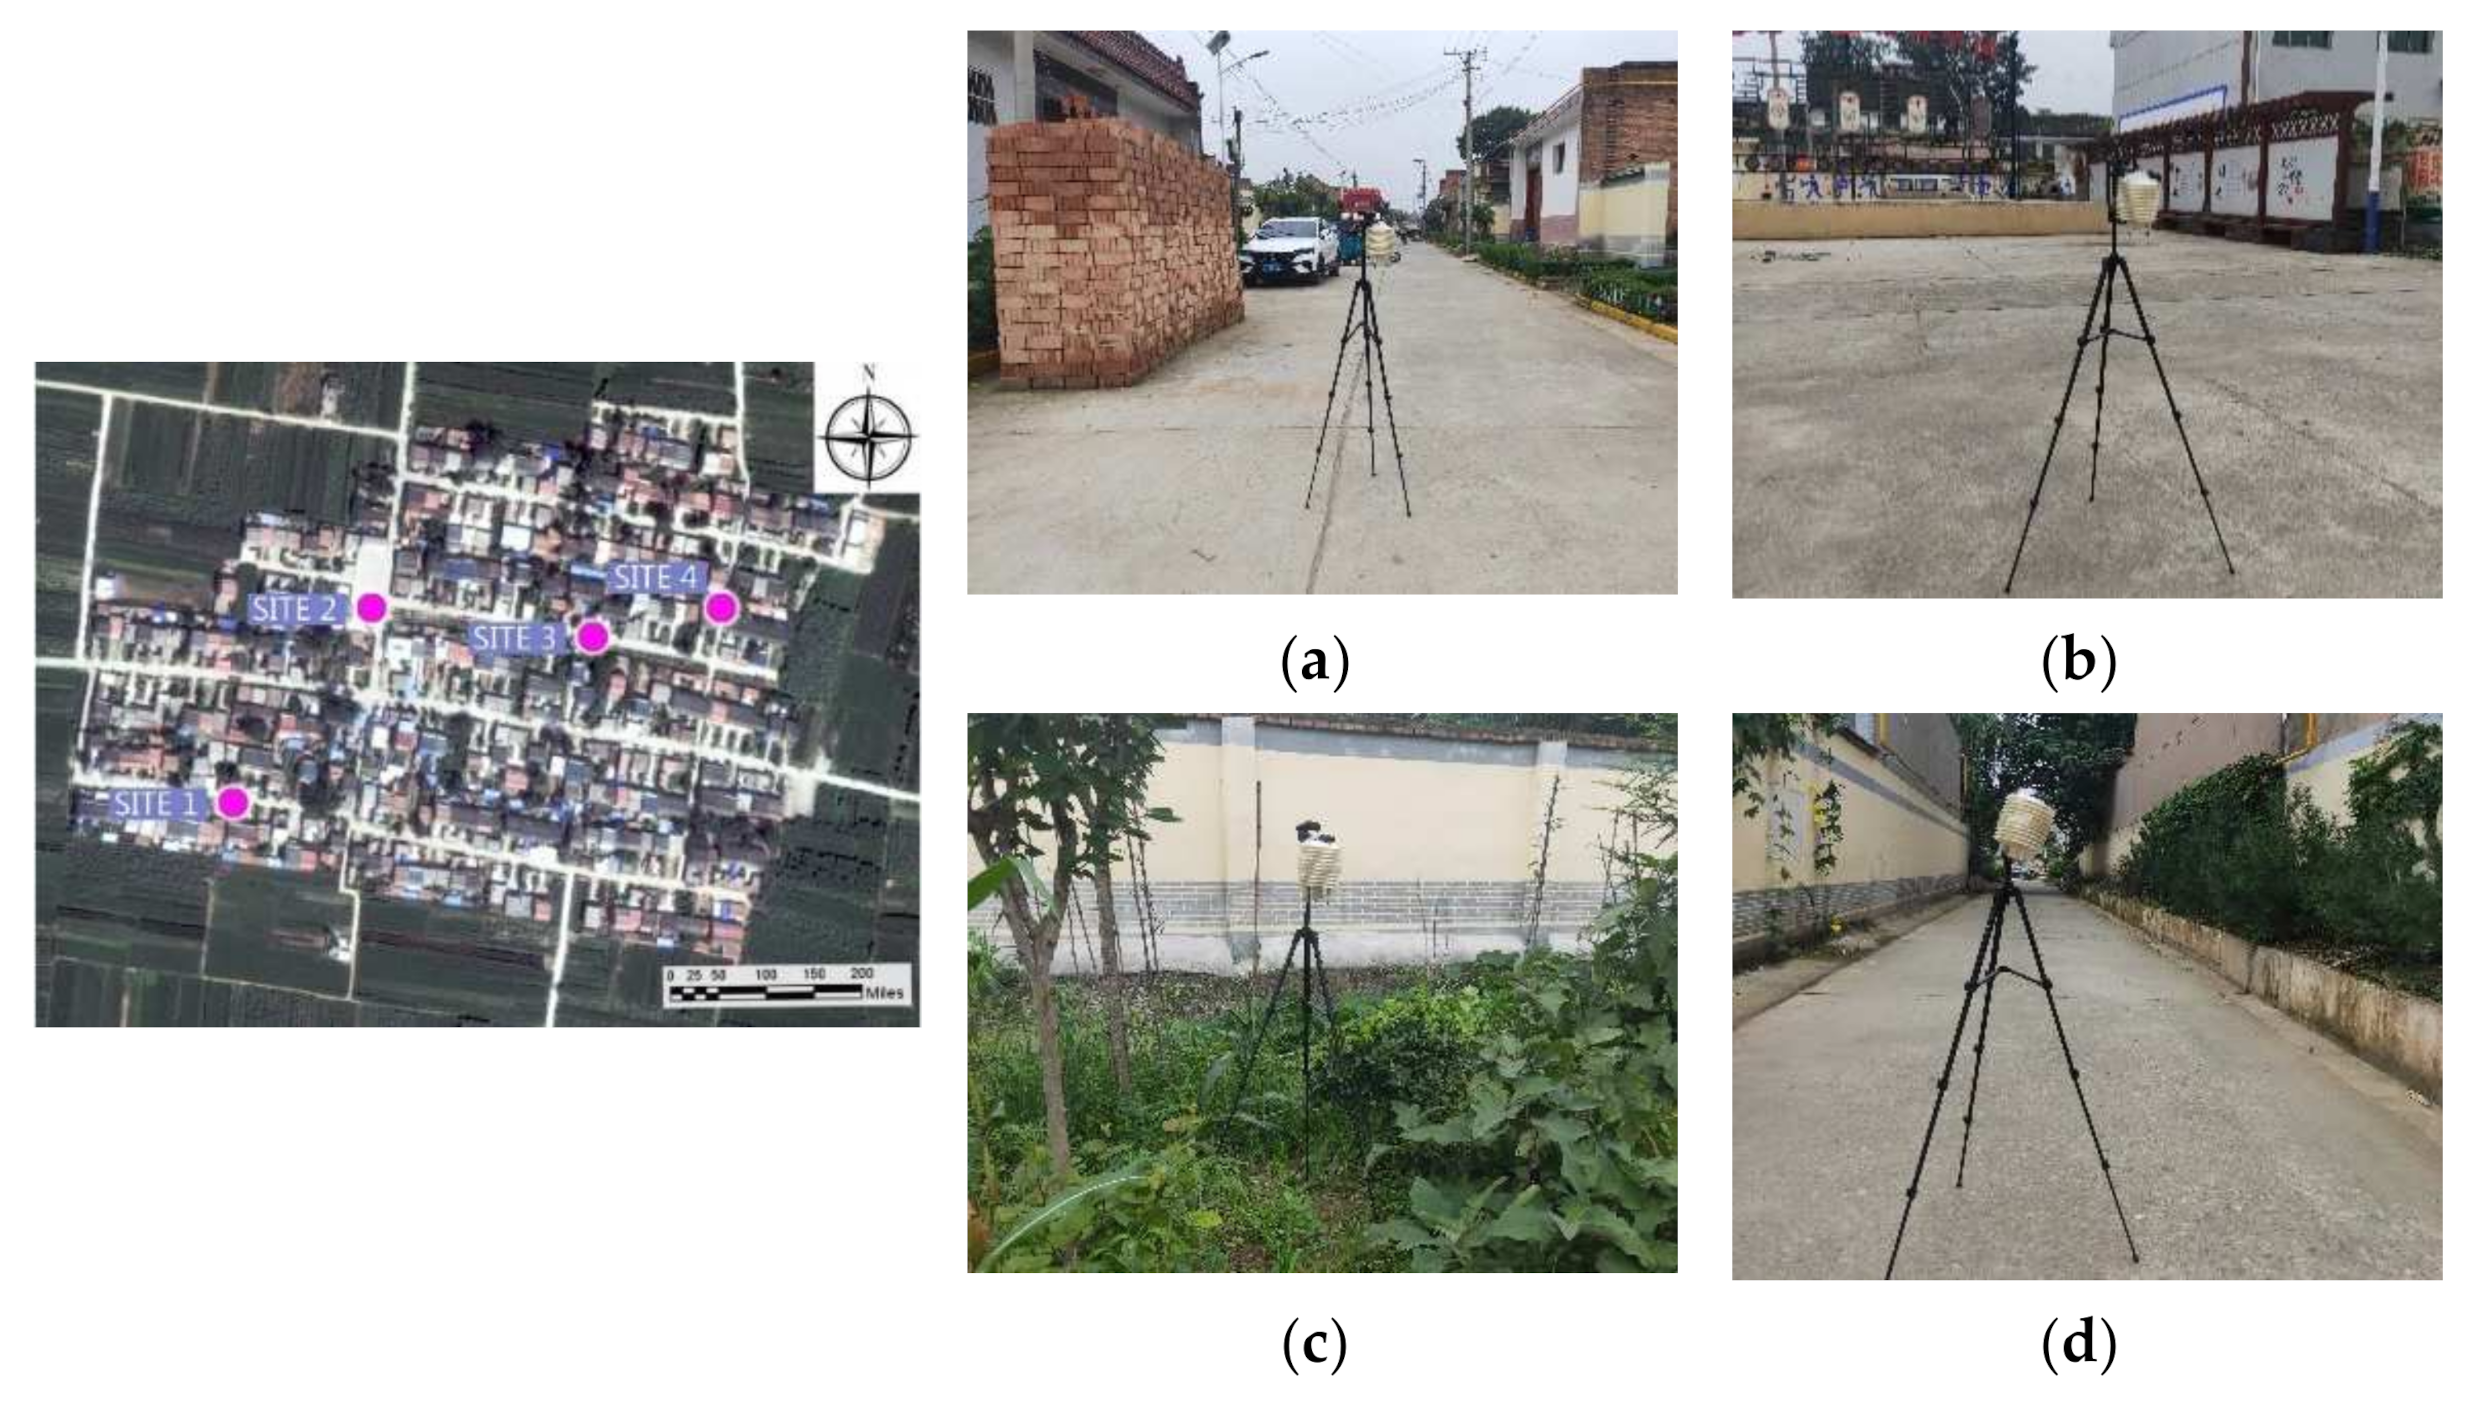
2.2.1. Field Measurements

Four sites were selected as the representatives of the rural outdoor space for field measurements, as shown in Figure 2. More specifically, site 1 represents the east–west road (Figure 1), site 2 is the event plaza space (Figure 2), site 3 is bare ground (Figure 3), and site 4 is the north–south road (Figure 4). On-site measurements were performed during 13–17 July 2019, which is the hottest period of the year. The data from 14 July with the most stable weather conditions were selected for this study. Air temperature (Ta), relative humidity (RH), and wind speed (Va) were recorded and automatically stored with an interval of one minute. Four total HOBO (the name of small weather station recorder; model:MX2301A; precision: ±2 °C, ±2.5% RH) meteorological stations were used, with one station in each of the four measurement sites. In addition, the on-site measurements were simultaneously performed at the pedestrian level of 1.5 m by the mobile micrometeorological stations of the HOBOs.

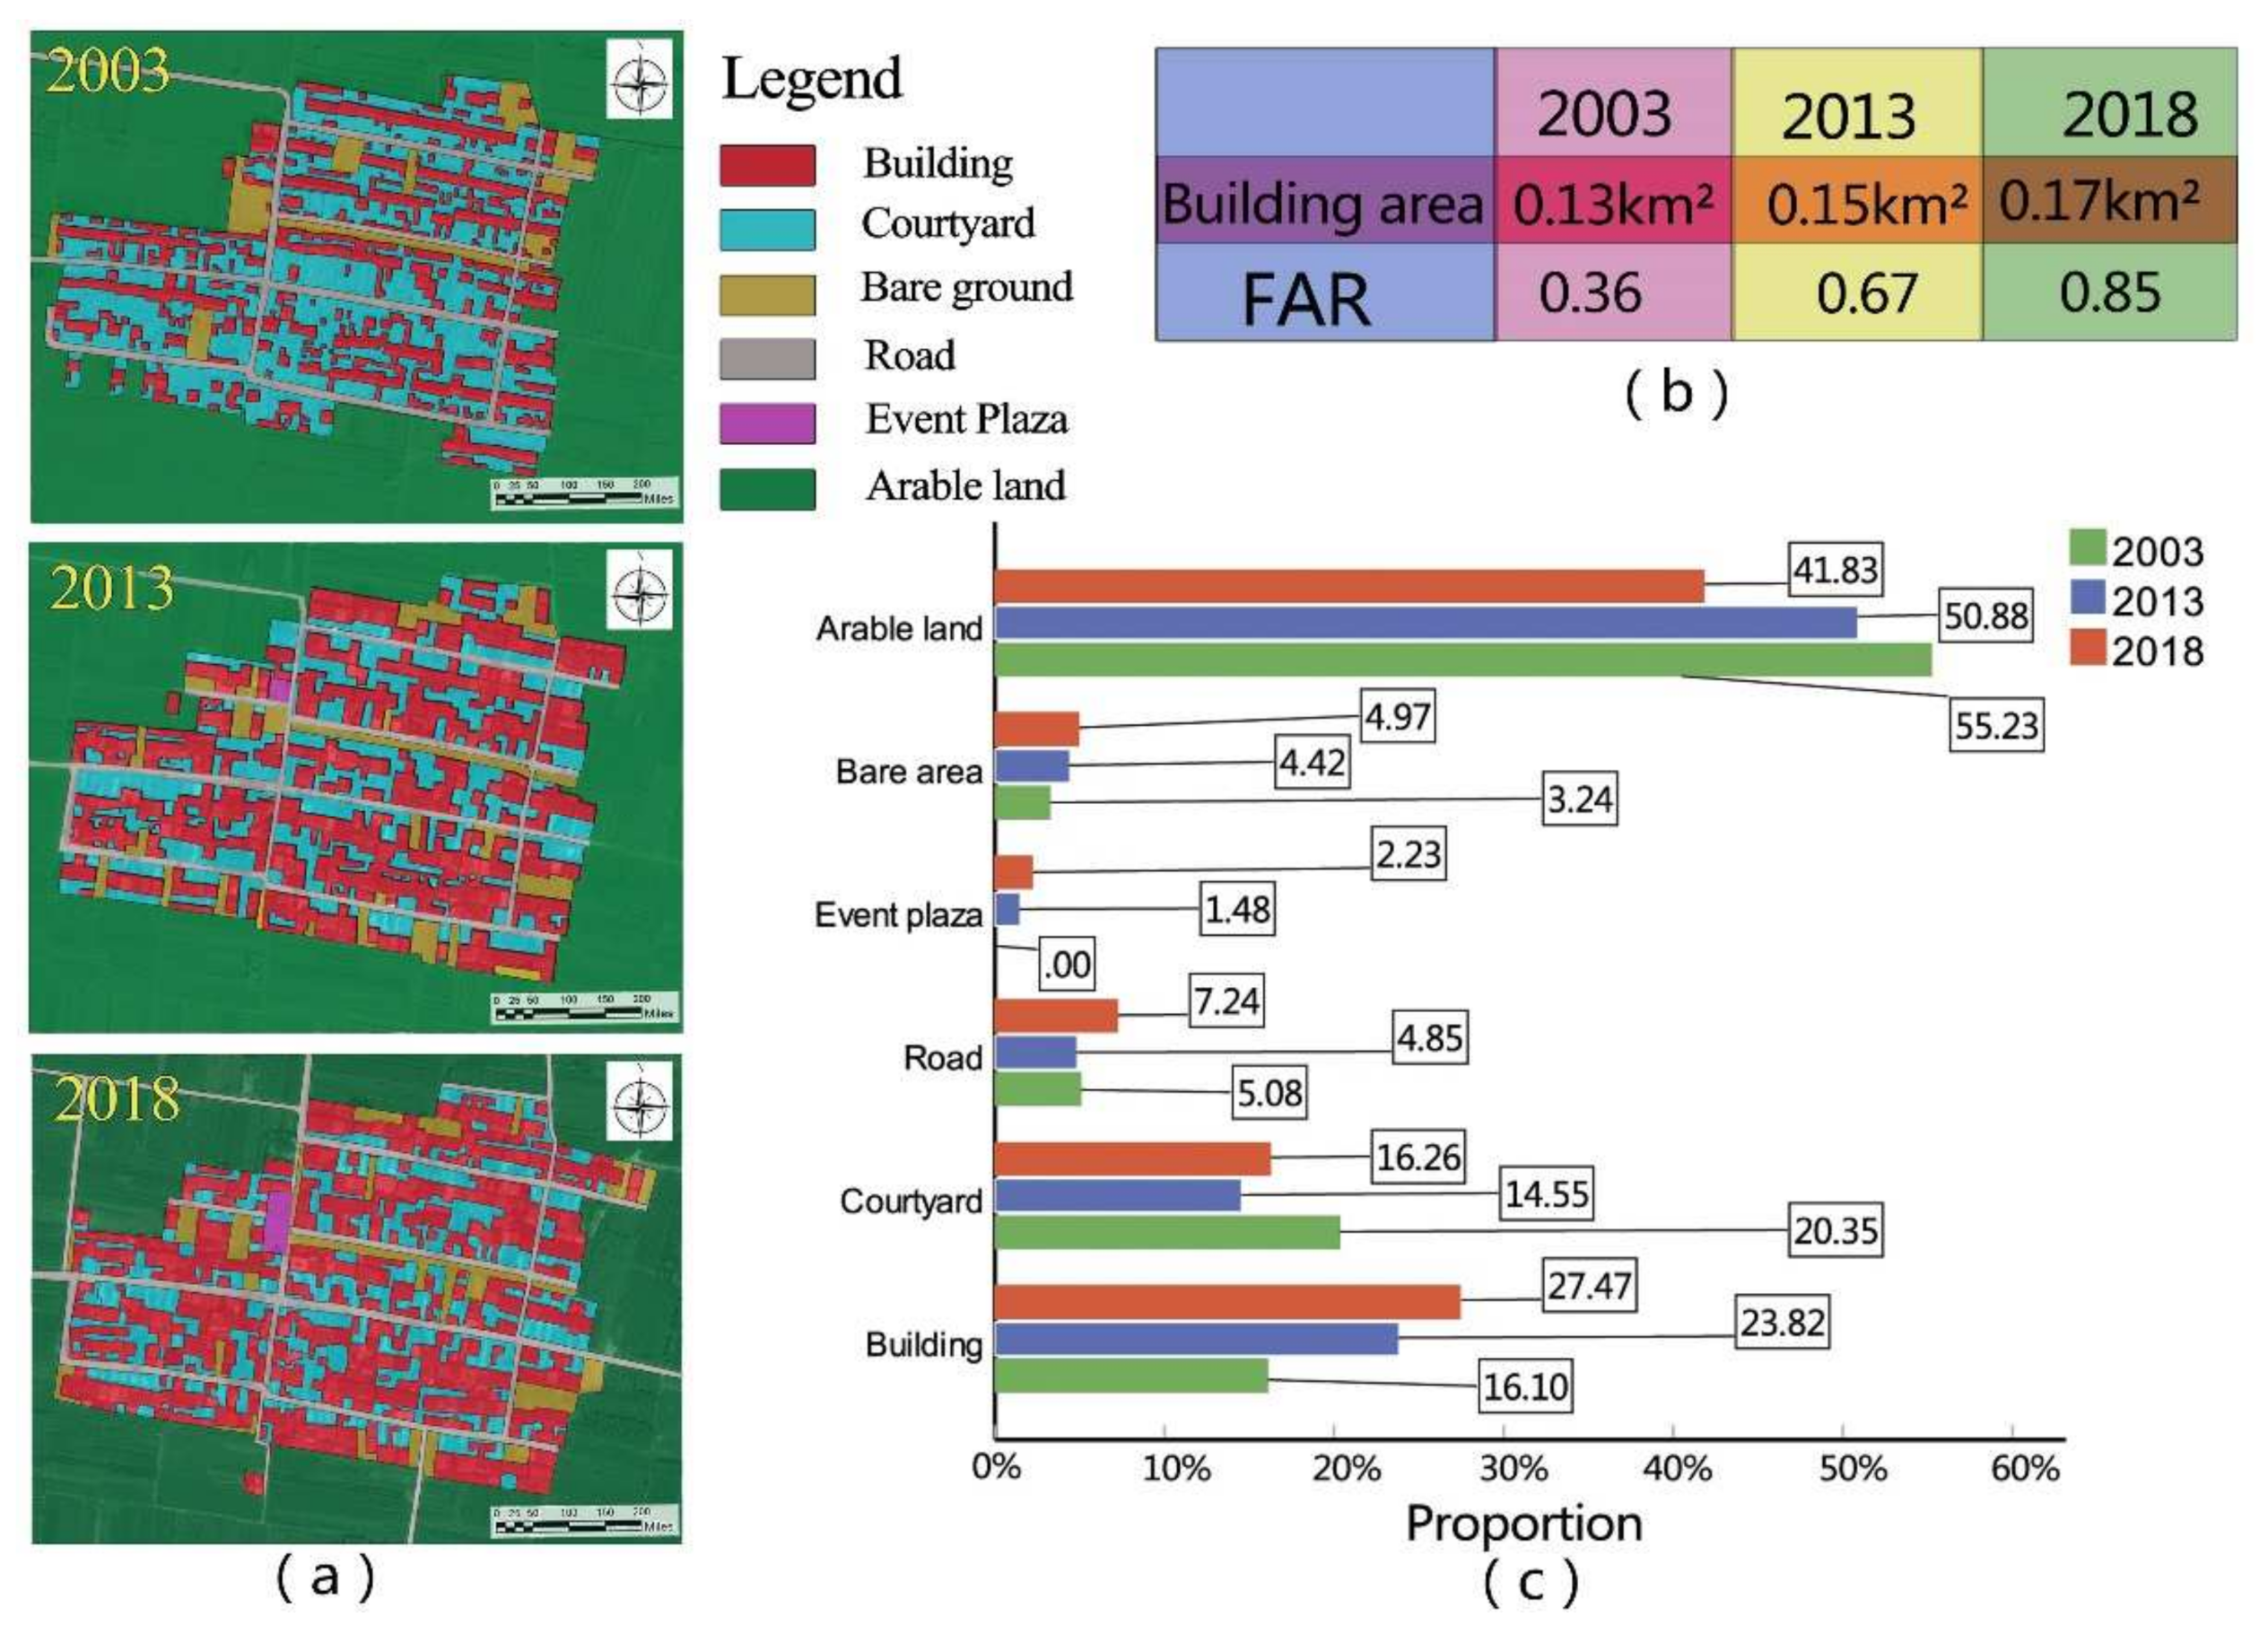
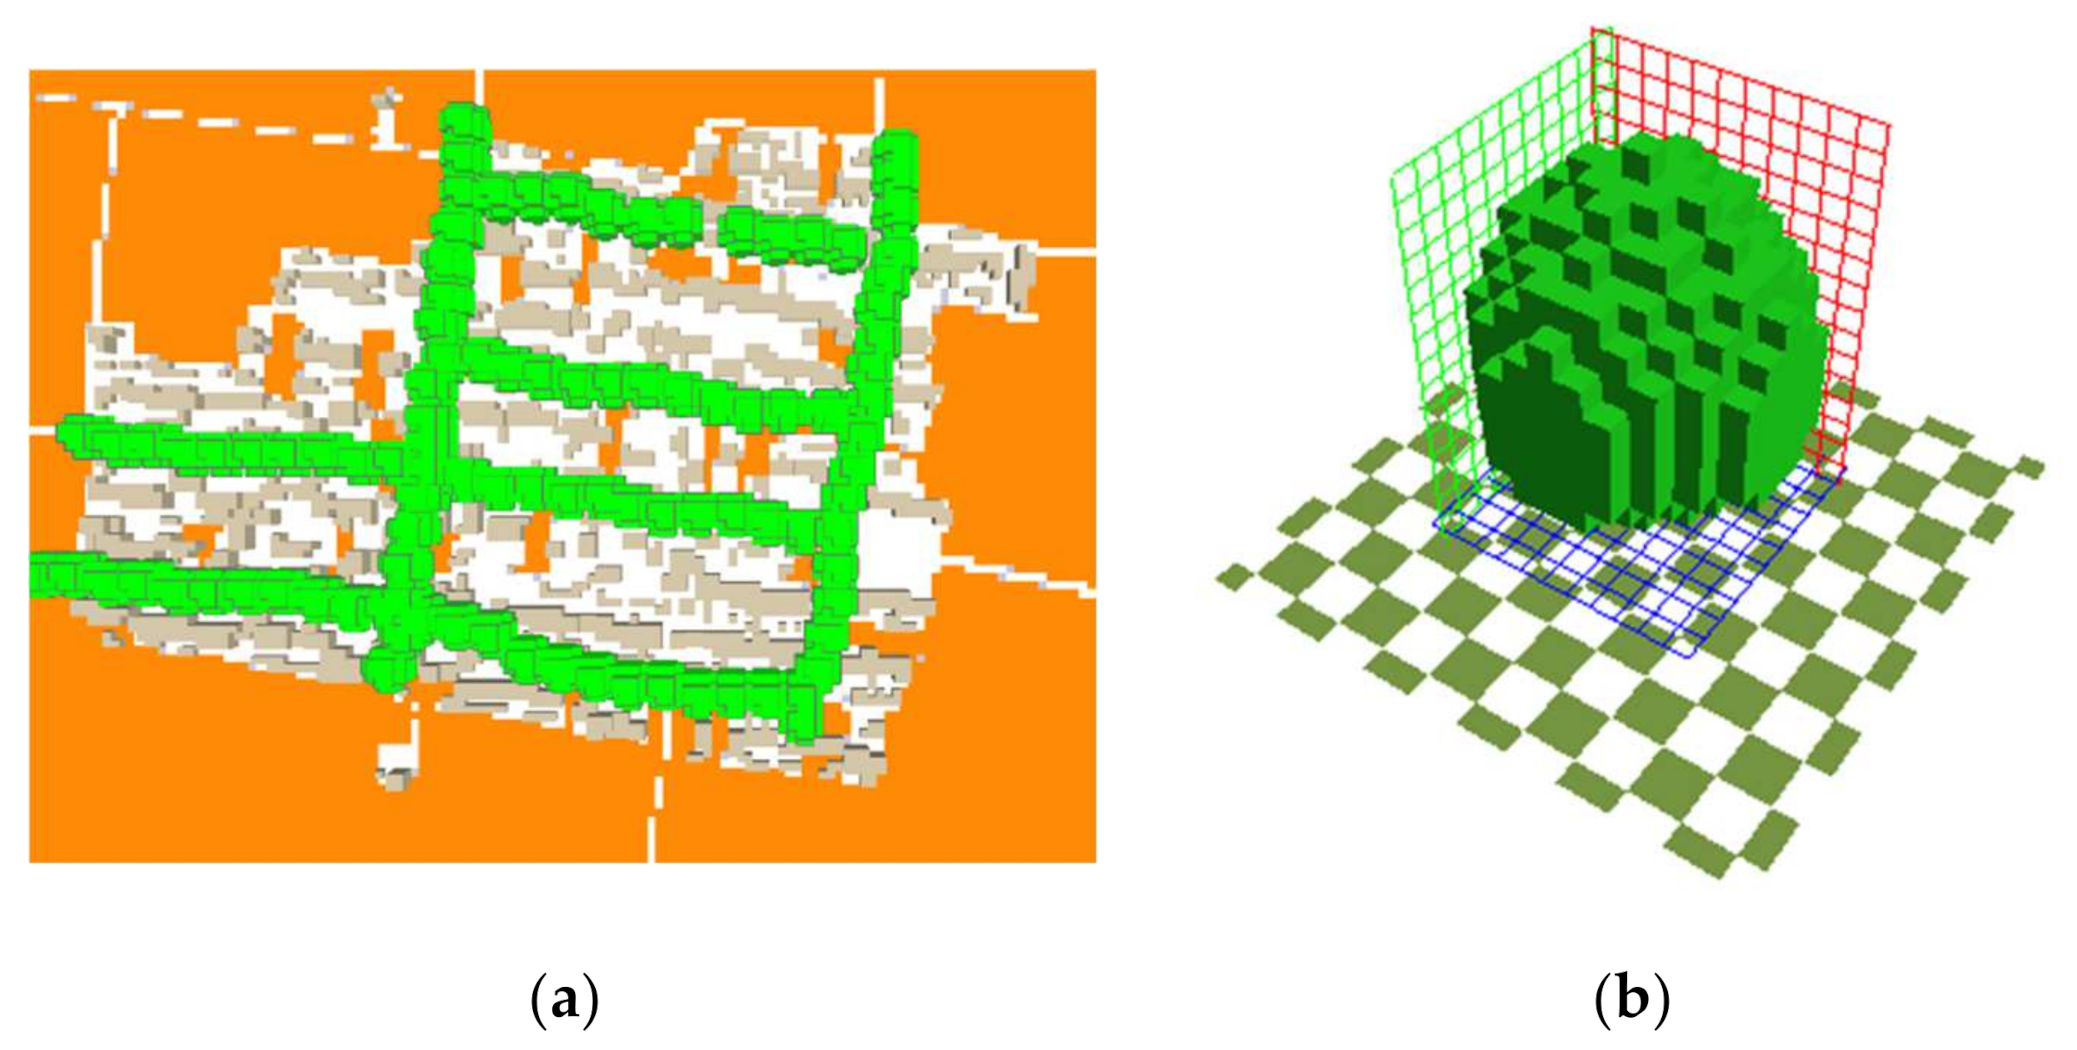
2.2.2. Building Model Set-Up

As shown in Figure 3, which is the land use map of the study area from 2003 to 2018, we can see that the land use of the village has obviously transformed. In particular, the building area has increased from 0.13 km2 in 2003 to 0.17 km2 in 2018; more specifically, the proportion of building area has increased from 16.1% in 2003 to 27.47% in 2018 at a rate of 11.37%. It is worth noting that the buildings in 2003 were basically single-storey structures, and by 2018, most of them were two-storeys; therefore, we also calculated the floor area ratios (FARs) within the construction area of the village to be 0.36 in 2003, 0.67 in 2013, and 0.85 in 2018.
Figure 3. Land use information of the study area. (a) The land use maps of the study area in 2003, 2013, and 2018. (b) The building area and the floor area ratios (FARs). (c) The proportion of different underlying surfaces.
Buildings 12 00345 g003
The term courtyard refers to the rest of the land within a homestead, except for the buildings. Although courtyards covered the largest area in 2003, courtyards in 2003 were mainly composed of soil and sand. After 2013, most courtyards were paved with concrete. The main structure of the road has not changed significantly, having an increase of 2.16%, but the road in 2003 mainly consisted of soil, and after 2013 it had been transformed into a concrete road. Bare ground, which refers to the undeveloped land in the village, is mainly composed of soil and weeds, and it increased from 3.24 (FAR) in 2003 to 4.97 (FAR) in 2018. The function of arable land is to provide crops for residents. With the continuous expansion of the village construction area, a small amount of arable land was developed as residential land or other use. The event plaza is a leisure and entertainment place for residents, and while there was no square in 2003, until 2013 the event plaza only accounted for 1.48% of the study area, and it increased to 2.23% in 2018. Generally speaking, from 2003 to 2018, the proportion of village buildings, roads, event plaza, and bare ground showed an increasing trend, while the proportion of arable land and courtyards decreased. This is mainly due to the fact that urbanization drives economic levels and improves living conditions, and residents meet their living needs through increasing residential land area.
Using the land use maps of 2003, 2013 and 2018, three-dimensional building models were established. The model domain consists of a 296,100 m2 (630 m × 470 m) area characterized by densely placed, low-rise buildings and several side passages, including buildings, courtyards, bare ground, roads, an event plaza, and arable land. The parameters of each land material are from the databases of ENVI-met. The study area was fitted into the simulation domain, which horizontally consisted of 210 × 160 square grids with 3 m resolution. This study used 10 vertical grids with a resolution of 2 m, and 10 nest grids were added to move the boundary away from the model core and minimize boundary effects to ensure the stability of the simulation. We did not need to consider the difference between the 2018 image data obtained from Google Historical Maps and the actual situation in 2019, as the study area did not change significantly between 2018 and 2019.

2.2.3. Ideal Model

In order to explore the thermal effect mechanism of trees on the village settlement, a new, ideal three-dimensional model that included Platanus trees was established based on the 2018 model, as shown in Figure 4a. The average distance between each household in the village settlement is about 15 m, according to field survey. Thus, the Platanus per 15 m was used to set up the ideal model to ensure one tree for each house, which is beneficial to ensure the future maintenance of the Platanus trees. Platanus trees have a strong ability to adapt to soil and resist pests. Further, they can absorb smoke, dust, sulfur dioxide, and other toxic gases, and effectively isolate noise. In addition, Platanus trees have a tall trunk and large leaf area, which can improve the air temperature of the surrounding environment by blocking solar radiation. Most importantly, the Platanus is native to the Guanzhong plain.
Figure 4. The three-dimensional model with street trees. (a) Platanus trees with a distance of 15 m. (b) A model of Platanus trees.
Buildings 12 00345 g004
Different plant morphologies were described using leaf area densities (LAD) as input parameters in the ENVI-met model, which is defined as the sum of plant leaf area per unit volume (m2/m3) [38]. During current research, the three-dimensional model was used to mesh the trees and assign the LAD value to each of these grids. Table 1 illustrates the parameters of the Platanus trees. The LAD values come from the ENVI-met database, which has performed multiple runs with different LAD values to estimate the correct LAD value, and has been verified by many previous studies [31,36].

2.2.4. Meteorological Input Parameters

The meteorological data for hourly temperature, relative humidity, wind speed, and direction are required while simulating. The average hourly data for temperature and relative humidity observed at the four measurement sites were used as input meteorological data. Wind speed data at 10 m above ground, the most frequent diurnal wind direction, cloud cover, and relative humidity at a 2 m height were acquired from the government weather station, which is located 3 km east of the study area in Zhouzhi. In addition, incoming solar radiation was calculated by ENVI-met based on latitude/longitude, date, time, and cloud cover. The same input meteorological conditions were used for these four models for accuracy analysis of the thermal effect mechanism, while the calculations are as illustrated in Table 2.

2.3. Outdoor Thermal Comfort

Nowadays, there are many thermal comfort indices used to evaluate the outdoor environment based on human energy balance and the ambient environment, such as the PMV (predicted mean vote) [39], SET* (standard effective temperature) [40], and PET (physiological equivalent temperature) [41] indices. PET was adopted for this paper as it has been evaluated primarily for outdoor thermal comfort, and it is derived from the Munich Energy Balance Model for Individuals (MEMI) [42].
The mean radiant temperature (Tmrt) was the first step to calculate outdoor thermal comfort, which is a measure of the combined effects of surface temperatures in an area. The RayMan model was used to calculate Tmrt, which considers air temperature, radiation temperature, wind speed, humidity, conversion rate, keeping-warm clothing, height, weight, and age [43]. The calculation formula is as follows [44]:
T mrt = T g + 273.15 4 + 1.10 × 10 8 × V a 0.6 × T g T a ε D 0.4 1 4 273.15
where Tg is the global temperature, Ta is the air temperature, Va is the wind speed, D is the global diameter, and ε is the global emissivity. Apart from this, the relationship between PET, thermal sensation, and thermal comfort should be examined for different seasons and different spatial functions when applying PET in different areas to evaluate the outdoor thermal comforts. Table 3 illustrates the two PET classifications for the subtropical and temperate regions. The thermal ranges in the temperate region were lower than those of the subtropical region due to the lower humidity and higher tolerance to cold temperatures in that area [11]. In this paper, the thermal perception and grade of thermal stress for a temperate region were applied as the Guanzhong plain (33°35′–33°52′ N, 105°48′–110°35′ E) belongs to temperate region.

2.4. Data Analysis

RMSE (root mean square error) and MAPE (mean absolute percentage) were used for the verification and evaluation of both the measured and simulation data, which is an effective method to verify the deviation between measured values (Xobs,i) and simulation values (Xmodel,i) [48]. Generally, the smaller the value, the higher the accuracy. The model of RMSE and MAPE is as follows:
RMSE = i = 1 n X obs , i X mod el , i 2 n
MAPE = 1 n i = 1 n X obs , i X mod el , i X obs , i × 100 %
The entire observation time was divided into day (12:00) and night (23:00) to facilitate the comparison of different observation periods. Further, the east-west road (E–W road), north-south road (N–S road), and event plaza space (E-P space) represent the rural outdoor spaces used to evaluate the average rural environment, as these are the main activity spaces for residents. This study used SPSS (statistics 22.0) for data analysis.

3. Results of the Case Study

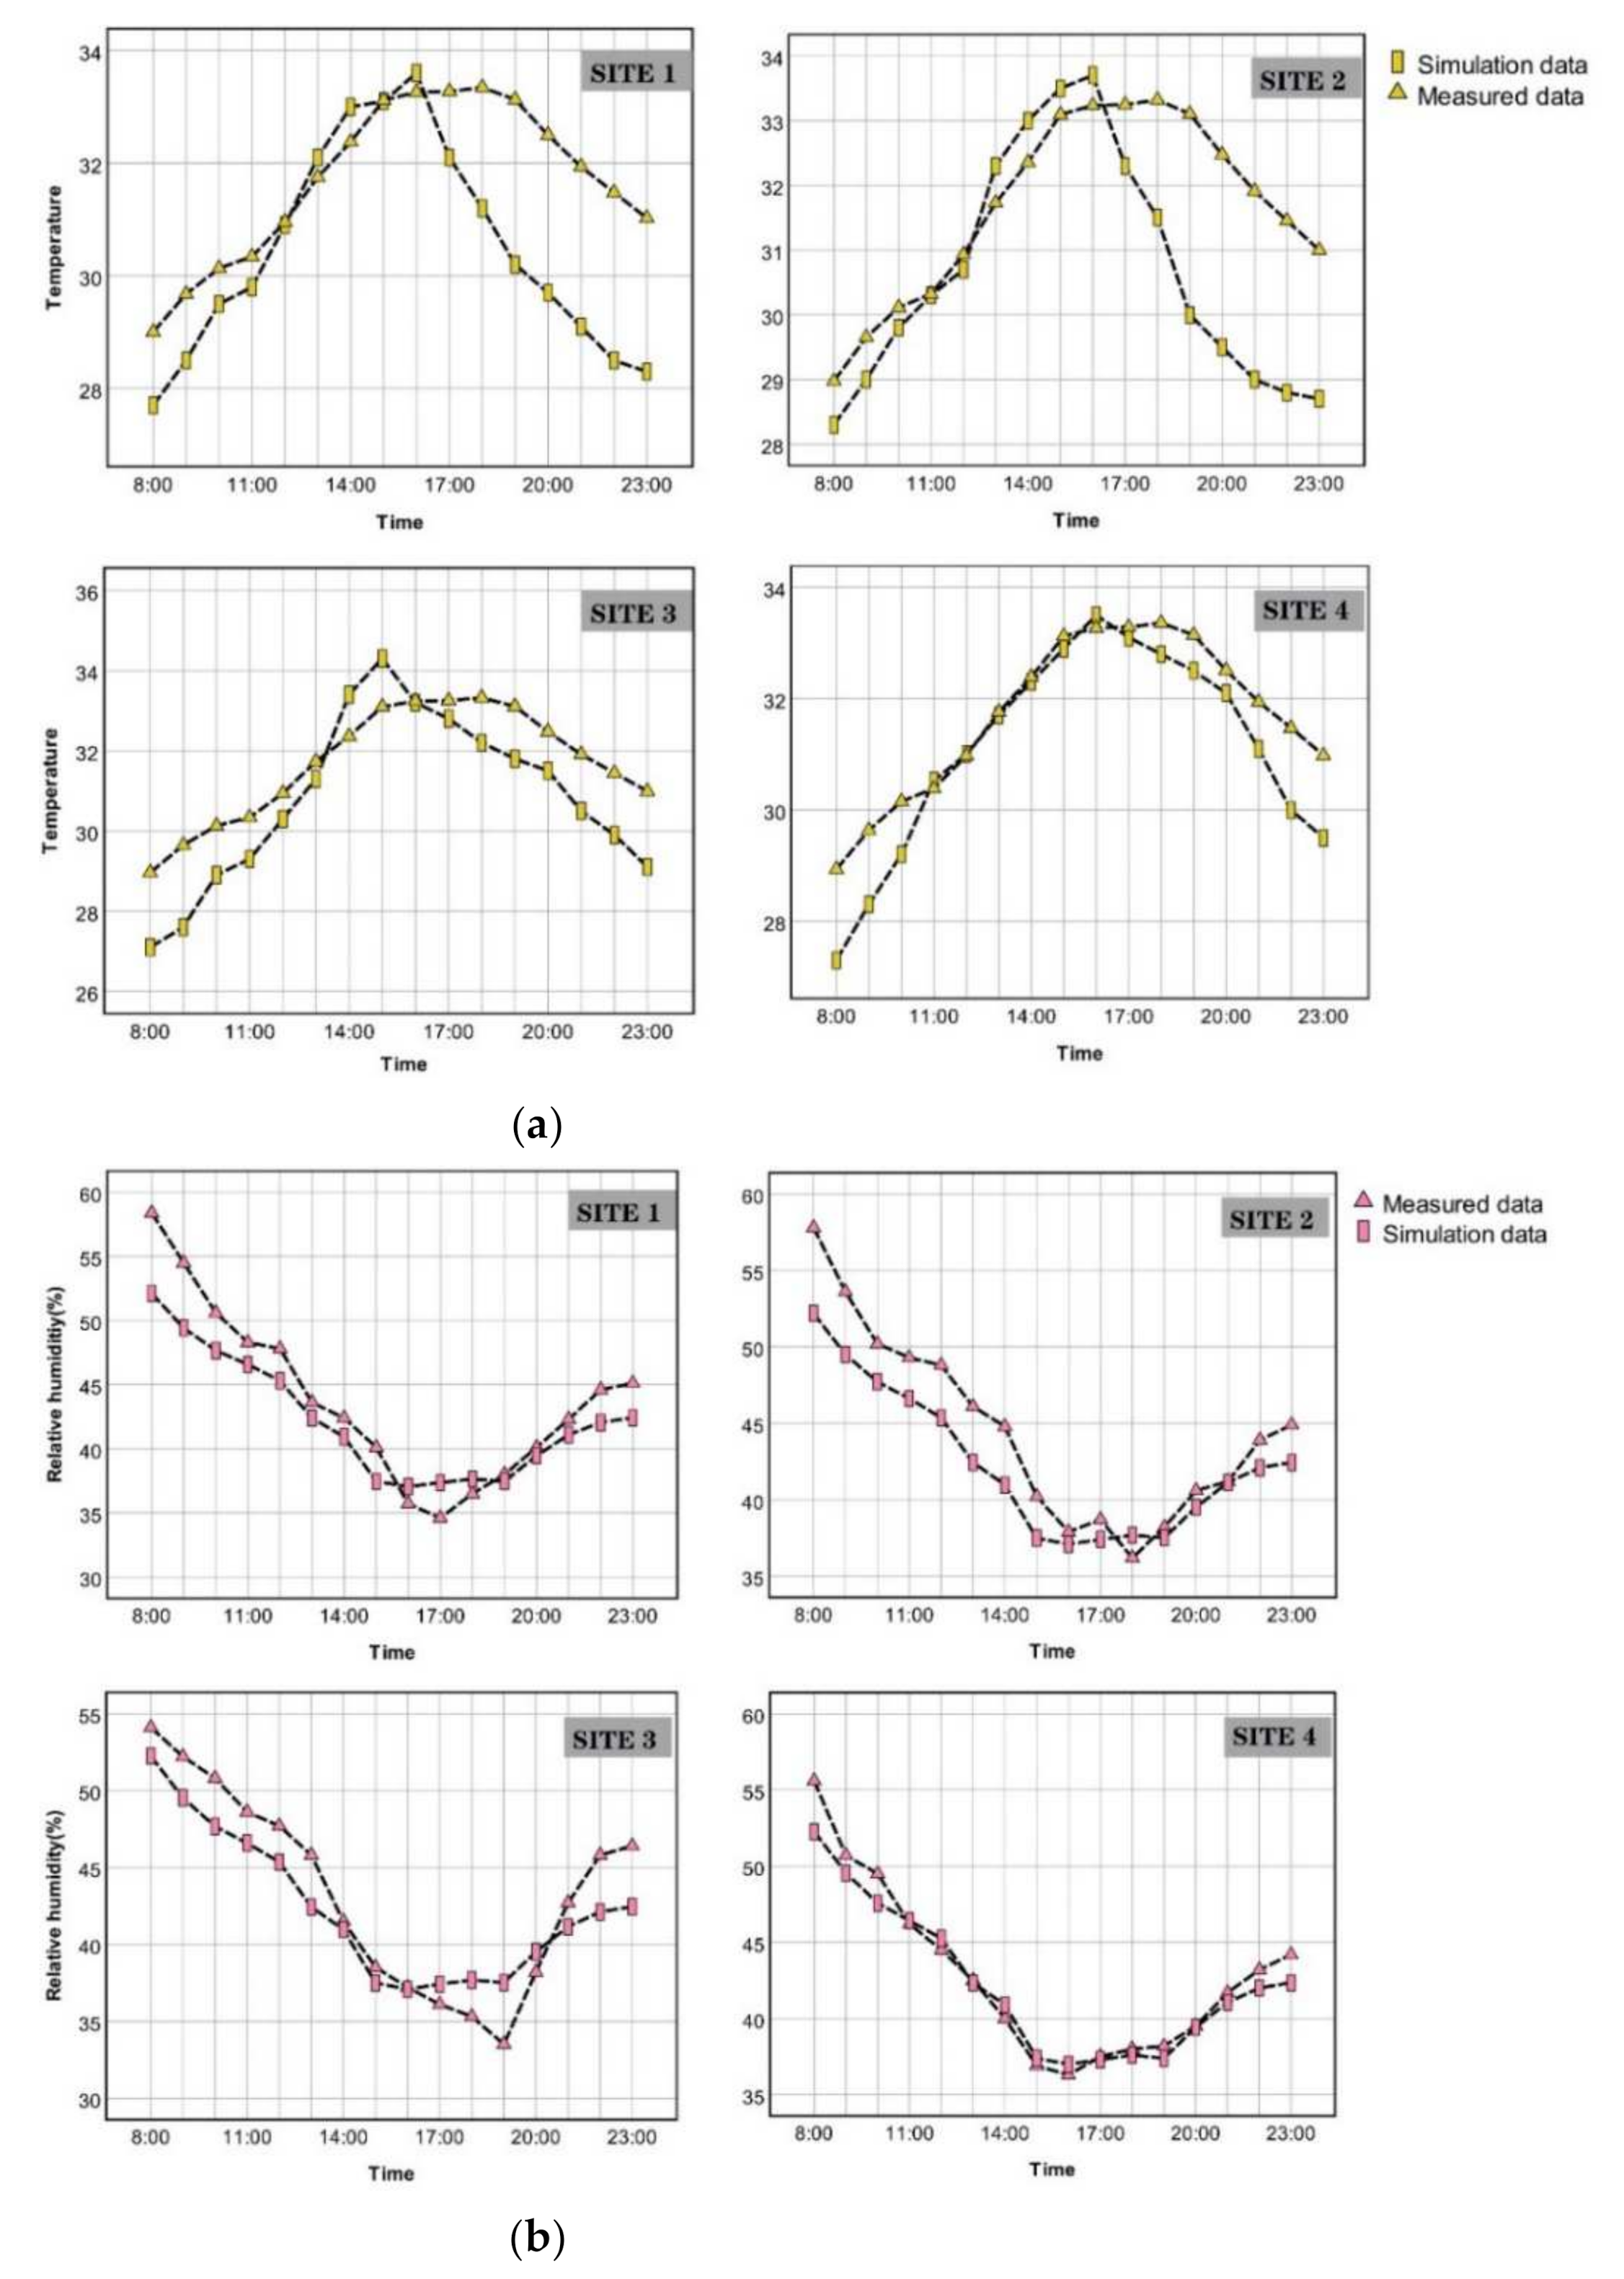
3.1. ENVI-Met Model Evaluation

It can be clearly seen that the measured and simulated temperatures and relative humidity of the four monitored sites have a strong trend toward consistency, as illustrated in Figure 5. However, the air temperature of the simulation was relatively lower than that of the observation after 14:00, possibly due to the ENVI-met model’s inability to consider the contingencies of environmental impacts, such as the heat wave emitted by air-conditioners that will increase the outdoor air temperature, especially in the afternoon.
Table 4 shows the values of root mean square error (RMSE) and mean absolute error (MAPE). It can be clearly seen that the RMSE of the air temperature between the simulation data and the measured data is from 0.85 to 1.79, and the relative humidity error is between 1.24 and 2.78. In terms of MAPE, both the air temperature and relative humidity are between 2.04% and 5.11%. In general, scholars recommend that the error values between the measured and the simulated values are all small, while the RMSE is not greater than 5, and not greater than 10% [49,50]; therefore, the prediction of microclimatic conditions can be considered to have a good precision. It is difficult to accurately record the wind field, as it is a characteristic that occasionally occurs and has instantaneous changes. Therefore, the relationship between wind and the simulated and measured data was not considered during current research, and it seemed to have little influence on the air temperature and relative humidity.

3.2. Results of the Case Study

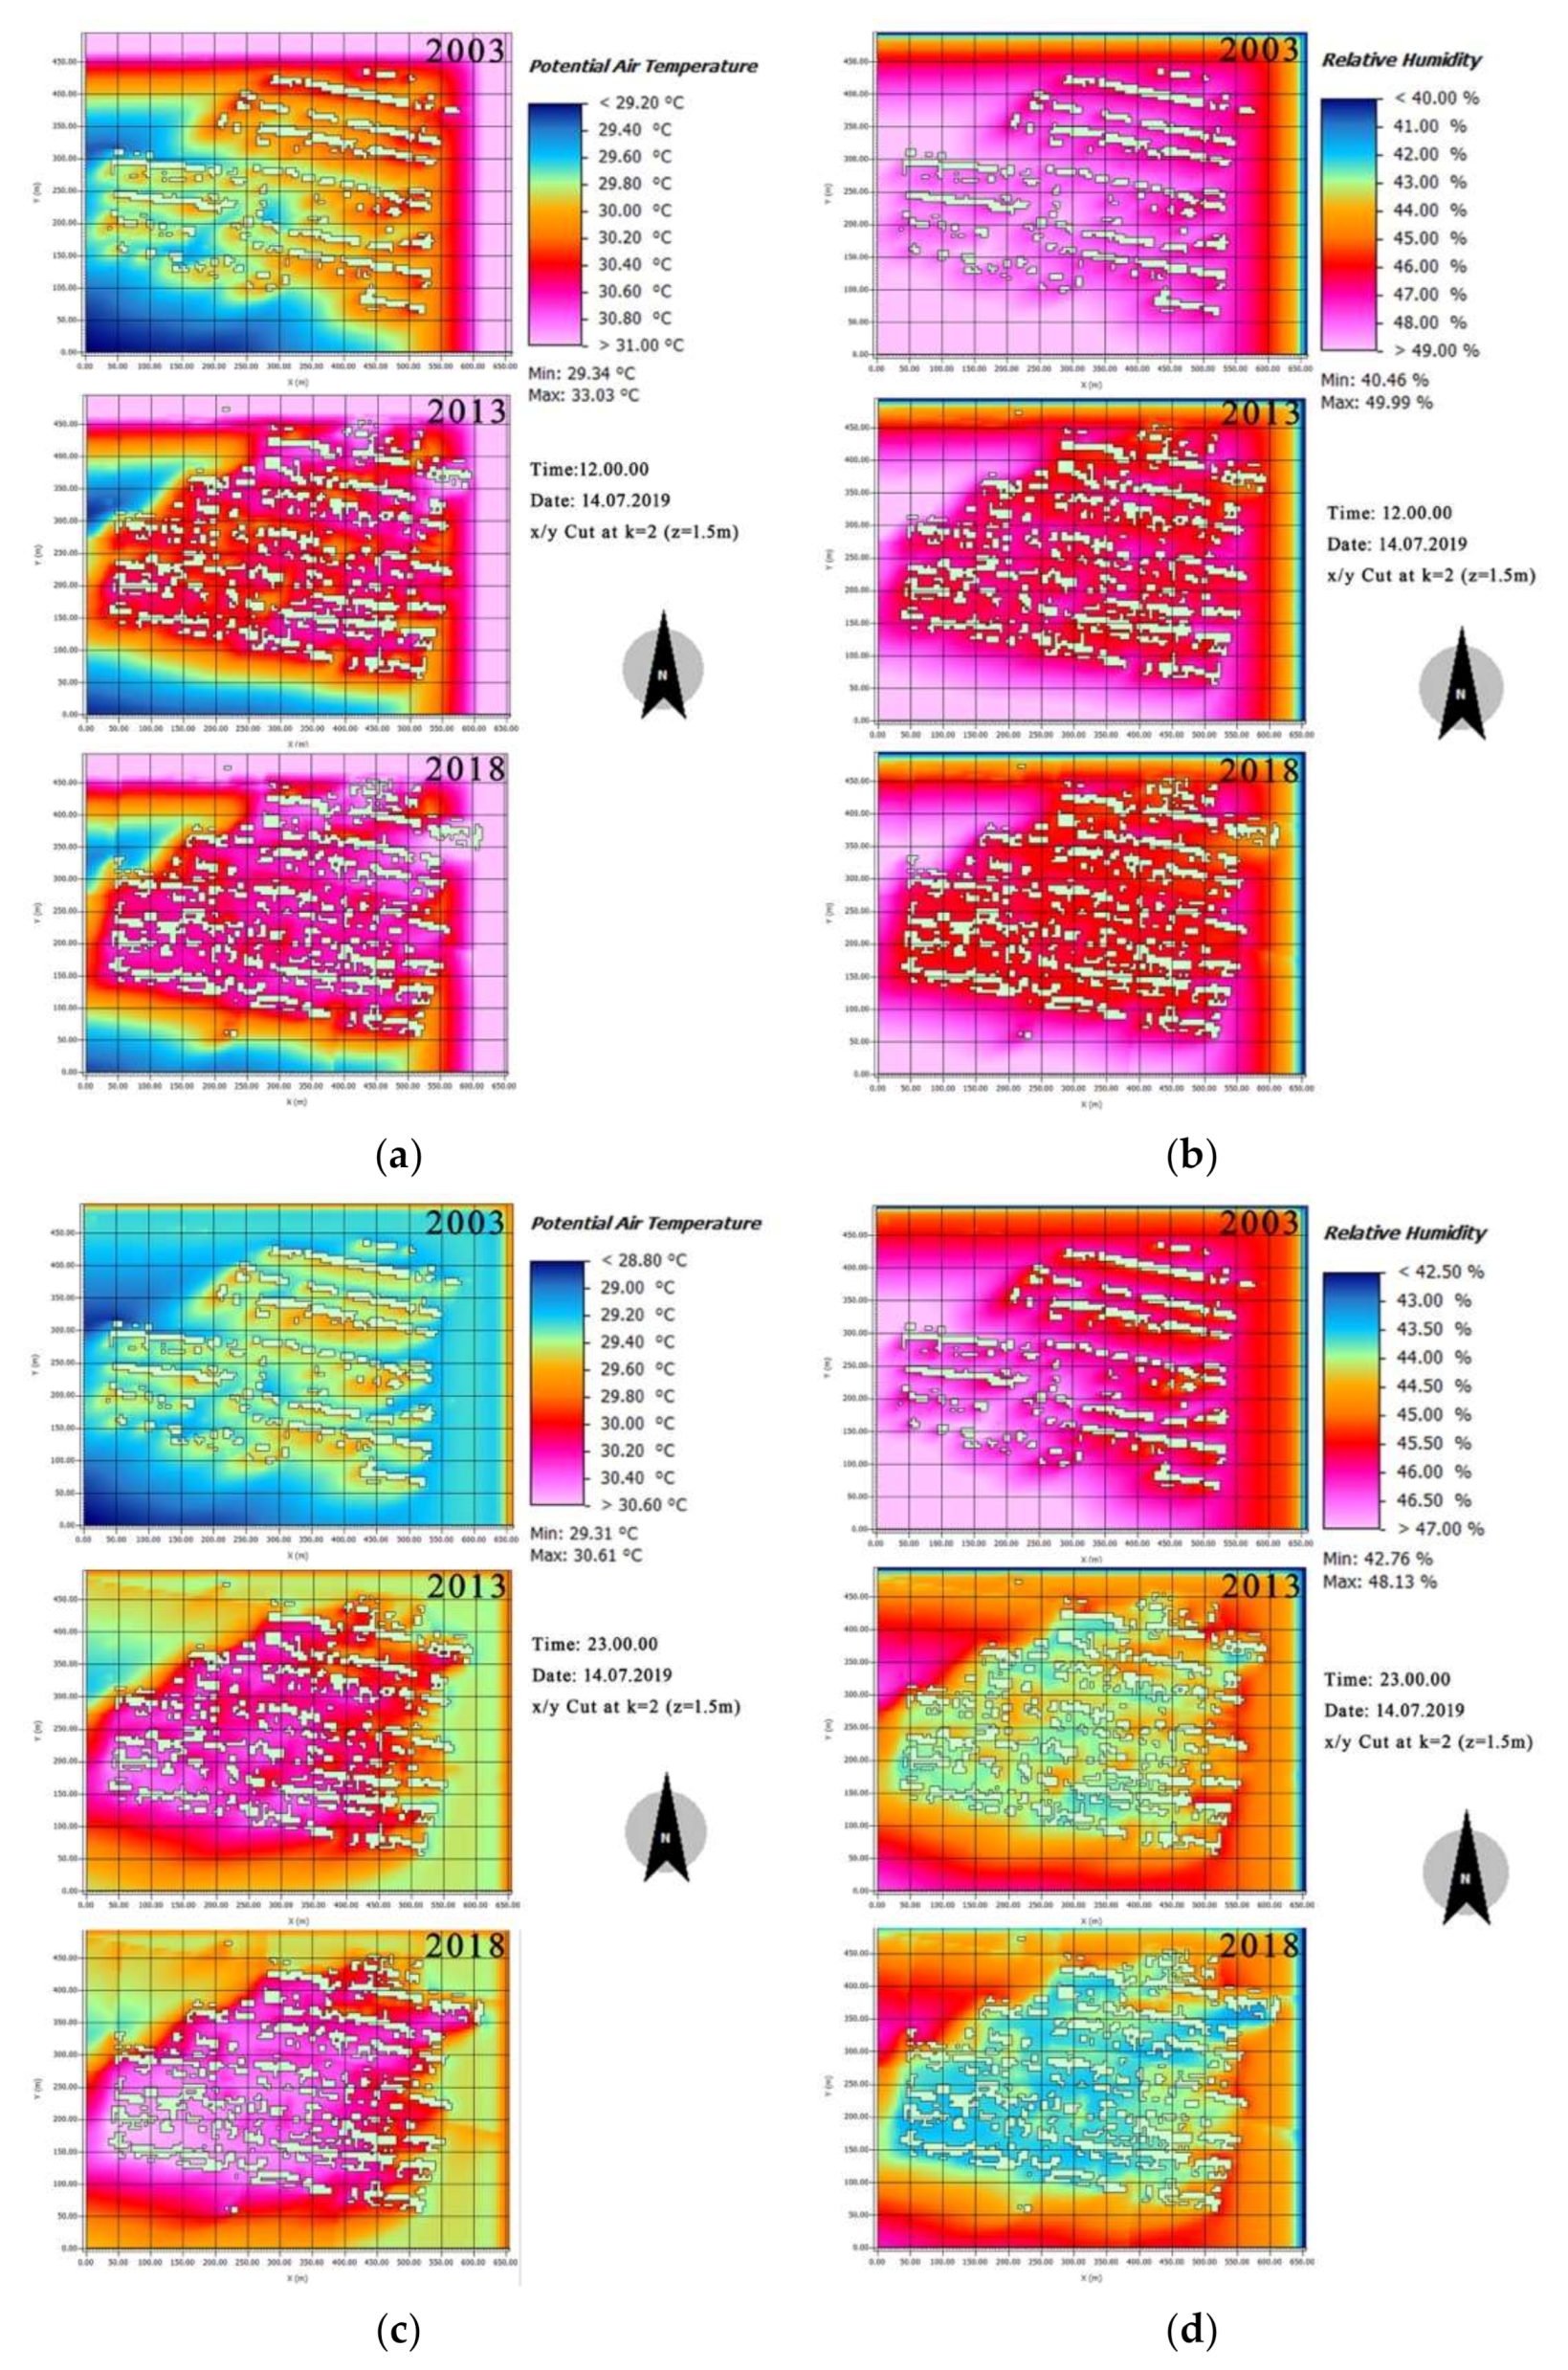
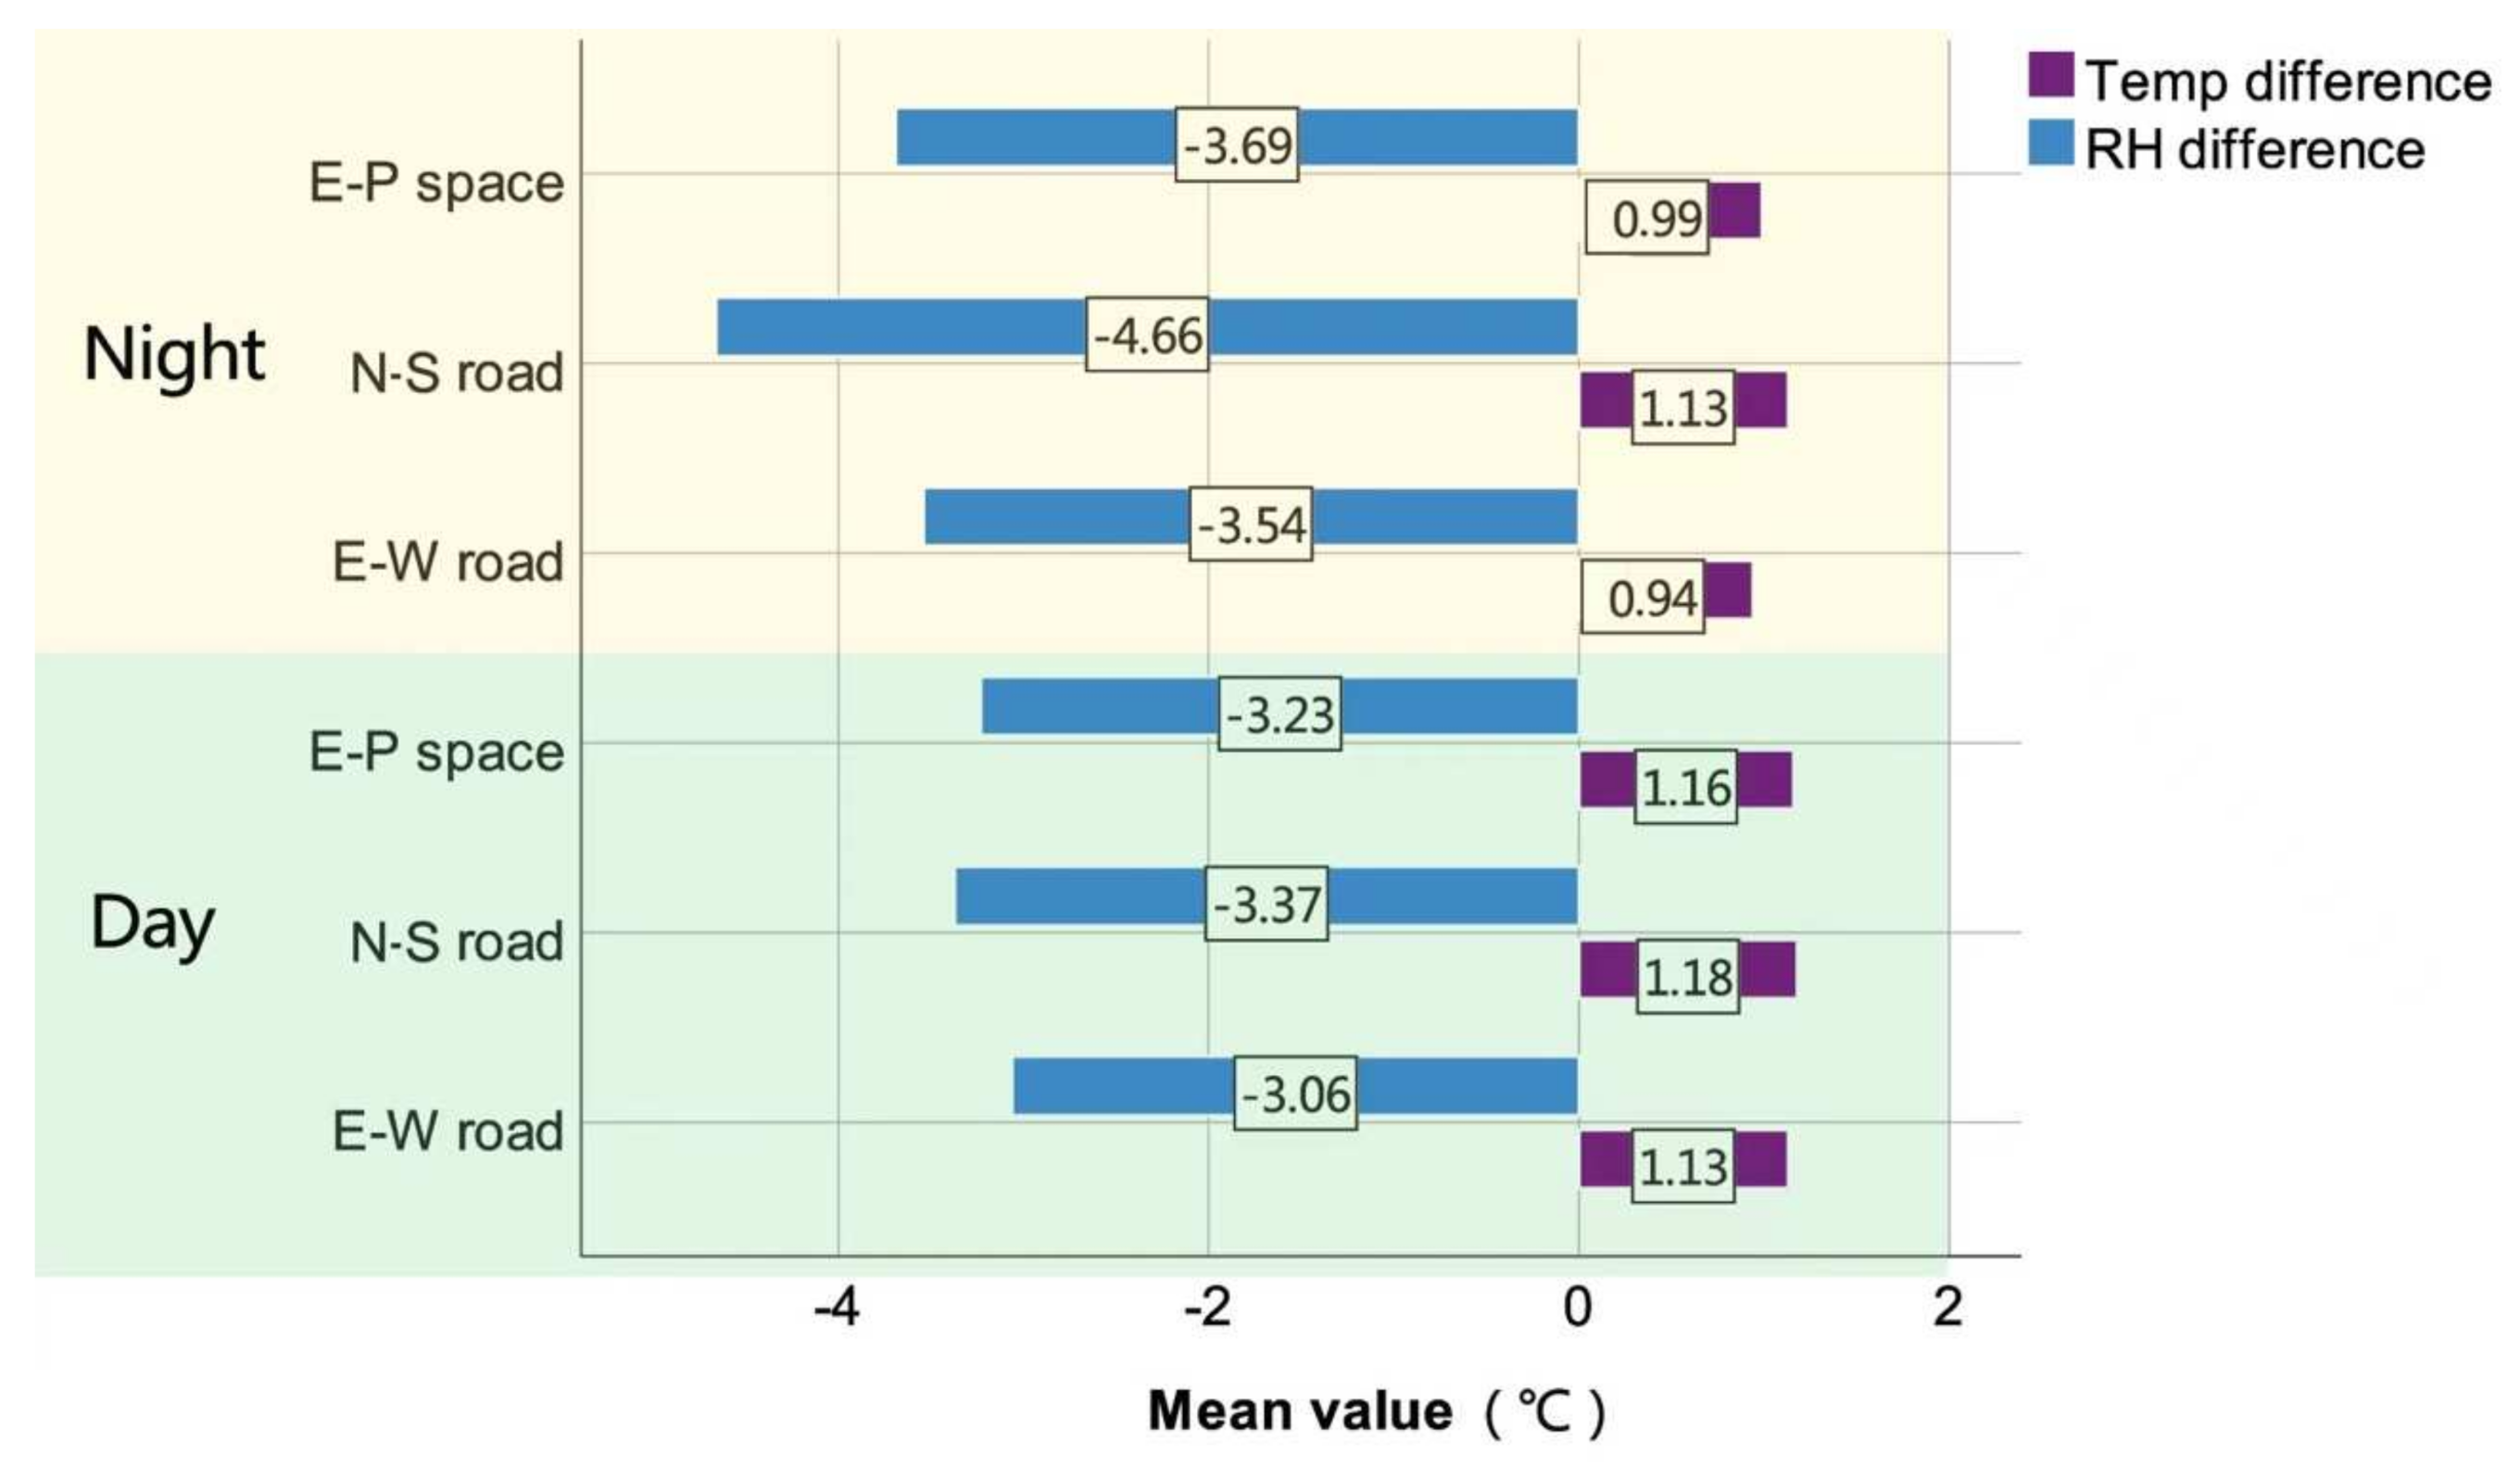
3.2.1. Air Temperature and Relative Humidity

Figure 6 illustrates the distribution map of AT and RH both at daytime and nighttime. It can be seen that the area of purple patches gradually increased from 2003 to 2018, as illustrated in Figure 6a,b, which are the AT distribution maps of both daytime and nighttime. Specifically, the AT of the settlement at daytime was 29.8–30 °C in 2003, 30.2–30.6 °C in 2013, and close to 30.8 °C in 2018. During the nighttime, the AT ranges in 2003, 2013, and 2018 were 29.2–29.6 °C, 29.8–30.4 °C, and 30.4–30.6 °C, respectively. In terms of RH, which is illustrated in Figure 6c,d, we can see that the purple plaque reduced during the daytime, while the light blue plaque gradually expanded at nighttime. This reveals that the changes of AT and RH in the rural settlement were obvious from 2003 to 2018, and mainly presents that the higher AT area and the lower RH zone gradually expanded.
To further explore the changes in the rural outdoor thermal environment from 2003–2018, the difference values of AT and RH in the E–W road, N–S road, and E-P space were calculated, as illustrated in Figure 7. It can be seen that the AT increased (difference value larger than 0), while RH decreased (lower than 0), also meaning that from 2003 to 2018, as the AT went up, RH went down. Furthermore, the difference values of AT and RH from 2003 to 2013 were higher than those between 2013 and 2018, which may be caused by the changes of the interior of the rural settlement. It is noteworthy that the difference values of AT and RH of the E-W road were significant during the daytime, with 0.79 °C and 2.01%, respectively; however, at night, the E-P space is obvious, with 1.04 °C AT and 2.38% RH. Further, the difference at night is more obvious than that of the day. As determined by calculations, mean AT increased by 0.91 °C (3.08%) and average RH decreased by 2.07% (4.42%) from 2003 to 2018.

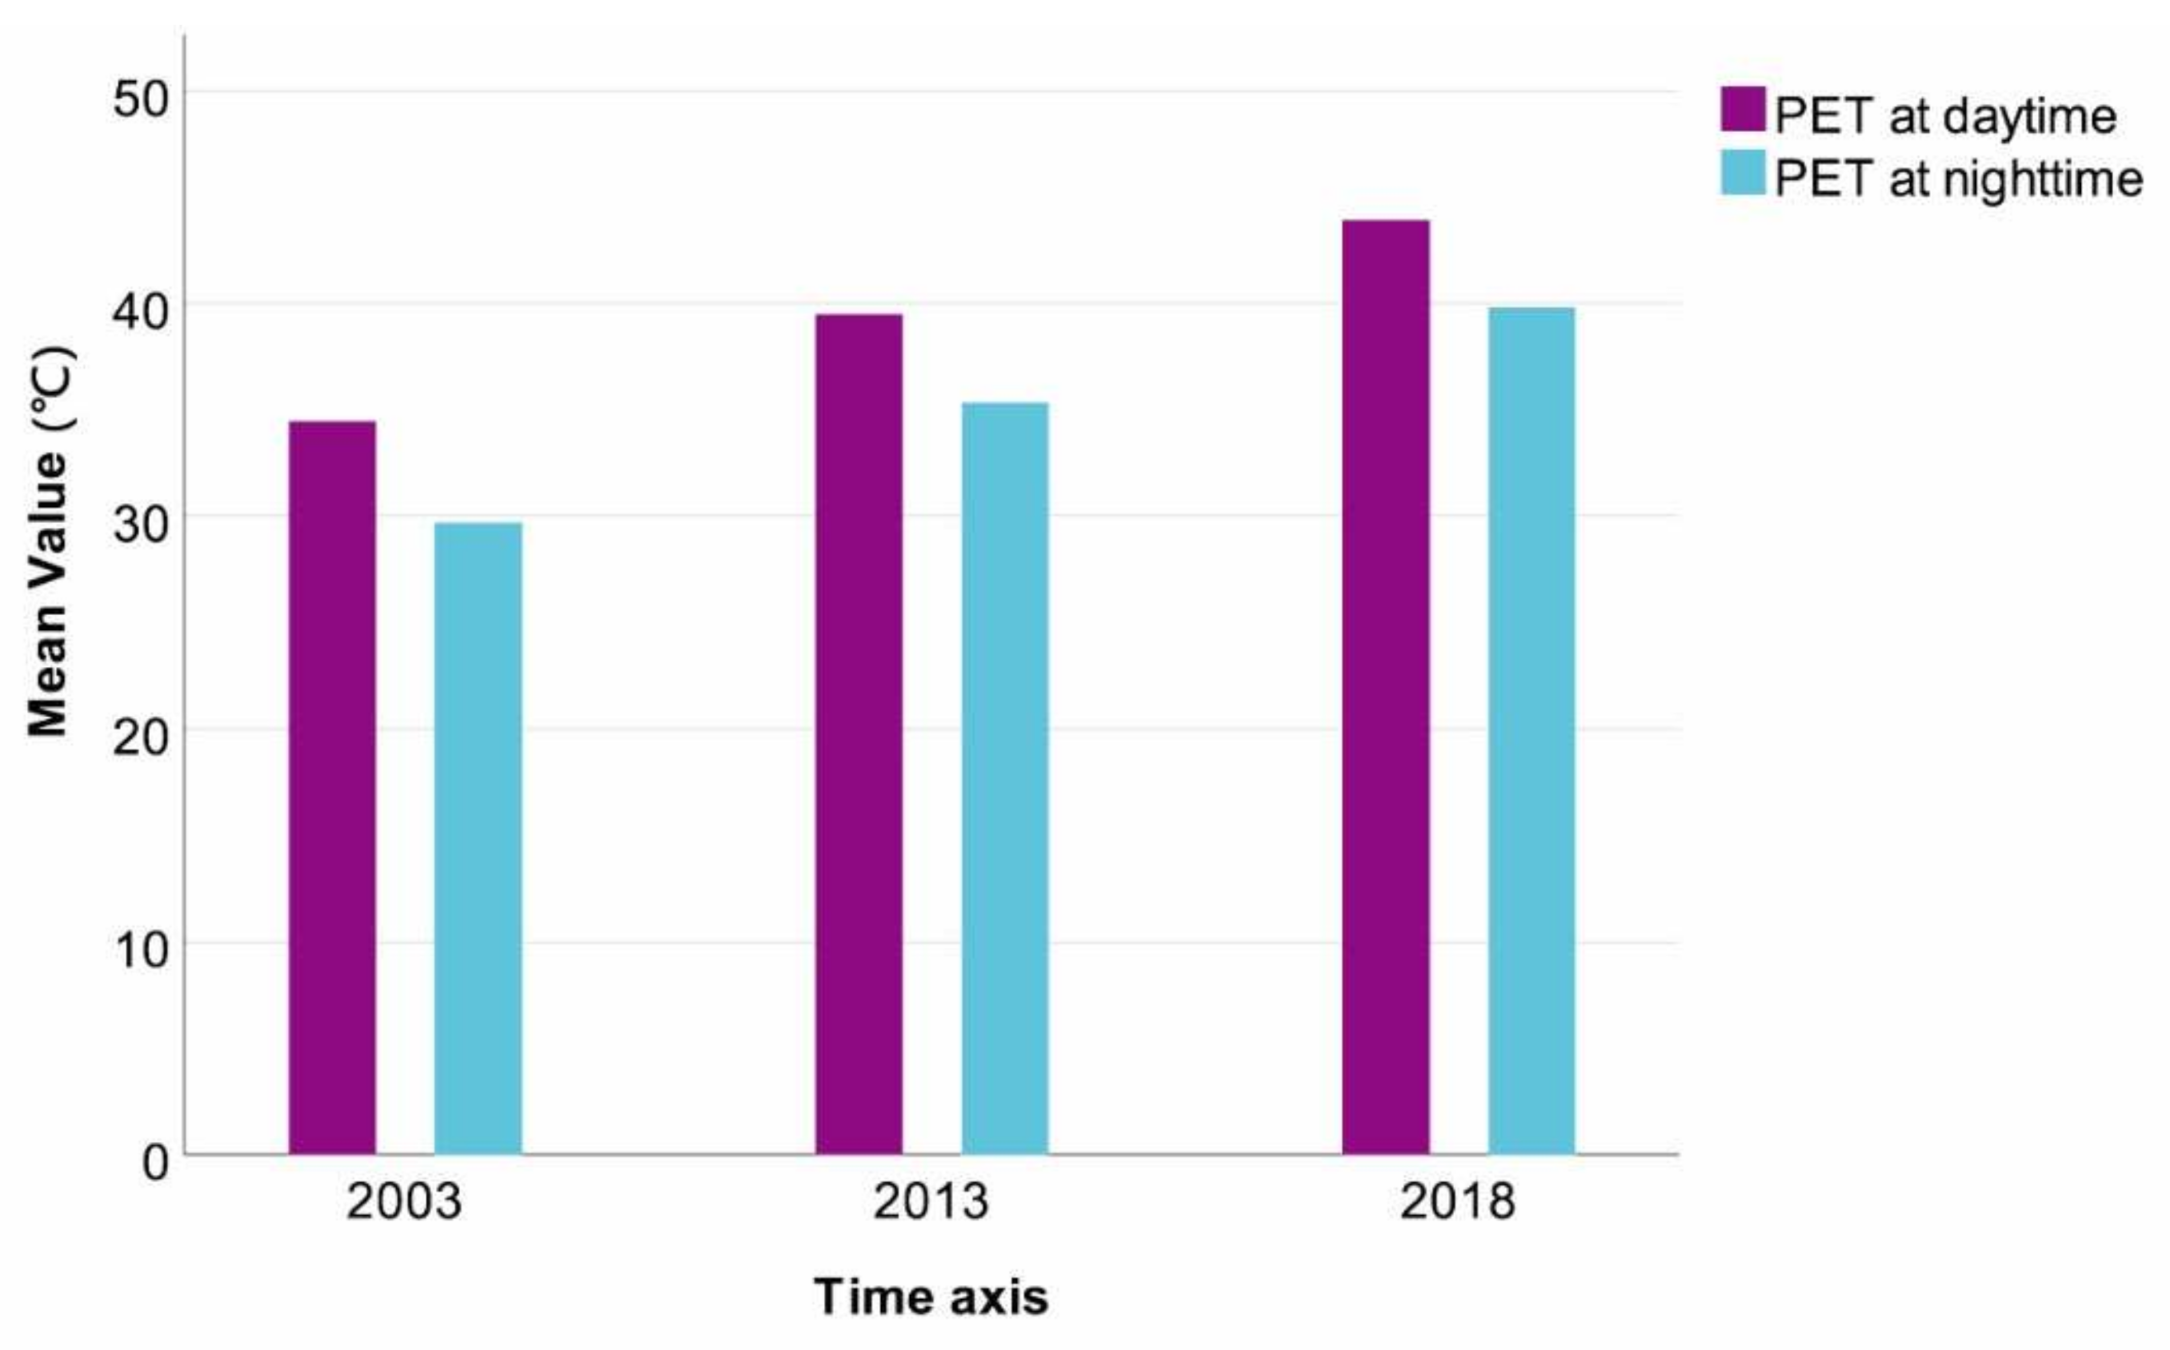
3.2.2. Outdoor Thermal Comfort

PET (physiological equivalent temperature) was used as an indicator of outdoor thermal comfort to assess human thermal sensation in order to explore the rural outdoor thermal environment. Figure 8 illustrates the changes of PET in the daytime and nighttime, which shows that PET in the daytime was higher than at nighttime. Furthermore, we found that PET values increased from 2003 to 2018, meaning that it is difficult for humans to adapt to the rural outdoor thermal environment. Through calculations, we determined that the growth percentage of PET at daytime was 27.3%, and at nighttime it was 34.03%.
Table 5 shows the thermal perception (TP) and thermal stress (TS) according to the physiological equivalent temperature (PET) range and the grade of physiological stress. It can be seen that TP increased from warm to very hot during the daytime from 2003 to 2018, and from warm (close to slightly warm) to hot at night; for TS, it changed from moderate heat to extreme heat at daytime, and from moderate heat (close to slightly heat) to strong heat at night. In general, the TP and TS showed remarkable growth. More importantly, because the outdoor thermal environment affects the normal function of body temperature regulation, it will affect human health and even cause human pathological reactions if the outdoor thermal environment exceeds the limit of human body temperature regulation.

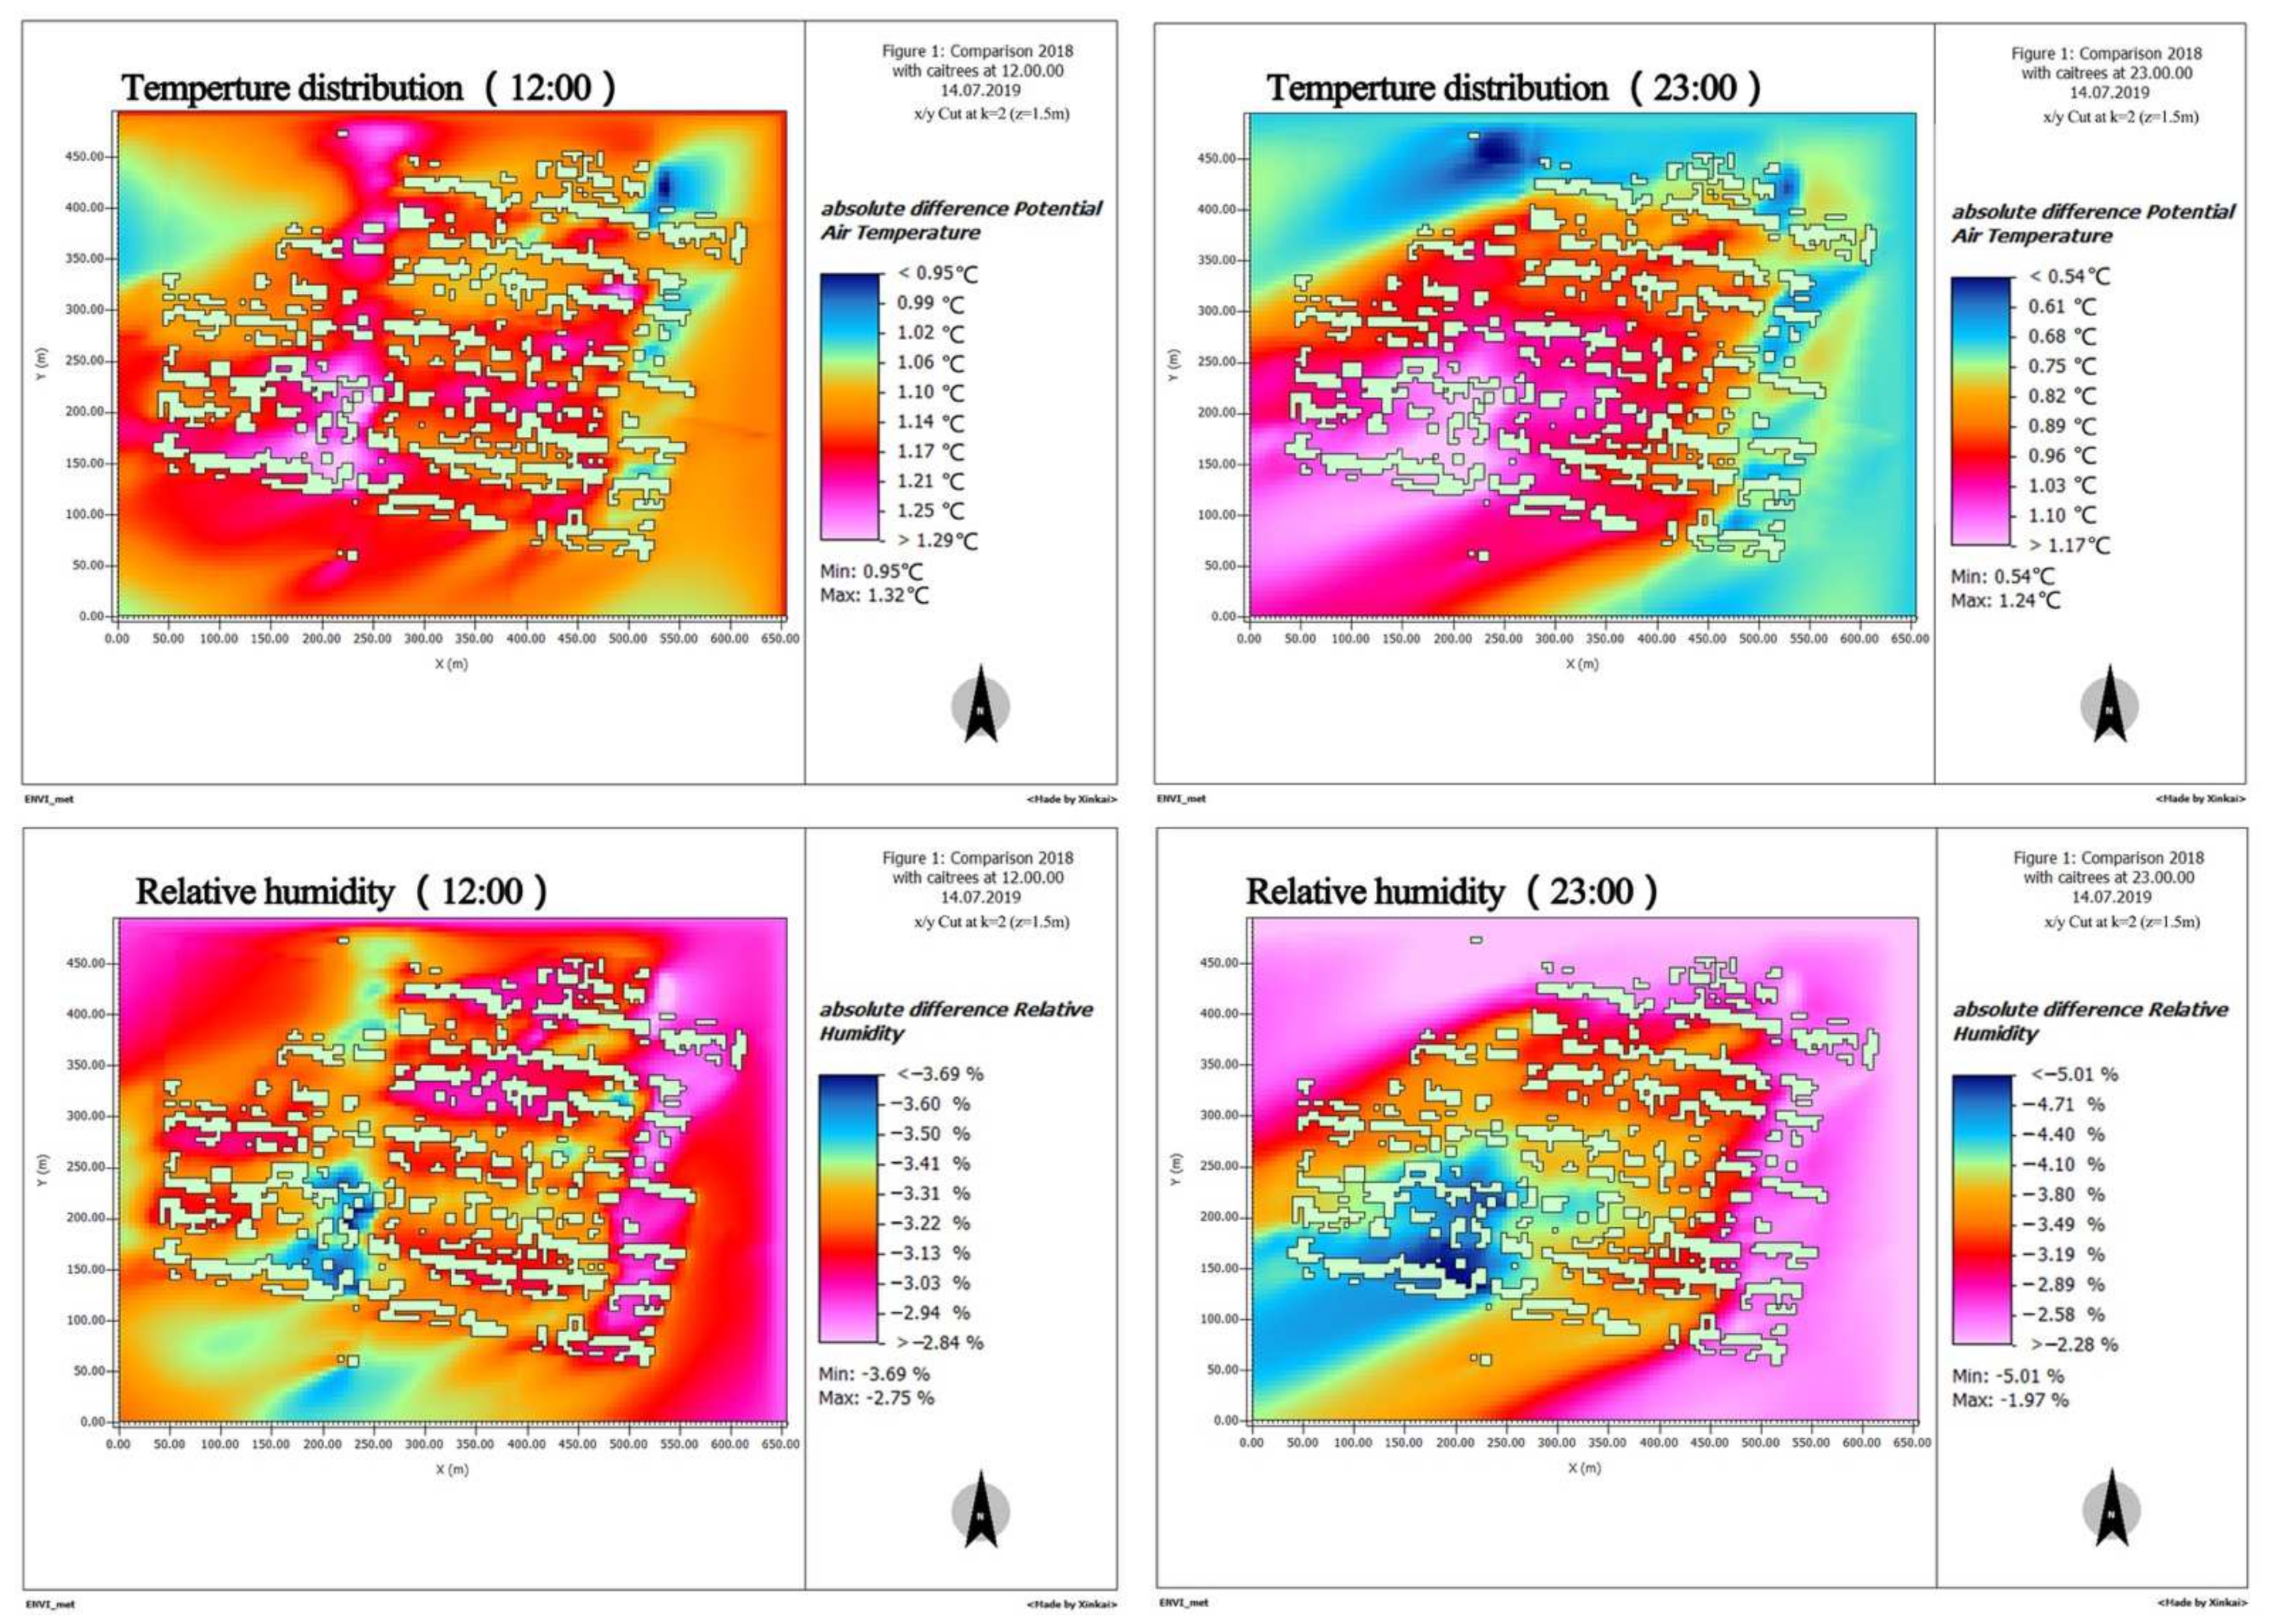
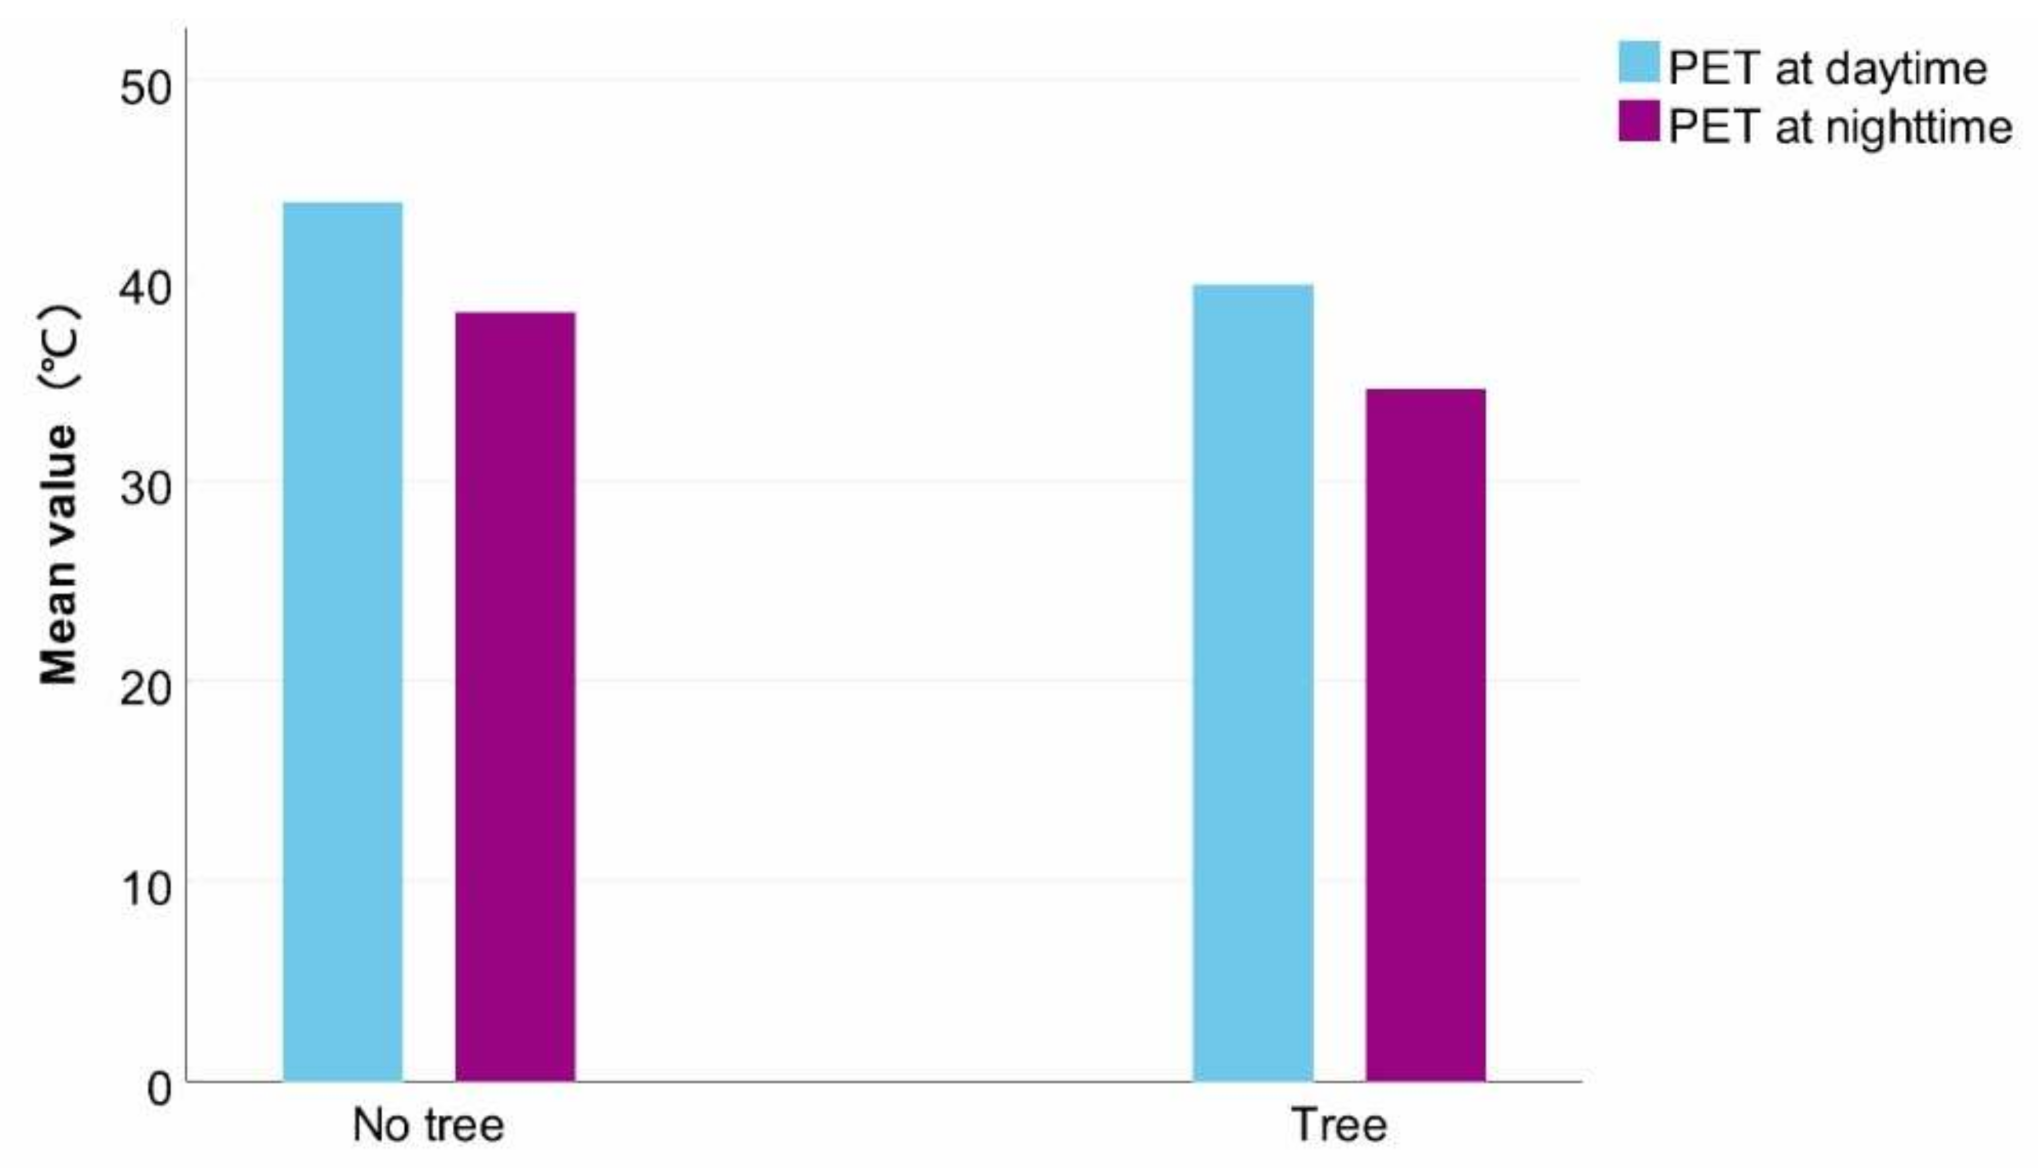
3.3. The Cooling Effect of Trees

Figure 9 illustrates the distribution maps of AT (air temperature) differences and RH (relative humidity) differences during the daytime (12:00) and nighttime (23:00), both with trees and with no trees. It can be seen that the AT and RH clearly change in the study area with the function of the trees, mainly showing that AT decreases and RH goes up, especially with the density of buildings.
During the daytime, the AT difference in most areas ranges from 1.17 °C to 1.21 °C, and the highest AT occurred at densely binding areas with the value of 1.29 °C, which is located in the southeast of the study area. However, the main range of RH is between 3.13% and 3.31%, and the highest difference appeared at the same place, with a value of 3.69%. For nighttime, the main ranges of AT and RH were 0.96–1.03 °C and 3.19–3.8%, respectively, and the peak values were 1.17 °C and 5.01%. Obviously, the difference of AT at nighttime is lower than that of daytime, but opposite to the values of RH.
As illustrated in Figure 10, which shows the difference values of AT and RH with the thermal improvement of trees, the difference values of the N–S road were more obvious compared to those of the E–W road and the E-P space, with difference values of −4.46% (RH in daytime), −3.06% (RH at nighttime), 1.13 °C (AT in daytime), and 1.13 °C (AT at nighttime). Through calculations, we determined that the daily average AT dropped by 1.09 °C with an amplitude of 3.6%, and the RH increased by 3.59% with an amplitude of 8%. Thus, the trees had a significant effect on reducing air temperature and increasing relative humidity in the N–S road of the rural settlements.
Figure 11 illustrates the average PET changes both at daytime and nighttime based on the N–S road, E–W road, and E-P space, and shows that PET values with trees are lower than those without trees. Our calculations determined that the PET decreased by 12.4% during the daytime and 13.1% at night.
Table 6 shows the changes of thermal perception (TP) and thermal stress (TS) with the cooling effect of trees on the rural settlement. More specifically, for TP, the changes both at daytime and nighttime were “very hot”–“hot” and “hot”–“warm”, respectively. In terms of TS, the changes during the day are “Extreme heat”–“Strong heat” and at night “Strong heat”–“Moderate heat”. Therefore, even one tree per house could significantly improve outdoor human thermal comfort in rural settlements, especially at night.

4. Discussion

4.1. Spatio-Temporal Changes of the Outdoor Thermal Environment

In the current case study, from 2003 to 2018, the average AT increased by 0.91 °C (3.08%) and RH decreased by 2.07% (4.42%). According to Section 2.2.2, we know that from 2003 to 2018, the obvious changes of the village were to the buildings, courtyards, bare ground, event plaza, and roads. What they have in common is that the type of underlying surface was converted from the natural underlying surface (loam or sand) to the artificial underlying surface (concrete paving). Table 7 shows the proportion of artificial surfaces in this paper. It can be seen that the artificial surface area increased from 9.5% to 44.9% between 2003 and 2018; in other words, the air temperature increased by 3.08% and relative humidity decreased by 4.42% with the 35.4% increase in artificial surfaces.
The land-atmosphere interaction refers to the exchange transmission process, which is the exchange and transmission process of energy, moisture, matter, etc. between the land and the atmosphere. Earth’s surface first responds to incident solar short-wave radiation by heating up, while the atmosphere above the surface responds indirectly through heating the surface [51]. Land surfaces dissipate the received solar short-wave radiation and provide boundary driving conditions for the energy and water exchange process in the upper atmosphere [52,53]. As shown in Figure 12, a complete earth system model must have the ability to describe the process of energy and moisture exchange and transmission between land and atmosphere based on physical foundations [54,55,56]. Moreover, the energy redistribution process that occurs on the land surface is one of the important physical processes in the earth system.
Figure 13 shows the process of energy balance on the earth’s surface, which is an important foundation for studying land-surface processes [57]. The surface energy balance equation, which provides an essential quantitative characterization tool for describing this process, is:
Rn − Go = H + LE
Rn is net surface radiation, H is sensible heat flux (also the heat exchange between the underlying surface and atmospheric turbulence), LE is latent heat flux (the heat exchange between the underlying surface and water evaporation), Go is the soil heat flux (surface storage heat flux), and the units of all variables are W/m2. Rn−Go represents the energy received by the surface and H + LE reflects the energy consumed by the surface through turbulence. This formula plays an important role in studying the energy distribution mechanism of the underlying surface.
The net radiation Rn is the sum of the incident long- and short-wave radiation, which can generally be expressed as:
R n = 1 α S d + ε a σ T a 4 ε s σ T s 4
where α is the surface albedo (the ratio of the total reflected radiant flux to the incident radiant flux), Sd is the incident short-wave radiation, εa is the atmospheric emissivity, εs is the surface emissivity, σ is the Stefan–Boltzmann constant (5.67·10−8 W/m2 × K4), Ta is the air temperature, and Ts is the surface temperature. Specifically, the more reflected radiant with the higher the albedo, the more energy (H) is used to heat the air temperature near the ground. As shown in Table 8, the albedo of the natural surface is generally lower than that of an artificial surface, which indicates that the near-surface air temperature of the artificial surface is higher than that of a natural surface with the same meteorological conditions. Furthermore, the larger the artificial area proportion, the higher the temperature.
In this paper, artificial surfaces increased from 9.5% to 44.9% between 2003 and 2018. Moreover, the main changes to ground surfaces were the increase in cement areas and the decrease in soil. For albedo, the soil (0.1–0.2) is lower than that of cement (0.20–0.35). This also explains the increase in temperature from 2003 to 2018, which was mainly due to the increase in the proportion of artificial surfaces with a higher albedo. Besides, the ground absorbs solar radiation and stores it as a form of heat during the day, which is released after sunset. The reason why the difference at night is more obvious than that of the day may be due to the heat capacity of the artificial surface being greater than that of the natural surface and the faster heat release rate without radiation.
The global annual mean temperature increased from 2003 to 2018 in the real world, and, obviously, the air temperature of 2018 was higher than that of 2003. However, the input meteorological parameters of this current research were the same in the models of 2003, 2013, and 2018, meaning that the actual air temperature growth rate may be higher than the results of this study. In other words, the changes of the air temperature were higher than 3.08%, while the relative humidity was higher than 4.42%. In addition, PET values will also increase. This also reveals that it is more difficult for the human body to adapt to the outdoor thermal environment.
Urbanization in China has continued to accelerate in recent years, which is an irreversible trend worldwide; however, in this case study, the artificial surface of 2018 accounted for 44.9%, and most areas still have natural surfaces. We cannot estimate how much the proportion of artificial surfaces will increase, but it will increase with continued urbanization. Meanwhile, artificial surfaces increase the hazards of rural outdoor thermal environments and also affect the thermal comfort of the human body.
The case study of this paper is representative of the villages in the Guanzhong region of China. Most of the issues of rural settlements with the process of urbanization were similar with this case, for example, the area of bare soil decreased, the area of concrete increased, the height of buildings gradually increased, and so on. However, this research reveals the spatio-temporal mechanisms of the rural outdoor thermal environment in Guanzhong during the process of urbanization, indicating that the air temperature increased with the growth of artificial surfaces. Therefore, we suggest that rural policymakers should pay attention to the outdoor thermal environment issues caused by artificial surfaces.

4.2. Effect of Trees on Outdoor Thermal Environment

Trees can not only consume solar energy through plant transpiration to create a cool surrounding environment [26], but also intercept solar radiation with their leaves and branches to provide shaded areas, as illustrated in Figure 14 [60]. During this research, an ideal model with trees was established based on the 2018 model; furthermore, the same meteorological condition was used for simulations. The results showed that the air temperature dropped by 3.6% and the relative humidity increased by 8%, also improving thermal comfort. As shown in Figure 15, approximately 50% of visible and infrared radiation was absorbed, with 30% reflected and only 20% transmitted. Overall, nearly 80–90% of both types of radiation was filtered because of the types of leaves, arrangement, and leaf density [61] of the trees. This explains the mechanism of the cooling effect of trees.
Rural settlements in China are a cultural product that has existed for hundreds of years, with many older trees. The large canopy of the trees produces a larger shadow area and creates a better cooling effect. Although we selected one species of tree as the research object, the results of our study prove that arbor shading can improve the rural outdoor thermal environment. Compared with cities, the height of buildings in the countryside is relatively low and the land resources are abundant, which is suitable for the survival of trees. Rural policymakers should pay attention to the protection and planting of trees from the perspective of the thermal environment in the future development of villages.

5. Conclusions and Suggestions

Using the methods of field measurement and numerical simulation, we analyzed the temporal-spatial changes of the outdoor thermal environment in a representative rural settlement in Northwest China. The thermal improvement of trees on the settlement was also explored. The index of human thermal comfort (PET) was used to assess the changes of the thermal environment. The following are the main results:
The values of RMSE and MAPE reveal that the ENVI-met model could be considered to have a good precision to simulate the outdoor thermal environment of a rural settlement. Furthermore, the average air temperature and relative humidity increased by 3.08% and −4.42% due to the 35.4% increase in artificial surfaces from 2003 to 2018 with the urbanization acceleration, ultra-high-speed, and new era stages of this case study. Moreover, the index of outdoor thermal comfort (PET) gradually increased by 27.43% in the daytime and 34.03% at nighttime, and the most uncomfortable period occurred during the daytime in 2018, which was “very hot” and “extreme heat”. Further, the effect of trees on rural settlements presented that the average air temperature was reduced by 3.6% and relative humidity was increased by 8%. Moreover, PET index was reduced by 12.4% and 13.1%, respectively, for daytime and nighttime.
The results of the case study could represent most villages in the Guanzhong plain as it is typical of rural settlement in the Guanzhong plain. Therefore, some suggestions for rural planning are as follows:
  • Rural policy makers should pay attention to the rural outdoor thermal environment issues caused by the increase of artificial underlay surfaces with the process of urbanization because it will cause changes to the surface energy balance, increasing local air temperature and reducing relative humidity, which is not conducive to human thermal comfort.
  • Local trees should be retained while rural rebuilding and the amount of trees should be appropriately increased in future planning as the outdoor thermal environment and thermal comfort can be improved through plant shading.
This paper provides support for rural planning from the perspective of the thermal environment, which is of great significance to rural sustainable development. However, as Guanzhong plain has a different climate condition than other regions, the findings of our study are limited to the rural settlements in the Guanzhong region.
Although our paper has achieved some conclusions, we should focus on coupling the relationship between rural spatial form and outdoor thermal environment in further research, exploring the thresholds of various spatial morphological factors that affect the thermal environment. In addition, the energy consumption of residential building should also be taken into consideration. This will be of great significance and contribution to the creation of a healthier and more ecologically sustainable rural settlement.

Author Contributions

Methodology, K.X. and W.G.; software, K.X.; validation, K.X.; formal analysis, T.W.; investigation, K.X. and W.G.; resources, J.Z.; data curation, T.W.; writing—original draft, K.X.; writing—review and editing, T.W. and Q.Z.; visualization, Q.Z.; supervision, W.G.; project administration, J.Z.; funding acquisition, J.Z. All authors have read and agreed to the published version of the manuscript.

Funding

This research was funded by the “Resilient urban and rural system planning theory and practice construction system adapting to climate change (2020TD-029)” and the “Theory and technical system of riverside landscape planning in northwest China (300102411401)”.

Informed Consent Statement

Informed consent was obtained from all subjects involved in the study.

Data Availability Statement

The data that support the findings of this study are available from the corresponding author upon reasonable request.

Conflicts of Interest

The authors declare no conflict of interest.

References

  1. Fan, J.; Zhou, L.; Zhang, Y.; Shao, S.; Ma, M. How Does Population Aging Affect Household Carbon Emissions? Evidence from Chinese Urban and Rural Areas. Energy Econ. 2021, 100, 105356. [Google Scholar] [CrossRef]
  2. Feng, W.; Liu, Y.; Qu, L. Effect of Land-Centered Urbanization on Rural Development: A Regional Analysis in China. Land Use Policy 2019, 87, 104072. [Google Scholar] [CrossRef]
  3. Chu, Y.-W. China’s New Urbanization Plan: Progress and Structural Constraints. Cities 2020, 103, 102736. [Google Scholar] [CrossRef]
  4. Liu, Y.S. Introduction to Land Use and Rural Sustainability in China. Land Use Policy 2018, 74, 1–4. [Google Scholar] [CrossRef]
  5. Cao, S.; Yu, N.; Wu, Y.; Wang, Z.; Mi, J. The Educational Level of Rural Labor, Population Urbanization, and Sustainable Economic Growth in China. Sustainability 2020, 12, 4860. [Google Scholar] [CrossRef]
  6. Zhang, Y. Analysis of Factors Influencing Ecological Environment of Rural Residence in Shanxi Province. J. China Agric. Resour. Reg. Plan. 2018, 39, 103–107. [Google Scholar]
  7. Liu, S.; Huang, G. Rural Construction and Ecological Environment Optimization in Northwest China Based on Sustainability. IOP Conf. Ser. Earth Environ. Sci. 2020, 514, 032056. [Google Scholar] [CrossRef]
  8. Rutan, D.A.; Smith, G.L.; Wong, T. Diurnal Variations of Albedo Retrieved from Earth Radiation Budget Experiment Measurements. J. Appl. Meteorol. Clim. 2014, 53, 2747–2760. [Google Scholar] [CrossRef]
  9. Takebayashi, H.; Moriyama, M. Study on Surface Heat Budget of Various Pavements for Urban Heat Island Mitigation. Adv. Mater. Sci. Eng. 2012, 2012, 1–11. [Google Scholar] [CrossRef] [Green Version]
  10. Kim, S.W.; Brown, R.D. Urban Heat Island (UHI) Intensity and Magnitude Estimations: A Systematic Literature Review. Sci. Total Environ. 2021, 779, 146389. [Google Scholar] [CrossRef]
  11. Wang, Y.; Ni, Z.; Chen, S.; Xia, B. Microclimate Regulation and Energy Saving Potential from Different Urban Green Infrastructures in a Subtropical City. J. Clean. Prod. 2019, 226, 913–927. [Google Scholar] [CrossRef]
  12. Han, L.; Zhao, J.; Gao, Y.; Gu, Z.; Xin, K.; Zhang, J. Spatial Distribution Characteristics of PM2.5 and PM10 in Xi’an City Predicted by Land Use Regression Models. Sustain. Cities Soc. 2020, 61, 102329. [Google Scholar] [CrossRef] [PubMed]
  13. Kim, J.; Hong, T.; Jeong, J.; Koo, C.; Jeong, K. An Optimization Model for Selecting the Optimal Green Systems by Considering the Thermal Comfort and Energy Consumption. Appl. Energy 2016, 169, 682–695. [Google Scholar] [CrossRef]
  14. Davis, R.E.; Hondula, D.M.; Patel, A.P. Temperature Observation Time and Type Influence Estimates of Heat-Related Mortality in Seven U.S. Cities. Environ. Health Perspect. 2016, 124, 795–804. [Google Scholar] [CrossRef]
  15. Shashua-Bar, L.; Pearlmutter, D.; Erell, E. The Influence of Trees and Grass on Outdoor Thermal Comfort in a Hot-Arid Environment. Int. J. Clim. 2010, 31, 1498–1506. [Google Scholar] [CrossRef]
  16. Linares, C.; Martinez, G.; Kendrovski, V.; Diaz, J. A New Integrative Perspective on Early Warning Systems for Health in the Context of Climate Change. Environ. Res. 2020, 187, 109623. [Google Scholar] [CrossRef] [PubMed]
  17. Li, C.; Gu, H. Climate Change and Mortality Evolution in China. J. Environ. Manag. 2020, 267, 110622. [Google Scholar] [CrossRef] [PubMed]
  18. Oliveira, S.; Andrade, H.; Vaz, T. The Cooling Effect of Green Spaces as a Contribution to the Mitigation of Urban Heat: A Case Study in Lisbon. Build. Environ. 2011, 46, 2186–2194. [Google Scholar] [CrossRef]
  19. Park, C.Y.; Lee, D.K.; Asawa, T.; Murakami, A.; Kim, H.G.; Lee, M.K.; Lee, H.S. Influence of Urban Form on the Cooling Effect of a Small Urban River. Landsc. Urban Plan. 2018, 183, 26–35. [Google Scholar] [CrossRef]
  20. Yan, H.; Wu, F.; Dong, L. Influence of a Large Urban Park on the Local Urban Thermal Environment. Sci. Total Environ. 2018, 622, 882–891. [Google Scholar] [CrossRef]
  21. Chang, C.-R.; Li, M.-H. Effects of Urban Parks on the Local Urban Thermal Environment. Urban For. Urban Green. 2014, 13, 672–681. [Google Scholar] [CrossRef]
  22. Jefferson, M. Safeguarding Rural Landscapes in the New Era of Energy Transition to a Low Carbon Future. Energy Res. Soc. Sci. 2018, 37, 191–197. [Google Scholar] [CrossRef]
  23. Kan, K. Creating Land Markets for Rural Revitalization: Land Transfer, Property Rights and Gentrification in China. J. Rural Stud. 2020, 81, 68–77. [Google Scholar] [CrossRef]
  24. Guo, Y.; Liu, Y. Poverty Alleviation through Land Assetization and Its Implications for Rural Revitalization in China. Land Use Policy 2021, 105, 105418. [Google Scholar] [CrossRef]
  25. Liu, C.; Dou, X.; Li, J.; Cai, L.A. Analyzing Government Role in Rural Tourism Development: An Empirical Investigation from China. J. Rural Stud. 2020, 79, 177–188. [Google Scholar] [CrossRef]
  26. Lee, H.; Mayer, H.; Chen, L. Contribution of Trees and Grasslands to the Mitigation of Human Heat Stress in a Residential District of Freiburg, Southwest Germany. Landsc. Urban Plan. 2016, 148, 37–50. [Google Scholar] [CrossRef]
  27. Salata, F.; Golasi, I.; Petitti, D.; Vollaro, E.D.L.; Coppi, M.; Vollaro, A.D.L. Relating Microclimate, Human Thermal Comfort and Health during Heat Waves: An Analysis of Heat Island Mitigation Strategies through a Case Study in an Urban Outdoor Environment. Sustain. Cities Soc. 2017, 30, 79–96. [Google Scholar] [CrossRef]
  28. Doick, K.J.; Peace, A.; Hutchings, T.R. The Role of One Large Greenspace in Mitigating London’s Nocturnal Urban Heat Island. Sci. Total Environ. 2014, 493, 662–671. [Google Scholar] [CrossRef]
  29. Ng, E.; Chen, L.; Wang, Y.; Yuan, C. A Study on the Cooling Effects of Greening in a High-Density City: An Experience from Hong Kong. Build. Environ. 2012, 47, 256–271. [Google Scholar] [CrossRef]
  30. Zölch, T.; Rahman, M.A.; Pfleiderer, E.; Wagner, G.; Pauleit, S. Designing Public Squares with Green Infrastructure to Optimize Human Thermal Comfort. Build. Environ. 2018, 149, 640–654. [Google Scholar] [CrossRef]
  31. Zhao, Q.; Sailor, D.J.; Wentz, E.A. Impact of Tree Locations and Arrangements on Outdoor Microclimates and Human Thermal Comfort in an Urban Residential Environment. Urban For. Urban Green. 2018, 32, 81–91. [Google Scholar] [CrossRef] [Green Version]
  32. Hami, A.; Abdi, B.; Zarehaghi, D.; Bin Maulan, S. Assessing the Thermal Comfort Effects of Green Spaces: A Systematic Review of Methods, Parameters, and Plants’ Attributes. Sustain. Cities Soc. 2019, 49, 101634. [Google Scholar] [CrossRef]
  33. Chen, M.; Lu, D.; Zha, L. The Comprehensive Evaluation of China’s Urbanization and Effects on Resources and Environment. J. Geogr. Sci. 2010, 20, 17–30. [Google Scholar] [CrossRef]
  34. Grădinaru, S.R.; Fan, P.; Iojă, C.I.; Niță, M.R.; Suditu, B.; Hersperger, A.M. Impact of National Policies on Patterns of Built-Up Development: An Assessment over Three Decades. Land Use Policy 2020, 94, 104510. [Google Scholar] [CrossRef]
  35. Bruse, M.; Fleer, H. Simulating Surface-Plant-Air Interactions inside Urban Environments with a Three Dimensional Numerical Model. Environ. Model. Softw. 1998, 13, 373–384. [Google Scholar] [CrossRef]
  36. Perini, K.; Magliocco, A. Effects of Vegetation, Urban Density, Building Height, and Atmospheric Conditions on Local Temperatures and Thermal Comfort. Urban For. Urban Green. 2014, 13, 495–506. [Google Scholar] [CrossRef]
  37. Middel, A.; Häb, K.; Brazel, A.J.; Martin, C.A.; Guhathakurta, S. Impact of Urban Form and Design on Mid-Afternoon Microclimate in Phoenix Local Climate Zones. Landsc. Urban Plan. 2014, 122, 16–28. [Google Scholar] [CrossRef]
  38. Ouyang, W.; Sinsel, T.; Simon, H.; Morakinyo, T.E.; Liu, H.; Ng, E. Evaluating the Thermal-Radiative Performance of ENVI-Met Model for Green Infrastructure Typologies: Experience from a Subtropical Climate. Build. Environ. 2021, 207, 108427. [Google Scholar] [CrossRef]
  39. Elnabawi, M.H.; Hamza, N. Outdoor Thermal Comfort: Coupling Microclimatic Parameters with Subjective Thermal Assessment to Design Urban Performative Spaces. Buildings 2020, 10, 238. [Google Scholar] [CrossRef]
  40. Zhu, Z.; Liang, J.; Sun, C.; Han, Y. Summer Outdoor Thermal Comfort in Urban Commercial Pedestrian Streets in Severe Cold Regions of China. Sustainability 2020, 12, 1876. [Google Scholar] [CrossRef] [Green Version]
  41. Morakinyo, T.E.; Dahanayake, K.; Ng, E.Y.Y.; Chow, C.L. Temperature and Cooling Demand Reduction by Green-Roof Types in Different Climates and Urban Densities: A Co-Simulation Parametric Study. Energy Build. 2017, 145, 226–237. [Google Scholar] [CrossRef]
  42. Cheng, B.; Gou, Z.; Zhang, F.; Feng, Q.; Huang, Z. Thermal Comfort in Urban Mountain Parks in the Hot Summer and Cold Winter Climate. Sustain. Cities Soc. 2019, 51, 101756. [Google Scholar] [CrossRef]
  43. Matzarakis, A.; Rutz, F.; Mayer, H. Modelling Radiation Fluxes in Simple and Complex Environments: Basics of the RayMan Model. Int. J. Biometeorol. 2010, 54, 131–139. [Google Scholar] [CrossRef] [PubMed] [Green Version]
  44. Zhang, L.; Zhan, Q.; Lan, Y. Effects of the Tree Distribution and Species on Outdoor Environment Conditions in a Hot Summer and Cold Winter Zone: A Case Study in Wuhan Residential Quarters. Build. Environ. 2018, 130, 27–39. [Google Scholar] [CrossRef]
  45. Lin, T.-P.; Matzarakis, A. Tourism Climate and Thermal Comfort in Sun Moon Lake, Taiwan. Int. J. Biometeorol. 2007, 52, 281–290. [Google Scholar] [CrossRef] [PubMed]
  46. Matzarakis, A.; Mayer, H. Heat Stress in Greece. Int. J. Biometeorol. 1997, 41, 34–39. [Google Scholar] [CrossRef] [PubMed]
  47. Yin, S.; Lang, W.; Xiao, Y.; Xu, Z. Correlative Impact of Shading Strategies and Configurations Design on Pedestrian-Level Thermal Comfort in Traditional Shophouse Neighbourhoods, Southern China. Sustainability 2019, 11, 1355. [Google Scholar] [CrossRef] [Green Version]
  48. Khan, A.; Chatterjee, S.; Weng, Y. Simulating microscale thermal interactions using ENVI-met climate Model. In Urban Heat Island Modeling for Tropical Climates; Elsevier: Amsterdam, The Netherlands, 2021; pp. 179–213. [Google Scholar] [CrossRef]
  49. Jiang, Y.; Han, X.; Shi, T.; Song, D. Microclimatic Impact Analysis of Multi-Dimensional Indicators of Streetscape Fabric in the Medium Spatial Zone. Int. J. Environ. Res. Public Health 2019, 16, 952. [Google Scholar] [CrossRef] [Green Version]
  50. Chow, W.T.L.; Pope, R.L.; Martin, C.A.; Brazel, A.J. Observing and Modeling the Nocturnal Park Cool Island of an Arid City: Horizontal and Vertical Impacts. Arch. Meteorol. Geophys. Bioclimatol. Ser. B 2010, 103, 197–211. [Google Scholar] [CrossRef]
  51. Oke, T.R. The Energetic Basis of the Urban Heat Island. Q. J. R. Meteorol. Soc. 1982, 108, 1–24. [Google Scholar] [CrossRef]
  52. McCumber, M.C.; Pielke, R.A. Simulation of the Effects of Surface Fluxes of Heat and Moisture in a Mesoscale Numerical Model: 1. Soil Layer. J. Geophys. Res. Earth Surf. 1981, 86, 9929–9938. [Google Scholar] [CrossRef] [Green Version]
  53. Fei, C.; Dudhia, J. Coupling an Advanced Land Surface-Hydrology Model with the Penn State-NCAR MM5 Modeling System. I. Model Implementation and Sensitivity. Mon. Weather Rev. 2001, 129, 569–585. [Google Scholar]
  54. Sellers, P.J.; Dickinson, R.E.; Randall, D.A.; Betts, A.K.; Hall, F.G.; Berry, J.A.; Collatz, G.J.; Denning, A.S.; Mooney, H.A.; Nobre, C.A. Modeling the Exchanges of Energy, Water, and Carbon between Continents and the Atmosphere. Science 1997, 275, 502–509. [Google Scholar] [CrossRef] [Green Version]
  55. Liang, X.; Lettenmaier, D.P.; Wood, E.F.; Burges, S.J. A Simple Hydrologically Based Model of Land Surface Water and Energy Fluxes for General Circulation Models. J. Geophys. Res. Earth Surf. 1994, 99, 14415–14428. [Google Scholar] [CrossRef]
  56. Katul, G.; Oren, R.; Manzoni, S.; Higgins, C.; Parlange, M.B. Evapotranspiration: A Process Driving Mass Transport and Energy Exchange in the Soil-Plant-Atmosphere-Climate System. Rev. Geophys. 2012, 50, RG3002. [Google Scholar] [CrossRef] [Green Version]
  57. Touchaei, A.G.; Akbari, H. Evaluation of the Seasonal Effect of Increasing Albedo on Urban Climate and Energy Consumption of Buildings in Montreal. Urban Clim. 2015, 14, 278–289. [Google Scholar] [CrossRef]
  58. Mizwar, I.K.; Napiah, M.B.; Sutanto, M.H. 4—Pavements for Mitigating Urban Heat Island Effects, in Eco-Efficient Materials for Reducing Cooling Needs in Buildings and Construction; Pacheco-Torgal, F., Ed.; Woodhead Publishing: Cambridge, UK, 2021; pp. 61–76. [Google Scholar]
  59. Pasetto, M.; Baliello, A.; Pasquini, E.; Giacomello, G. 2—High Albedo Pavement Materials, in Eco-Efficient Materials for Reducing Cooling Needs in Buildings and Construction; Pacheco-Torgal, F., Ed.; Woodhead Publishing: Cambridge, UK, 2021; pp. 15–32. [Google Scholar]
  60. Abdi, B.; Hami, A.; Zarehaghi, D. Impact of Small-Scale Tree Planting Patterns on Outdoor Cooling and Thermal Comfort. Sustain. Cities Soc. 2020, 56, 102085. [Google Scholar] [CrossRef]
  61. Kotzen, B. An Investigation of Shade under Six Different Tree Species of the Negev Desert Towards Their Potential Use for Enhancing Micro-Climatic Conditions in Landscape Architectural Development. J. Arid Environ. 2003, 55, 231–274. [Google Scholar] [CrossRef]
  62. Shahidan, M.; Salleh, E.; Shariff, K. Effects of Tree Canopies on Solar Radiation Filtration in a Tropical Microclimatic Environment. In Proceedings of the 24th Conference on Passive and Low Energy Architecture, Singapore, 22–24 November 2007; Volume 18. [Google Scholar]
Figure 1. The location of the study area: (a) Guanzhong plain in, Shaanxi, China. (b) Image of Caijia settlement.
Buildings 12 00345 g001
Figure 2. The locations of the measuring sites: (a) site 1, (b) site 2, (c) site 3, and (d) site 4.
Buildings 12 00345 g002
Figure 5. The comparison between measured values and simulation values at 1.5 m from the ground at the four sites for verifying the validity of the ENVI-met software. (a) Air temperature. (b) Relative humidity.
Buildings 12 00345 g005
Figure 6. Distribution maps of air temperature (AT) and relative humidity (RH) at 1.5 m from the ground in the study area. (a) Air temperature at daytime (12:00). (b) Air temperature at nighttime (23:00). (c) Relative humidity at daytime (12:00). (d) Relative humidity at nighttime (23:00).
Buildings 12 00345 g006
Figure 7. The mean difference values profile of air temperature (AT) and relative humidity (RH) from 2003 to 2018.
Buildings 12 00345 g007
Figure 8. Profile of PET at daytime and nighttime in 2003, 2013, and 2018.
Buildings 12 00345 g008
Figure 9. Difference values distribution maps of air temperature (AT) and relative humidity (RH) at 1.5 m from the ground at daytime (12:00) and nighttime (23:00).
Buildings 12 00345 g009
Figure 10. The difference values of air temperature (AT) and relative humidity (RH) with trees and with no trees.
Buildings 12 00345 g010
Figure 11. Comparisons of PET values with trees and with no trees, during the daytime and at nighttime.
Buildings 12 00345 g011
Figure 12. The process of energy and moisture exchange and transmission between the land and the atmosphere.
Buildings 12 00345 g012
Figure 13. The diagram of surface energy balance.
Buildings 12 00345 g013
Figure 14. Diagram of the surface energy balance.
Buildings 12 00345 g014
Figure 15. The absorption, transmission, and reflection of radiation in a single leaf layer (adapted from Ref. [62]).
Buildings 12 00345 g015
Table 1. The attributes of street tree model.
NameHeight (m)Distance between Two Trees (m)Crown (m)LAD
Platanus1515101.1
Table 2. The basic parameters of the simulation experiment.
ParametersParameter Values
Simulation settingsTotal simulation time/h36
-Output time interval/min60
-Number of nested grids10
Initial parameter settingSimulation start date13 July 2019
-Simulation start time19:00
-Initial temperature25.7
-Wind speed at 10 m/(m·s−1)2.5
-Wind direction at 10 m (°)60° N–E
-Relative humidity at 2 m (%)40
-Specific humidity at 2500 m (g/kg)7
Table 3. The relationship between physiological equivalent temperature (PET) range and the grade of physiological stress [45,46,47].
Thermal PerceptionPET (°C) for Subtropical RegionPET (°C) for Temperate RegionGrade of Thermal StressAbbreviation
Very cold<14<4Extreme cold stressEC
Cold14–174–7Strong cold stressSC
Cool18–218–12Moderate cold stressMC
Slightly cool22–2513–17Slight cold stressSC
Neutral26–2918–22No thermal stressNT
Slightly warm30–3323–28Slight heat stressSH
Warm34–3729–34Moderate heat stressMH
Hot38–4135–40Strong heat stressSH
Very hot≥42≥41Extreme heat stressEHS
Table 4. Root mean square error (RMSE) and mean absolute error (MAPE) between the observation data and the measured data for temperature and relative humidity at the four sites.
ModelVariableSite 1Site 2Site 3Site 4
RMSETemperature1.791.691.260.85
Relative humidity2.742.782.491.24
MAPETemperature4.79%4.33%3.79%2.16%
Relative humidity4.99%5.11%5.09%2.04%
Table 5. Thermal perception (TP) and thermal stress (TS) during the daytime and nighttime from 2003 to 2018.
TimeIndicator200320132018
DayTPWarmHotVery hot
TSModerate heatStrong heatExtreme heat
NightTPWarm (close to slightly warm)WarmHot
TSModerate heat (close to slightly heat)Moderate heatStrong heat
Table 6. Thermal perception (TP) and thermal stress (TS) with no trees and with trees.
TimeEvaluation IndexNo TreesWith Trees
DayTPVery hotHot
TSExtreme heatStrong heat
NightTPHotWarm
TSStrong heatModerate heat
Table 7. Proportion of artificial surface from 2003 to 2018.
Time200320132018
Proportion 9.5%36.3%44.9%
Table 8. The albedo of typical natural and artificial materials [58,59].
SurfaceAlbedo
Artificial
Asphalt-0.05–0.20
Cement -0.20–0.35
Bricks-0.20–0.40
Corrugated iron-0.10–0.16
White stucco-0.70–0.90
Glass-0.08
Natural
Forest-0.07–0.20
Grass-0.15–0.30
Soil-0.10–0.20
Source: [51].
Publisher’s Note: MDPI stays neutral with regard to jurisdictional claims in published maps and institutional affiliations.

