
Landscape Efficiency Assessment of Urban Subway Station Entrance Based on Structural Equation Model: Case Study of Main Urban Area of Nanjing


Abstract
:1. Introduction
2. Relevant Research Progress
2.1. Study on Subway Station Entrance Landscape
2.2. Research on Structural Equation Model
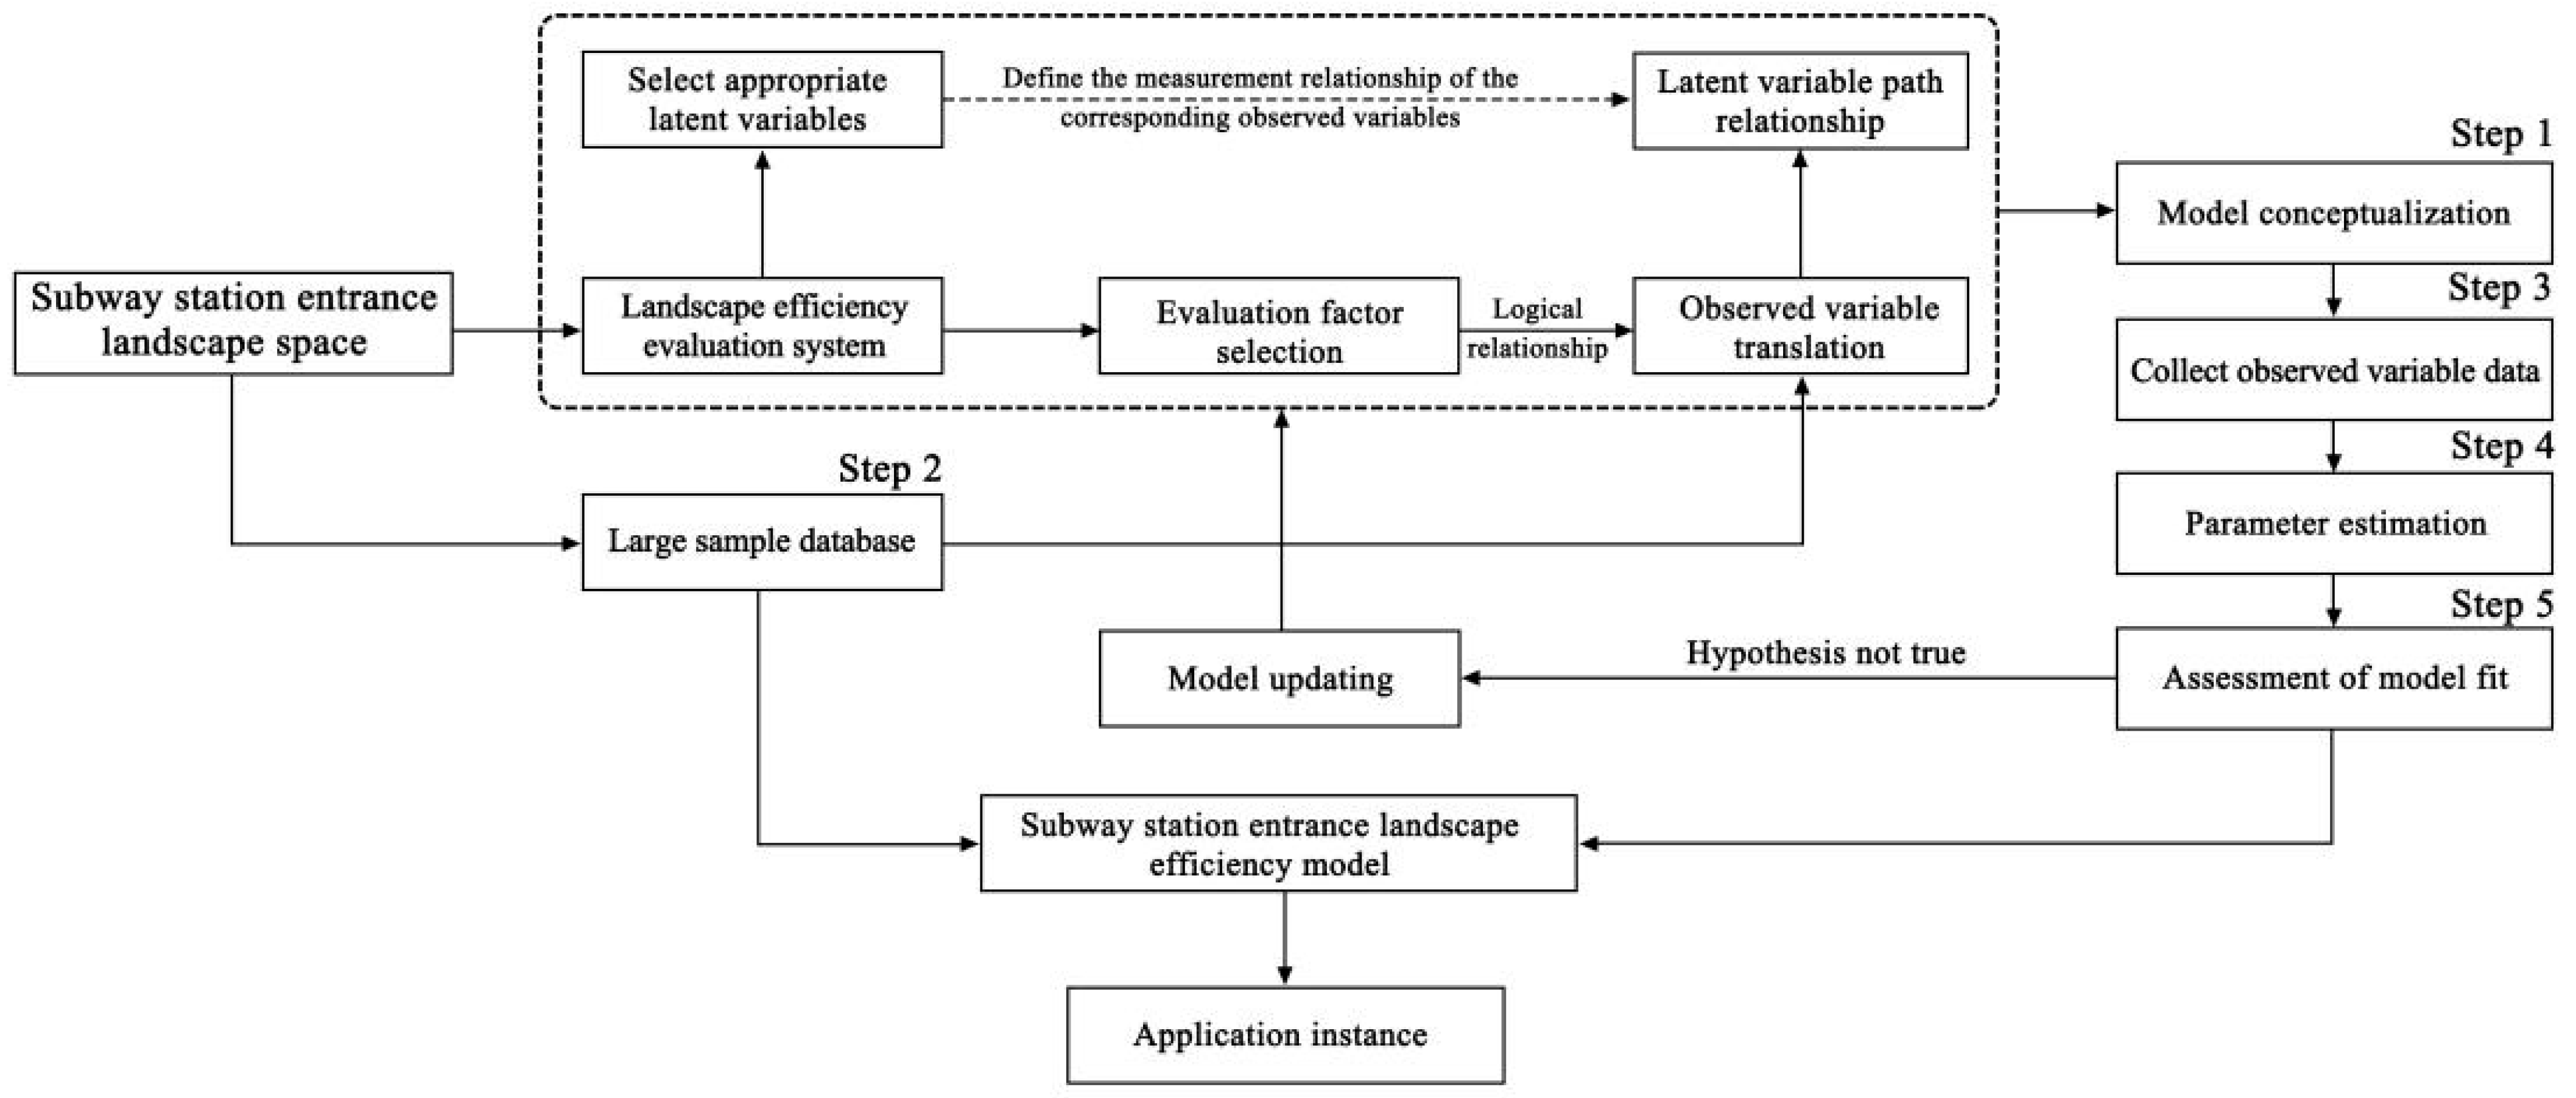
3. Theoretical Model of Urban Subway Station Entrance Landscape Efficiency
3.1. Logical Framework
3.2. Technical Route
- (1)
- Establish a theoretical model: Transform the proposed evaluation system into a structural equation model. The indicator layer corresponds to the latent variables which cannot be extracted directly from the landscape environment. The factor layer is equivalent to the observed variables. Then, researchers set the causal relationship among latent variables and measure the relationship between latent variables and observed variables individually.
- (2)
- Construction of a sample database: Select suitable samples according to site size and space boundary. The property line of the subway station entrance restricts the sample area, excluding the adjacent sidewalks and the municipal public green space.
- (3)
- Data collection and processing: Collect observed data of each sample, then batch process the original data to eliminate the effects of different dimensions. Since the maximum and minimum values of the data are known and there is no obvious outlier data, the “min-max standardization” method is suitable to be used in this study.
- (4)
- Parameter estimation: Import the processed data into the model and build the mathematical matrix for the regression model. After the parameters reach a single value, it shows that the evaluation system and theoretical hypotheses exist.
- (5)
- Fitness evaluation and model modification: Comprehensively evaluate the model validity regarding different fitness indicators. When the theoretical model does not match well, the initial model must be locally adjusted and optimized. The evaluation model is successfully established after completing the overall verification.
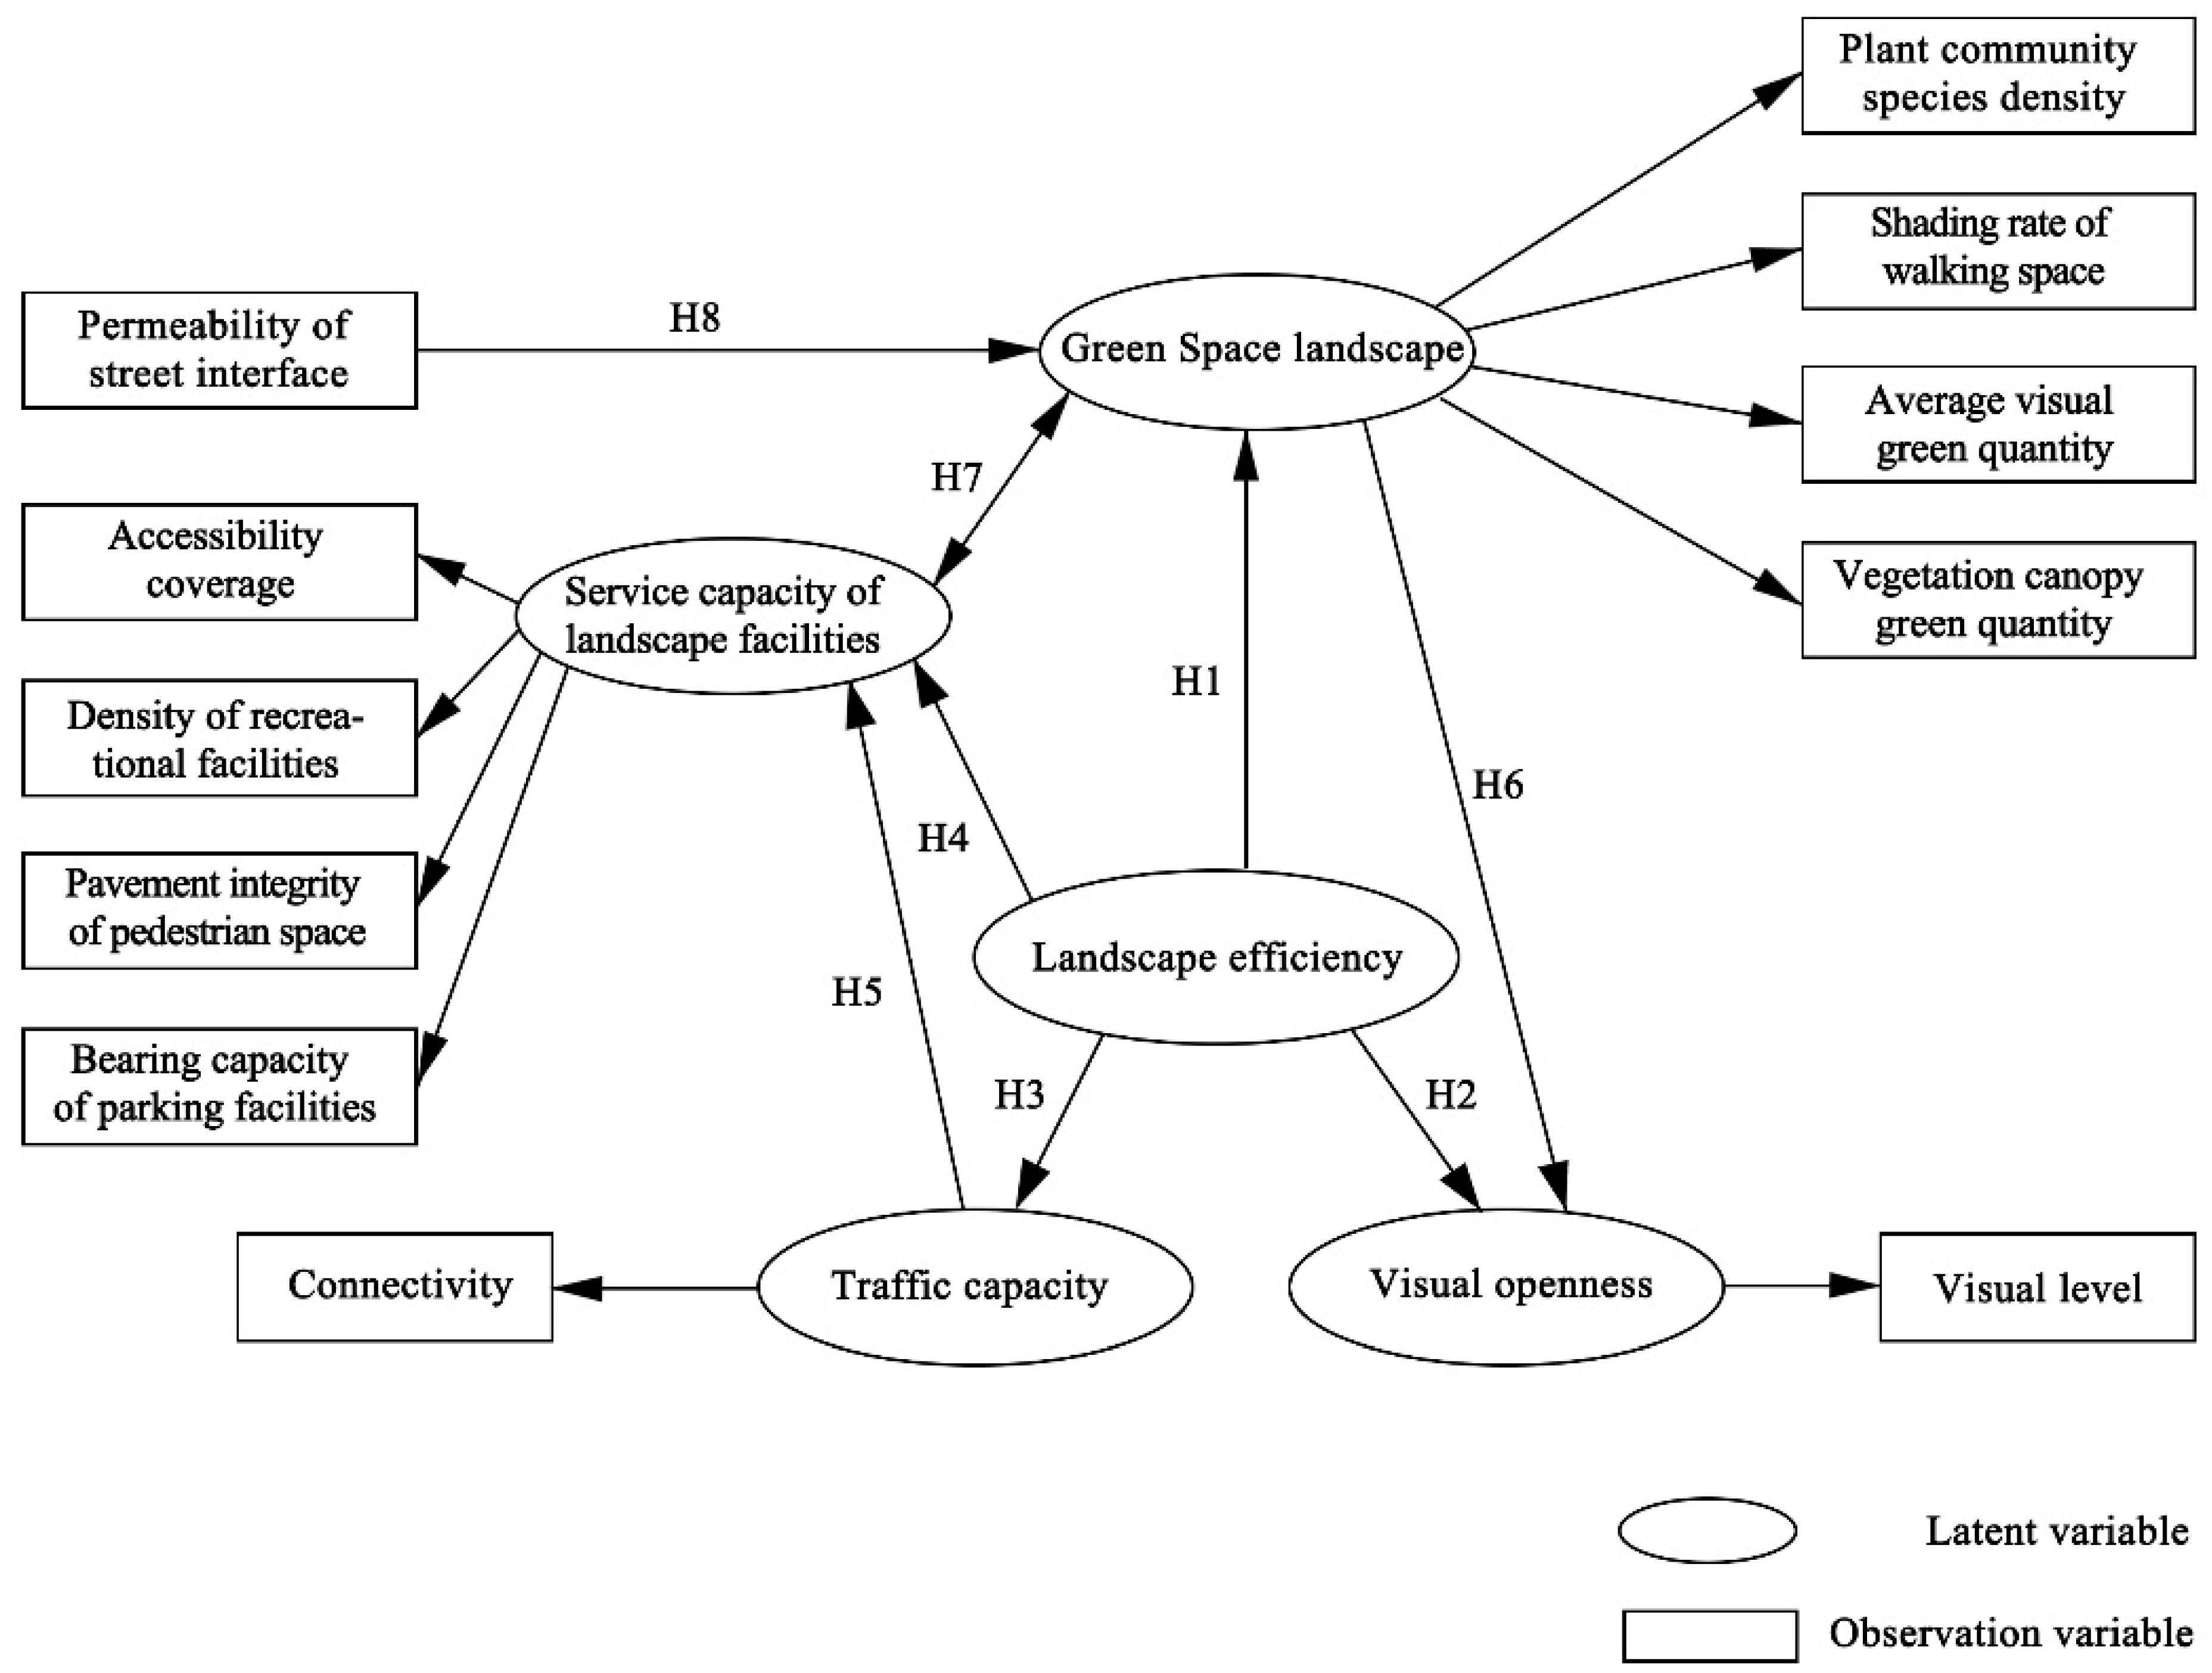
3.3. Initial Model and Theoretical Hypotheses
4. Case Study
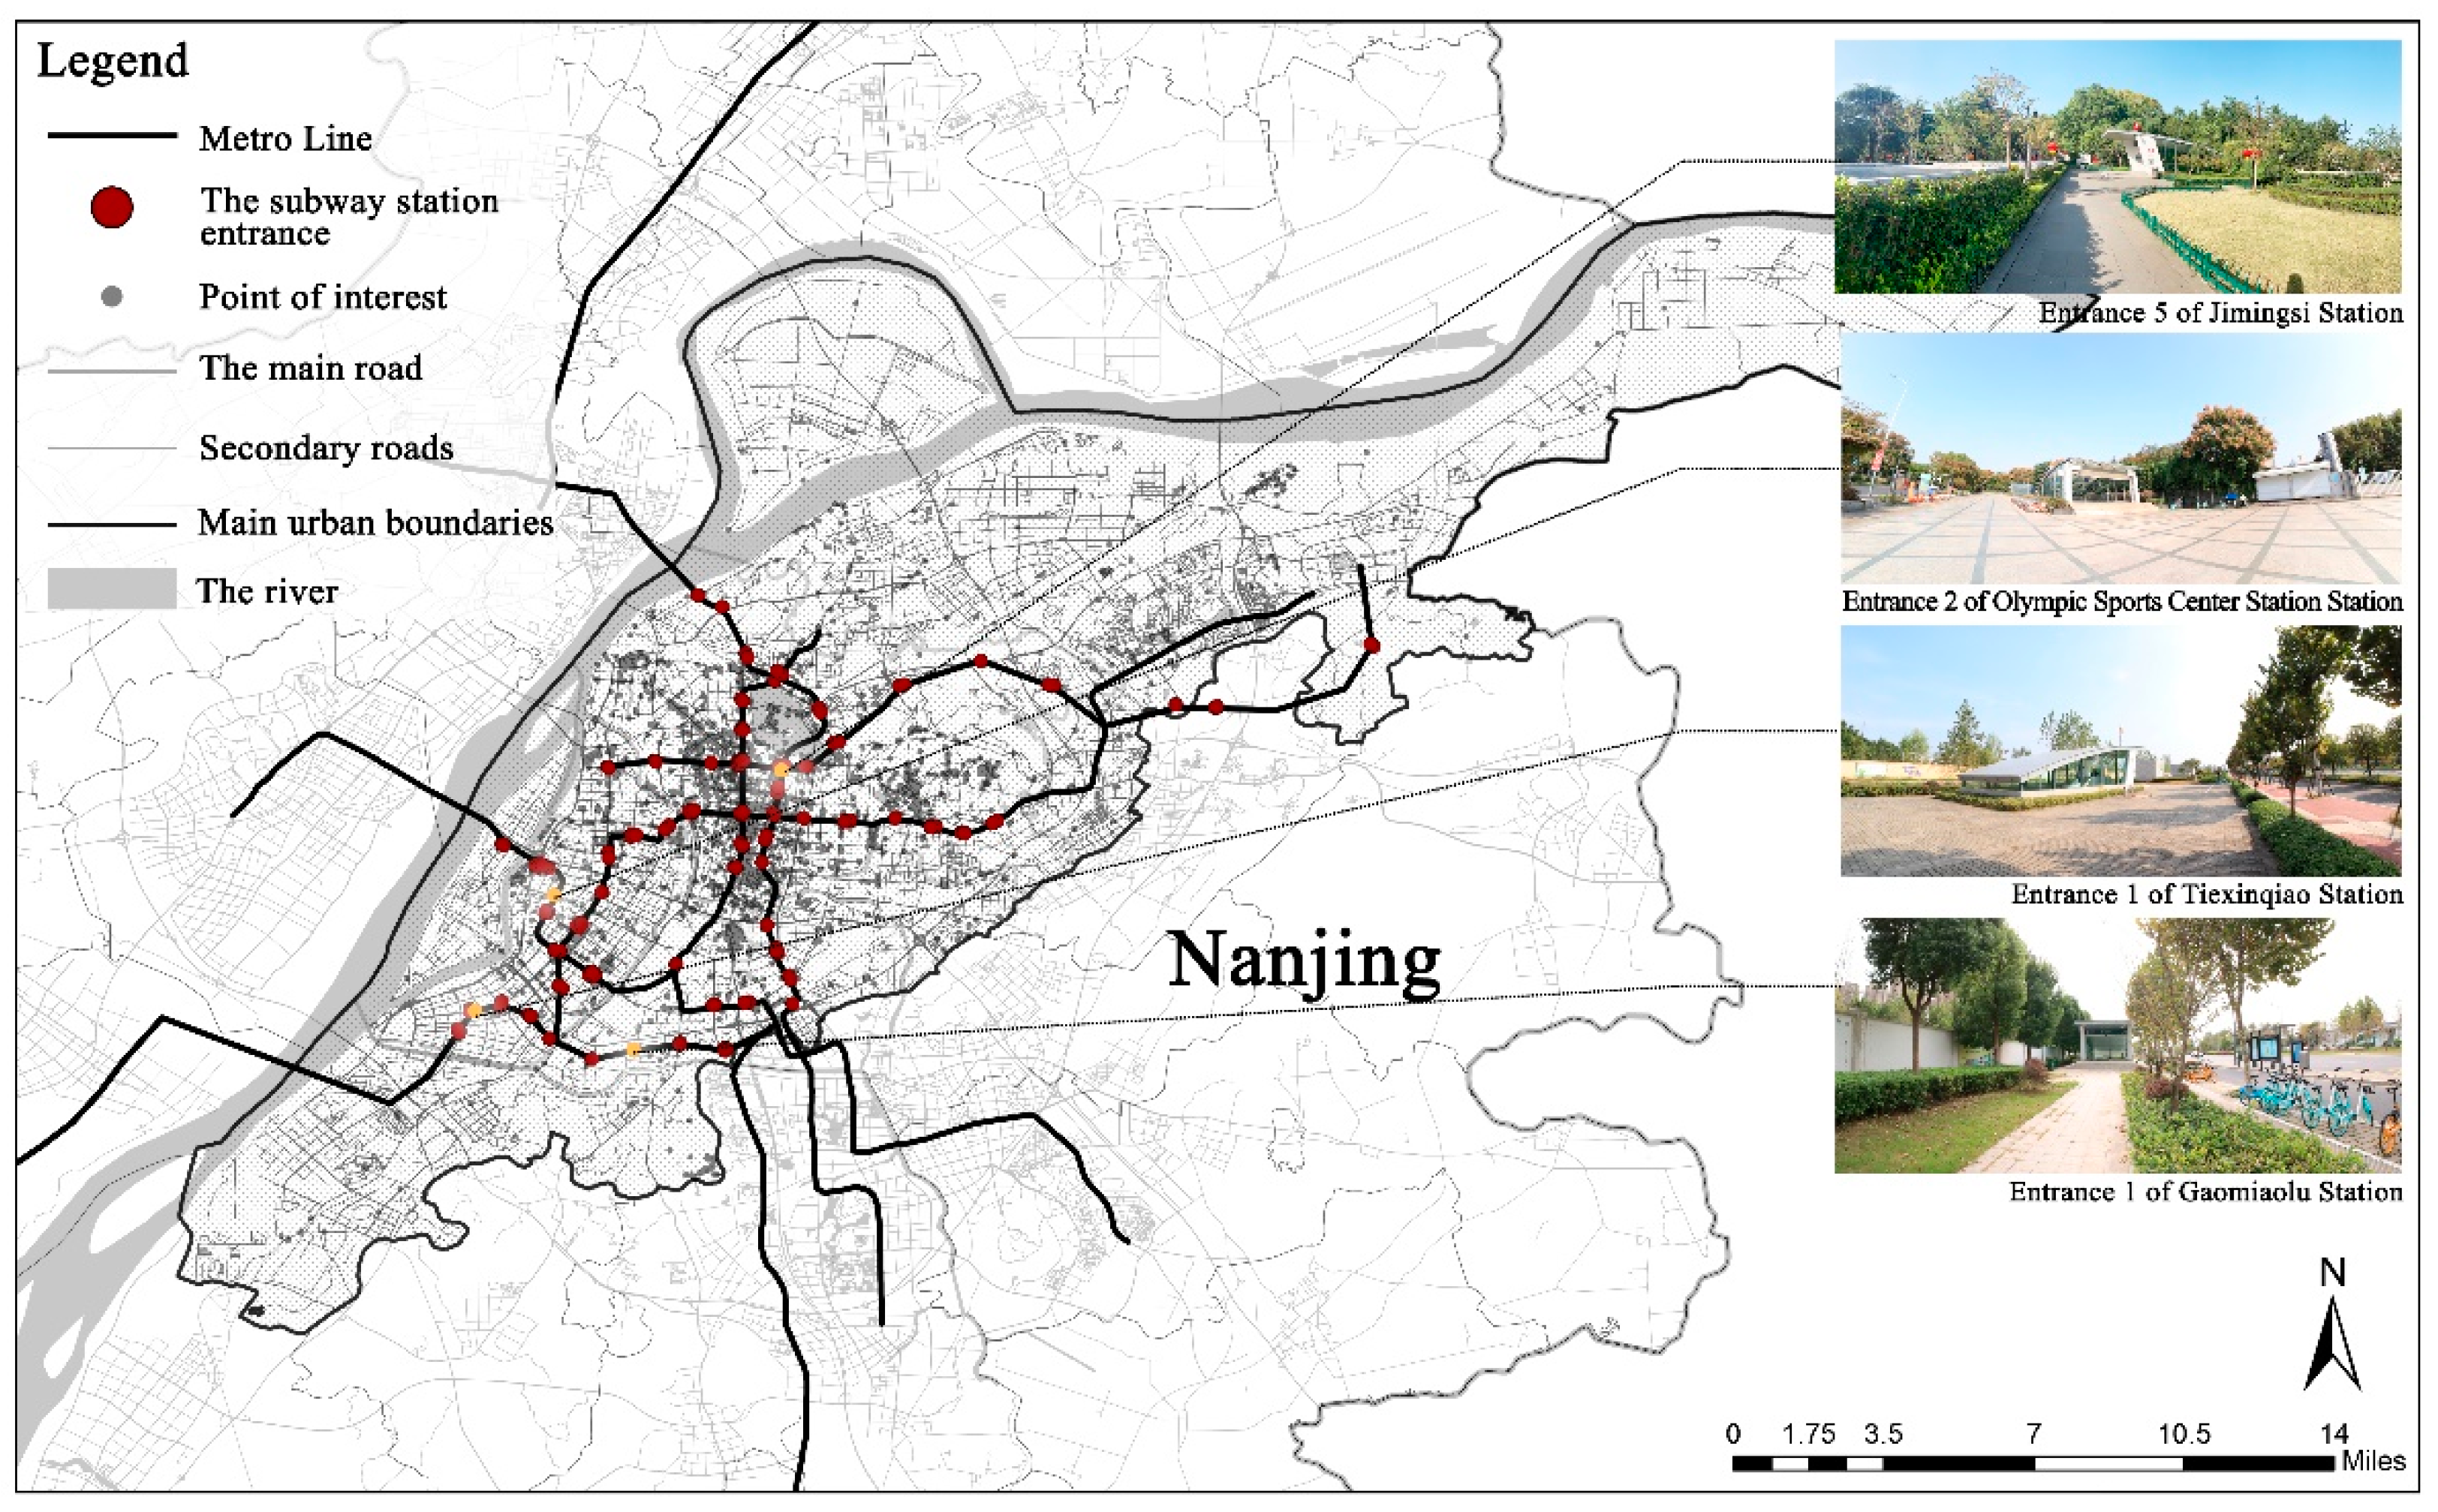
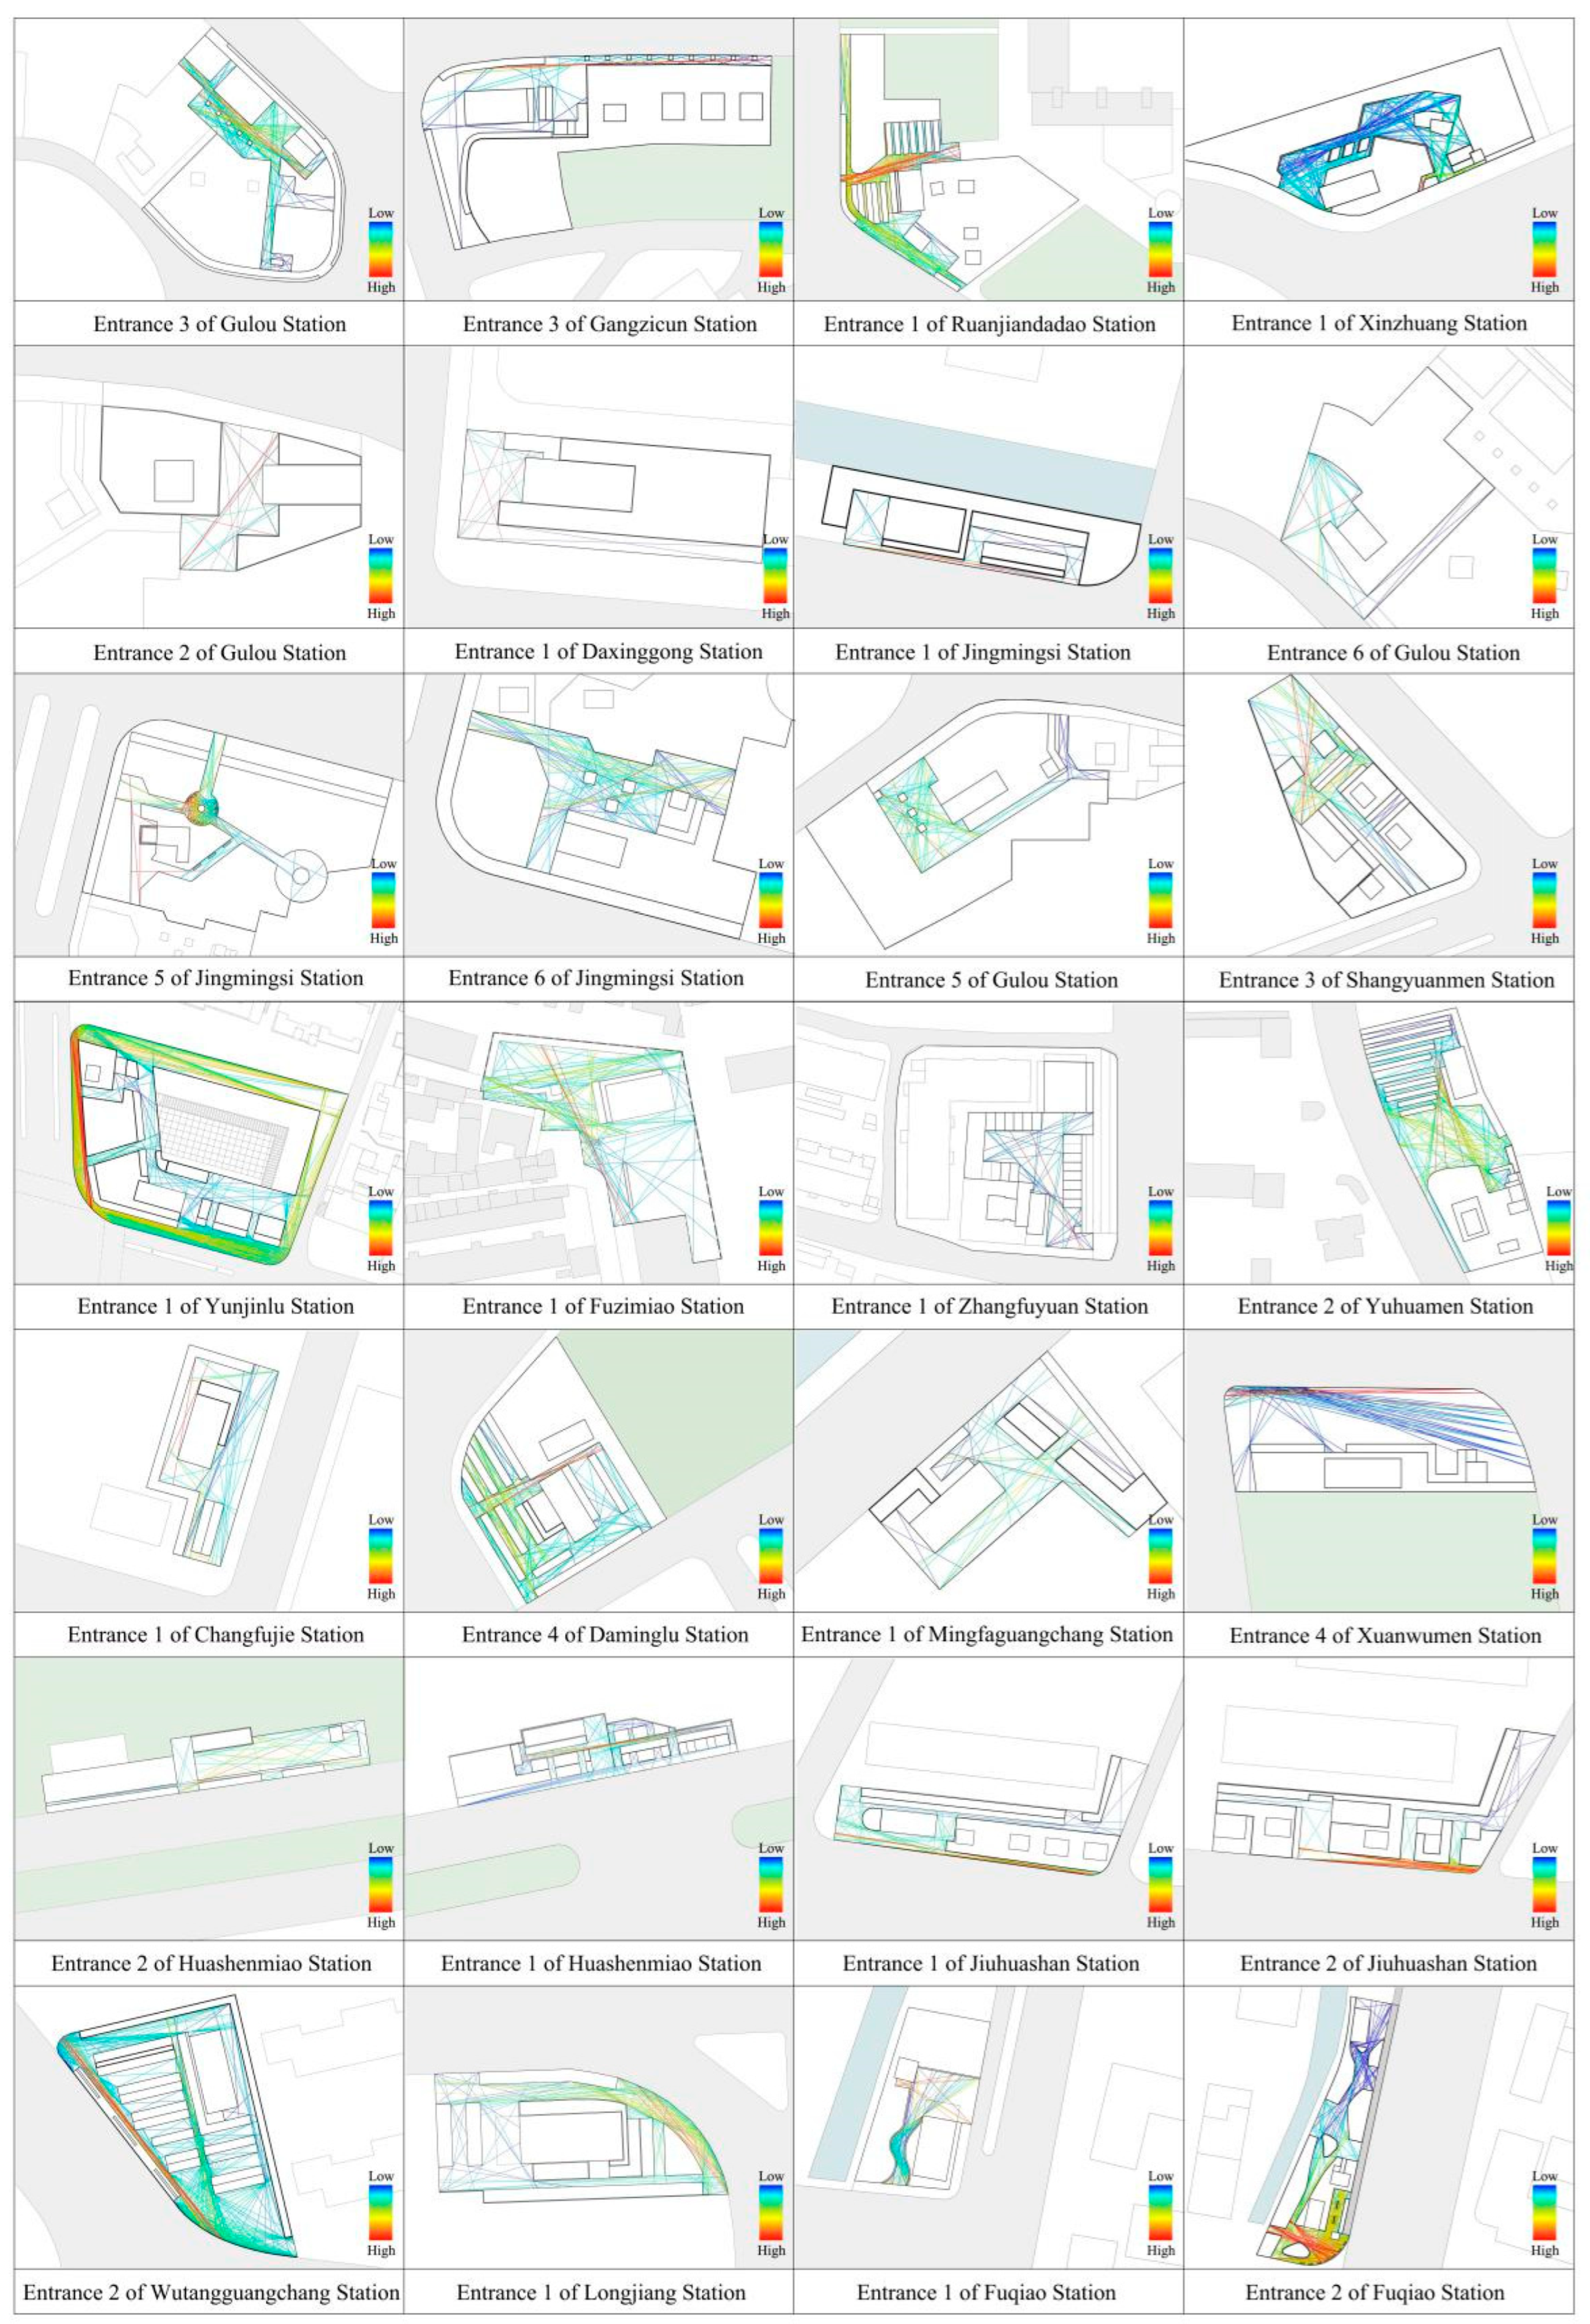
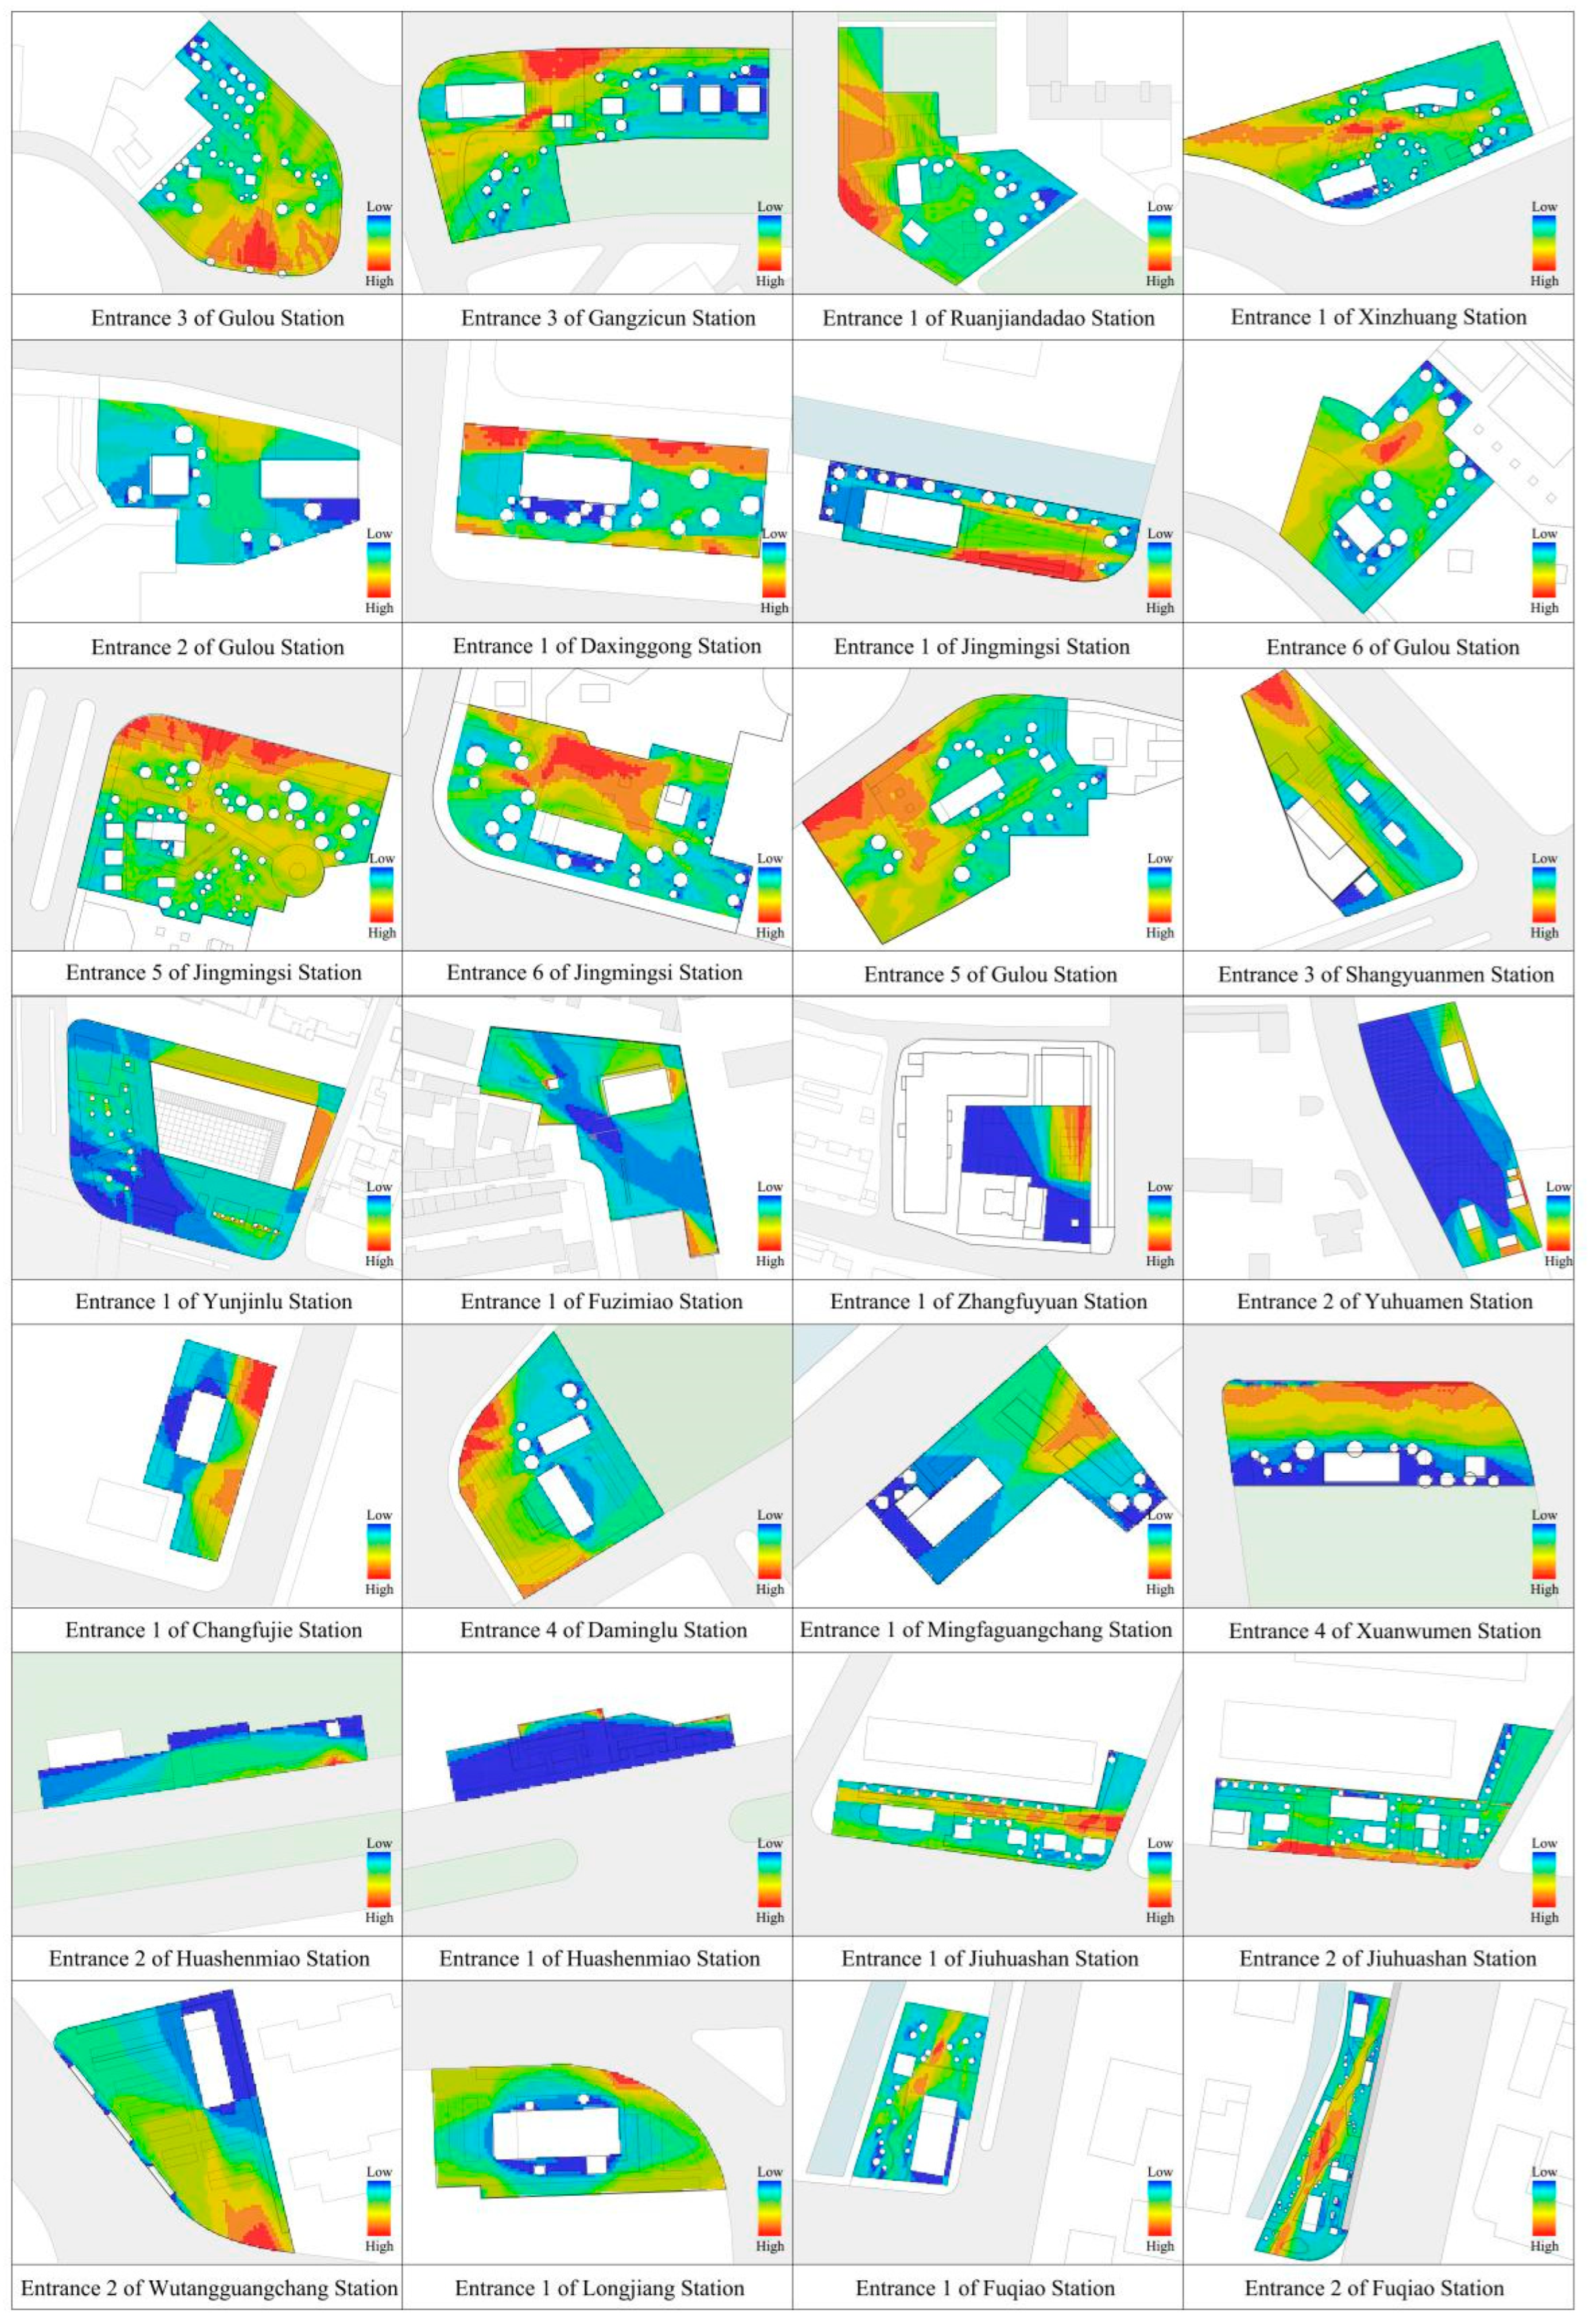
4.1. Overview of Studied Area and Sample Library
4.2. Data Collection and Pre-Processing
5. Efficiency Structural Equation Model
5.1. Factor Analysis
5.2. Parameter Estimation
5.3. Model Fitting Test
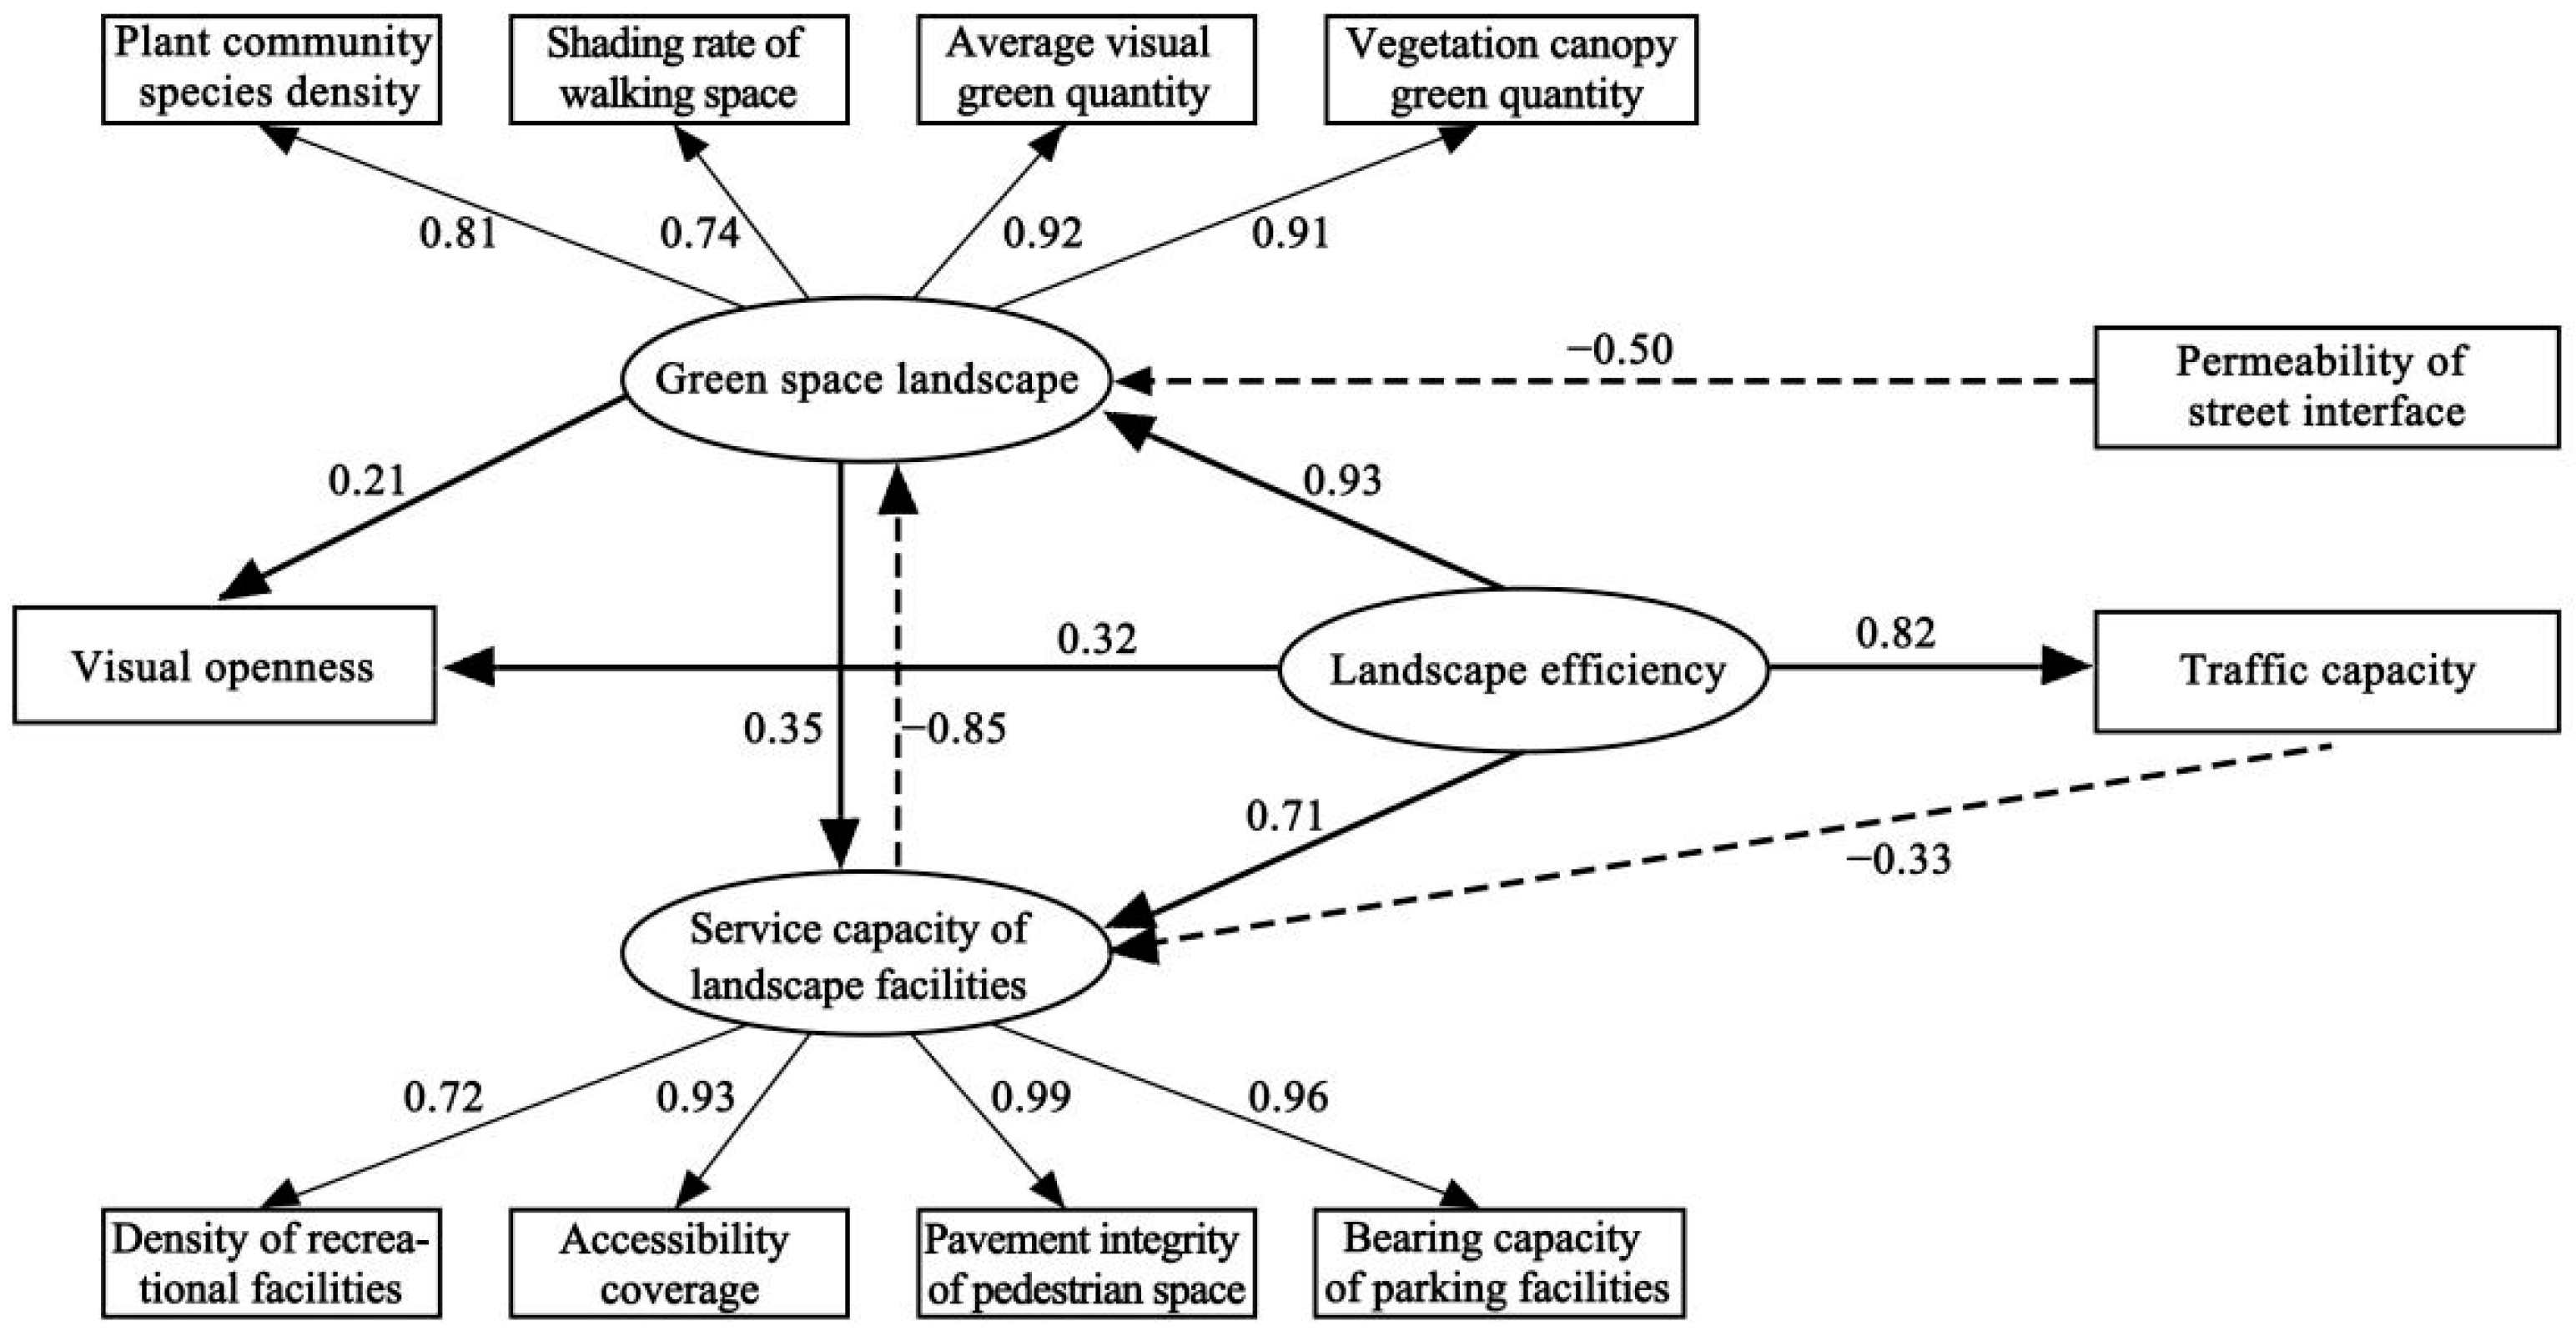
6. Analysis and Discussion
- (1)
- Initially, the results imply that the factors with significant benefits for landscape efficiency are the service capacity of landscape facilities and the landscape of green space. This finding verifies that the traffic demand is of the priority in landscape design of subway station entrances. Similarly, green space also has an overwhelming influence on landscape efficiency, which might stem from the ornamental and ecological benefits of plants. We believed that rich plant landscape construction and appropriate traffic layout can significantly improve the landscape efficiency of subway station entrances. It can help subway station entrances to enhance their spatial guidance capacity, improve tourist satisfaction, and act as a landscape hub. In contrast, the intrinsic relationship between the service capacity of landscape facilities and the landscape efficiency of subway station entrances is slightly weaker, which may be caused by the excessively simple content of landscape facilities. Although visual openness has relatively weak effects in landscape efficiency, it cannot be ignored in landscape design. The change in any latent variable may cause the related latent variable to decay or enhance, and then have a dynamic, nonlinear and complex impact on the overall efficiency of the landscape space. In conclusion, micro-environmental factors play a more significant role in landscape efficiency, because they can affect landscape space more directly.
- (2)
- There is a complex correlation mechanism among these variables, presenting different tendencies such as restriction or promotion. Any latent variable does not exist independently in the subway station entrance landscape system. There are interactions between these latent variables and one of them is weakened; other landscape elements will change simultaneously. Estimation results infer that the factor “traffic capacity” determines the landscape efficiency of the subway station entrance without the influence of space scale to some extent. Additionally, it has a certain limiting effect on the latent variable “landscape facility service capacity”. Landscape facility service capacity and green space landscape have a mutual relationship. The landscape facility service capacity has a strong negative impact on the green space landscape, while the latter can affect the former positively. In landscape design, it is necessary to comprehensively consider the specific situation and determine whether to sacrifice the service capabilities of landscape facilities appropriately. For the subway station entrances that are mainly traffic-oriented or have weak commercial influences, such as the entrances of Fuqiao Station, the focus of improving the aesthetic value and comfort of green landscapes is acceptable. Moreover, there is a weak correlation between green space landscape and visual openness. This is probably a consequence that the plants are the main three-dimensional obstacles to restrict the visual openness (namely, the visual level).
- (3)
- For the latent variable “landscape of green space”, it is noteworthy that the interface permeability has an inhibitory effect on the latent variable “green space landscape”. Therefore, it is essential to avoid the excessive complexity of the green space landscape at the subway station entrance. Meanwhile, green space design should consider the connection with the surrounding urban green space. The path analysis of latent variables further shows that the landscape of green space is a comprehensive description of observed variables (shading rate of pedestrian space, species density of plant community, green quantity of vegetation canopy and average visual green quantity). The four observed variables have a positive impact on the landscape of green space. Consequently, designers should establish a cognition that the green space is an integrity. It is difficult to optimize a specific element without seizing the coupling relationship between greening elements. For example, to improve the visual perception of plants, it is necessary to increase greening layers and enrich plant varieties. It is recommended to plant large trees in the inner activity space, then adjust the spatial allocation of plant trees and shrubs near pavements.
- (4)
- The service capacity of landscape facilities is the superposition effect of the various landscape facilities at the subway station entrance. Comparing path loading, it can be found that the service efficiency of landscape facilities has strong correlations with the pavement integrity and bearing capacity of parking facilities. Since users visit the station mainly on foot or by bike, providing excellent pavement quality and reasonably arranged bicycle parking space can ensure efficient traffic process and promote user satisfaction. However, the density of recreational facilities and accessibility coverage have weak effects on landscape facility service capacity. The field survey results also show that visitors need fewer recreation facilities. In subway station entrances with large traffic volume (such as Xinjiekou Station, Fuzimiao Station and Gulou Station); researchers suggest reducing seats to restrict the duration of resident activities and enhance the efficiency of pedestrian flow. However, for subway station entrances with less foot traffic, which are an important activity space for residents, it is inadvisable to reject the implantation of recreational functions.
7. Conclusions and Prospects
Author Contributions
Funding
Data Availability Statement
Conflicts of Interest
References
- Brown, R.D.; Corry, R.C. Evidence-based landscape architecture: The maturing of a profession. Landsc. Urban Plan. 2011, 100, 327–329. [Google Scholar] [CrossRef] [Green Version]
- Li, Z.; Cheng, Y.; Xiao, R. Electroencephalogram Experiment Based Analysis of Aesthetic Fatigue on Chinese Traditional Garden. Neuro Quantology 2018, 16, 356–362. [Google Scholar] [CrossRef] [Green Version]
- Pattacini, L. Defining public open spaces: An investigation framework to inform planning and design decision-making processes. Landsc. Res. 2021, 46, 653–672. [Google Scholar] [CrossRef]
- Schlossberg, M.; Brown, N. Comparing Transit-Oriented Development Sites by Walkability Indicators. Transp. Res. Rec. 2004, 1887, 34–42. [Google Scholar] [CrossRef]
- Doulet, J.-F.; Delpirou, A.; Delaunay, T. Taking advantage of a historic opportunity? A critical review of the literature on tod in china. J. Transp. Land Use 2017, 10, 77–92. [Google Scholar] [CrossRef]
- Luo, Y.; Mendenhall, A.; Hempel, C.; Wei, J. Assessing baseline conditions: A collaborative effort to advance landscape performance research. Socio. Ecol. Pract. Res. 2021, 3, 115–130. [Google Scholar] [CrossRef]
- Chitakira, M.; Torquebiau, E.; Ferguson, W.; Mearns, K. Analysis of landscape performance assessment by key stakeholders in a transfrontier conservation area. Landsc. Res. 2018, 43, 665–678. [Google Scholar] [CrossRef]
- Li, Z.; Cheng, Y.N.; Song, S.; He, Y.K. Research on the Space Cognitive Model of New Chinese Style Landscape Based on the Operator Optimization Genetic Algorithm. Fresenius Environ. Bull. 2019, 28, 4483–4491. [Google Scholar]
- Yoffe, H.; Plaut, P.; Grobman, Y.J. Towards sustainability evaluation of urban landscapes using big data: A case study of Israel’s architecture, engineering and construction industry. Landsc. Res. 2021, 47, 49–67. [Google Scholar] [CrossRef]
- Forthman, K.; Colaizzi, J.; Yeh, H.-W.; Kuplicki, R.; Paulus, M. Latent Variables Quantifying Neighborhood Characteristics and Their Associations with Poor Mental Health. Int. J. Environ. Res. Public Health 2021, 18, 1202. [Google Scholar] [CrossRef] [PubMed]
- Livote, E.E.; Wyka, K.E. Review of Introduction to structural equation modeling using spss and amos. Struct. Equ. Modeling 2009, 16, 556–560. [Google Scholar] [CrossRef]
- Li, Z.; Cheng, Y. Spatial Structure Optimization Model of Island Port Landscape Pattern. J. Coast. Res. 2019, 93, 404–409. [Google Scholar] [CrossRef]
- Li, L. Effects of enterprise technology on supply chain collaboration: Analysis of China-linked supply chain. Enterp. Inf. Syst. 2012, 6, 55–77. [Google Scholar] [CrossRef]
- Huang, Y.; Aguilar, F.; Yang, J.; Qin, Y.; Wen, Y. Predicting citizens’ participatory behavior in urban green space governance: Application of the extended theory of planned behavior. Urban For. Urban Green. 2021, 61, 127110. [Google Scholar] [CrossRef]
- Xie, M.; Chen, J.; Zhang, Q.; Li, H.; Fu, M.; Breuste, J. Dominant landscape indicators and their dominant areas influencing urban thermal environment based on structural equation model. Ecol. Indic. 2020, 111, 105992. [Google Scholar] [CrossRef]
- Sun, G.; Zacharias, J.; Ma, B.; Oreskovic, N.M. How do metro stations integrate with walking environments? Results from walking access within three types of built environment in Beijing. Cities 2016, 56, 91–98. [Google Scholar] [CrossRef]
- Kim, T.; Sohn, D.-W.; Choo, S. An analysis of the relationship between pedestrian traffic volumes and built environment around metro stations in Seoul. KSCE J. Civ. Eng. 2017, 21, 1443–1452. [Google Scholar] [CrossRef]
- Brovarone, E.V. Design as if bus stops mattered: Exploring the potential role of public transport stops in the urban environment. Urban Des. Int. 2020, 26, 82–96. [Google Scholar] [CrossRef]
- Li, S.; Liu, X.; Li, Z.; Wu, Z.; Yan, Z.; Chen, Y.; Gao, F. Spatial and Temporal Dynamics of Urban Expansion along the Guangzhou–Foshan Inter-City Rail Transit Corridor, China. Sustainability 2018, 10, 593. [Google Scholar] [CrossRef] [Green Version]
- Sun, G.; Webster, C.; Chiaradia, A. Objective assessment of station approach routes: Development and reliability of an audit for walking environments around metro stations in China. J. Transp. Health 2017, 4, 191–207. [Google Scholar] [CrossRef]
- Karou, S.; Hull, A. Accessibility modelling: Predicting the impact of planned transport infrastructure on accessibility patterns in Edinburgh, UK. J. Transp. Geogr. 2014, 35, 1–11. [Google Scholar] [CrossRef]
- Shirane, T.; Nakamura, K.; Masuda, N.; Kasuya, T. Study of Development of Urban Environments, Mainly in the Vicinity of Underground Stations. Procedia Eng. 2016, 165, 326–333. [Google Scholar] [CrossRef]
- Maydeu-Olivares, A.; Shi, D.X.; Rosseel, Y. Assessing fit in structural equation models: A monte-carlo evaluation of rmsea versus srmr confidence intervals and tests of close fit. Struct. Equ. Modeling 2018, 25, 389–402. [Google Scholar] [CrossRef]
- Finch, W.H. Modeling Nonlinear Structural Equation Models: A Comparison of the Two-Stage Generalized Additive Models and the Finite Mixture Structural Equation Model. Struct. Equ. Modeling 2015, 22, 60–75. [Google Scholar] [CrossRef]
- Curl, A.; Mason, P. Neighbourhood perceptions and older adults’ wellbeing: Does walking explain the relationship in deprived urban communities? Transp. Res. Part A Policy Pract. 2018, 123, 119–129. [Google Scholar] [CrossRef] [Green Version]
- Grünewald, C.; Schleuning, M.; Böhning-Gaese, K. Biodiversity, scenery and infrastructure: Factors driving wildlife tourism in an African savannah national park. Biol. Conserv. 2016, 201, 60–68. [Google Scholar] [CrossRef]
- Capmourteres, V.; Anand, M. Assessing ecological integrity: A multi-scale structural and functional approach using Structural Equation Modeling. Ecol. Indic. 2016, 71, 258–269. [Google Scholar] [CrossRef]
- Hong, J.; Jeon, J.Y. Influence of urban contexts on soundscape perceptions: A structural equation modeling approach. Landsc. Urban Plan. 2015, 141, 78–87. [Google Scholar] [CrossRef]
- Li, Z.; Han, X.; Lin, X.S.; Lu, X.Y. Quantitative analysis of landscape efficacy based on structural equation modelling: Empirical evidence from new Chinese style commercial streets. Alex. Eng. J. 2020, 60, 261–271. [Google Scholar] [CrossRef]
- Amini, A.; Alimohammadlou, M. Toward equation structural modeling: An integration of interpretive structural modeling and structural equation modeling. J. Manag. Anal. 2021, 8, 693–714. [Google Scholar] [CrossRef]
- Byrne, B.M.; Erlbaums, L. Structural Equation Modeling with AMOS: Basic Concepts, Applications, and Programming; Routledge: London, UK, 2009. [Google Scholar]
- Steiger, E.; Westerholt, R.; Resch, B.; Zipf, A. Twitter as an indicator for whereabouts of people? Correlating Twitter with UK census data. Comput. Environ. Urban Syst. 2015, 54, 255–265. [Google Scholar] [CrossRef]
- Li, X.J.; Zhang, C.R.; Li, W.D.; Ricard, R.; Meng, Q.Y. Assessing street-level urban greenery using Google Street View and amodified green view index. Urban For. Urban Green. 2015, 14, 675–685. [Google Scholar] [CrossRef]
- Said, M.; Abou-Zeid, M.; Kaysi, I. Modeling Satisfaction with the Walking Environment: The Case of an Urban University Neighborhood in a Developing Country. J. Urban Plan. Dev. 2017, 143, 05016009. [Google Scholar] [CrossRef] [Green Version]
- Wang, Y.; Kotze, D.J.; Vierikko, K.; Niemelä, J. What makes urban greenspace unique–Relationships between citizens’ perceptions on unique urban nature, biodiversity and environmental factors. Urban For. Urban Green. 2019, 42, 1–9. [Google Scholar] [CrossRef]
- Nicolas, C.; Kim, J.; Chi, S. Understanding the Influences of Urban-Specific Contexts for Smart City Development Using Structural Equation Modeling. J. Urban Plan. Dev. 2021, 147, 04021010. [Google Scholar] [CrossRef]
- Tahmasbi, B.; Haghshenas, H. Public transport accessibility measure based on weighted door to door travel time. Comput. Environ. Urban Syst. 2019, 76, 163–177. [Google Scholar] [CrossRef]
- Leslie, E.; Coffee, N.; Frank, L.; Owen, N.; Bauman, A.; Hugo, G. Walkability of local communities: Using geographic information systems to objectively assess relevant environmental attributes. Health Place 2007, 13, 111–122. [Google Scholar] [CrossRef]
- Ewing, R.; Handy, S. Measuring the Unmeasurable: Urban Design Qualities Related to Walkability. J. Urban Des. 2009, 14, 65–84. [Google Scholar] [CrossRef]
- El Aziz, N.A.A. Space syntax as a tool to measure safety in small urban parks—a case study of rod el farag park in cairo, egypt. Landsc. Arch. Front. 2020, 8, 42–59. [Google Scholar] [CrossRef]
- Hong, B.; Hu, L.H.; Qu, Y.J. Numerical Simulation Studies of Plant Communities’ Effects on Outdoor Wind Environment in Residential District. Adv. Mater. Res. 2013, 610–613, 1218–1222. [Google Scholar] [CrossRef]
- Morakinyo, T.E.; Lam, Y.F. Simulation study on the impact of tree-configuration, planting pattern and wind condition on street-canyon’s micro-climate and thermal comfort. Build. Environ. 2016, 103, 262–275. [Google Scholar] [CrossRef]
- Wolf, E.J.; Harrington, K.M.; Clark, S.L.; Miller, M.W. Sample size requirements for structural equation models: An evaluation of power, bias, and solution propriety. Educ. Psychol. Meas. 2013, 73, 913–934. [Google Scholar] [CrossRef] [PubMed]
- Tian, Y.; Hong, B.; Zhang, Z.; Wu, S.; Yuan, T. Factors influencing resident and tourist outdoor thermal comfort: A comparative study in China’s cold region. Sci. Total Environ. 2021, 808, 152079. [Google Scholar] [CrossRef]
- Devellis, R.F. Scale Development: Theory and Applications; Sage Publications: Thousand Oaks, CA, USA, 2003. [Google Scholar]
- Bagozzi, R.P.; Yi, Y. On the evaluation of structural equation models. J. Acad. Mark. Sci. 1988, 16, 74–94. [Google Scholar] [CrossRef]
- Browne, M.W.; Du Toit, S. Automated Fitting of Nonstandard Models. Multivar. Behav. Res. 1992, 27, 269–300. [Google Scholar] [CrossRef] [PubMed]
- Bentler, P.M. On the fit of models to covariances and methodology to the Bulletin. Psychol. Bull. 1992, 112, 400–404. [Google Scholar] [CrossRef]


| Indicator | Factor | Explanation | Method | Unit | |
|---|---|---|---|---|---|
| Evaluate Factors | Traffic capacity | Connectivity | It reflects the connection degree among different paths. Pedestrian usually enter a space with higher connectivity. | CAD; Depthmap | / |
| Visual openness | Visual level | It reflects the visual conditions of any target point in the landscape space. The higher the visual level, the easier the space is to be observed and perceived. | CAD; Depthmap; field survey | / | |
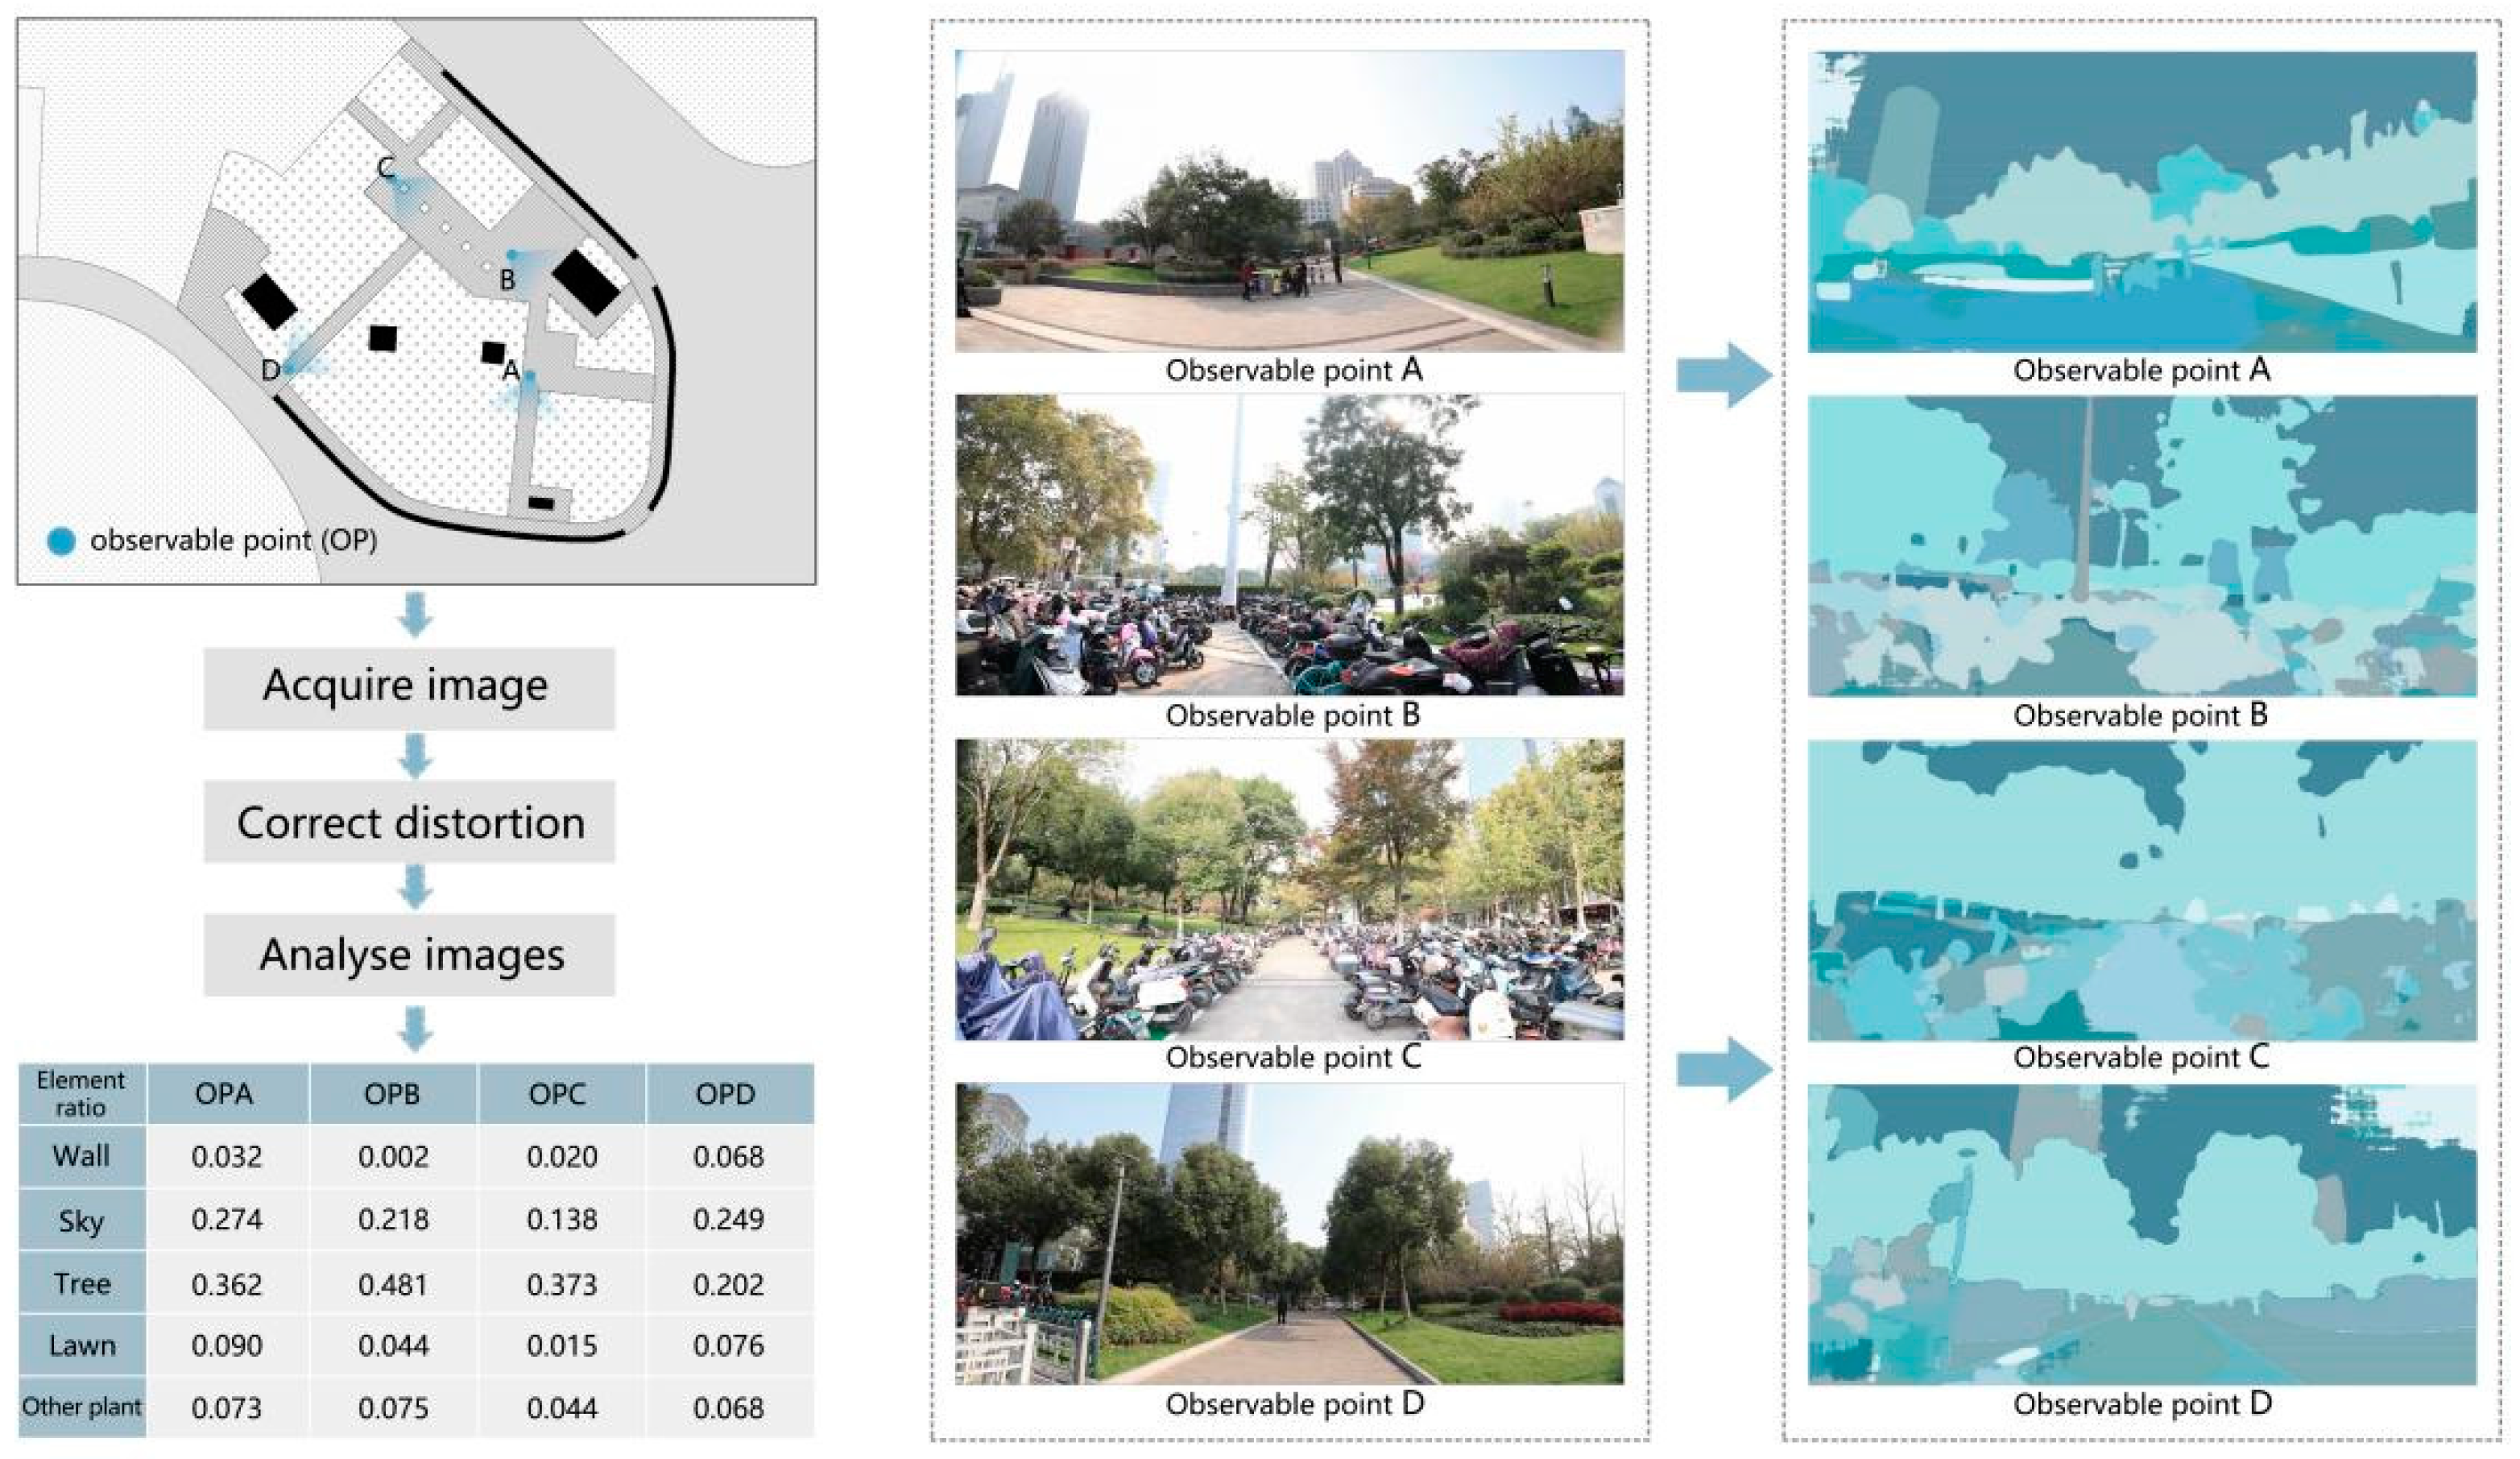
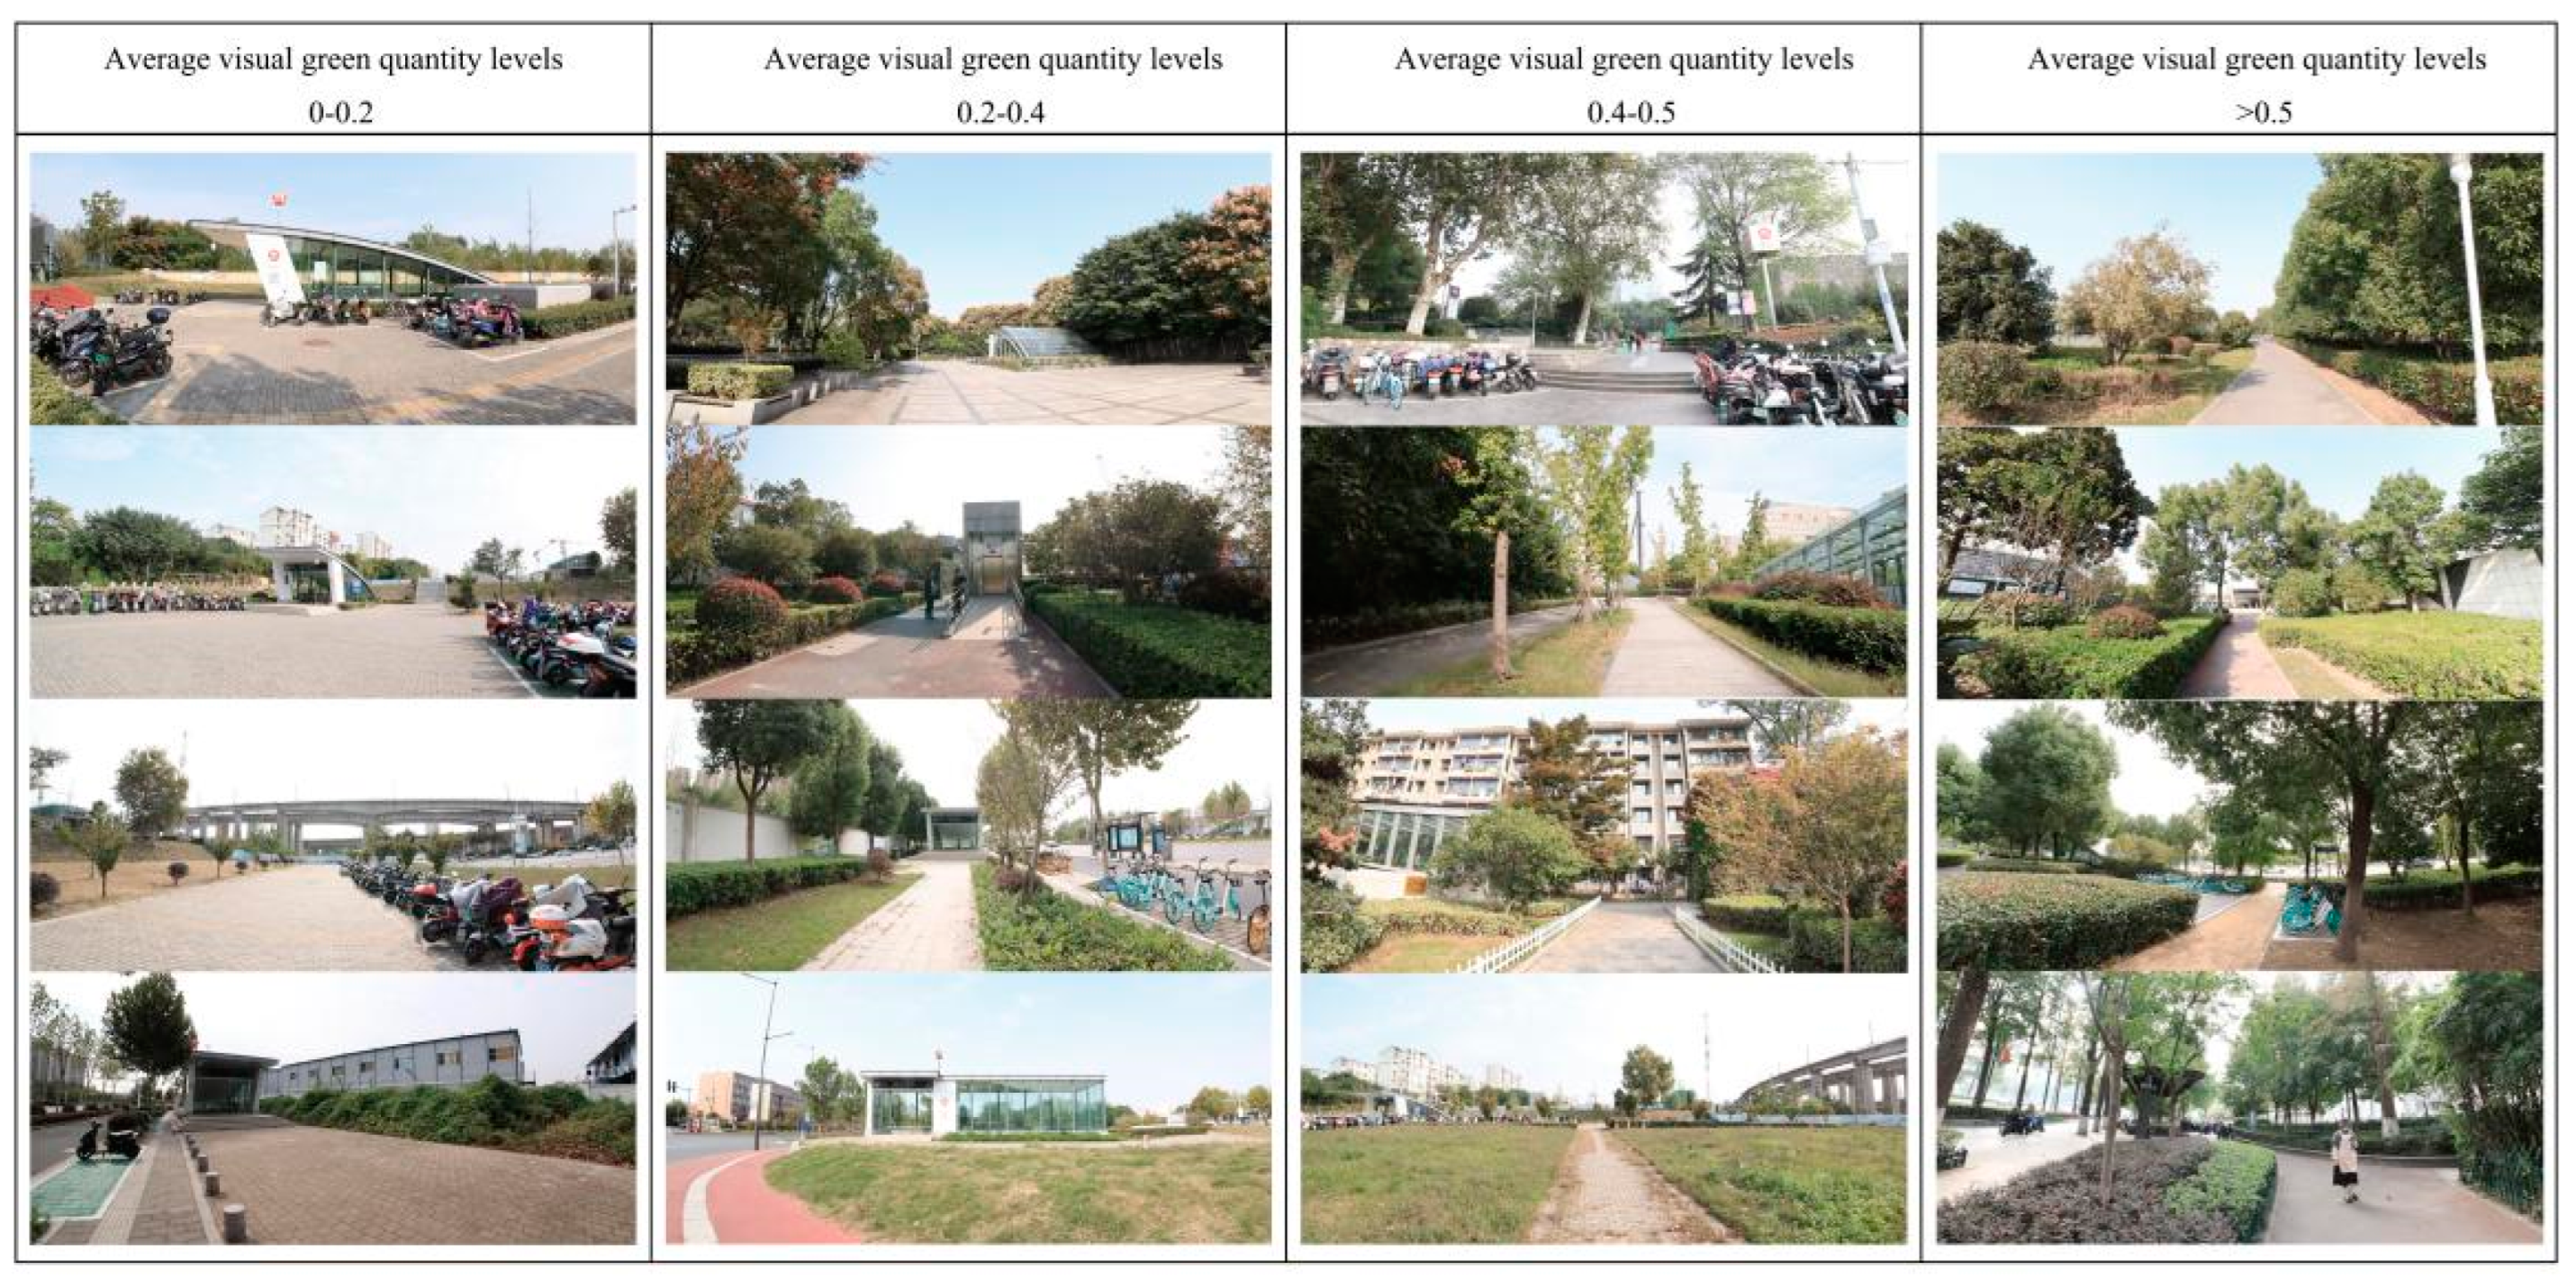
| Green space landscape | Average visual green quantity | It reflects the average level of green quantity perceived by visitors when entering the subway station entrances. | Photoshop; semantic segmentation | / | |
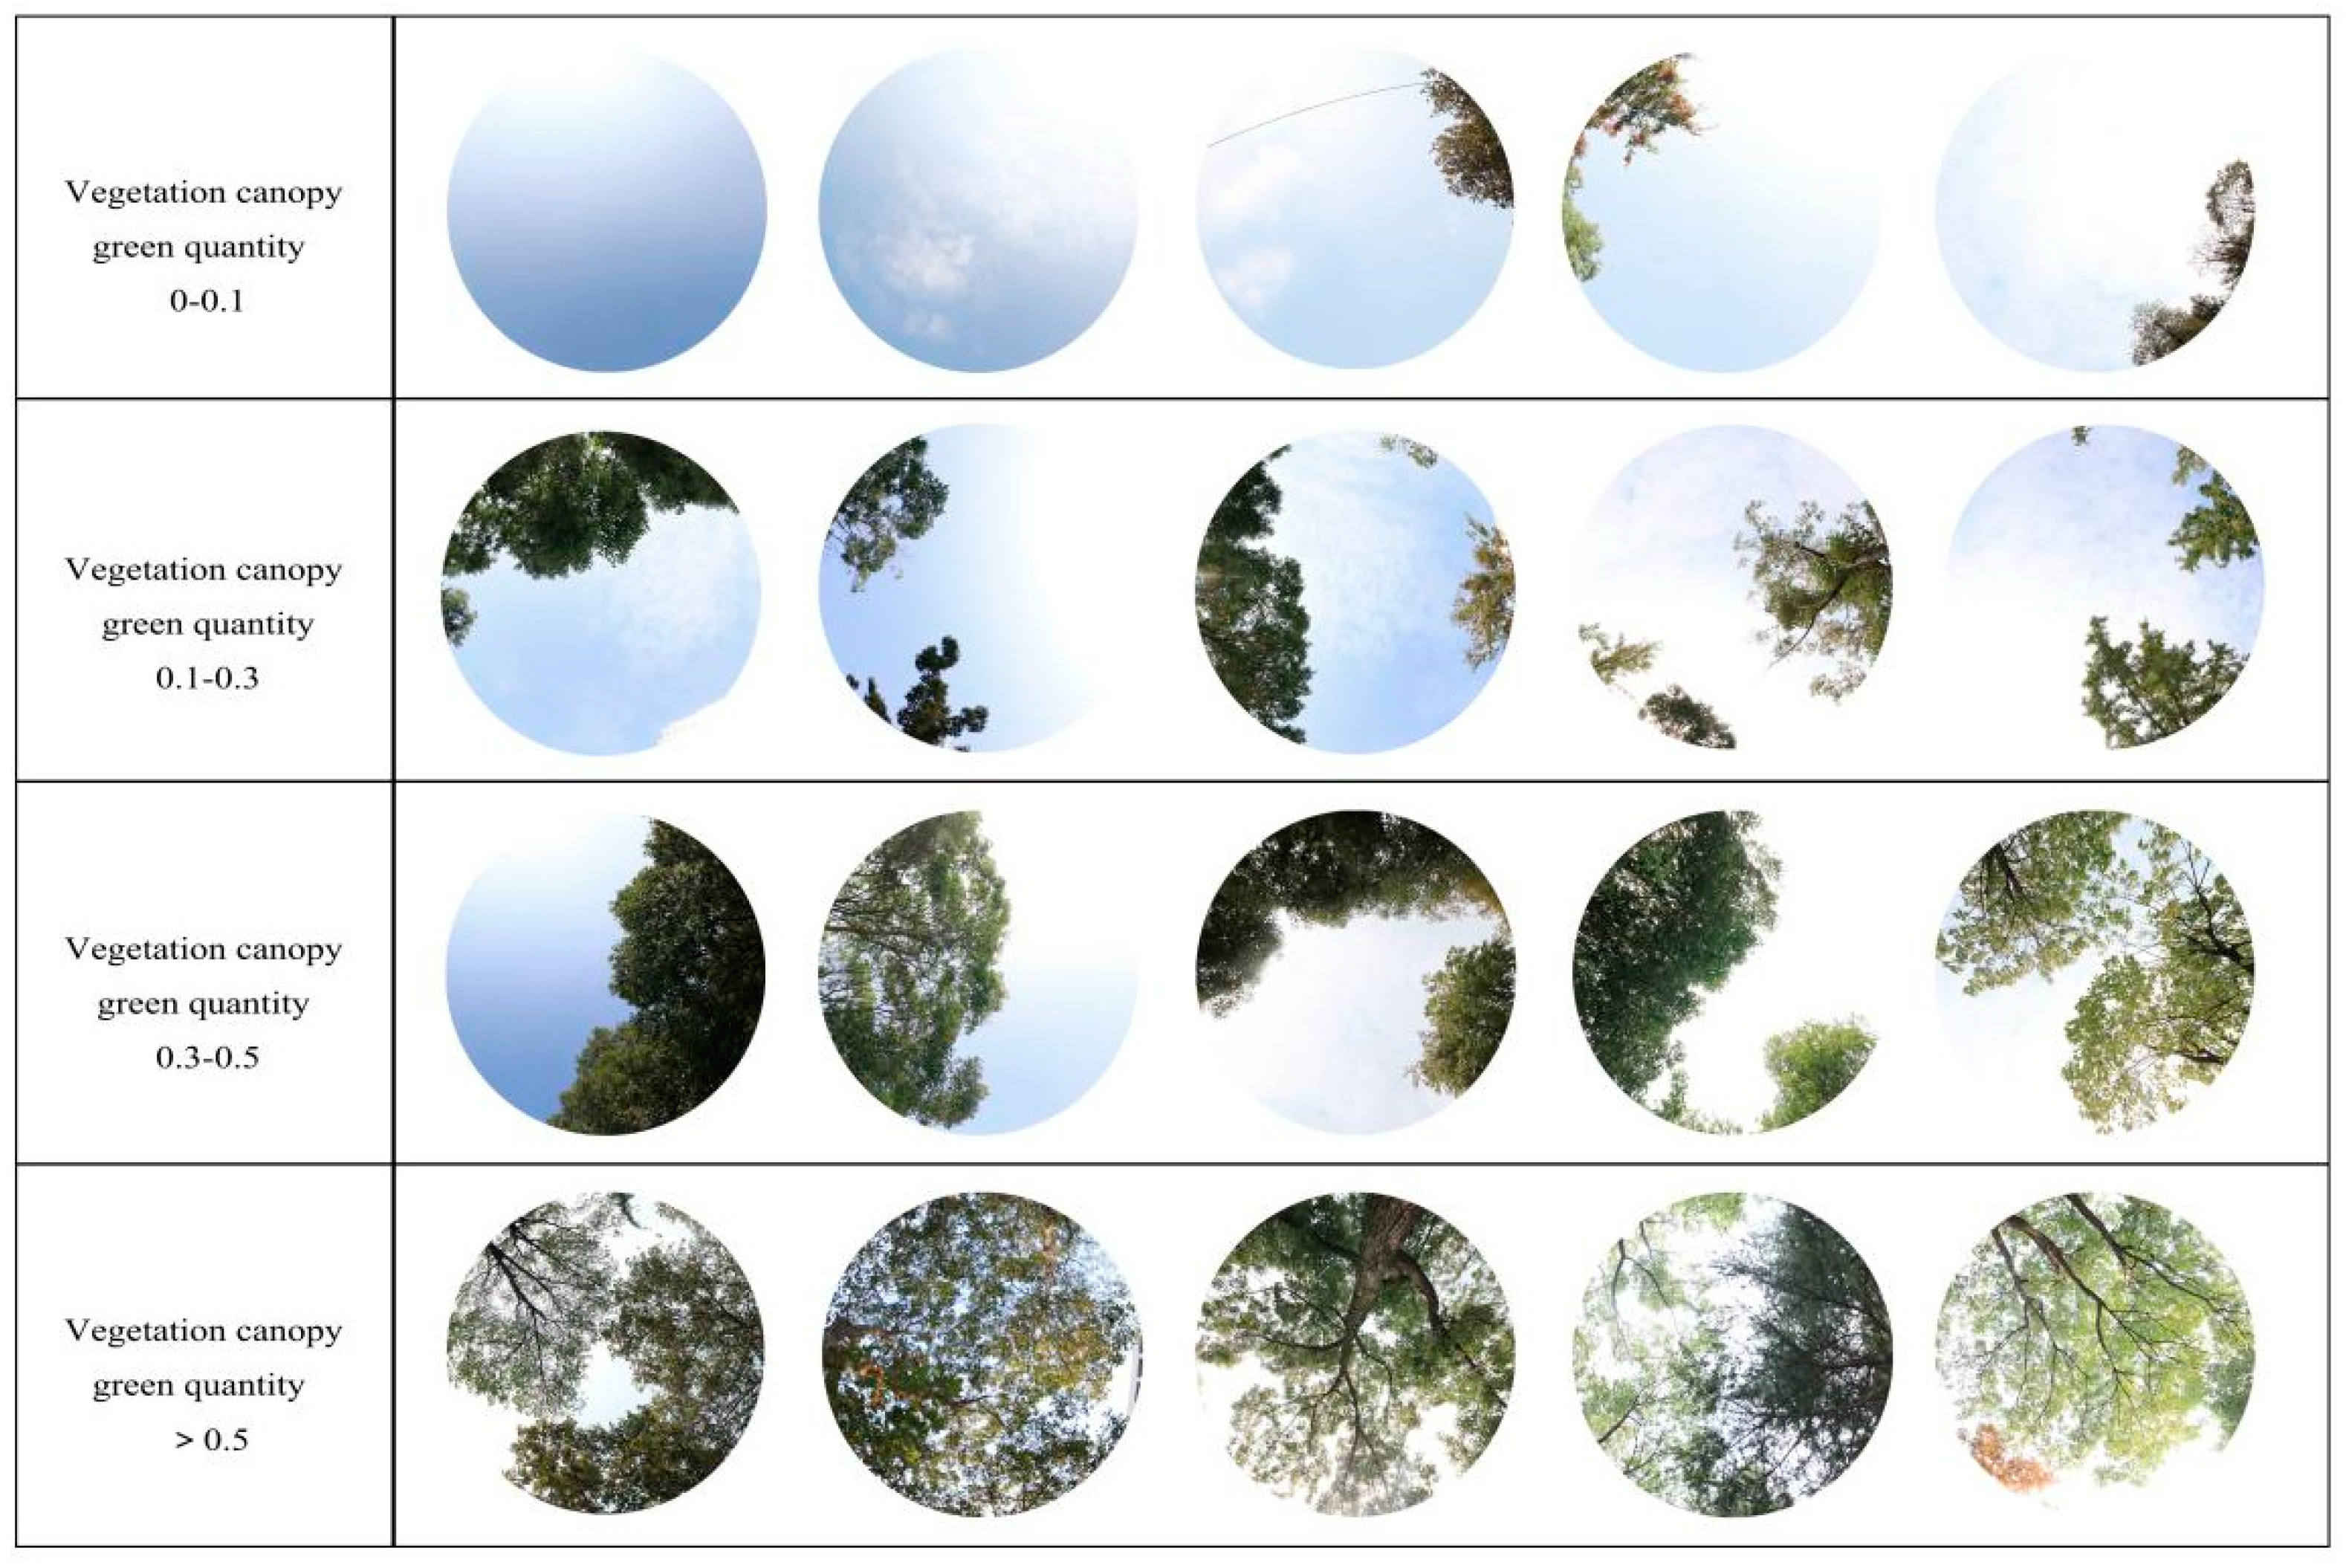
| Vegetation canopy green quantity | It reflects the average level of vegetation canopy structure in the walking environment of subway station entrances. | Photoshop; semantic segmentation | / | ||
| Plant community species density | It reflects the richness of plant species on the site. (i.e., the ratio of plant community species number to the site area.) | / | Species/m2 | ||
| Shading rate of walking space | It reflects the shading capacity of plants, indicating the ability of trees to provide a comfortable thermal environment. | Field survey; CAD | / | ||
| Service capacity of landscape facilities | Density of recreational facilities | It reflects the capacity of recreational activities. (i.e., the ratio of the number of seats to the site area.) | Field survey; area measurement | pieces/m2 | |
| Accessibility coverage | It reflects matching degree between barrier free facilities available and barrier free facilities required. | Area measurement | / | ||
| Pavement integrity of pedestrian space | It reflects the construction quality of walking space. The higher pavement integrity is, the higher the pedestrian satisfactory might be. | Field survey | / | ||
| Bearing capacity of parking facilities | It reflects the visiting and usage demand of residents. (i.e., ratio of the number of non-motor vehicle parking spaces to the site area.) | Field survey; area measuremen; | pcs/m2 | ||
| Limiting factor | External environment | Permeability of street interface | It reflects the spatial recognition of the entrance environments from the street interface. | CAD | / |
| Observation Variable | Calculation Formula | Explanation | Data Collection Method | Data Source/Instrument |
|---|---|---|---|---|
| Connectivity | RAA is the global depth of the axis model. |
| Nanjing Municipal Bureau of Land and Resources | |
| Visual level | G represents the total number of grids. For any target point S, all observation points that can be seen are “M”. |
| Nanjing Municipal Bureau of Land and Resources Tape measure | |
| Average visual green quantity | Pg represents the amount of green pixels in the “ith” panorama, and Pt represents the total number of pixels. |
| Wide-angle lens; SLR camera | |
| Vegetation canopy green quantity | Sg represents the amount of green space pixels in the “ith” photo, and St represents the total number of pixels. |
| Fisheye lens; SLR camera | |
| Plant community species density | S represents plant species and A is the sample area. | Calculate the varieties of plants and introduce the number into the formula. | / | |
| Shading rate of walking space | Sts is the projection area of trees in the pedestrian space, and Sw is the total area of the pedestrian space. |
| / | |
| Density of recreational facilities | Ns is the number of seats, and S is the space unit area. | Investigate the number of seats, and introduce it into the formula for calculation | / | |
| Accessibility coverage | AAna represents the quantity of facilities available, and SAna is the quantity required. | Classify and count the number of barrier-free facilities such as ramps, escalators, straight ladders, blind lanes and signs through field research. | / | |
| Pavement integrity of pedestrian space | Onl is the total area of paving space, and Inl is the total area of paving space in flaws. | Estimate or measure the complete paving area of the pedestrian space (excluding damage, cracks, warping, breakage, etc.) | Tape measure | |
| Bearing capacity of parking facilities | Snmv is the parking area of non-motor vehicles, and S represents the total area of the site. | Measure area of parking facilities. The number of parking space is estimated according to 1.2 m2/a single parking space. | Tape measure | |
| Permeability of street interface | t is the penetration of interface i, a is the area of interface i, and S is the total vertical interface area. | Parallel to the road, take the street view of subway station entrances. Measure the areas of different vertical interfaces. | SLR camera |
| Latent Variable | Observation Variable | Factor Loading | Cronbach A Coefficient | Average Variance Extracted | Construct Reliability |
|---|---|---|---|---|---|
| Service capacity of landscape facilities | Density of recreational facilities | 0.654 | 0.942 | 0.7682 | 0.9285 |
| Accessibility coverage | 0.933 | ||||
| Pavement integrity of pedestrian space | 0.940 | ||||
| Bearing capacity of parking facilities | 0.944 | ||||
| Green space landscape | Plant community species density | 0.754 | 0.918 | 0.6609 | 0.886 |
| Shading rate of walking space | 0.844 | ||||
| Average visual green quantity | 0.785 | ||||
| Vegetation canopy green quantity | 0.864 |
| Absolute Fit Index | Value Added Adaptation Index | Simple Adaptation Index | |||||
|---|---|---|---|---|---|---|---|
| Adaptation parameter | CFI | RMSEA | NFI | IFI | PNFI | NC value | PCFI |
| Adaptation threshold | >0.9 | <0.08 | >0.9 | >0.9 | >0.5 | 1 < NC < 3 | >0.5 |
| Research results | 0.927 | 0.075 | 0.851 | 0.929 | 0.674 | 1.770 | 0.674 |
Publisher’s Note: MDPI stays neutral with regard to jurisdictional claims in published maps and institutional affiliations. |
© 2022 by the authors. Licensee MDPI, Basel, Switzerland. This article is an open access article distributed under the terms and conditions of the Creative Commons Attribution (CC BY) license (https://creativecommons.org/licenses/by/4.0/).
Share and Cite
Li, Z.; Lin, X.; Han, X.; Lu, X.; Zhao, H. Landscape Efficiency Assessment of Urban Subway Station Entrance Based on Structural Equation Model: Case Study of Main Urban Area of Nanjing. Buildings 2022, 12, 294. https://doi.org/10.3390/buildings12030294
Li Z, Lin X, Han X, Lu X, Zhao H. Landscape Efficiency Assessment of Urban Subway Station Entrance Based on Structural Equation Model: Case Study of Main Urban Area of Nanjing. Buildings. 2022; 12(3):294. https://doi.org/10.3390/buildings12030294
Chicago/Turabian StyleLi, Zhe, Xiaoshan Lin, Xiao Han, Xinyi Lu, and Hengyi Zhao. 2022. "Landscape Efficiency Assessment of Urban Subway Station Entrance Based on Structural Equation Model: Case Study of Main Urban Area of Nanjing" Buildings 12, no. 3: 294. https://doi.org/10.3390/buildings12030294