1. Introduction
Since the 21st century, the increase in carbon emissions has led to intensification of the greenhouse effect and an increase in the frequency of extreme weather and climate events. The main reason is that heat wave events are most likely to occur under conditions of high temperature and humidity. Urbanization has increased carbon emissions, exacerbating heat waves [
1]. The average temperature in 23 urban areas increased by 4 °C in the past 100 years in Tokyo, Japan. Due to the influence of high-density urban areas, the temperature difference within 3 km increased to 5.5 °C in the Kowloon district in Hong Kong, China [
2]. Frequent high-temperature weather seriously threatens people’s life and health, causing direct and indirect harm to people. High temperatures may increase the burden on the cardiovascular system and affect renal function, neural activity, motor coordination, etc. [
3]. For example, the Chicago heat wave event caused about 700 deaths due to heatstroke in 1995 [
4], and the European heat wave event caused 506 deaths in Paris and 315 deaths in London in 2003 [
5]. On the other hand, high temperatures indirectly threaten people’s health. Elevated temperatures create suitable conditions for the parasitism, reproduction, and transmission of pathogens, increasing the pathogenicity of pathogens, and resulting in an increase in the prevalence and infecting range of infectious diseases [
6]. The negative impacts of high temperatures also include poor thermal comfort, high economic loss, and high energy demands, etc. [
7].
In recent years, high-temperature weather has been continuously investigated by various fields. Foreign scholars have mainly focused on the impact of heat exposure on human behavior and health. Shinya Yasumoto et al. built a dynamic heat exposure model based on people’s daily travel data, concluding that the exposure level of people in urban areas was significantly different from the exposure level of people in suburbs, and proposed new remedial measures for the urban heat island [
8]. Park Chae Yeon et al. compared the spatial layouts of heat exposure that was fatal to the elderly in Seoul and Tokyo in East Asia according to the current weather (2006–2015) and the future weather (2040–2090), and proposed strategies to adapt to different spatial layouts [
9]. Yin Yanzhe et al. collected different heat exposure cases from urban areas based on human activities, dynamically monitored high-temperature heat exposure areas, and provided heat mitigation strategies for vulnerable locations in urban areas [
10]. Relevant studies have also showed that elderly and low-income people experienced high levels of outdoor heat exposure, and more methods to mitigate heat exposure need to be implemented [
11,
12]. Pennahm et al. conducted a cross-study of more than 185,000 deaths in London based on a high-resolution weather data set and proposed that heat-related mortality increased with an increase in the temperature of various communities with low vegetation coverage, high income deprivation levels, and social-rent houses, and that vegetation coverage had a better regulatory effect [
13].
In contrast, domestic studies on high-temperature heat wave disasters are in the initial development stage, and have mainly focused on the risk assessment and spatial distribution of high-temperature heat wave disasters. Xie Pan assessed the vulnerability of high-temperature heat wave disasters at a county scale in China based on the assessment framework of weather change risk proposed by Intergovernmental Panel on Climate Change(IPCC) [
14]. Li Huanhuan, Zhang Mingshun et al. conducted a risk assessment of high-temperature heat wave disasters in Beijing, indicating that the effect of high-temperature heat waves on human health in Beijing had obvious spatial differences, and the number of high-temperature heat wave days, the proportion of outdoor working people, and the proportion of people over the age of 65 years were important factors affecting the interannual variation in the vulnerability to high-temperature heat wave disasters in Beijing [
15,
16]. He Miao et al. used multi-source satellite remote sensing data to research the risk assessment of high-temperature heat waves in Beijing [
17]. Jin Xingxing et al. established a risk evaluation index system of high-temperature heat waves and discussed the temporal-spatial differentiation characteristics of high-temperature heat wave risk in Fujian Province [
18]. Chen Kai et al. identified the spatial distribution characteristics of the vulnerability to high-temperature heat waves in a central urban area of Beijing by constructing an evaluation framework of the vulnerability to urban high-temperature heat waves [
19]. In addition, Liu Jianjun et al. concluded that high-temperature heat waves can increase the incidence and mortality rate, especially among infants and the elderly, and aggravate the condition of patients with cardiovascular diseases and respiratory system diseases, resulting in premature death [
20]. Therefore, long-term high-temperature exposure may cause adverse reactions, and vulnerable groups (the elderly and children) need to be focused on.
In summary, this study selected Beijing, a world-class megacity, as the research object, which has typical characteristics, such as a large urban scale, concentrated population distribution, and stock development after rapid urbanization, thus research on the thermal environment of Beijing’s urban space has guiding significance. Based on the heat exposure space and urban-scale research results of domestic and foreign scholars, this study provides an innovative investigation at the street district scale and from a humanistic perspective, which has significance as a reference for the renewal of metropolitan cities and construction of humanistic cities under urban stock development. This study defined the high-risk heat exposure space distribution in a central urban area of Beijing at a street district scale according to high-temperature meteorological data and social demographic data, focusing on elderly aged 65 years and over and children. The distribution characteristics of the high-risk heat exposure space and the characteristics of the built environment in the street district from a humanistic perspective were analyzed, and specific improvement methods for high-risk heat exposure spaces based on the ways of emotional mitigation were proposed.
2. Research Overview and Data Processing
2.1. Research Area and Methodology
Beijing is located in the north of North China Plain with Yanshan Mountain at 115.7°–117.4° eastern longitude and 39.4°–41.6° northern latitude. According to the Köppen–Geiger climate classification, Beijing is located in the Dwa/Dwb (temperate monsoon climate) zone and has typical north temperate semi-humid continental monsoon weather [
21]. The temperature is the highest in July, and the monthly average temperature in the plain is about 26 °C. As of 0:00 on 1 November 2020, the number of permanent residents in Beijing was 21.89 million. As an international metropolis, Beijing has advanced and convenient urban infrastructure. However, under the influence of global warming, high urbanization, and other factors in recent years, high-temperature weather in summer occurs frequently in Beijing. Based on the daily meteorological data from 1960 to 2009, Zheng Zuofang concluded that the extreme maximum temperature, temperature raising rate, and the number of high-temperature days in Beijing since 1980 were significantly higher than those in the suburbs and outer suburbs. The average difference between urban areas and suburban areas was 0.18 °C, and the average difference between suburban areas and exurb areas was 0.44 °C [
22]. Li Xiaomeng et al. concluded that the range of high-temperature areas extended when extreme high temperatures occurred in Beijing in the recent 10 years, and the average temperature was 40.21 °C in 2000 and increased to 40.66 °C in 2010 [
23]. Beijing Meteorological Observatory issued the first high-temperature red warning on 30 May 2014, and the highest temperature surpassed the historical extreme value in the same period, reaching 42 °C in some areas.
With the outbreak of COVID-19, street districts have become the basis for dividing risk areas, facilitating screening and management, and providing effective grid units for elaborate community governance. According to the basic geographical base map of Beijing’s administrative regional boundary in 2020, the central urban area of Beijing was divided into 130 street districts. These 130 street districts are the most humanistic areas in the built environment, which can better reflect the thermal environment problems of high-density built-up areas.
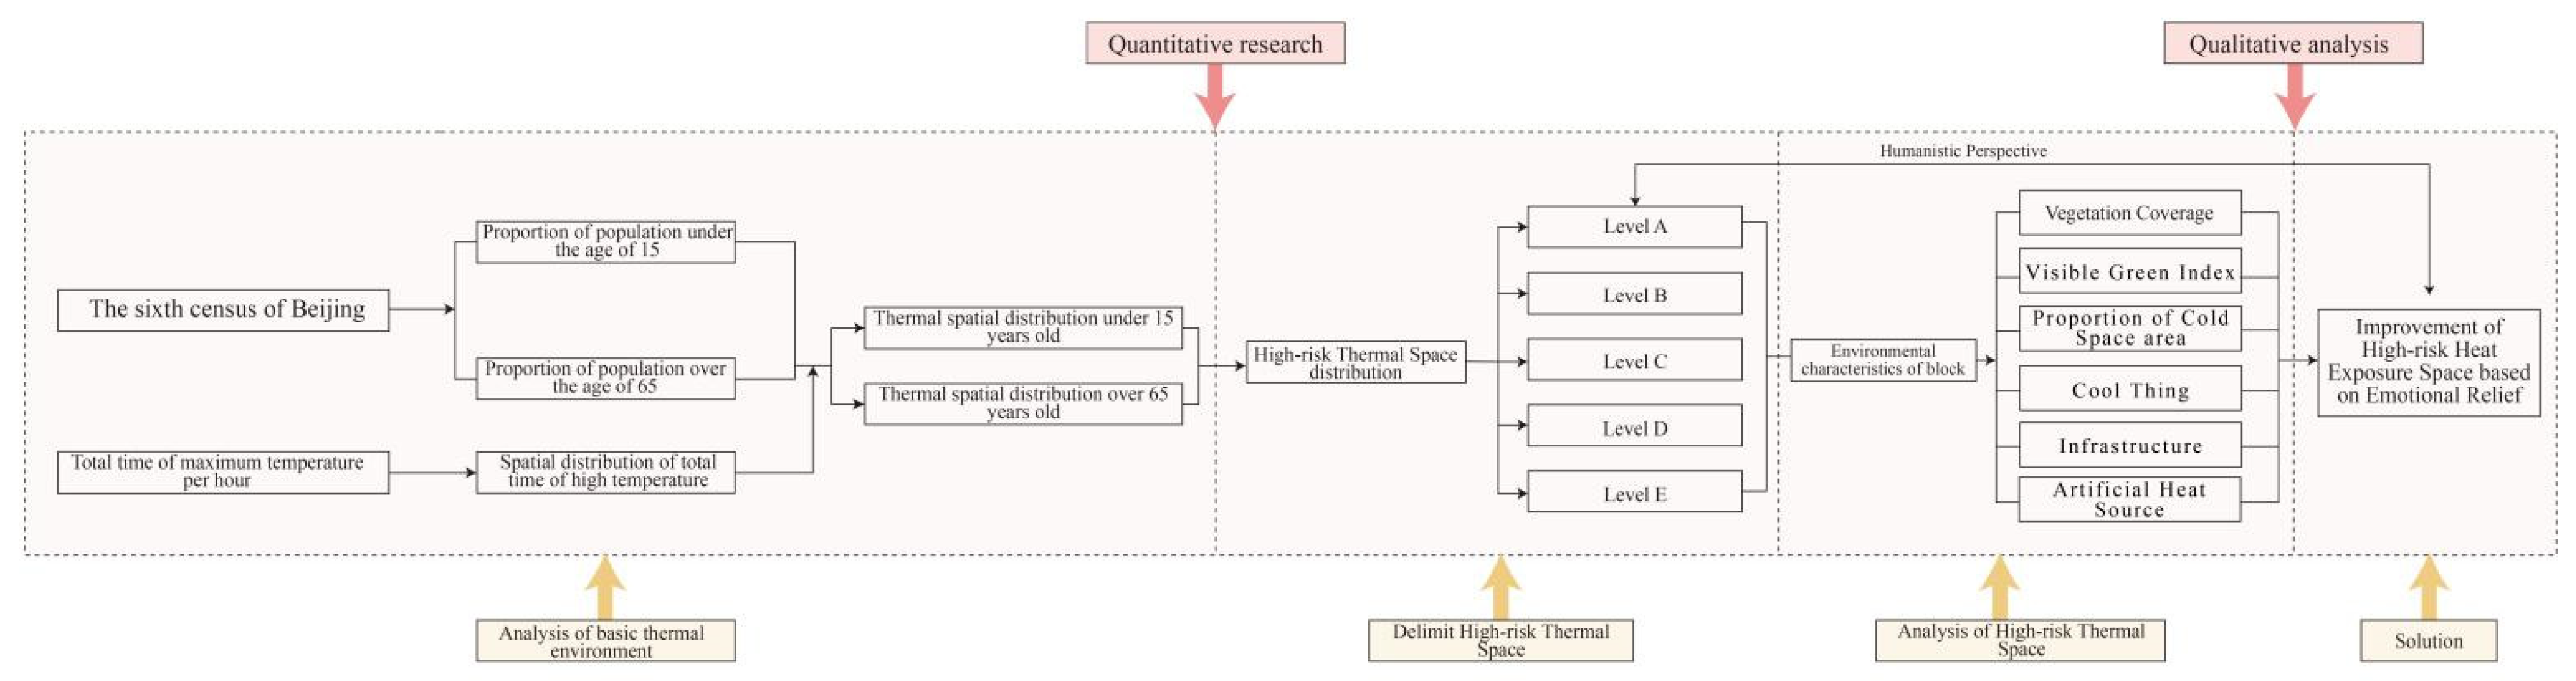
From the humanistic perspective, the 130 street districts in the central urban area of Beijing were selected as the research units, and technical methods, such as multi-source data, statistical analysis, and data visualization, were comprehensively applied. Based on the duration of high-temperature weather in summer and the proportion of the population located in the street districts, quantitative analysis of the spatial distribution level of heat exposure in the central urban area was carried out, and the street district scale was “marked in red”. Qualitative and quantitative analysis of the street district built environment was carried out from the humanistic perspective in high-risk heat exposure areas, and countermeasures to improve the heat exposure space were proposed from the perspective of emotional mitigation.
The research method used was a combination of quantitative and qualitative analysis. Quantitative analysis was mainly applied to the analysis of basic meteorological index data and environmental index data. Qualitative analysis was mainly used to generate research conclusions based on quantitative analysis results, such as classification of thee spatial distribution of heat exposure, thermal space improvement strategies, and methods based on emotional mitigation, etc. In the research process, there was certain crossover between quantitative analysis and qualitative analysis. Quantitative analysis was used in basic research to ensure scientificity, and qualitative analysis was used as a strategic means to highlight human characteristics (as shown in
Figure 1).
2.2. Source and Process of Data
The basic database in this paper consisted of the following five parts: (1) hourly maximum temperature data from July 2019; (2) data from Beijing’s sixth population census; (3) green space, river, and other vector data obtained from the website of Open street map; (4) sensing satellite data obtained from resource No. 3 remote in July 2019; and (5) street view pictures obtained from the open platform of Baidu Map.
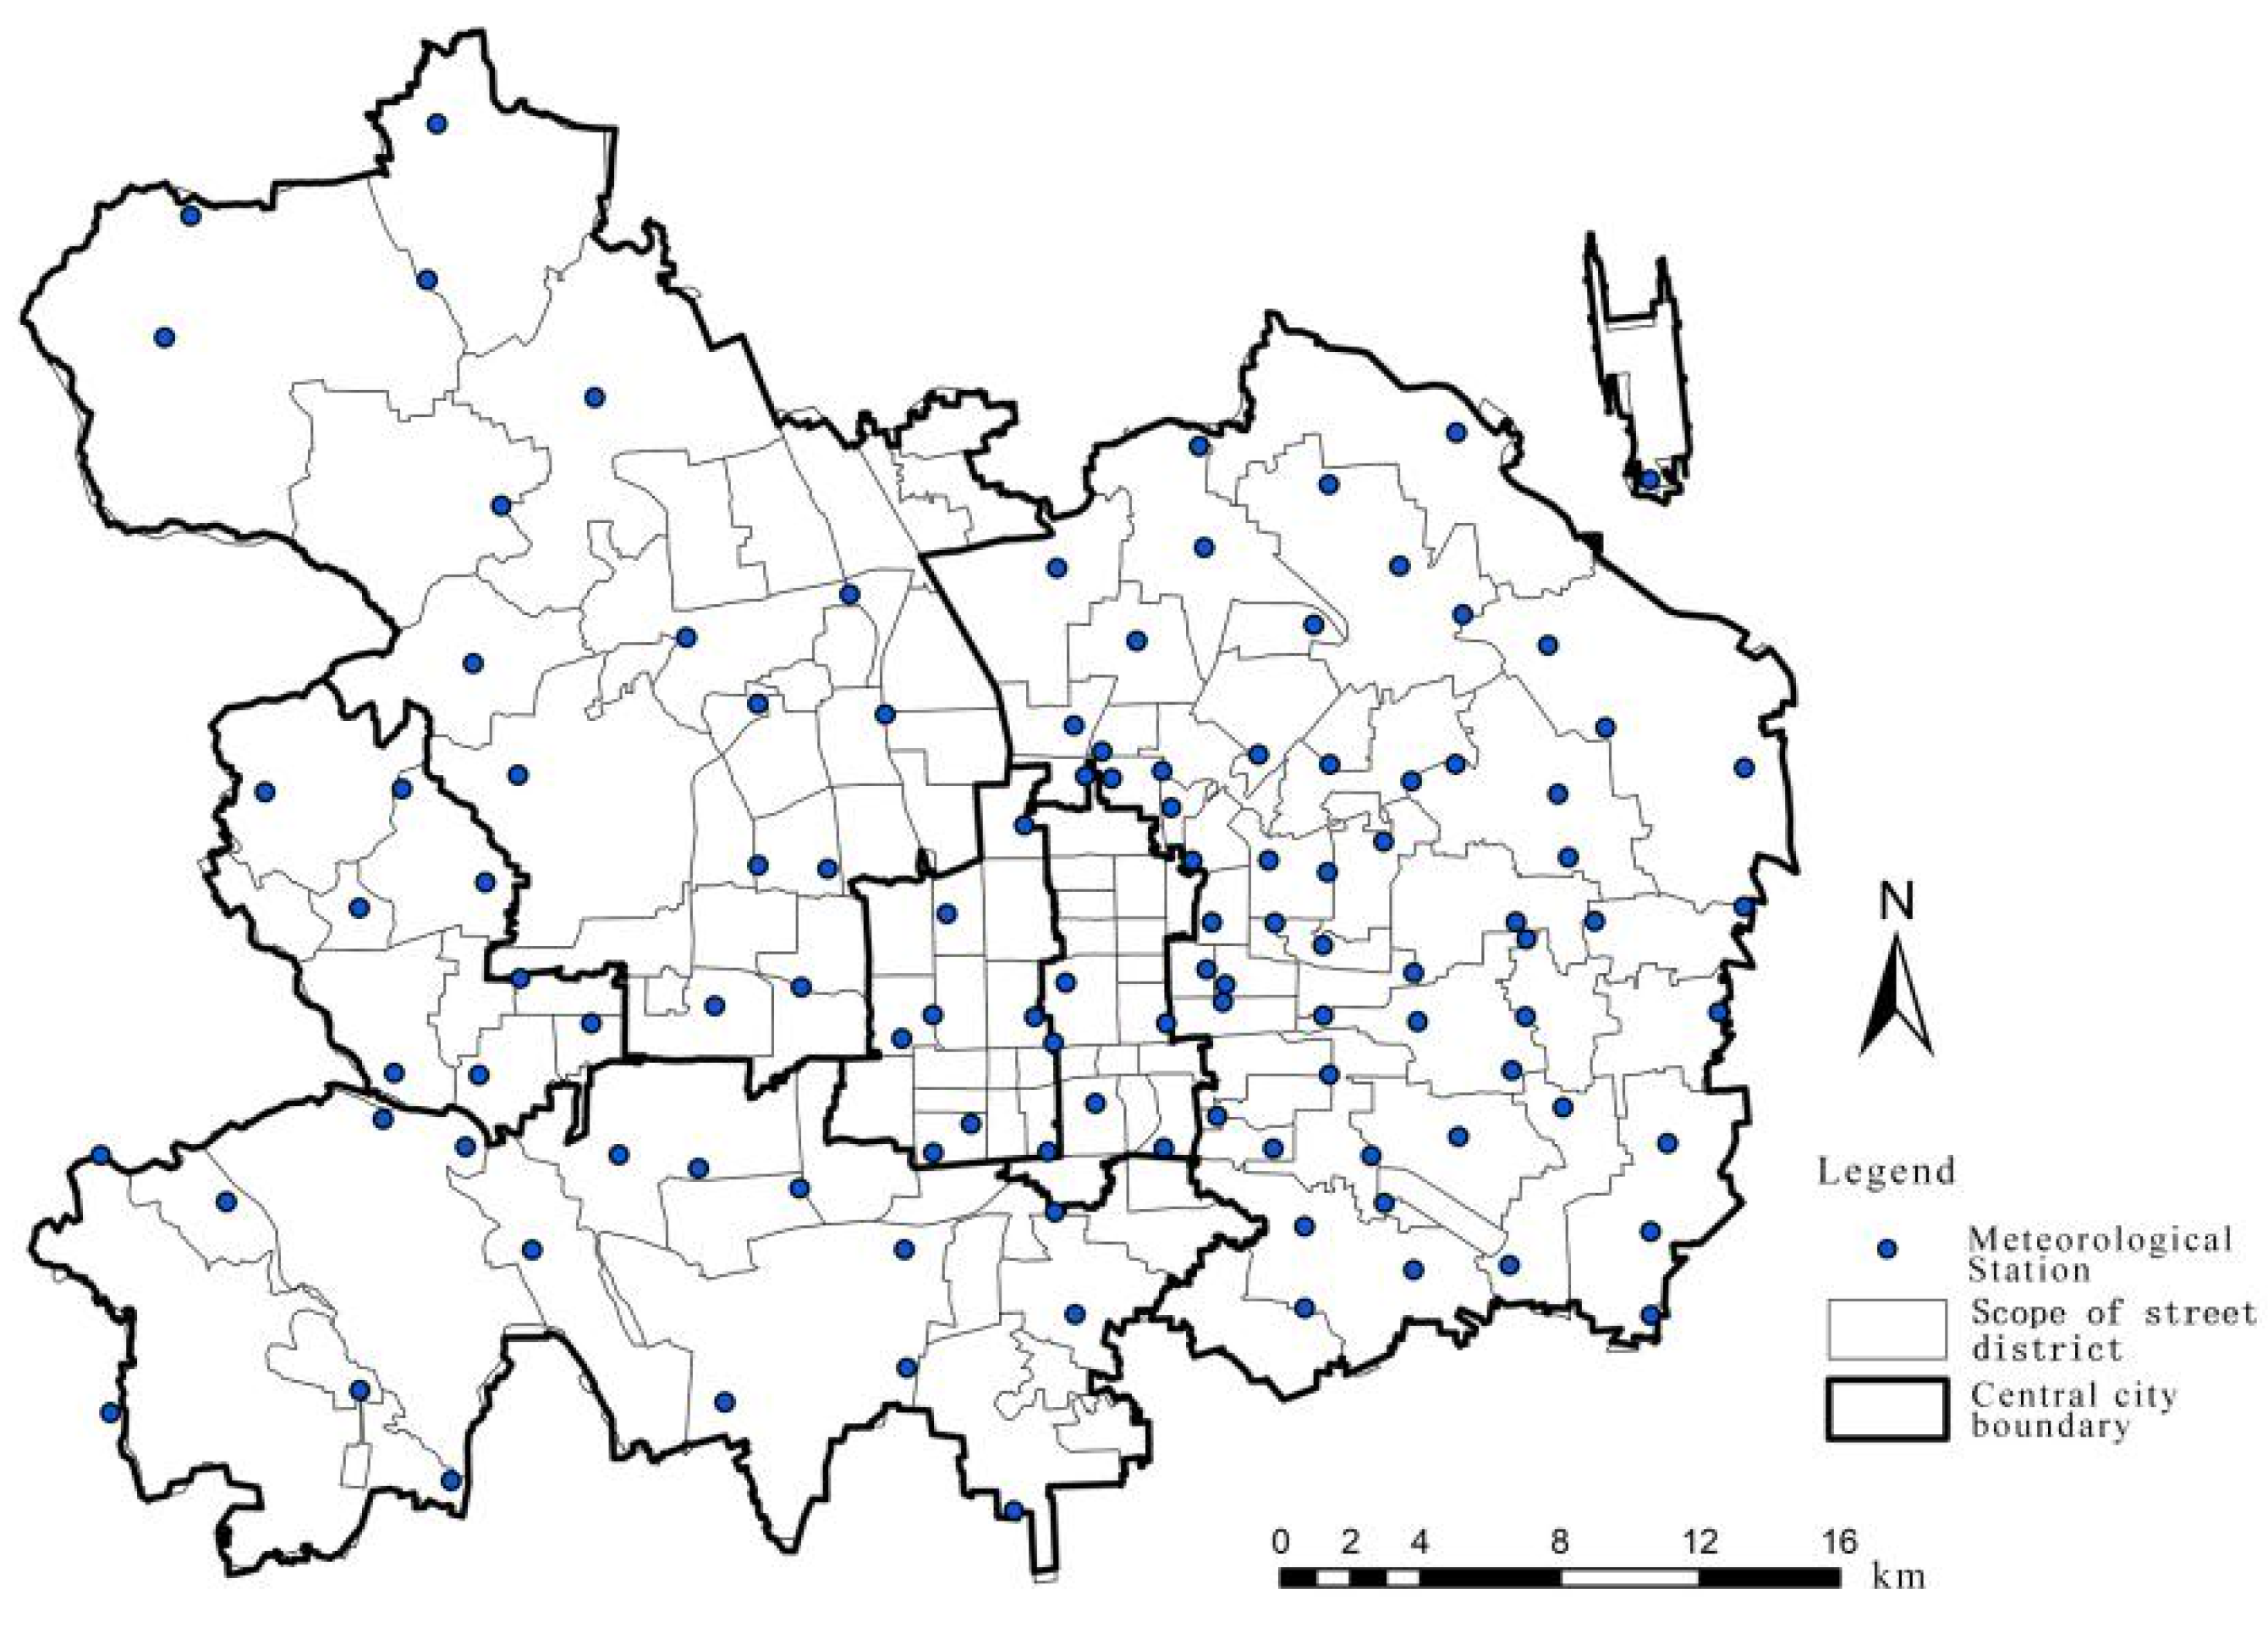
Firstly, the hourly maximum temperature from 463 meteorological stations in the central urban area of Beijing were collected and processed. A high-temperature day in China refers to a day on which the maximum temperature is ≥35 °C. The most comfortable temperature range for humans is 19–24 °C. Elderly individuals need to avoid the risks of high temperatures when temperatures exceed 34 °C according to the scientific popularization content about humans’ comfortable temperature of the China Meteorological Data Network [
24]. Therefore, 34 °C was adopted as the critical high temperature value and the total duration when the temperature was greater than or equal to 34 °C in July 2019 was calculated (as shown in
Figure 2).
Secondly, in the Aging of Population and the Socio-Economic Consequences published in 1956 [
25], the United Nations formulated the standard for being an aging society: “If the number of elderly people aged 65 and over the age of 65 in a country or region accounts is more than 7% of the total population, this country or region has entered an aging society”. Although the age boundary of children has not been clearly regulated, relevant data show that the United Nations has stated that people aged 15–24 years are young people. Since the impact of high-risk heat spaces on vulnerable groups was the focus in this paper, the proportion of people under the age of 15 years and over the age of 65 years based on the data of Beijing’s sixth population census was adopted as one of the research factors of high-risk heat exposure spaces [
26].
Thirdly, the latest data about the green spaces and rivers in the central urban area of Beijing were collected from the open-source website of Open street map, and the data were sorted and calculated based on ArcGIS to obtain basic information, such as area and length, etc.
Fourthly, the data obtained from resource No. 3 remote sensing satellite imagery were corrected and integrated based on the Environment for Visualizing Images (ENVI) platform, the value of the Normalized Difference Vegetation Index (NDVI) was calculated by using the function of the calculation parameters in NDVI, and the vegetation coverage was obtained according to the formula.
Fifthly, the Application Programming Interface Key (AK) code of the Baidu personalized map developer platform was used. Pictures of high-risk street districts were obtained in batches by selecting a 30 m distance as the interval and the 10° horizontal perspective as the benchmark, and the visual image semantic segmentation tool for deep learning of the Full Convolution Network (FCN) was used for translating and computing, and the characteristics of the space elements in street districts were analyzed from the humanistic perspective.
3. Analysis of High-Risk Heat Exposure Spaces in the Central Urban Area of Beijing
3.1. Distribution of Heat Duration in Street Districts in the Central Urban Area of Beijing
According to the heat duration data of the meteorological stations in the central urban area of Beijing, the heat duration distribution was visualized in a diagram based on ArcGIS, and the average heat duration in the street district was calculated. Firstly, the high-temperature data monitoring time was 24 h, sampled once per hour. Secondly, the high-temperature heat duration data of each meteorological station were counted. Thirdly, the Radial Basis Function (RBF) interpolation method in ArcGIS software was used to obtain the heat duration distribution map of the central urban area of Beijing. Since were data was grid based, the values of each grid point in street districts were added and divided by the total grid points to obtain the average heat duration in the street area.
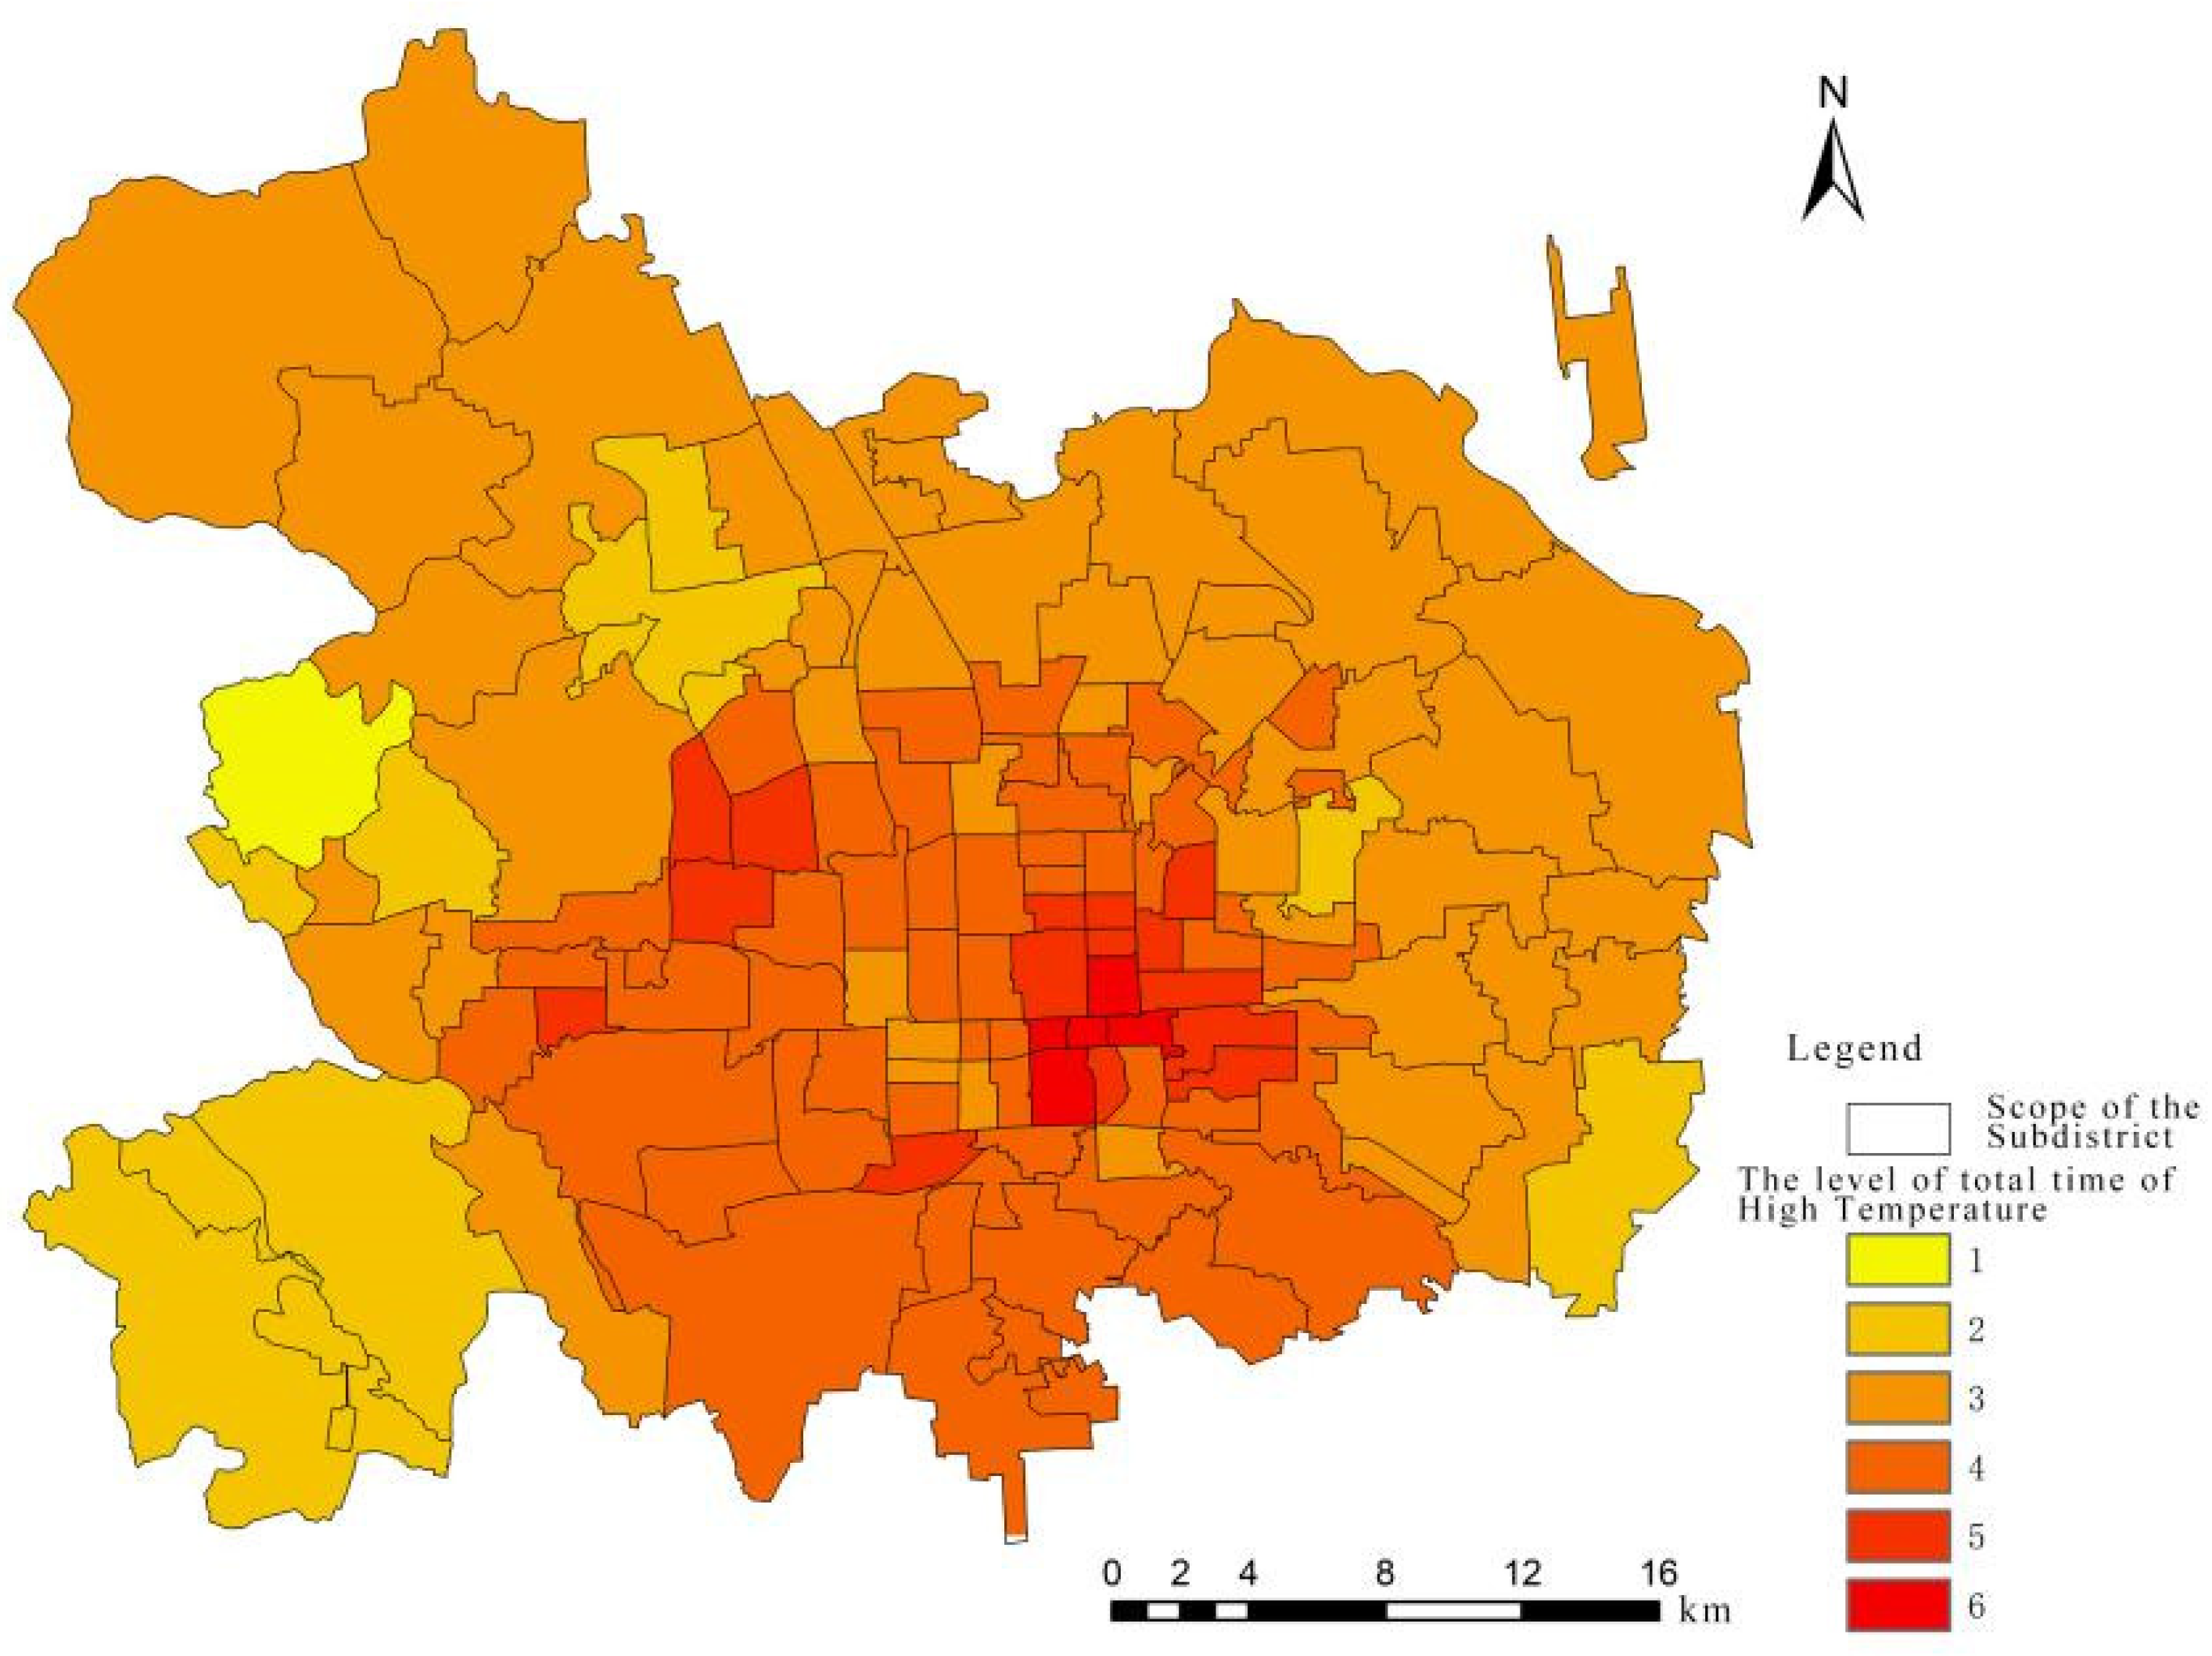
According to the calculation results, the heat duration distribution was divided into 6 levels by adopting a 12 h duration as the interval, and the statistics of the heat duration in street districts in 2019 were assessed (as shown in
Table 1). The research method of dividing the heat duration by 12 h was used mainly to select a complete daytime period from 6 a.m. to 6 p.m. during which citizens’ outdoor activities were most frequently and most affected by high temperatures. The results showed that the characteristics of the heat duration distribution in the central urban area of Beijing in 2019 were a “longer duration in the central area and shorter duration in surrounding areas”, which was consistent with the circular radiating spatial layout of Beijing. The data analysis results showed that the main range of the heat duration distribution in 2019 was 81.0829–143.76 h. Taking 12 h as the interval range, it was 72–144 h. The six grades were used to divide the heat duration at all levels equally, taking into account the geographical distribution characteristics and visualization of the heat duration. Street districts with a heat duration of 132–144 h included Chongwenmenwai street district, Donghuashi street district, Jianguomen street district, Qianmen street district, and Tiantan street district (as shown in
Figure 3).
3.2. Population Analysis of Street Districts in the Central Urban Area of Beijing
Based on the data of Beijing’s sixth population census, the populations under the age of 15 years and over the age of 65 years in 130 street districts in the central urban area of Beijing were calculated respectively. The calculation formula is as follows:
Population proportion = Population under the age of 15/Total population in the sub-district × 100%.
Population proportion = Population over the age of 65/Total population in the sub-district × 100%.
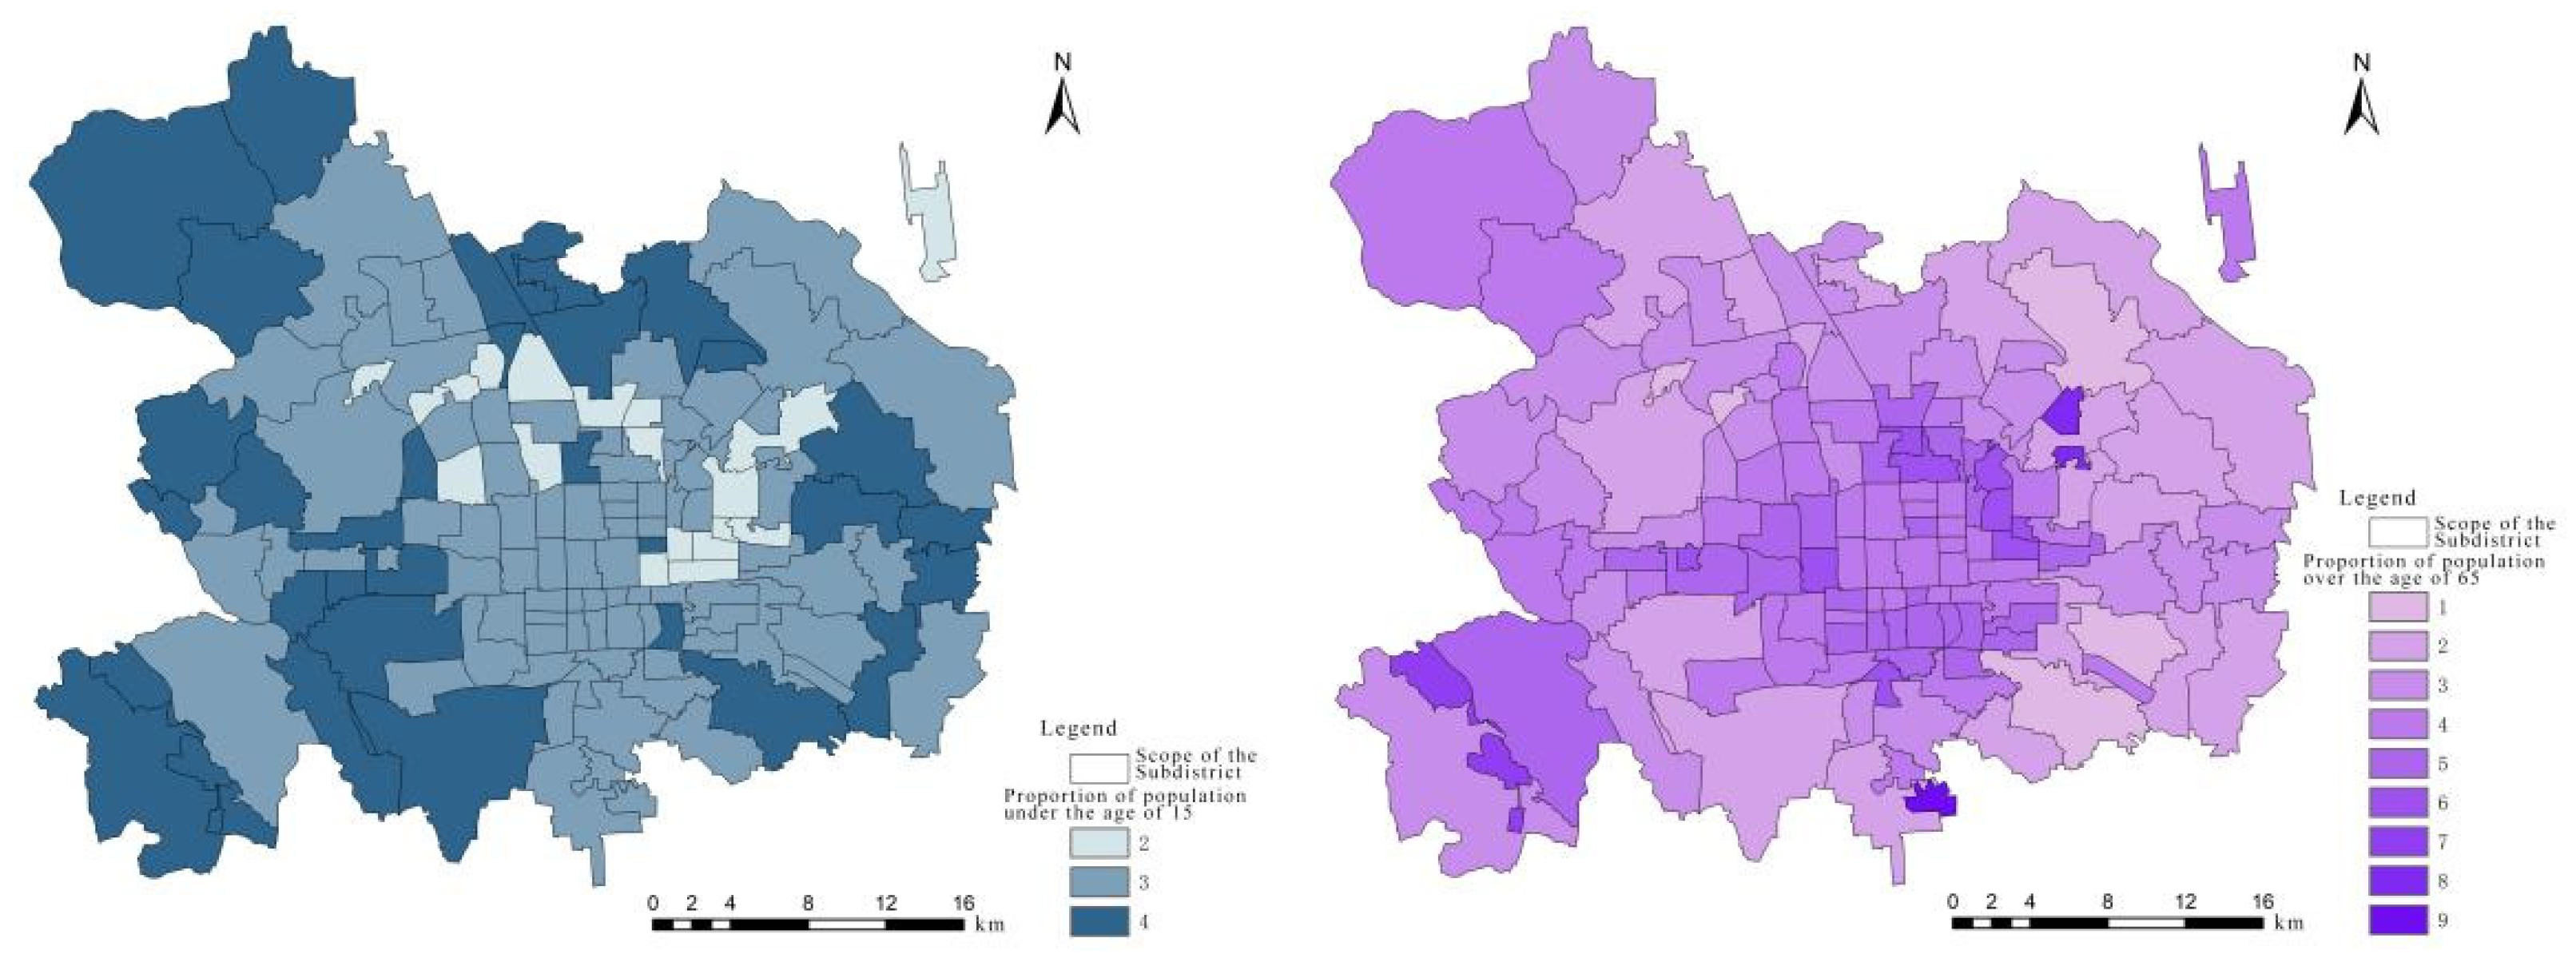
After obtaining the population proportion of the corresponding street, 3% was determined as the partition interval(as shown in
Table 2). The population proportion under the age of 15 years was divided into 3 levels, and the population over the age of 65 years was divided into 9 grades. Visual analysis was conducted using the ArcGIS platform (as shown in
Figure 4).
The results showed that the population distribution under the age of 15 years was scattered around the central urban area. The high-level street districts included Chaoyang District, Haidian District, and Fengtai District, and the street district with the highest proportion was Wangzuo Town in Fengtai District, accounting for 11.29%. In addition, the population distribution over the age of 65 years was concentrated in the central area, mainly in Dongcheng District, Xicheng District, and Chaoyang District. The street district with the highest proportion was Donggaodi street district in Fengtai District, accounting for 24.54%.
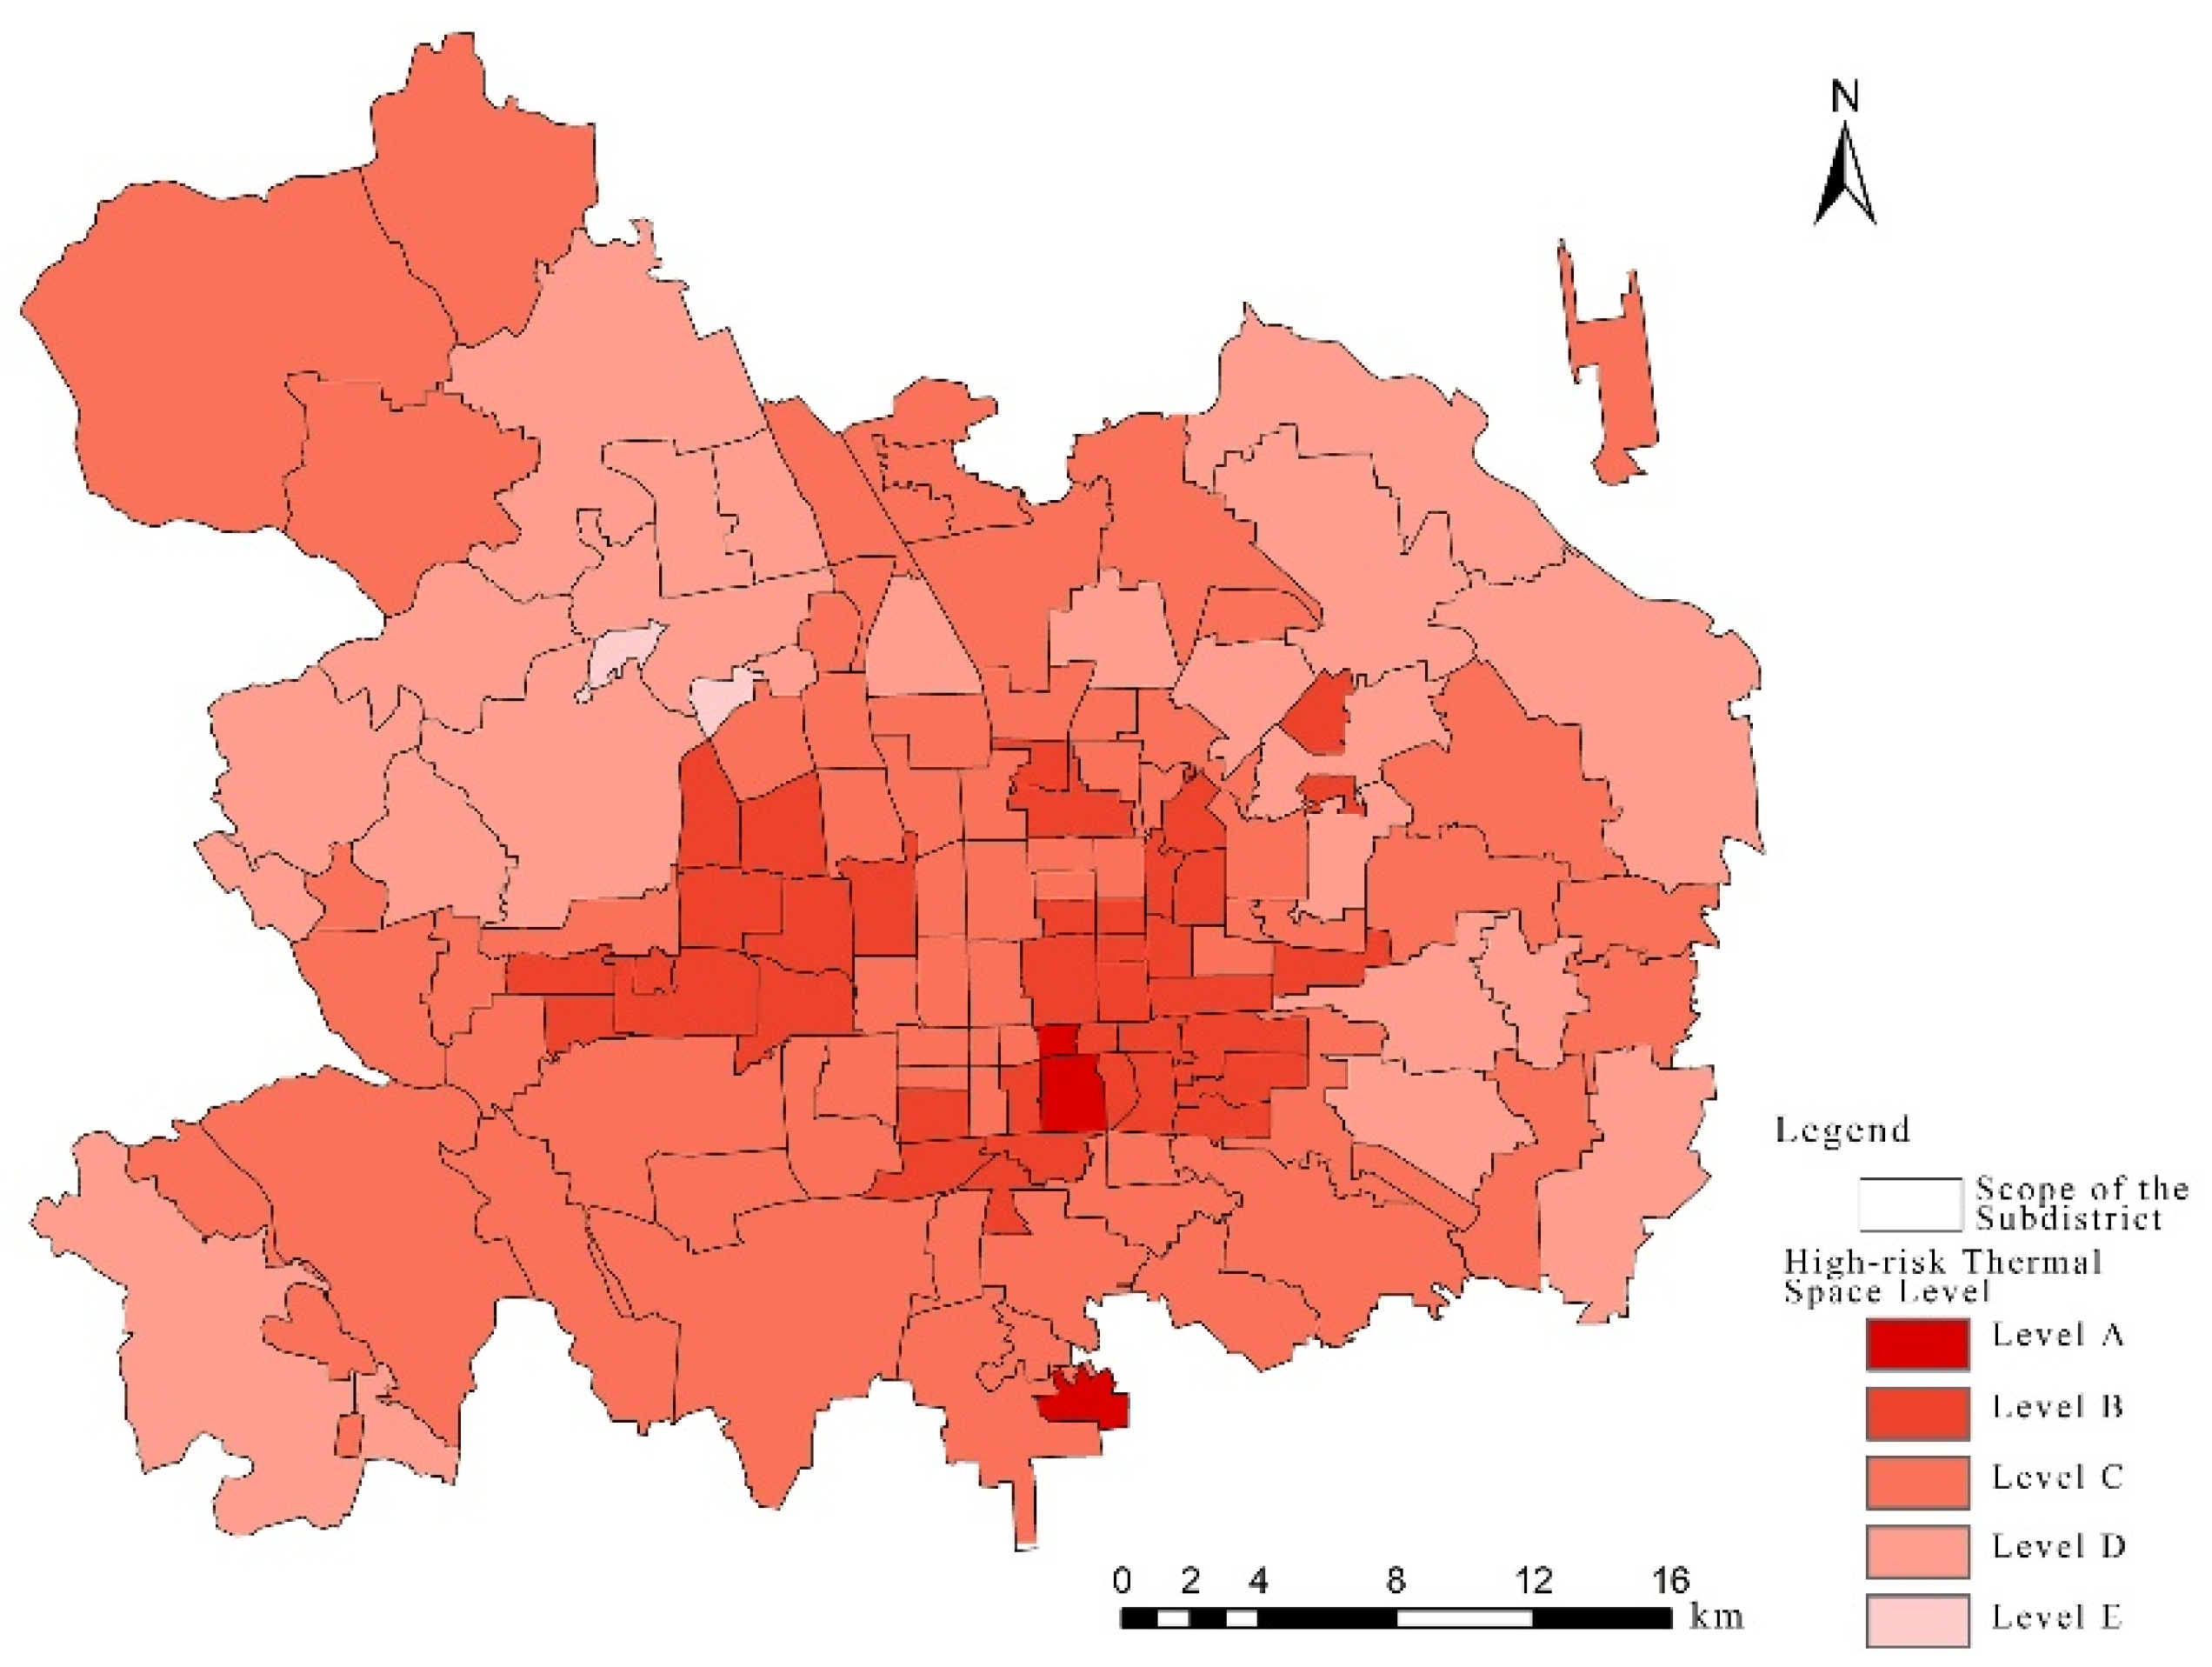
3.3. “Marked in Red” for High-Risk Heat Exposure Spaces in the Central Urban Area of Beijing
From the humanistic perspective, the impact of high-temperature weather on vulnerable groups was discussed to determine high-risk heat exposure spaces in the central urban area of Beijing. High-risk heat exposure spaces where people under the age of 15 years and over the age of 65 years lived were integrated with each other to obtain the distribution level of high-risk heat exposure at the street district scale. By integrating the above results, the street districts with high-risk heat were “marked red” and divided into five levels: A-level high-risk heat space, B-level high-risk heat space, C-level high-risk heat space, D-level high-risk heat space, and E-level high-risk heat space (the risk gradually reduces from A-level to E-level) (as shown in
Table 3).
High-risk heat exposure spaces in the central urban area of Beijing were based on the “central axis”, and had the spatial characteristic of a “higher level in the central area and lower level in surrounding areas” on the whole. The high-risk heat space in the central axis area had a low level and had the characteristic of a “higher level in the south and lower level in the north”. The statistics of street districts with high-risk heat on different levels were further analyzed, and the results showed that there were three street districts with A-level high-risk heat, namely Qianmen street district, Tiantan street district, and Donggaodi street district (as shown in
Figure 5).
4. Analysis of the Spatial Characteristics of High-Risk Heat Exposure Street Districts Based on Translation of Street View Pictures
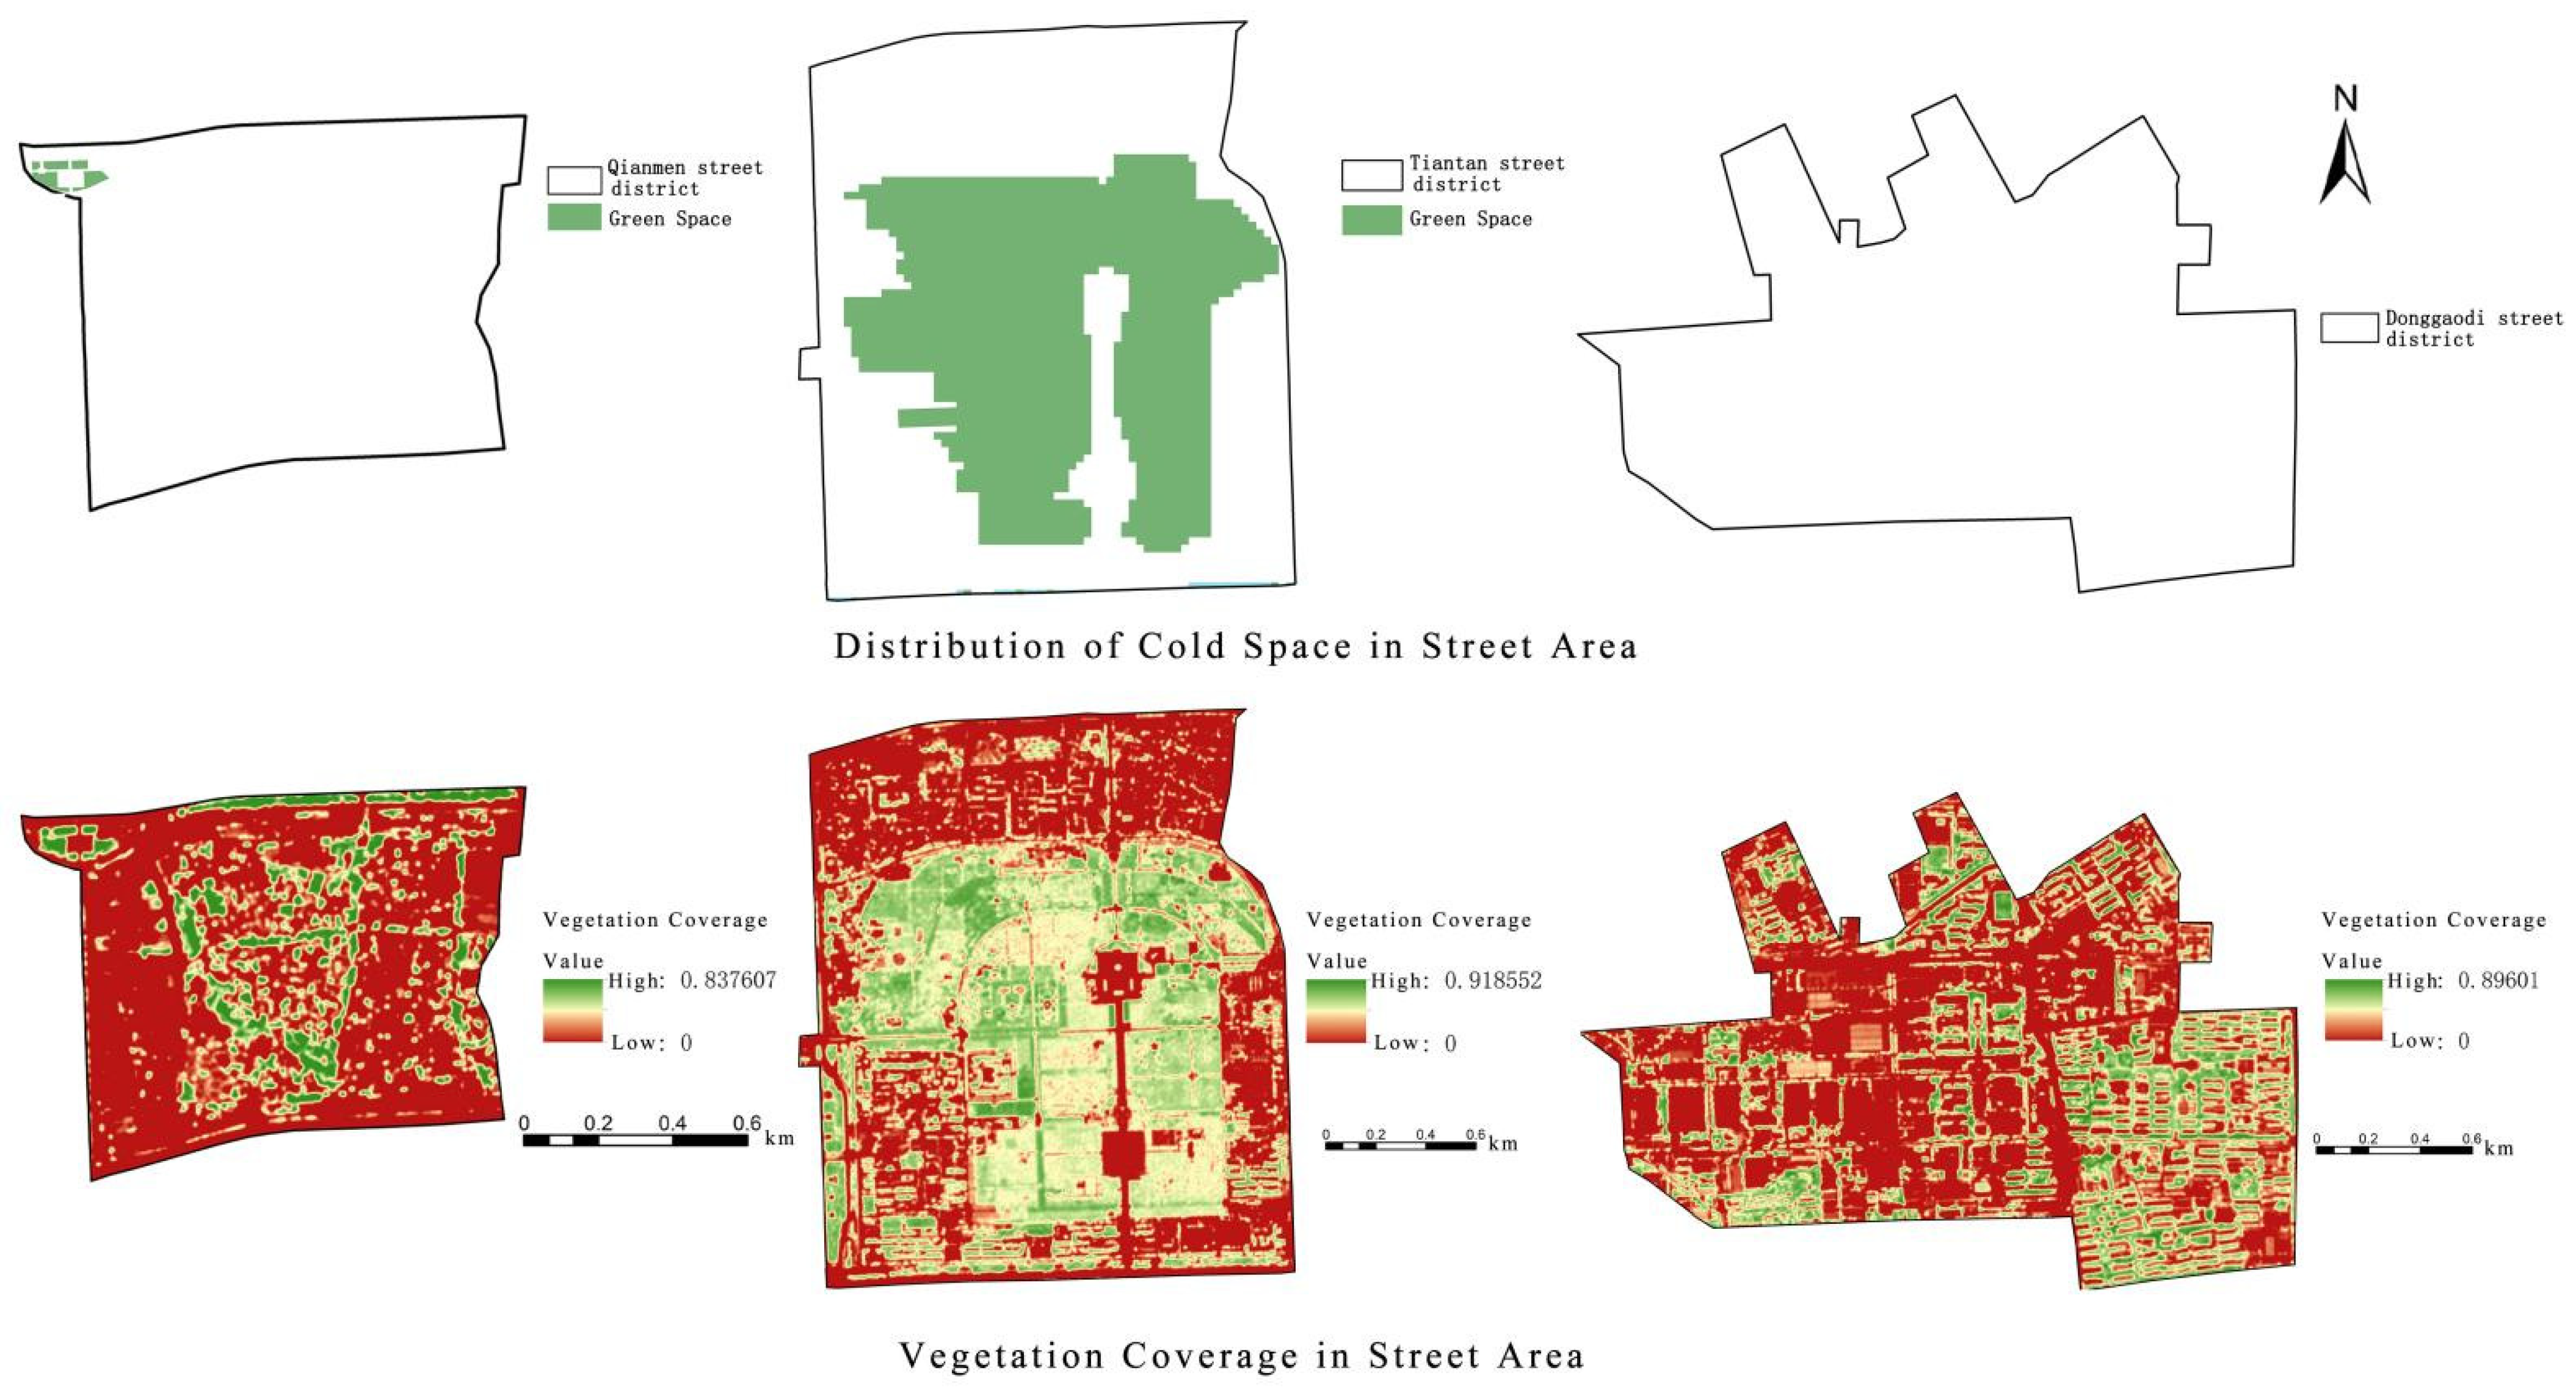
The environments of Qianmen street district, Tiantan street district, and Donggaodi street district were analyzed from the humanistic perspective. The main influencing factors were recognized to be the vegetation coverage, proportion of cold space area, green looking ratio, cooling materials, infrastructures, and artificial heat source, of which cold spaces consisted of rivers, lakes, and green space. Relevant studies have shown that green spaces, rivers, and lakes can act as “cold islands” in cities and cause a decrease in the temperature [
27]. The green looking ratio, cooling materials, infrastructure, and artificial heat source were considered as street space elements that people can see and feel in the space based on the human perspective, which were the most visualized parts that had an impact on human feeling. Street space elements were obtained by translating and computing the street view pictures, and the vegetation coverage and proportion of cold space areas were obtained by implementing integration, correction, and computing in ENVI and ArcGIS (as shown in
Figure 6).
It can be observed in the distribution comparison diagram that places covered by vegetation did not necessarily have green space. Similarly, it was possible that there was low vegetation coverage in areas designated as green space. Therefore, it was necessary to analyze the causes affecting the thermal environment in street areas in more detail.
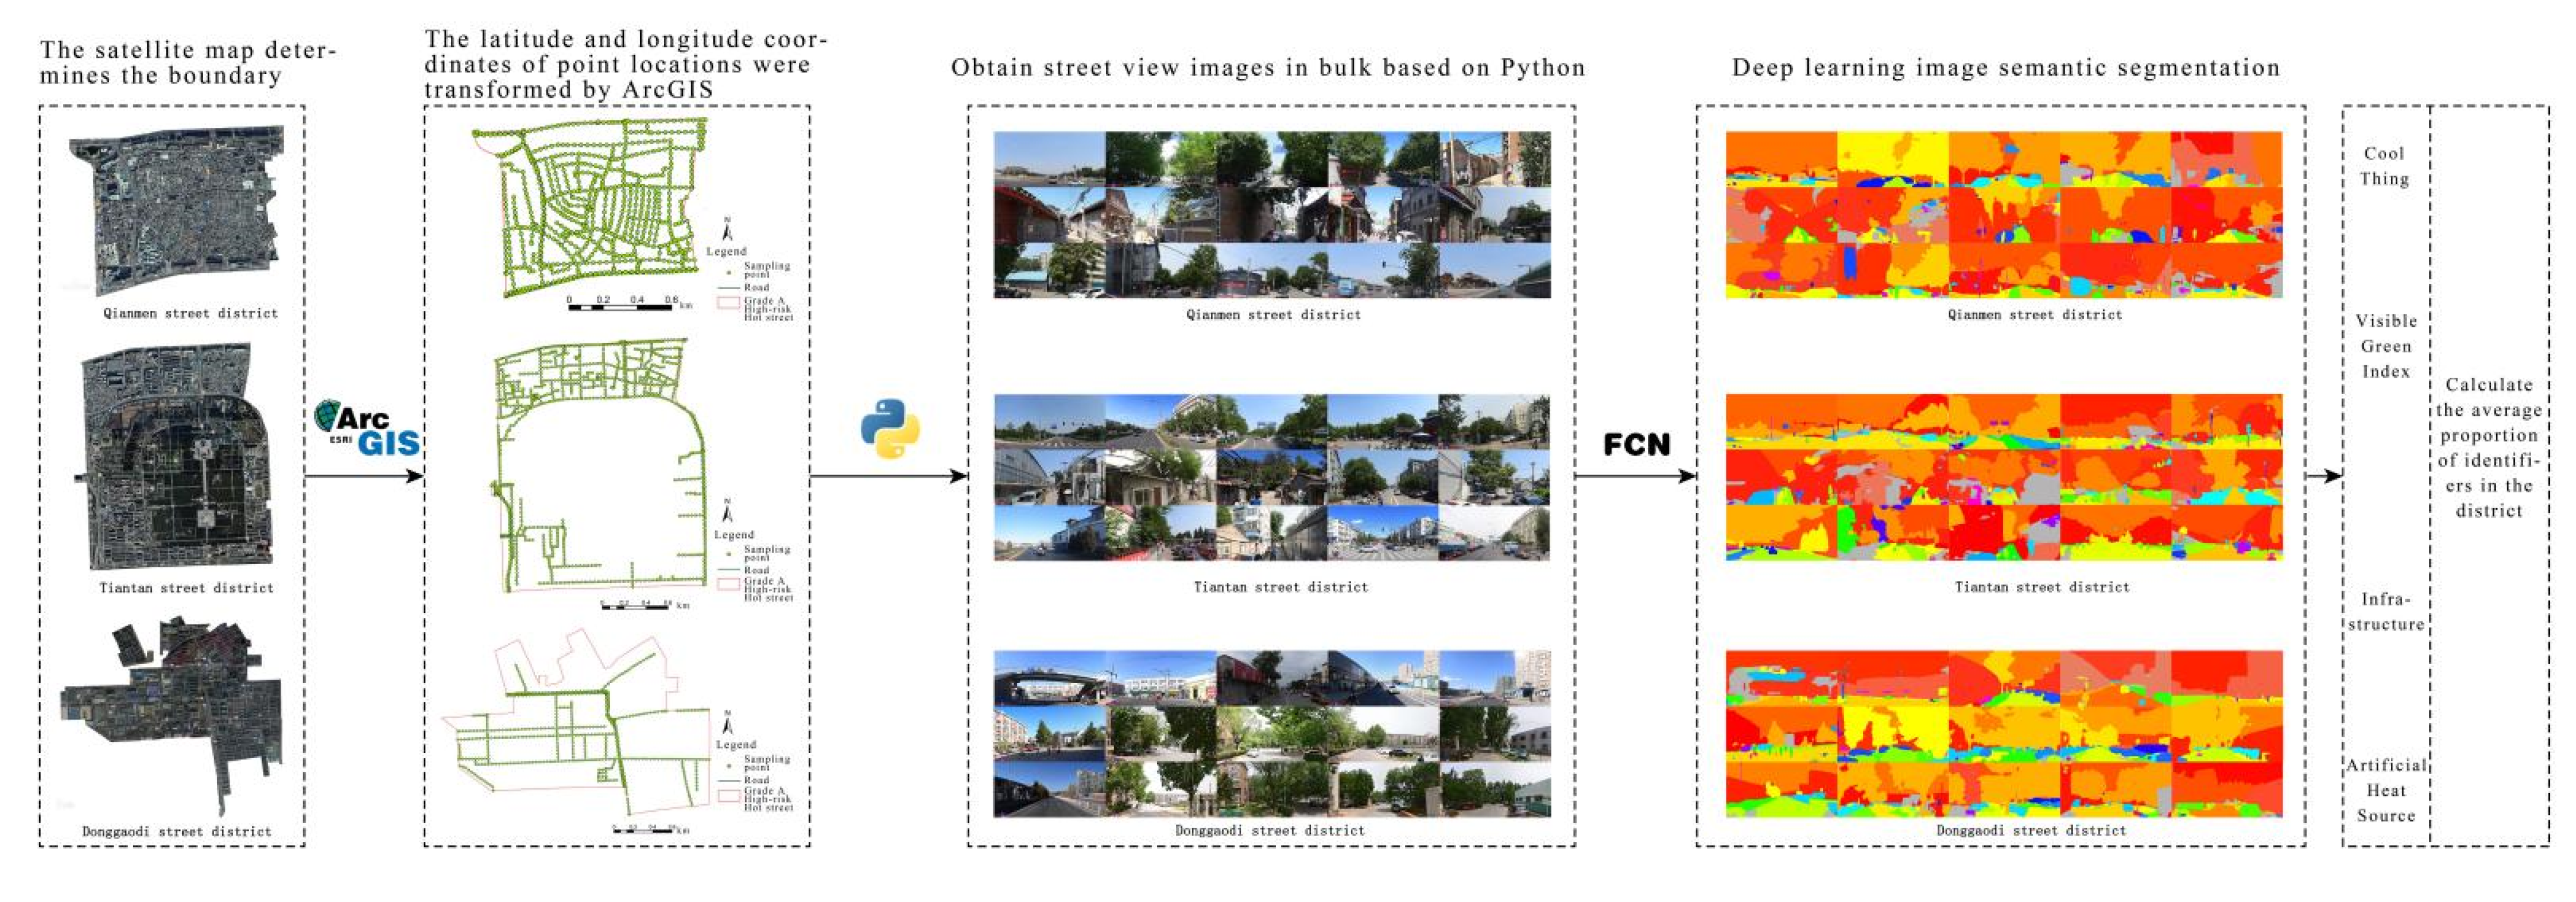
To translate and compute the street view pictures, the vector road network data obtained from the website of Open street map was input into the ArcGIS platform at an interval of a 30 m distance. The sampling points on each road were determined to generate 3466 points (1152 points in Qianmen street district, 1611 points in Tiantan street district, and 703 points in Donggaodi street district), and the longitude and latitude coordinates of these sampling points were recorded. Next, according to the AK code provided by the Baidu personalized map developer platform, pictures with a front view angle (perpendicular to the street) and 0-degree horizontal view angle of each sampling point and 1024 × 512 pixels were captured in batches using Python language, and the points excluding street views and pictures with large seasonal differences were deleted. Finally, 845 valid pictures of the Qianmen street district, 845 valid pictures of the Tiantan street district, and 378 valid pictures of the Donggaodi street district were obtained. The visual image semantic segmentation tool of deep learning FCN was adopted to identify and analyze the obtained street view pictures in batches. Based on the segmentation characteristics of the tool, 150 types of elements were identified, in which some elements were integrated and computed, such as the green looking ratio involving trees, grass, plants, and flowers; cooling materials including rivers, lakes, fountains, flowerpots, and vases; infrastructure, which was divided into two categories, including the first category, which referred to facilities in street spaces, such as rest places, tables, and seats, that help relieve the “hot feeling”, and the second category, which referred to facilities, such as awnings, escalators, and fans, that can reduce heat exposure; and artificial heat sources, including motor vehicles (buses, trucks, trucks, small locomotives, automobiles, etc.) and temperature-rising materials (air conditioning radiators, electronic screens, lights, etc.) (as shown in
Figure 7).
The analysis results showed that the area of cold space was very small, and the vegetation coverage was less than 20%, which was one of the reasons for high-temperature heat in Donggaodi street district and Qianmen street district. Moreover, the proportions of cold space area and vegetation coverage were the highest in Tiantan street district due to the impact of Tiantan Park (as shown in
Table 4). Aoki Yoji concluded that if the green looking ratio is higher than 25%, people feel that the greening degree of the surrounding environment is good, and if the green looking ratio is higher than 50%, people feel that the greening degree is very good [
28]. From the humanistic perspective, the green looking ratio of the three street districts was less than 16% and was significantly lower than the critical value of the good feeling of the greening degree. It might increase people’s “impatient feeling” in hot weather, thus causing harm. In the three street districts, the proportion of infrastructure that could help to rest, relieve, block, and avoid heat exposure was less than 0.01%, and the proportion of cooling materials was less than 0.5%. This shows that the elderly and children with weak physical strength could not find relief from heat exposure in time due to the lack of heatstroke prevention facilities, and “heat risk” was thus increased. For artificial heat sources, the proportion of temperature-rising materials was not large, the proportion of motor vehicles was more than 2.5%, and these two proportions greatly exceeded the proportions of cooling materials and infrastructure, so the risk of heat exposure was aggravated. The change in the urban surface properties and artificial heat sources were the main reasons for the heat island problem [
29].
5. Improvement Strategy for Heat Exposure Spaces under Emotional Mitigation from the Humanistic Perspective
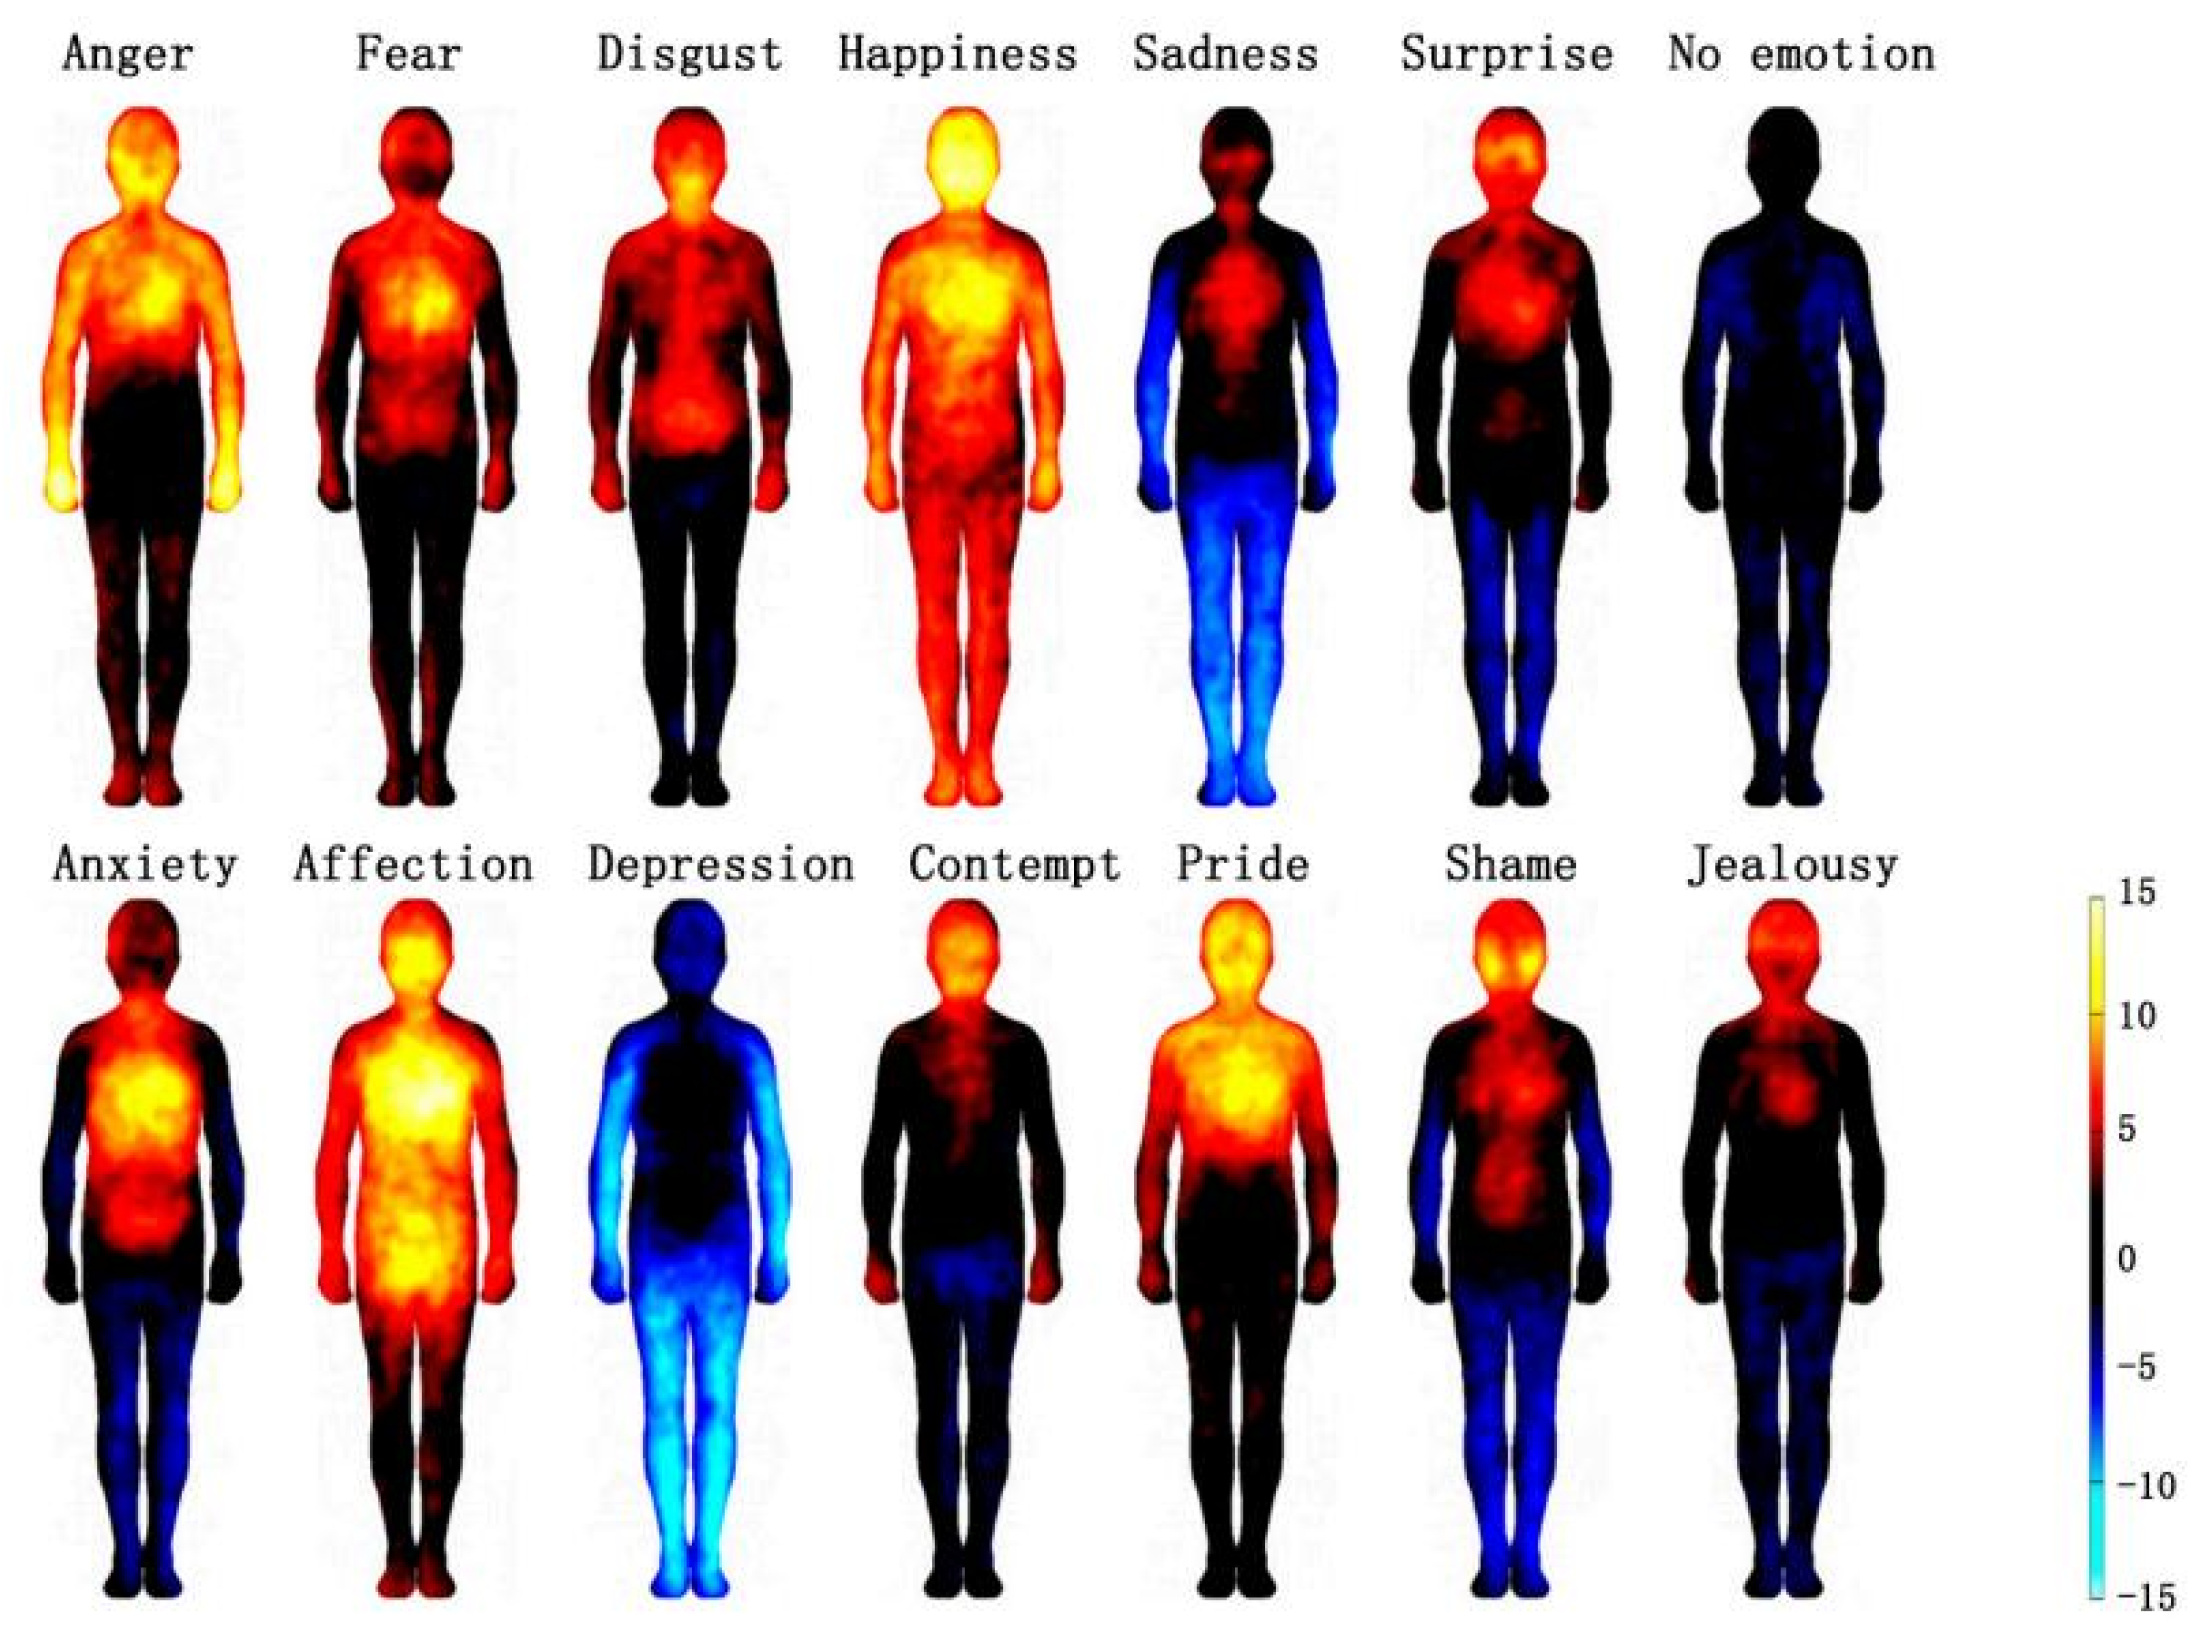
High-temperature heat wave disasters always threaten the health of urban residents and have a more serious impact on vulnerable groups. Relevant studies have shown that different emotions can change the temperature of different parts of the human body [
30]. Emotional stimulation stimulates the body to produce different substances that lead to changes in body temperature, resulting in high-temperature heat danger in hot summers (as shown in
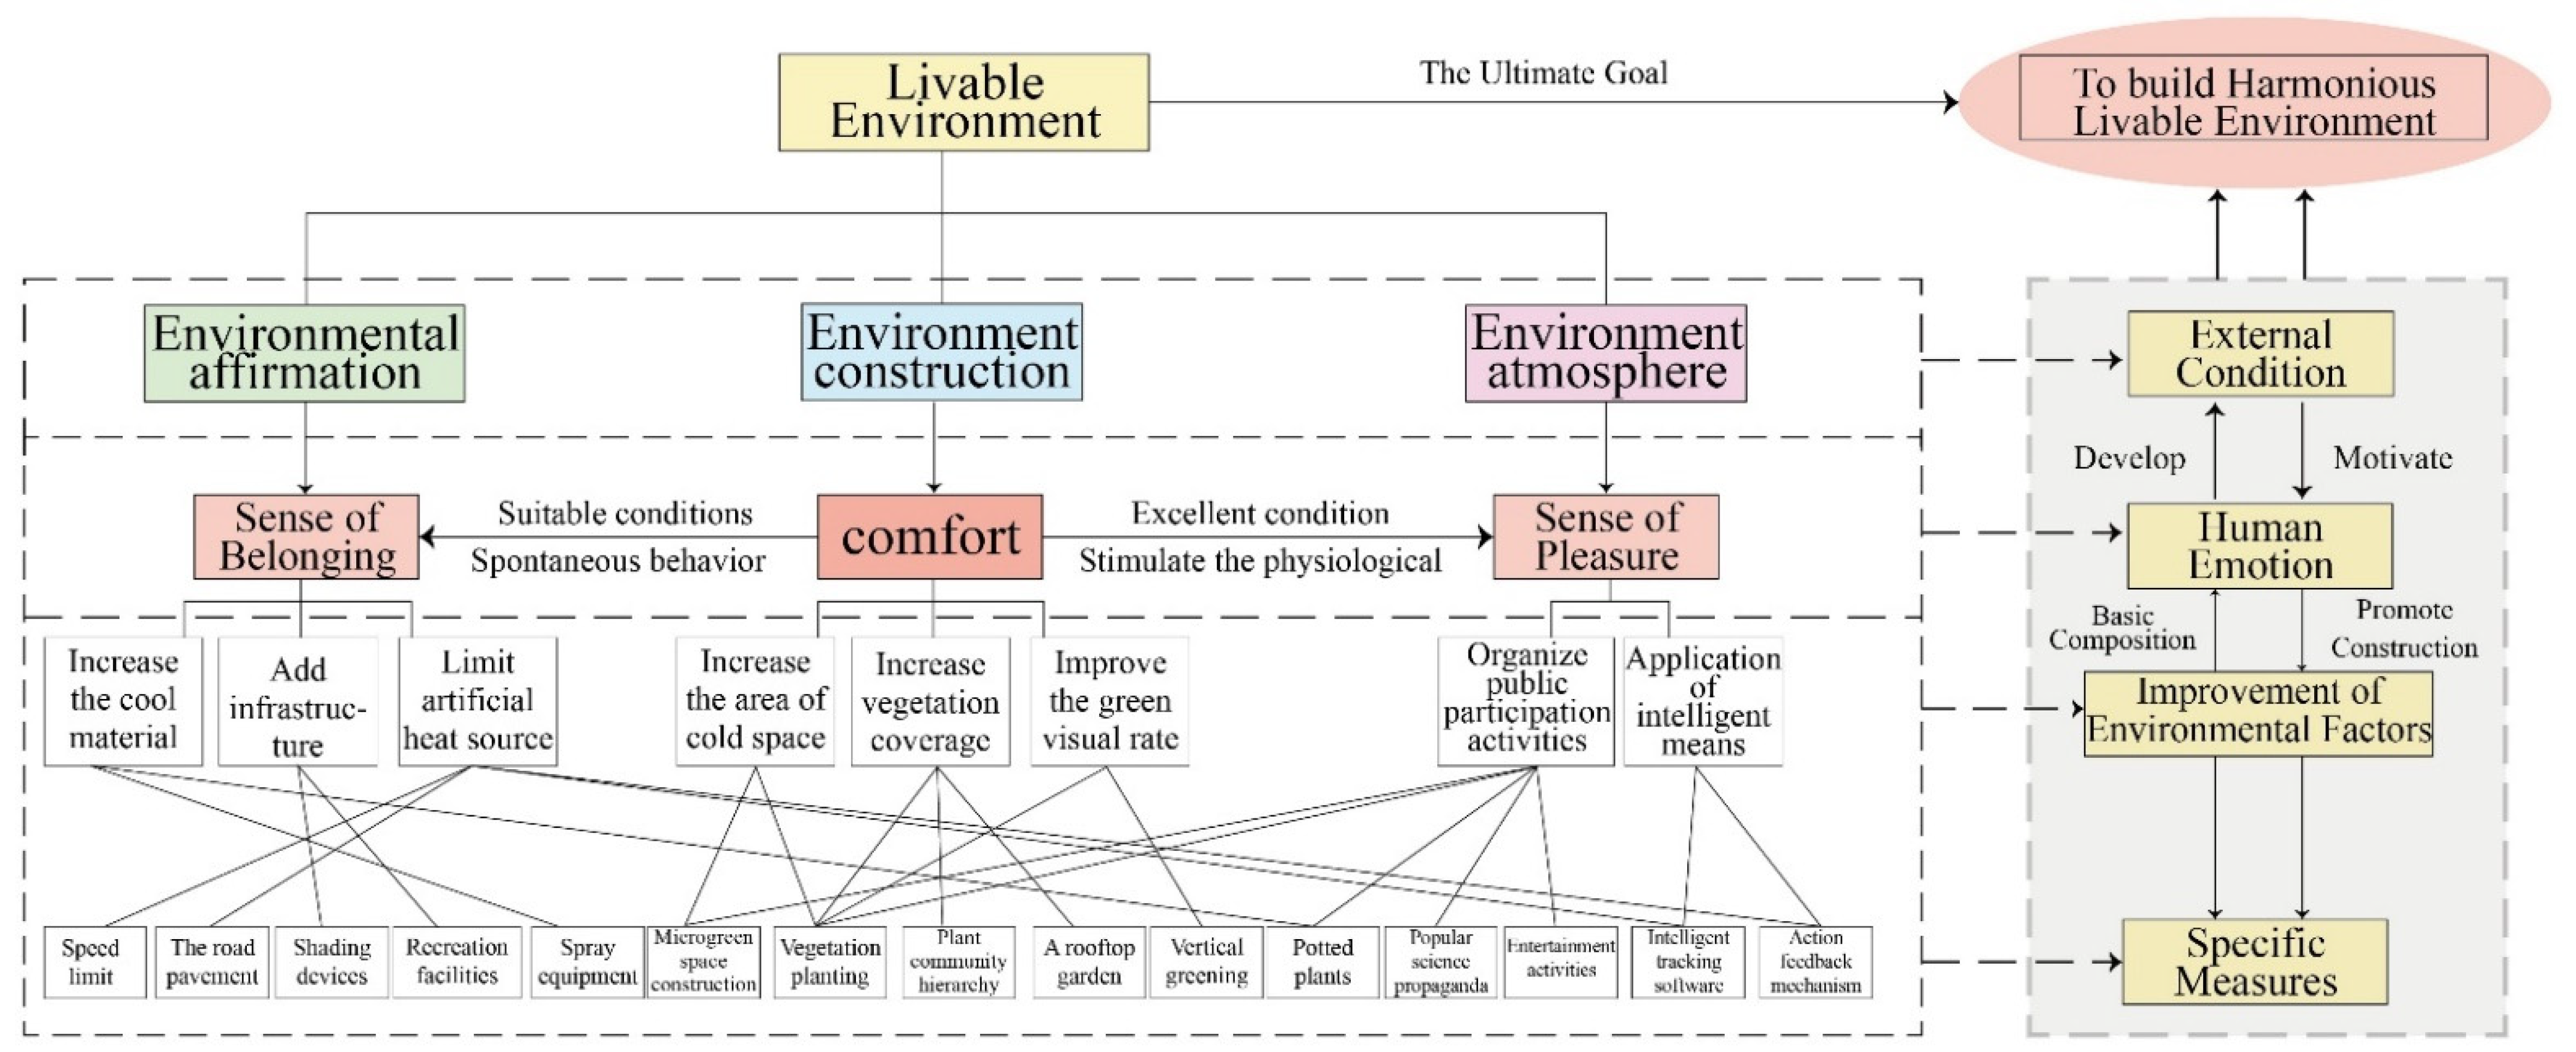
Figure 8). Under the background of stock development, the method of increasing cold island spaces in a large area was not feasible in the central urban area of Beijing. Therefore, the mitigation countermeasures of high-risk heat exposure spaces based on emotional levels from the humanistic perspective were more in line with the actual needs and can reduce and mitigate the impact of high-risk heat exposure spaces on the direct feelings of humans by using relevant construction methods, thereby creating a comfortable local environment and truly realizing humanistic fine governance (as shown in
Figure 9).
- (1)
Comfortable feeling in the living environment
Comfort was the core factor for the development of residents’ life in residential areas, and seriously affected the health maintenance of vulnerable groups, such as the elderly and children.
Relevant studies have shown that green landscapes can reduce residents’ mental stress, and moderate vegetation coverage (30%) can increase stress relief effect by three-fold [
31]. Being in a green environment and looking at plant communities made people’s mood stable for the longest time [
32]. Based on the characteristics of the built environment and the statistics of the environmental elements of high-risk heat exposure spaces in the central urban area of Beijing, three aspects were proposed: increasing cold space areas, increasing vegetation coverage, and improving green visibility.
- ➀
Increase cold space areas. According to the characteristics of the high-density construction area in the central urban area, it is feasible to build small and micro green spaces and expand the “cold island” effect of green spaces;
- ➁
Increase vegetation coverage. Compared with increasing green space in a large area, strengthening street greening and management, and making full use of tree shade and transpiration of plant leaves to reduce temperatures represent suitable improvement measures for the central urban area of Beijing;
- ➂
Improve the green looking ratio. Planting layers should be enriched, vertical greening and roof gardens chosen, green vegetation that can be seen by people increased, and the green visibility of streets improved, indirectly playing a role in cooling and humidifying streets.
- (2)
Sense of belonging of actions and activities
A sense of belonging comes from people’s dependence on the environment and cultural identity. Jan Gehl believes that the environment has a great influence on people’s spontaneous activities, and activities can only take place in the right place [
33]. On the basis of a comfortable environment, people produce a variety of behaviors and activities in the block, and the construction of good infrastructure encourages residents to travel and promotes communication between residents, gradually deriving the unique culture of the street. A relevant study showed that the blood oxygen saturation concentration in an open area was significantly lower than that in a shaded area, which was positively correlated with solar radiation. After being stimulated by heat, an increase in the blood oxygen concentration accelerated body metabolism, resulting in greater heat release [
34]. Therefore, by increasing cooling materials, placing infrastructure with street characteristics, and limiting artificial heat source emissions, a good environment can be created in the high-temperature exposure environment.
- ➀
Increase cool material. Movable potted plants and pavement materials with low reflectivity are especially suitable for hutongs in the old city of Beijing, which can improve the microclimate environment while improving the environmental quality to increase community identity and build a sense of belonging to the home;
- ➁
Increase infrastructure. Taking into account the walking speed and time of vulnerable groups, rest facilities, such as sunshade devices and rest seats, should be placed at appropriate intervals. With the help of cooling spray and road sprinklers, the physical cooling method can directly and effectively reduce the temperature of high-risk hot spaces.
- ➂
Limit artificial heat sources. The direction and speed of vehicles on the street should be limited to minimize the influence of artificial heat sources. The high-density road network in Beijing causes problems regarding artificial heat sources, in which traffic is particularly serious. Restricting the driving time, direction, and speed of vehicles in street districts can minimize the influence of artificial heat sources.
- (3)
Inner feeling of pleasure
It is possible that people exist in a state of irritability in hot weather, which inevitably lead to extreme behavior, and the elderly are more vulnerable to acute sudden diseases. At present, since the understanding of high-temperature risk is insufficient, the construction of comfortable physiological and inner pleasure should be focused on. Happiness is not only a basic physiological response but also positive feedback from a good environment and positive living behavior. Specific measures can be implemented in two ways: carrying out public participation activities in the “cold space” in street spaces and applying intelligent means.
- ➀
Organize public participation activities. Neighborhood committee members can regularly give lectures on the identification and planting of cooling and heat-relieving plants, improve public participation, and broadcast the risks of high temperatures and heat exposure.
- ➁
Application of intelligent means. Baitasi community and Shuangjing community in Beijing represent pilot projects of smart community construction, which refers to the promotion of building block sensors to collect climate and environment data, timely feedback, and warnings via a mobile phone APP, and real-time update of high-temperature meteorological data. APP represents a mobile phone application, which can check the recorded information on electronic devices at any time. In addition, intelligent quantification methods, such as “games” mini-programs, can be adopted to detail the contribution of an individual’s personal life to climate mitigation, to improve the physiological and psychological sense of pleasure in activities and entertainment. The feedback given by the APP can improve the pride of residents in mitigating climate change.
7. Discussions
This study had some limitations, which will be further researched in the future. For example, many factors influence high-temperature heat wave disasters, among which the altitude factor has the most direct impact on the temperature. Topographic and geomorphic factors were not included in the indicators in this study. For a social population, people with traditional chronic diseases and low-income people are more vulnerable to high temperatures, resulting in direct or indirect harm. Future research may focus on the environmental equity of heat exposure of special populations. For technical methods, since the date and location of street pictures collected through Python were diverse, the loss of data and the precision of semantic segmentation and translation calculation need to be improved. In future research, street view images and thermal comfort questionnaire surveys can be combined to further improve thermal environment research from the humanistic perspective. In addition, measures to improve heat exposure not only include environment renovation and renewal, but also involve many aspects of community environmental management and operation, so a refined urban governance approach for metropolises should integrate improvement of the climate environment based on human perception, which plays an important role in promoting the construction of a harmonious and livable city. Finally, in future research, it is necessary to investigate the impact of high-temperature heat exposure on people to deal with the danger of high-temperature heat waves, reduce the harm of high temperatures in urban areas, and provide a reference for healthy and sustainable development of living environments.


