
Investigation of Indoor Asymmetric Thermal Radiation in Tibet Plateau: Case Study of a Typical Office Building


Abstract
:1. Introduction
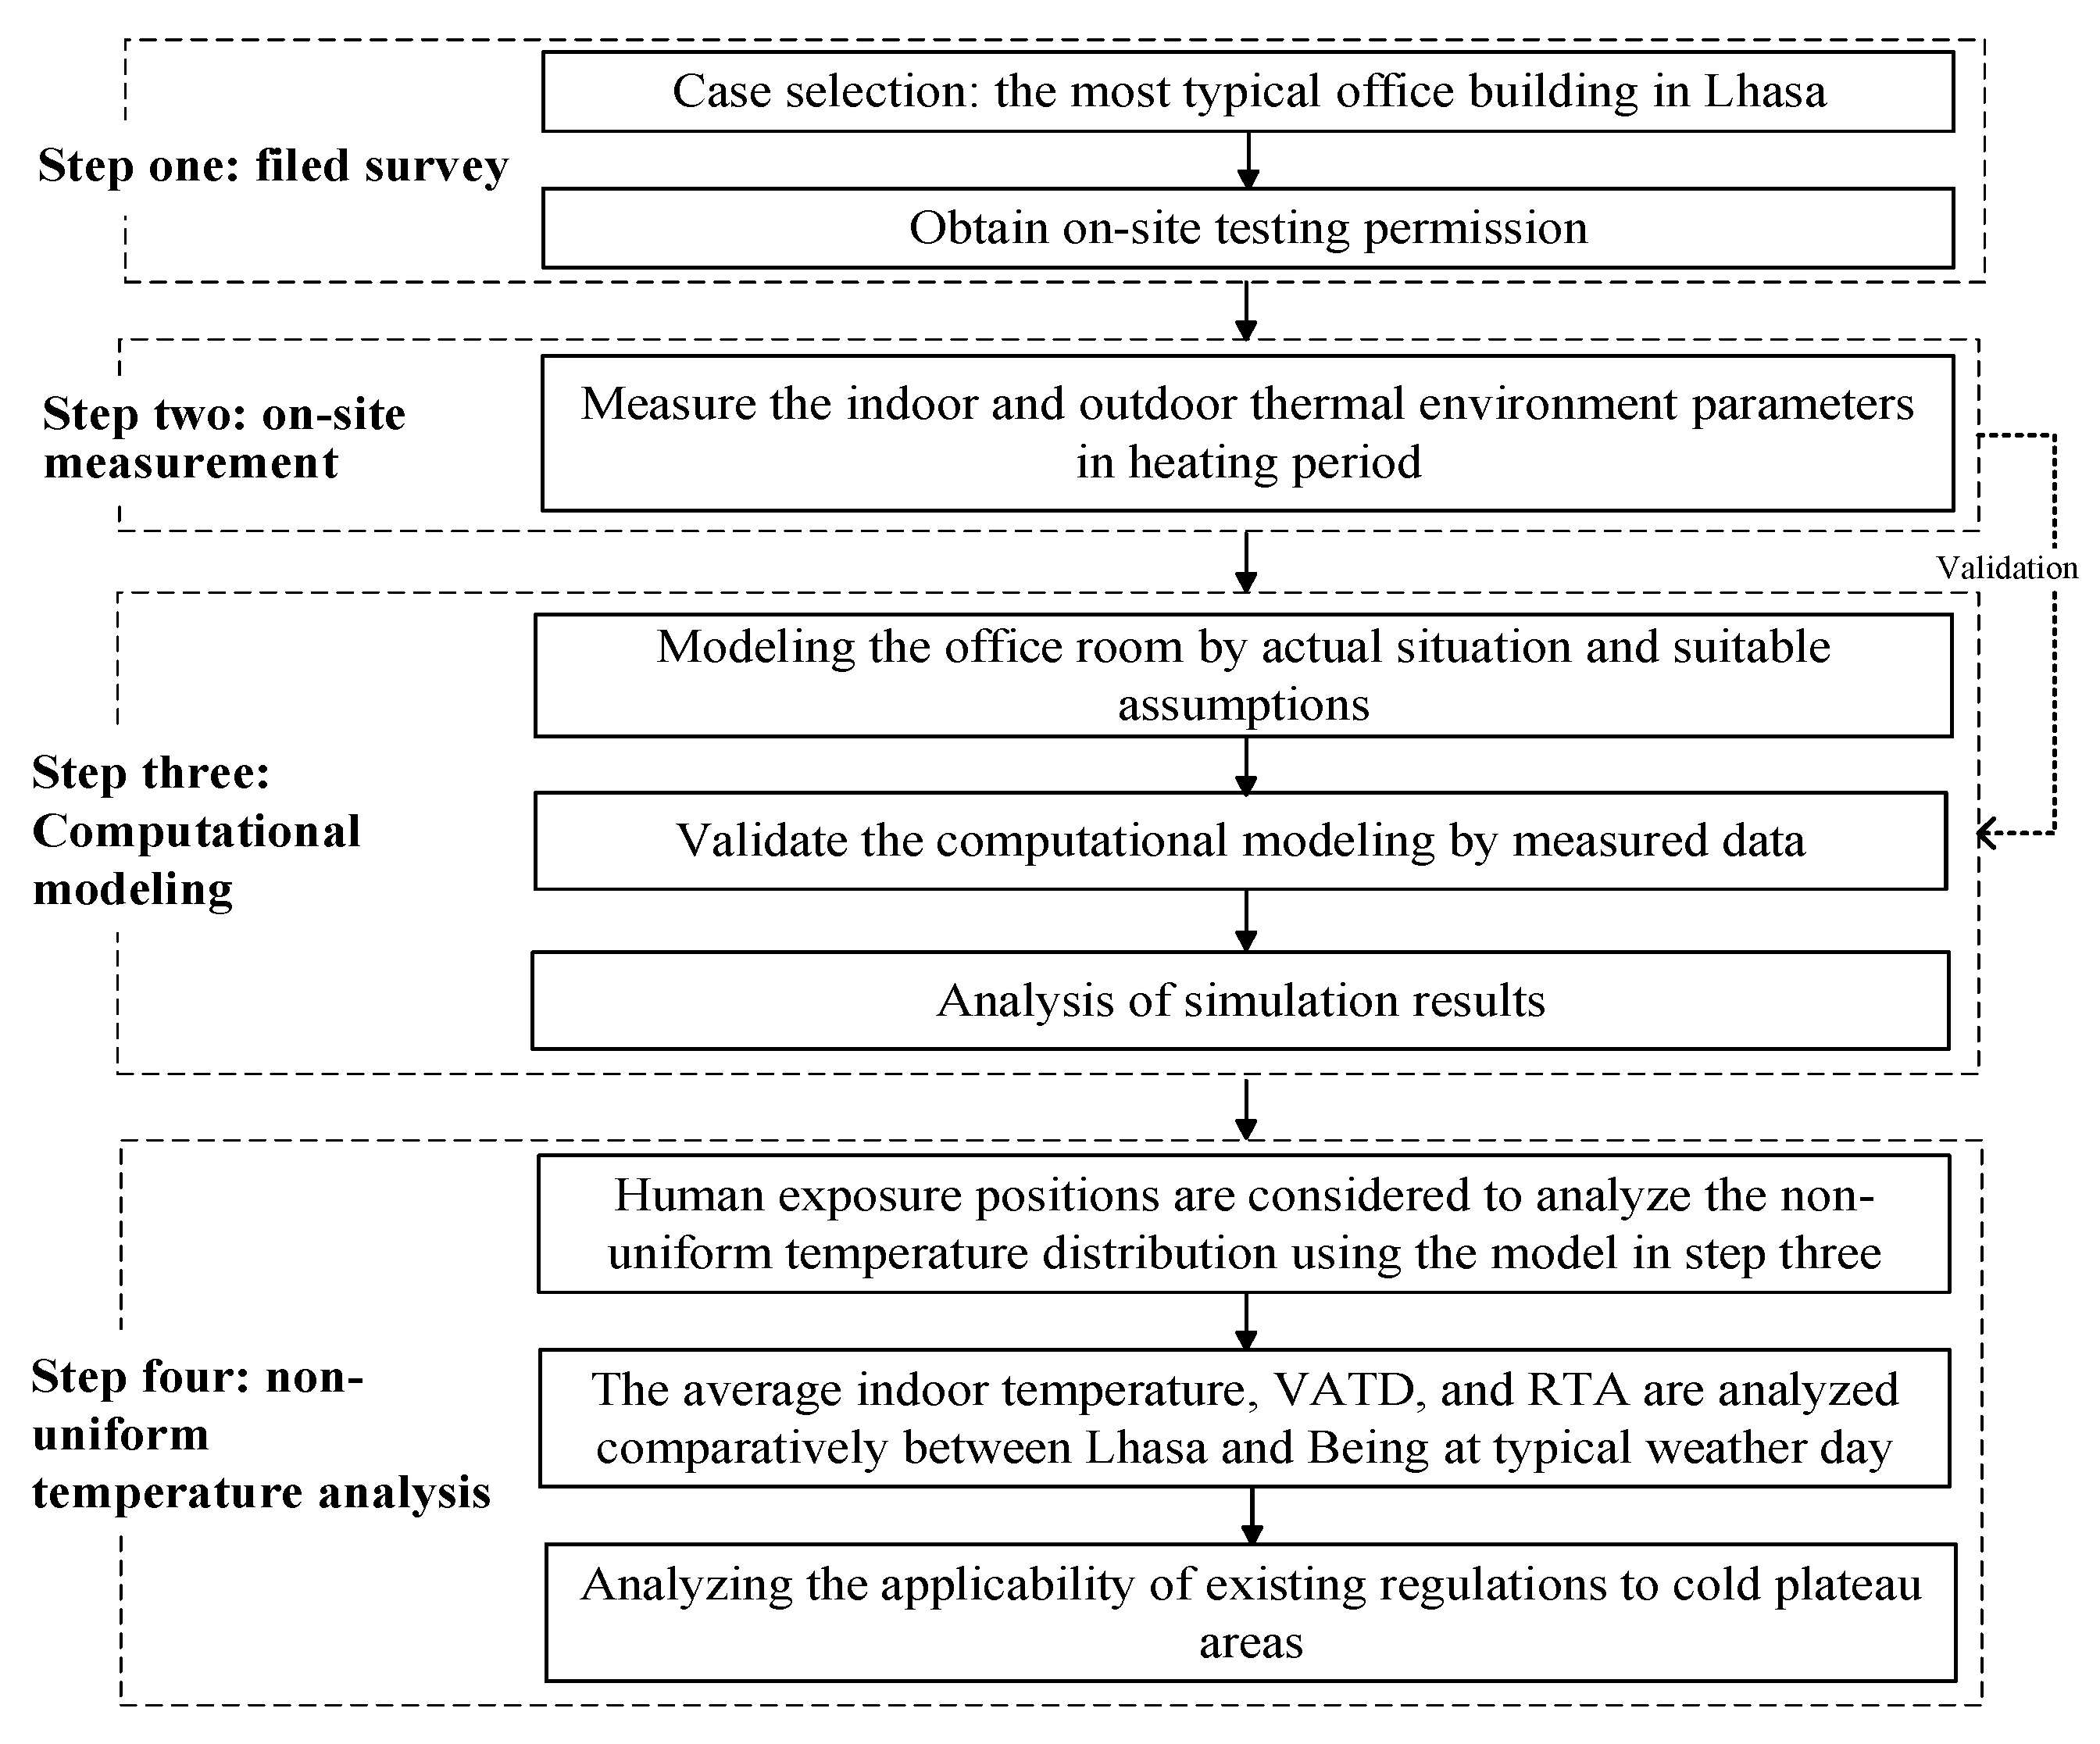
2. Methodology
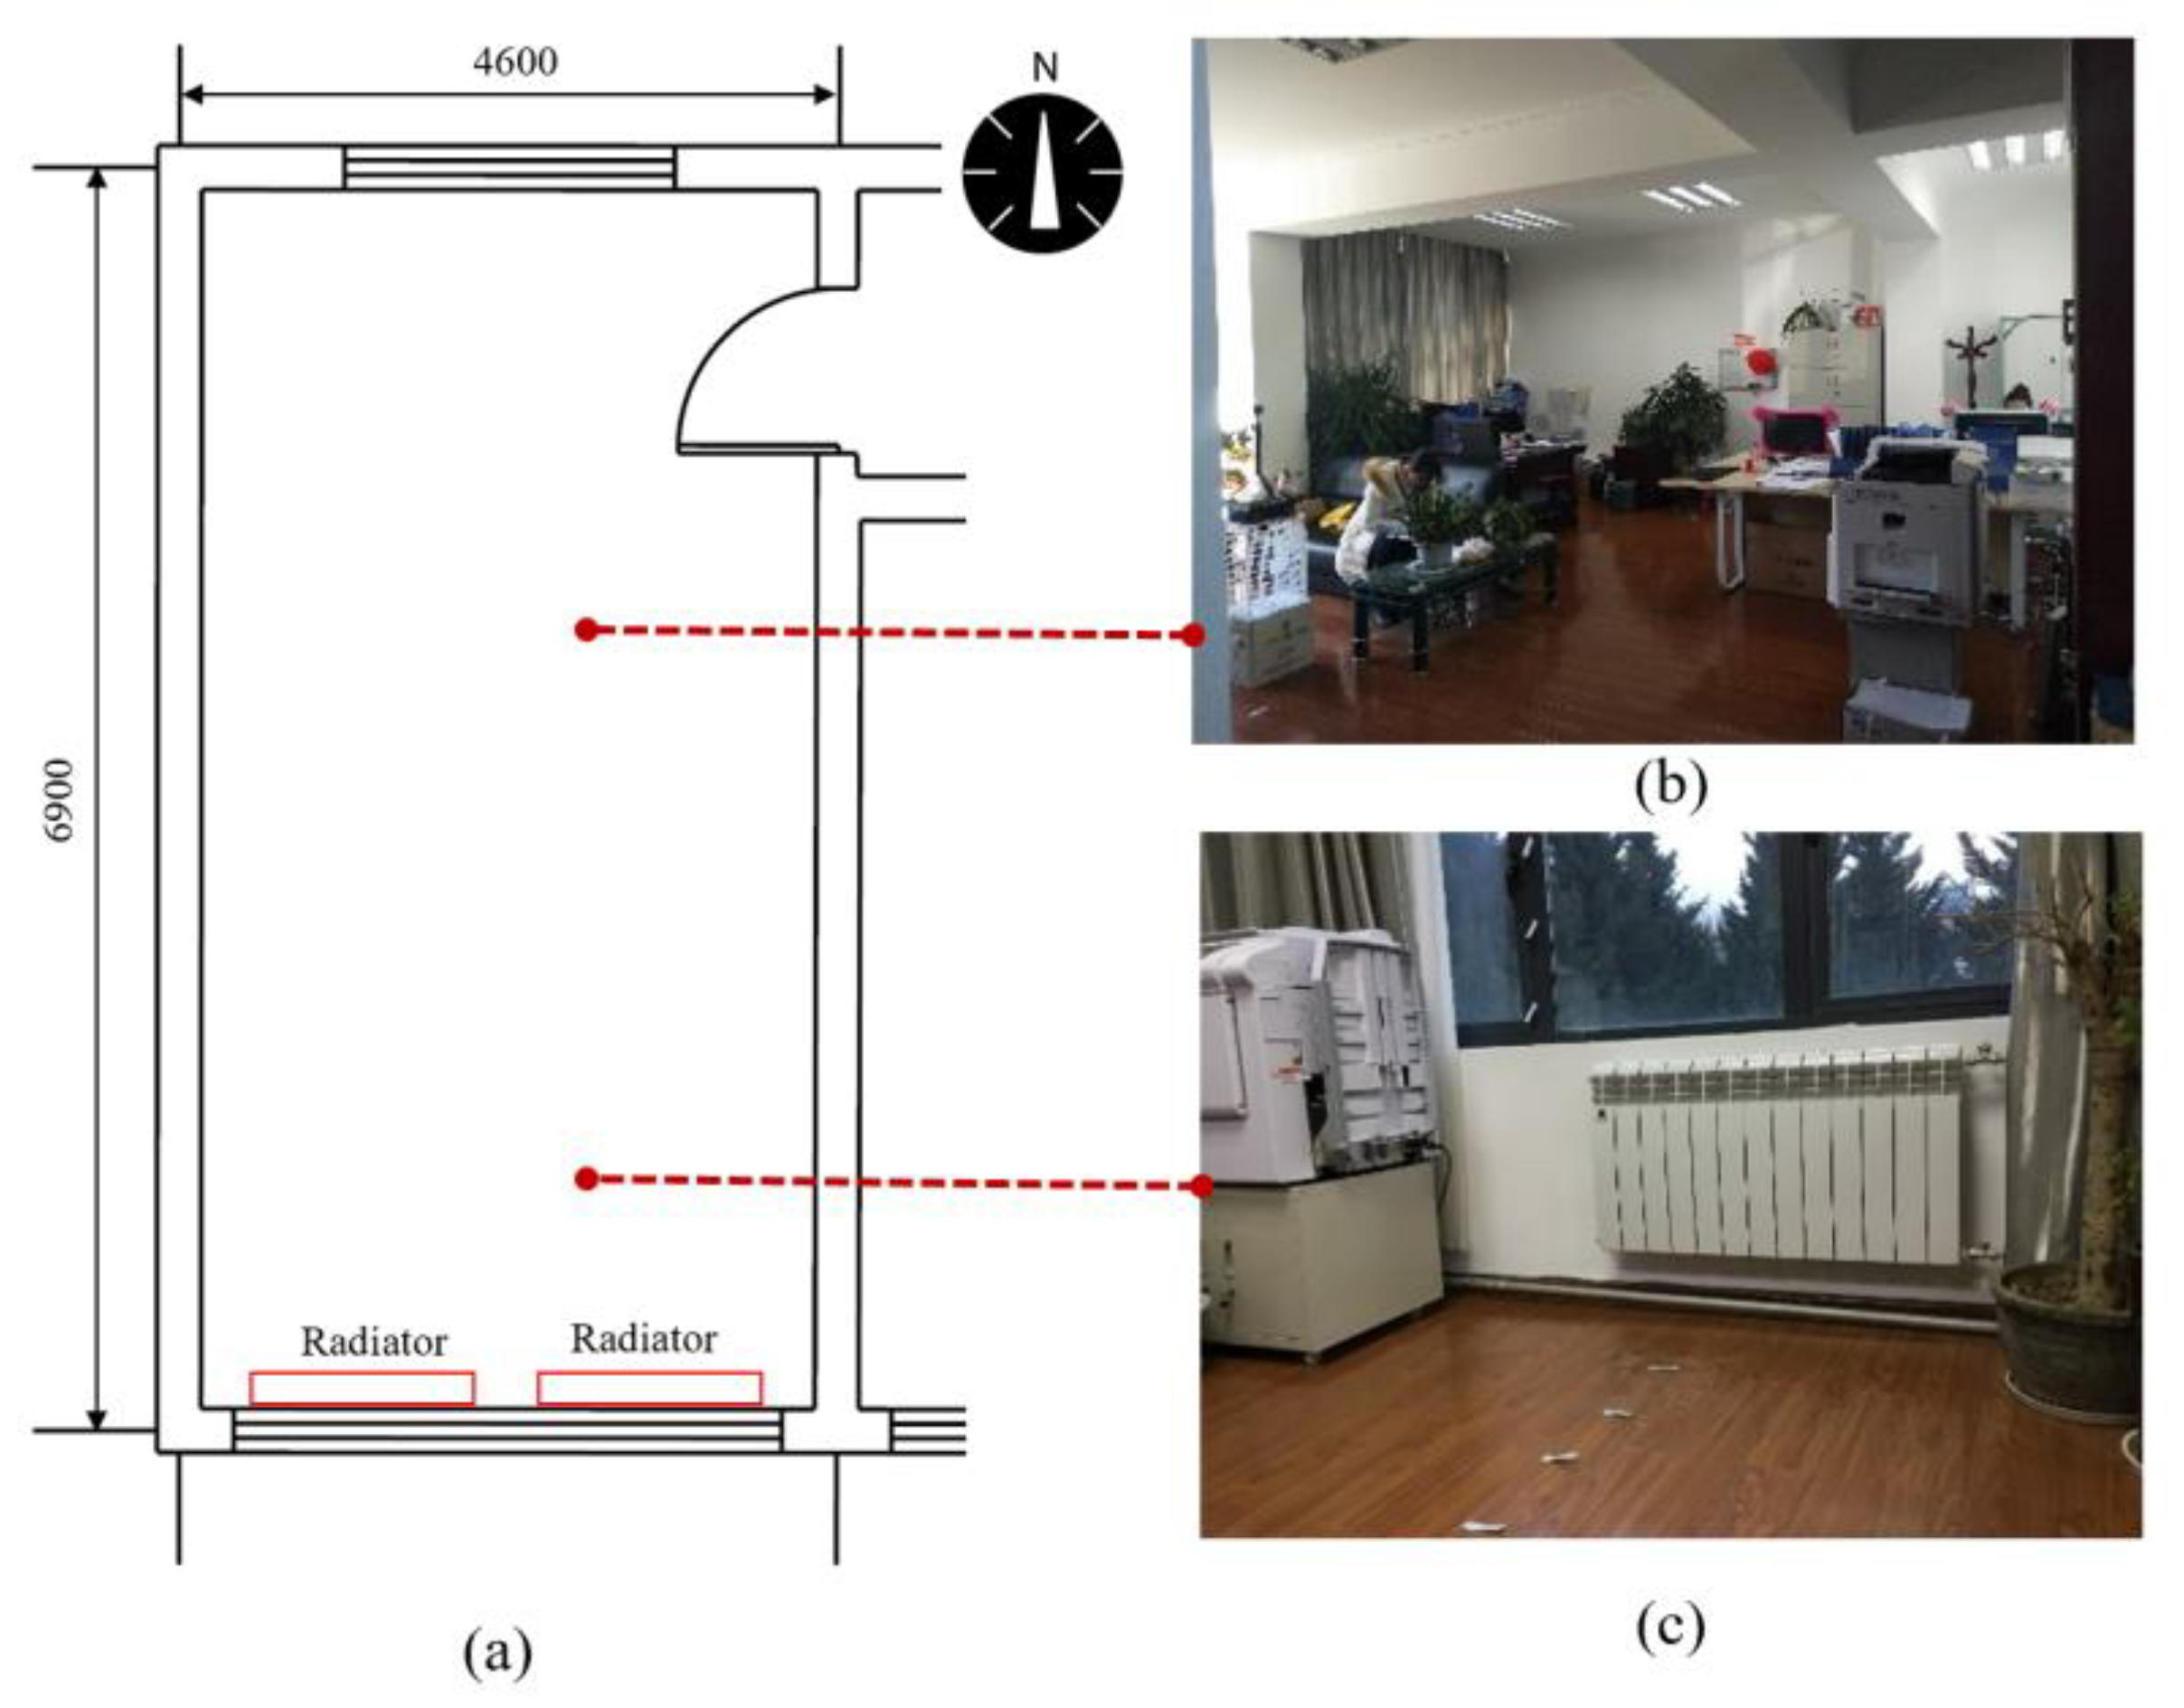
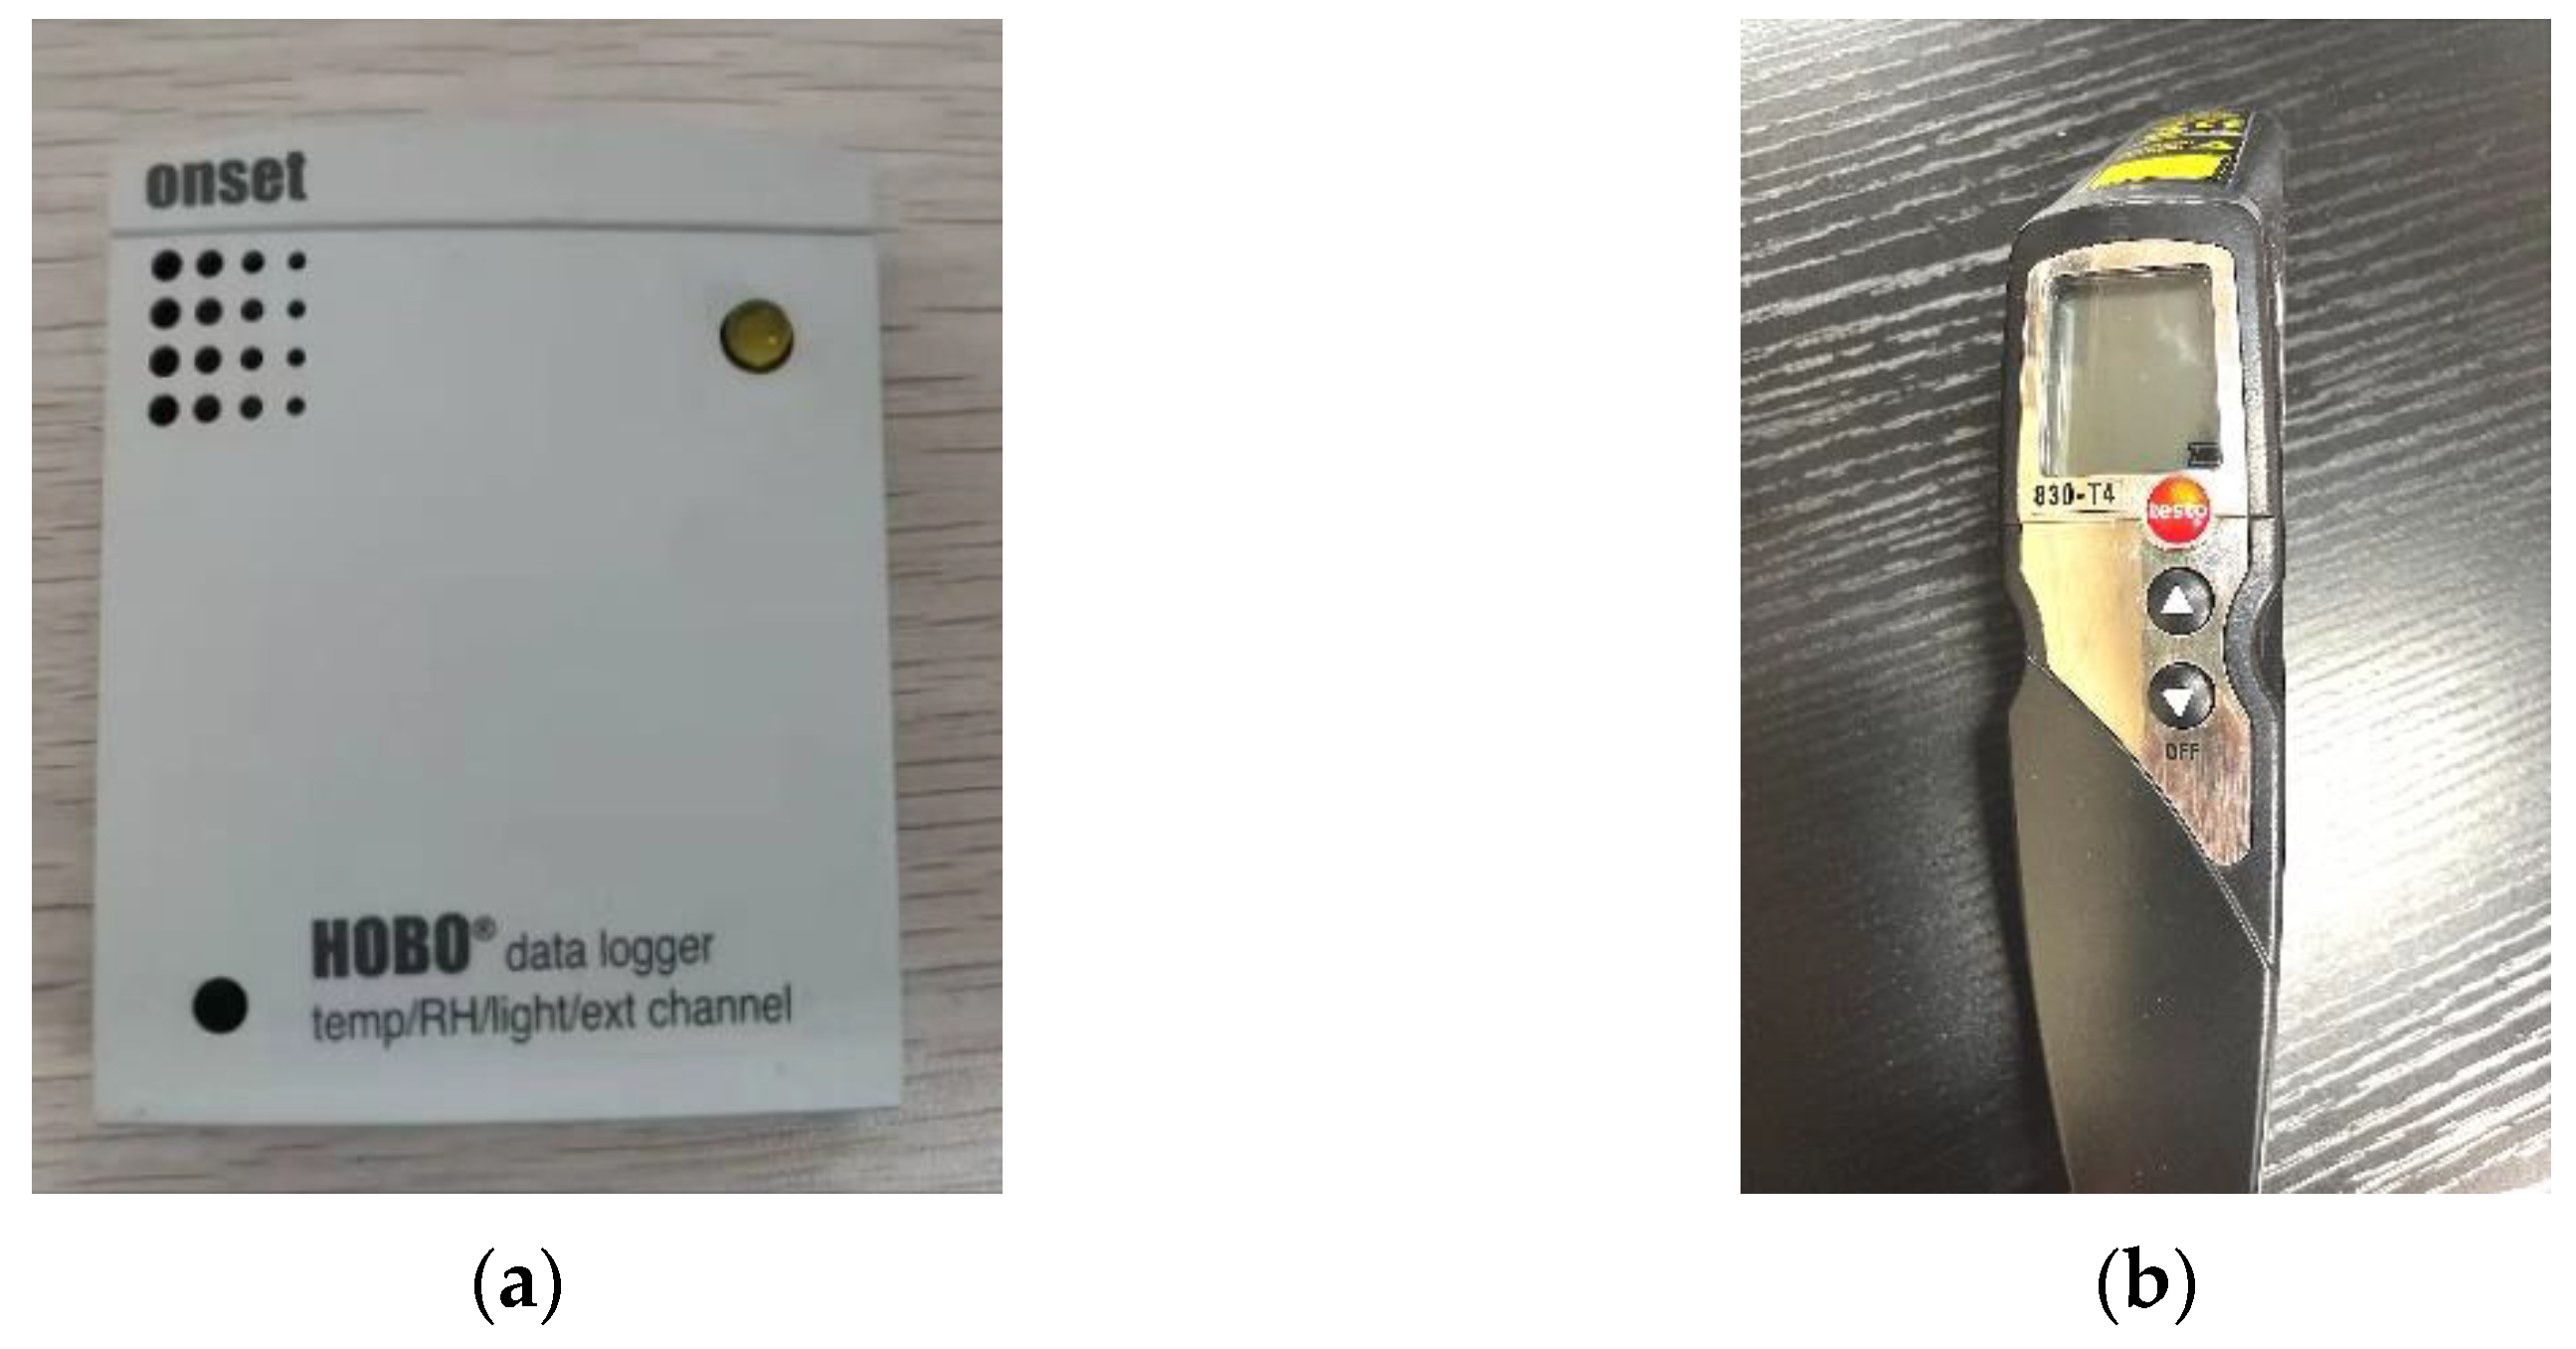
2.1. Field Test
- HOBO U12-012 digital temperature and humidity meter:
- 2.
- Testo 830-T4 handheld infrared thermometer:
2.2. Simulation and Assumptions
2.2.1. Governing Equations
2.2.2. Solution Methods
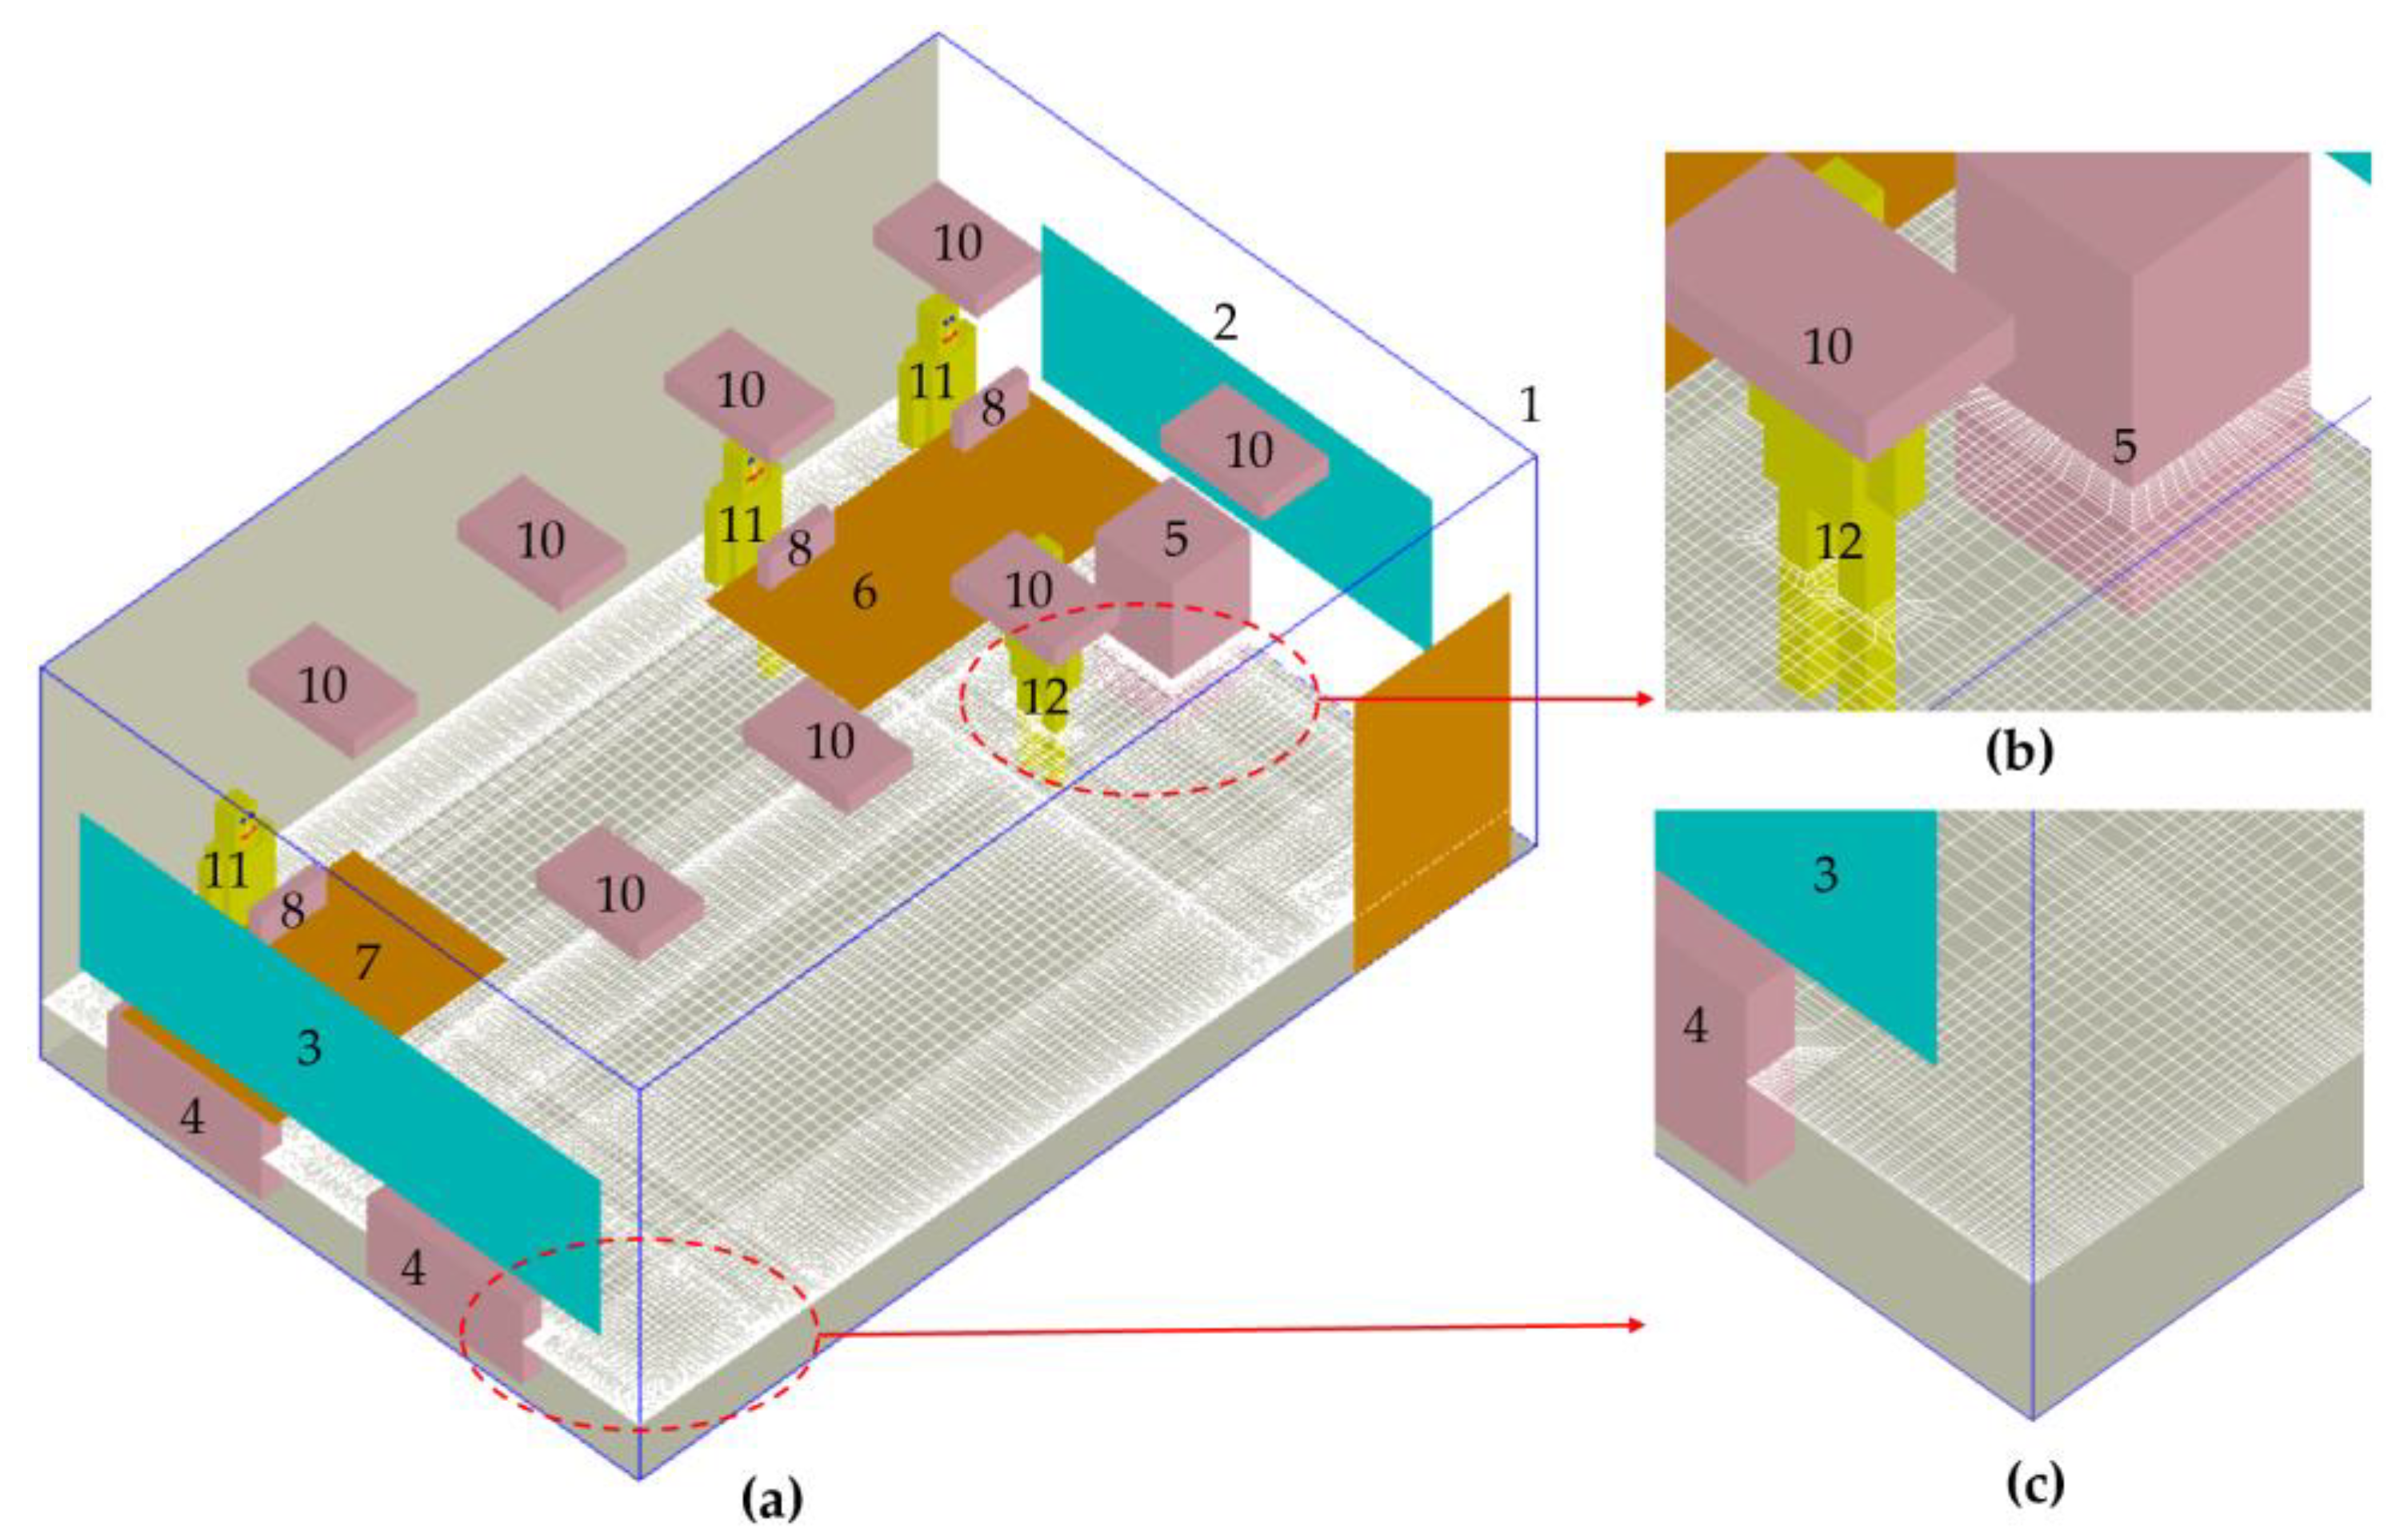
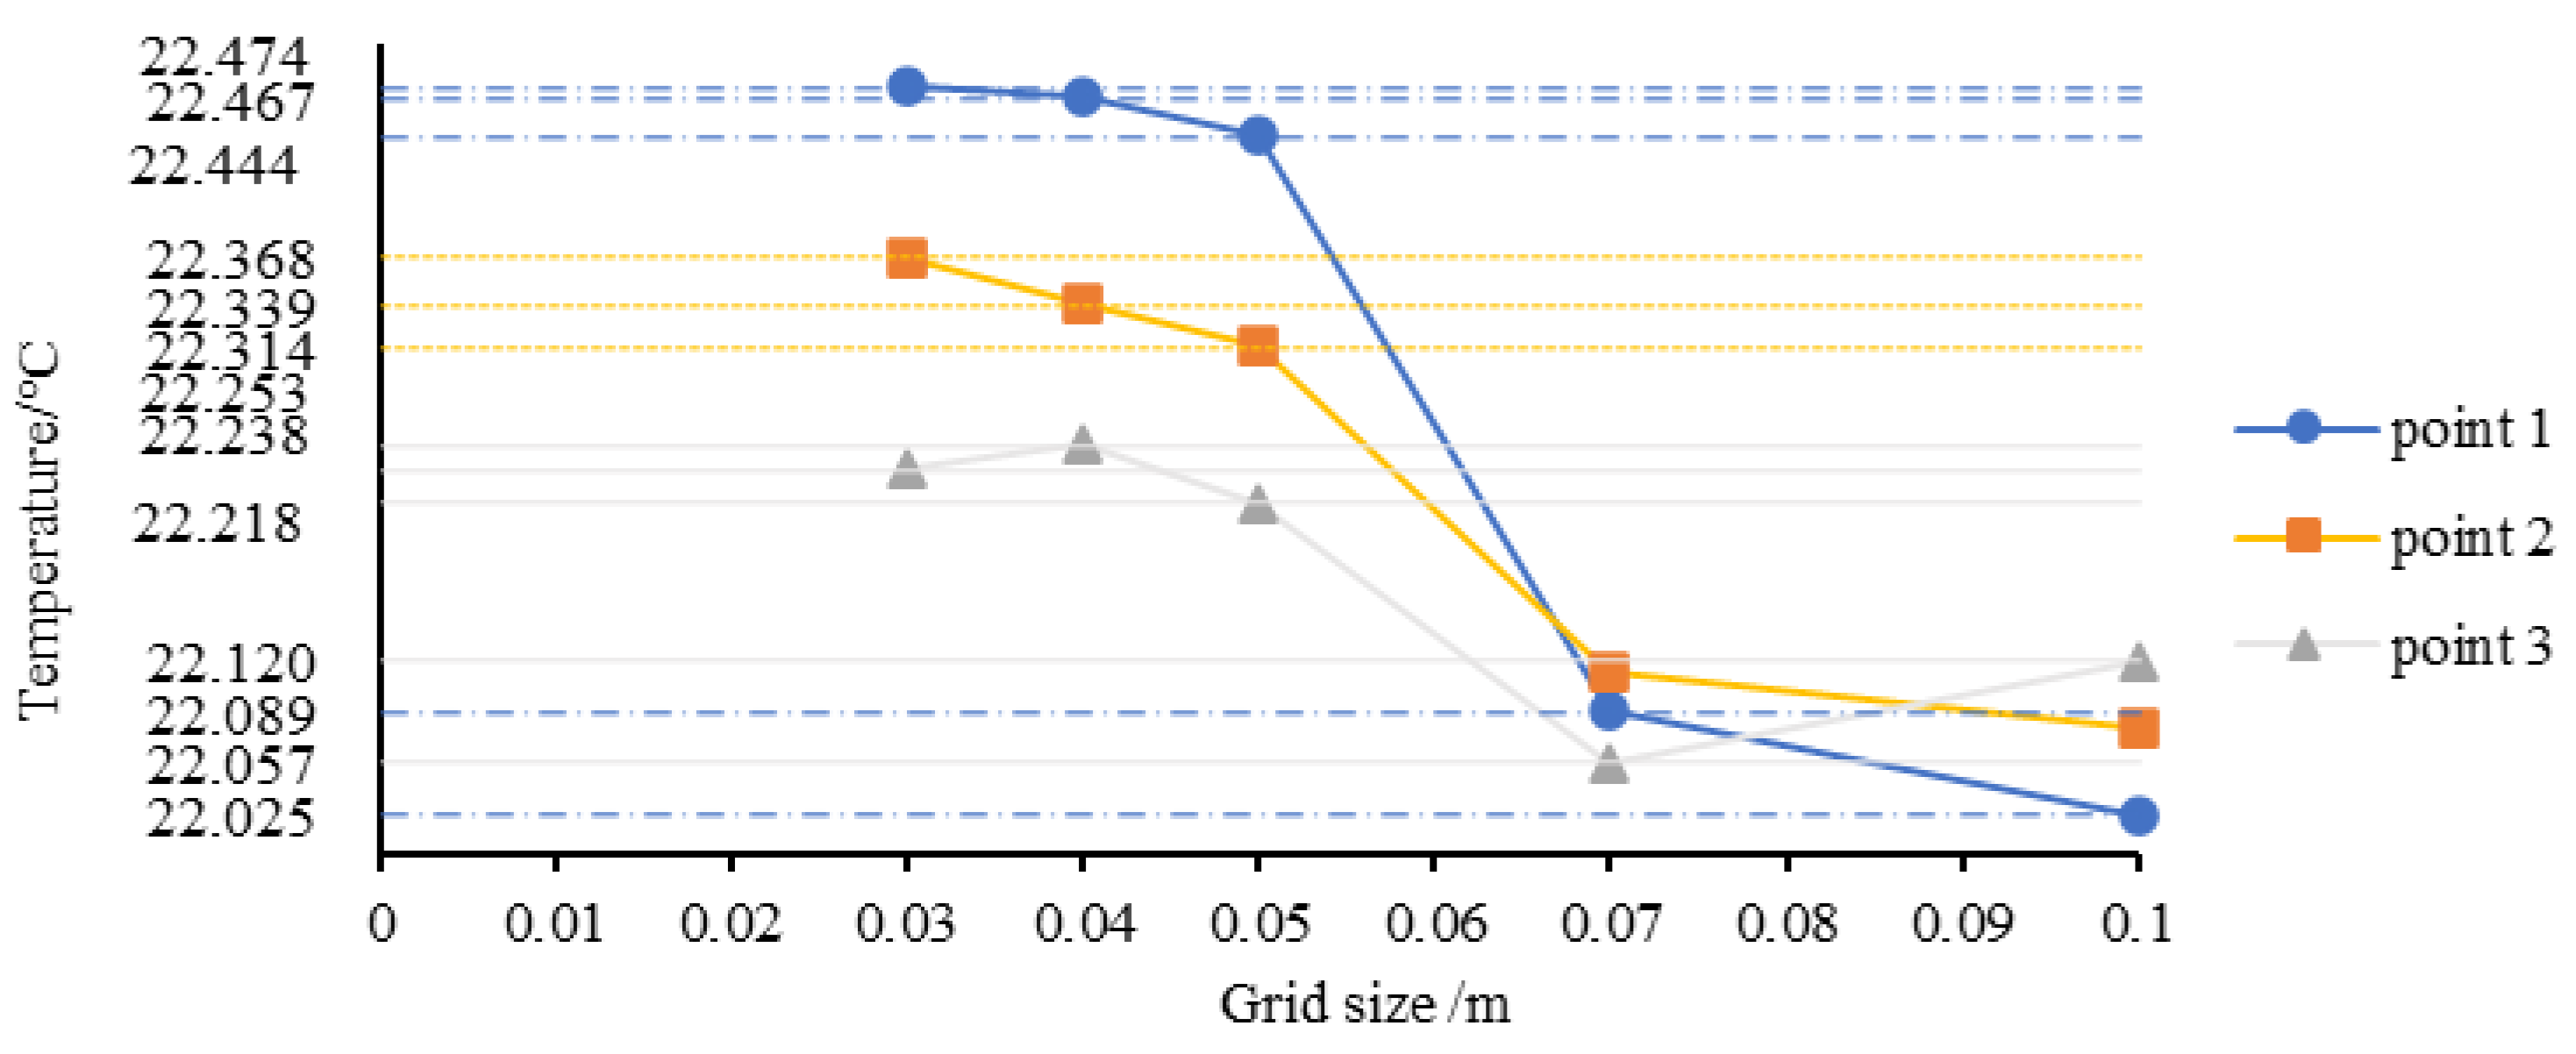
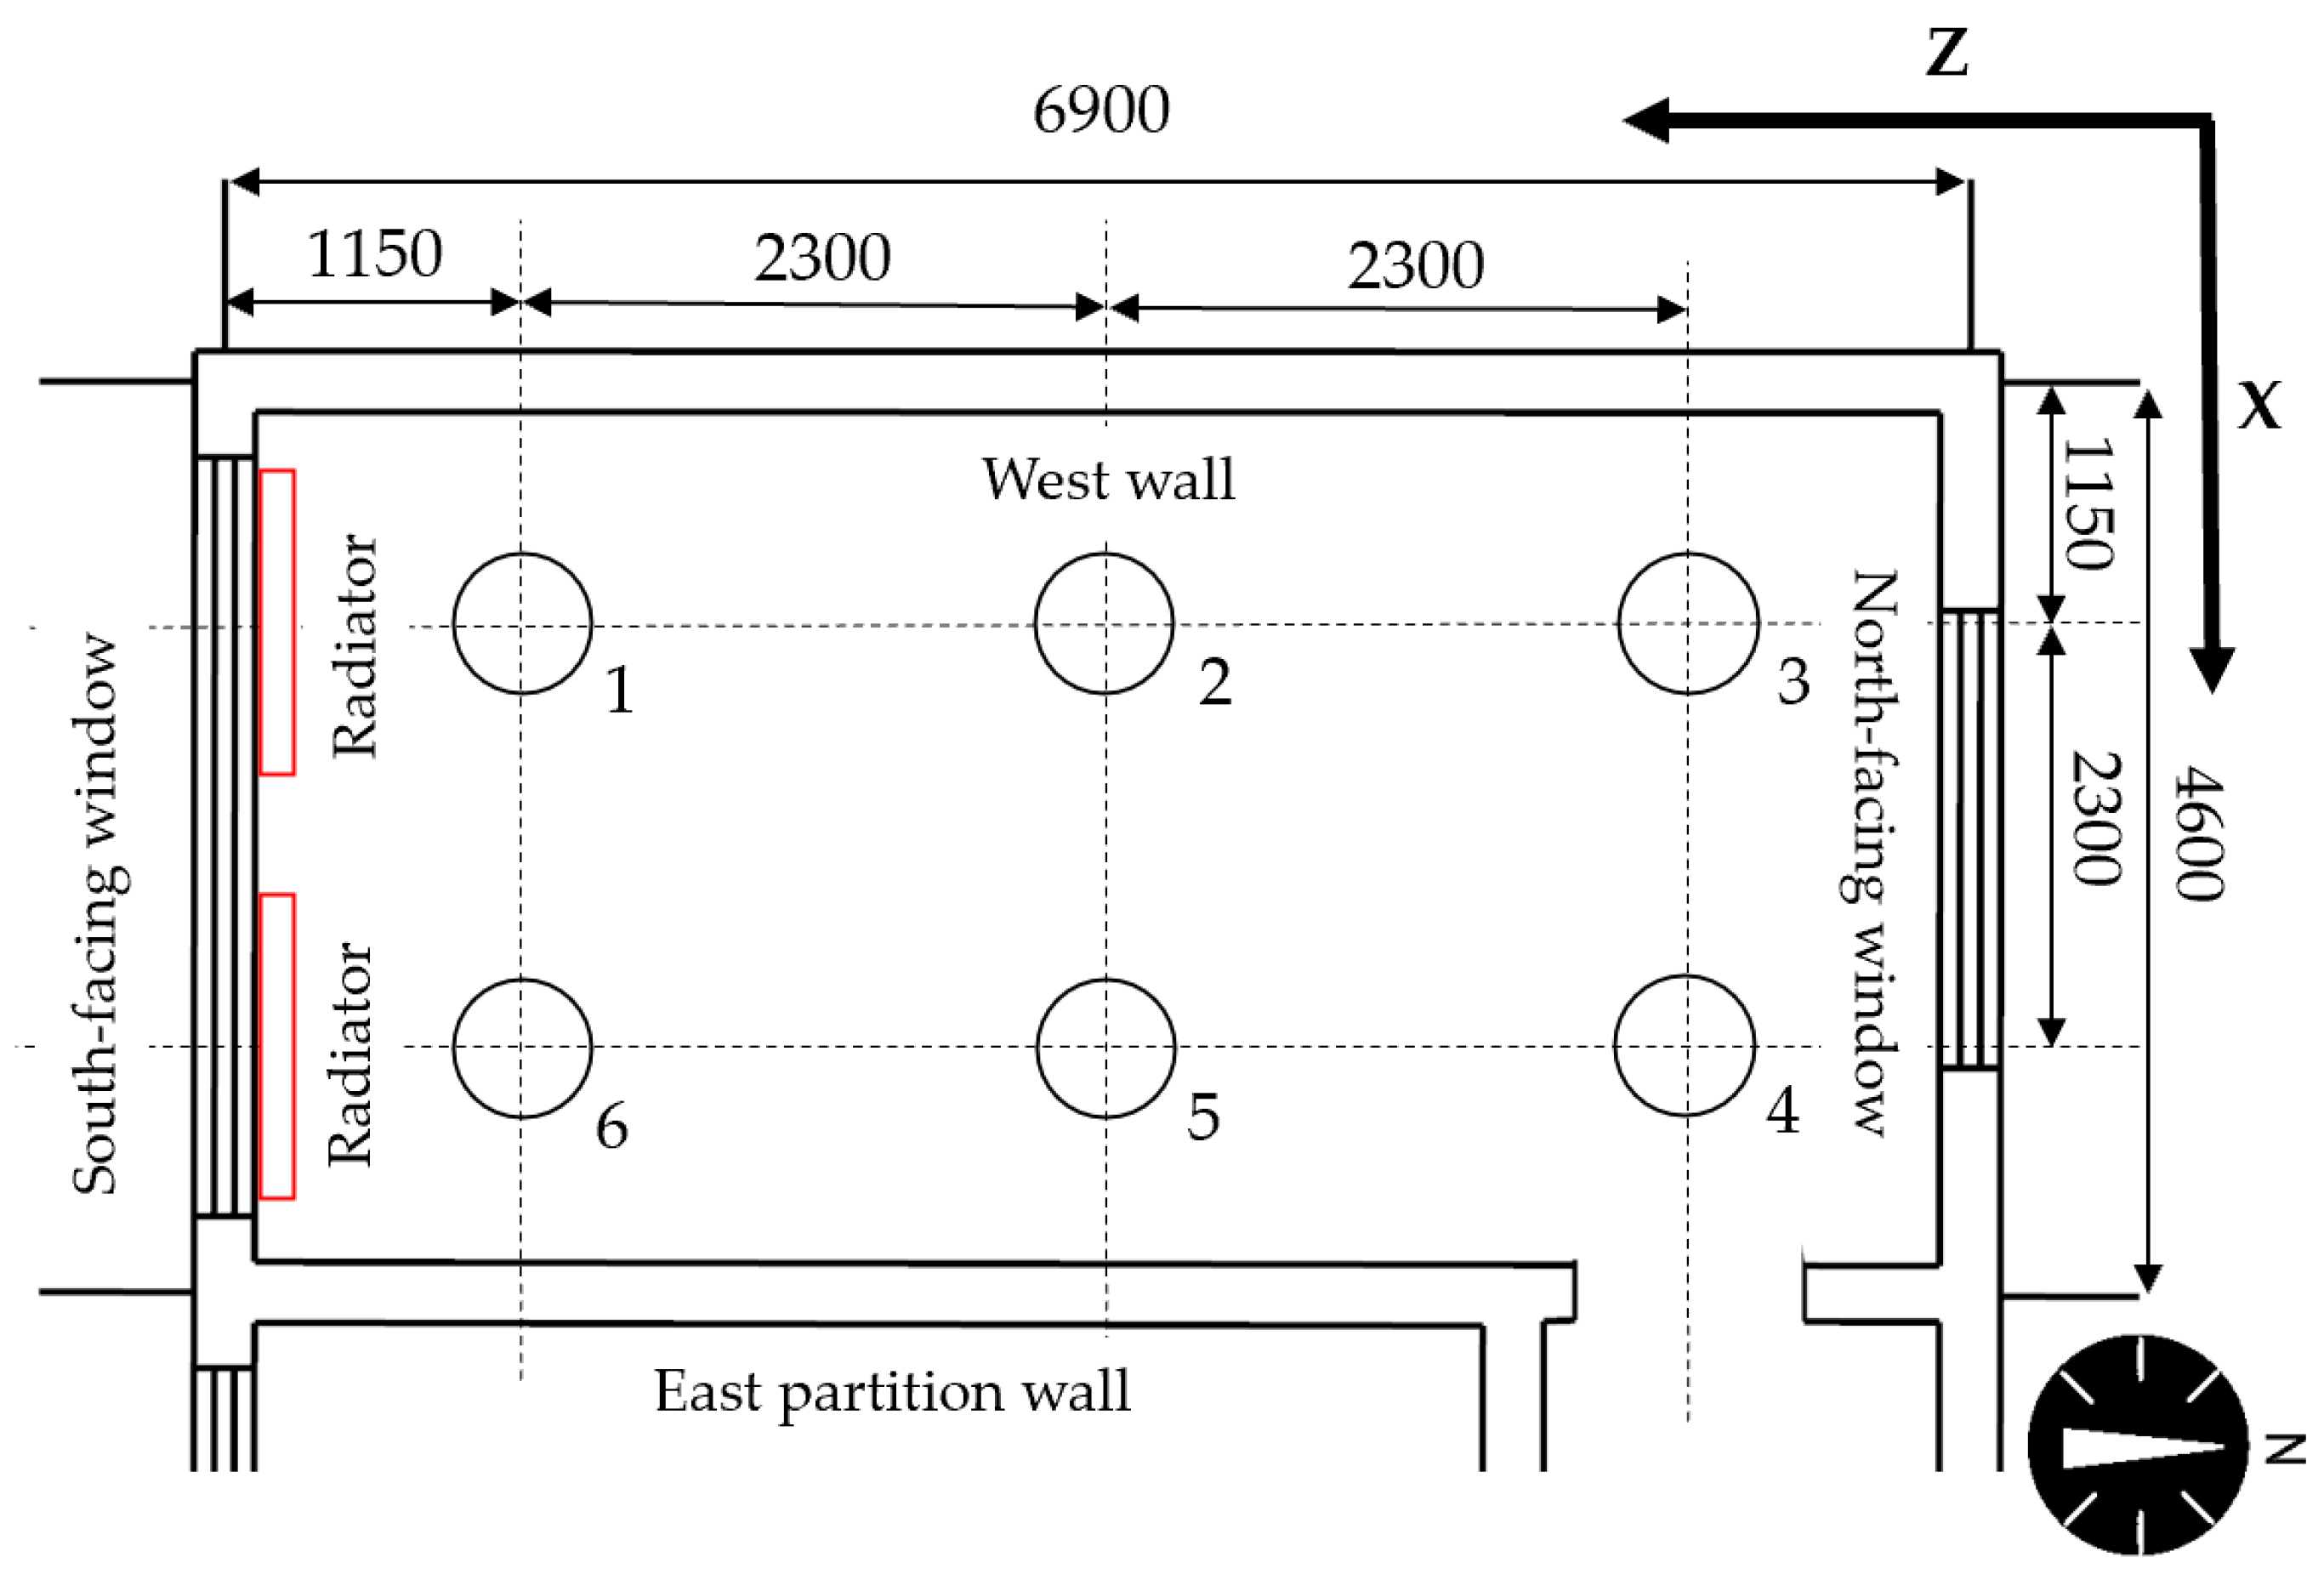
2.2.3. Computational Modeling
2.2.4. Operating Environment and Boundary Conditions
3. Results
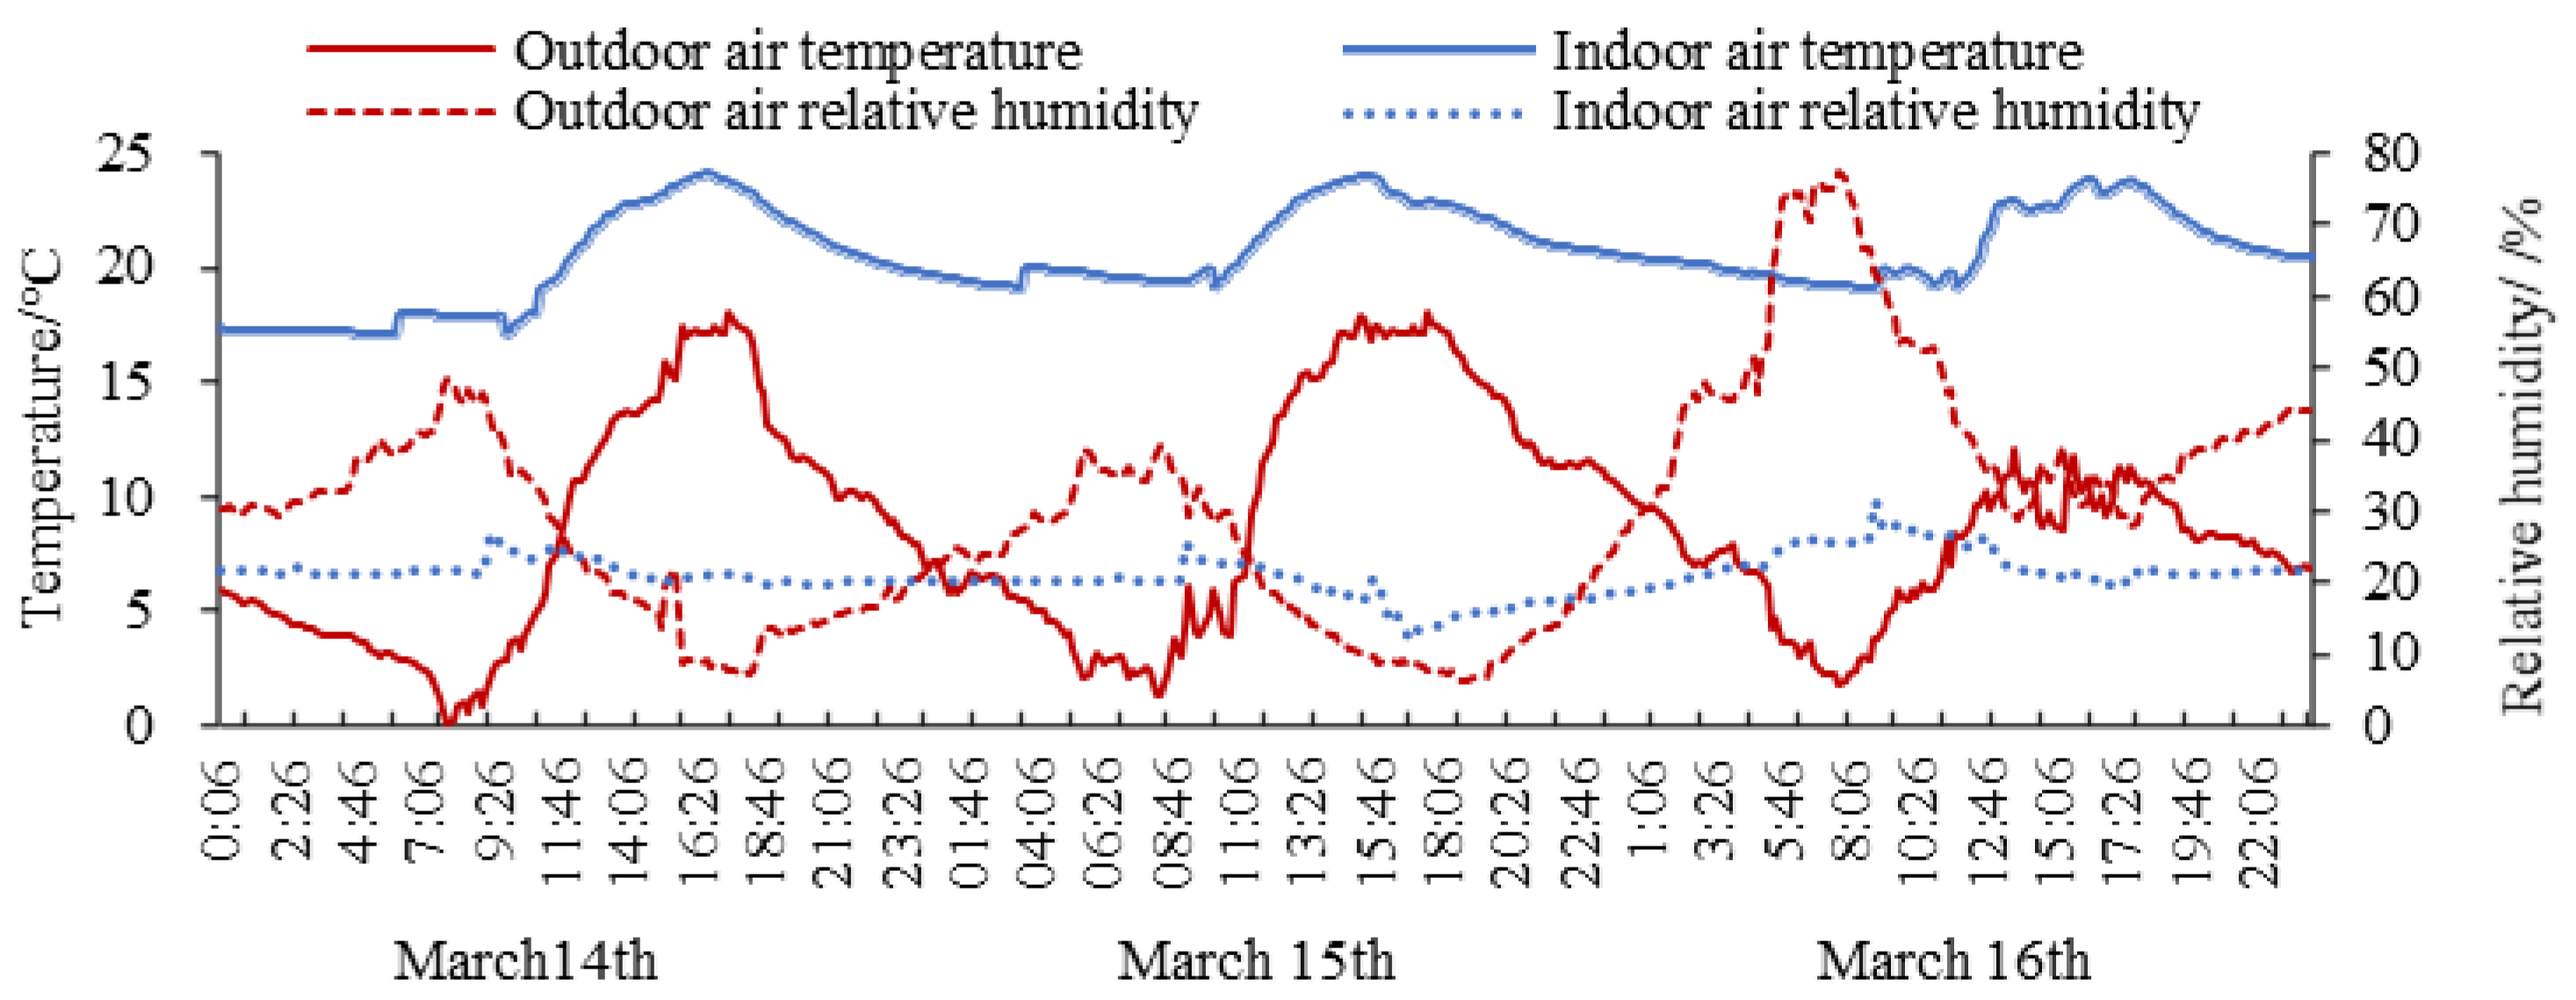
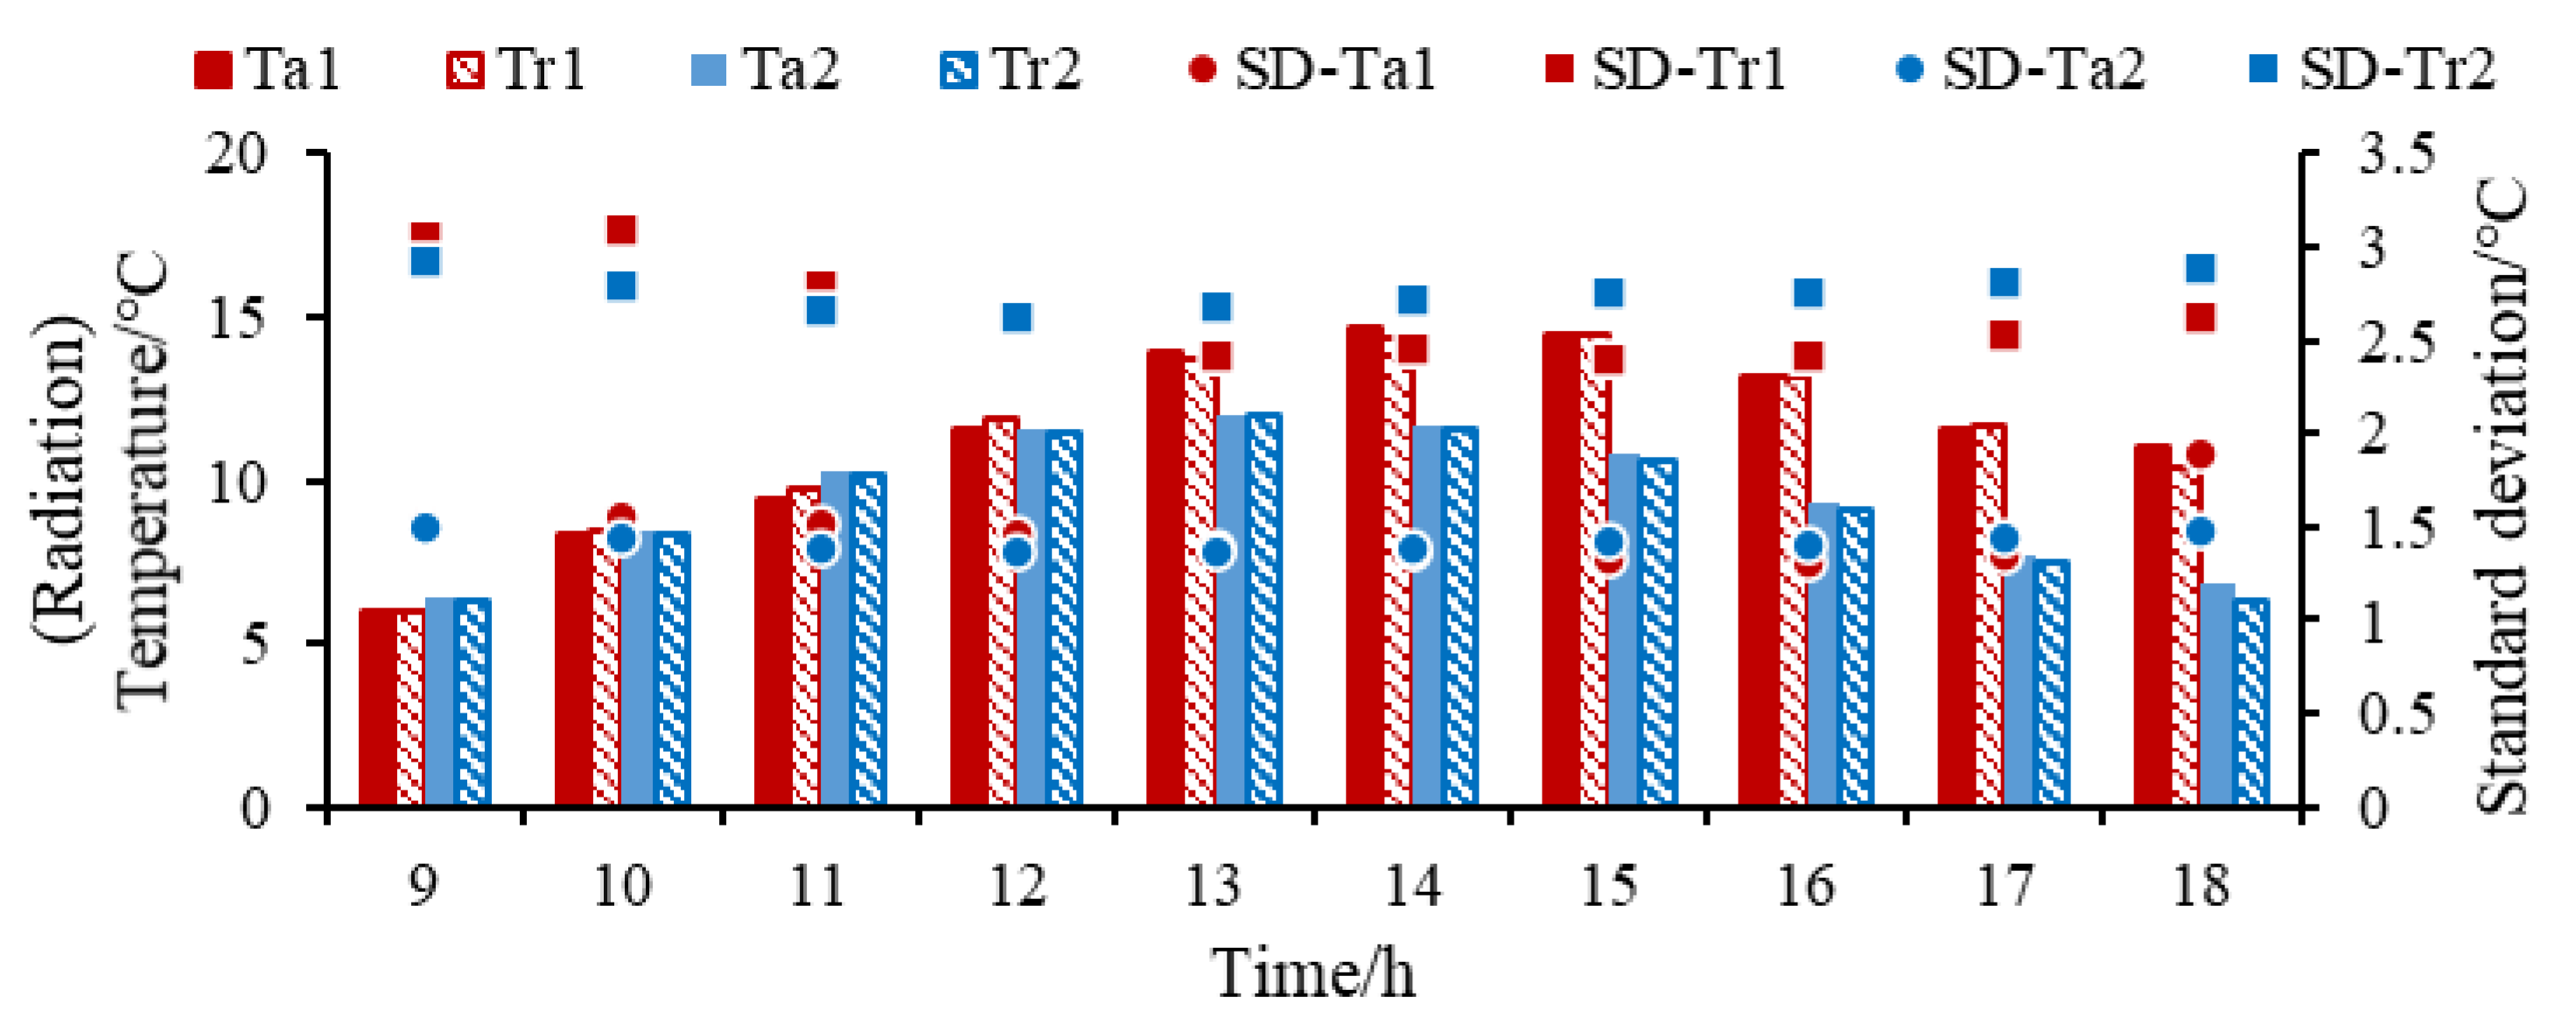
3.1. Measured Data and Analysis
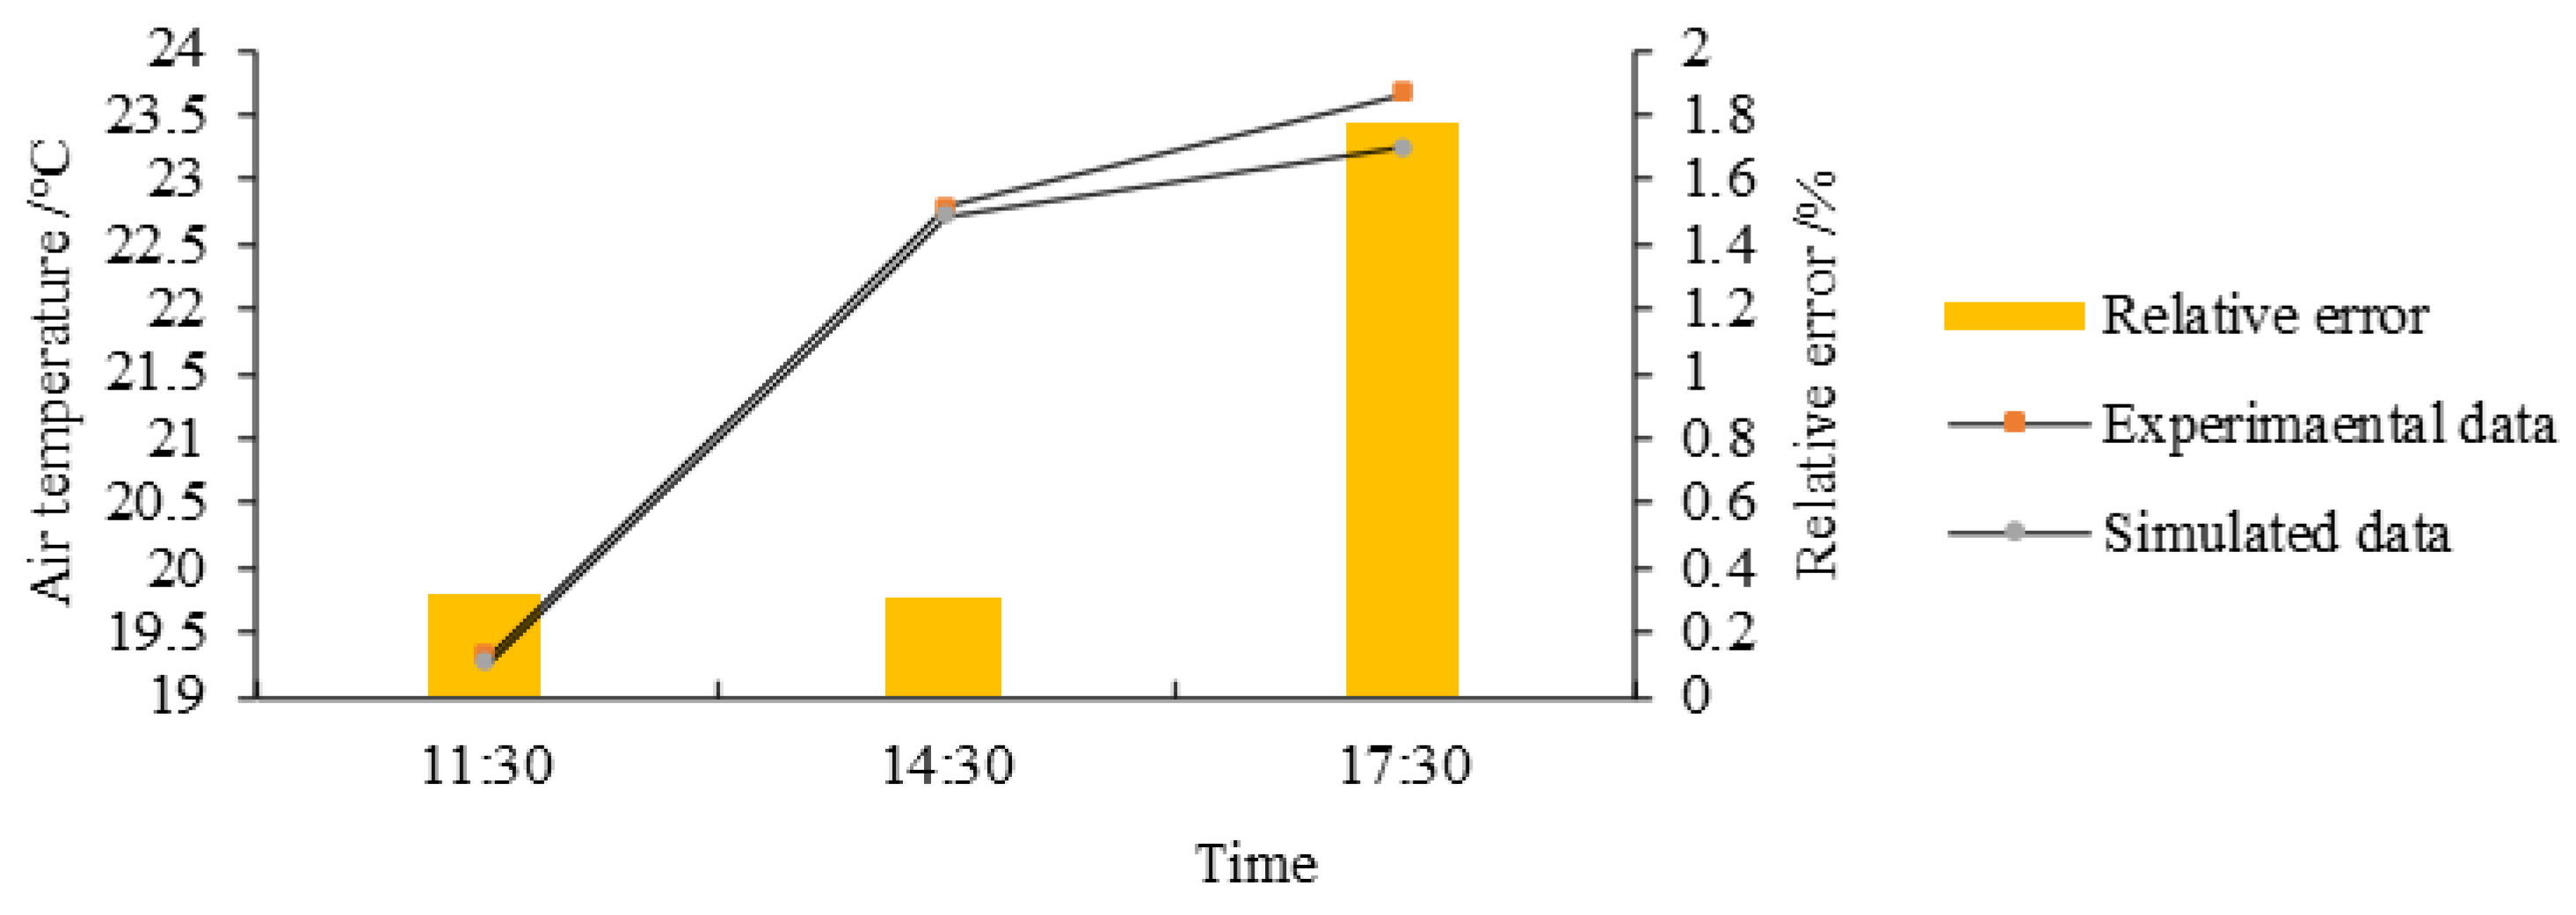
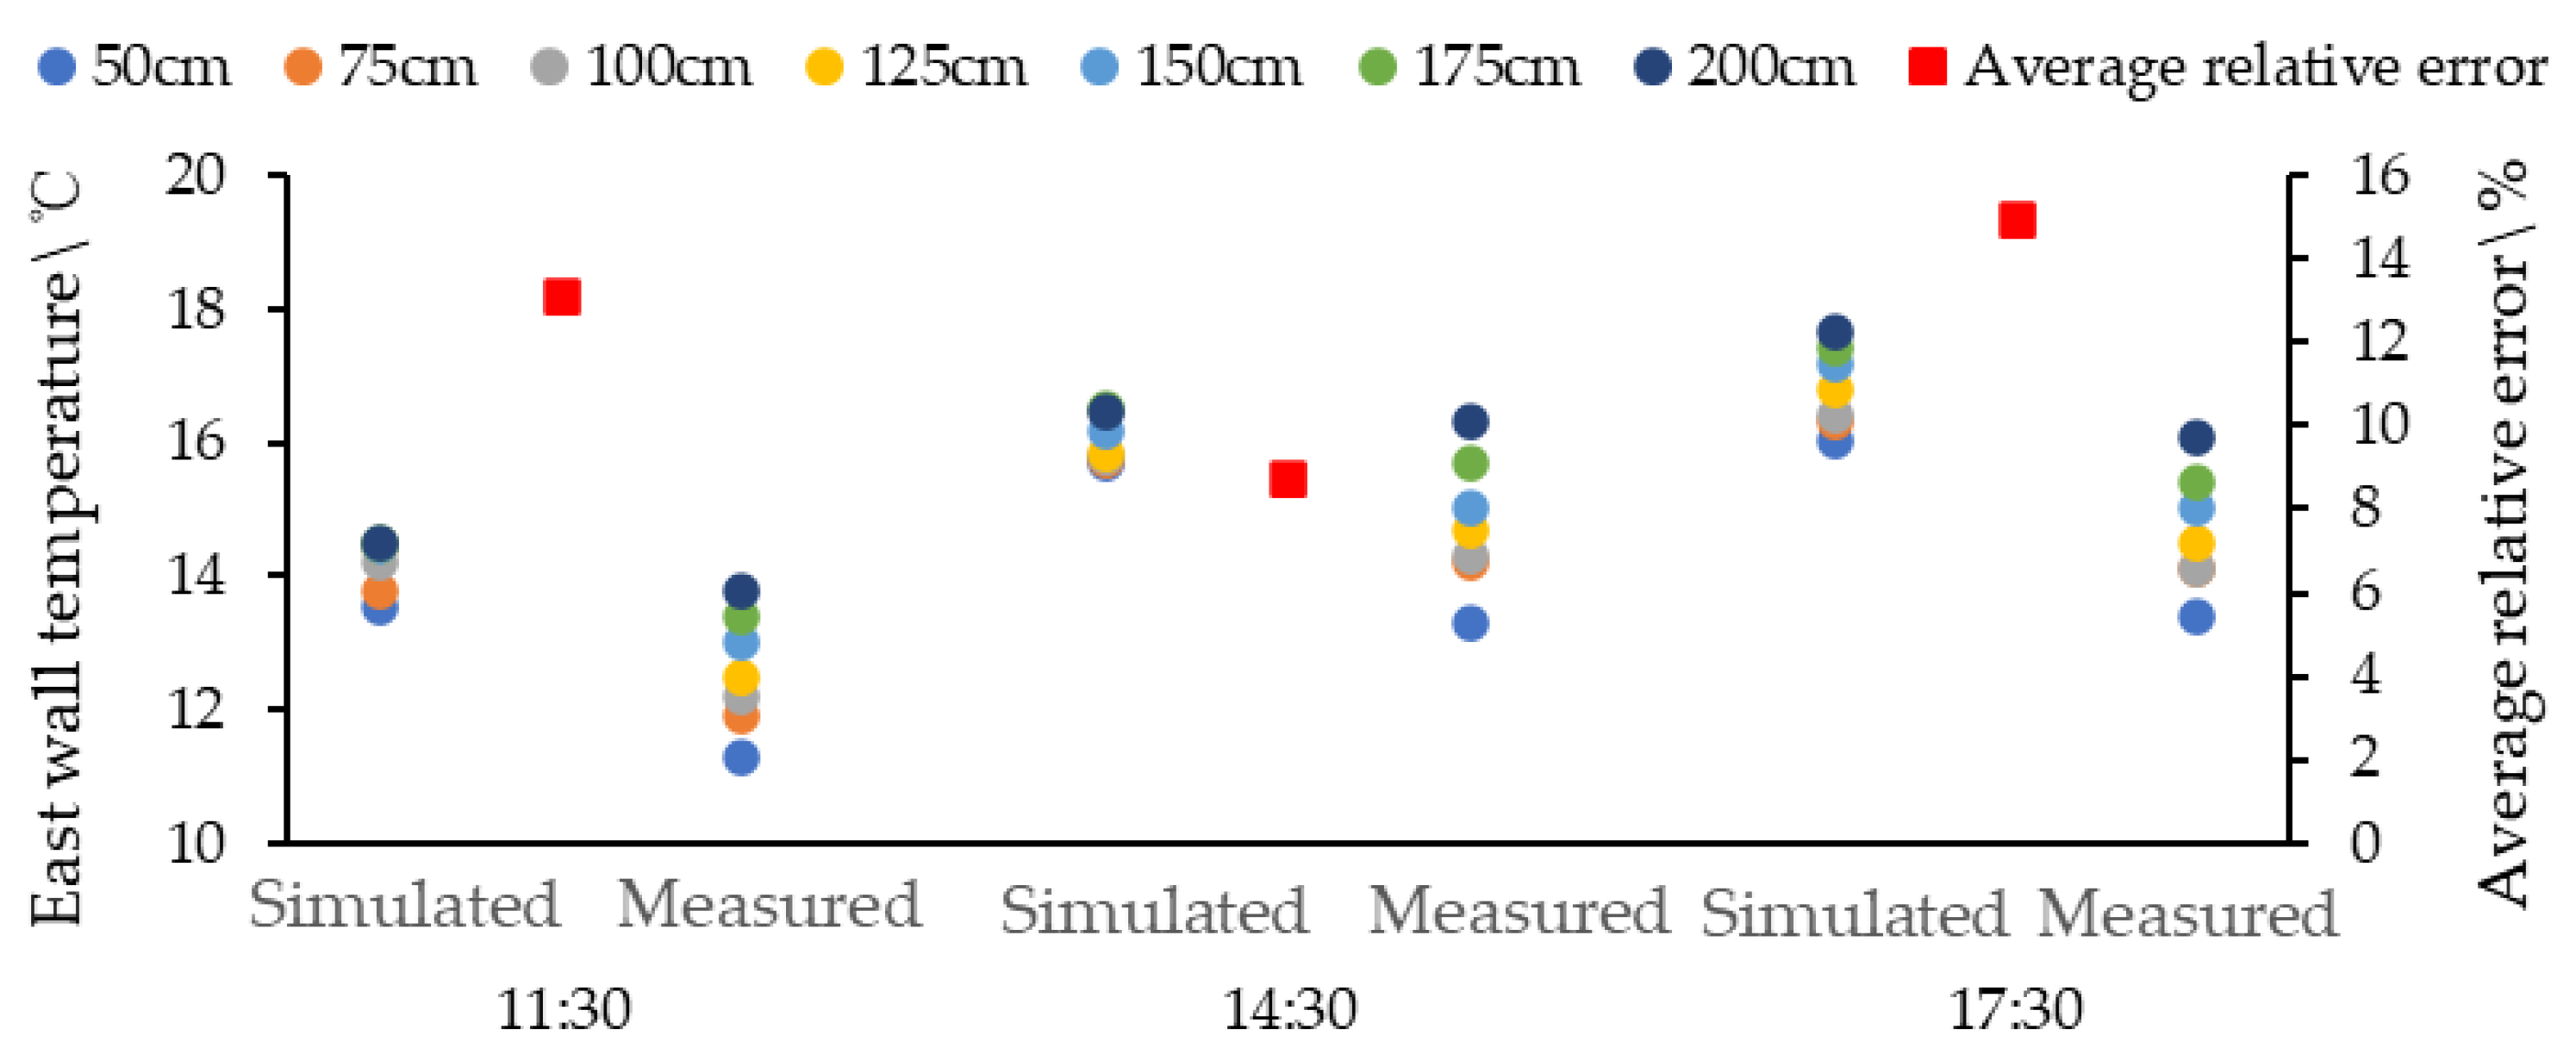
3.2. Model Verification
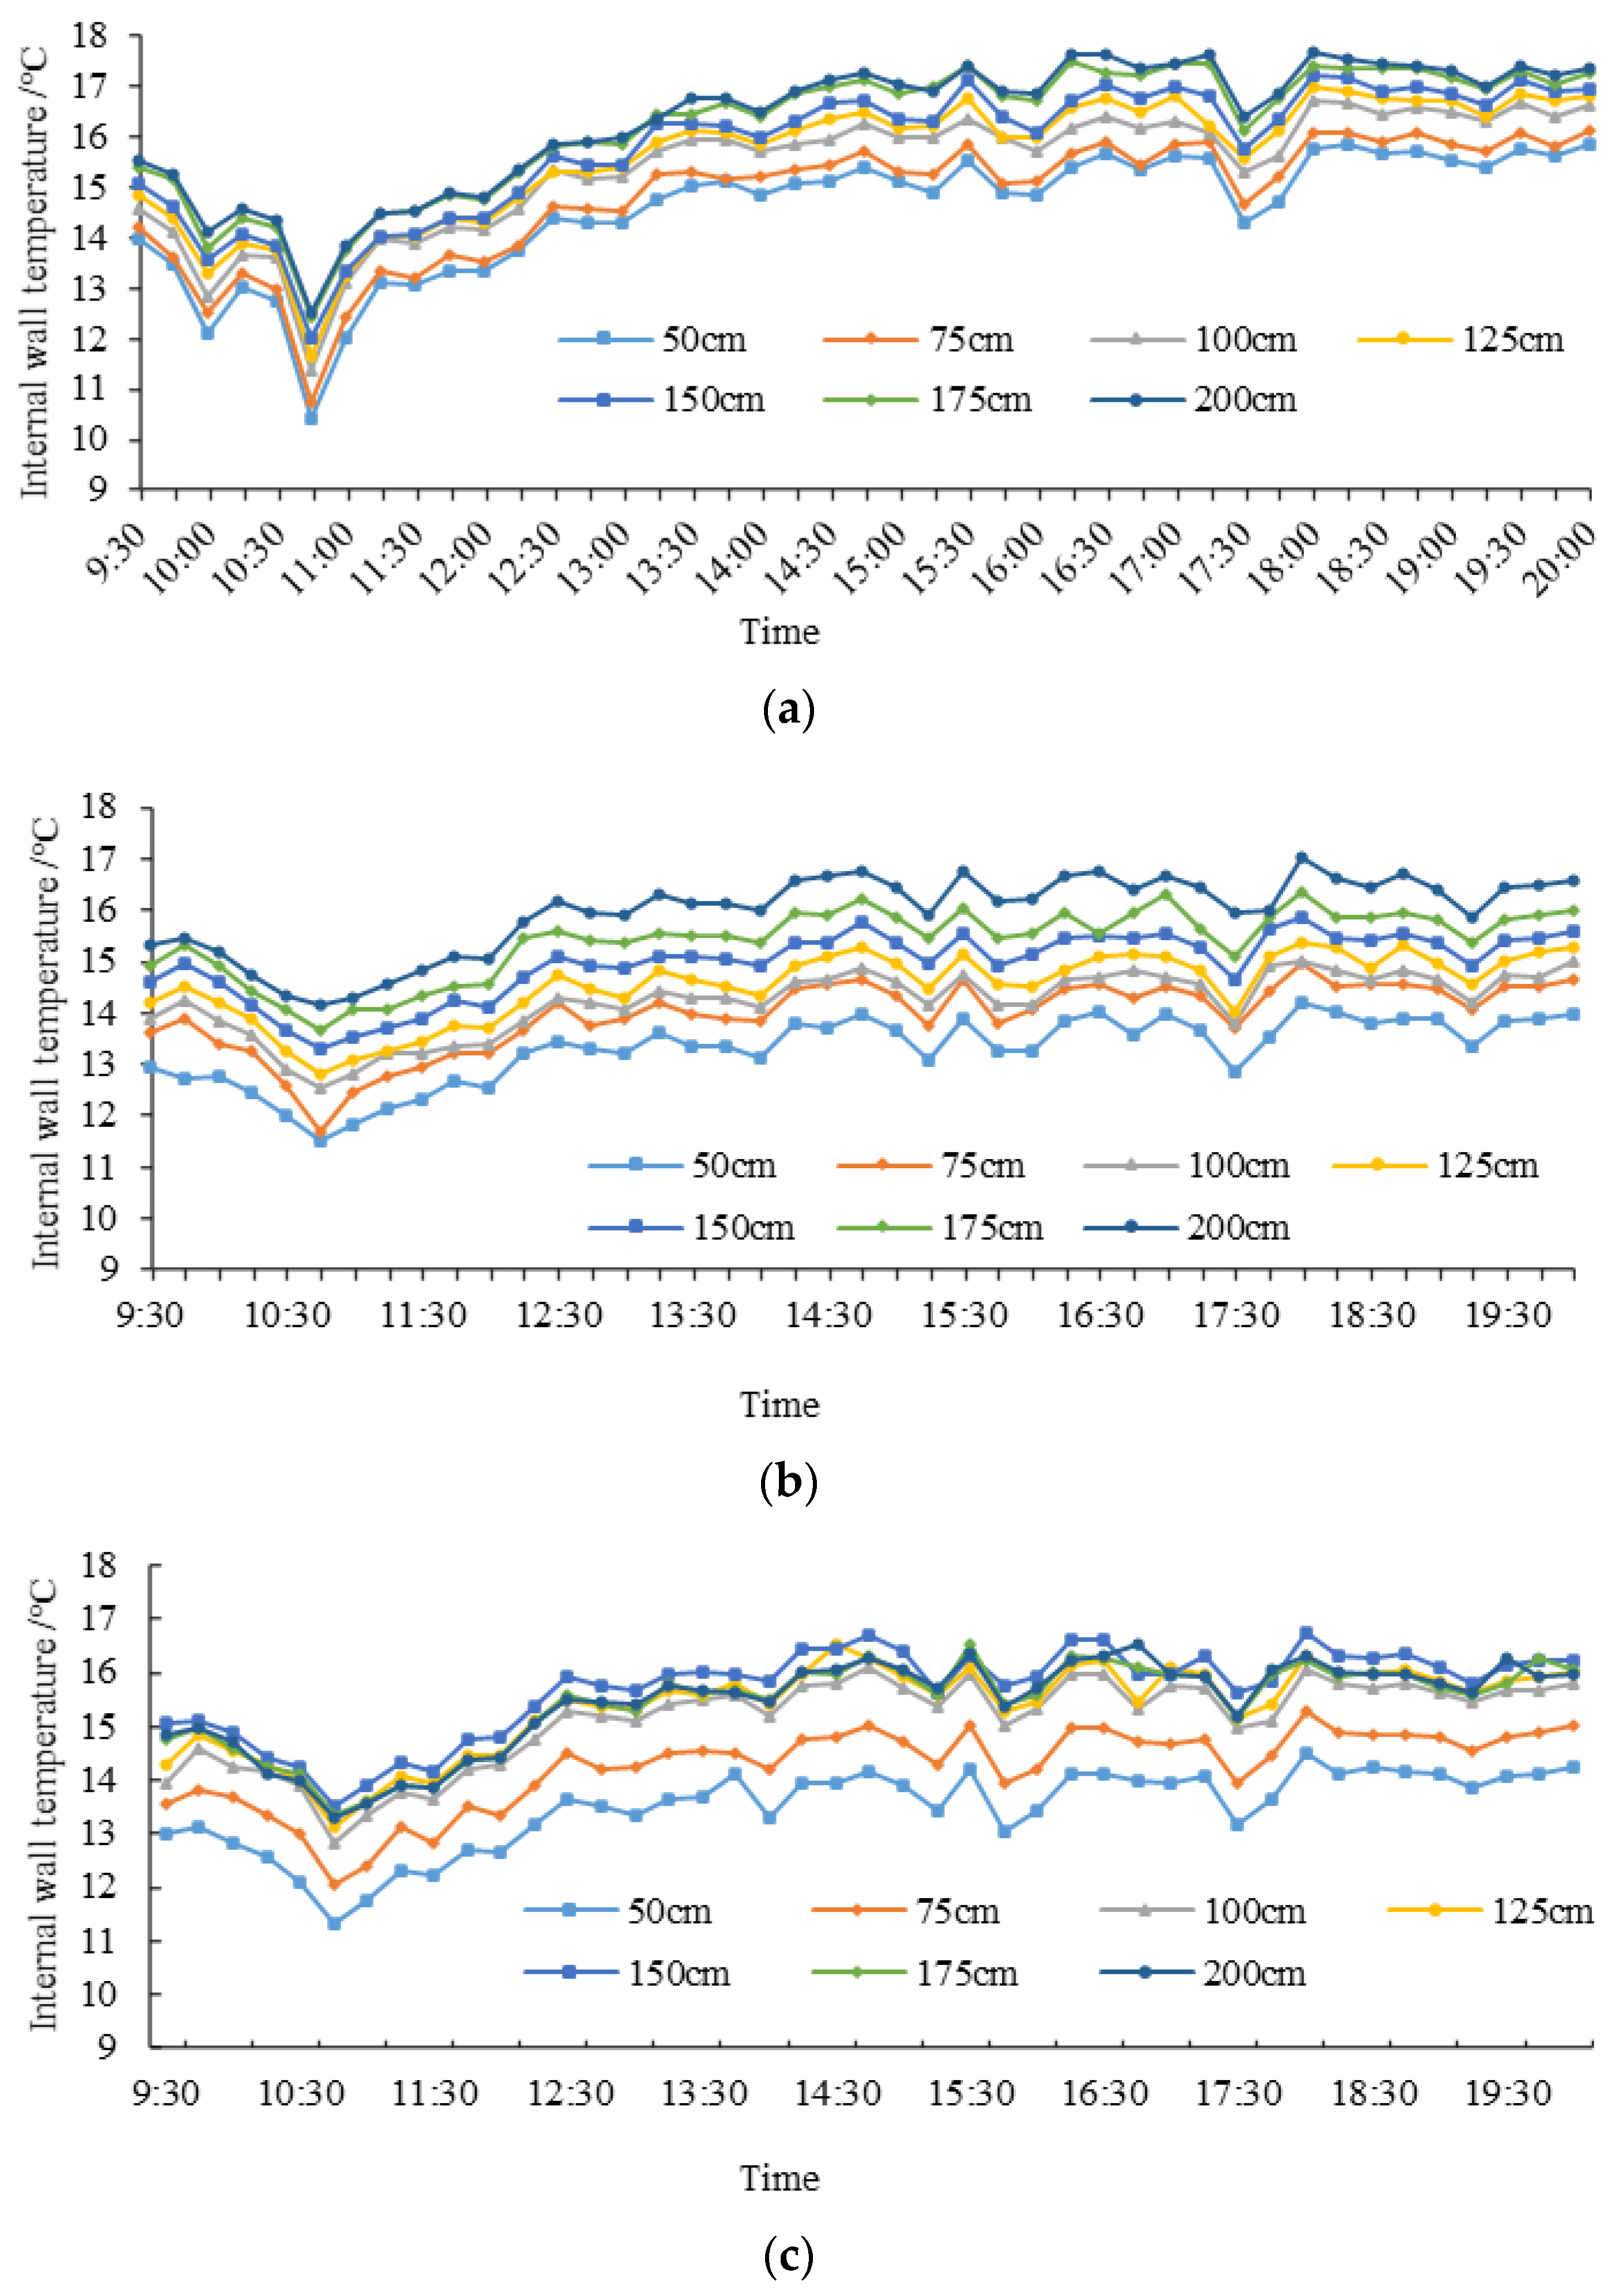
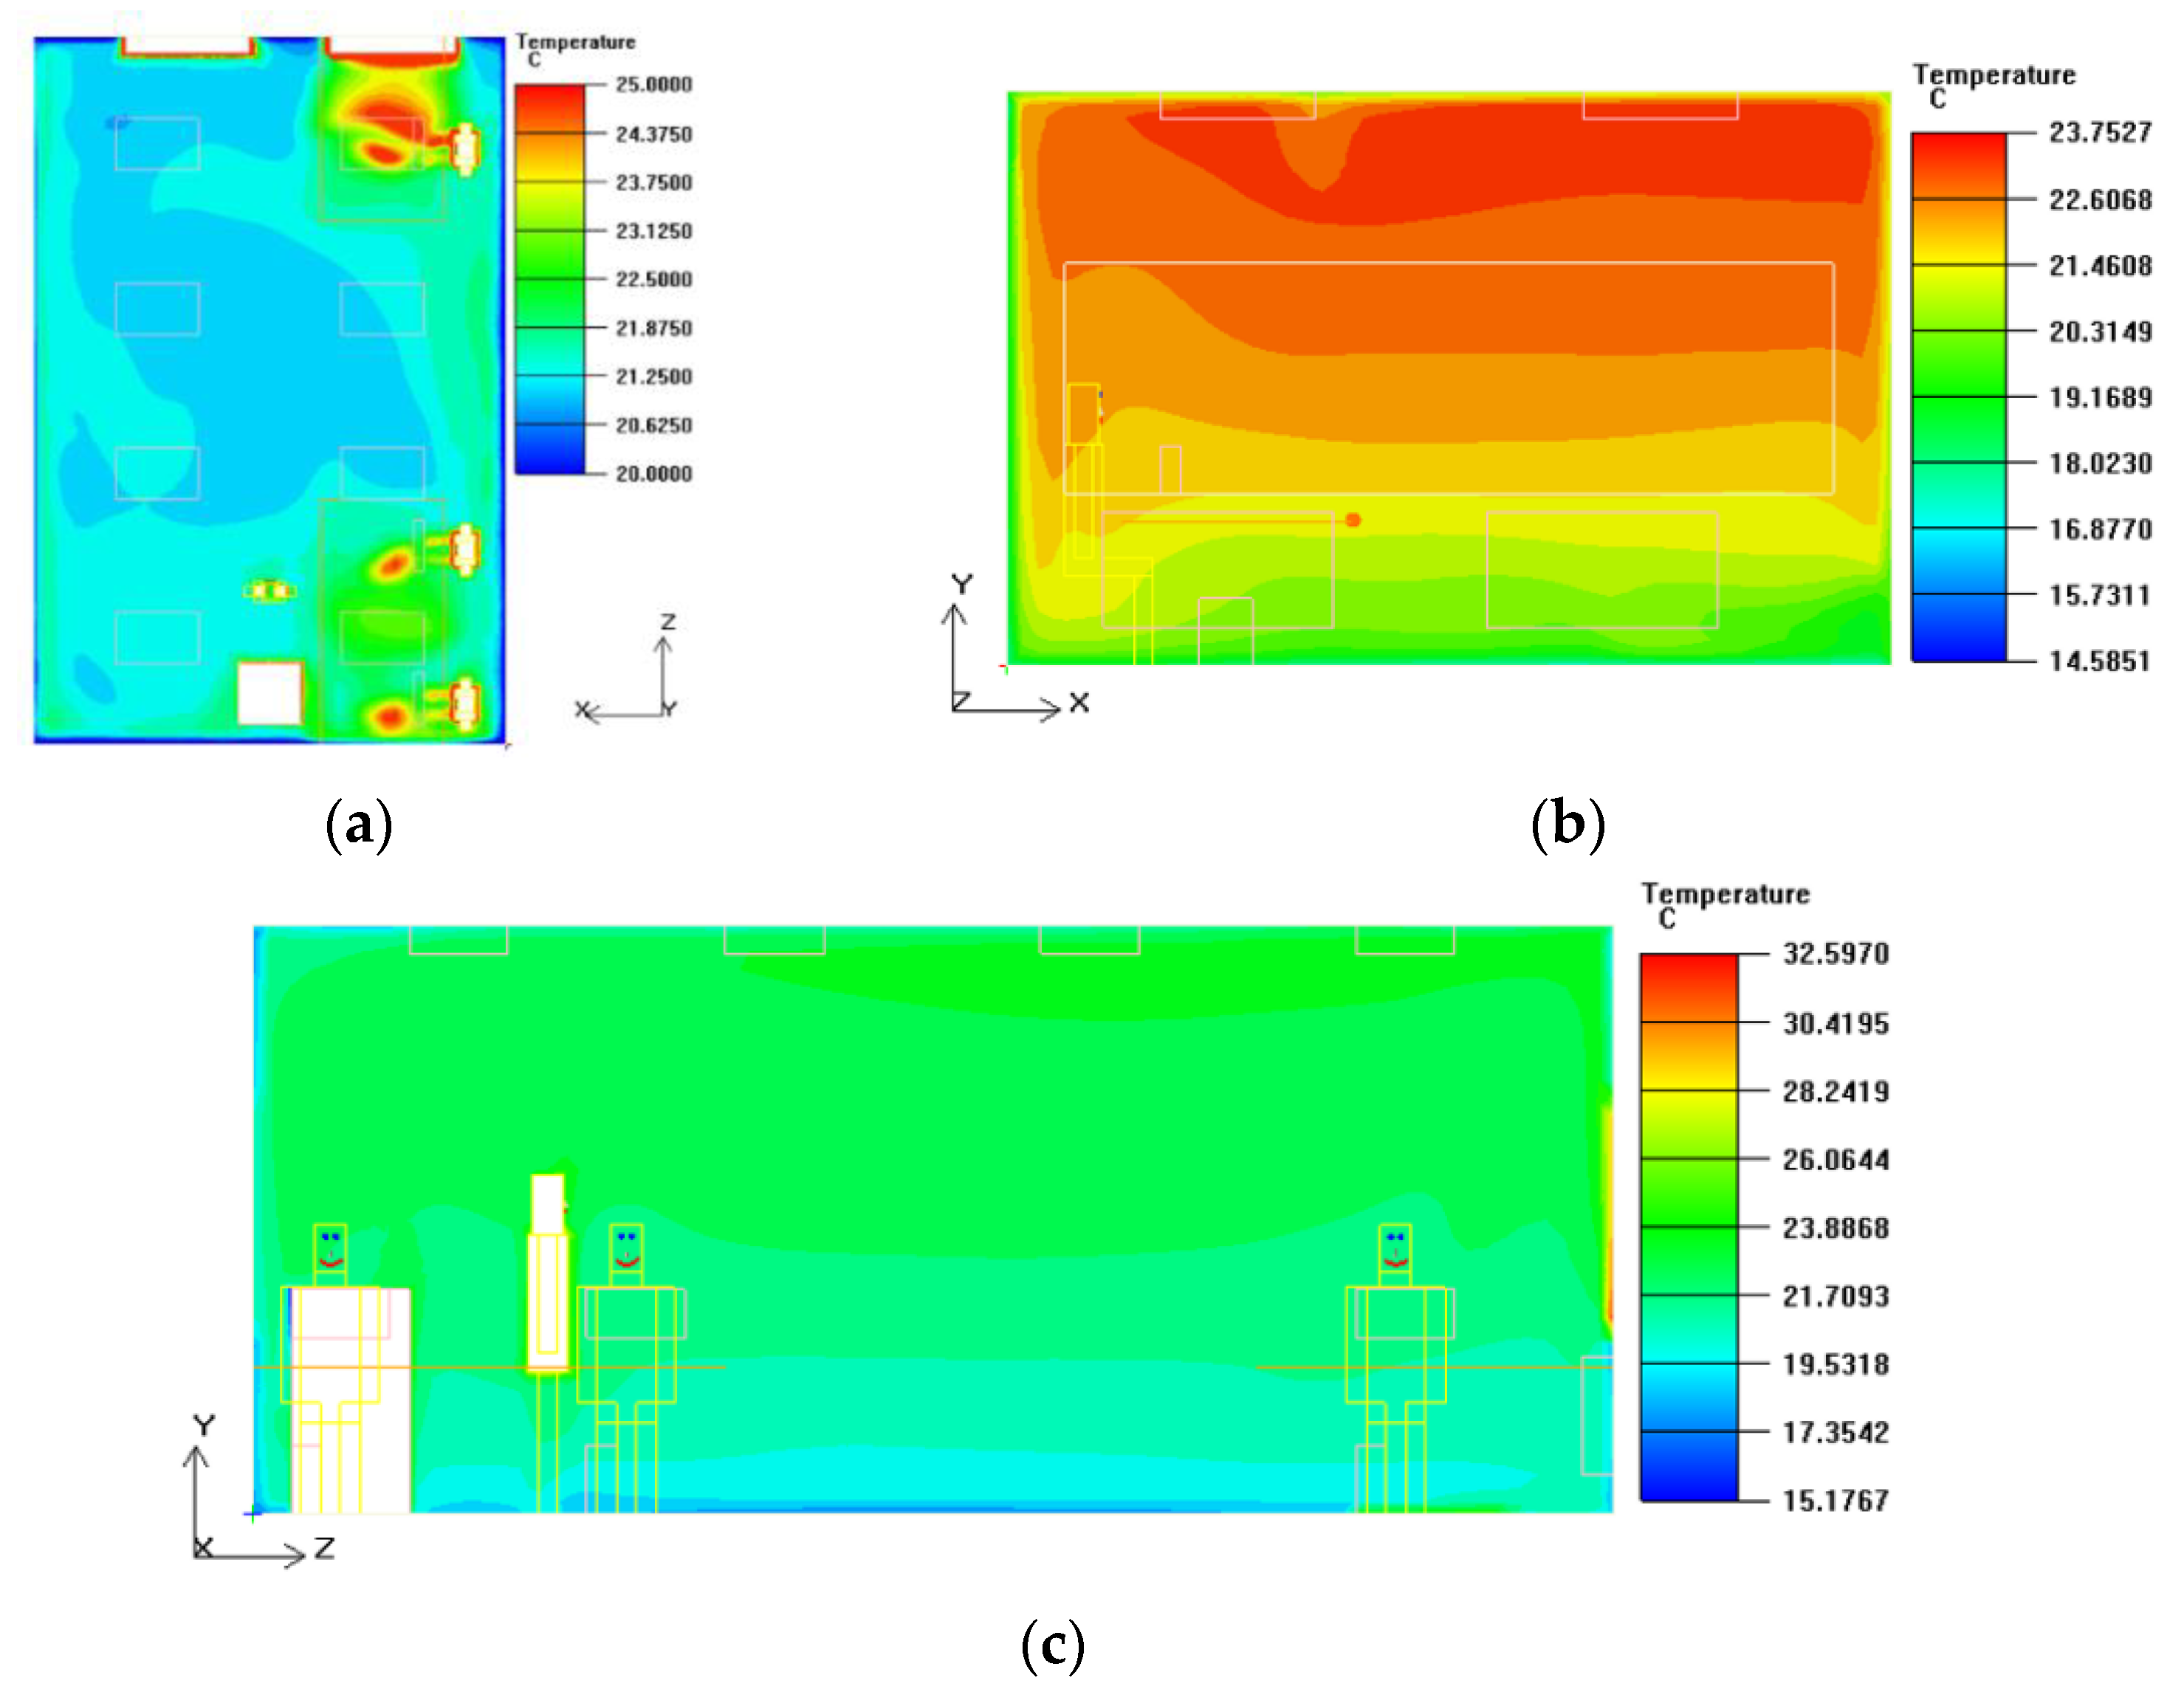
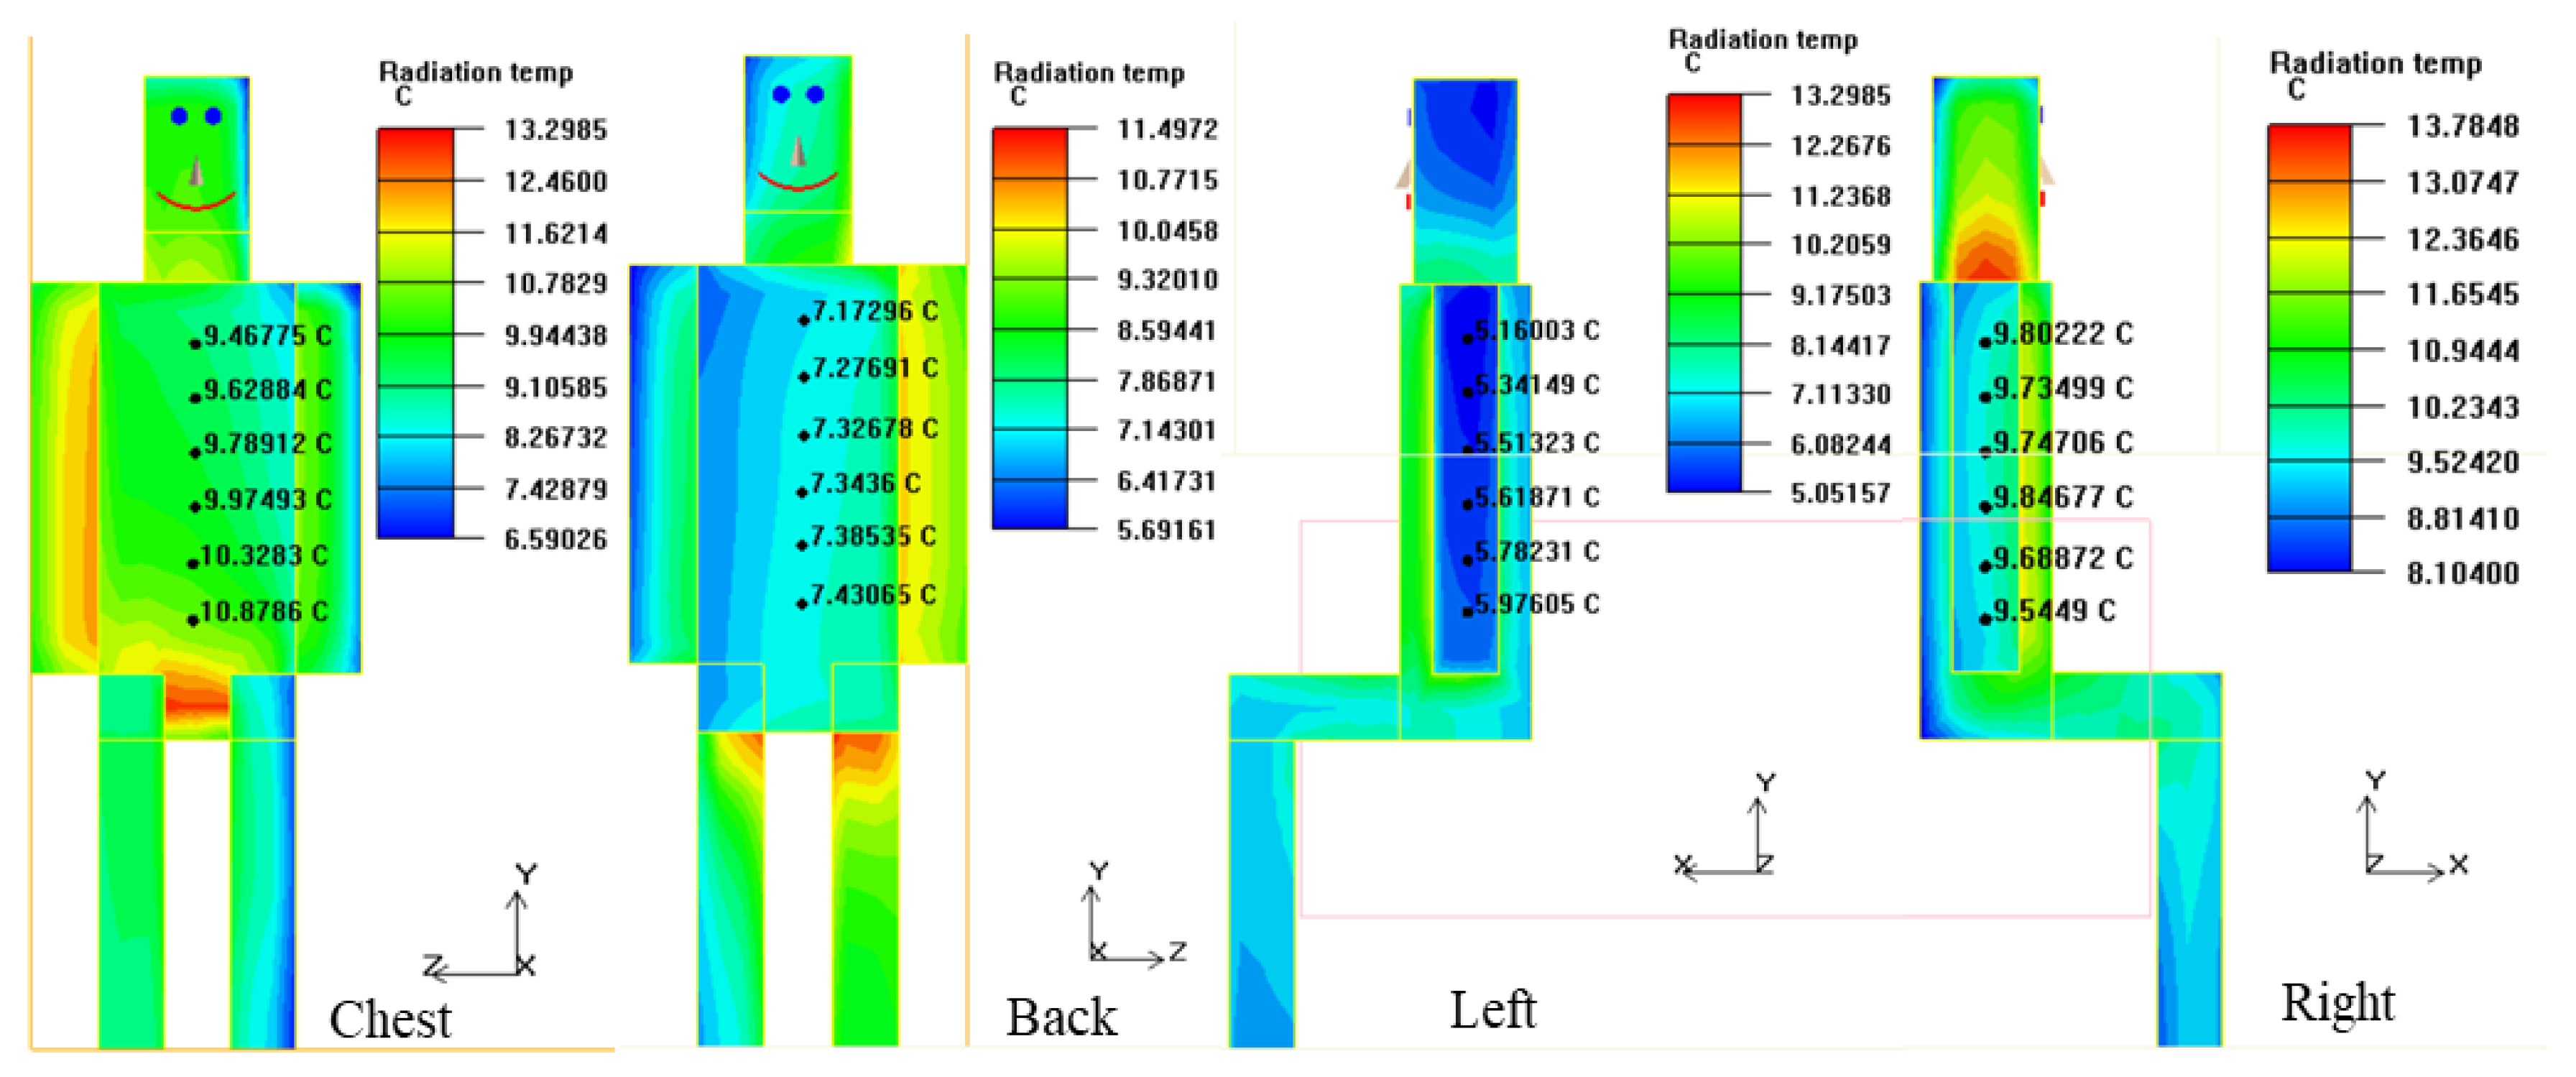
3.3. Simulation Results
4. Discussion
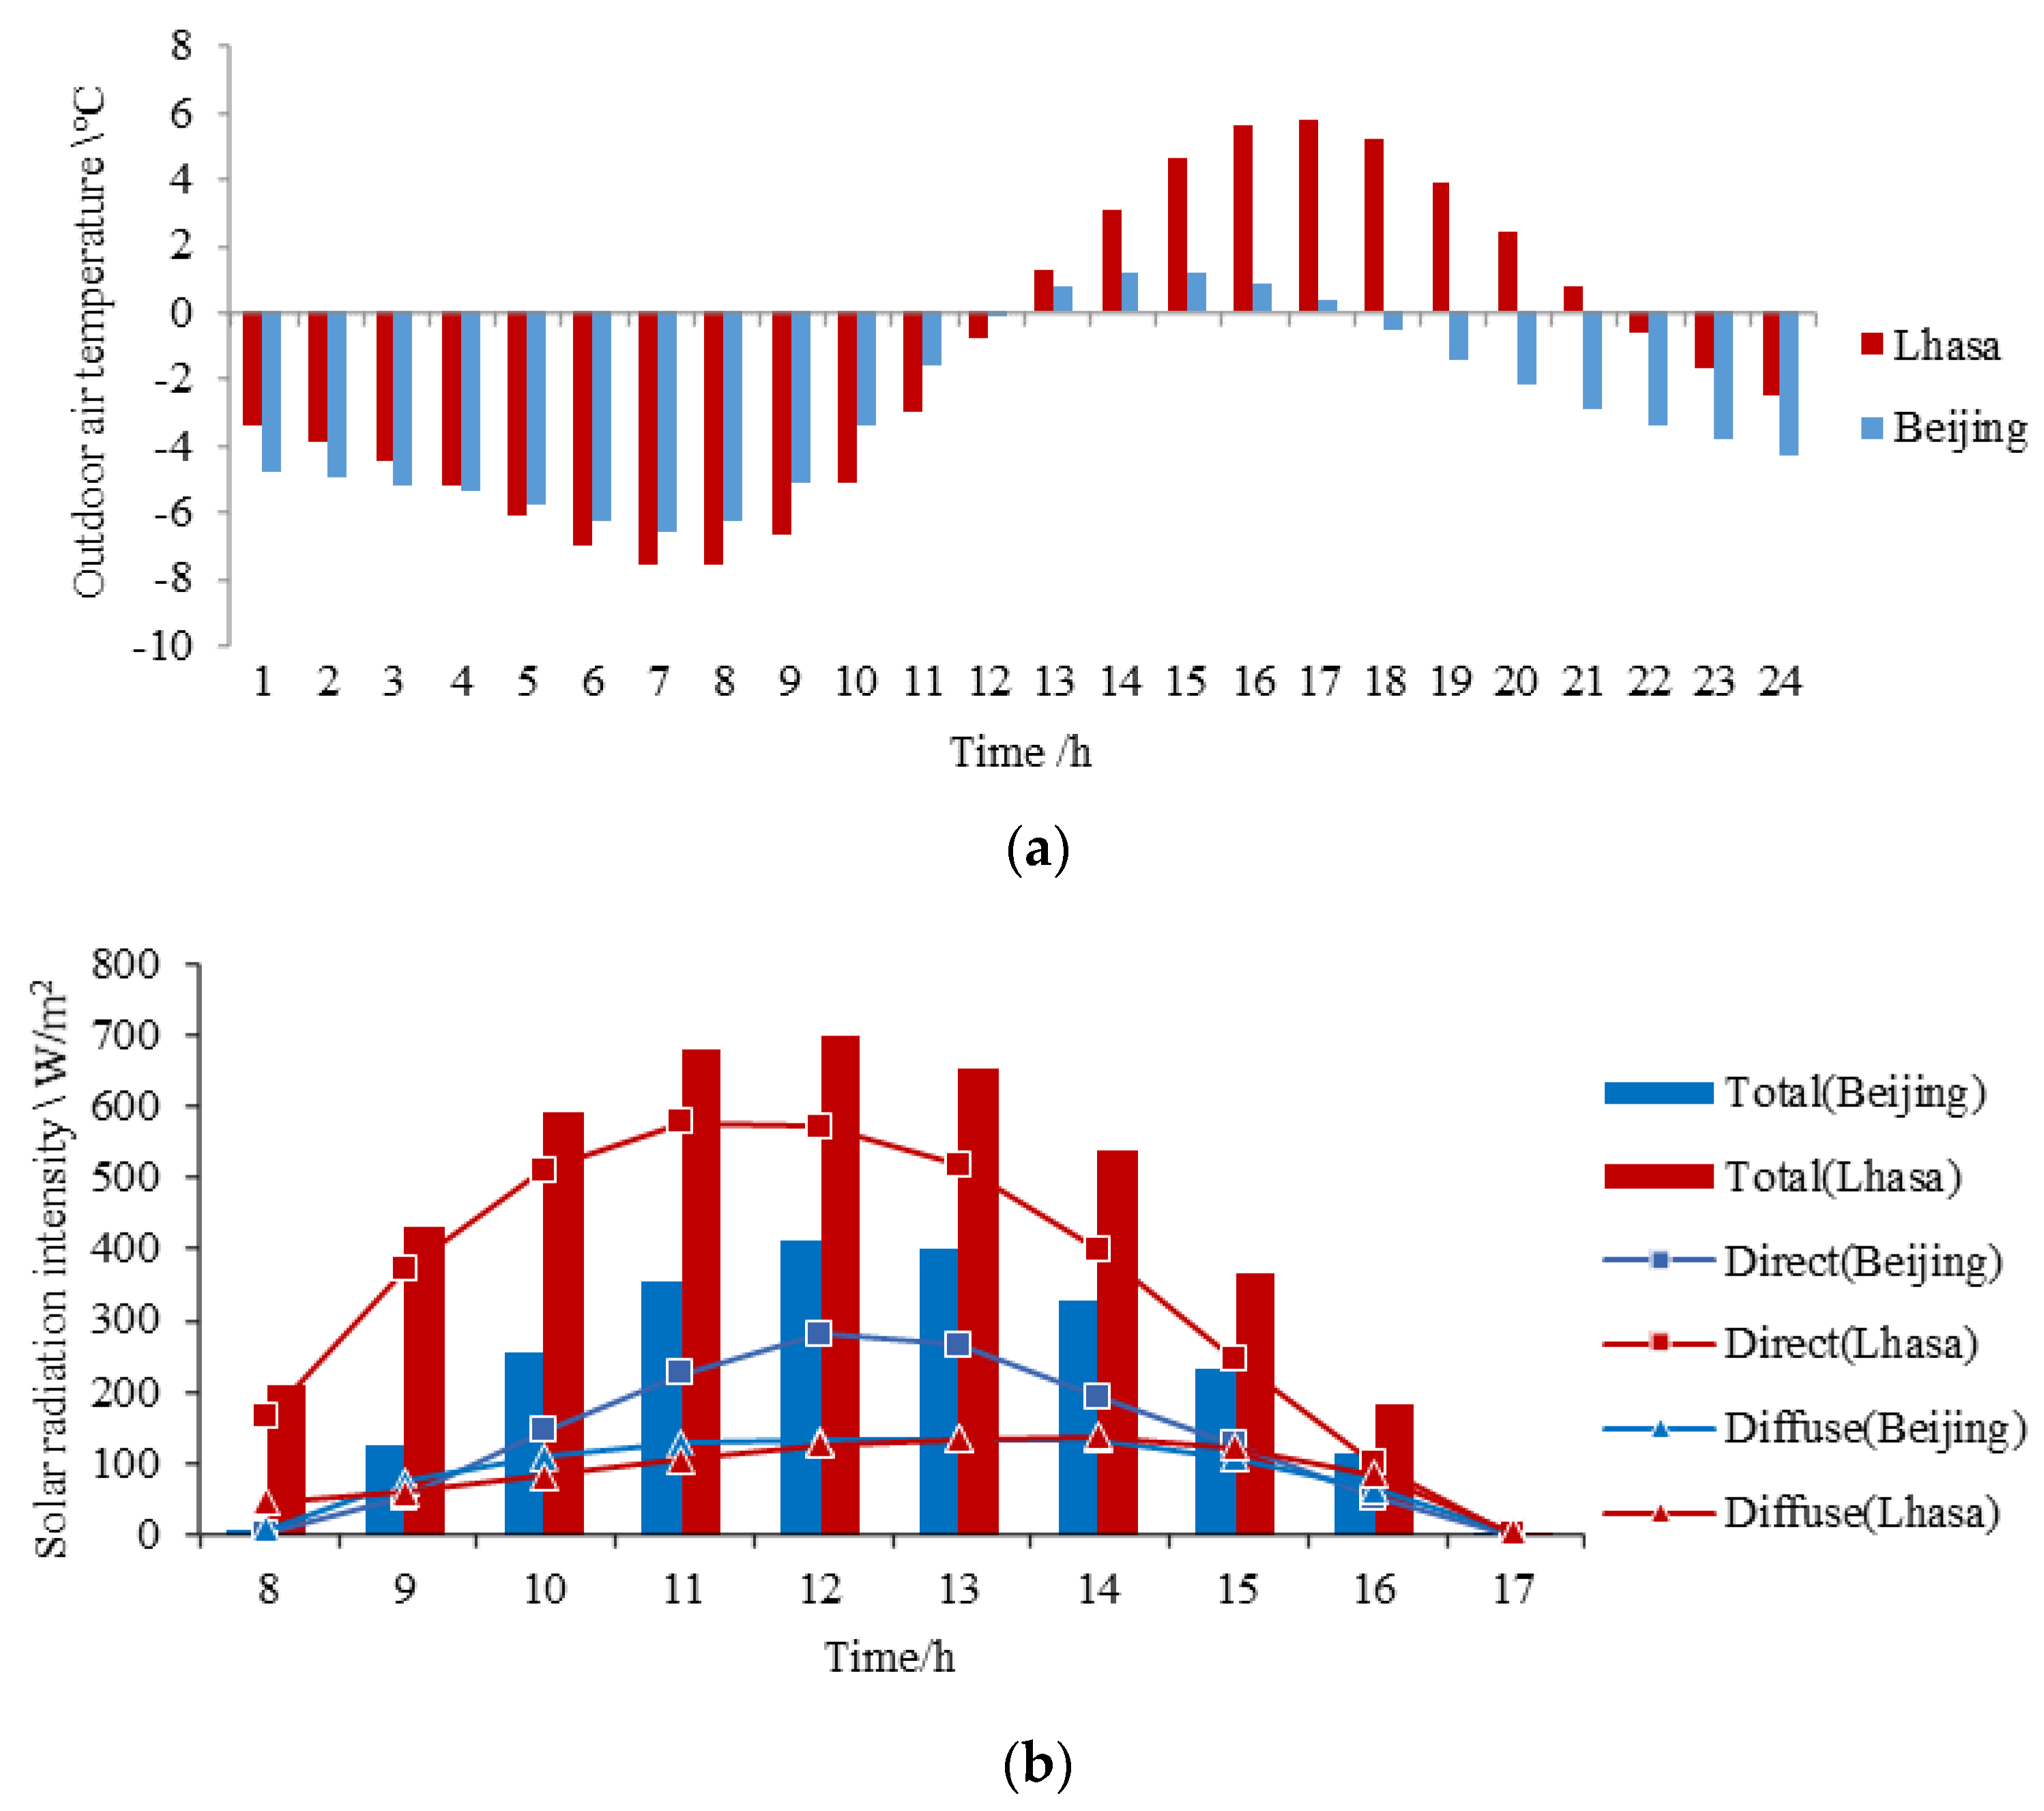
4.1. Typical-Weather Day in Lhasa and Beijing
4.2. Human Exposure Positions
4.3. Average Temperature
4.4. Non-Uniform Temperature Distribution
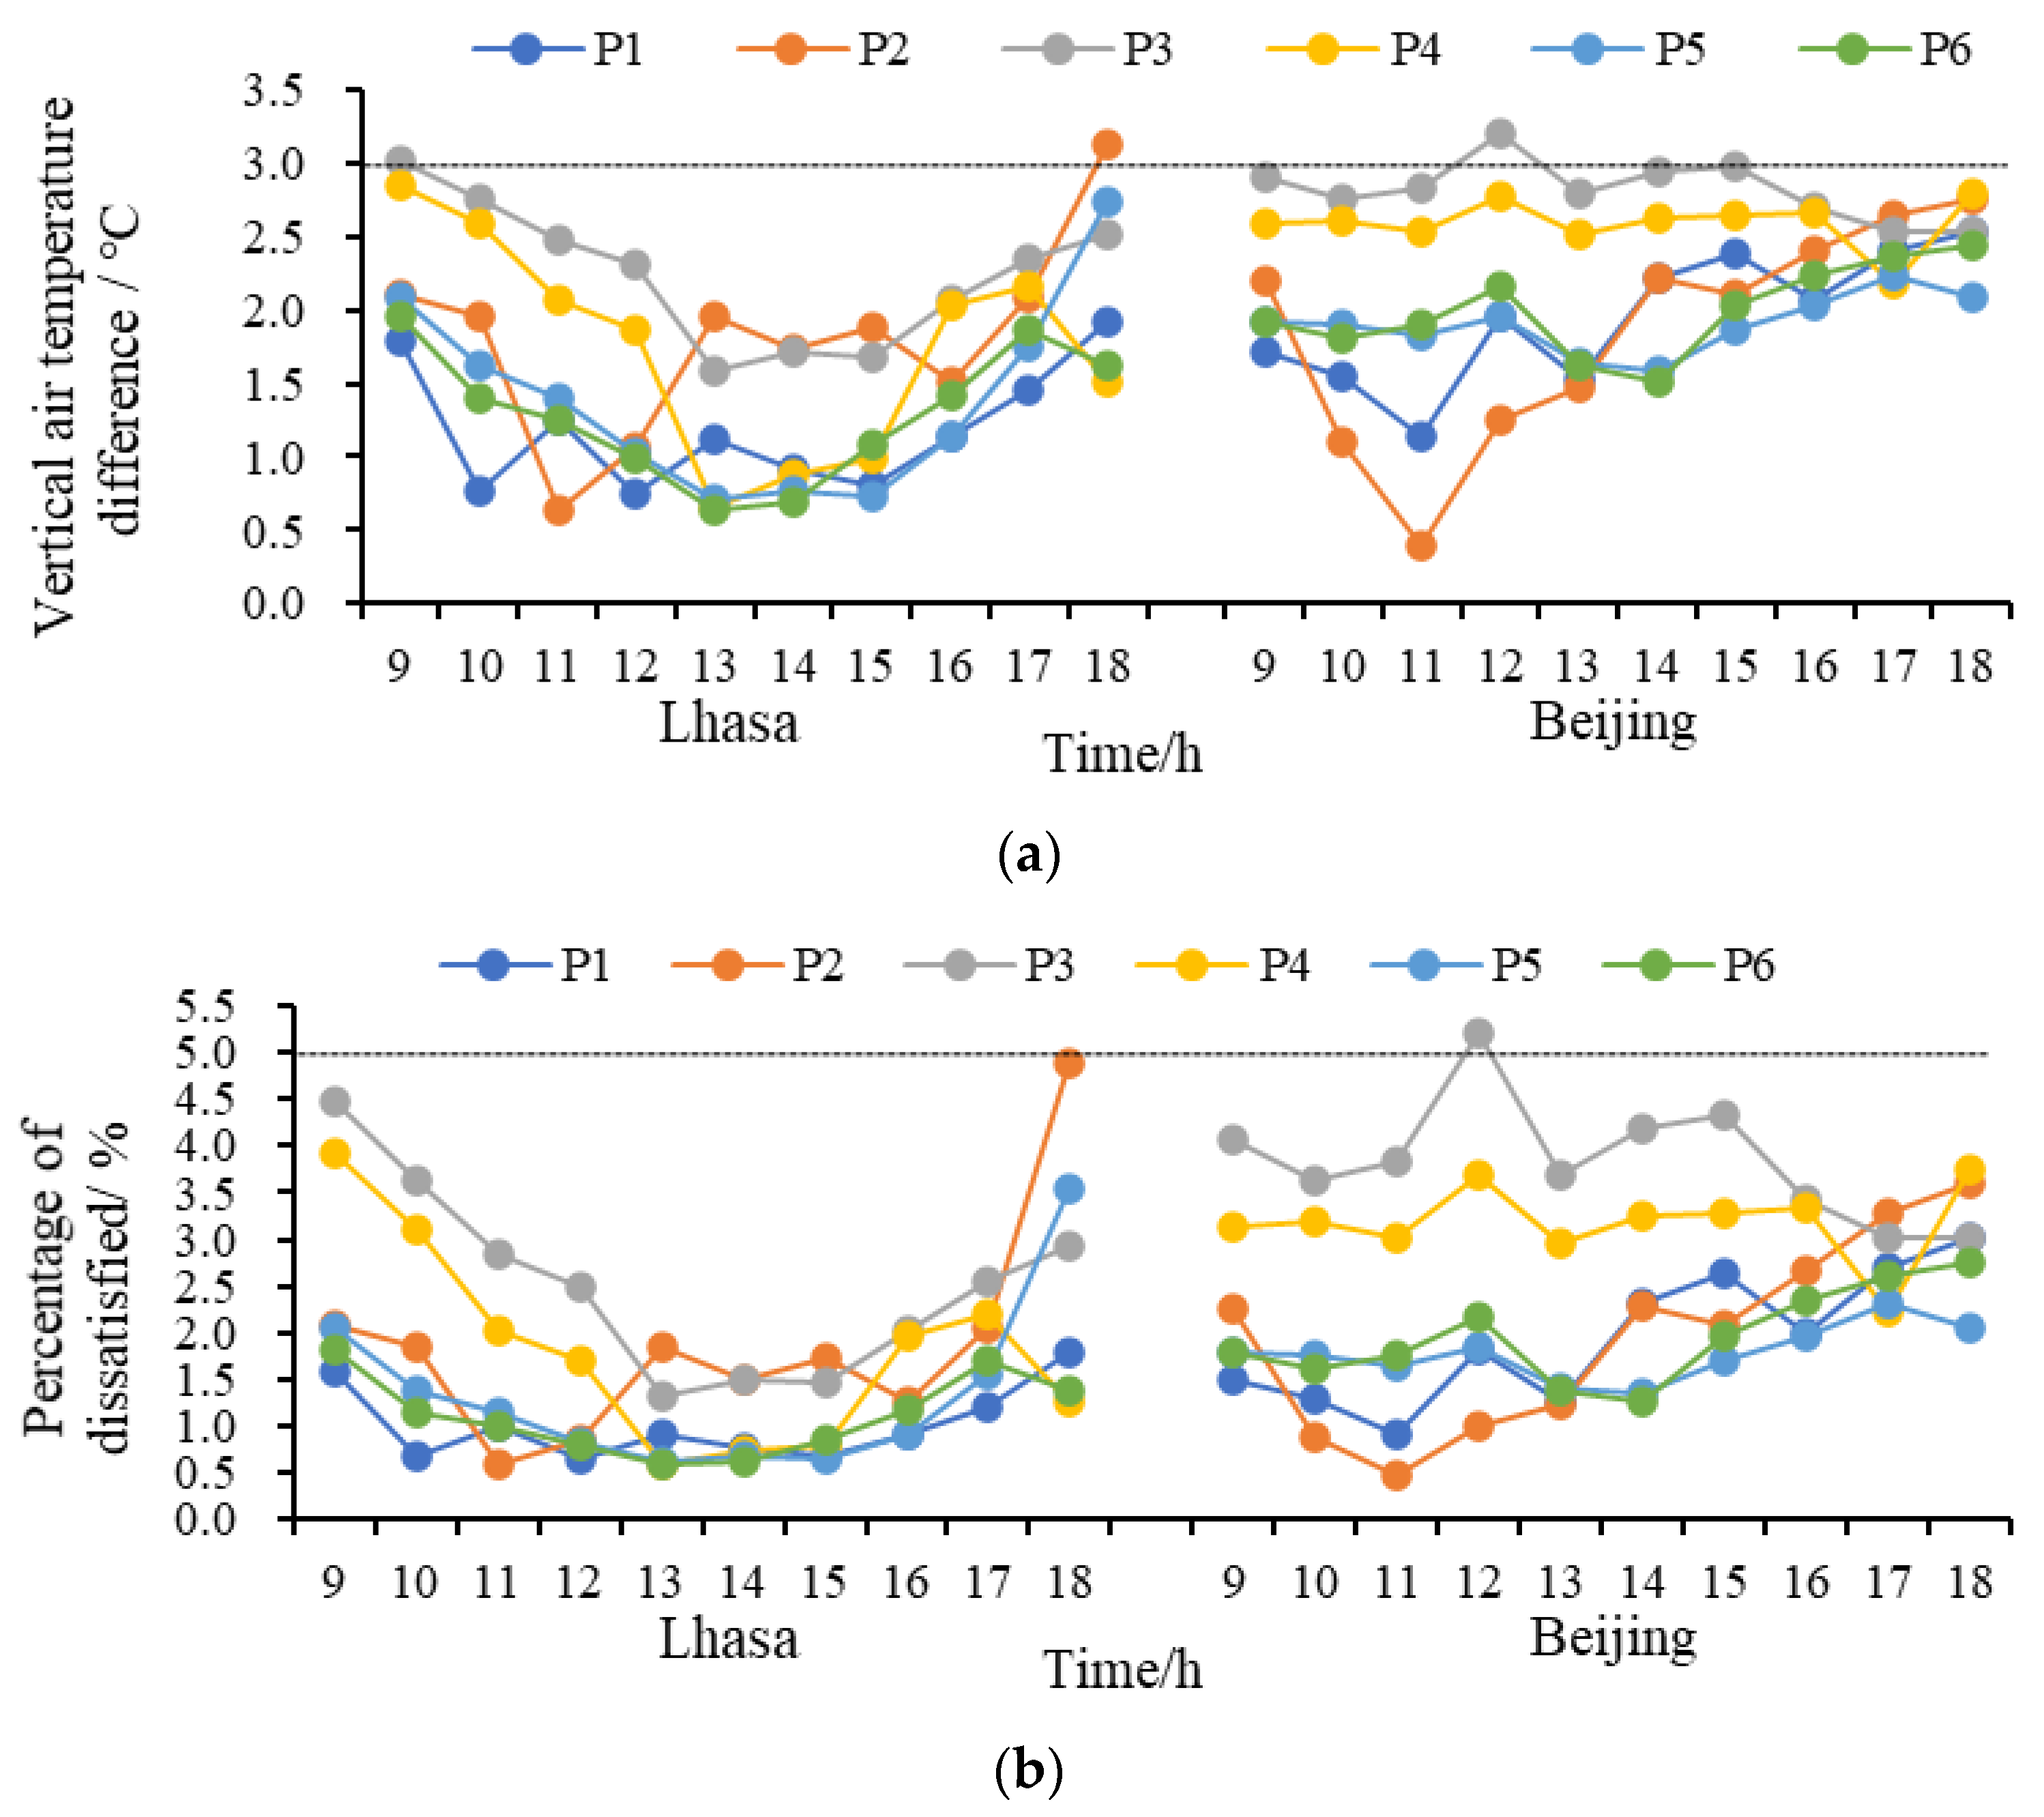
4.4.1. Vertical Air Temperature Difference
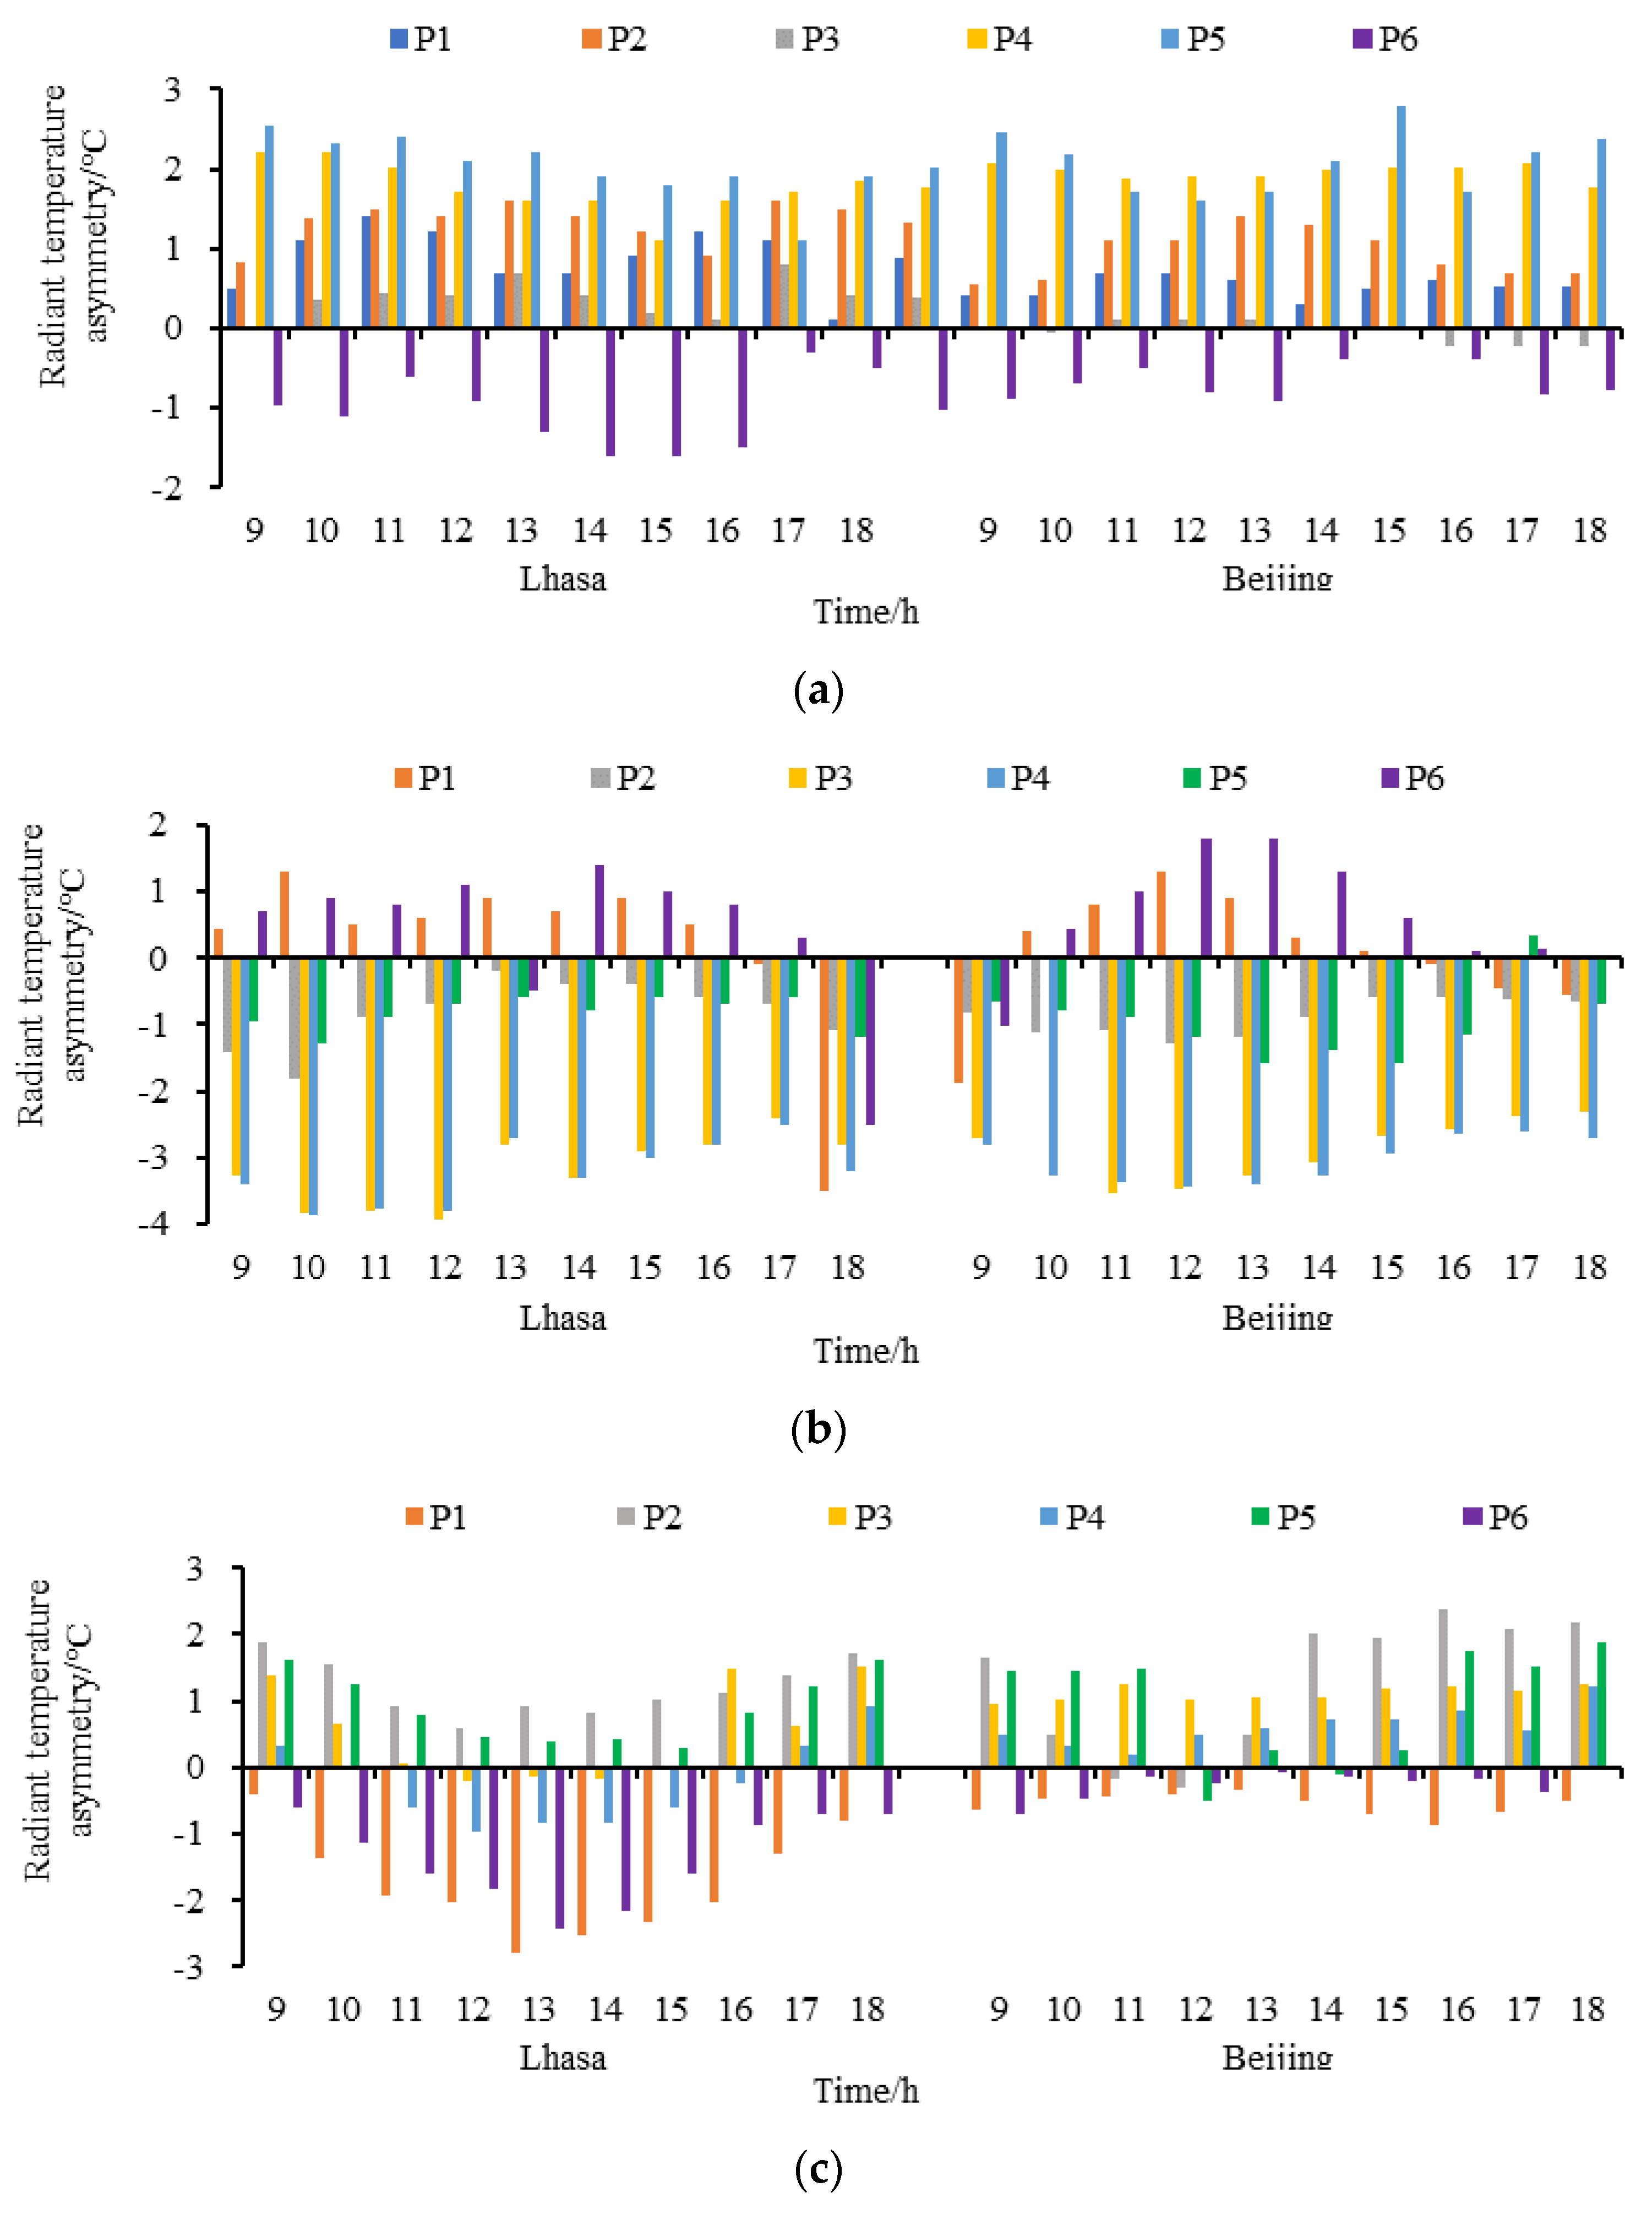
4.4.2. Radiant Temperature Asymmetry
4.5. Analysis of Standards
5. Conclusions
Author Contributions
Funding
Institutional Review Board Statement
Informed Consent Statement
Data Availability Statement
Conflicts of Interest
Nomenclature
| Absorption coefficient | Scattered direction | ||
| Specific heat of air, J/(kg·K) | T | Air temperature, °C | |
| Gravitational acceleration vector, m/s2 | Ta1 | Average indoor air temperature at the height of 0.6 m of Lhasa, °C | |
| Radiation intensity depending on location () and direction (), w/m2 | Ta2 | Average indoor air temperature at the height of 0.6 m of Beijing, °C | |
| Nearest distance from the wall, m | Reference air temperature, °C | ||
| Percentage of dissatisfaction caused by vertical air temperature difference, % | Tr1 | Average indoor radiation temperature at the height of 0.6 m of Lhasa, °C | |
| Percentage of dissatisfaction caused by radiant temperature asymmetry, % | Tr2 | Average indoor radiation temperature at the height of 0.6 m of Beijing, °C | |
| Convert coefficient | Tangential velocity of the wall, m/s | ||
| P | Partial pressure of water vapor in moist air, Pa | Air velocity component in point , m/s | |
| Turbulent Prandtl number | Air velocity component in point , m/s | ||
| Position vector | Friction velocity of wall, m/s | ||
| Length path, m | Normal distance from wall to first layer of mesh, m | ||
| Directional vector | |||
| Greek symbols | |||
| Coefficient of cubical expansion | Air density, kg/m3 | ||
| Thermal expansion coefficient, K−1 | Air density corresponding Tc, kg/m3 | ||
| Effective thermal conductivity, | Density of wall, kg/m3 | ||
| Laminar effective thermal conductivity, | Stefan–Boltzmann constant, 5.672 × 10⁻⁸ W/m2k4 | ||
| Dynamic viscosity, | Scattering coefficient | ||
| Effective viscosity, Pa·s | Vertical air temperature difference between head and ankle, °C | ||
| Laminar viscosity, Pa·s | Phase function | ||
| Turbulent viscosity, Pa·s | Spatial angle | ||
| Local mean velocity, m/s | |||
| Abbreviations | |||
| ASHRAE | American society of heating, refrigerating and air-conditioning engineers | ISO | International Standards Organization |
| CFD | Computational fluid dynamics | SD | Standard deviation |
| RTA | Radiant temperature asymmetry | VATD | vertical air temperature difference |
References
- Tibet Plateau. Available online: https://baike.baidu.com/item/西藏高原/9701346?fr=aladdin (accessed on 25 December 2021). (In Chinese).
- Overview of Land Resources in Tibet Autonomous Region. Available online: http://www.xizang.gov.cn/rsxz/qqjj/zrdl/201812/t20181221_34484.html (accessed on 21 December 2018).
- The 2018 Statistical Communique on National Economic and Social Development of the Tibet Autonomous Region. Available online: http://www.xzxw.com/xw/xzyw/201905/t20190528_2635687.html (accessed on 18 May 2019).
- Wang, D.J.; Liu, Y.F.; Wang, Y.; Liu, J.P. Measurement and Evaluation of Indoor Thermal Environment of Residential Buildings in Lhasa in Winter. Build. Sci. 2011, 27, 20–24. [Google Scholar] [CrossRef]
- Li, E.; Zhu, J.K. Parametric analysis of the mechanism of creating indoor thermal environment in traditional houses in Lhasa. Build. Environ. 2021, 207, 108510. [Google Scholar] [CrossRef]
- Qi, F.; Yang, L.; He, Q.; Liu, D.; He, H.; Wang, Q.Q. Residential Indoor Thermal Environment Test and Analysis of Kangding in Winter. Build. Energy Effic. 2015, 3, 102–106. [Google Scholar] [CrossRef]
- Wang, P.Q.; Leng, Y.H.; Xu, G.T. Analysis on Thermal Environment Current Situation of Residential Buildings in the South-Eastern of Tibet. Build. Sci. 2012, 28, 65–68. [Google Scholar] [CrossRef]
- Sun, H.J.; Leng, M.J. Analysis on building energy performance of Tibetan traditional dwelling in cold rural area of Gannan. Energy Build. 2015, 96, 251–260. [Google Scholar] [CrossRef]
- Wang, Z. Passive Design of Energy Efficient Residential Building in Chamdo. Master’s Thesis, Xi’an University of Architectural and Technology, Xi’an, China, 2014. [Google Scholar]
- Zhang, M. The Passive Control Strategy Research of Residential Buildings Indoor Thermal Environment in Tibet Area. Master’s Thesis, Chongqing University, Chongqing, China, 2015. [Google Scholar]
- Xie, H. Research on Interior Thermal Environment of Architectural Design Based on High Altitudes. Master’s Thesis, Southwest Jiaotong University, Chengdu, China, 2014. [Google Scholar]
- Luo, Y. Improve the Indoor Thermal Environment of AlpineRegion Building Technical Measures and Research in Tibet. Master’s Thesis, Southwest Jiaotong University, Chengdu, China, 2012. [Google Scholar]
- Yang, L.; Yan, H.Y.; Xu, Y.; Lam, J.C. Residential thermal environment in cold climates at high altitudes and building energy use implications. Energy Build. 2013, 62, 139–145. [Google Scholar] [CrossRef]
- Zhao, J.; Lu, J.; Liao, X.; Huang, G.Q.; Li, X.L.; Guo, X.J. Influence of Solar Radiation on Indoor Thermal Environment in Cold Highland Area. Gas Heat 2014, 34, 17–21. [Google Scholar] [CrossRef]
- Huang, L.J.; Hamza, N.; Lan, B.; Zahi, D. Climate-responsive design of traditional dwellings in the cold-arid regions of Tibet and a field investigation of indoor environments in winter. Energy Build. 2016, 128, 697–712. [Google Scholar] [CrossRef]
- Fanger, P.O.; Bànhidi, L.; Olesen, B.W.; Langkilde, G. Comfort Limits for heated ceilings. ASHRAE Trans. 1980, 86, 141–156. [Google Scholar]
- Fanger, P.O.; Ipsen, B.M.; Langkilde, G.; Olessen, B.W.; Christensen, N.K.; Tanabe, S. Comfort limits for asymmetric thermal radiation. Energy Build. 1985, 8, 225–236. [Google Scholar] [CrossRef]
- Chrenko, F.A. Heated Ceilings and Comfort. J. Inst. Heat. Vent. Eng. 1953, 20, 375–396. [Google Scholar]
- Loveday, D.L.; Parsons, K.C.; Taki, A.H.; Hodder, S.G. Displacement ventilation environments with chilled ceilings: Thermal comfort design within the context of the BS EN ISO7730 versus adaptive debate. Energy Build. 2002, 34, 573–579. [Google Scholar] [CrossRef]
- Loveday, D.L.; Parsons, K.C.; Taki, A.H.; Hodder, S.G.; Jeal, L.D. Designing for Thermal Comfort in Combined Chilled Ceiling/Displacement Ventilation Environments. In Proceedings of the 1998 ASHRAE Winter Meeting, San Francisco, CA, USA, 17–21 June 1998; p. 1162. [Google Scholar]
- Griffiths, I.; Mcintyre, D. Subjective Response to Overhead Thermal-Radiation. Hum. Factors 1974, 16, 415–422. [Google Scholar] [CrossRef]
- McNall, P.E.; Biddison, R.E. Thermal and comfort sensations of sedentary persons exposed to asymmetric radiant fields. ASHRAE Trans. 1970, 76, 123–136. [Google Scholar]
- ISO 7730; Ergonomics of the Thermal Environment-Analytical Determination and Interpretation of Thermal Comfort Using Calculation of the PMV and PPD Indices and Local Thermal Comfort Criteria. International Organization for Standardization: Geneva, Switzerland, 2005; 6–10.
- Standard 55-2004; Thermal Environmental Conditions for Human Occupancy ANSI/ASHRAE. American Society of Heating, Refrigerating and Air-Conditioning Engineers: Atlanta, GA, USA, 2004; 4–10, 26.
- GB50178-93; National Standard of the People’s Republic of China: Standard for Building Climate Zoning. China Planning Press: Beijing, China, 1994; 2–3.
- GB 50736-2012; Design Code for Heating Ventilation and Air Conditioning of Civil Buildings. China Construction Industry Press: Beijing, China, 2012; 5–10.
- Standard 55-2017; Thermal Environmental Conditions for Human Occupancy ANSI/ASHRAE. ASHRAE Website: Atlanta, GA, USA, 2017; 4–18. Available online: www.ashrae (accessed on 12 October 2017).
- Zhu, W.J. CFD Simulation of the Heat Environment of Multi-Spar Greenhouse at Night in Winter under Heating. Master’s Thesis, China Agricultural University, Beijing, China, 2005; p. 119. [Google Scholar]
- Echeverria Serur, C. Fast Iterative Methods for Solving the Incompressible Navier-Stokes Equations. Master’s Thesis, Delft University of Technology, Delft, The Netherlands, 2013. [Google Scholar]
- Emanuel, G. Analytical Fluid Dynamics; CRC Press: Boca Raton, FL, USA, 2017; p. 24. [Google Scholar]
- Wang, F.J. Computational Fluid Dynamics Analysis; Tsinghua University Press: Beijing, China, 2004; pp. 7–10. [Google Scholar]
- Chen, Q.Y.; Xu, W.R. A zero-equation turbulence model for indoor airflow simulation. Energy Build. 1998, 28, 137–144. [Google Scholar] [CrossRef]
- Nazarian, N.; Kleissl, J. CFD simulation of an idealized urban environment: Thermal effects of geometrical characteristics and surface materials. Urban Stud. 2015, 12, 141–159. [Google Scholar] [CrossRef]
- Guo, X.G. Study on Thermal Performance of the Heating Radiator in Cold Regions with High Altitude. Master’s Thesis, Chongqing University, Chongqing, China, 2014. [Google Scholar]
- GB/T 18048-2008; Ergonomics of the thermal environment Determination of Metabolic Rate. Administration of Quality Supervision Inspection and Quarantine of China, Standardization Administration of China, China Standard Press: Beijing, China, 2008; 11.
- Zhang, Q.Y. Standard Meteorological Database for Chinese Construction; China Building Industry Press: Beijing, China, 2004; pp. 62, 138. [Google Scholar]
- Housing and Urban-Rural Development Department of Tibet Autonomous Region. Design Standard for Heating and Ventilation of Civil Buildings for Tibet; Housing and Urban-Rural Development Department of Tibet Autonomous Region: Lhasa, China, 2016; p. 8. [Google Scholar]
- GB/T50785-2012; Evaluation Standard for Indoor Thermal Environment in Civil Buildings. China Construction Industry Press: Beijing, China, 2012; 5–10.
- DBJ540001-2018; Design Standard for Green Building in the Tibet Autonomous Region. Housing and Urban-Rural Development Department of Tibet Autonomous Region: Lhasa, China, 2018; 15–19, 37–38.
- Su, X.W.; Wang, Z.J.; Xu, Y.Y.; Liu, N.C. Thermal comfort under asymmetric cold radiant environment at different exposure distances. Build. Environ. 2020, 178, 106961. [Google Scholar] [CrossRef]


| Direction | Area of External Window (m2) | Area of the External Wall (m2) | The Ratio of Window to Wall |
|---|---|---|---|
| East | 43.2 | 162.00 | 0.27 |
| South | 360 | 673.20 | 0.53 |
| West | 0 | 162.00 | 0 |
| North | 201.3 | 673.20 | 0.3 |
| Type | Heat Transfer Coefficient (W/m2·K) | Thickness (mm) |
|---|---|---|
| External wall | 0.54 | 316 |
| Roof | 0.412 | 280 |
| Floor | 1.65 | 420 |
| Partition | 1.55 | 310 |
| External window | 3.2 | 5 (glass) + 9 (air) + 5 (glass) |
| Number | Type | Size | Amount | Heat/Temperature |
|---|---|---|---|---|
| 1 | Office | 4.6 m × 6.9 × 3 m | 1 | —— |
| 2 | South-facing window | 3.6 m × 1.2 m | 1 | —— |
| 3 | North-facing window | 1.8 m × 1.2 m | 1 | —— |
| 4 | Radiator | 1.2 m × 0.15 m × 0.6 m | 2 | 51.5·°C [34] |
| 5 | Printer | 0.6 m × 0.65 m × 1.15 m | 1 | 80 W |
| 6 | Desk 1 | 2.4 m × 1.2 m × 0.75 m | 1 | —— |
| 7 | Desk 2 | 1.8 m × 1.2 m × 0.75 m | 1 | —— |
| 8 | Screen | 0.5 m × 0.1 m × 0.25 m | 4 | 40 W |
| 9 | Computer | 0.15 m × 0.28 m × 0.35 m | 4 | 120 W |
| 10 | Lamp | 0.5 m × 0.8 m × 0.15 m | 8 | 34 W |
| 11 | seated person | 0.4 m × 0.35 m × 1.1 m | 3 | 69.78 W [35] |
| 12 | Standing person | 0.3 m × 0.2 m × 1.7 m | 1 | 93.04 W [35] |
| Parameters | Values |
|---|---|
| Density | 2500 (kg/m3) |
| Specific heat capacity | 700 (J/kg·K) |
| Emissivity | 0.84 |
| Solar absorption rate-normal incidence | 0.14 |
| Solar transmittance-normal incidence | 0.78 |
| Solar reflectance-normal incidence | 0.08 |
Publisher’s Note: MDPI stays neutral with regard to jurisdictional claims in published maps and institutional affiliations. |
© 2022 by the authors. Licensee MDPI, Basel, Switzerland. This article is an open access article distributed under the terms and conditions of the Creative Commons Attribution (CC BY) license (https://creativecommons.org/licenses/by/4.0/).
Share and Cite
Wang, M.; Shen, P. Investigation of Indoor Asymmetric Thermal Radiation in Tibet Plateau: Case Study of a Typical Office Building. Buildings 2022, 12, 129. https://doi.org/10.3390/buildings12020129
Wang M, Shen P. Investigation of Indoor Asymmetric Thermal Radiation in Tibet Plateau: Case Study of a Typical Office Building. Buildings. 2022; 12(2):129. https://doi.org/10.3390/buildings12020129
Chicago/Turabian StyleWang, Meilin, and Pengyuan Shen. 2022. "Investigation of Indoor Asymmetric Thermal Radiation in Tibet Plateau: Case Study of a Typical Office Building" Buildings 12, no. 2: 129. https://doi.org/10.3390/buildings12020129