Article

Critical Factors Affecting Contractors’ Decision to Bid: A Global Perspective

1
School of Built Environment, University of New South Wales, Sydney, NSW 2052, Australia
2
Faculty of Design, Architecture and Building, University of Technology Sydney, Ultimo, NSW 2007, Australia
*
Author to whom correspondence should be addressed.
Buildings 2022, 12(3), 379; https://doi.org/10.3390/buildings12030379
Submission received: 14 February 2022 / Revised: 11 March 2022 / Accepted: 15 March 2022 / Published: 18 March 2022
(This article belongs to the Section Construction Management, and Computers & Digitization)

Abstract

:
Given that project selection is a vital and recurring strategic decision for construction firms, there is a sizeable collection of studies that examine the factors affecting contractors’ decision to bid (d2b). With the aim to provide a global perspective of factors affecting contractors’ d2b, this study meta-analytically reviews 24 relevant studies published between 1988 and 2021. The results show that that there are 28 critical factors, and the top five factors are (i) project payment terms, (ii) financial capacity of client, (iii) client’s reputation in the industry, (iv) the history of client’s payments in the past projects, and (v) project size. The heterogeneity test results, which show no statistically significant heterogeneity across the included studies, reinforce the generalisability of the findings to a global context. The research findings have practical implications for construction clients in their procurement of construction services, highlighting the importance of good reputation and payment history. For contractors, they now have access to a list of critical factors from a global perspective in facilitating their d2b decision. There are methodological implications for the research community in guiding future efforts in replicating studies.

1. Introduction

In competitive bidding, the decision to bid (d2b) (also known as project selection, pre-bid analysis, project screening or bid/no-bid decision) is a vital and recurring strategic decision for construction firms. This is because most contractors obtain a large portion of their jobs through competitive bidding and they only win a proportion of the jobs they bid for [1,2]. Contractors are selective in their d2b and the decision-making process is complex and challenging because on one hand failing to bid for a ‘right’ project results in the loss of opportunity to realise the potential profit and, on the other hand, submitting non-winning bids in response to clients’ tender invitations is sometimes said to be costly and may have a negative impact on a firm’s reputation [3]. It should be noted that the added complexity in a d2b process is evidenced in contractors’ submission of a non-competitive bid or non bona fide bid instead of rejecting a bidding opportunity [4]. The possible reasons for contractors’ submitting a non-competitive bid include that they want to (i) obtain information about current market conditions, (ii) show that they are still in the market, (iii) make it more difficult for competitors to determine their strategy, and (iv) deny their competitors the chance of entering the competition in their place; also, their failure to bid will prejudice future bidding opportunities [4,5].
Given the complexities involved in contractors’ d2b, previous studies may be classified into two categories. First, there is a sizeable collection of studies aimed at identifying and determining the importance of possible factors affecting contractors’ d2b. These studies were conducted in different countries, mainly using questionnaire surveys for data collection. Next, the second category consists of various d2b models developed to offer contractors decision support systems in facilitating their decision making (e.g., [6,7,8]). Unfortunately, it has been reported that contractors do not use, or have made minimal use of, such models for different reasons [9,10]. This study focusses on the first category of studies on factors affecting contractors’ d2b. Although there is a sizeable collection over the last 30 years or so, there is little consensus on the critical factors affecting contractors’ d2b given the disparate state of existing findings. A statistical meta-analysis is warranted and imperative to shed light on the critical factors affecting contractors’ d2b. Meta-analysis is a robust statistical approach for an orderly summarisation of studies so that knowledge can be extracted from the myriad individual studies [11,12]—that is, to estimate the combined effect (outcome) of individual studies and ascertain the precision of that estimate [13]. With the aim to provide a global view of factors affecting contractors’ d2b, this study meta-analytically reviews the relevant studies over the last 30 years or so. In achieving the research aim, a statistical analytical method was used to achieve the two specific objectives, namely: (i) the identification and evaluation of the importance of critical factors affecting contractors’ d2b, and (ii) the assessment of the generalisability of findings of the meta-analysis. The findings clearly have implications to industry stakeholders. For construction clients, an understanding of critical factors affecting contractors’ d2b would enable them to fine-tune their procurement design. Contractors, on the other hand, would be able to consider the critical factors in the formulation of their d2b strategies. This understanding is especially valuable to new market entrants or contractors interested in global construction markets [14,15,16].

2. Factors Affecting Contractors’ Decision to Bid

Despite the evolvement of different procurement routes over the years, competitive bidding remains the most common method of job distribution in the construction industry [2,17]. It is concerned with contractors making strategic decisions in respect of (i) project selection—whether to bid for a job, and (ii) determination of the mark-up for their bid if they opt to bid [18]. With limited response time to any bidding opportunities, contractors need to concentrate their bidding efforts on bidding opportunities that assist in satisfying their firms’ objectives. The construction industry has been characterised by substantially lower mark-ups compared to other industries because of highly competitive business environments [15,19] and unfortunately, the industry has a high rate of business failures [20]. Thus, there is a consensus that the primary objective of a construction firm has been said to be in its continued existence and further development [21,22]. In line with individual firms’ objectives, there are specific objectives for contractors’ project selections or d2b [18]: (i) a monetary objective to achieve the desired change in levels of monetary resources (i.e., profit or profitability of project); (ii) non-monetary objectives including to keep the resources occupied, to serve the client well, and to maintain and improve quality and services; and (iii) market-related objectives, including to increase market share, to stay in existing markets to penetrate new markets, and to increase publicity.
In meeting individual firms’ specific project selection objectives, it is expected that d2b strategies vary from contractor to contractor, and that their strategies depend on many individual firm-specific characteristics [23]. For example, contractors will avoid contracts that are too large for their firm size, and that are beyond their experience and normal geographical location of operation, and contracts that are likely to stretch their available resources, including cash [24]. Male [25,26] suggests that contractors define a strategic domain establishing the market dimensions within which they plan to operate and compete for work. The strategic domain can be defined by a set of parameters including degree of complexity and project size, type of contractual arrangement, and geographical area [27]. In modelling contractors’ d2b, Oo et al. [23,28] have applied the notion of heterogeneity, i.e., construction firms respond differently in terms of both their (i) intrinsic bid/no-bid preferences and (ii) responses to the given set of factors affecting their d2b. In other words, individual contractors exhibit different degrees of preference or sensitivity towards the factors affecting their d2b. There is a sizeable collection of replicated studies that examine contractors’ responses to factors affecting their d2b since the pioneering work by Ahmad and Minkarah [29]. While not specifically derived based on any theoretical notions, this collection of studies has reported the differences in contractors’ responses mainly via grouping and/or ranking of d2b factors in accordance with their level of importance.
Next, this collection of replicated studies was conducted in construction industries of different countries using a long list of factors affecting contractors’ d2b (for e.g., as many as 94 factors in [30]). Although there is substantial evidence on the varying levels of importance or emphasis on individual factors among the study respondents, it is neither possible nor justified to draw conclusions on what are the most critical factors affecting contractors’ d2b when the replicated studies are treated individually. Thus, it is not possible to provide a global view of critical factors affecting contractors’ d2b despite the existence of this sizeable collection of studies. This paper aims to address this research gap by meta-analytically reviewing the relevant studies using a statistical approach.

Why Meta-Analysis?

Glass [11] coined the phrase meta-analysis and outlined its essential characteristics. He refers to meta-analysis as “the analysis of analyses … the statistical analysis of a large collection of analysis results from individual studies for the purpose of integrating the findings” (p. 3). With reference to the vast amount of educational research, he advocated that new methods of discovering knowledge in ‘findings’ or ‘results’ of individual studies are needed when there is a sign of maturity of research efforts. Meta-analysis has been used in many different fields of scholarly work, which was referenced by Shadish and Lecy [31] as the ‘meta-analytic big bang’ that occurred in the 1970s. They found that the application of meta-analysis has been prevalent in social sciences, medicine, and education.
While construction management research is considered rather new since its emergence in the 1970s, Kenley [32] opined that it is reaching a point where there is an increasing need to perform meta-analysis on testing the existing models or results of replicated research studies. This would offer the research community an appraisal of what is currently known, including: (i) the identification of trends and new relationships via repeated observation in replicated studies; (ii) the potential to draw conclusions not supported by individual studies; and (iii) the development of an international perspective on a subject matter [32]. The other important role of meta-analysis is in documenting rigorous methodology in replicated studies so that meta-analysis can take place in the future, as well as to guide future research efforts [32,33,34]. There are clear signs of maturity of research efforts on some construction management research areas as evidenced by the application of meta-analysis in recent literature. For example, Alruqi and Hallowell [35] identified the critical leading indicators for construction safety; Sanni-Anibire et al. [36] provided a global view on causes of delay in construction projects; Hussien and Zayed [34] examined the critical success factors for just-in-time application in modular integrated construction; and Adebowale and Agumba [37] identified the critical factors affecting labour productivity of small and medium-sized construction firms in developing countries. In construction bidding research, Oo et al. [16] opined that the large collection of replicated studies on factors affecting contractors’ bidding decisions have prompted the maturity of research efforts and the need for meta-analysis. They performed a meta-analysis in identifying and ascertaining the importance of 23 critical factors affecting mark-up size of construction projects based on a collection of relevant studies conducted in different countries. Their study was considered the closest to this study in which the focus here is on factors affecting contractors’ d2b.

3. Research Method

There are challenges in the application of meta-analysis, and thus there is a need to address them in the design and conduct of the study. The main challenge is to minimise the risk of bias associated in the three key processes, namely the selection of relevant studies, the data extraction, and the application of statistical meta-analysis methods [38,39]. Various strategies have been adopted in these processes in the present study, as detailed next.

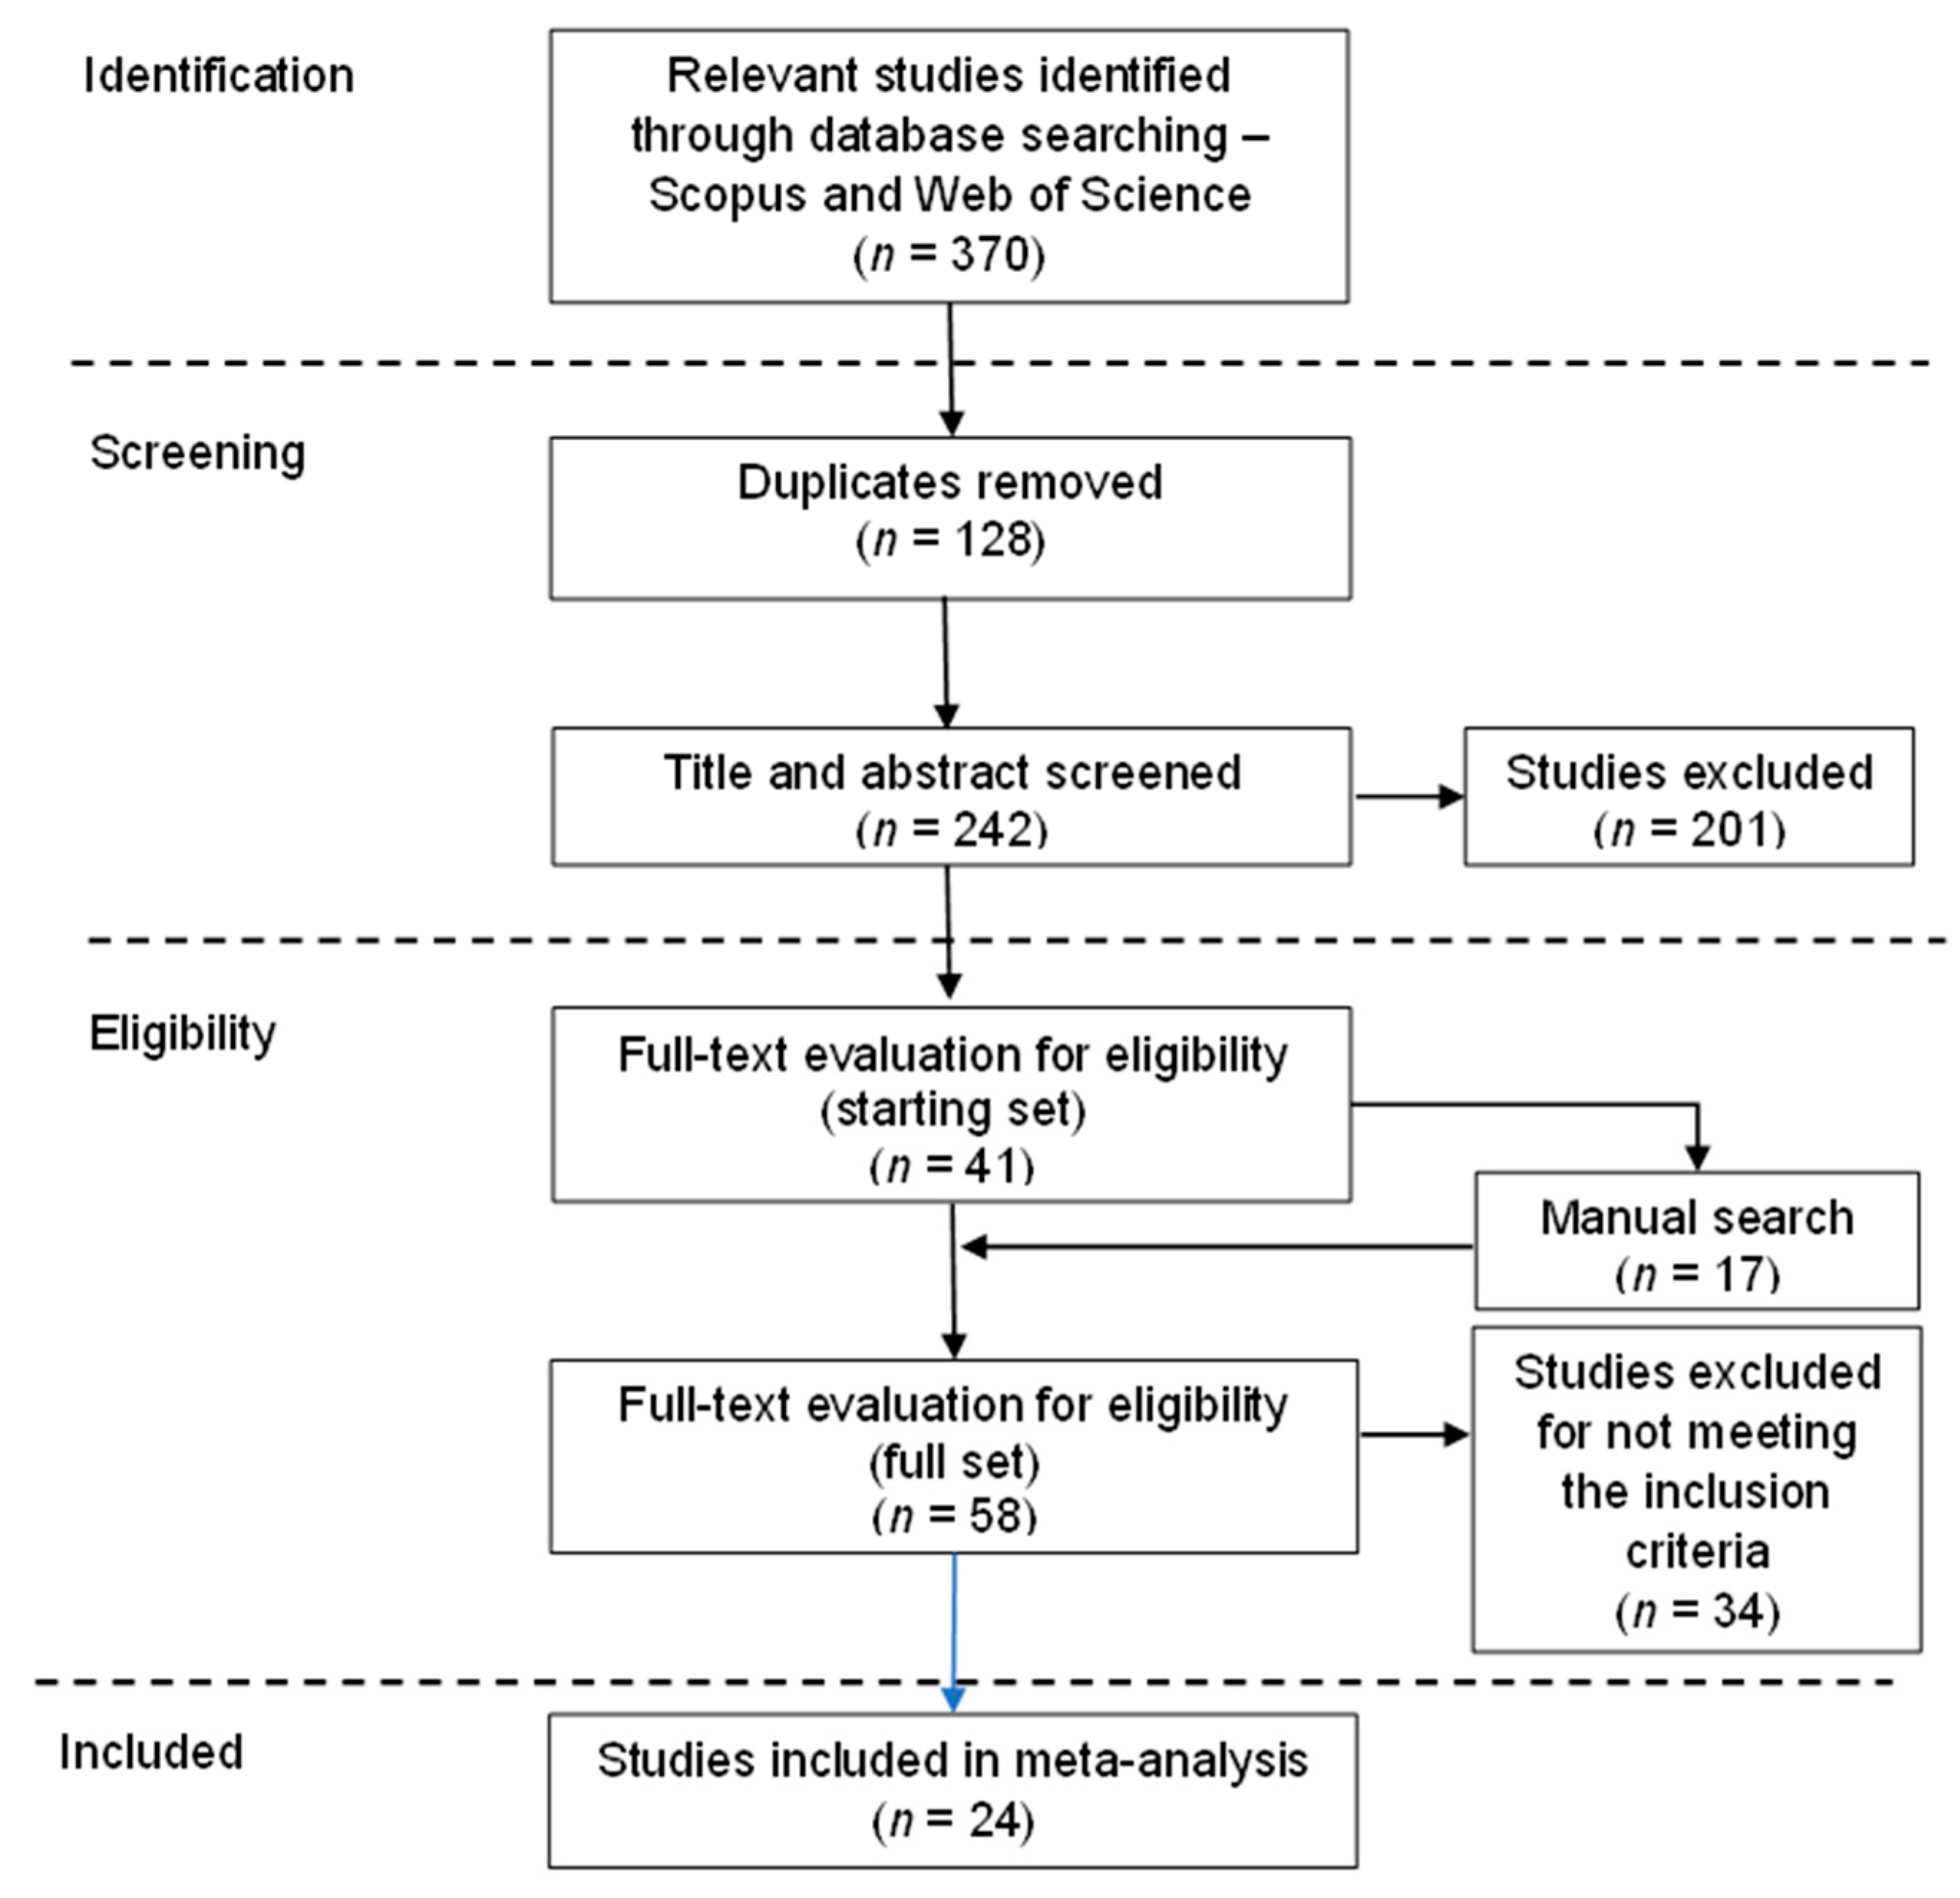
3.1. Selection of Relevant Studies

The selection of relevant studies followed the widely accepted Preferred Reporting Items for Systematic Review and Meta-Analyses (PRISMA) guidelines in Moher et al. [40]. Figure 1 shows the PRISMA four-phase flow diagram in screening and selecting the relevant studies in the systematic review process. In the first phase of identification, it started with a keywords-based search on two key databases that have been widely used in systematic construction management review research, namely Scopus and Web of Science. The use of two databases helped to ensure a comprehensive coverage and the Endnotes software was used in managing the retrieval of relevant studies. In performing the search on ‘article title, abstract, and keywords’ in the databases, the advanced search tools in the databases were applied by utilising Boolean operators (AND, OR). The keywords used include ‘construction’, ‘contractor’, ‘construction project’, ‘factor’, ‘bid or no-bid’, ‘decision to bid’, ‘bid decision’, ‘project selection’, and ‘tender selection’. Upon the removal of duplicates, a total of 242 studies were examined based on titles and abstracts in the screening phase. Of these, 41 relevant studies were identified as the starting set for the subsequent full-text evaluation in the eligibility phase.
An MS Excel spreadsheet was used to perform a structured full-text evaluation process by recording the relevant details including the authors’ names, publication types, publication years, countries or locations of study, types of project examined (e.g., general building, civil engineering, or international project), data collection and measurement techniques, sample sizes, number of factors examined, and identities of sample respondents. For studies with missing details, the authors attempted to consult the respective authors. Furthermore, manual searching was essential in this eligibility phase to minimise possible bias arising from missing relevant studies in the selection process [41]. The manual search process commenced by searching references from the included studies (i.e., the starting set of 41 studies). The consecutive steps to increase and refine the yield of manual searching involved tracking ‘related articles’ and ‘cited by’ articles using the identified references in the Google Scholar search engine and requesting the full texts via interlibrary loans as required. An additional 17 references were obtained via manual searching and these references were subjected to full-text evaluation for eligibility. The spreadsheet enabled a comprehensive review of the studies for identifying the dominant research focus and statistical measurement technique. A total of 24 studies were selected for the meta-analysis based on the following inclusion criteria:
  • Study that focused on factors affecting contractors’ d2b;
  • Study that focussed on general building and civil engineering projects;
  • Sufficient statistical data was available for conducting meta-analysis (i.e., mean scores or Relative Importance Index (RII));
  • No restriction regarding location of study, publication year, or publication type; and
  • Only one study was selected when there were duplicating studies.
It should be noted that relevant studies from the same country or location have been included to minimise the risk of bias in the selection [42]. For example, there are four studies from Nigeria that were conducted at different time points, and two from the Gaza Strip with different groups of respondents (see Table 2).

3.2. The Data Extraction Process

In performing the data extraction process as illustrated in Figure 2, spreadsheets were used to record the list of factors and to perform the calculations or conversions as the data needed for meta-analyses are often reported in diverse formats [43]. It started with the conversion or calculation of the RII (i.e., the effect size) for individual factors. The equation of RII is given below:
RII = w ( A * N )
where w is the weighting given to each factor by respondents, A = highest weight in the Likert scale, and N = total number of respondents. The minimum and maximum RII values are between 0 and 1, respectively. A higher RII value indicates that a particular factor is more important than those with lower RII values. There is a collection of studies that reported RII in percentage terms and thus there was a need to convert RII in percentages into indices by dividing them with a constant of 100. Next, about half of the included studies reported mean scores for individual factors and the calculations involved dividing the mean scores with the number of points used for the Likert scale in the respective studies (ranges from 1 to 7). The consecutive step involved the selection of factors for the meta-analysis. There were 1006 factors from the included studies and a master list of 264 factors was used for data extraction upon the removal of duplicates. In the data extraction process, the RII of individual factors from the included studies were recorded using different columns on a spreadsheet. Each column represents a sample set (or sample population) and there are 25 sample populations from the 24 included studies—that is, a total frequency of 25 if an individual factor has been examined in all sample sets.
It should be noted that there are 25 sample populations because there are 14 publications that examined responses from different groups of respondents in their studies, creating subgroups of respondents. Of these, two publications reported statistically significant differences between their subgroups of respondents (S4 and S16 in Table 2). These subgroups were treated as independent, giving rise to two additional sample sets for the meta-analysis purpose. Next, the data from two publications (S17 and S20 in Table 2) were combined as they were obtained from the same study (i.e., single sample population). These two publications focussed on external and internal factors affecting d2b, respectively. Indeed, Li et al. [43] pointed out that individual studies, rather than reports or publications, should be the unit of interest in a systematic review where multiple publications of the same study need to be identified and combined for the data extraction process.
Of the 264 factors, the recorded frequencies range between 1 and 24. The recorded maximum of 24 means that there is no single factor that has been examined in all 25 sample sets. Additionally, there are 200 factors with recorded frequency of five or less, which indicates these factors were examined in five or less sample sets. While it is possible to perform a meta-analysis on individual factors with at least two RII values (at least two sample sets), it is more reasonable to focus on critical factors that have been examined in most of the sample sets. In this, a cut-off point of 11 (i.e., the median of frequency) was used and 28 factors with a frequency count equal to or greater than 11 were selected, giving rise to a total of 440 RII values (raw data points) for statistical meta-analysis.

3.3. Statistical Meta-Analysis Using Random-Effects Model

One goal of a meta-analysis will often be to estimate the overall or combined effect or effect summary (es) that summarises the individual effect sizes (outcomes) from all included studies [44]. In the present study, the effect sizes are RII for the 28 factors collected from the relevant studies. In a meta-analysis, the focus is to compute a weighted mean, with more weight given to some studies and less weight given to others, rather than to compute a simple mean of the effect sizes since some studies are more precise than others [13]. This study used the inverse-variance method, which is the most common and simple weighting scheme in meta-analysis that involves assigning weights to each study based on the inverse of the overall study error variance (i.e., 1/variance) [45]. For model specification, the two popular statistical models for meta-analysis are the fixed-effect model and the random-effects model. These two models make different assumptions about the nature of the selected studies, and these assumptions give rise to different definitions for the combined effect or effect summary, and different mechanisms for assigning weights [44]. In a fixed-effect model, it is assumed that all included studies share a common (true) effect size [13]. However, Borenstein et al. [44] point out that “this assumption may be implausible in many systematic reviews, when we decide to incorporate a group of studies in a meta-analysis, we assume that the studies have enough in common that it makes sense to synthesise the information. However, there is generally no reason to assume that they are “identical” in the sense that the true effect size is exactly the same in all the studies” (p. 105). For a random-effects model, on the other hand, the true effect could vary from study to study. For example, in the context of the present study, the effect size (RII) might be a higher or lower if the respondents are more experienced, or more successful in past bidding attempts, or if the effect was measured more reliably. Thus, it would be expected that the effect size (RII) would be ‘similar but not identical’ across the selected studies. In a meta-analysis of factors affecting contractors’ mark-up decisions, Oo et al. [16] opined that the magnitude of the importance of individual factors may vary depending on firm size, market conditions, the location of study, the respondent’s experience, and many other factors, which are likely to vary from study to study. Logically, such factors do exist and may lead to variations in the magnitude of the effect size [13,44]. Indeed, Borenstein et al. [13,44] further point out that it is very hard, if not impossible, to assess or know which factors are related to the effect size obtained from the included studies. Hence, a random-effects model would be a more appropriate choice in most meta-analyses since it is more likely to fit the actual sampling distribution, and it allows the findings to be generalised to a wider array of situations [13]. The latter suggests that the findings in this study could be generalised to construction industries in different countries, thus providing a global view of the subject matter. The meta-analysis was performed using MS Excel spreadsheet guidelines prepared by Borenstein et al. [44] and Neyeloff et al. [46]. The use of MS Excel for meta-analysis is an affordable and easily accessible option, despite the availability of some free or commercial software packages on meta-analyses, which might be too complex and inflexible [46]. Table 1 shows the details of the steps and equations applied in the meta-analysis for all 28 factors.

4. Results

Table 2 shows the 24 studies published between 1988 and 2021 that have been included in the meta-analysis. As pointed out before, there are 25 sample sets based on these 24 studies. Data were collected using questionnaires in all studies, which were distributed by post, electronically, or by hand delivery to the targeted respondents. One of the studies is the pioneering work (i.e., S1) by Ahmad and Minkarah [29], which has been replicated across a period of over 30 years as captured in the systematic review process in this study. However, it should be noted that no study between 1998 and 2007 (i.e., a gap of 9 years between S3 and S4) has been included. While a few studies between these years were identified in the review process, they were excluded for not meeting the inclusion criteria. For example, Fayek et al.’s [48] study in Canada has not provided sufficient statistical data (only the factor ranking was reported), Lowe and Parvar’s [7] study using case studies in the UK was grouped in an incomparable way that is not possible for conversion into RII, and Wanous et al. [6] have not reported the required statistical data for RII computation for 182 projects in Syria that were used in their modelling attempt.
In terms of publication type, most studies are journal articles with a combined sample size totalling 2031. The number of survey respondents ranges between 22 and 169, with an average of 84 respondents per study. Most of the respondents were local contractors of different scales, whom the authors have classified into small, medium, and large contractors based on the relevant local contractors’ registry system. Two studies included consultants and clients in their survey (i.e., S7 and S21), which provides another perspective in understanding the factors affecting contractors’ d2b. Next, the number of factors examined ranges between 15 and 94 with an average of 42 factors per study. Additionally, an attempt has been made to classify the studies based on their location using the World Bank country classification system by income [49]. There is a good mixture of lower-middle-, upper-middle-, and high-income countries among the included studies.
In presenting the meta-analysis results of the 28 factors, first, Table 3 shows the weighted RII and ranking of individual factors obtained from the meta-analysis, together with their ranking based on frequency of occurrence (out of 25 sample sets). These factors are classified into five categories, namely project characteristics, firm-related factors, tendering situation, client-related factors, and economic situation. Of these, the ‘project characteristics’ category has the highest number of factors often. The two ranking approaches clearly demonstrate that the frequency of occurrence of an individual factor in the literature may not necessarily reflect its importance level. For example, all three client-related factors are among the top five factors based on their weighted RII obtained from the meta-analysis. By contrast, these three factors have recorded rather low frequencies of occurrence and ranked outside the top five. Similarly, there is a stark difference in both rankings for other factors including project payment terms (F1.9), project location (F1.2), project duration (F1.3), number of bidders (F3.1), and availability of equipment (F5.1). A further comparison of the top five factors in the two rankings reveals that ‘project size (F1.1)’ is the only factor that ranked in the top five in both rankings. It should also be noted that a precise ranking is not achievable based on the recorded frequencies when there are an identical number of occurrences. Indeed, these stark differences in both rankings provide a strong support for performing statistical meta-analysis in ascertaining the importance of individual factors with certainty (i.e., the estimate of effect size—weighted RII with confidence intervals). Based on the weighted RII, the top five factors are project payment terms (F1.9), financial capability of client (F4.1), client’s reputation in the industry (F4.2), the history of client’s payments in past projects (F4.3), and project size (F1.1).
Table 2. Studies included in the meta-analysis.
ID in Meta-AnalysisReferencePublication TypePub. DateLocation of StudyWorld Bank ClassificationSample SizeNo. of FactorsRespondents
S1Ahmad 1988 (US)[29]Journal 1988USHigh income9031Top contractors
S2Shash 1993 (UK)[50]Journal 1993UKHigh income8555Top contractors
S3Wanous 1998 (SY)[51]Conference1998SyriaLow income6138Contractors registered on local registry
S4Egemen 2007 (TR) (S) and (M)[52]Journal2007Northern Cyprus and TurkishHigh income (Cyprus), Upper middle income (Turkey)80 a83Small (38) and medium (42) contractors
S5Bageis 2009 (SA)[53]Journal 2009Saudi ArabiaHigh income91 b87Small, medium and large contractors
S6Enshassi 2010 (PS) (I)[30]Journal 2010Gaza stripLower middle income77 b94Three different grades of contractors
S7Enshassi 2010 (PS) (II)[54]Journal 2010Gaza stripLower middle income104 b78Owners (28), contractors (65) and consultants (11)
S8Asuquo 2012(NG)[55]Journal2012NigeriaLower middle income64 b20Small, medium and large contractors
S9El-Mashaleh 2013 (JO)[56]Journal 2013JordanUpper middle income4353Large contractors
S10Jarkas 2014 (QA)[57]Journal 2014QatarHigh income92 b43Three different grades of contractors
S11Lesniak 2015 (PL)[58]Journal 2015PolandHigh income61 b16Micro, small and medium contractors
S12Oyeyipo 2016 (NG)[59]Journal 2016NigeriaLower middle income50 b48Indigenous (39) and expatriate (11) contractors
S13Shokri-Ghasabeh 2016 (AU)[60]Journal 2016AustraliaHigh income81 b26Small, medium and large contractors
S14Olatunji 2017 (NG)[61]Journal 2017NigeriaLower middle income6441Indigenous contractors SMEs
S15Marzouk 2018 (EG)[62]Journal 2018EgyptLower middle income22 b38Three different groups of contractors based on average job size
S16Zhang 2018 (CN) (M) and (L)[63]Thesis2018ChinaUpper middle income57 a40Medium (20) and large (37) contractors in Jilin Province, China
S17Maqsoom 2018 (PK) [64]Conference2018PakistanLower middle income167 c23Contractors registered on local registry
S18Alsaedi 2019 (SA)[65]Journal 2019Saudi ArabiaHigh income67 b31Three different grades of contractors
S19Bageis 2019 (SA)[66]Journal 2019Saudi ArabiaHigh income9725Large contractors
S20Maqsoom 2020 (PK)[67]Conference2020PakistanLower middle income167 c24Contractors registered on local registry
S21Oke 2020 (NG)[68]Journal 2020NigeriaLower middle income100 b15Contractors and consultants
S22Wang 2020 (CN)[17]Journal 2020ChinaUpper middle income10933Contractors in different (20) provinces and cities
S23Chileshe 2021 (TZ)[69]Journal 2021TanzaniaLower middle income3330Small contractors
S24Gunduz 2021 (QA)[70]Journal 2021QatarHigh income169 b34Small, medium and large contractors
a Statistically significant difference between different groups of respondents reported in the study; the subgroups of respondents were treated as independent samples. b No statistically significant difference and/or no comparison between different groups of respondents reported in the study; the subgroups of respondents were treated as single sample population. c Studies S17 and S20 were based on single sample population focussing on internal and external factors affecting contractors’ d2b decision, respectively.
Next, Table 4 summarises the two statistical test results of the estimated effect summary of individual factors. In testing the null hypothesis that the effect summary (i.e., weighted RII) equals zero, the results show that null hypothesis (i.e., e s ¯ v = 0 in step 11 in Table 1) is rejected for all 28 factors at p < 0.05 significant level. The weighted RII values range between 0.553 and 0.833, with an average of 0.668 (out of maximum of 1). Only the top six factors (21%) recorded weighted RII above 0.75, and as many as 19 factors (68%) recorded weighted RII below 0.70. By contrast, it is worth noting that there is much variability in the recorded RII values from the included studies (i.e., a total of 440 raw data points), where 10% of the RII values are below 0.5 and the percentages of the RII values above 0.75 and below 0.70 are 41% and 39%, respectively. These variabilities can be partly explained by the heterogeneity across the included studies that were conducted in different countries or locations. However, the heterogeneity test results show that there is no statistically significant heterogeneity across the results of included studies; thus, the null hypothesis (i.e., Qv = 0 in step 12 in Table 1) cannot be rejected. This hypothesis testing outcome applies to all 28 factors for which all p-values are greater than a 0.05 significance level. Although no significant heterogeneity was detected, four factors recorded a very low level of heterogeneity with an I2v of below 10% and the remaining factors have no inconsistency (I2v = 0). Hence, further investigation of heterogeneity is not warranted in the present meta-analysis.
Figure 3 shows the weighted RII and 95% confidence intervals (i.e., the error bars) of individual factors. As expected, some factors have relatively large confidence intervals. This can be explained because the standard errors and confidence intervals will always be larger under random-effects model specification, since it has considered both within-studies and between-studies variances [44]. It is noted that the confidence intervals are larger for factors with lower weighted RII (for e.g., F1.7, F1.8, F3.4, and F5.4), indicating lower precision that can be attributable to the variances between studies on these factors.
Lastly, Figure 4 shows the forest plots, which are the usual way to illustrate meta-analyses results. These forest plots are only presented for the top five factors identified in the study because of the space limitations in this paper. Each forest plot displays the effect estimates and confidence intervals at 95% level of confidence of individual studies (i.e., individual block markers with error bars with study ID on Y-axis) and effect summary from the meta-analysis (i.e., the diamond marker with error bar at the bottom, ID = 1). For all five factors, as expected, the effect estimates of individual studies would not line up in a row since a particular effect size is assumed to vary from one study to the next under the random-effects model specification. The diamond marker crossed by a vertical line parallel to the y-axis, which denotes the effect summary, further demonstrates the variations between studies that made different contributions to the effect summary estimate. For example, in the forest plot for factor ‘the history of client’s payments in past projects (F4.3)’, two studies crossed the line (study ID 7 and 9) and the numbers of studies that contributed positively and negatively to the effect summary are five and four, respectively—that is, five studies on the right-hand side (positive contribution) and four studies on the left-hand side (negative contribution) of the vertical line. Next, the error bars denote that the width of confidence intervals of some individual studies are rather wide, indicating less precision in the respective studies. Nonetheless, the concern of precision in meta-analysis is over the precision of the effect summary rather than the precision of individual studies [44]. In this case, the precision of the effect summary is not a concern since the width of the confidence intervals of the individual effect summary of all top five factors (i.e., the diamond markers) are approaching zero.

5. Discussion

In addressing research objective 1 on the identification and evaluation of the importance of critical factors affecting contractors’ d2b, the 24 relevant studies selected via a systematic review process has enabled the identification of a set of 28 critical factors for inclusion in the statistical meta-analysis. Upon considering both within-studies and between-studies variances using a random-effects model, the results show the importance of the individual factors (i.e., weighted RII with confidence intervals) along with their ranking with certainty. It is clearly demonstrated in Table 3 that there is a significant difference in ranking the factors based on their frequency of occurrence and weighted RII, respectively. Here, the meta-analysis findings have made it possible to identify and draw robust conclusions on the critical factors affecting contractors’ d2b, which were not possible before the use of statistical meta-analysis. It is worth noting that these are the potential benefits of meta-analysis highlighted in Kenley [32]. Next, on the assessment of the generalisability of findings of the meta-analysis (i.e., research objective 2), the heterogeneity test results (see Table 4), which show that no statistically significant heterogeneity was detected in the included studies’ results, reinforce the generalisability of the meta-analysis findings to a wider population [13]. With the differing economic, geographical, and institutional settings of the construction industries in the included studies as a backdrop, the current findings provide a global view of factors affecting contractors’ d2b. Again, this was not achievable given the disparate state of existing findings when the collection of replicated studies is treated individually. Nonetheless, as with any research findings, it is recognised that the current findings do require care in generalisation.
On the identified critical factors, there is much empirical evidence on their importance and effects on contractors’ d2b, especially the top ranked factors. However, it is rather surprising that the top four factors are related to client and project payment issues (i.e., project payment terms (F1.9), financial capacity of client (F4.1), client’s reputation (F4.2), and the history of client’s payments (F4.3)). This may largely be explained by the importance of a healthy cash flow and cost control in construction-business survival [71,72]. Mahamid [73] found that contractors perceived delay in payments from clients as one of the top-ranked factors affecting construction-business failures. In addressing challenges of construction-business failure, Holt [71] recommended that contractors should bid for a project type that is within geographic locations that offer the firm optimum cost control, maintain up-to-date knowledge on demand, competition, clients, and suppliers, and sustain positive cash flow. These suggestions have indeed captured other critical factors identified in this study (i.e., F1.2, F1.4, F3.5, and F5.1 to F5.5). The importance of clients’ financial capacity (or ability to pay), their reputations, and histories of timely payment were reported in Zuo et al.’s [22] study on contractors’ strategies in surviving an economic downturn. Their interviewees suggested that bidding rationally is especially important during an economic downturn, and it is not advisable to bid for clients who may not be able to honour payment. One should also avoid ‘aimless’ bidding and aim to bid for projects from honourable clients who are within a firm’s area of expertise and familiarity [22].
Further to the above, empirical evidence has highlighted the effects and/or relationships among contractors’ current workloads (F2.1, ranked 8), need for work (F2.4, ranked 7), prevailing economic situation (F5.5 availability of work and F5.3 availability of other projects for tendering, ranked 12 and 10, respectively), and contractors’ d2b. De Neufville et al. [74] found that fewer bids were recorded in what they refer to as ‘good’ years with a wide availability of projects, whereas competition becomes fierce in ‘bad’ years when few projects are available. This can be partly explained by the fact that contractors have a high need for work (and current workload tends to be low) in recession times and thus submit more bids, and vice versa in boom times. Using need for work as the proxy variable of market conditions, Oo et al.’s [23,28] statistical modelling attempts found that individual contractors submit more bids in recession times when fewer projects are available. Other variables captured in their models are project size (F1.1, ranked 5), project type (F1.4, ranked 9), and number of bidders (F3.1, ranked 20). They found that contractors show preference in project type and size in their d2b, and that they are more reluctant to bid when the anticipated number of bidders is high. The other top-ranked factor that is highly related to project type is contractors’ experience on similar projects (F2.2, ranked 6), which enables them to submit more competitive bids for types of work they are familiar with—that is, to concentrate on a firm’s area of expertise and familiarity in project selection [22,71]. Project size, on the other hand, reflects the risks involved in undertaking a project and it is a major determinant of the number of contractors who are capable of undertaking a particular project with required capital and management skills [27]. Contractors’ preferences for a particular size range of projects in d2b can be explained because they are more competitive or successful in the respective size range [75,76].
While the discussion so far has focussed on the top-ranked d2b critical factors, it would be worthwhile to compare the findings with the 23 critical factors affecting contractors’ mark-up sizes in Oo et al. [16], both using the same statistical meta-analysis approach. Table 5 shows the top 10 factors in both studies. It can be seen that the four top-ranked critical factors are identical in the two consecutive bidding decision-making processes, namely project size, experience on similar project, current workload, and availability of other projects for tendering (highlighted in grey). The evidence is suggestive that contractors have placed different degrees of emphasis on different factors in their d2b and mark-up decisions. Project payment and client-related factors are of greater importance in d2b decision-making processes, while factors related to the tendering situation (competitiveness of other bidders, number of bidders, and tendering procedure) gain more importance in mark-up decision. The lack of agreement on the identity of the top-ranked factors detected in the comparison should be considered in relevant future research.

Research Implications

All in all, the findings of the meta-analysis are invaluable in revealing the critical factors affecting contractors’ d2b from a global perspective. While there is a need of care in results generalisationto a wider population, the findings clearly have implications in many ways. For construction clients, it is important for them to build up and maintain good reputations and on-time payments to contractors, thus reducing risks for contractors. These would help in securing competitive bids from a potential pool of contractors, thus achieving the required competition level. Indeed, this may be of particular importance to client groups who need to maintain a high level of accountability and transparency in their procurement of construction services. Similarly, clients may need to consider other critical factors in their procurement designs, for example, the availability of other projects in the markets in scheduling their tenders, to maximise the efficiency in their procurement exercises. For contractors, especially new market entrants, who are keen to venture into new markets, the top-ranked critical factors related to project payment and clients are of great importance in filtering the tender opportunities that come along. There may be a need to do some background research on a potential client’s financial capability, reputation, and history of payments before deciding to bid for a project. Additionally, the identified critical factors highlight that potential competing bidders would very likely to take into consideration their current workload and need for work in their d2b, and these considerations may be reflected in their bid pricing behaviours. Thus, this would have implications on the bidding strategies of individual organisations. Above all, a global perspective and an insight into the importance of the critical factors affecting d2b are valuable to contractors. The simplest application here is to refer to the list of critical factors when deciding whether to bid for a job.
Last, the implications for the research community are numerous. It is advisable that researchers should use the most frequent measuring statistics in their attempts to replicate a study so that meta-analysis can take place in future. It is also essential to provide information on the variability of the reported results (e.g., standard deviation, standard error, or confidence interval) to facilitate calculation or conversion of effect size. As noted in this study and so in other meta-analyses (e.g., [16,34]), possible reasons for not including some relevant studies are insufficient statistical data and/or use of different measuring statistics. Next, the list of critical factors should serve as a robust foundation in future research efforts related to factors affecting d2b and/or d2b modelling attempts. Very often, authors have attempted to identify a list of potential factors in the literature based on their frequency of occurrence, which as demonstrated in the present study may not be adequate to reflect the importance of individual factors. Last, future research should take into consideration the fact that contractors have placed different emphases on different sets of factors in their d2b and mark-up decisions. Previous studies (e.g., [52,63]) that applied an identical set of factors in examining their importance in both decisions may be seen as a research limitation, which could be justified by the non-existence of the respective meta-analyses. It is envisaged that future research that applies different sets of factors could potentially lead to an understanding of the association of different factors affecting these two decisions.

6. Conclusions

There are two key stages in the research processes in addressing the research aim and objectives. A systematic review process was first performed to identify a collection of 24 relevant studies on factors affecting contractors’ d2b over the last 30 years or so. These included studies were published between 1988 and 2021. The subsequent stage involved the data extraction process for the selection of 28 critical factors for inclusion in the statistical meta-analysis. The findings of the meta-analysis have enabled an estimation of the combined effect of individual factors from the included studies—that is, a summation of the studies so that conclusions could be drawn on critical factors affecting contractors’ d2b. The results show that the top five critical factors are: (i) project payment terms; (ii) financial capacity of client; (iii) client’s reputation in the industry; (iv) the history of client’s payments in the past projects; and (v) project size. The end results consist of a list of 28 critical factors affecting contractors d2b, which have been ranked with certainty based on the meta-analysis outputs. The heterogeneity test results, which show no statistically significant heterogeneity in the included studies’ results, reinforce the generalisability of the meta-analysis findings to a wider population. With the differing economic, geographical, and institutional settings of the construction industries in the included studies as a backdrop, the current findings provide a global view of factors affecting contractors’ d2b. These findings have practical and methodological implications for construction industry stakeholders and construction management research community, respectively.
There are potential weaknesses in meta-analyses and one of the key limitations of this study is that one should apply care in the generalisation of the results. It is recognised that it is always necessary to consider all relevant factors that are of strategic importance to individual organisations in a bidding decision-making process, including any institutional factors. Thus, it is vital to include factors that are relevant to a local construction industry or project type under investigation in future research attempts related to factors affecting d2b and/or d2b modelling attempts. The other limitation is that some relevant studies have not been considered in the study, mainly because of the unavailability of sufficient statistical data. It is worth noting that a similar issue has been reported in other meta-analyses in construction management research. Thus, this issue should be addressed in any future attempts to replicate a study so that meta-analysis can take place in the future. It is felt that efforts on such construction management research have clearly demonstrated maturity, prompting the need for meta-analyses.

Author Contributions

Formal analysis, B.L.O. and T.H.B.L.; methodology, B.L.O.; resources, G.R.; writing—original draft, B.L.O.; writing—review & editing, T.H.B.L. and G.R. All authors have read and agreed to the published version of the manuscript.

Funding

The APC was funded by the School of Build Environment, Faculty of Arts, Design and Architecture, UNSW, Sydney, Australia.

Conflicts of Interest

The authors report there are no competing interest to declare.

References

  1. Alkhateeb, A.M.; Hyari, K.H.; Hiyassat, M.A. Analyzing bidding competitiveness and success rate of contractors competing for public construction projects. Constr. Innov. 2020, 21, 576–591. [Google Scholar] [CrossRef]
  2. Oo, B.L.; Tsang, O.S. Information feedback in construction contract bidding: Perceptions of Hong Kong contractors. Int. J. Constr. Manag. 2021, 1–9. [Google Scholar] [CrossRef]
  3. Lin, C.T.; Chen, Y.T. Bid/no-bid decision-making–a fuzzy linguistic approach. Int. J. Proj. Manag. 2004, 22, 585–593. [Google Scholar] [CrossRef]
  4. Skitmore, M.; Lo, H.P. A method for identifying high outliers in construction contract auctions. Eng. Constr. Archit. Manag. 2002, 9, 90–130. [Google Scholar] [CrossRef]
  5. Runeson, G.; Skitmore, M. Tendering theory revisited. Constr. Manag. Econ. 1999, 17, 285–296. [Google Scholar] [CrossRef] [Green Version]
  6. Wanous, M.; Boussabaine, H.A.; Lewis, J. A neural network bid/no bid model: The case for contractors in Syria. Constr. Manag. Econ. 2003, 21, 737–744. [Google Scholar] [CrossRef]
  7. Lowe, D.J.; Parvar, J. A logistic regression approach to modelling the contractor’s decision to bid. Constr. Manag. Econ. 2004, 22, 643–653. [Google Scholar] [CrossRef]
  8. Kalan, D.; Ozbek, M.E. Development of a construction project bidding decision-making tool. Pract. Period. Struct. Des. Constr. 2020, 25, 04019032. [Google Scholar] [CrossRef]
  9. Adnan, H.; Rami, M.I.; Yusuwan, N.M.; Rosman, M.R. A survey on factors affecting the contractor’s mark-up size decision. WSEAS Trans. Bus. Econ. 2018, 15, 18–26. [Google Scholar]
  10. Urquhart, S.; Whyte, A. Contractor tendering research: Going beyond bid/no-bid and markup models. Proc. Inst. Civ. Eng. Manag. Procure. Law 2018, 170, 255–262. [Google Scholar] [CrossRef] [Green Version]
  11. Glass, G.V. Primary, secondary, and meta-analysis of research. Educ. Res. 1976, 5, 3–8. [Google Scholar] [CrossRef]
  12. Hedges, L.V. Meta-analysis. J. Educ. Stat. 1992, 17, 279–296. [Google Scholar] [CrossRef]
  13. Borenstein, M.; Hedges, L.V.; Higgins, J.P.; Rothstein, H.R. A basic introduction to fixed-effect and random-effects models for meta-analysis. Res. Synth. Methods 2010, 1, 97–111. [Google Scholar] [CrossRef] [PubMed]
  14. Ling, Y.Y.F. Global factors affecting margin-size of construction projects. J. Constr. Res. 2005, 6, 91–106. [Google Scholar] [CrossRef]
  15. Oo, B.L.; Drew, D.S.; Lo, H.P. A comparison of contractors’ decision to bid behaviour according to different market environments. Int. J. Proj. Manag. 2008, 26, 439–447. [Google Scholar] [CrossRef]
  16. Oo, B.L.; Lim, B.T.H.; Runeson, G. Mark-up of construction projects: What have we learned in the last 20 years. 2022; under review. [Google Scholar]
  17. Wang, J.; Wang, L.; Ye, K.; Shan, Y. Will bid/No-bid decision factors for construction projects be different in economic downturns? A Chinese study. Appl. Sci. 2020, 10, 1899. [Google Scholar] [CrossRef] [Green Version]
  18. Skitmore, M. Contract Bidding in Construction: Strategic Management and Modelling; Longman Scientific & Technical: London UK, 1989. [Google Scholar]
  19. Molnár, M.; Bottini, N. How large are competitive pressures in services markets? Estimation of mark-ups for selected OECD countries. OECD J. Econ. Stud. 2011, 2010, 1–51. [Google Scholar]
  20. Assaad, R.; El-Adaway, I.H. Enhancing the knowledge of construction business failure: A social network analysis approach. J. Constr. Eng. Manag. 2020, 146, 04020052. [Google Scholar] [CrossRef]
  21. Lim, B.T.H.; Oo, B.L.; Ling, F. The survival strategies of Singapore contractors in prolonged recession. Eng. Constr. Archit. Manag. 2010, 17, 387–403. [Google Scholar]
  22. Zuo, J.; Zillante, G.; Xia, B.; Chan, A.; Zhao, Z. How Australian construction contractors responded to the economic downturn. Int. J. Strateg. Prop. Manag. 2015, 19, 245–259. [Google Scholar] [CrossRef] [Green Version]
  23. Oo, B.L.; Drew, D.S.; Lo, H.P. Heterogeneous approach to modeling contractors’ decision-to-bid strategies. J. Constr. Eng. Manag. 2008, 134, 766–775. [Google Scholar] [CrossRef]
  24. Thorpe, T.; McCaffer, R. Competitive bidding and tendering policies. In Competitive Advantage in Construction; Male, S., Stocks, R., Eds.; Butterworth-Heinemann: Oxford, UK, 1991; pp. 163–194. [Google Scholar]
  25. Male, S. Strategic management in construction: Conceptual foundations. In Competitive Advantage in Construction; Male, S., Stocks, R., Eds.; Butterworth-Heinemann: Oxford, UK, 1991; pp. 1–4. [Google Scholar]
  26. Male, S. Strategic management and competitive advantage in construction. In Competitive Advantage in Construction; Male, S., Stocks, R., Eds.; Butterworth-Heinemann: Oxford, UK, 1991; pp. 5–44. [Google Scholar]
  27. Hillebrandt, P.M. Economic Theory and the Construction Industry, 3rd ed.; Macmillan Press: London, UK, 2000. [Google Scholar]
  28. Oo, B.L.; Drew, D.S.; Lo, H.P. Applying a random coefficients logistic model to contractors’ decision to bid. Constr. Manag. Econ. 2007, 25, 387–398. [Google Scholar] [CrossRef]
  29. Ahmad, I.; Minkarah, I. Questionnaire survey on bidding in construction. J. Manag. Eng. 1988, 4, 229–243. [Google Scholar] [CrossRef]
  30. Enshassi, A.; Kumaraswamy, M.; Nairab, S. Analysis of contractors’ bidding decision in the Palestinian construction industry. Rev. Ing. Construcción 2010, 25, 161–214. [Google Scholar]
  31. Shadish, W.R.; Lecy, J.D. The meta-analytic big bang. Res. Synth. Methods 2015, 6, 246–264. [Google Scholar] [CrossRef]
  32. Kenley, R. The Role of Meta-Analysis in Construction Management Research. In Proceedings of the 14th Annual ARCOM conference, Reading, UK, 9–11 September 1998; University of Reading: Reading, UK, 1998; Volume 1, pp. 31–38. [Google Scholar]
  33. Horman, M.J.; Kenley, R. Quantifying levels of wasted time in construction with meta-analysis. J. Constr. Eng. Manag. 2005, 131, 52–61. [Google Scholar] [CrossRef]
  34. Hussein, M.; Zayed, T. Critical factors for successful implementation of just-in-time concept in modular integrated construction: A systematic review and meta-analysis. J. Clean. Prod. 2021, 284, 124716. [Google Scholar] [CrossRef]
  35. Alruqi, W.M.; Hallowell, M.R. Critical success factors for construction safety: Review and meta-analysis of safety leading indicators. J. Constr. Eng. Manag. 2019, 145, 04019005. [Google Scholar] [CrossRef]
  36. Sanni-Anibire, M.O.; Mohamad Zin, R.; Olatunji, S.O. Causes of delay in the global construction industry: A meta-analytical review. Int. J. Constr. Manag. 2020, 1–13. [Google Scholar] [CrossRef]
  37. Adebowale, O.J.; Agumba, J.N. A meta-analysis of factors affecting labour productivity of construction SMEs in developing countries. J. Eng. Des. Technol. 2021. [CrossRef]
  38. Glass, G.V.; McGaw, B.; Smith, M.L. Meta-Analysis in Social Research; Sage Publications, Inc.: Beverly Hills, CA, USA, 1981. [Google Scholar]
  39. Higgins, J.P.T.; Thomas, J.; Chandler, J.; Cumpston, M.; Li, T.; Page, M.J.; Welch, V.A. Cochrane Handbook for Systematic Reviews of Interventions Version 6.2 (Updated February 2021); 2021. Available online: www.training.cochrane.org/handbook (accessed on 15 November 2021).
  40. Moher, D.; Liberati, A.; Tetzlaff, J.; Altman, D.G.; Prisma Group. Preferred reporting items for systematic reviews and meta-analyses: The PRISMA statement. PLoS Med. 2009, 6, e1000097. [Google Scholar] [CrossRef] [PubMed] [Green Version]
  41. Tawfik, G.M.; Dila, K.A.S.; Mohamed, M.Y.F.; Tam, D.N.H.; Kien, N.D.; Ahmed, A.M.; Huy, N.T. A step-by-step guide for conducting a systematic review and meta-analysis with simulation data. Trop. Med. Health 2019, 47, 1–9. [Google Scholar] [CrossRef] [PubMed]
  42. Boutron, I.; Page, M.J.; Higgins, J.P.T.; Altman, D.G.; Lundh, A.; Hróbjartsson, A. Considering bias and conflicts of interest among the included studies. In Cochrane Handbook for Systematic Reviews of Interventions Version 6.2 (Updated February 2021); Higgins, J.P.T., Thomas, J., Chandler, J., Cumpston, M., Li, T., Page, M.J., Welch, V.A., Eds.; 2021; Available online: www.training.cochrane.org/handbook (accessed on 20 November 2021).
  43. Li, T.; Higgins, J.P.T.; Deeks, J.J. Collecting data. In Cochrane Handbook for Systematic Reviews of Interventions Version 6.2 (Updated February 2021); Higgins, J.P.T., Thomas, J., Chandler, J., Cumpston, M., Li, T., Page, M.J., Welch, V.A., Eds.; 2021; Available online: www.training.cochrane.org/handbook (accessed on 15 November 2021).
  44. Borenstein, M.; Hedges, L.; Rothstein, H. Meta-Analysis: Fixed Effect vs. Random Effects. 2007. Available online: https://www.meta-analysis.com/downloads/Meta-analysis%20fixed%20effect%20vs%20random%20effects%20072607.pdf (accessed on 15 November 2021).
  45. Deeks, J.J.; Higgins, J.P.T.; Altman, D.G. Analysing data and undertaking meta-analyses. In Cochrane Handbook for Systematic Reviews of Interventions Version 6.2; Higgins, J.P.T., Thomas, J., Chandler, J., Cumpston, M., Li, T., Page, M.J., Welch, V.A., Eds.; 2021; Available online: www.training.cochrane.org/handbook (accessed on 15 November 2021).
  46. Neyeloff, J.L.; Fuchs, S.C.; Moreira, L.B. Meta-analyses and Forest plots using a microsoft excel spreadsheet: Step-by-step guide focusing on descriptive data analysis. BMC Res. Notes 2012, 5, 1–6. [Google Scholar] [CrossRef] [PubMed] [Green Version]
  47. Higgins, J.P.; Thompson, S.G.; Deeks, J.J.; Altman, D.G. Measuring inconsistency in meta-analyses. BMJ 2003, 327, 557–560. [Google Scholar] [CrossRef] [Green Version]
  48. Fayek, A.; Ghoshal, I.; AbouRizk, S. A survey of the bidding practices of Canadian civil engineering construction contractors. Can. J. Civ. Eng. 1999, 26, 13–25. [Google Scholar] [CrossRef]
  49. The World Bank. The World by Income and Region; The World Bank, 2021; Available online: https://datatopics.worldbank.org/world-development-indicators/the-world-by-income-and-region.html (accessed on 20 November 2021).
  50. Shash, A.A. Factors considered in tendering decisions by top UK contractors. Constr. Manag. Econ. 1993, 11, 111–118. [Google Scholar] [CrossRef]
  51. Wanous, M.; Boussabaine, A.H.; Lewis, J. Tendering factors considered by Syrian contractors. In Proceedings of the 14th Annual ARCOM Conference, Reading, UK, 9–11 September 1998; Hughes, W., Ed.; University of Reading, Association of Researchers in Construction Management: Reading, UK, 1998; Volume 2, pp. 535–543. [Google Scholar]
  52. Egemen, M.; Mohamed, A.N. A framework for contractors to reach strategically correct bid/no bid and mark-up size decisions. Build. Environ. 2007, 42, 1373–1385. [Google Scholar] [CrossRef]
  53. Bageis, A.S.; Fortune, C. Factors affecting the bid/no bid decision in the Saudi Arabian construction contractors. Constr. Manag. Econ. 2009, 27, 53–71. [Google Scholar] [CrossRef]
  54. Enshassi, A.; Mohamed, S. Factors affecting the bid/no bid decision in the Palestinian construction industry. J. Financ. Manag. Prop. Constr. 2010, 15, 118–142. [Google Scholar] [CrossRef]
  55. Asuquo, C.F.; Nwahizu, C. Factors affecting building contractors’ decision to tender. J. Environ. Des. 2012, 7, 148–154. [Google Scholar]
  56. El-Mashaleh, M.S. Empirical framework for making the bid/no-bid decision. J. Manag. Eng. 2013, 29, 200–205. [Google Scholar] [CrossRef]
  57. Jarkas, A.M.; Mubarak, S.A.; Kadri, C.Y. Critical factors determining bid/no bid decisions of contractors in Qatar. J. Manag. Eng. 2014, 30, 05014007. [Google Scholar] [CrossRef]
  58. Leśniak, A.; Plebankiewicz, E. Modeling the decision-making process concerning participation in construction bidding. J. Manag. Eng. 2015, 31, 04014032. [Google Scholar] [CrossRef]
  59. Oyeyipo, O.; Odusami, K.T.; Ojelabi, R.A.; Afolabi, A.O. Factors affecting contractors’ bidding decisions for construction projects in Nigeria. J. Constr. Dev. Ctries. 2016, 21, 21–35. [Google Scholar] [CrossRef]
  60. Shokri-Ghasabeh, M.; Chileshe, N. Critical factors influencing the bid/no bid decision in the Australian construction industry. Constr. Innov. 2016, 16, 127–157. [Google Scholar] [CrossRef]
  61. Olatunji, O.A.; Aje, O.I.; Makanjuola, S. Bid or no-bid decision factors of indigenous contractors in Nigeria. Eng. Constr. Archit. Manag. 2017, 24, 378–392. [Google Scholar] [CrossRef]
  62. Marzouk, M.; Mohamed, E. Modeling bid/no bid decisions using fuzzy fault tree. Constr. Innov. 2018, 18, 90–108. [Google Scholar] [CrossRef]
  63. Zhang, Y. Factors Affecting Contractors’ Bid or No-Bid and Mark-Up Decisions in Jilin Province, China. Honours Thesis, Faculty of Built Environment, University of New South Wales, Sydney, NSW, Australia, 2018, unpublished. [Google Scholar]
  64. Maqsoom, A.; Farjad, M.M.; Abbas, M.S.; Ehtesham-Ul-Haque, M.; Irfan, M.; Malik, A.U. Strategic factors influencing bid/no-bid decision of Pakistani contractors. In Proceedings of the 21st International Symposium on Advancement of Construction Management and Real Estate; Springer: Singapore, 2018; pp. 1345–1353. [Google Scholar]
  65. Alsaedi, M.; Assaf, S.; Hassanain, M.A.; Abdallah, A. Factors affecting contractors’ bidding decisions for construction projects in Saudi Arabia. Buildings 2019, 9, 33. [Google Scholar] [CrossRef] [Green Version]
  66. Bageis, A.; Falqi, I.I.; Alshehri, A.; Alsulamy, S.; Alsahli, T.A. Behavioral differences towards internal and external factors in making the bid/no-bid decision. Civ. Eng. J. 2019, 5, 1189–1196. [Google Scholar] [CrossRef] [Green Version]
  67. Maqsoom, A.; Shaheen, I.; Asshraf, H.; Zahoor, H.; Khan, S.Y. Intrinsic Factors influencing the bid/no-bid decision of Pakistani contractors. In Proceedings of the ICCREM 2020: Intelligent Construction and Sustainable Buildings, Stockholm, Sweden, 24–25 August 2020; pp. 602–610. [Google Scholar]
  68. Oke, A.; Omoraka, A.; Olatunbode, A. Appraisal of factors affecting bidding decisions in Nigeria. Int. J. Constr. Manag. 2020, 20, 169–175. [Google Scholar] [CrossRef]
  69. Chileshe, N.; Kavishe, N.; Edwards, D.J. Critical factors influencing the bid or no-bid decision of the indigenous small building contractors in Tanzania. Constr. Innov. 2020, 21, 182–202. [Google Scholar] [CrossRef]
  70. Gunduz, M.; Al-Ajji, I. Employment of CHAID and CRT decision tree algorithms to develop bid/no-bid decision-making models for contractors. Eng. Constr. Archit. Manag. 2021. [CrossRef]
  71. Holt, G.D. Construction business failure: Conceptual synthesis of causal agents. Constr. Innov. 2013, 13, 50–76. [Google Scholar] [CrossRef]
  72. Alaka, H.A.; Oyedele, L.O.; Owolabi, H.A.; Oyedele, A.A.; Akinade, O.O.; Bilal, M.; Ajayi, S.O. Critical factors for insolvency prediction: Towards a theoretical model for the construction industry. Int. J. Constr. Manag. 2017, 17, 25–49. [Google Scholar] [CrossRef]
  73. Mahamid, I. Factors affecting contractor’s business failure: Contractors’ perspective. Eng. Constr. Archit. Manag. 2012, 19, 269–285. [Google Scholar] [CrossRef]
  74. De Neufville, R.; Lesage, Y.; Hani, E.N. Bidding models: Effects of bidders’ risk aversion. J. Constr. Div. 1977, 103, 57–70. [Google Scholar] [CrossRef]
  75. Oo, B.L.; Drew, D.S.; Runeson, G. Competitor analysis in construction bidding. Constr. Manag. Econ. 2010, 28, 1321–1329. [Google Scholar] [CrossRef]
  76. Drew, D.S.; Skitmore, M.; Lo, H.P. The effect of client and type and size of construction work on a contractor’s bidding strategy. Build. Environ. 2001, 36, 393–406. [Google Scholar] [CrossRef] [Green Version]
Figure 1. PRISMA flow diagram for screening and selecting relevant studies.
Buildings 12 00379 g001
Figure 2. The data extraction process for selecting factors to be included in the meta-analysis.
Buildings 12 00379 g002
Figure 3. Effect size (weighted RII) and 95% confidence intervals of individual factors.
Buildings 12 00379 g003
Figure 4. Forest plots of the five top factors affecting contractors’ d2b.
Buildings 12 00379 g004
Table 1. Steps in the meta-analysis.
Step Abbrev.Equation
1Calculate the effect size of individual factors (i.e., the RII).es
2Calculate the standard error. SE S E = e s e s × n
n = sample size
3Compute the within-study variance.Var V a r = S E 2
4Calculate the individual study weight.w w = 1 S E 2
5Compute the total variance, Q (within-studies variance plus the between-studies variance). The Q statistic is a measure of heterogeneity across selected studies. It is distributed as a chi-square statistic with k (number of studies)-1 degree of freedom.Q Q = ( w × e s 2 ) [ ( w × e s ) ] 2 w
6Compute I2, an alternative measure to quantify heterogeneity in percentage, providing a measure of the degree of inconsistency in the studies’ results [47]. Negative values of I2 are put equal to zero so that I2 lies between 0% and 100%. A value of 0% indicates no observed heterogeneity, and larger values show increasing heterogeneity.I2 I 2 = Q d f Q × 100
7Compute the between-studies variance.v v = Q d f w ( w 2 w )     i f   Q > d f
v = 0 ,   i f   Q d f
df = degrees of freedom, k (number of studies)1
8Calculate the new weight of individual study under the random-effects model specification.wv w v = 1 S E 2 + v
9Calculate the effect summary (i.e., weighted RII) using the new weight from step 8. e s ¯ v e s ¯ v = ( w v × e s ) w v
10Compute the standard error of effect summary and the 95% confidence intervals. S E e s ¯ v S E e s ¯ v = 1 w v
L o w e r   l i m i t = e s ¯ v 1.96 × S E e s ¯ v
U p p e r   l i m i t = e s ¯ v + 1.96 × S E e s ¯ v
11 Compute   the   Z - score   for   testing   the   null   hypothesis   on   the   effect   summary ,   e s ¯ v = 0. Z e s ¯ v Z e s ¯ v = e s ¯ v S E e s ¯ v
12Repeat steps 5 and 6 using the new weight from step 8 for testing the null hypothesis on the heterogeneity, Qv = 0.Qv and I2
Source: [16].
Table 3. Rankings of factors based on frequency and effect summary (weighted RII).
FactorsFrequency
(Total = 440)
RankEffect Summary
(Weighted RII)
Rank
1 Project characteristics
F1.1 Project size 2410.7715
F1.2 Project location 2410.65218
F1.3 Project duration 2220.63123
F1.4 Type of project 2030.7399
F1.5 Degree of hazard (safety) 1750.59127
F1.6 Degree of difficulty (project complexity)1570.67813
F1.7 The amount of work to be subcontracted1480.55328
F1.8 Type of contractual arrangement 1390.63422
F1.9 Project payment terms12100.8331
F1.10 Quantum of liquidated damages 12100.61626
2 Firm-related factors
F2.1 Current workload2220.7428
F2.2 Experience on similar project2030.7706
F2.3 Past profit in similar jobs 1750.66515
F2.4 Need for work11110.7487
F2.5 Availability of qualified site management staff 11110.68811
3 Tendering situation
F3.1 Number of bidders2030.64120
F3.2 Time allowed for tender submission1570.62225
F3.3 Completeness of tender documents 1480.66116
F3.4 Bond requirements (tender, performance)12100.65517
F3.5 Competitiveness of other bidders11110.64419
4 Client-related factors
F4.1 Financial capability of client1660.8322
F4.2 Client’s reputation in the industry11110.8013
F4.3 The history of client’s payments in past projects11110.7904
5 Economic situation
F5.1 Availability of equipment 1940.62624
F5.2 Availability of labour 1750.63821
F5.3 Availability of other projects for tendering 1660.69510
F5.4 Availability of materials12100.67214
F5.5 Overall economy (availability of work) 12100.68012
Table 4. Statistical test results of the individual factors.
FactorsEffect Summary (Weighted RII)Z-TestHeterogeneity Test
Z-Scorep-ValueQvp-ValueI2v (%)
1 Project characteristics
F1.1 Project size 0.77125.354<0.000114.7620.9030
F1.2 Project location 0.65213.976<0.000114.6400.9070
F1.3 Project duration 0.63110.534<0.000110.3250.9740
F1.4 Type of project 0.73923.730<0.000118.5320.4870
F1.5 Degree of hazard (safety) 0.59112.583<0.000114.6400.5510
F1.6 Degree of difficulty (project complexity)0.67820.592<0.000112.1060.5980
F1.7 The amount of work to be subcontracted0.5536.348<0.00014.1710.9890
F1.8 Type of contractual arrangement 0.6348.744<0.00018.2780.7630
F1.9 Project payment terms0.83325.282<0.00016.6080.8300
F1.10 Quantum of liquidated damages 0.61622.820<0.000111.2450.4232.18
2 Firm-related factors
F2.1 Current workload0.74234.051<0.000116.9540.7140
F2.2 Experience on similar project0.77033.178<0.00018.8850.9750
F2.3 Past profit in similar jobs 0.66512.373<0.000112.3130.7220
F2.4 Need for work0.74825.934<0.00018.0330.6260
F2.5 Availability of qualified site management staff 0.68816.433<0.00017.4230.6850
3 Tendering situation
F3.1 Number of bidders0.64113.263<0.000111.6200.9010
F3.2 Time allowed for tender submission0.62217.799<0.000114.4930.4143.40
F3.3 Completeness of tender documents 0.66119.102<0.000113.8790.3826.34
F3.4 Bond requirements (tender, performance)0.65518.449<0.00019.3430.5900
F3.5 Competitiveness of other bidders0.6447.104<0.00014.1470.9400
4 Client-related factors
F4.1 Financial capability of client0.83221.081<0.00019.5990.8440
F4.2 Client’s reputation in the industry0.80126.337<0.00013.6730.9610
F4.3 The history of client’s payments in past projects0.79013.787<0.00015.9760.8170
5 Economic situation
F5.1 Availability of equipment 0.62615.506<0.000117.5360.4870
F5.2 Availability of labour 0.63815.086<0.000116.1030.4460.64
F5.3 Availability of other projects for tendering 0.69523.126<0.000113.6190.5550
F5.4 Availability of materials0.6729.992<0.00019.5150.5740
F5.5 Overall economy (availability of work) 0.68020.992<0.00017.2240.7810
Table 5. The top 10 factors affecting d2b and mark-up decisions.
RankCurrent Study—D2BOo et al. [16]—Mark-Up
1Project payment termsCompetitiveness of other bidders
2Financial capability of clientNumber of bidders
3Client’s reputation in the industryRelationship and past experience with client
4The history of client’s payments in past projectsExperience on similar project
5Project size Project size
6Experience on similar projectCurrent workload
7Need for workAvailability of other projects for tendering
8Current workloadQuantum of liquidated damages
9Type of project Type of contractual arrangement
10Availability of other projects for tendering Tendering procedure
Publisher’s Note: MDPI stays neutral with regard to jurisdictional claims in published maps and institutional affiliations.

