
Study on Stress Field Distribution during the Construction of a Group of Tunnels Using the Pile–Beam–Arch Method


Abstract
:1. Introduction
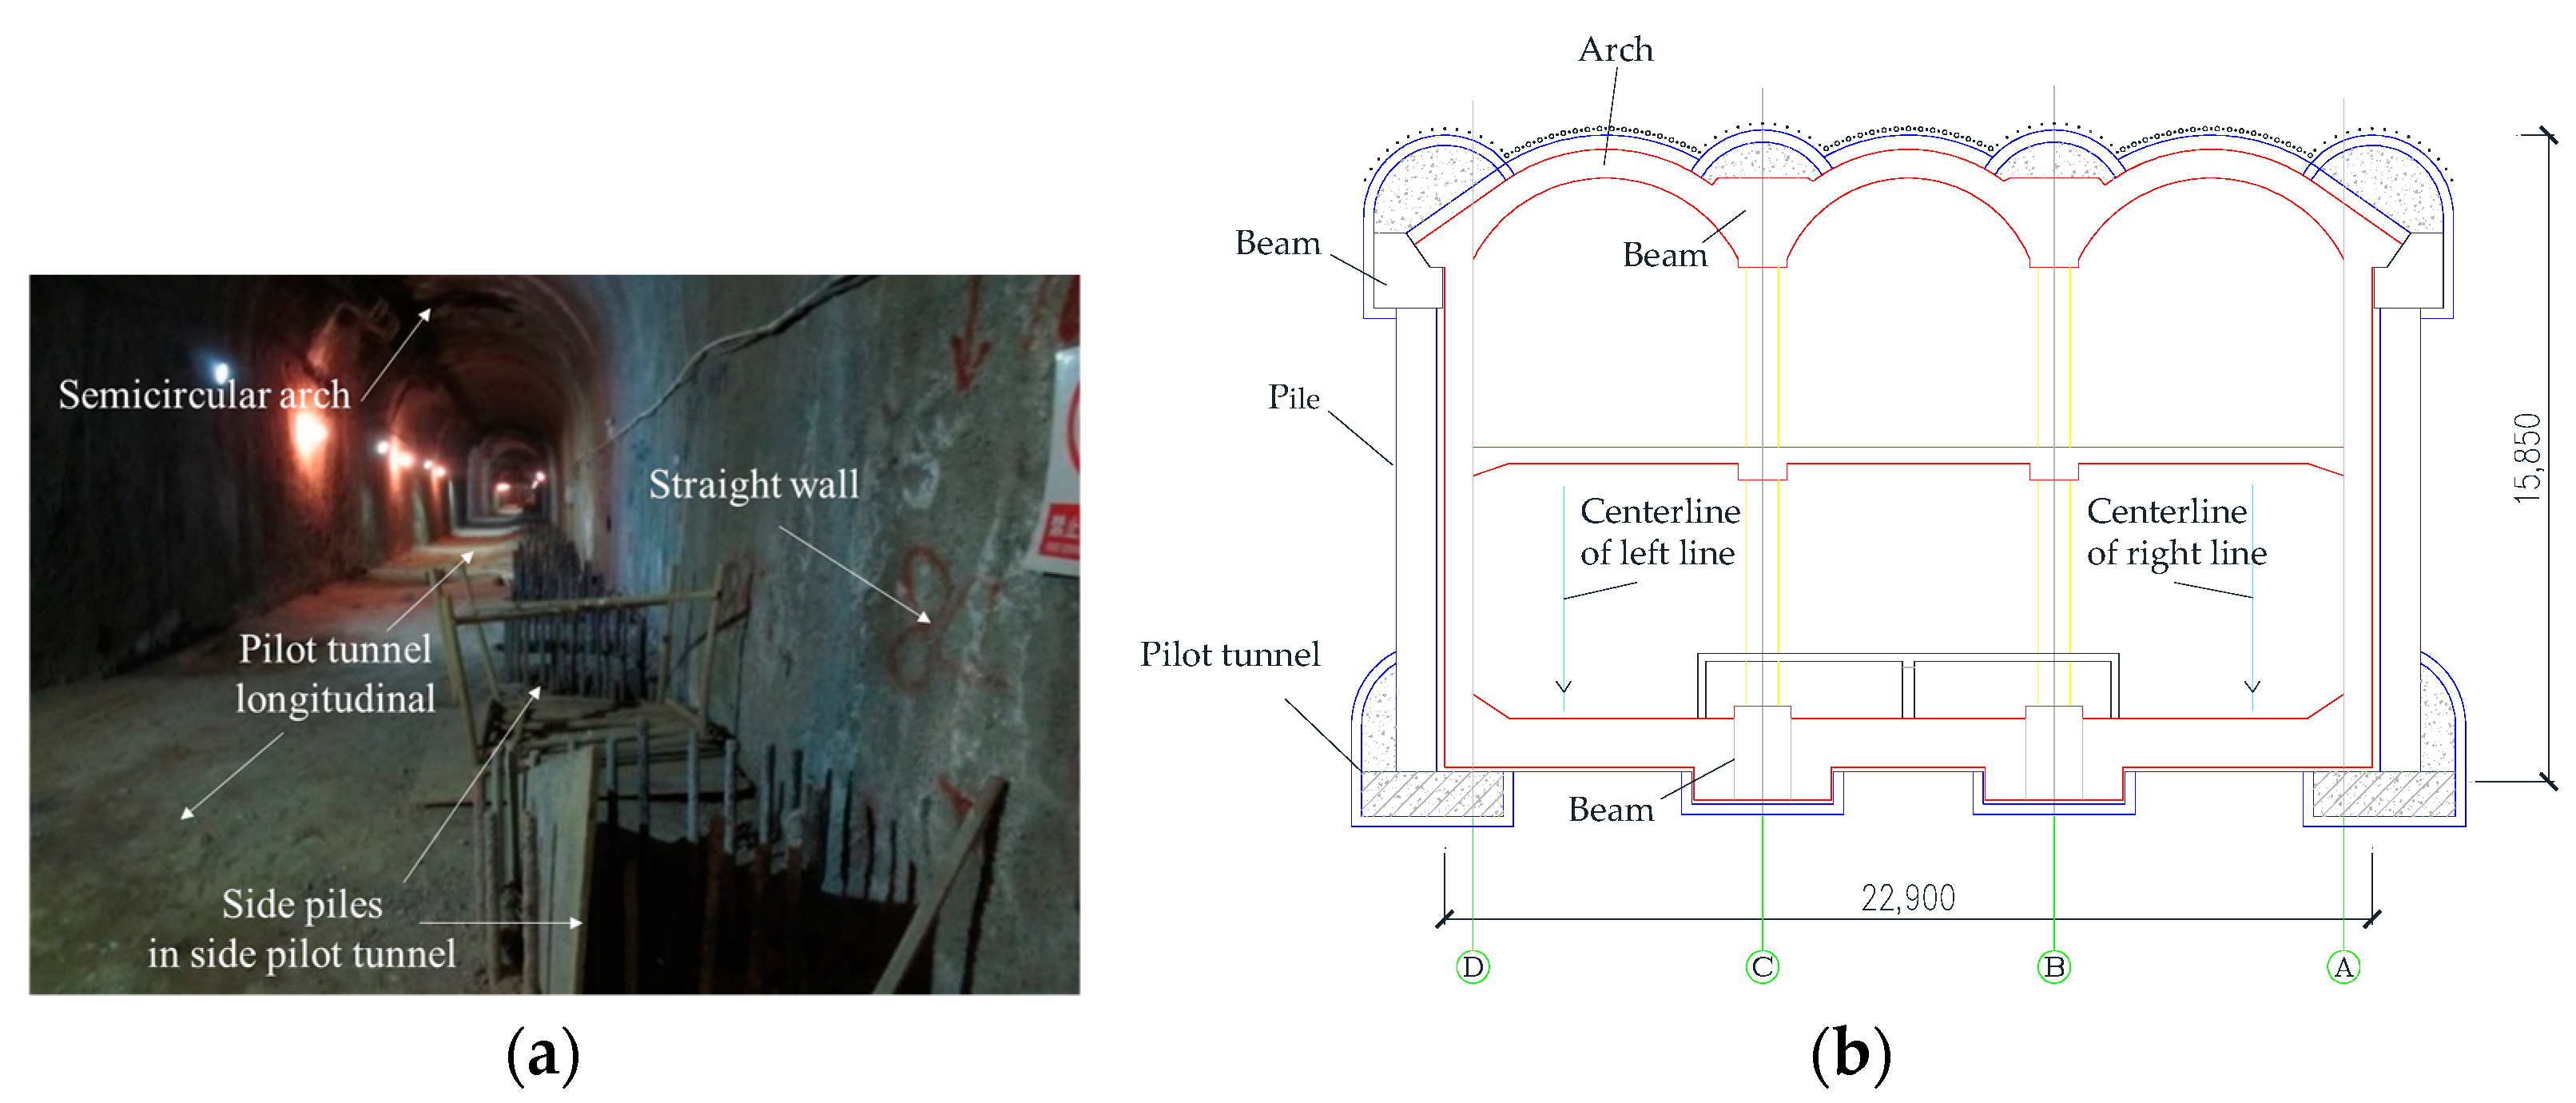
2. Case Study
3. Model
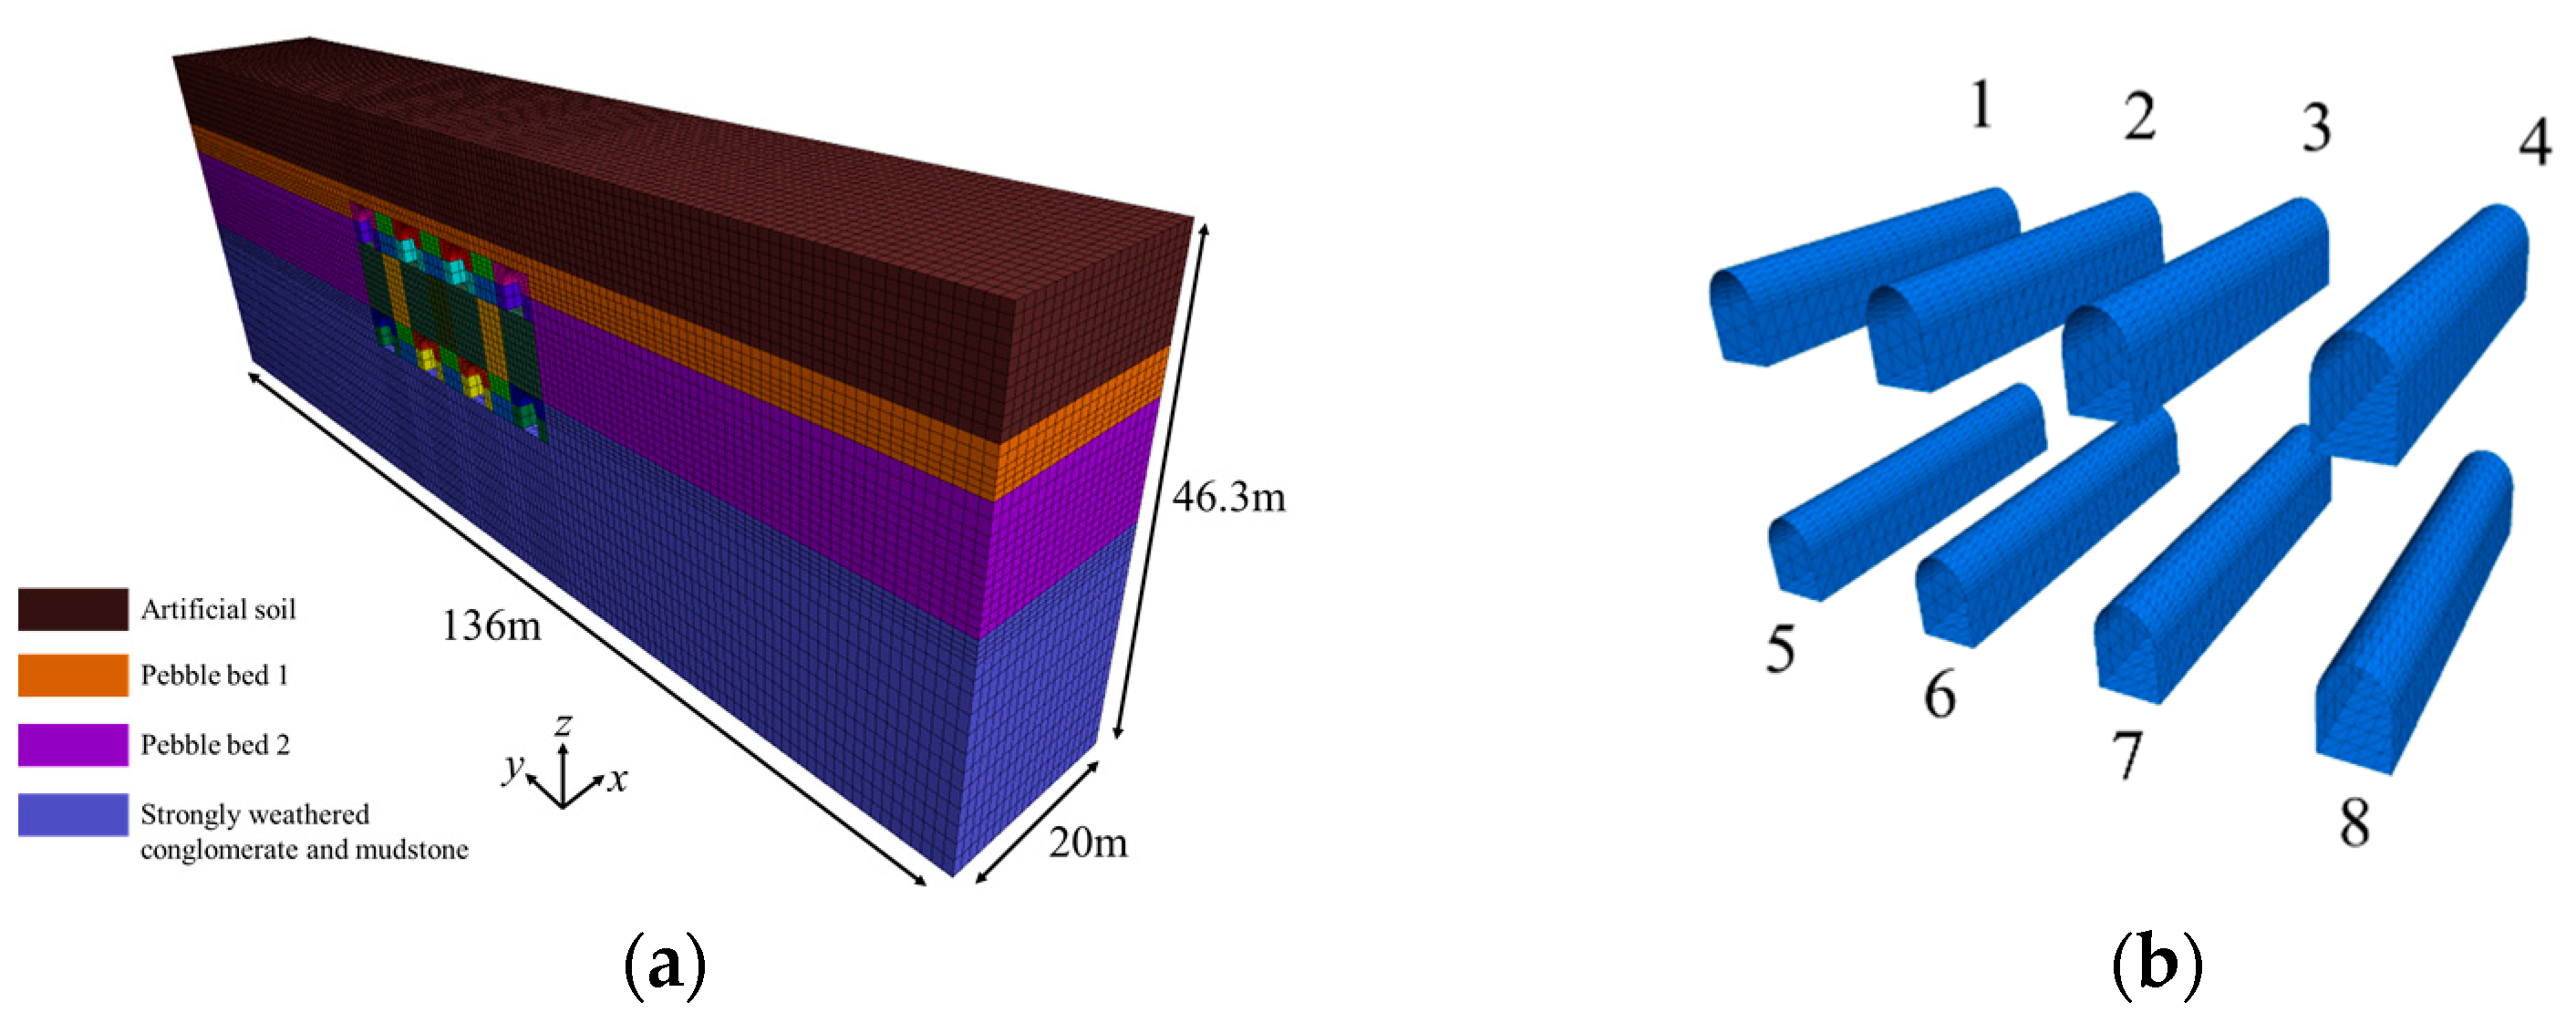
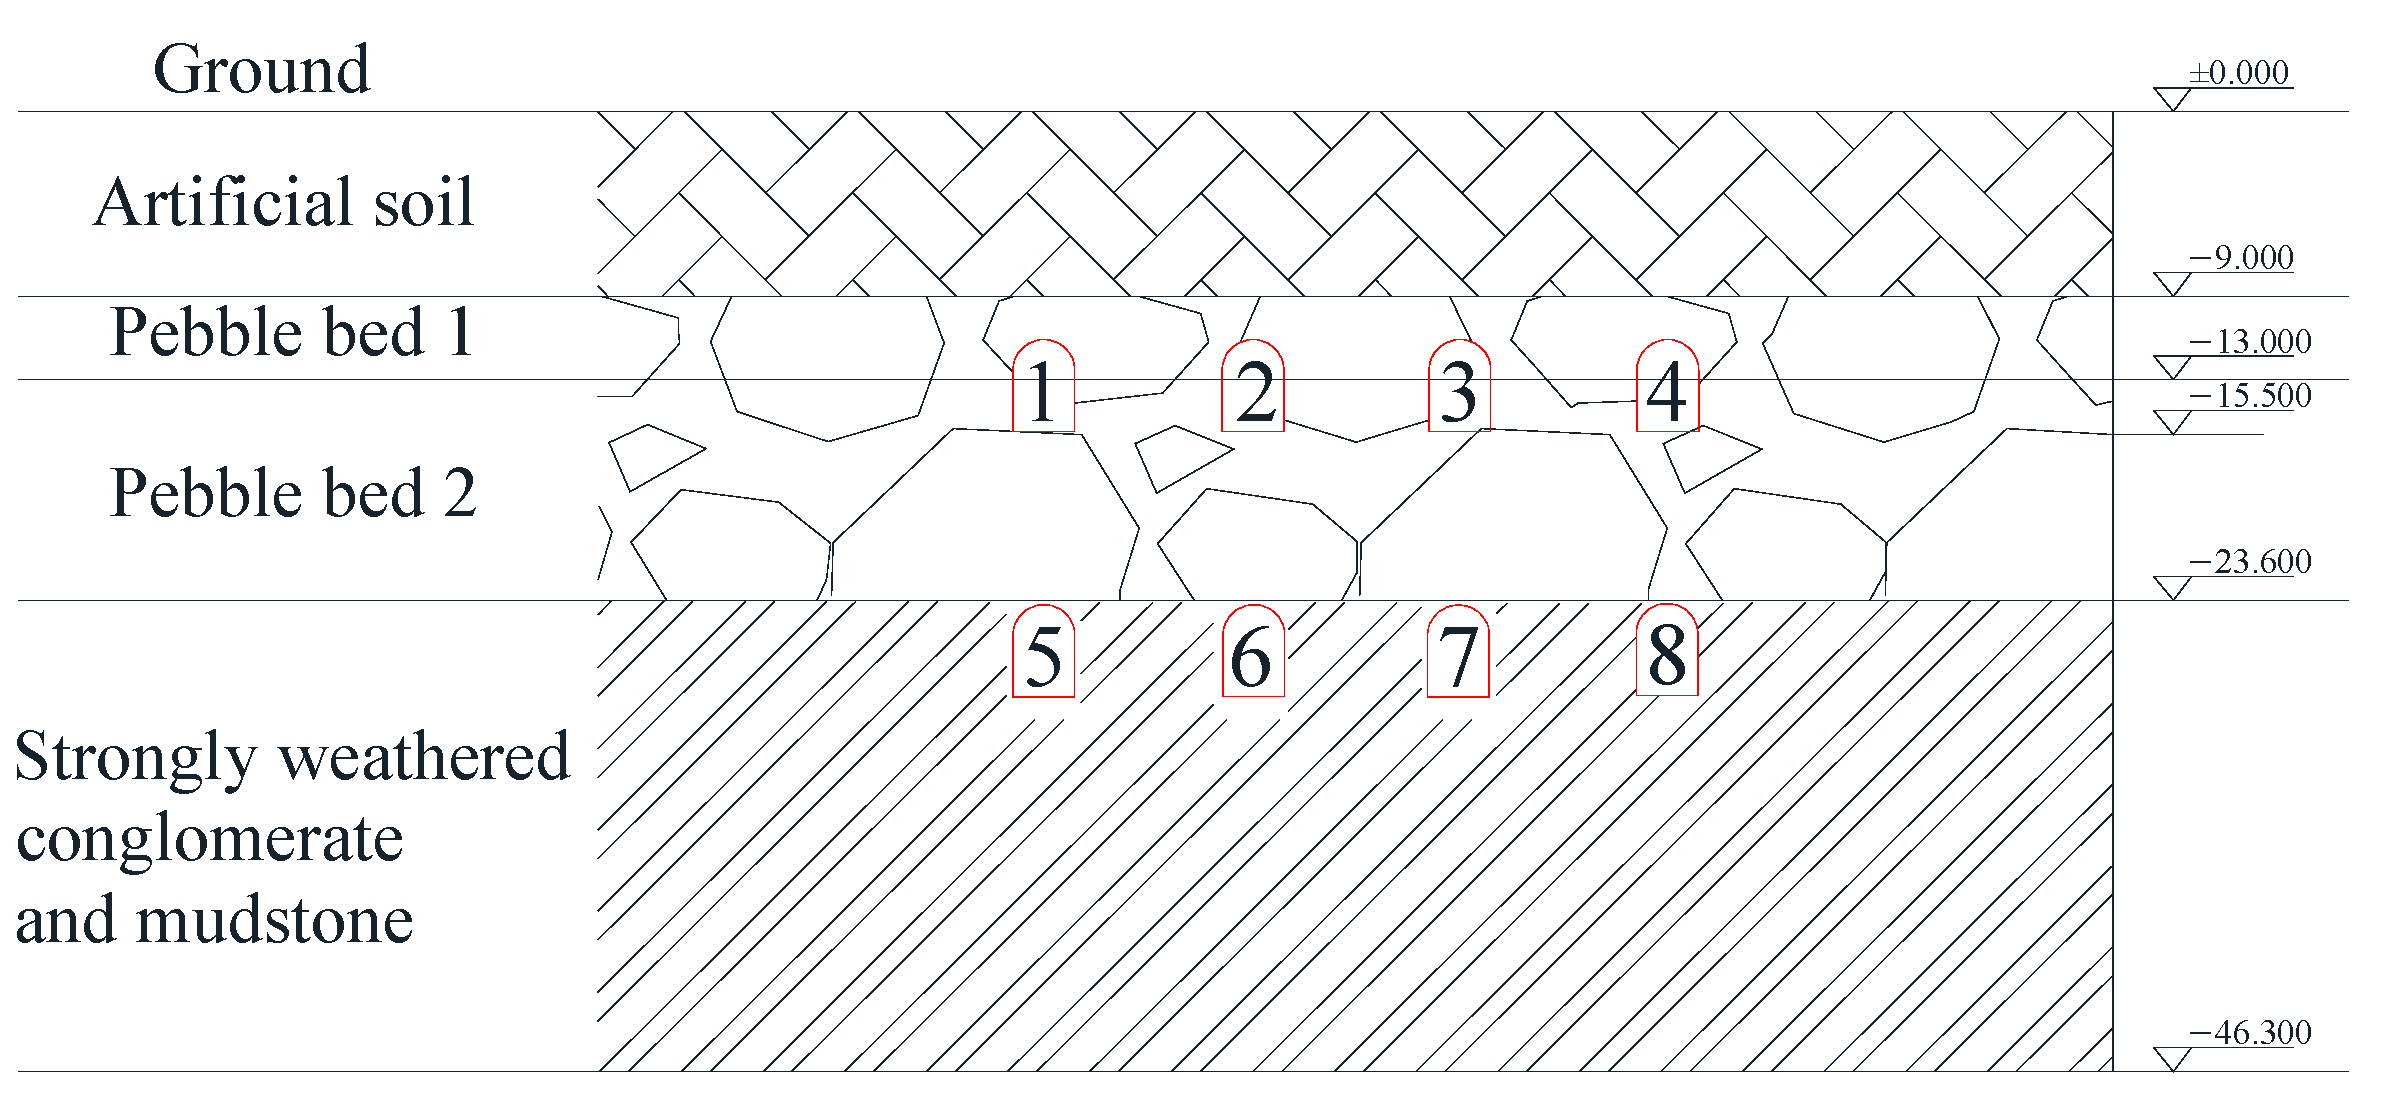
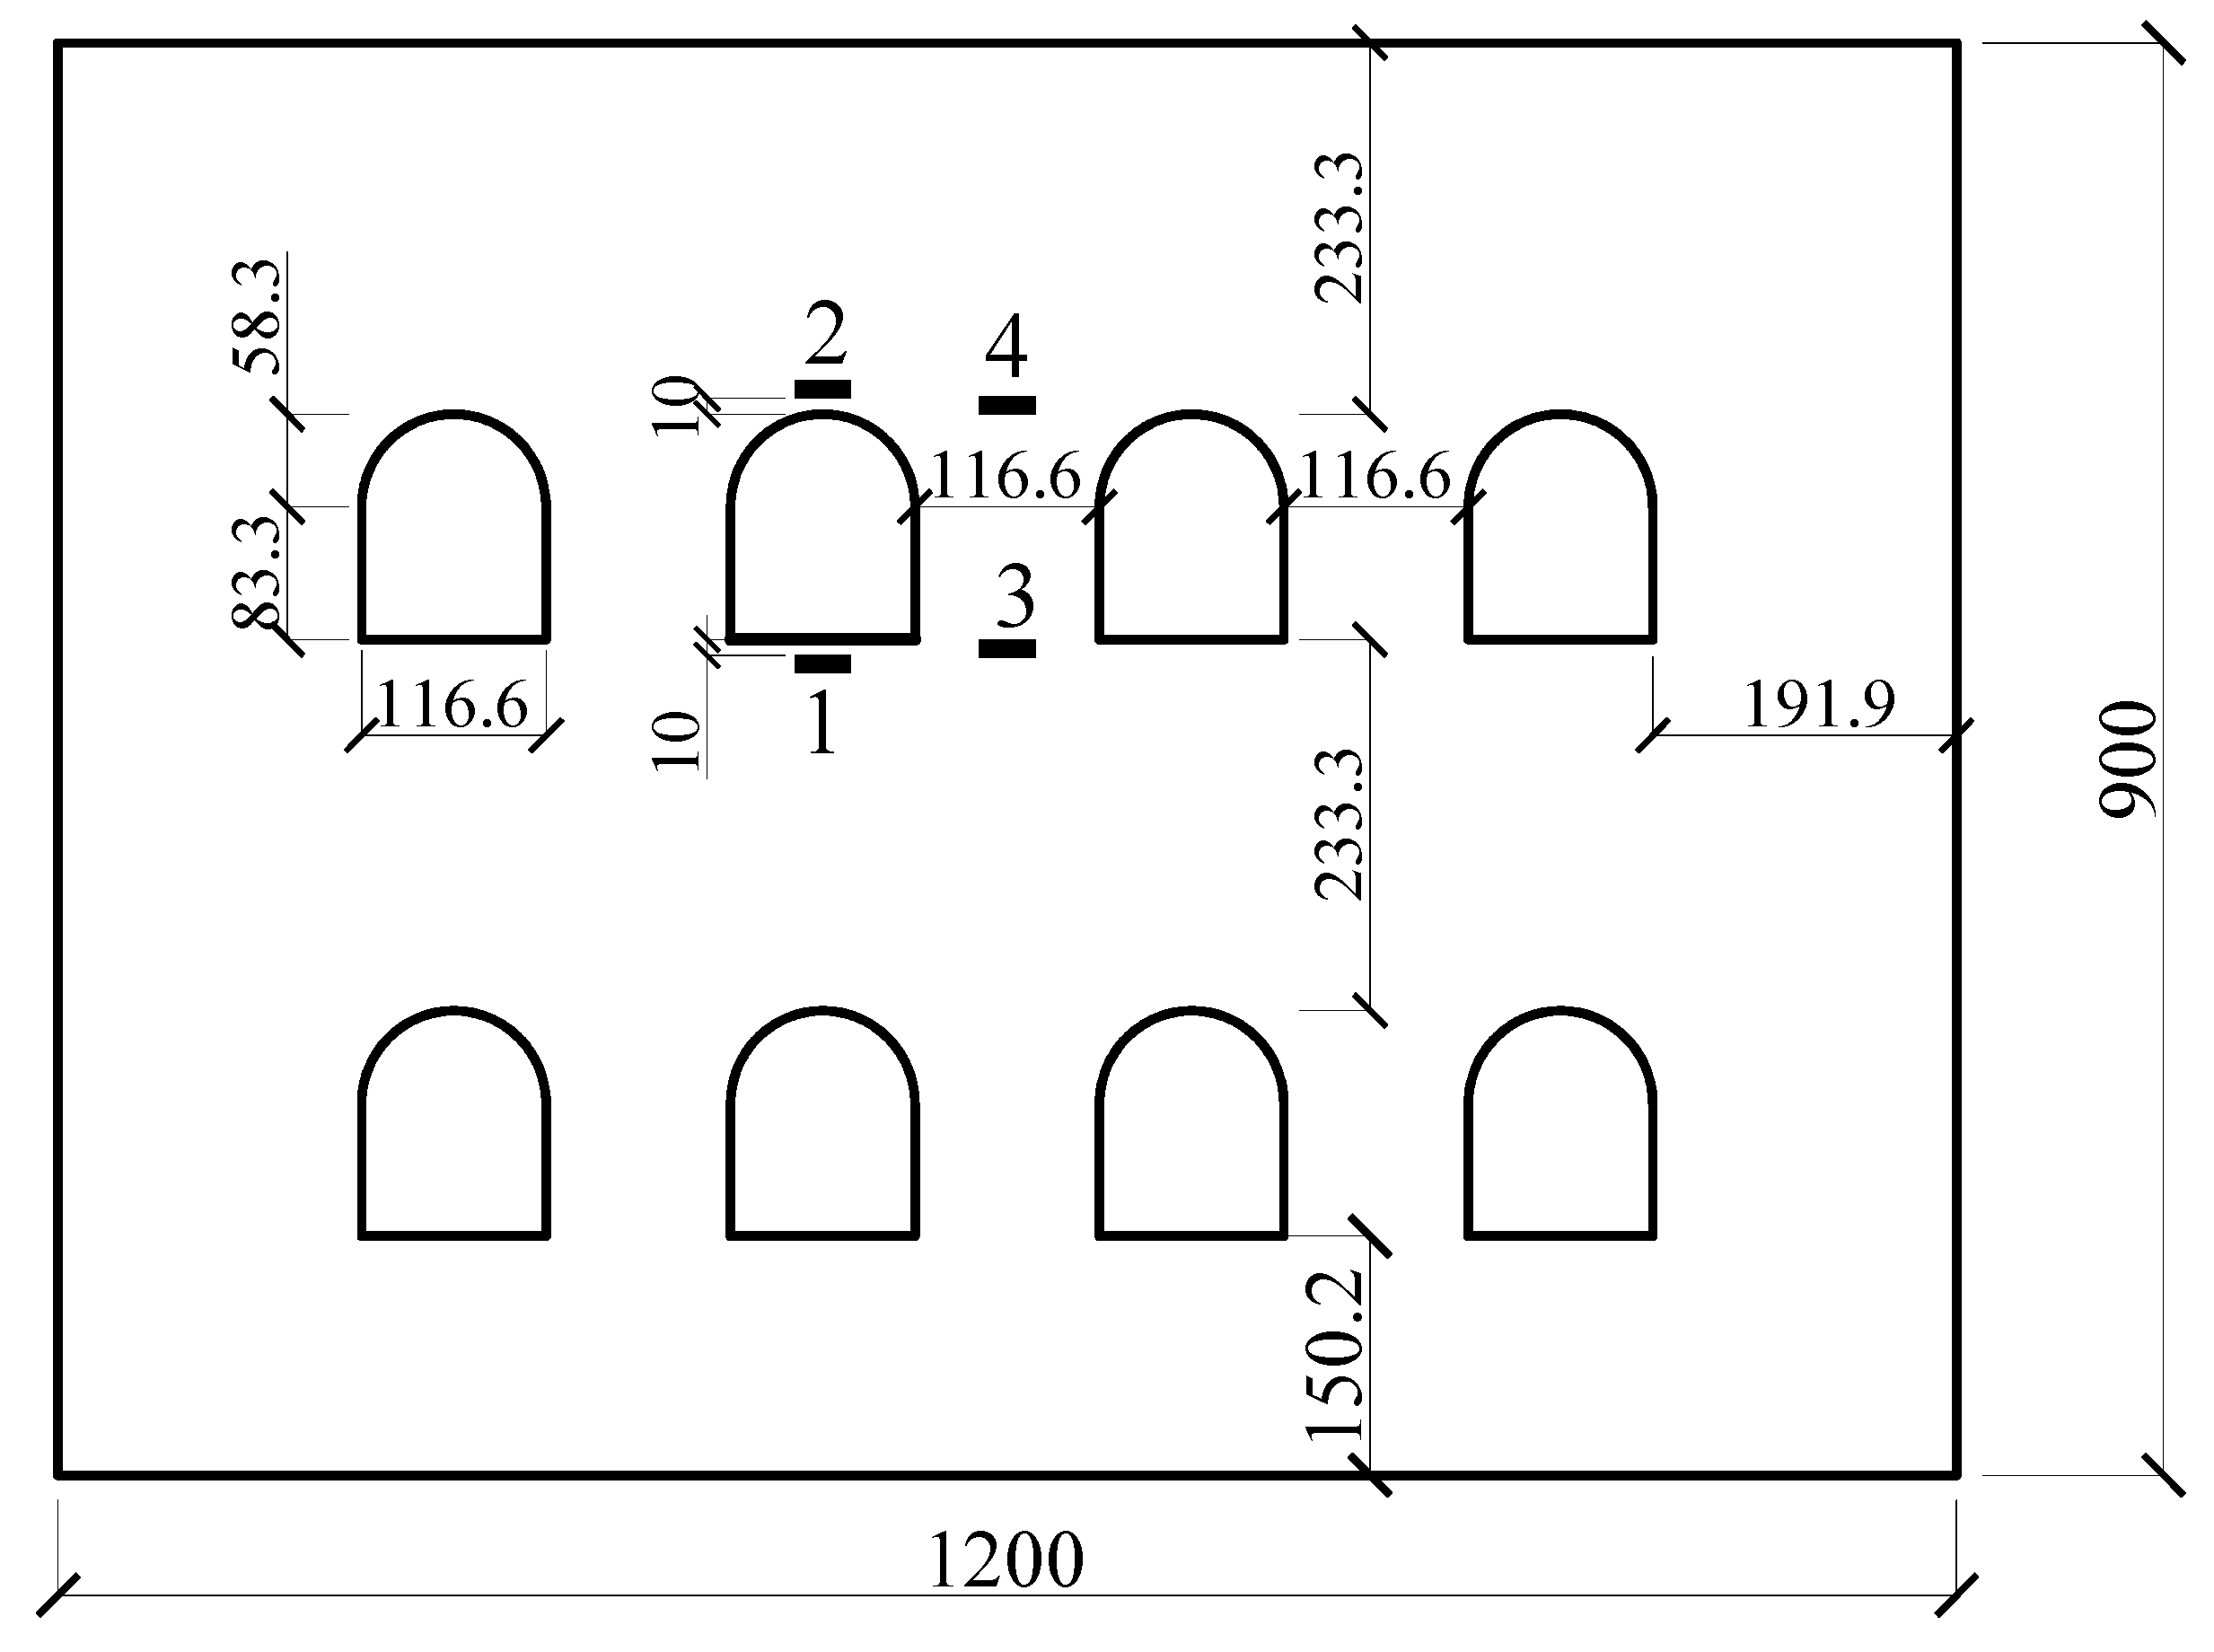
3.1. Numerical Model
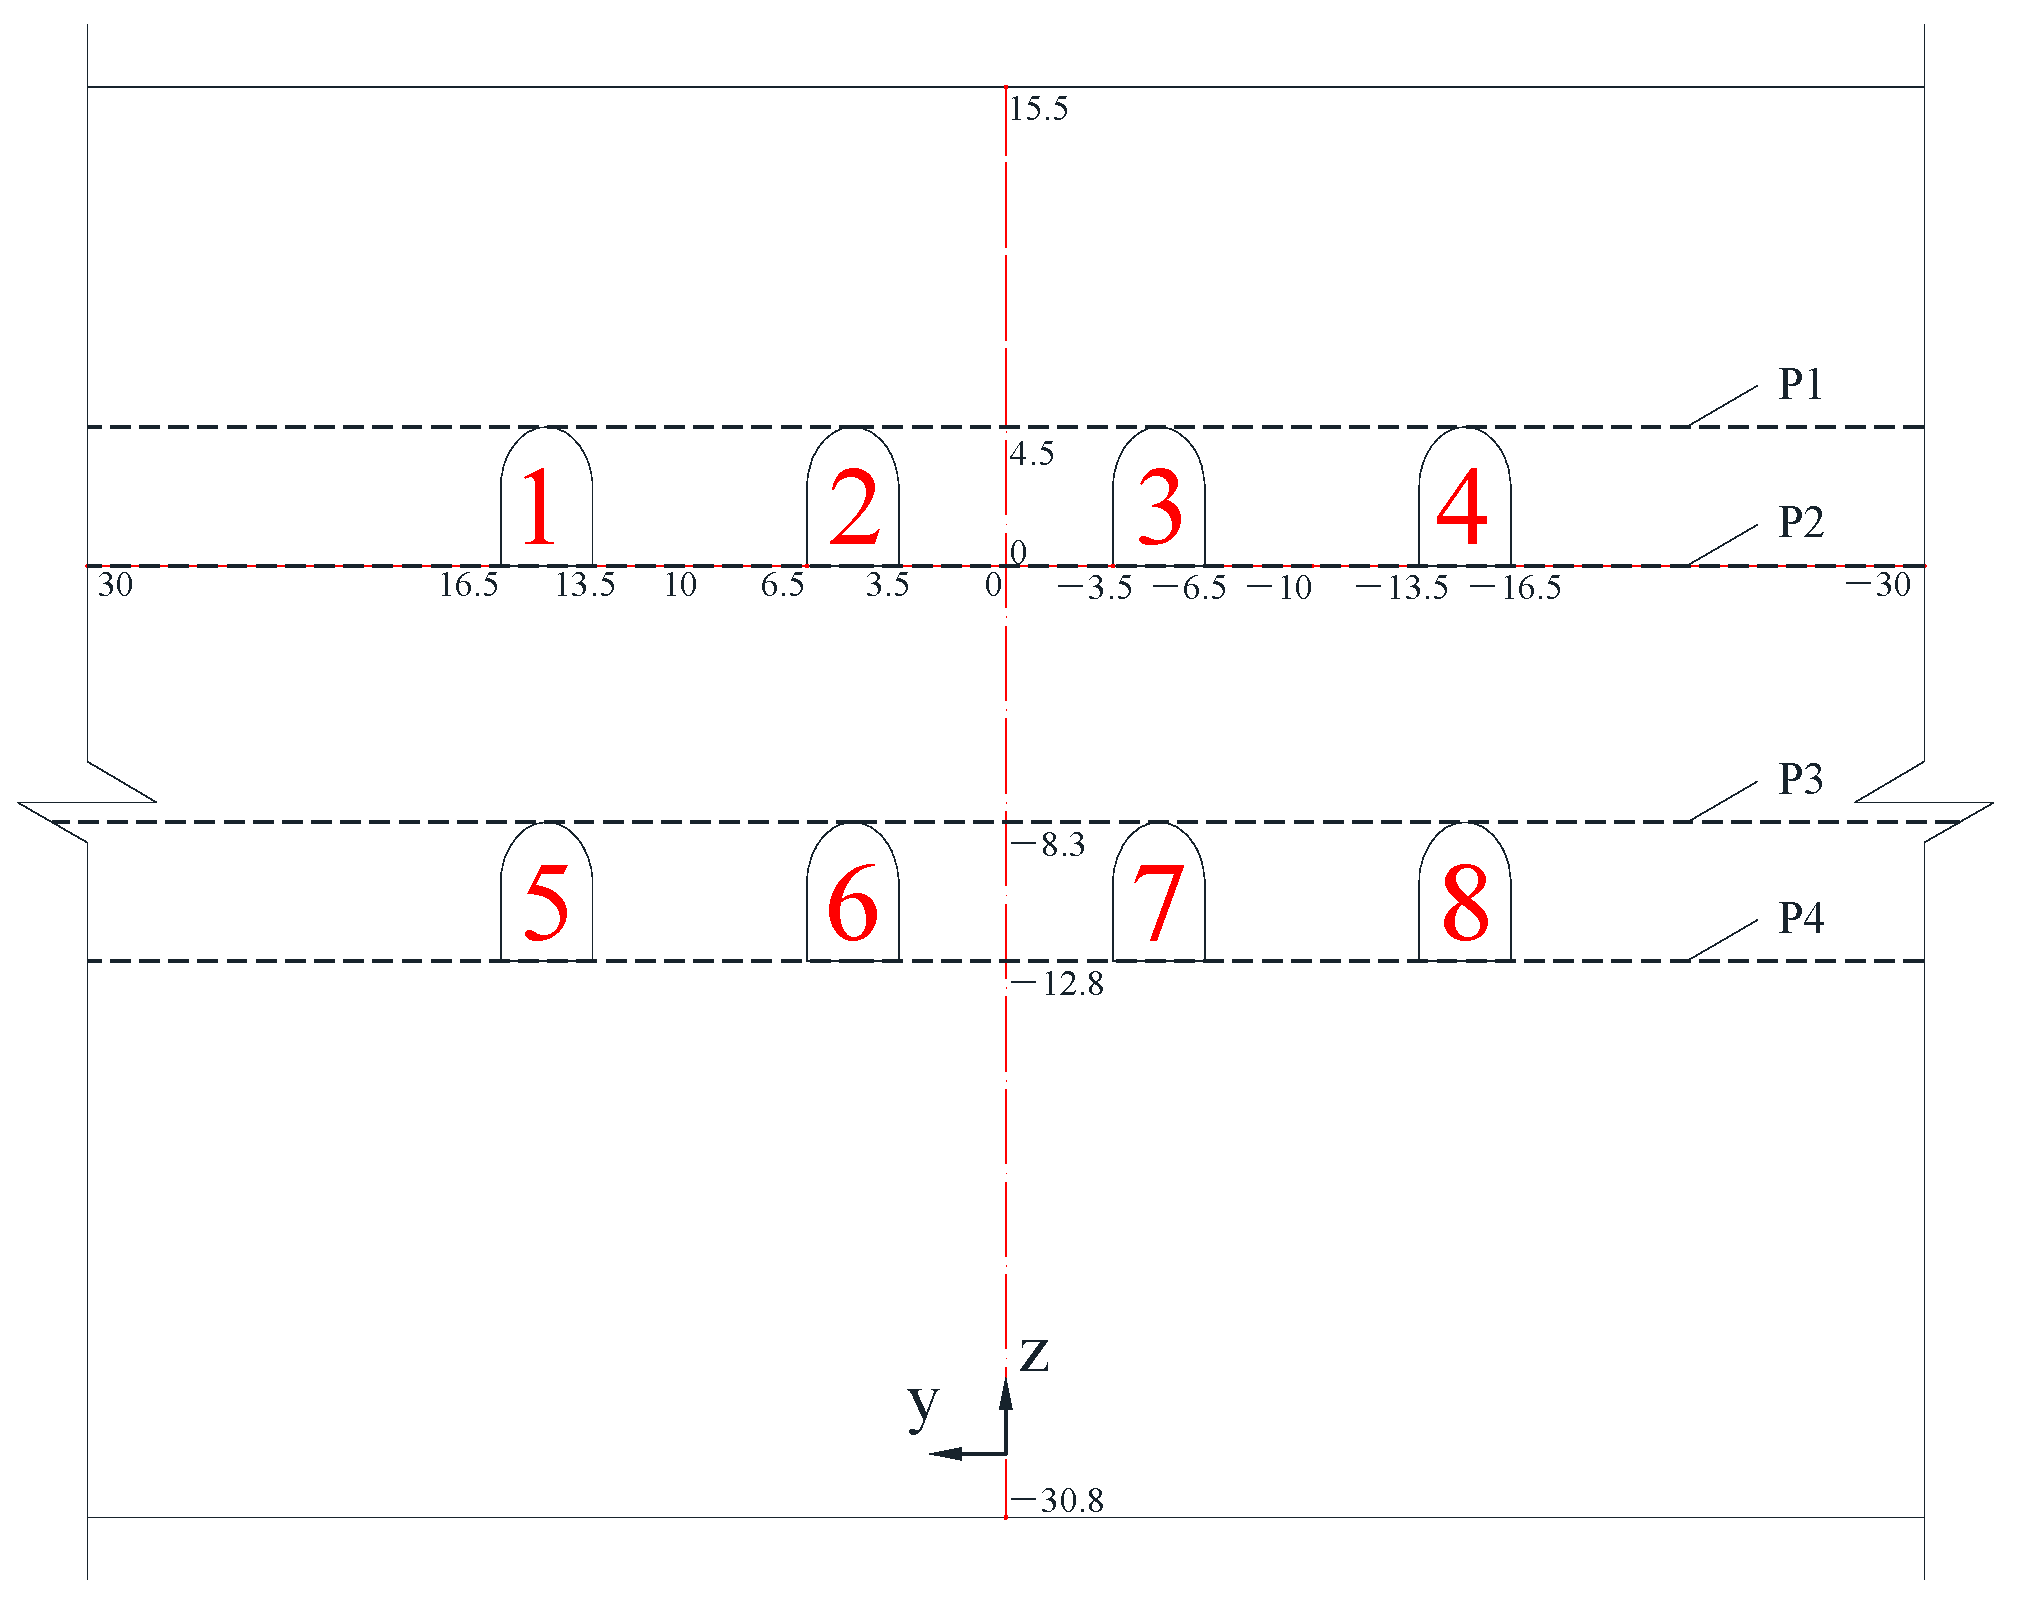
3.2. Setting Monitoring Points
4. Influence of Excavation Sequences on Stress Field Distribution
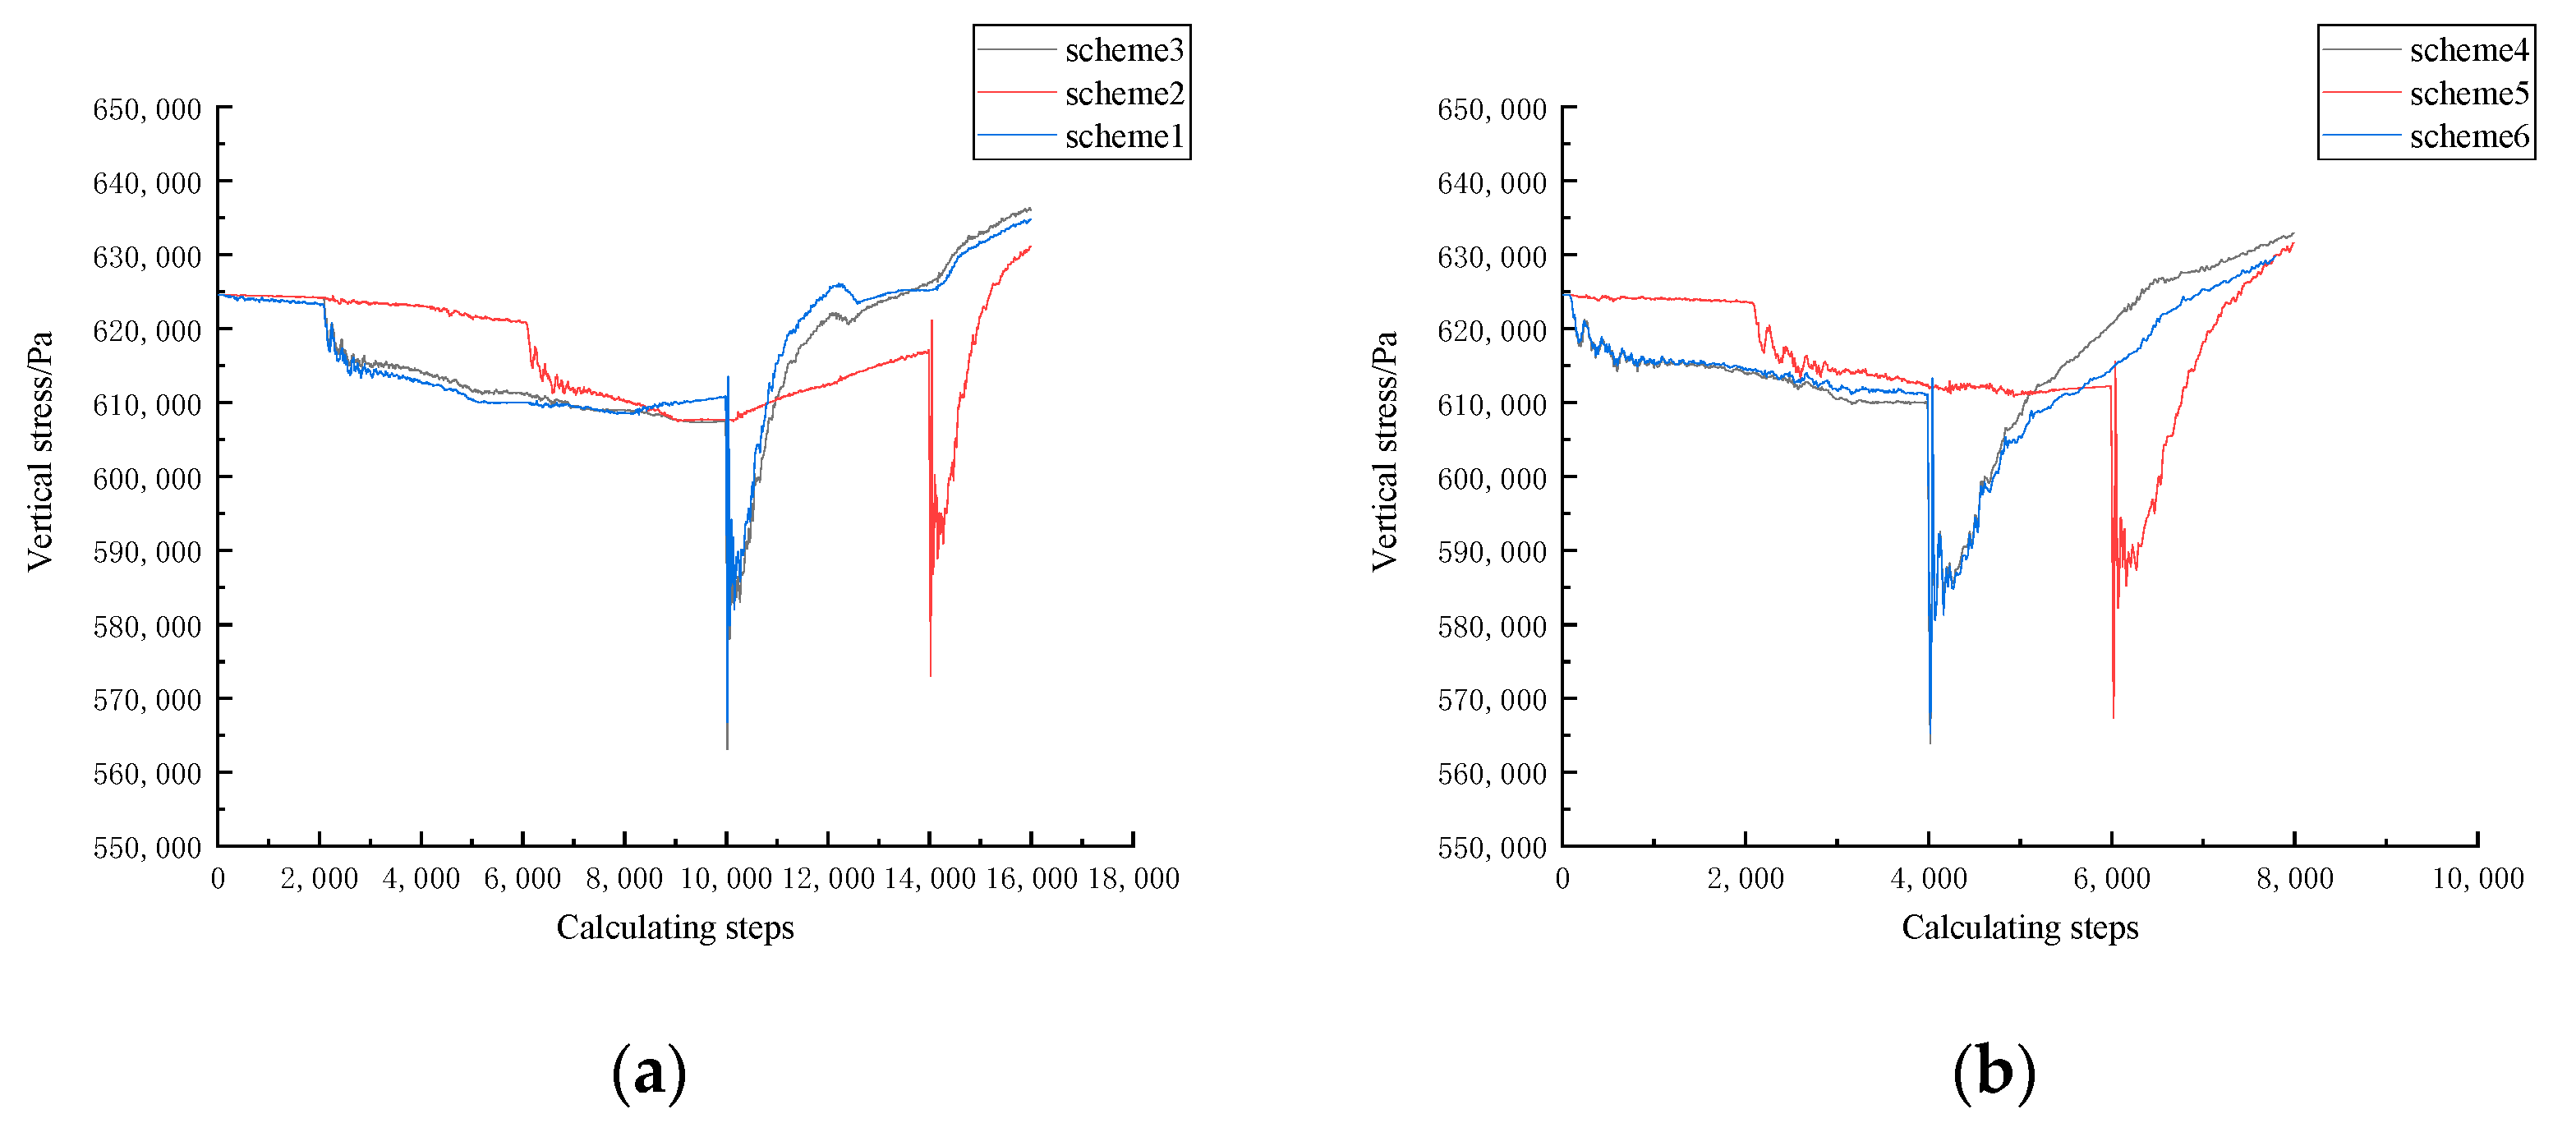
4.1. Simulation Results of the First Kind of Scheme (Schemes 1 to 3)
4.2. Simulation Results of the Second Kind of Scheme (Schemes 4 to 6)
- (1)
- Scheme 4 (D-23-14-67-58)
- (2)
- Scheme 5 (D-14-23-58-67)
- (3)
- Scheme 6 (D-13-24-57-68)
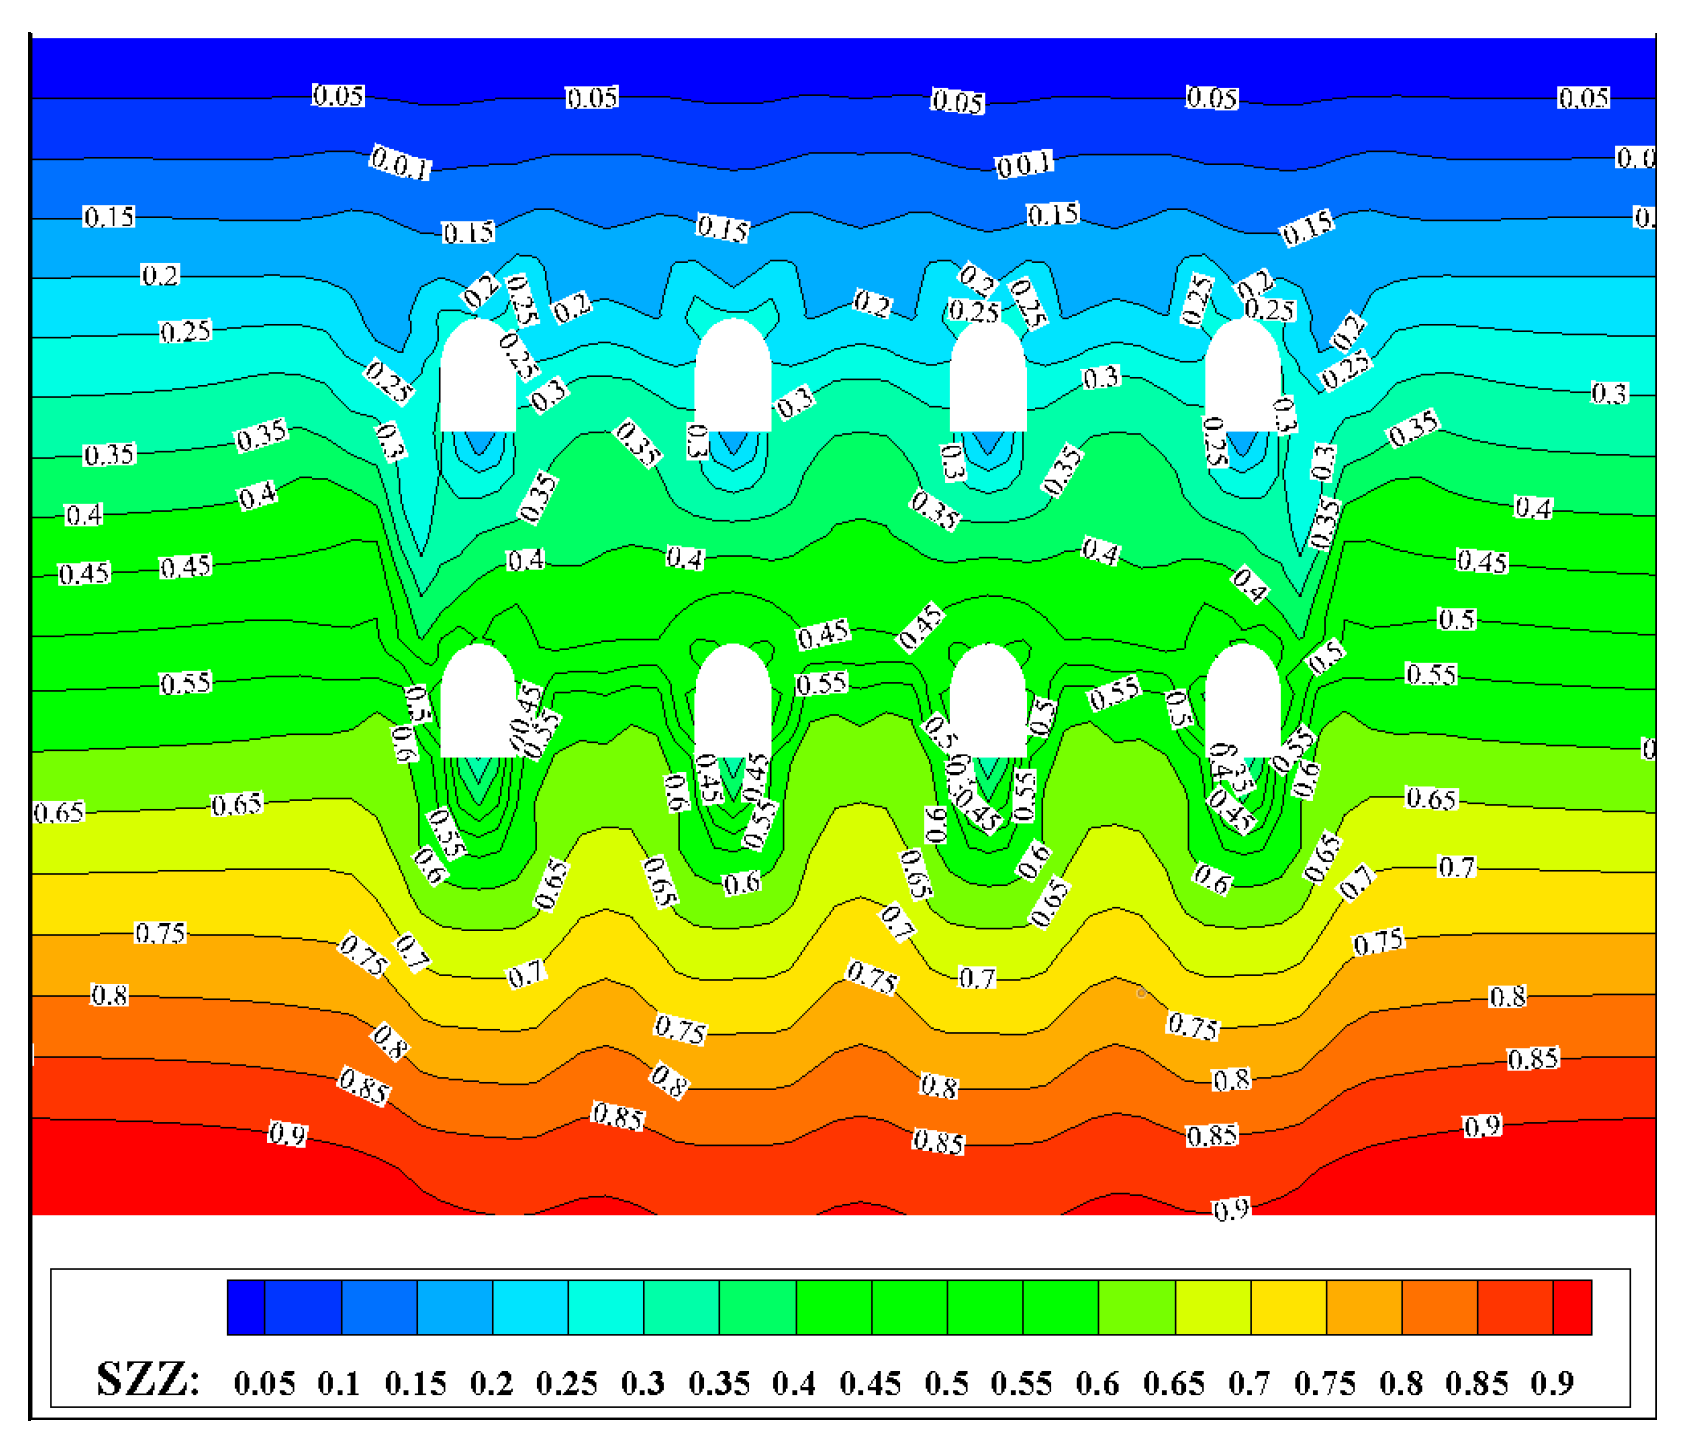
5. Study on the Formation of the Stress Field
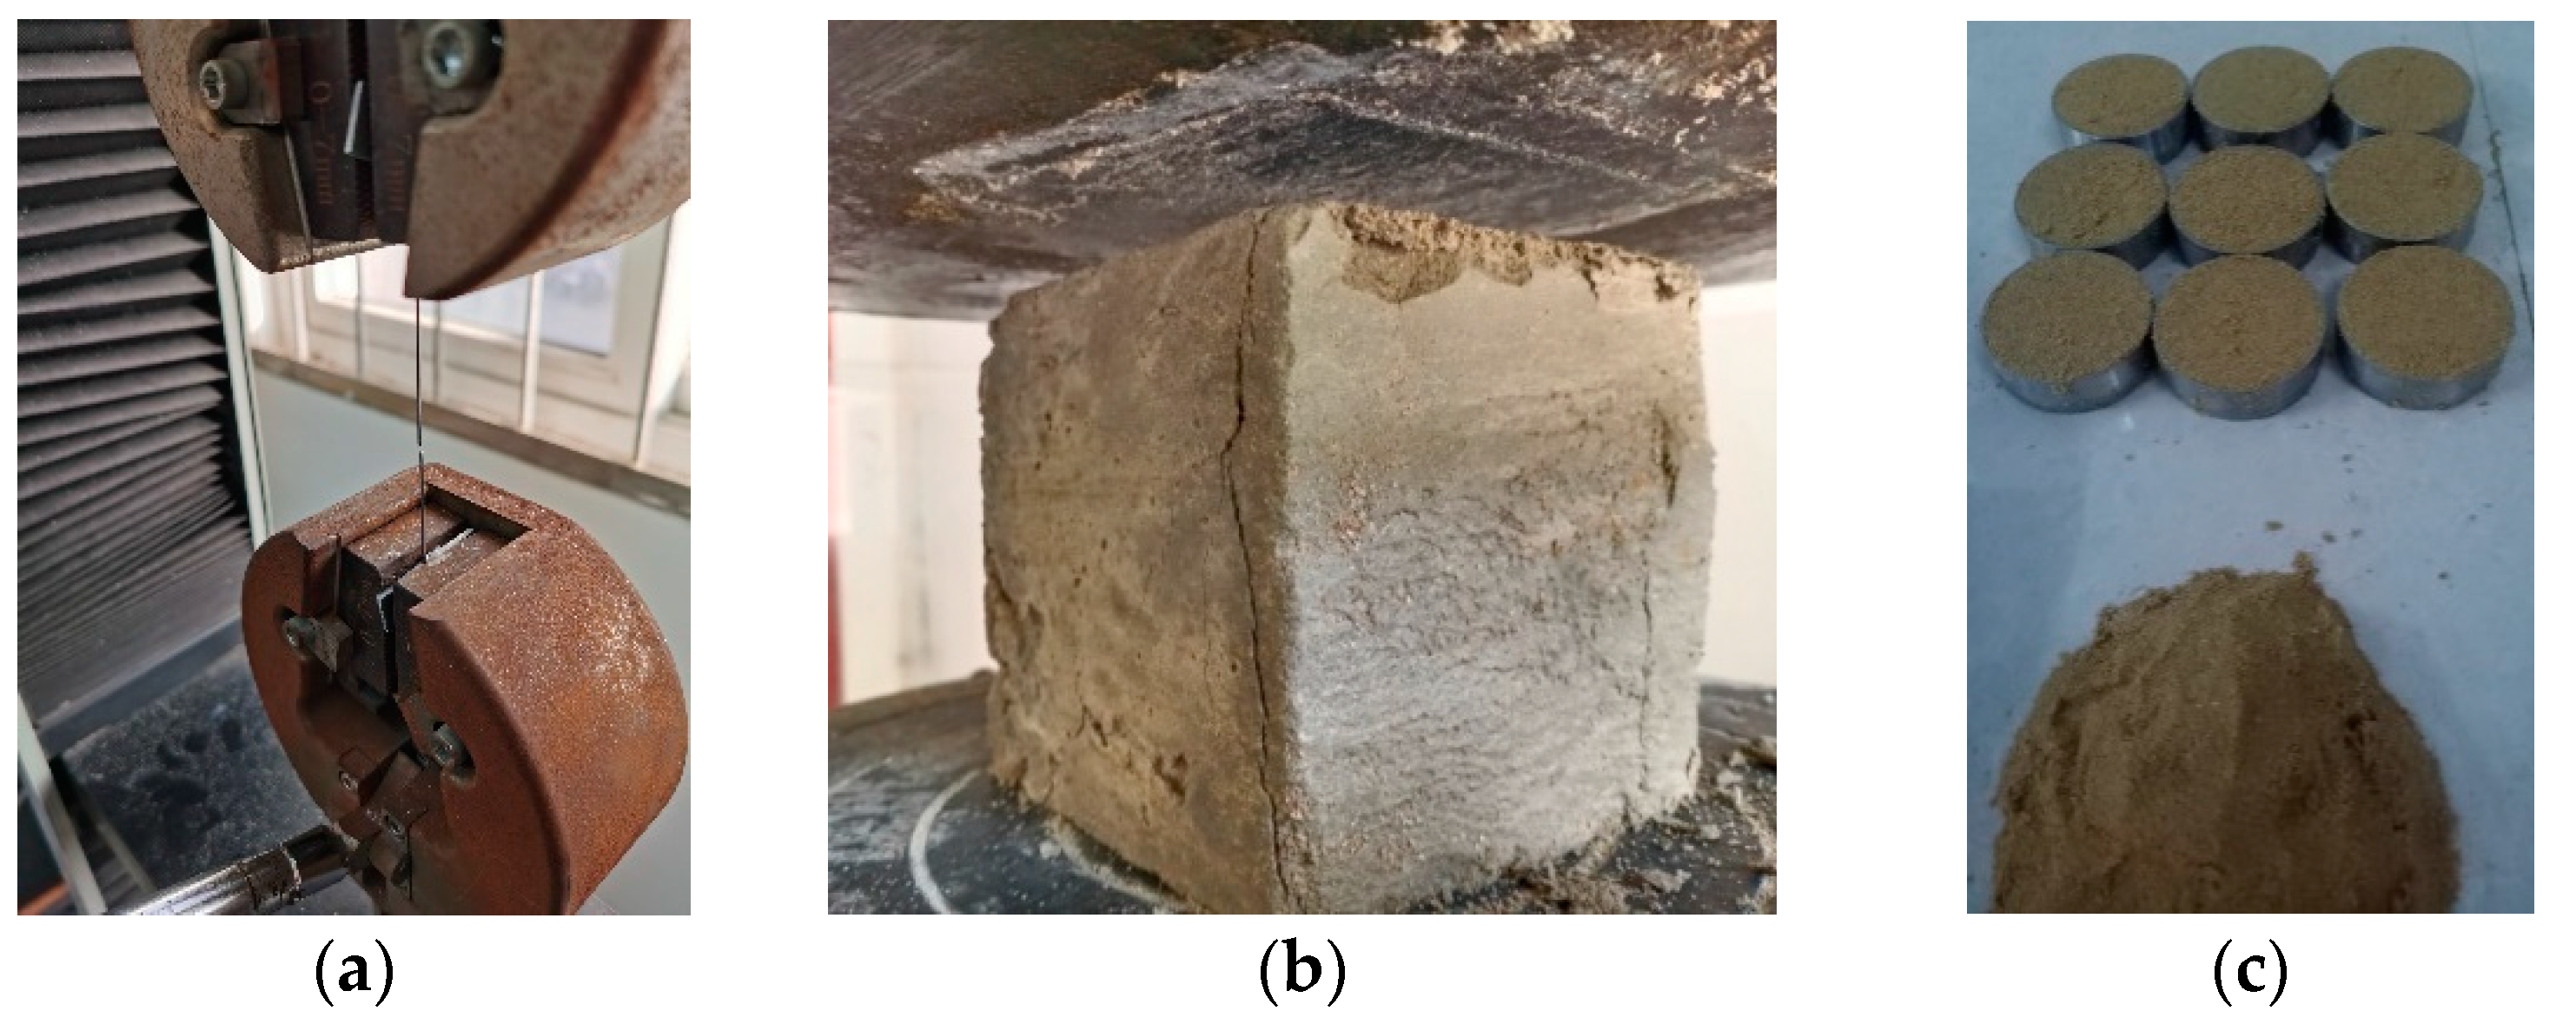
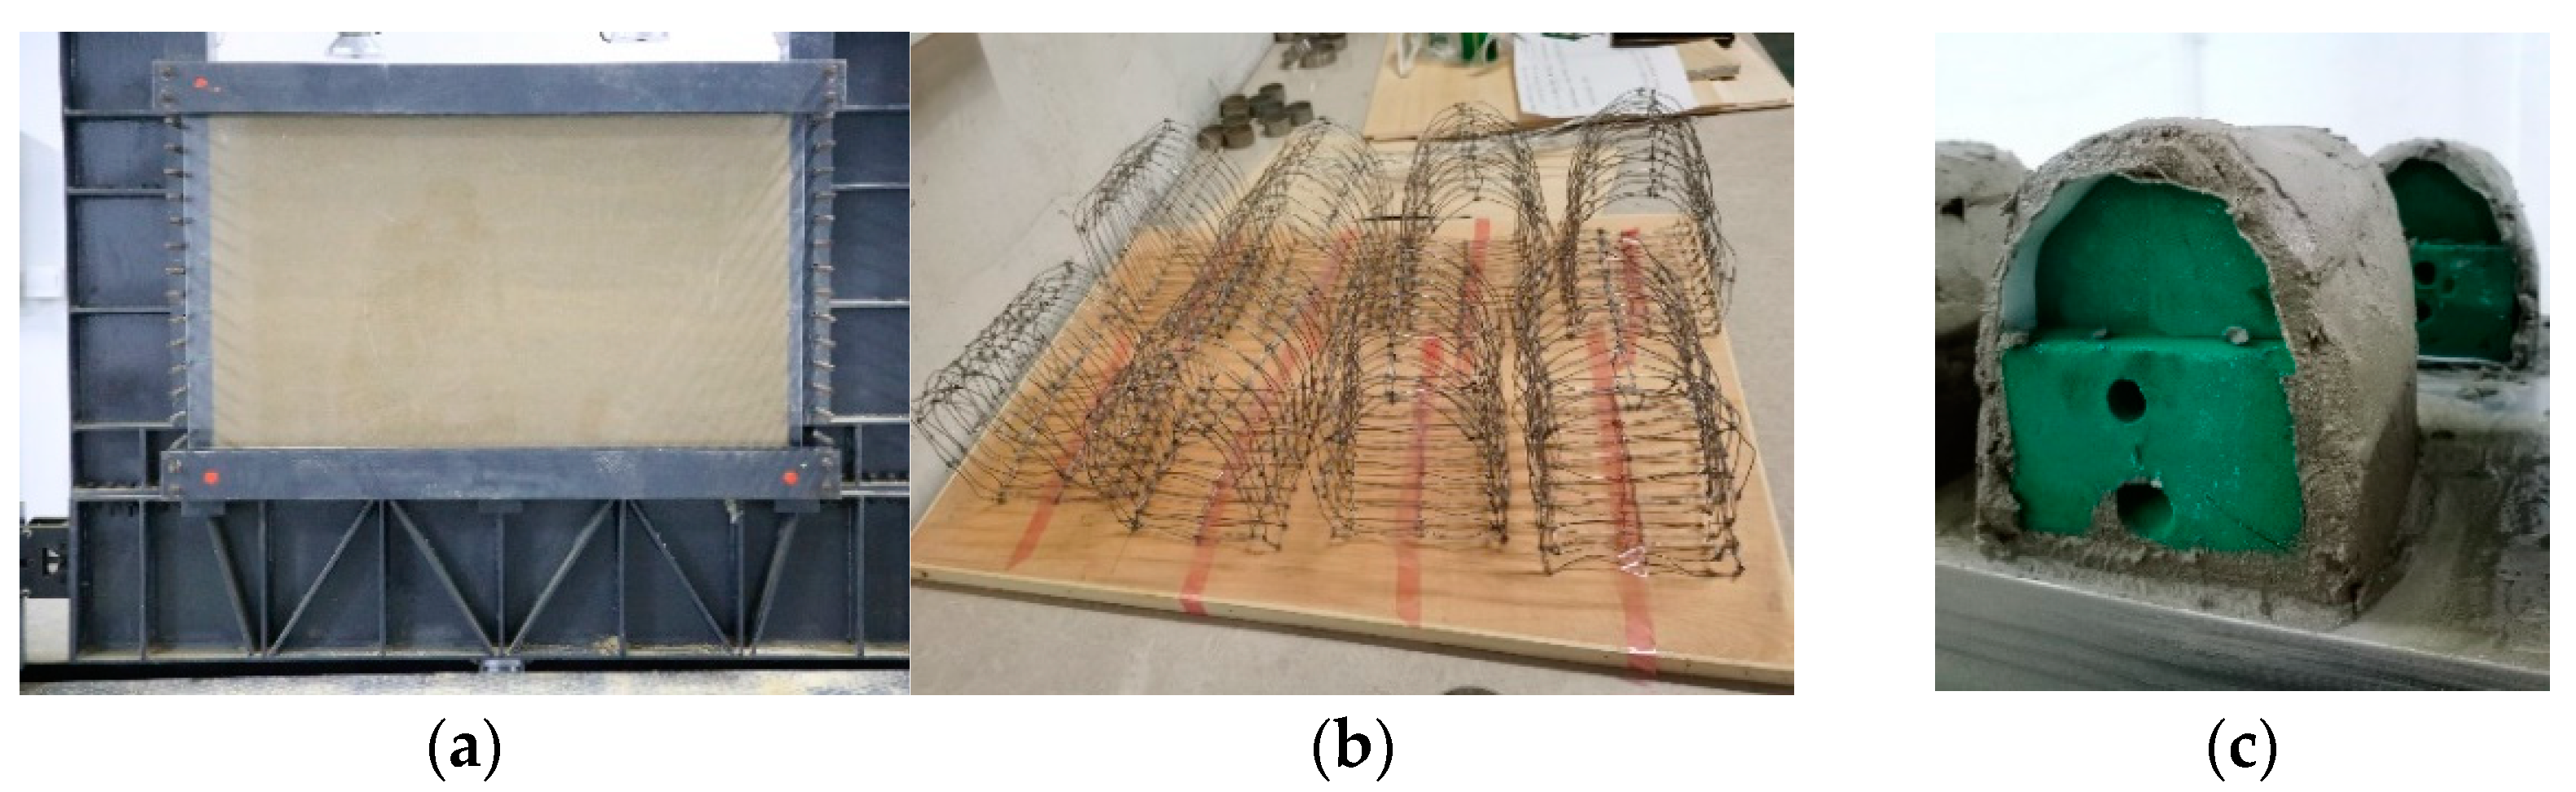
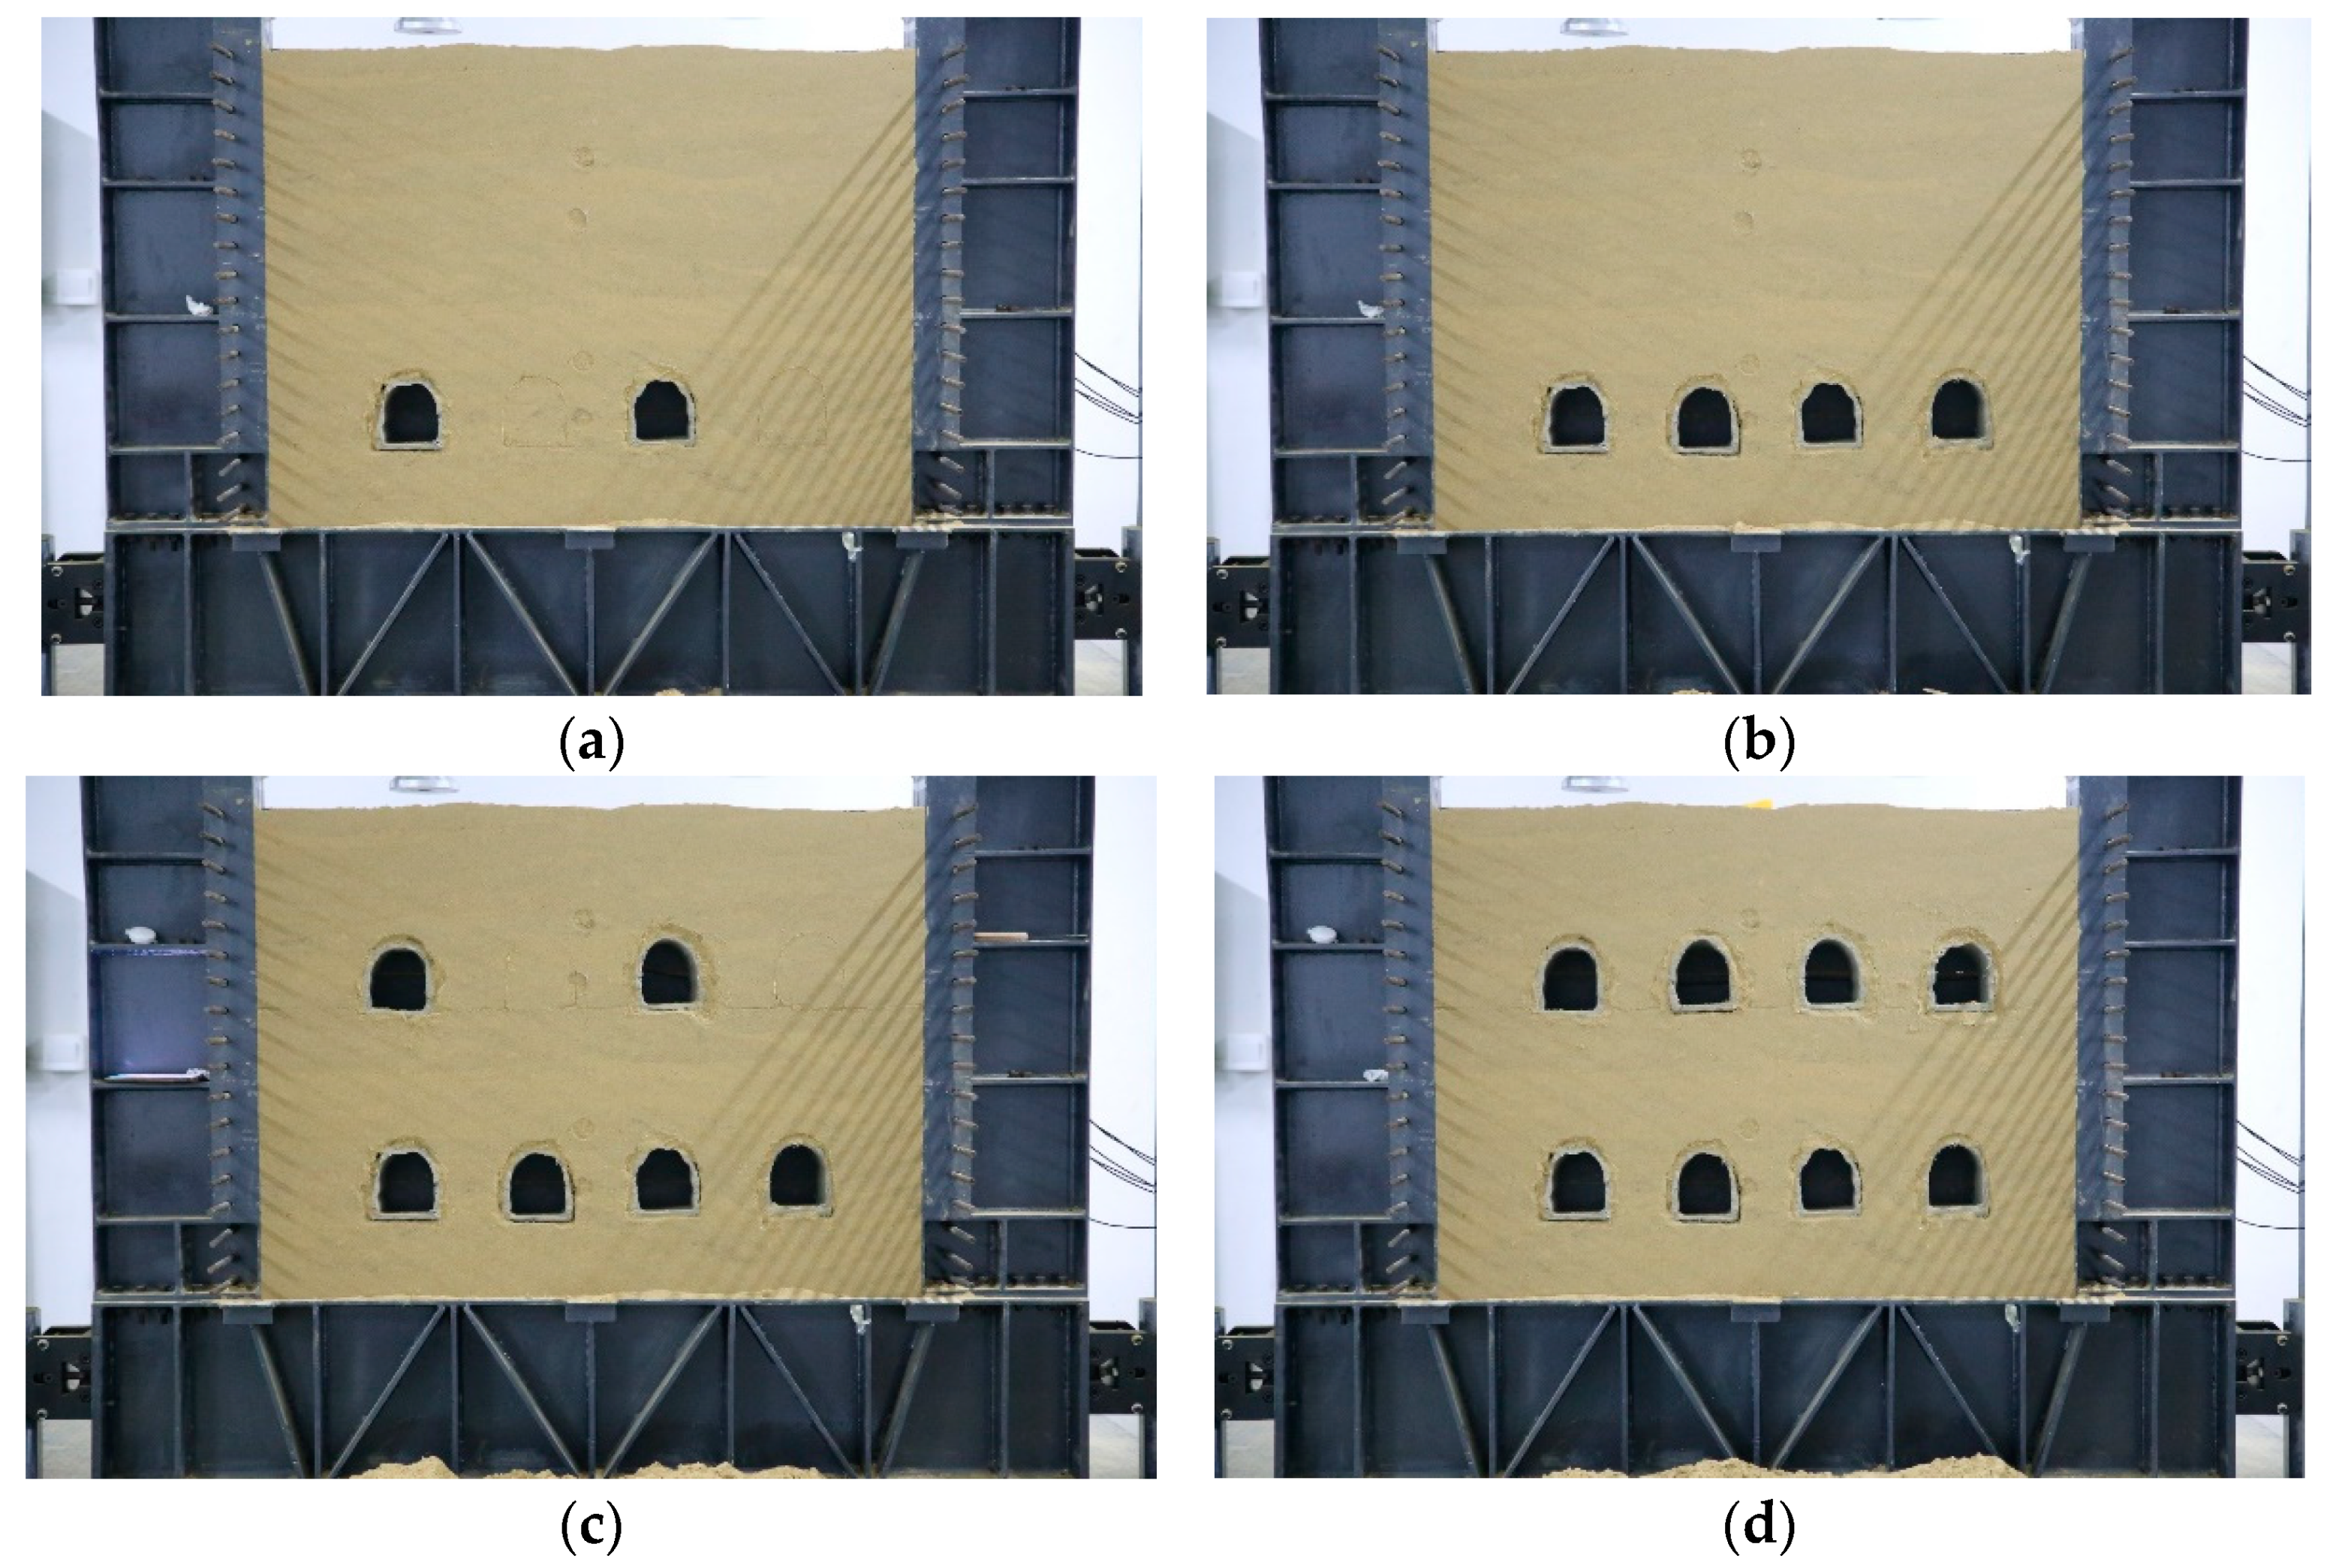
6. Model Verification
7. Conclusions
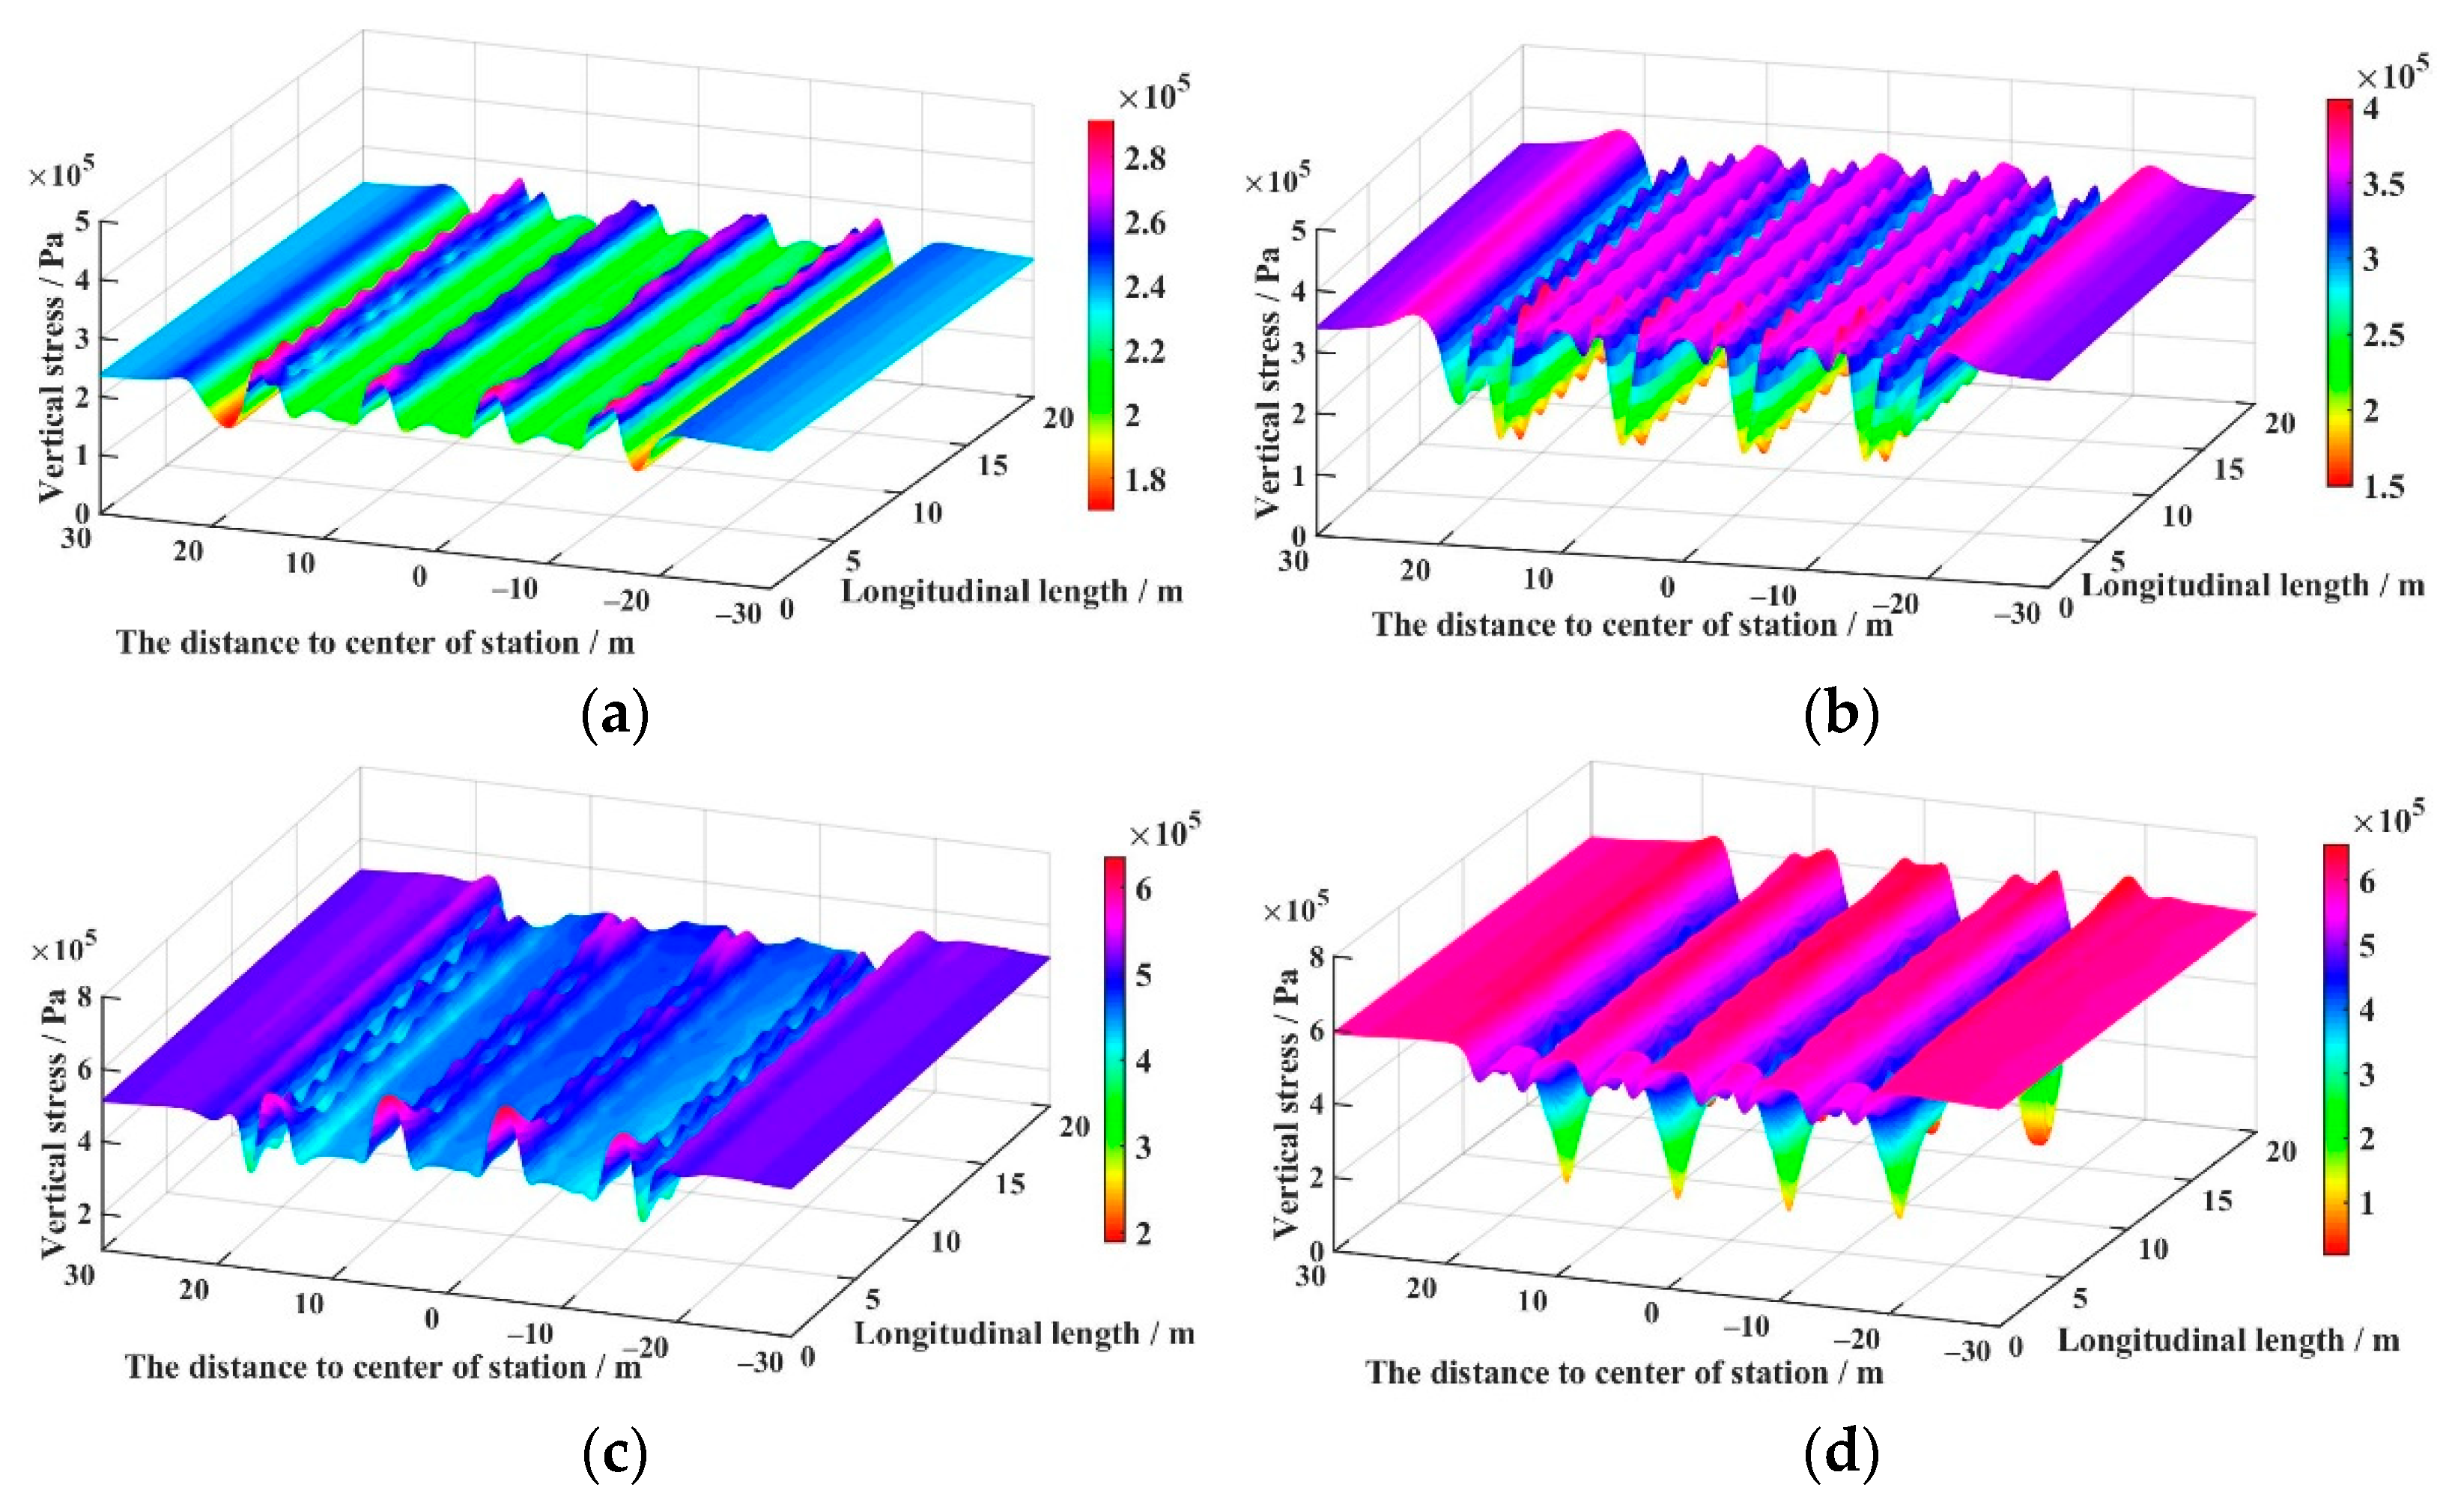
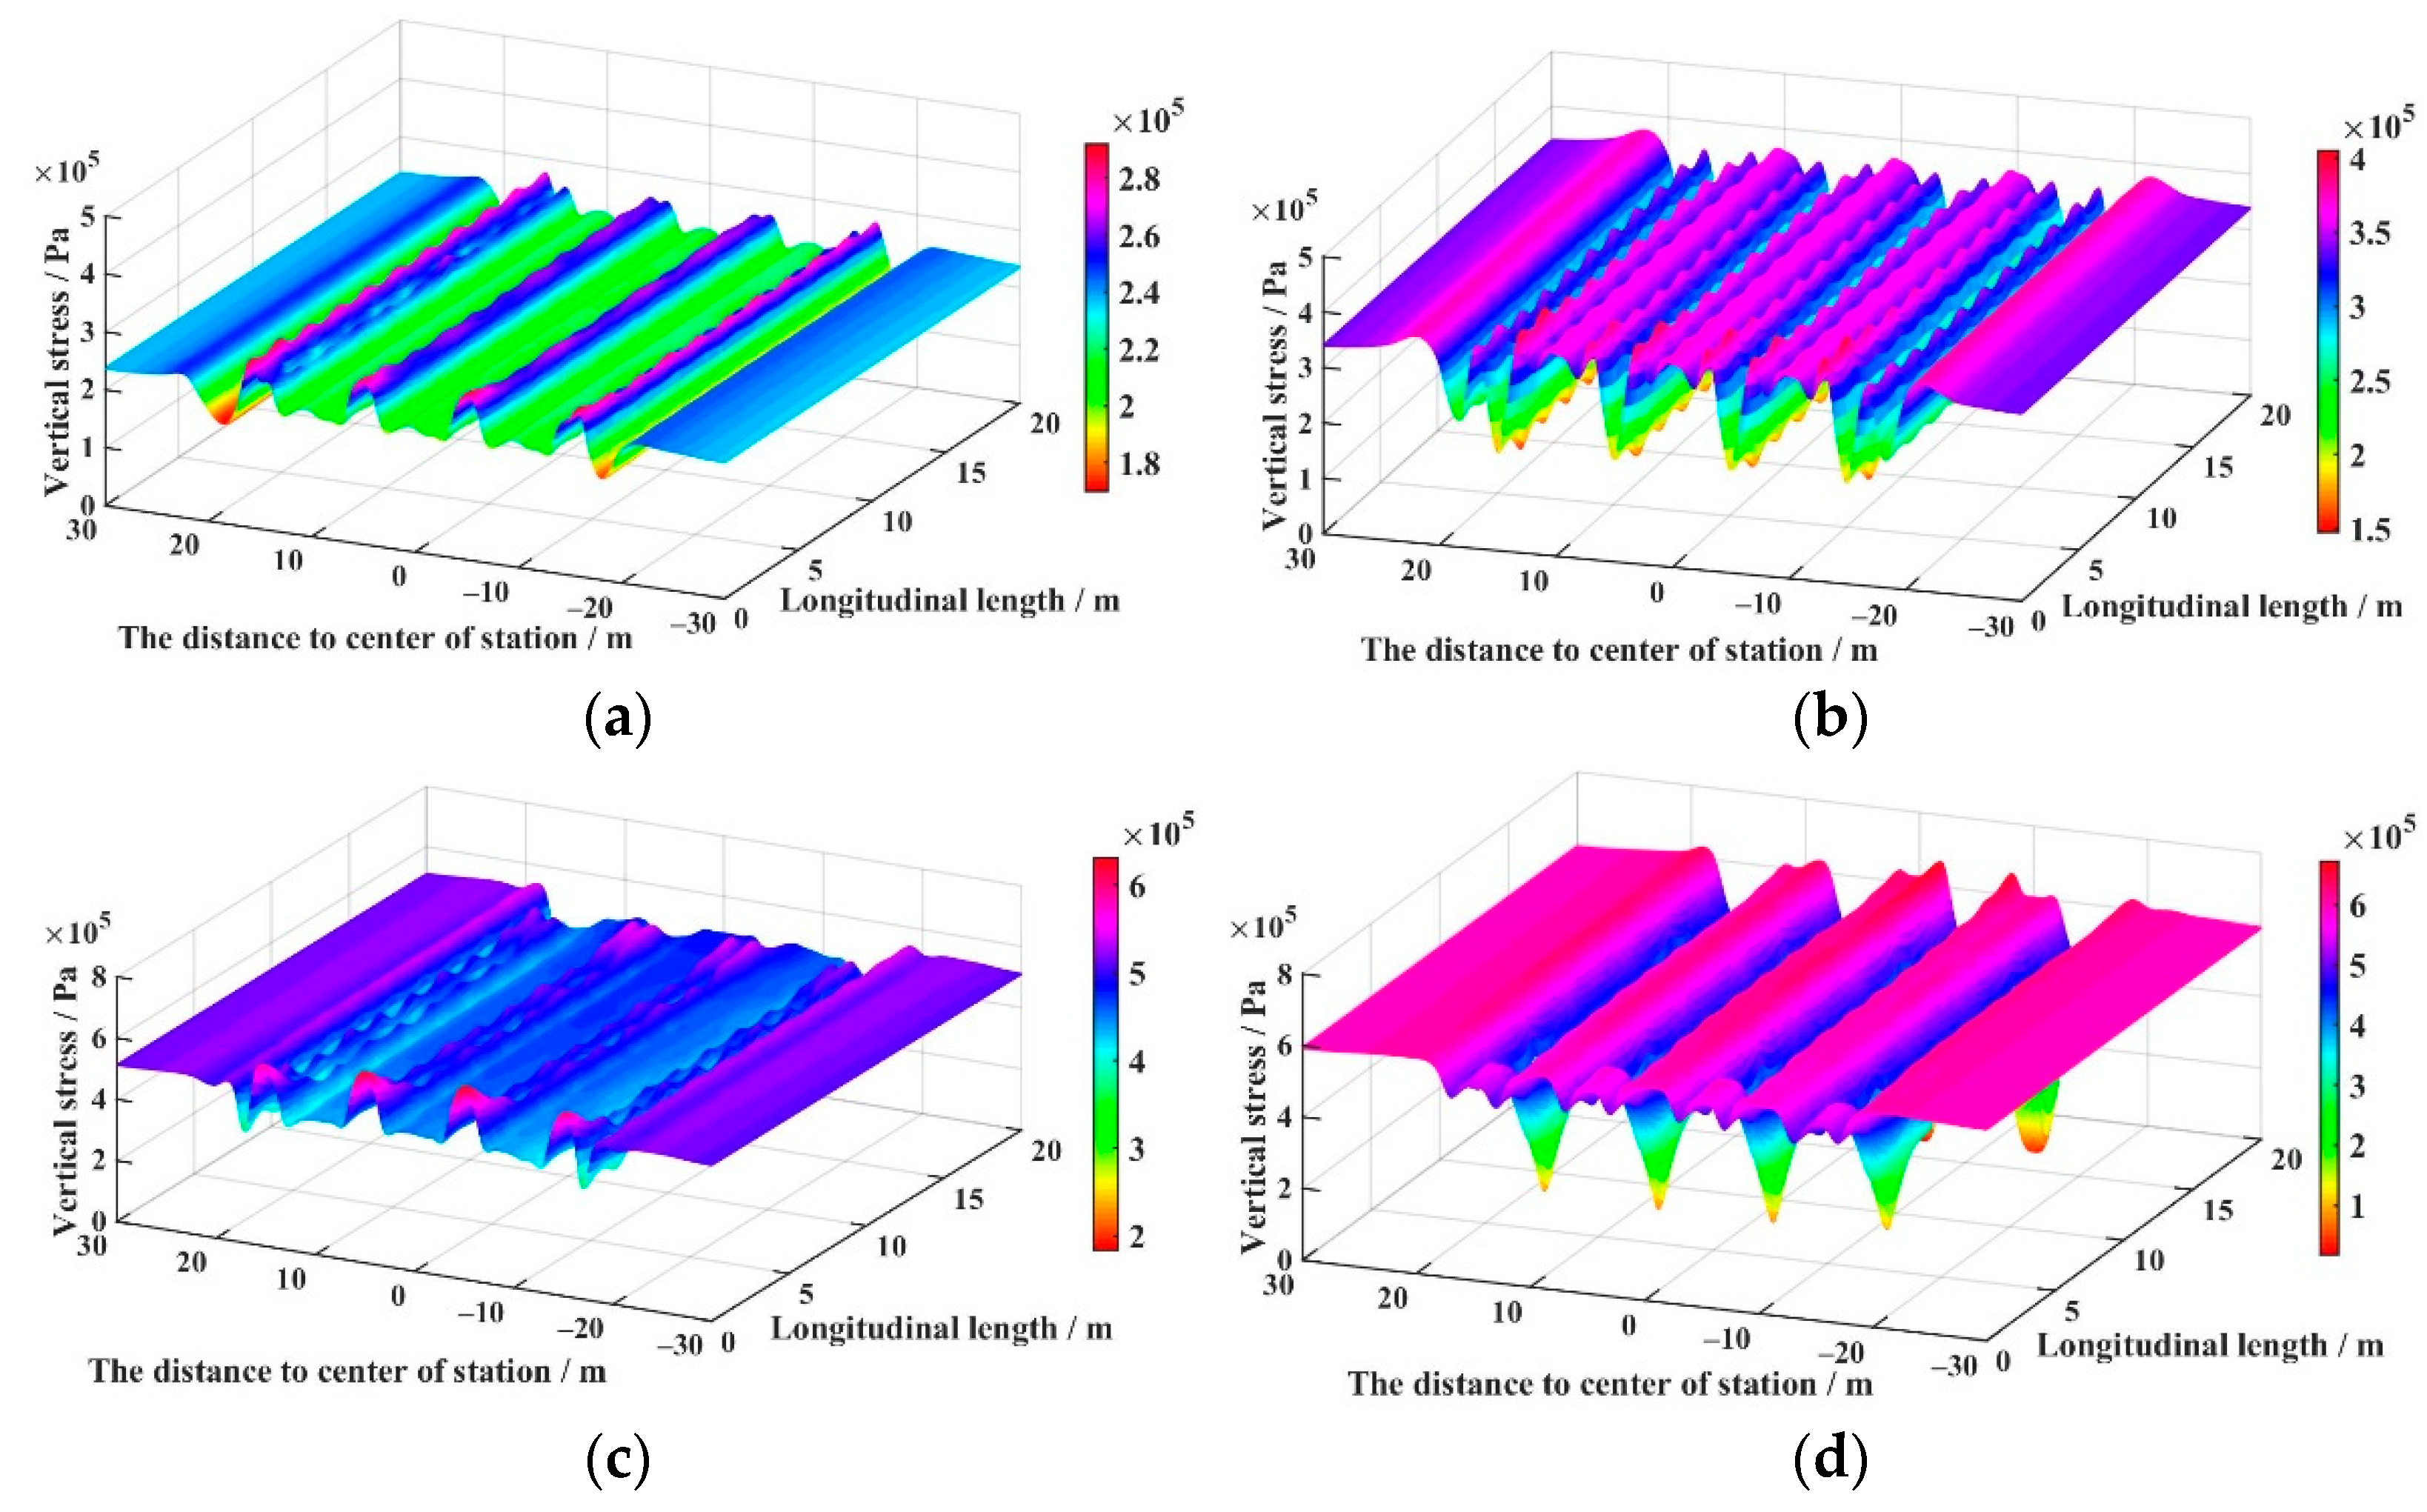
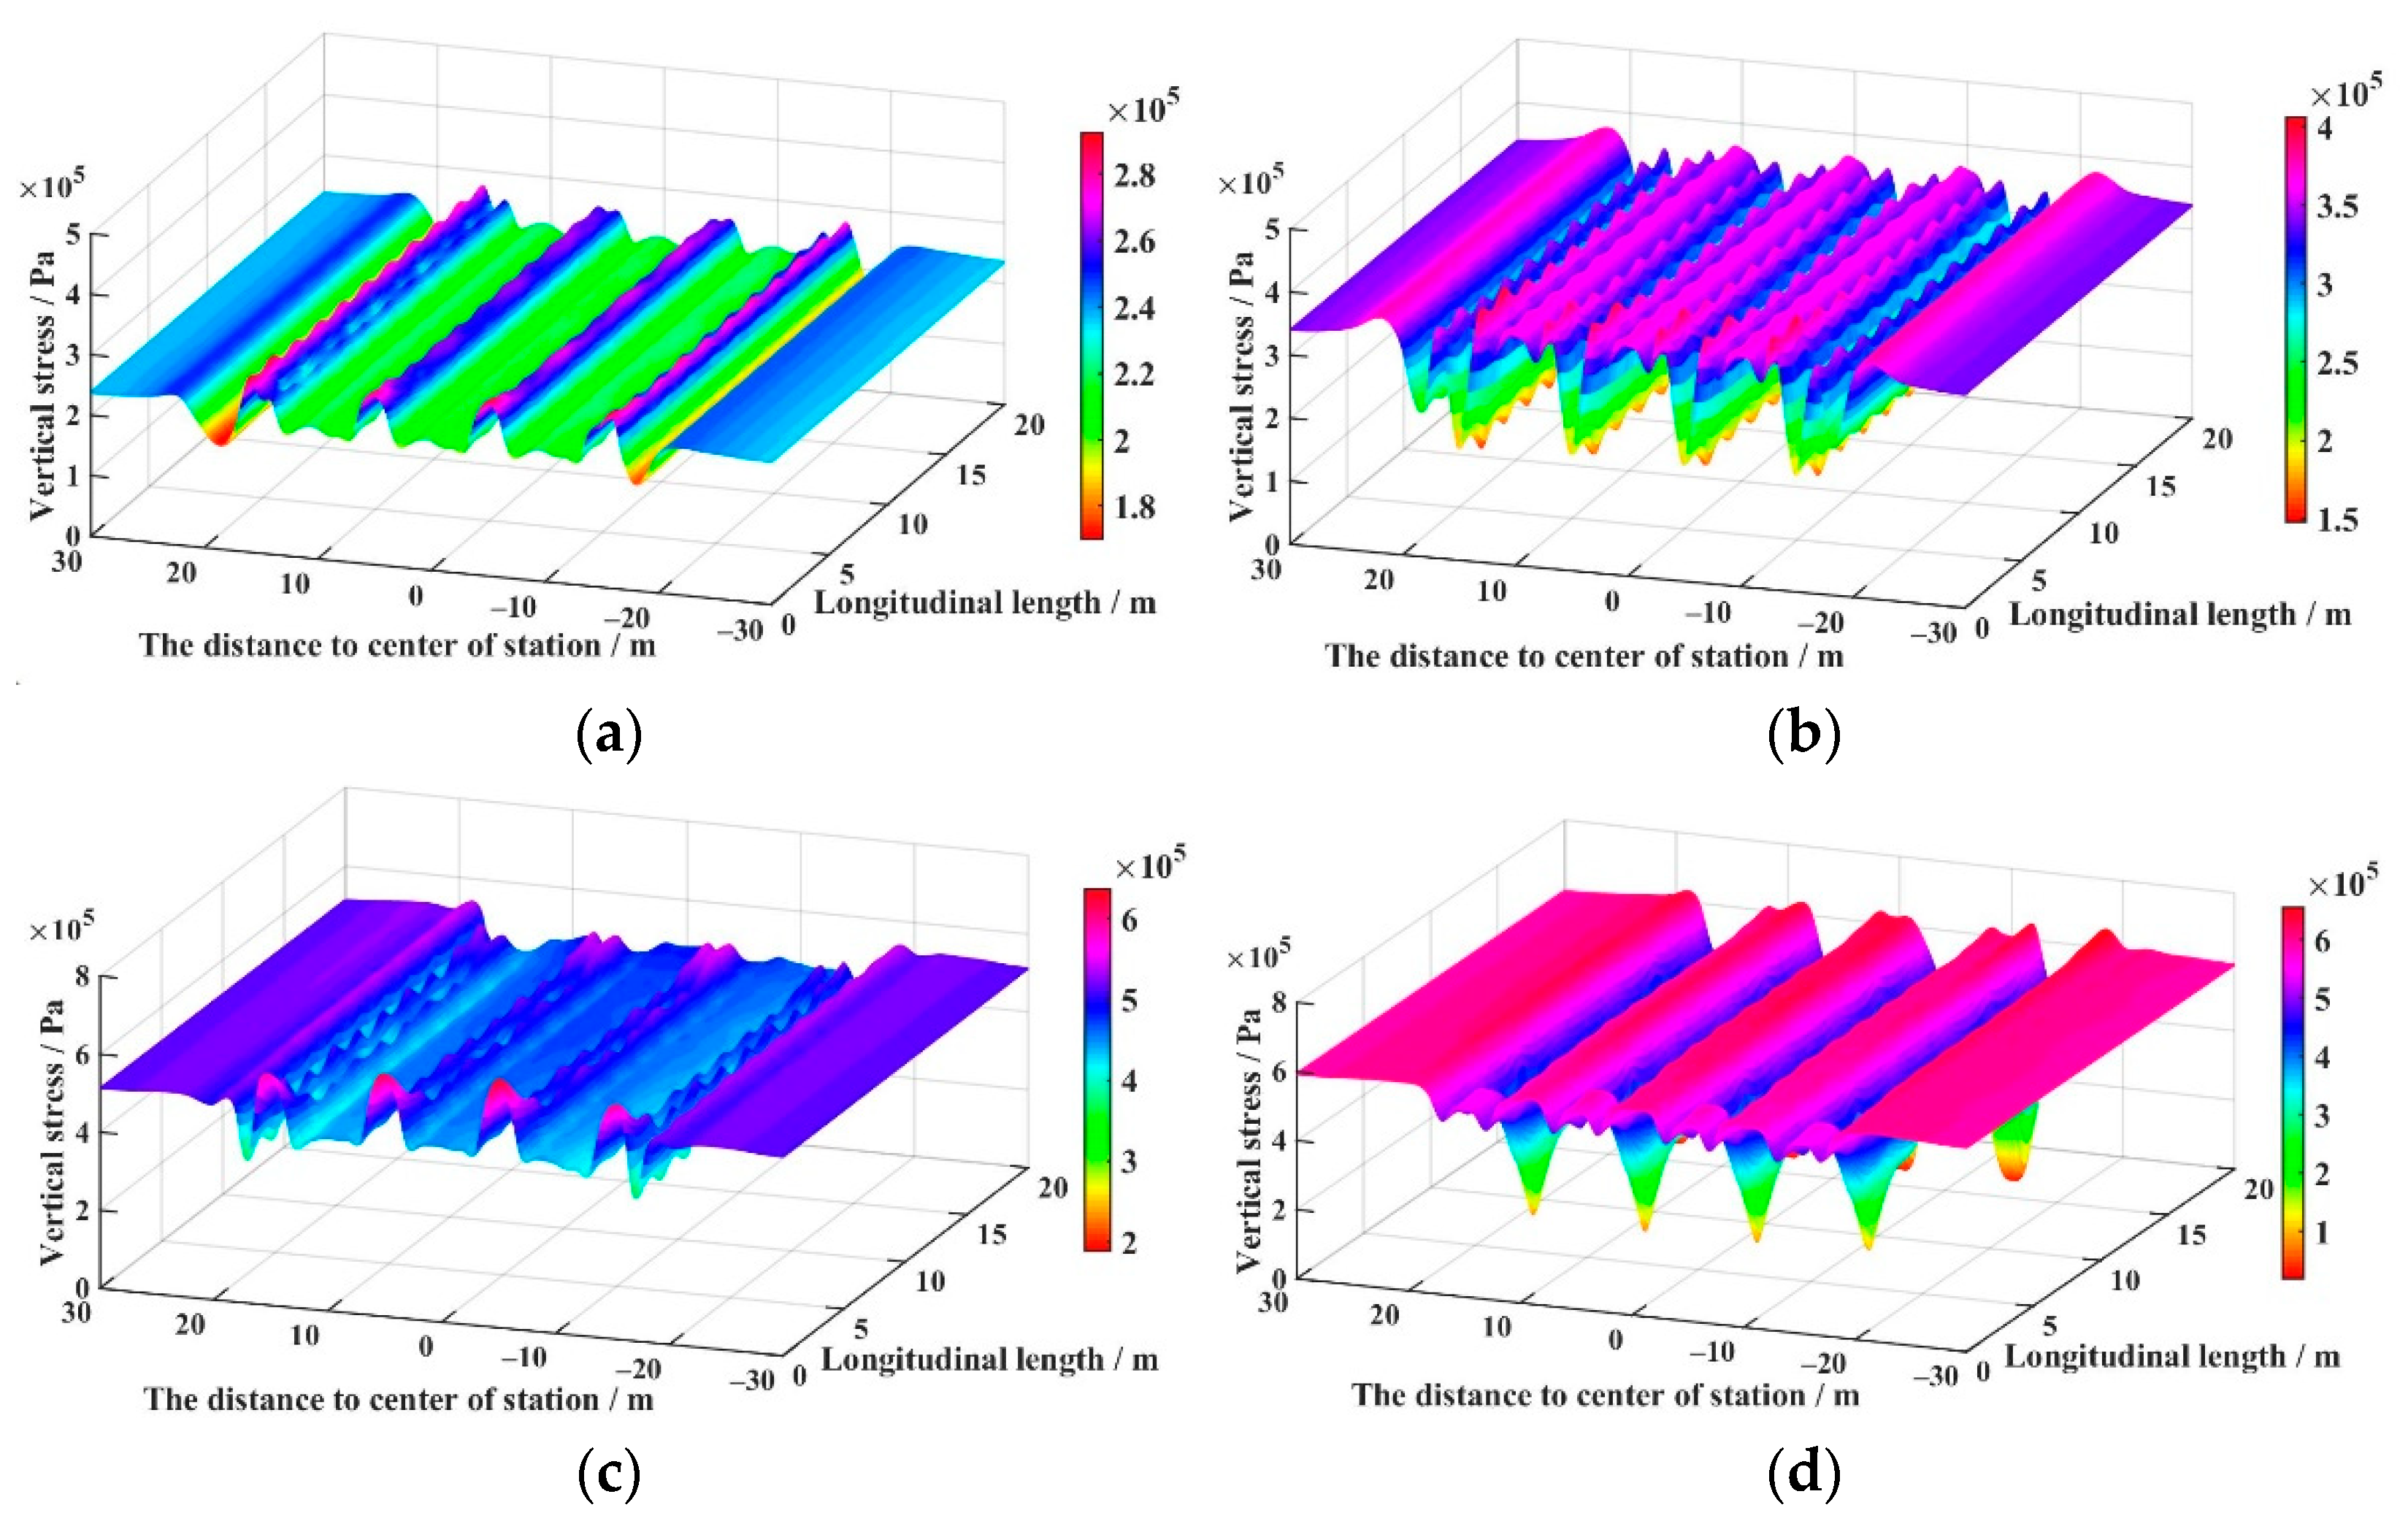
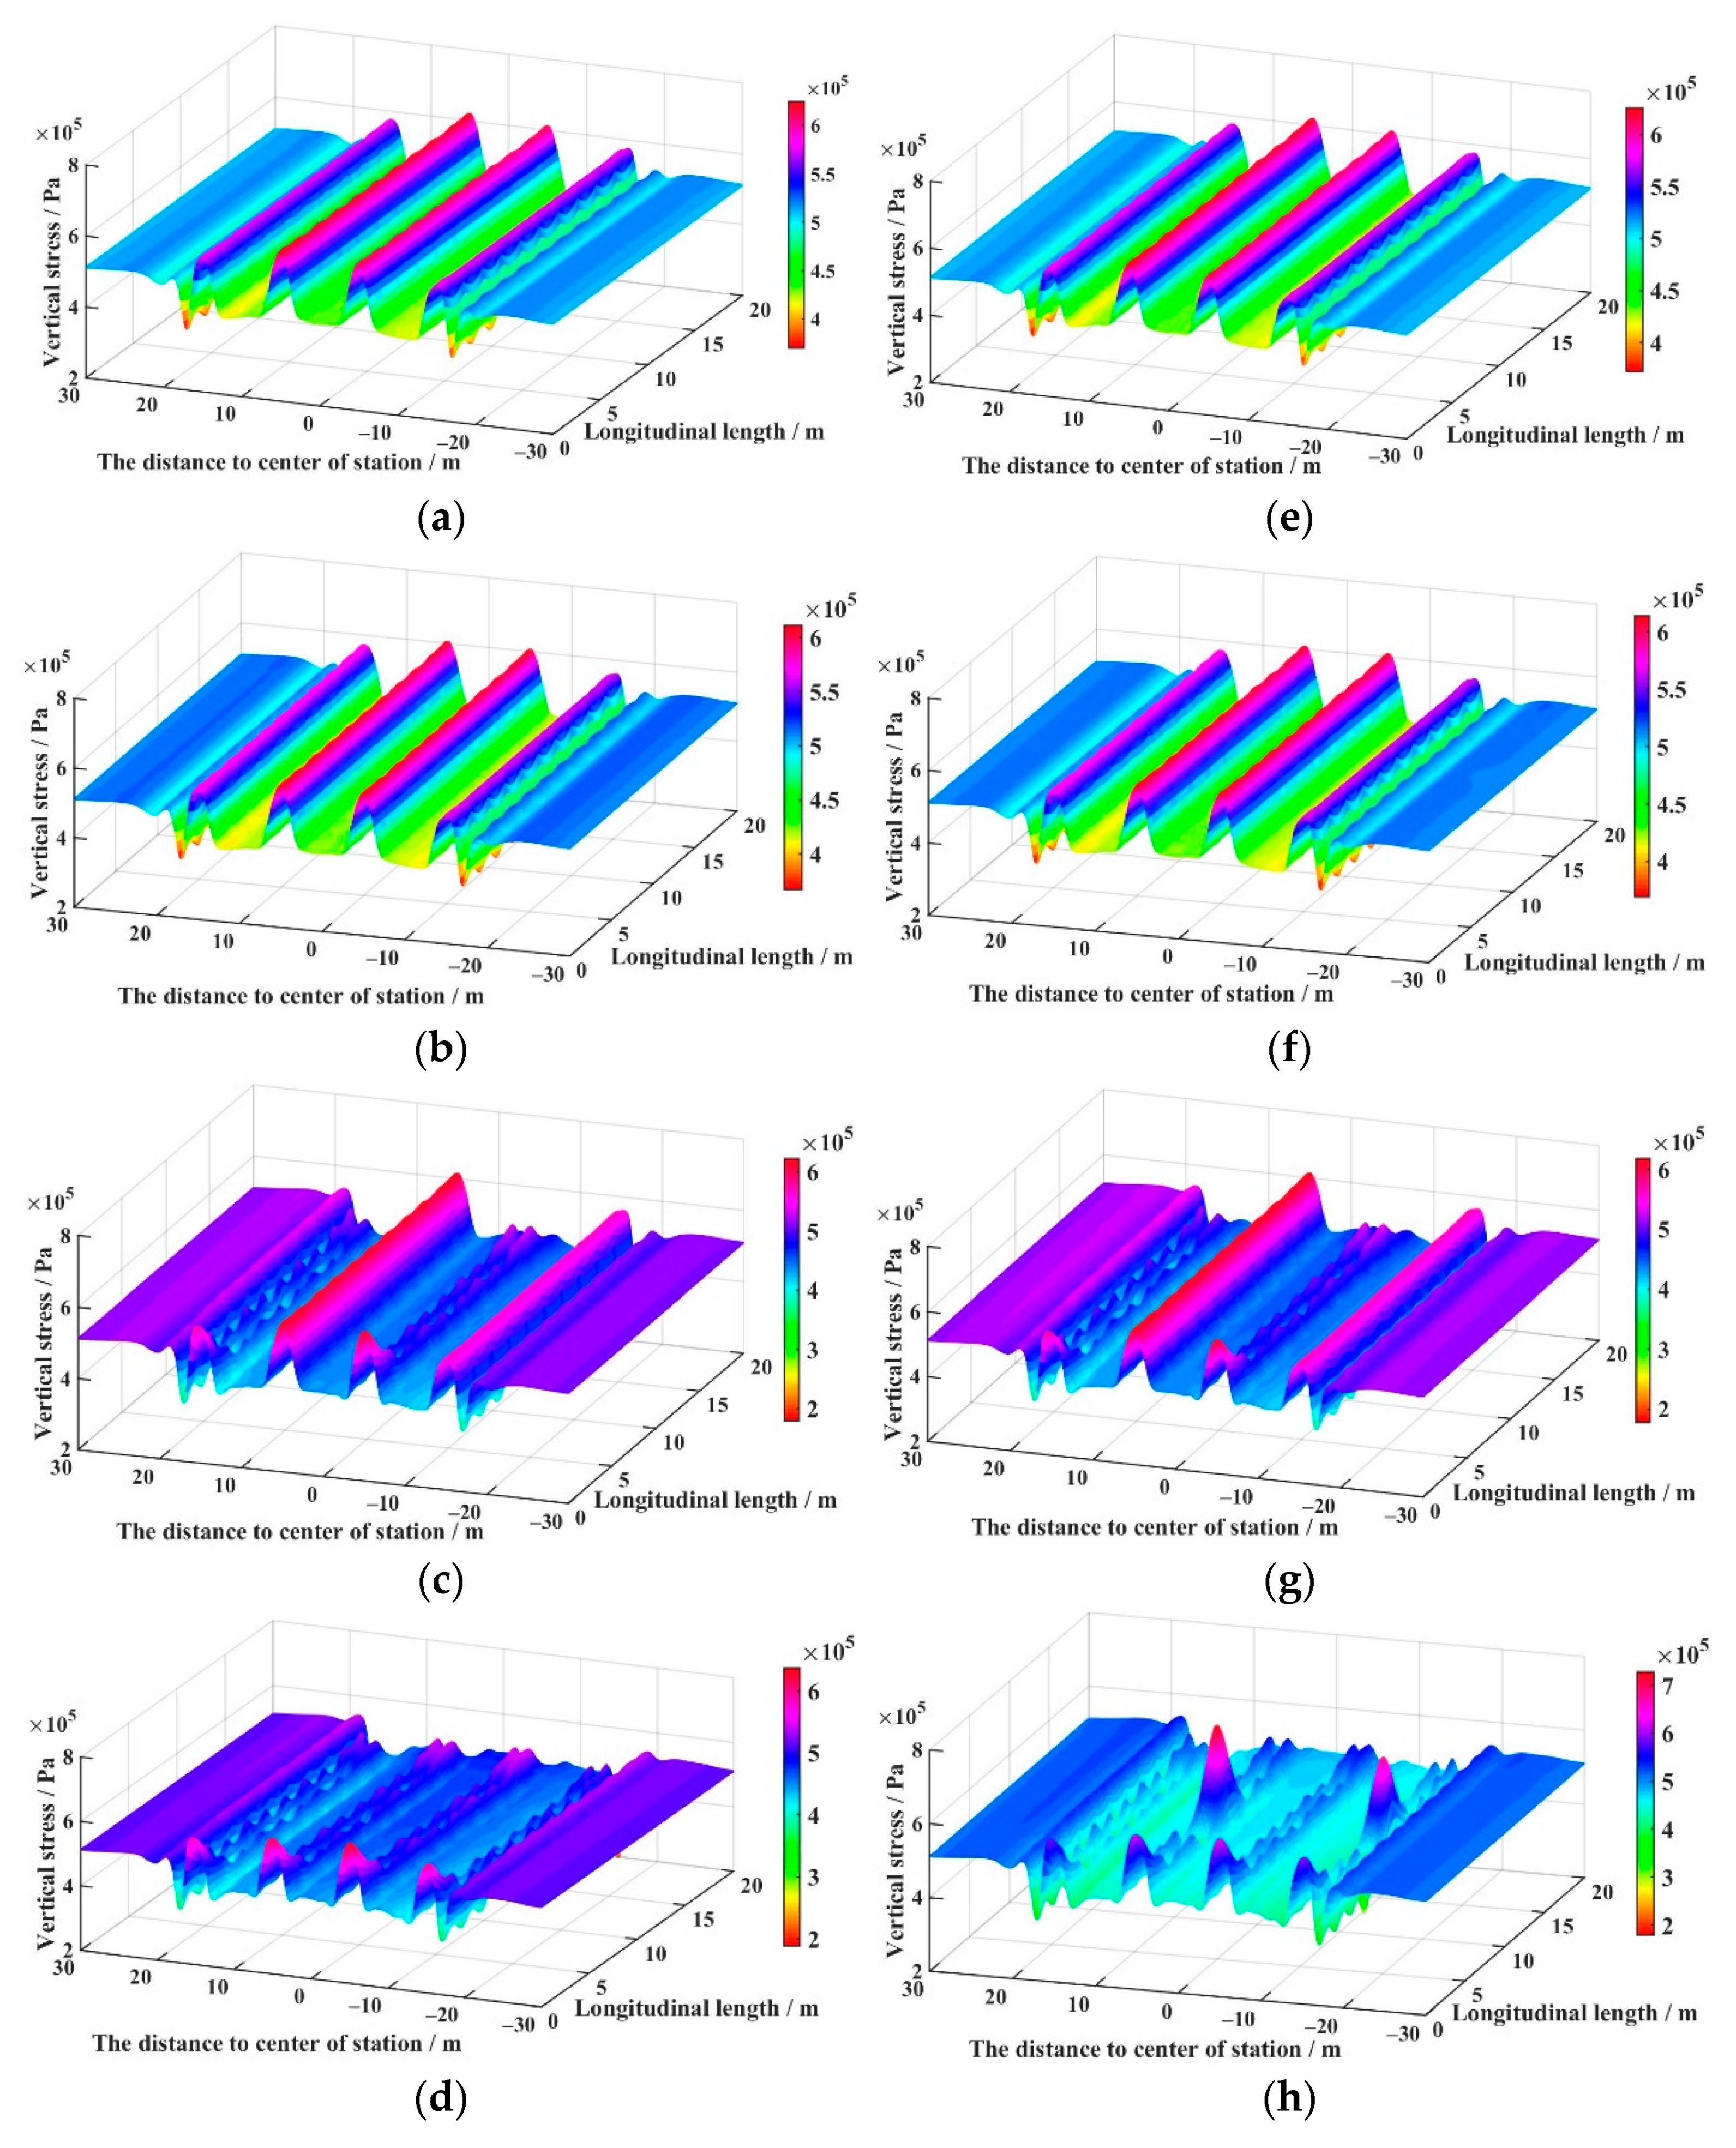
- The vertical stress in the area beyond 30 m on both sides of the station, which is the centerline, was not affected by the excavation of pilot tunnels; therefore, the effect of the excavation of pilot tunnels on vertical stress has a range that is essentially equal to twice the width of the station. Therefore, the effects of construction on the surrounding environment and buildings must be considered during construction.
- After the excavation of pilot tunnels, peaks appeared both at the tops of the pilot tunnels and between the bottoms of the tunnels and valleys appeared both at the bottoms of the pilot tunnels and between the tops of the tunnels. Furthermore, the stress concentration factor on the plane P3 was higher than that on the plane P1, and that on the plane P2 was higher than that on the plane P4.
- The stress concentration factors on planes P1 and P2 of all schemes were almost the same after construction, but those on planes P3 and P4 had significant differences. Therefore, the stress concentration factor from pilot tunnels located at the bottom of the group are significantly affected by the excavation sequence.
- Comparing the extreme points of the different schemes, those on the plane P1 are exactly the same, and only one scheme has a different extreme point among schemes on planes P2 and P3. Comparatively, some differences were found on the plane P4. A similar phenomenon was seen in the results of the stress concentration factor: the pilot tunnels located at the top of the group were less affected by the excavation sequence than the lower tunnels. The extreme point on the plane P4 was most significantly affected by the excavation sequence.
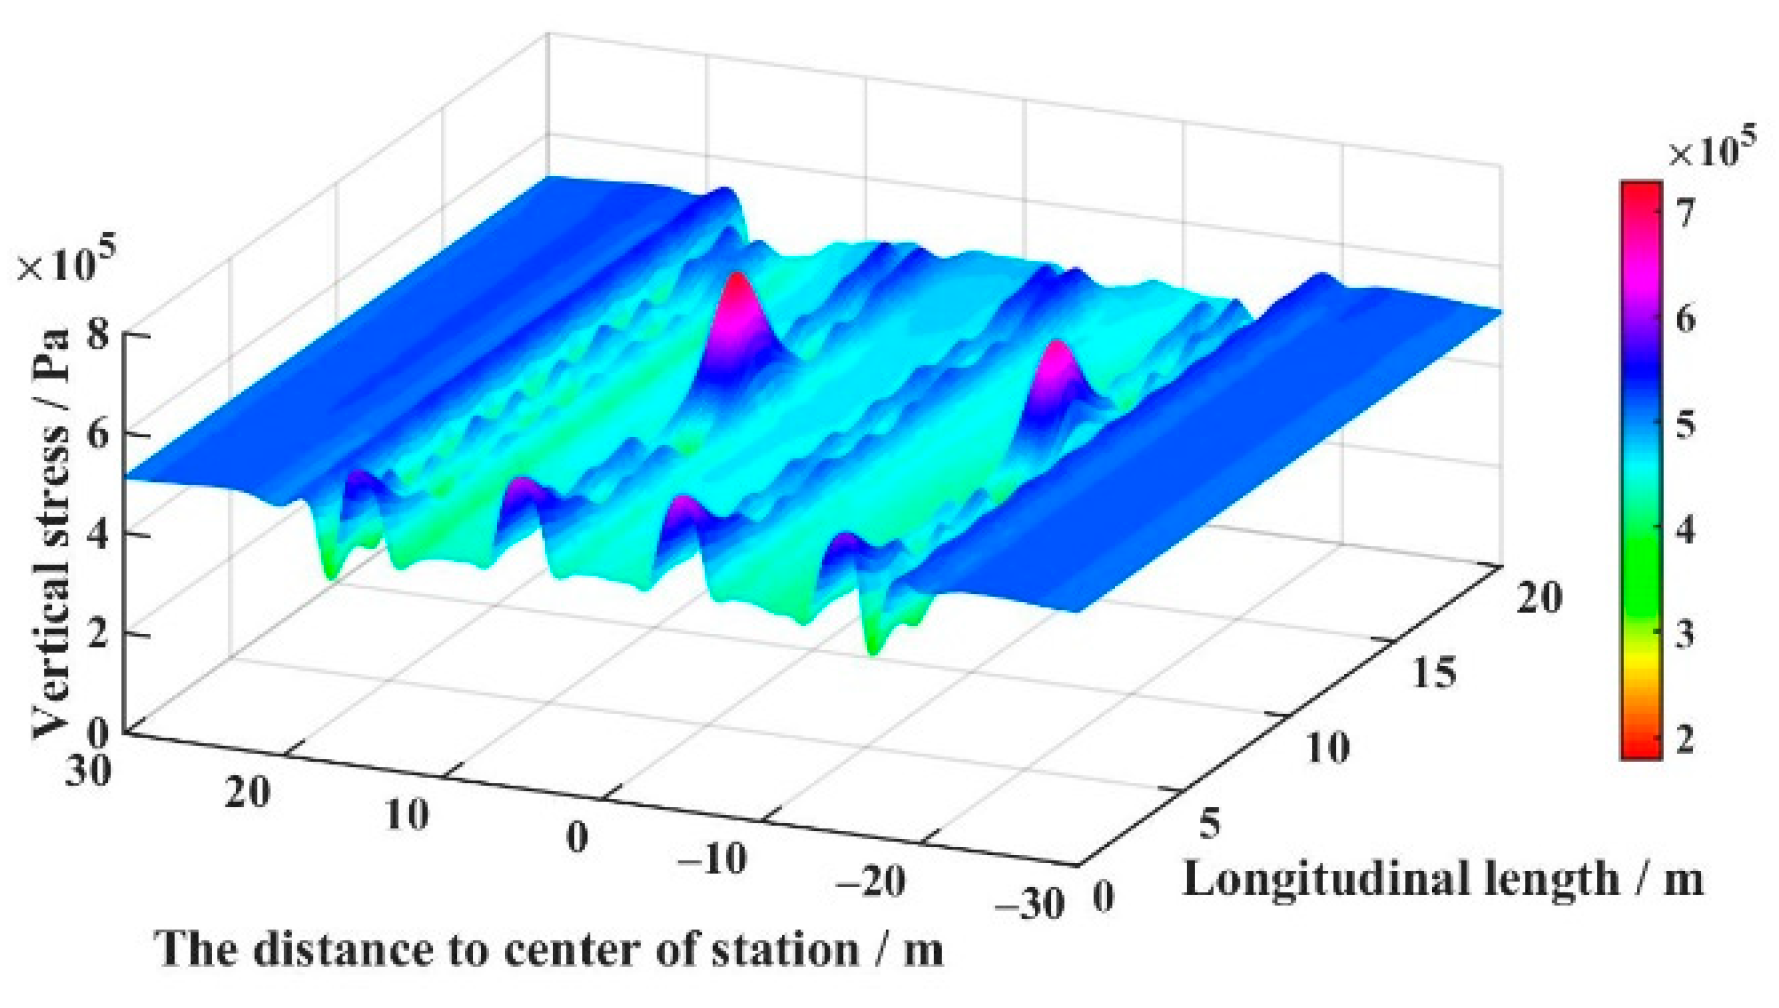
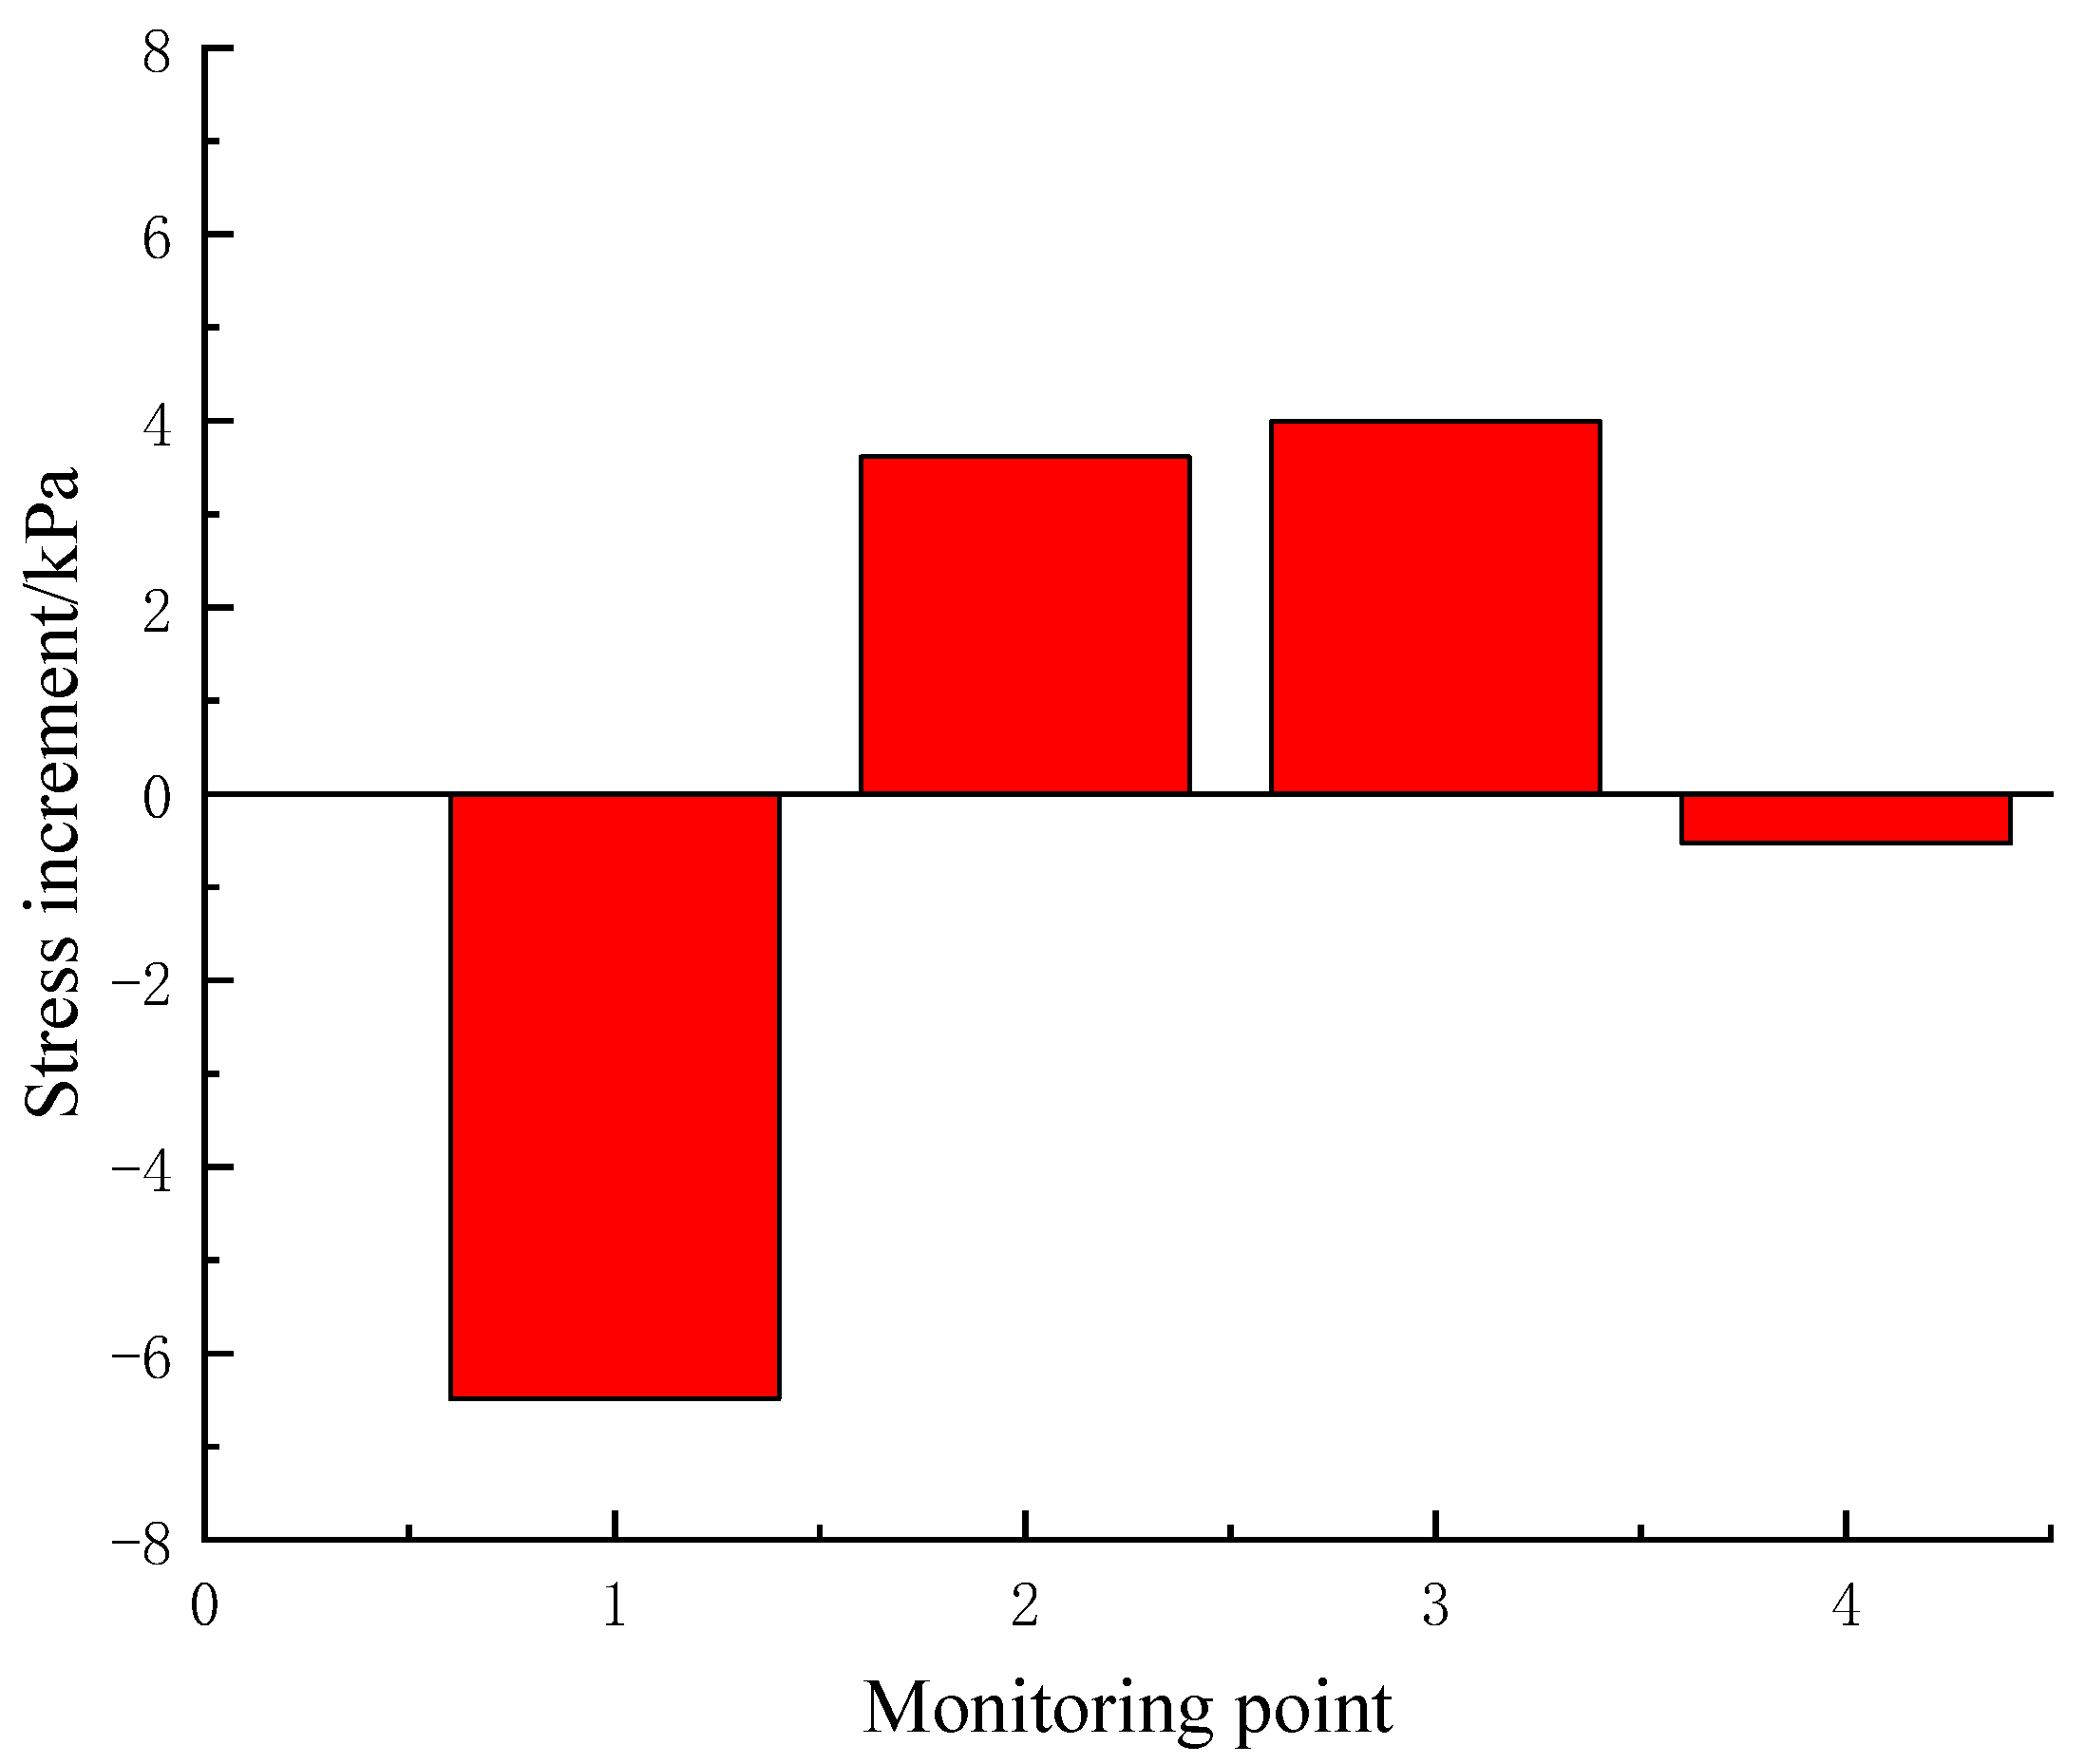
- In the model, the stress-monitoring results show that the stress at each monitoring point increases at both the tops of the pilot tunnels and between the bottoms of the tunnels, while it decreases at both the bottoms of the pilot tunnels and between the tops of the tunnels. Therefore, the model verified the numerical simulation results of the stress variation law.
Author Contributions
Funding
Institutional Review Board Statement
Informed Consent Statement
Data Availability Statement
Conflicts of Interest
References
- Liu, W.; Luo, F.; Mei, J. A new construction method for a metro station in Beijing. Tunn. Undergr. Space Technol. 2000, 15, 409–413. [Google Scholar] [CrossRef]
- Fang, Q.; Zhang, D.; Wong, L.N.Y. Shallow tunneling method (STM) for subway station construction in soft ground. Tunn. Undergr. Space Technol. 2012, 29, 10–30. [Google Scholar] [CrossRef]
- Ocak, I. Control of surface settlements with umbrella arch method in second stage excavations of Istanbul Metro. Tunn. Undergr. Space Technol. 2008, 23, 674–681. [Google Scholar] [CrossRef]
- Chakeri, H.; Ozcelik, Y.; Unver, B. Effects of important factors on surface settlement prediction for metro tunnel excavated by EPB. Tunn. Undergr. Space Technol. 2013, 36, 14–23. [Google Scholar] [CrossRef]
- Sirivachiraporn, A.; Phienwej, N. Ground movements in EPB shield tunneling of Bangkok subway project and impacts on adjacent buildings. Tunn. Undergr. Space Technol. 2012, 30, 10–24. [Google Scholar] [CrossRef]
- Weng, W. Study on Falsework about PBA Method in Underground Passage. J. Hunan City Univ. (Nat. Sci.) 2011, 20, 14–16. [Google Scholar] [CrossRef]
- Li, B.; Wang, Z. Numerical study on the response of ground movements to construction activities of a metro station using the pile-beam-arch method. Tunn. Undergr. Space Technol. 2019, 88, 209–220. [Google Scholar] [CrossRef]
- Huang, R. PBA Method Applied in the Construction of Arch in Subway Station. Chin. J. Undergr. Space Eng. 2007, 2, 268–271. [Google Scholar] [CrossRef]
- Li, X. Numerical Simulation on PBA Job Practice of Metro Station. Chin. J. Undergr. Space Eng. 2007, 5, 928–932. [Google Scholar] [CrossRef]
- Zhao, W.; Geng, D.; Dong, Z.; Zhou, Y. Analysis on Numerical Simulation of Heading Pilot′s Excavation in Subway Station. J. Shenyang Jianzhu Univ. (Nat. Sci.) 2010, 26, 855–858. [Google Scholar] [CrossRef]
- Guo, X.; Jiang, A.; Wang, S.; Gui, Y. Study on the Applicability of an Improved Pile-Beam-Arch Method of Metro Station Construction in the Upper-Soft and Lower-Hard Stratum. Adv. Civ. Eng. 2021, 2021, 6615016. [Google Scholar] [CrossRef]
- Yu, L.; Zhang, D.; Fang, Q.; Cao, L.; Xu, T.; Li, Q. Surface settlement of subway station construction using pile-beam-arch approach. Tunn. Undergr. Space Technol. 2019, 90, 340–356. [Google Scholar] [CrossRef]
- Jia, S. Analysis on Procedural Ground Settlement of Metro Station Constructed by PBA Method. Railw. Constr. Technol. 2018, 11, 72–76. [Google Scholar] [CrossRef]
- Xu, Y.; Yu, P. Discussion on the Settlement Law of PBA Metro Station Based on Tubular Roof Method. Railw. Stand. Des. 2019, 63, 130–136. [Google Scholar] [CrossRef]
- Li, J.; Chen, P. Comparative Analysis of Group Cave Effect in Construction of Subway Station by Pile-beam-arch (PBA) Method. Sci. Technol. Eng. 2020, 20, 5737–5742. [Google Scholar] [CrossRef]
- Wang, Y. Settlement Analysis Caused by Excavation on Sequence of Pilot Tunnel with PBA Method. Spec. Struct. 2016, 33, 10–13. [Google Scholar] [CrossRef]
- Ren, J.-x.; Cao, X. Research on the Surface Settlement of Subway Station Induced by PBA Construction Method. J. Railw. Eng. Soc. 2018, 35, 88–92. [Google Scholar] [CrossRef]
- Liu, X.; Liu, Y.; Yang, Z.; He, C. Numerical analysis on the mechanical performance of supporting structures and ground settlement characteristics in construction process of subway station built by Pile-Beam-Arch method. KSCE. J. Civ. Eng. 2017, 21, 1690–1705. [Google Scholar] [CrossRef]
- Ji, W.; Huang, B. Influence of Double Connecting Tunnel and Bidirectional Pilot Tunnel Construction of the Pile-Beam-Arch Method on Surface Settlement. J. Anhui Univ. Sci. Technol. (Nat. Sci.) 2020, 40, 21–26. [Google Scholar] [CrossRef]
- Shan, R.; Huang, B. The Comparison and Selection of Schemes on Pilot Tunnels’ Bidirectional Excavation in Metro Stations Constructed by PBA Method. J. Shenyang Jianzhu Univ. (Nat. Sci.) 2016, 32, 200–208. [Google Scholar] [CrossRef]


| Items | Elastic Modulus E/MPa | Poisson’s Ratio | Cohesion c/kPa | Internal Friction Angle/(°) | Density/(kg·m−3) | Bulk Modulus/MPa | Shear Modulus/MPa |
|---|---|---|---|---|---|---|---|
| artificial soil | 23 | 0.3 | 10 | 18 | 1950 | 19.17 | 8.85 |
| pebble bed 1 | 63 | 0.25 | 0.5 | 40 | 2070 | 42 | 25.2 |
| pebble bed 2 | 75 | 0.23 | 0.8 | 32 | 2000 | 32.5 | 30.5 |
| strongly weathered conglomerate and mudstone | 105 | 0.26 | 0 | 35 | 2150 | 72.9 | 41.7 |
| grid steel frame | 25,000 | 0.3 | 2300 |
| Scheme | Stress Concentration Factor | |||
|---|---|---|---|---|
| P1 | P2 | P3 | P4 | |
| Scheme 1 (S-2-3-1-4-6-7-5-8) | 1.254 | 1.211 | 1.264 | 1.106 |
| Scheme 2 (S-1-4-2-3-5-8-6-7) | 1.255 | 1.213 | 1.257 | 1.148 |
| Scheme 3 (S-1-3-2-4-5-7-6-8) | 1.255 | 1.214 | 1.267 | 1.105 |
| Scheme 4 (D-23-14-67-58) | 1.254 | 1.211 | 1.260 | 1.104 |
| Scheme 5 (D-14-23-58-67) | 1.255 | 1.209 | 1.258 | 1.143 |
| Scheme | Coordinates of the Extreme Points | |||
|---|---|---|---|---|
| P1 | P2 | P3 | P4 | |
| Scheme 1 (S-2-3-1-4-6-7-5-8) | (2,16,4.5) | (2,13,0) | (0,−5,−8.3) | (20,−12,−12.8) |
| Scheme 2 (S-1-4-2-3-5-8-6-7) | (2,16,4.5) | (2,−13,0) | (0,−5,−8.3) | (20,−2,−12.8) |
| Scheme 3 (S-1-3-2-4-5-7-6-8) | (2,16,4.5) | (2,13,0) | (0,−5,−8.3) | (20,−12,−12.8) |
| Scheme 4 (D-23-14-67-58) | (2,16,4.5) | (2,13,0) | (0,−5,−8.3) | (20,12,−12.8) |
| Scheme 5 (D-14-23-58-67) | (2,16,4.5) | (2,13,0) | (0,−5,−8.3) | (20,2,−12.8) |
| Scheme 6 (D-13-24-57-68) | (2,16,4.5) | (2,13,0) | (10,5,−8.3) | (20,2,−12.8) |
| Similarity Ratio Items | Definition formulas | Values |
|---|---|---|
| 30 | ||
| 0.87 | ||
| 1 | ||
| 26.1 | ||
| 23,490 |
Publisher’s Note: MDPI stays neutral with regard to jurisdictional claims in published maps and institutional affiliations. |
© 2022 by the authors. Licensee MDPI, Basel, Switzerland. This article is an open access article distributed under the terms and conditions of the Creative Commons Attribution (CC BY) license (https://creativecommons.org/licenses/by/4.0/).
Share and Cite
Huang, B.; Du, Y.; Zeng, Y.; Cao, B.; Zou, Y.; Yu, Q. Study on Stress Field Distribution during the Construction of a Group of Tunnels Using the Pile–Beam–Arch Method. Buildings 2022, 12, 300. https://doi.org/10.3390/buildings12030300
Huang B, Du Y, Zeng Y, Cao B, Zou Y, Yu Q. Study on Stress Field Distribution during the Construction of a Group of Tunnels Using the Pile–Beam–Arch Method. Buildings. 2022; 12(3):300. https://doi.org/10.3390/buildings12030300
Chicago/Turabian StyleHuang, Bo, Yihan Du, Yu Zeng, Bing Cao, Yu Zou, and Qian Yu. 2022. "Study on Stress Field Distribution during the Construction of a Group of Tunnels Using the Pile–Beam–Arch Method" Buildings 12, no. 3: 300. https://doi.org/10.3390/buildings12030300