
Utilization of Polyurethane Foam Dust in Development of Thermal Insulation Composite

 ,
,  ,
,
Abstract
:1. Introduction
2. Materials and Methods
2.1. Materials
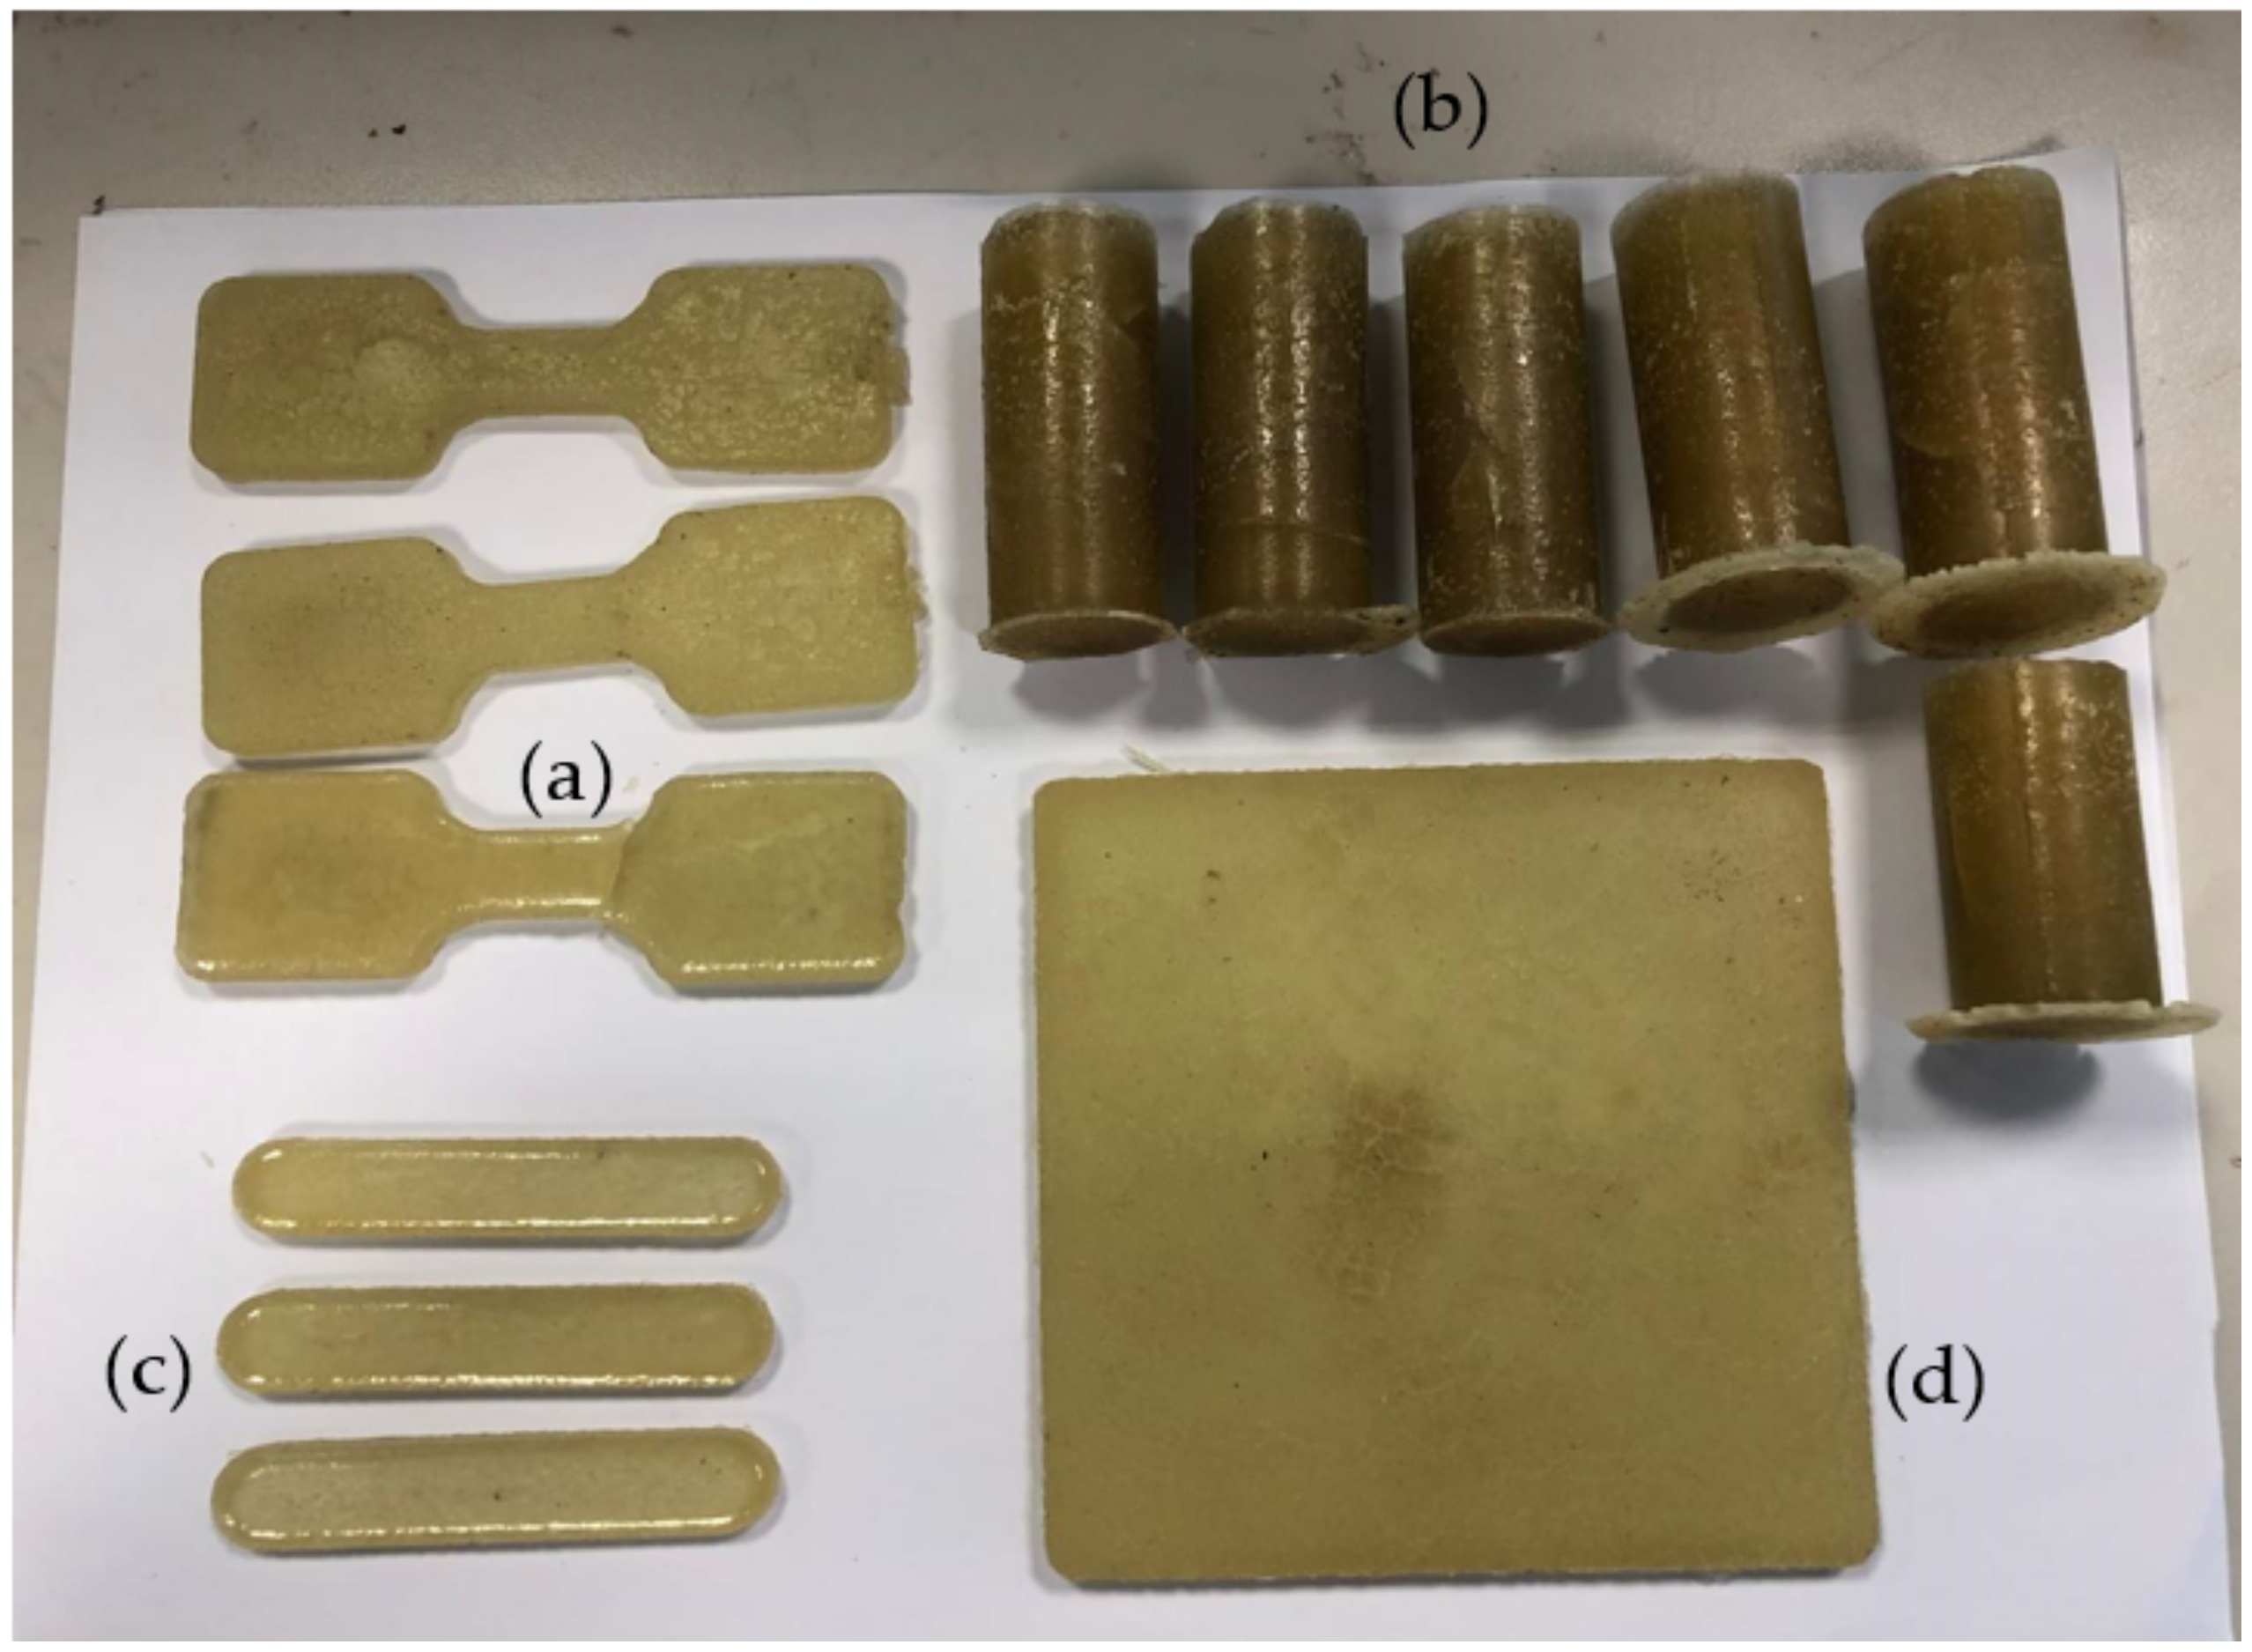
2.2. Composite Fabrication
2.3. Composite Characterization and Testing
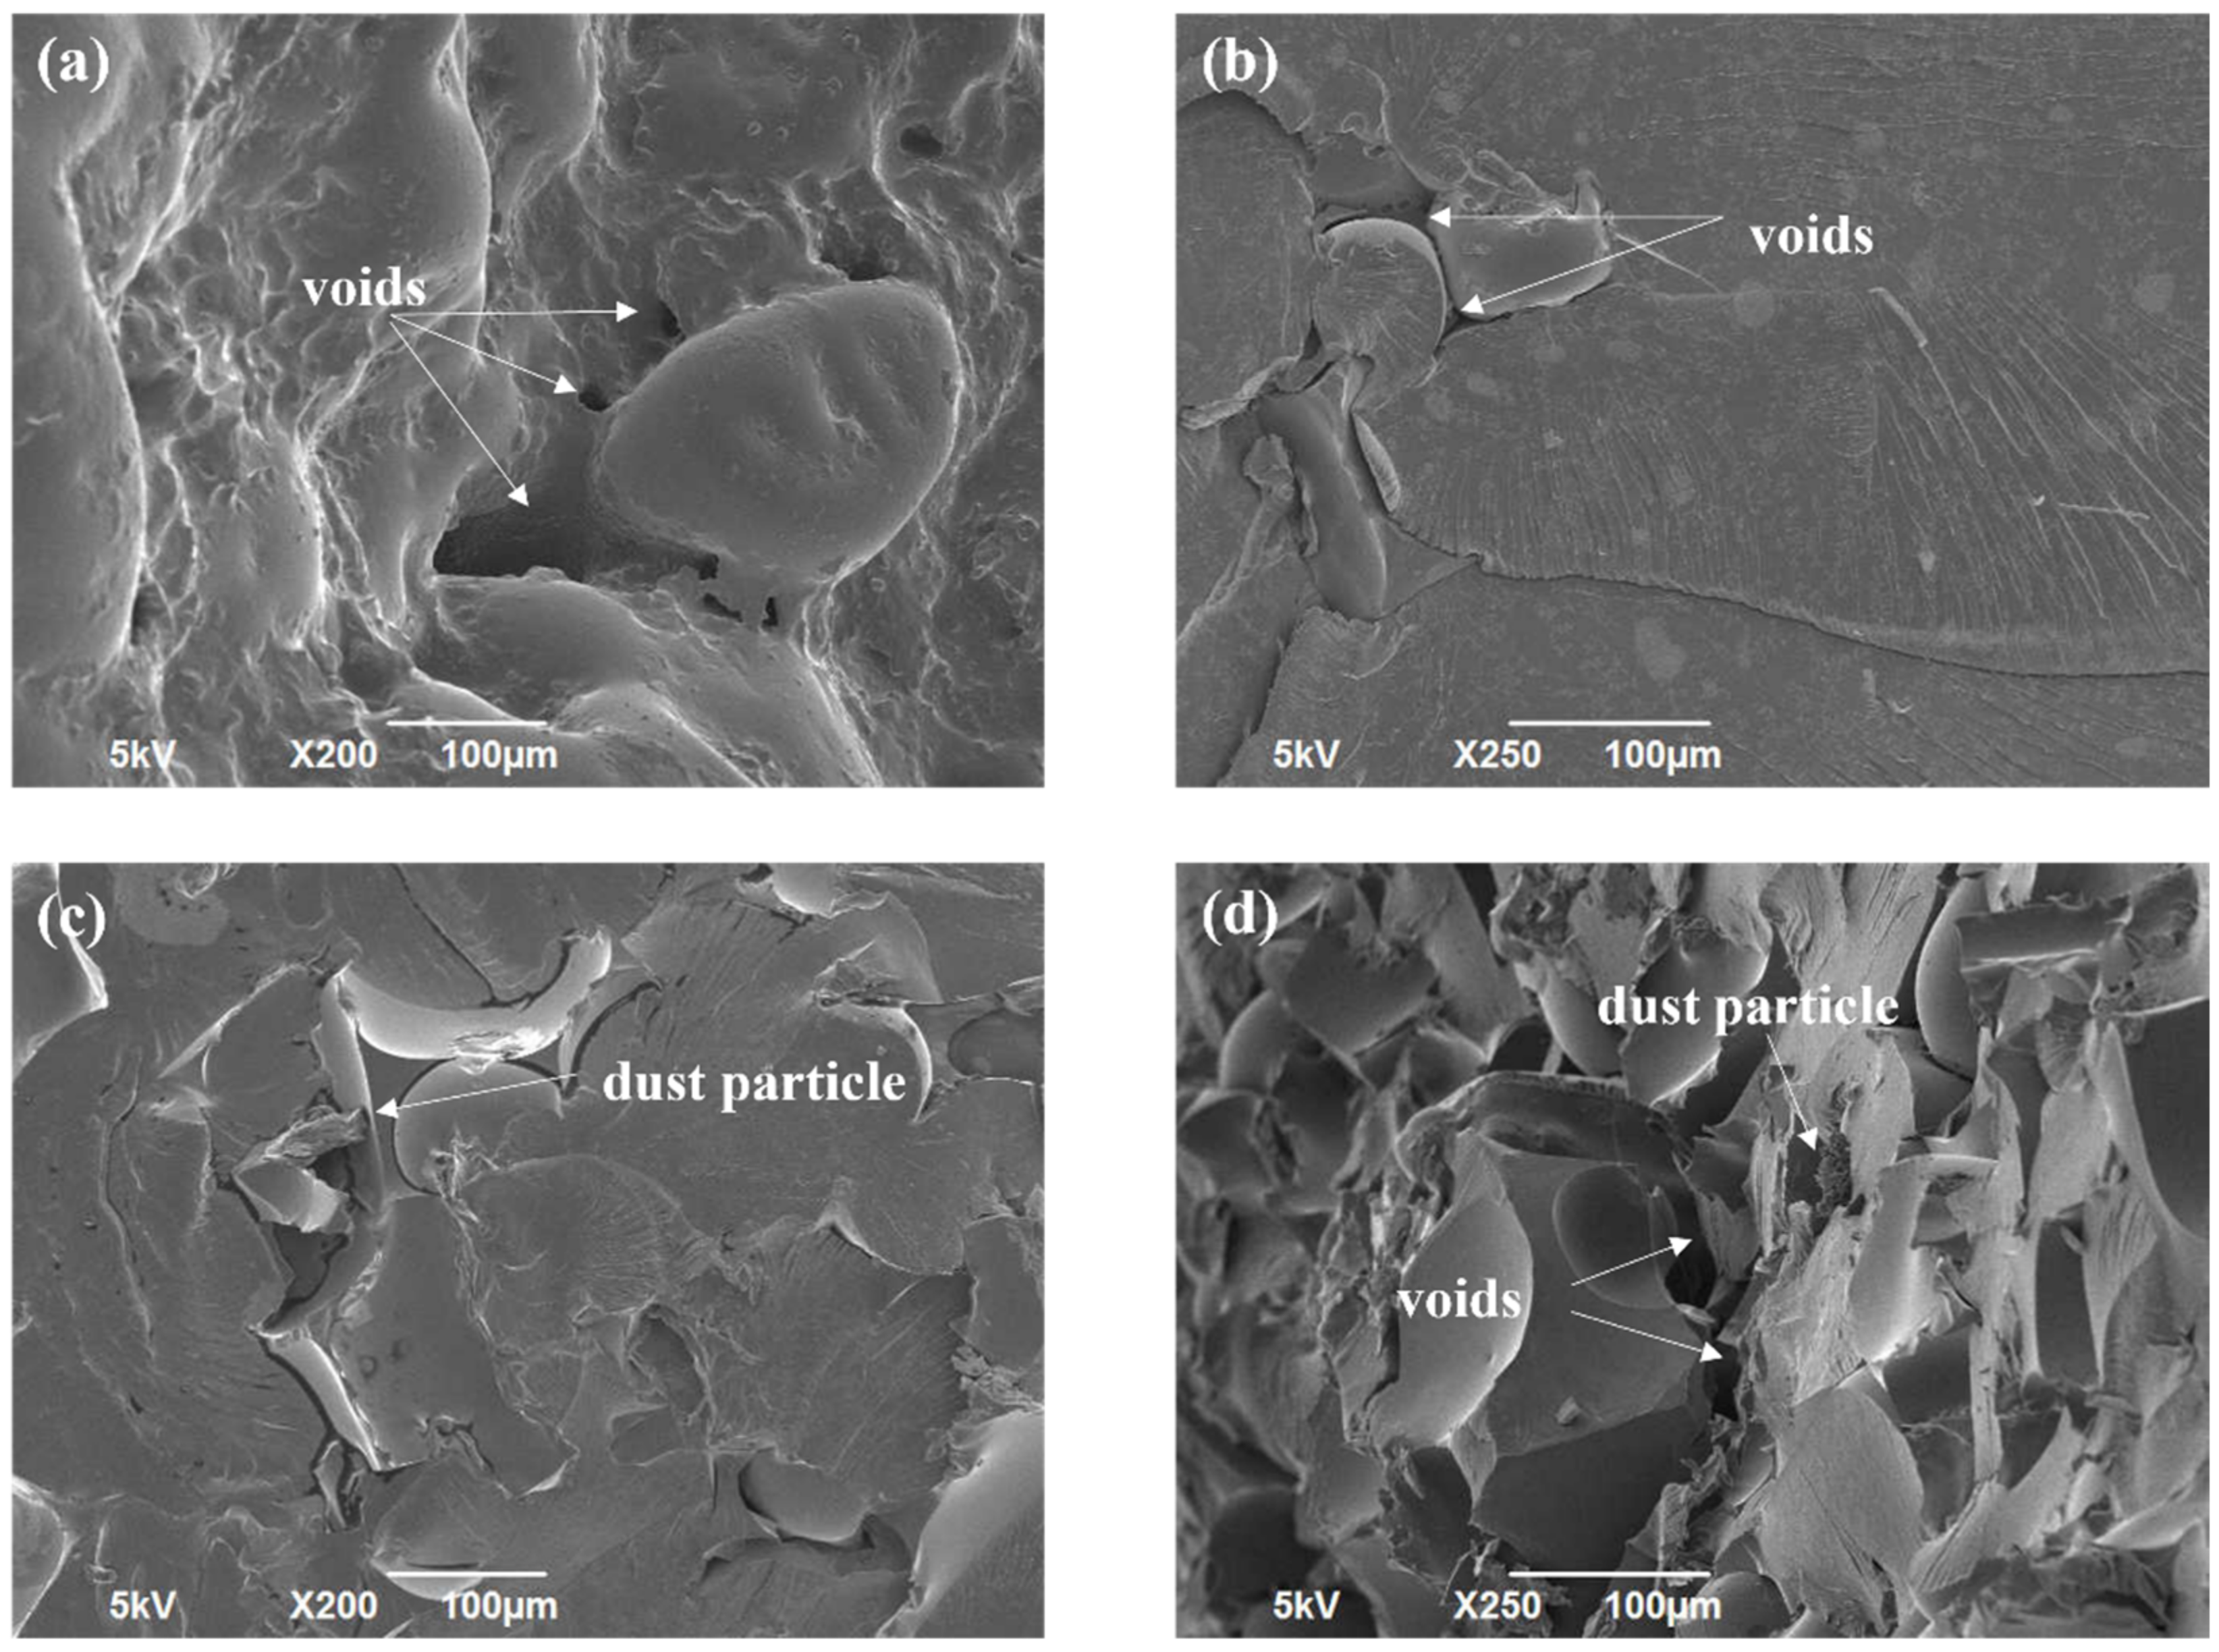
2.3.1. Scanning Electron Microscopy (SEM)
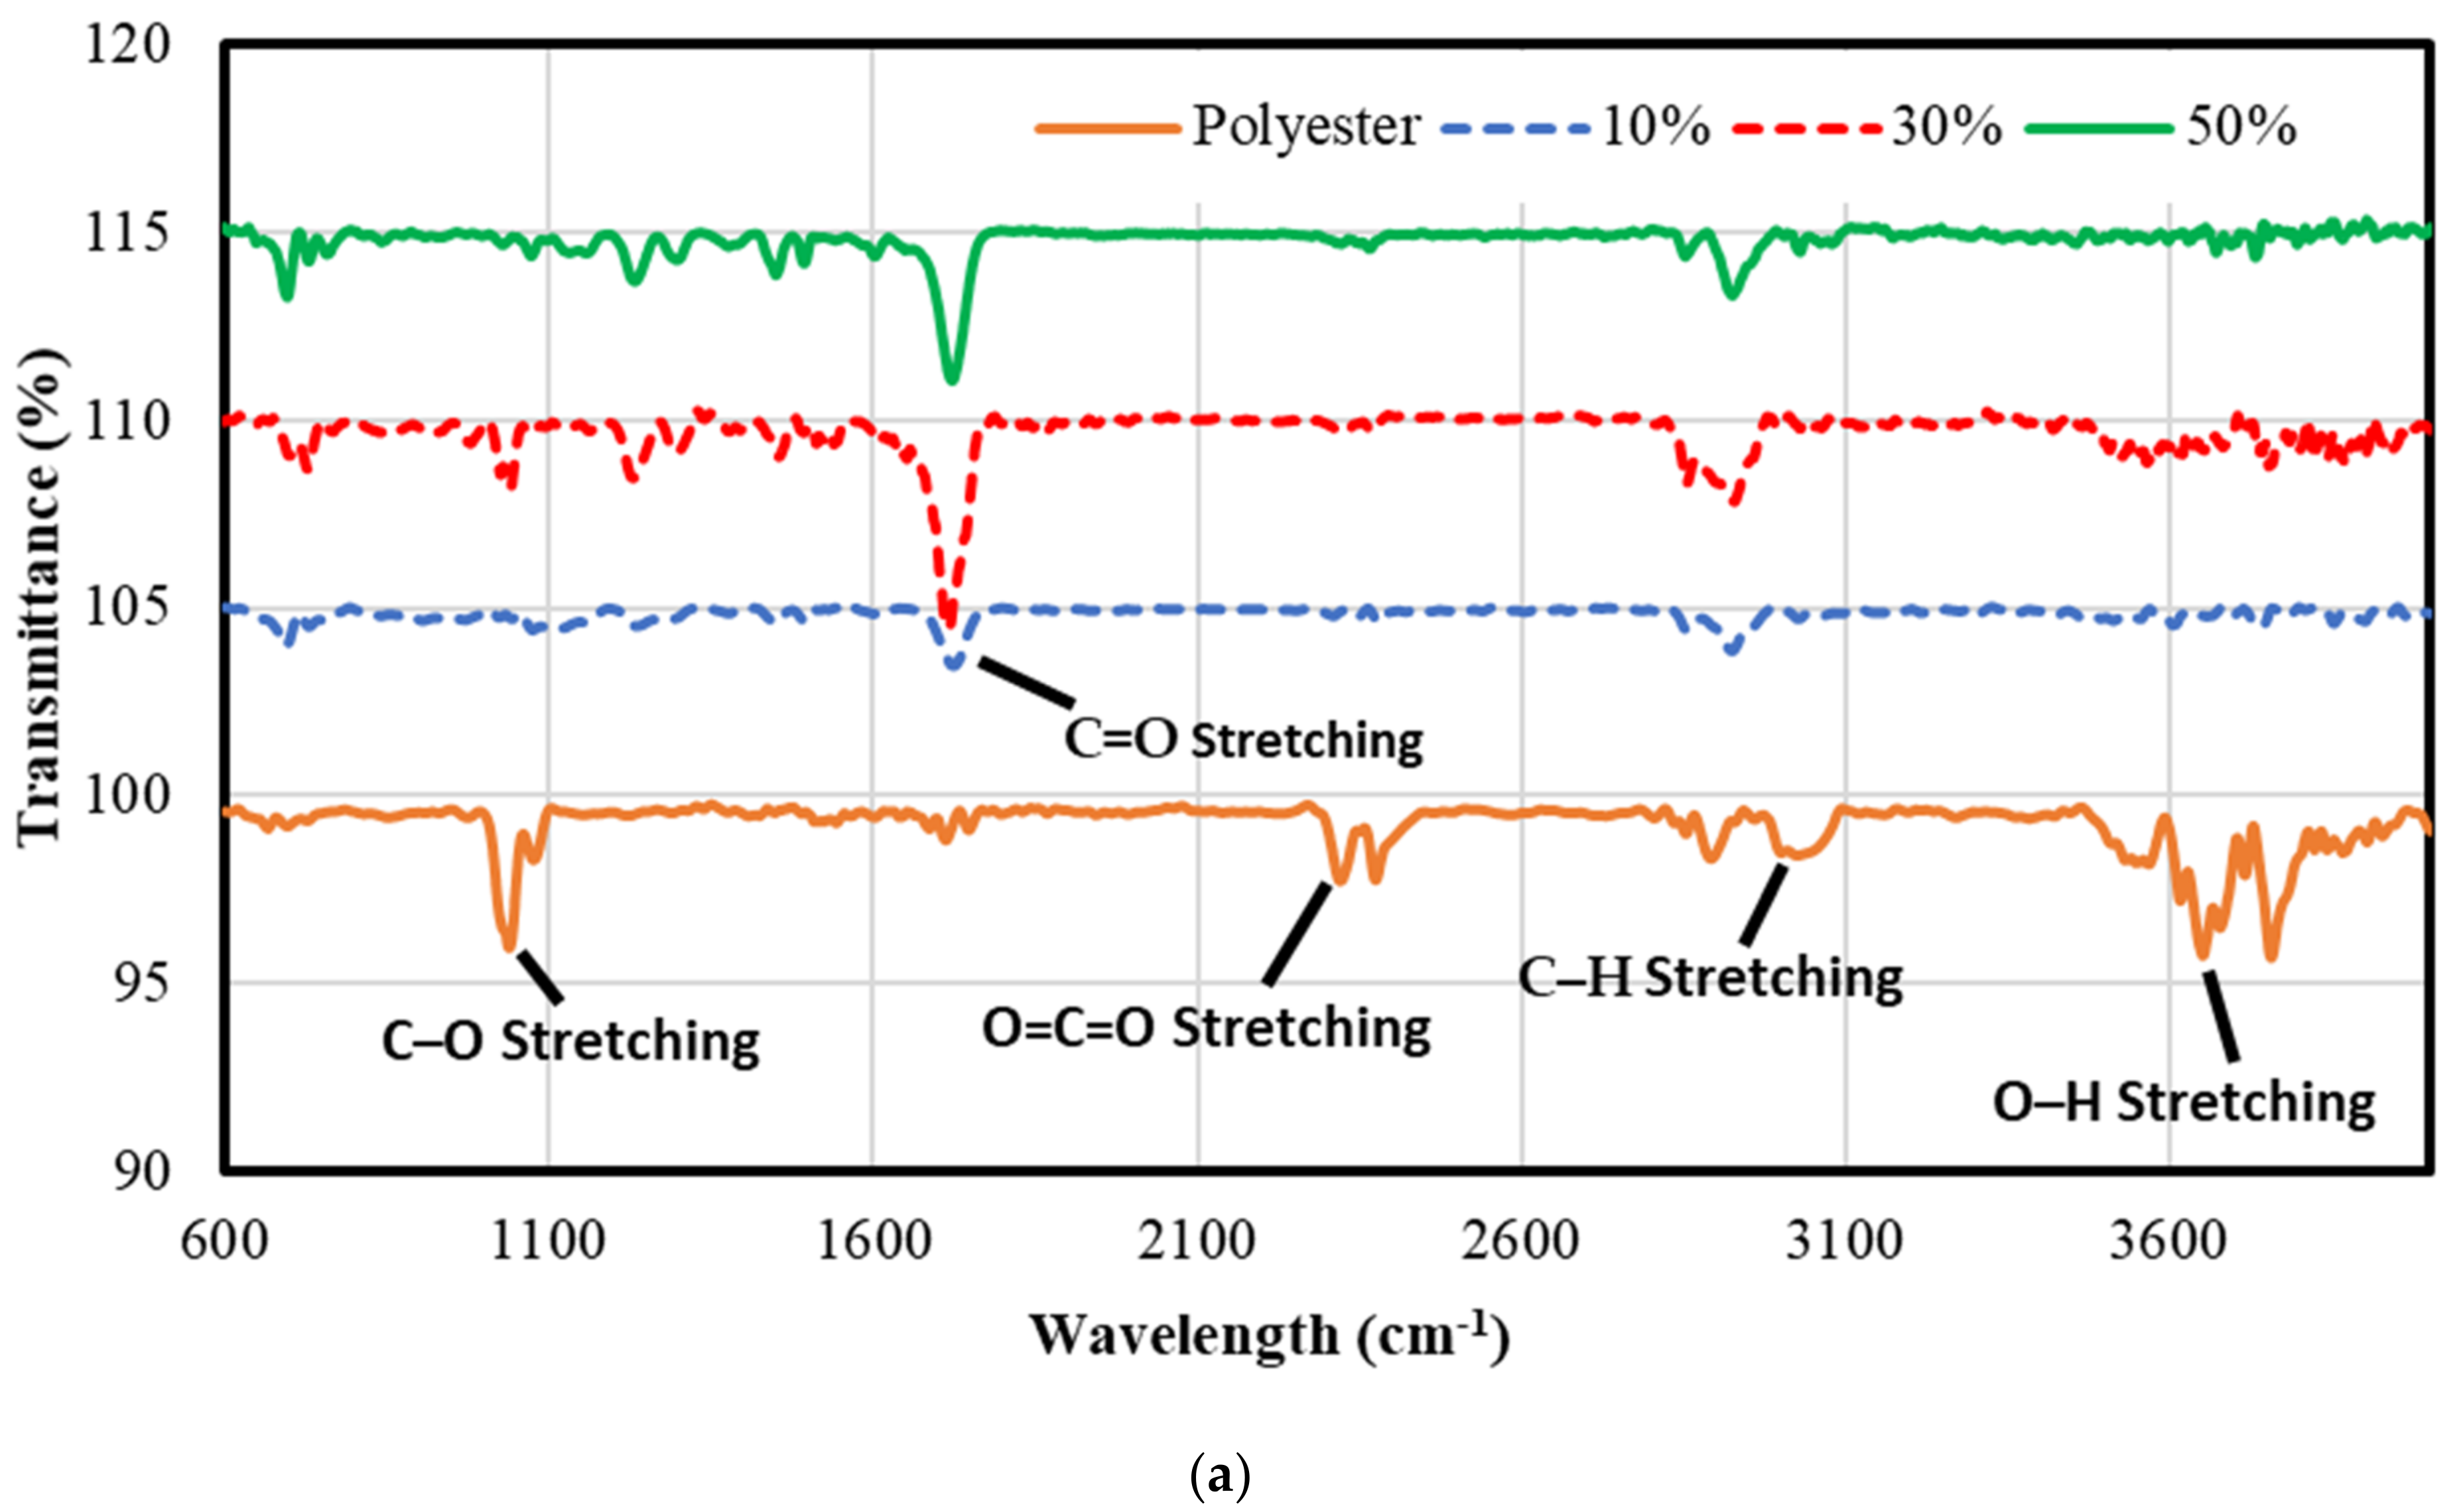
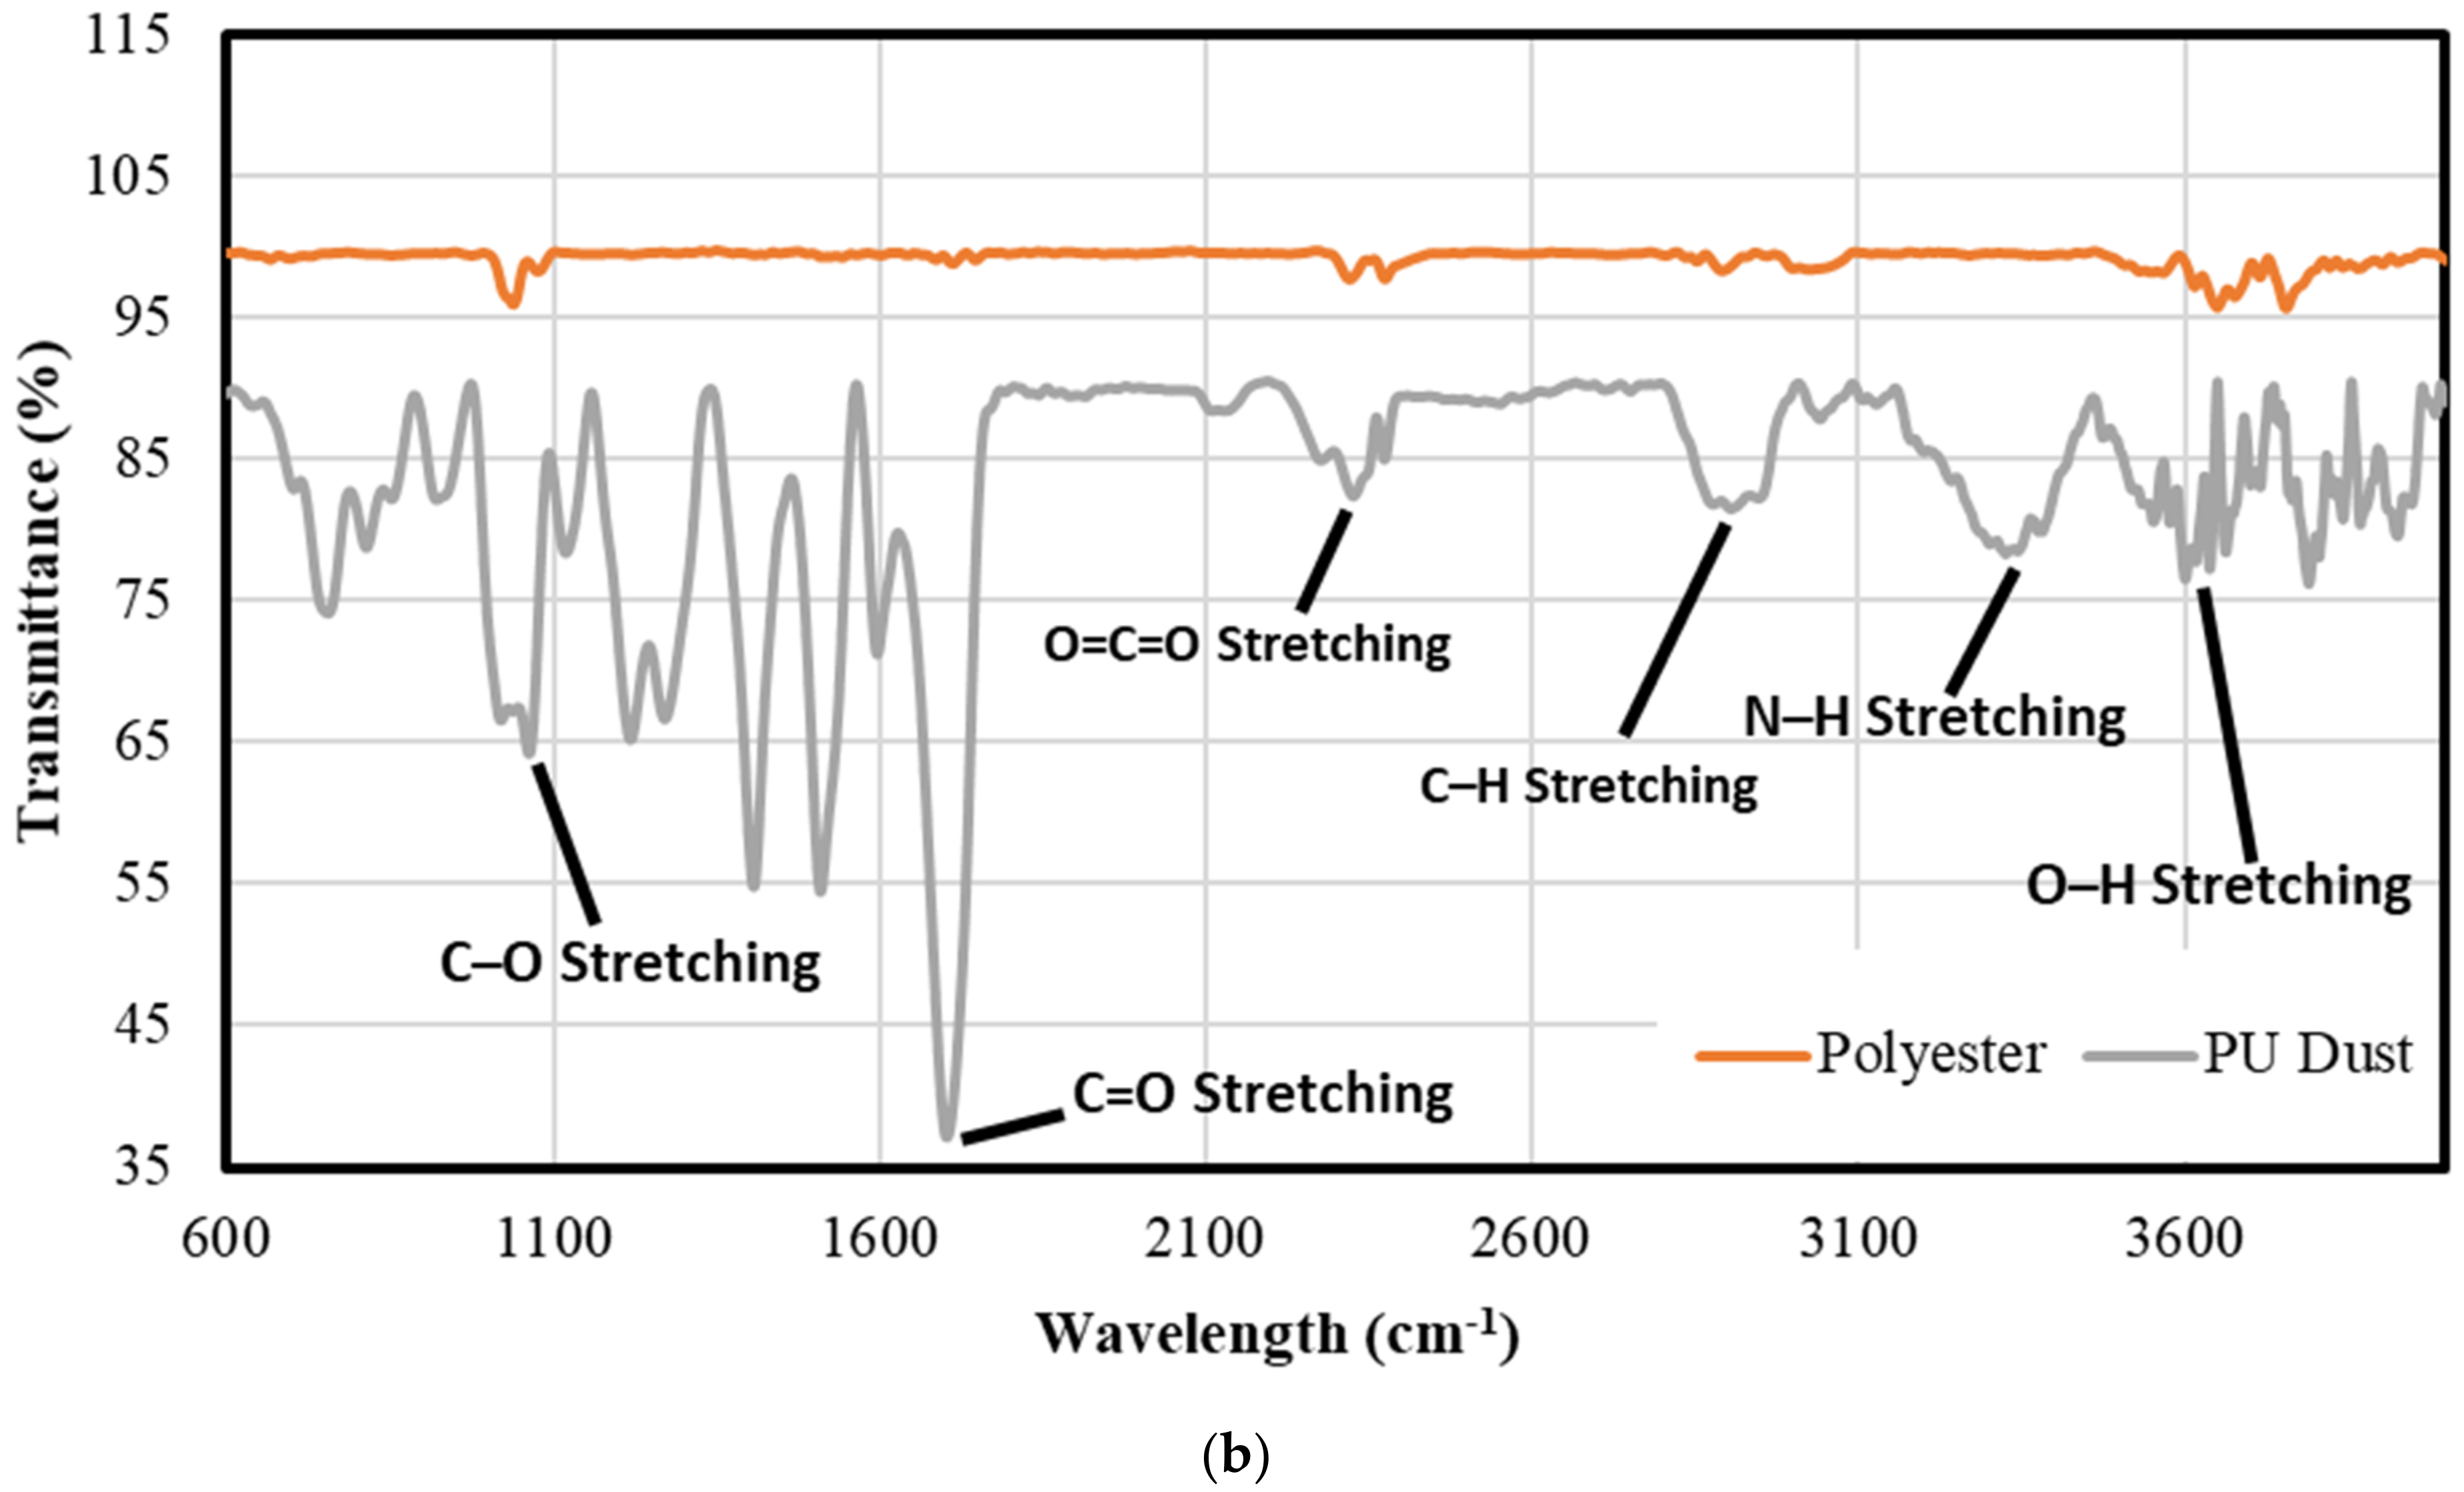
2.3.2. Fourier-Transform Infrared Spectroscopy (FTIR)
2.3.3. X-ray Diffraction (XRD)
2.3.4. Bulk Density
2.3.5. Thermal Conductivity Test
2.3.6. Differential Scanning Calorimeter (DSC)
2.3.7. Thermal Gravity Analysis (TGA)
2.3.8. Water Retention
2.3.9. Compressive and Tensile Strength Tests
3. Results and Discussion
3.1. Scanning Electron Microscopy (SEM) Analysis
3.2. FTIR Analysis
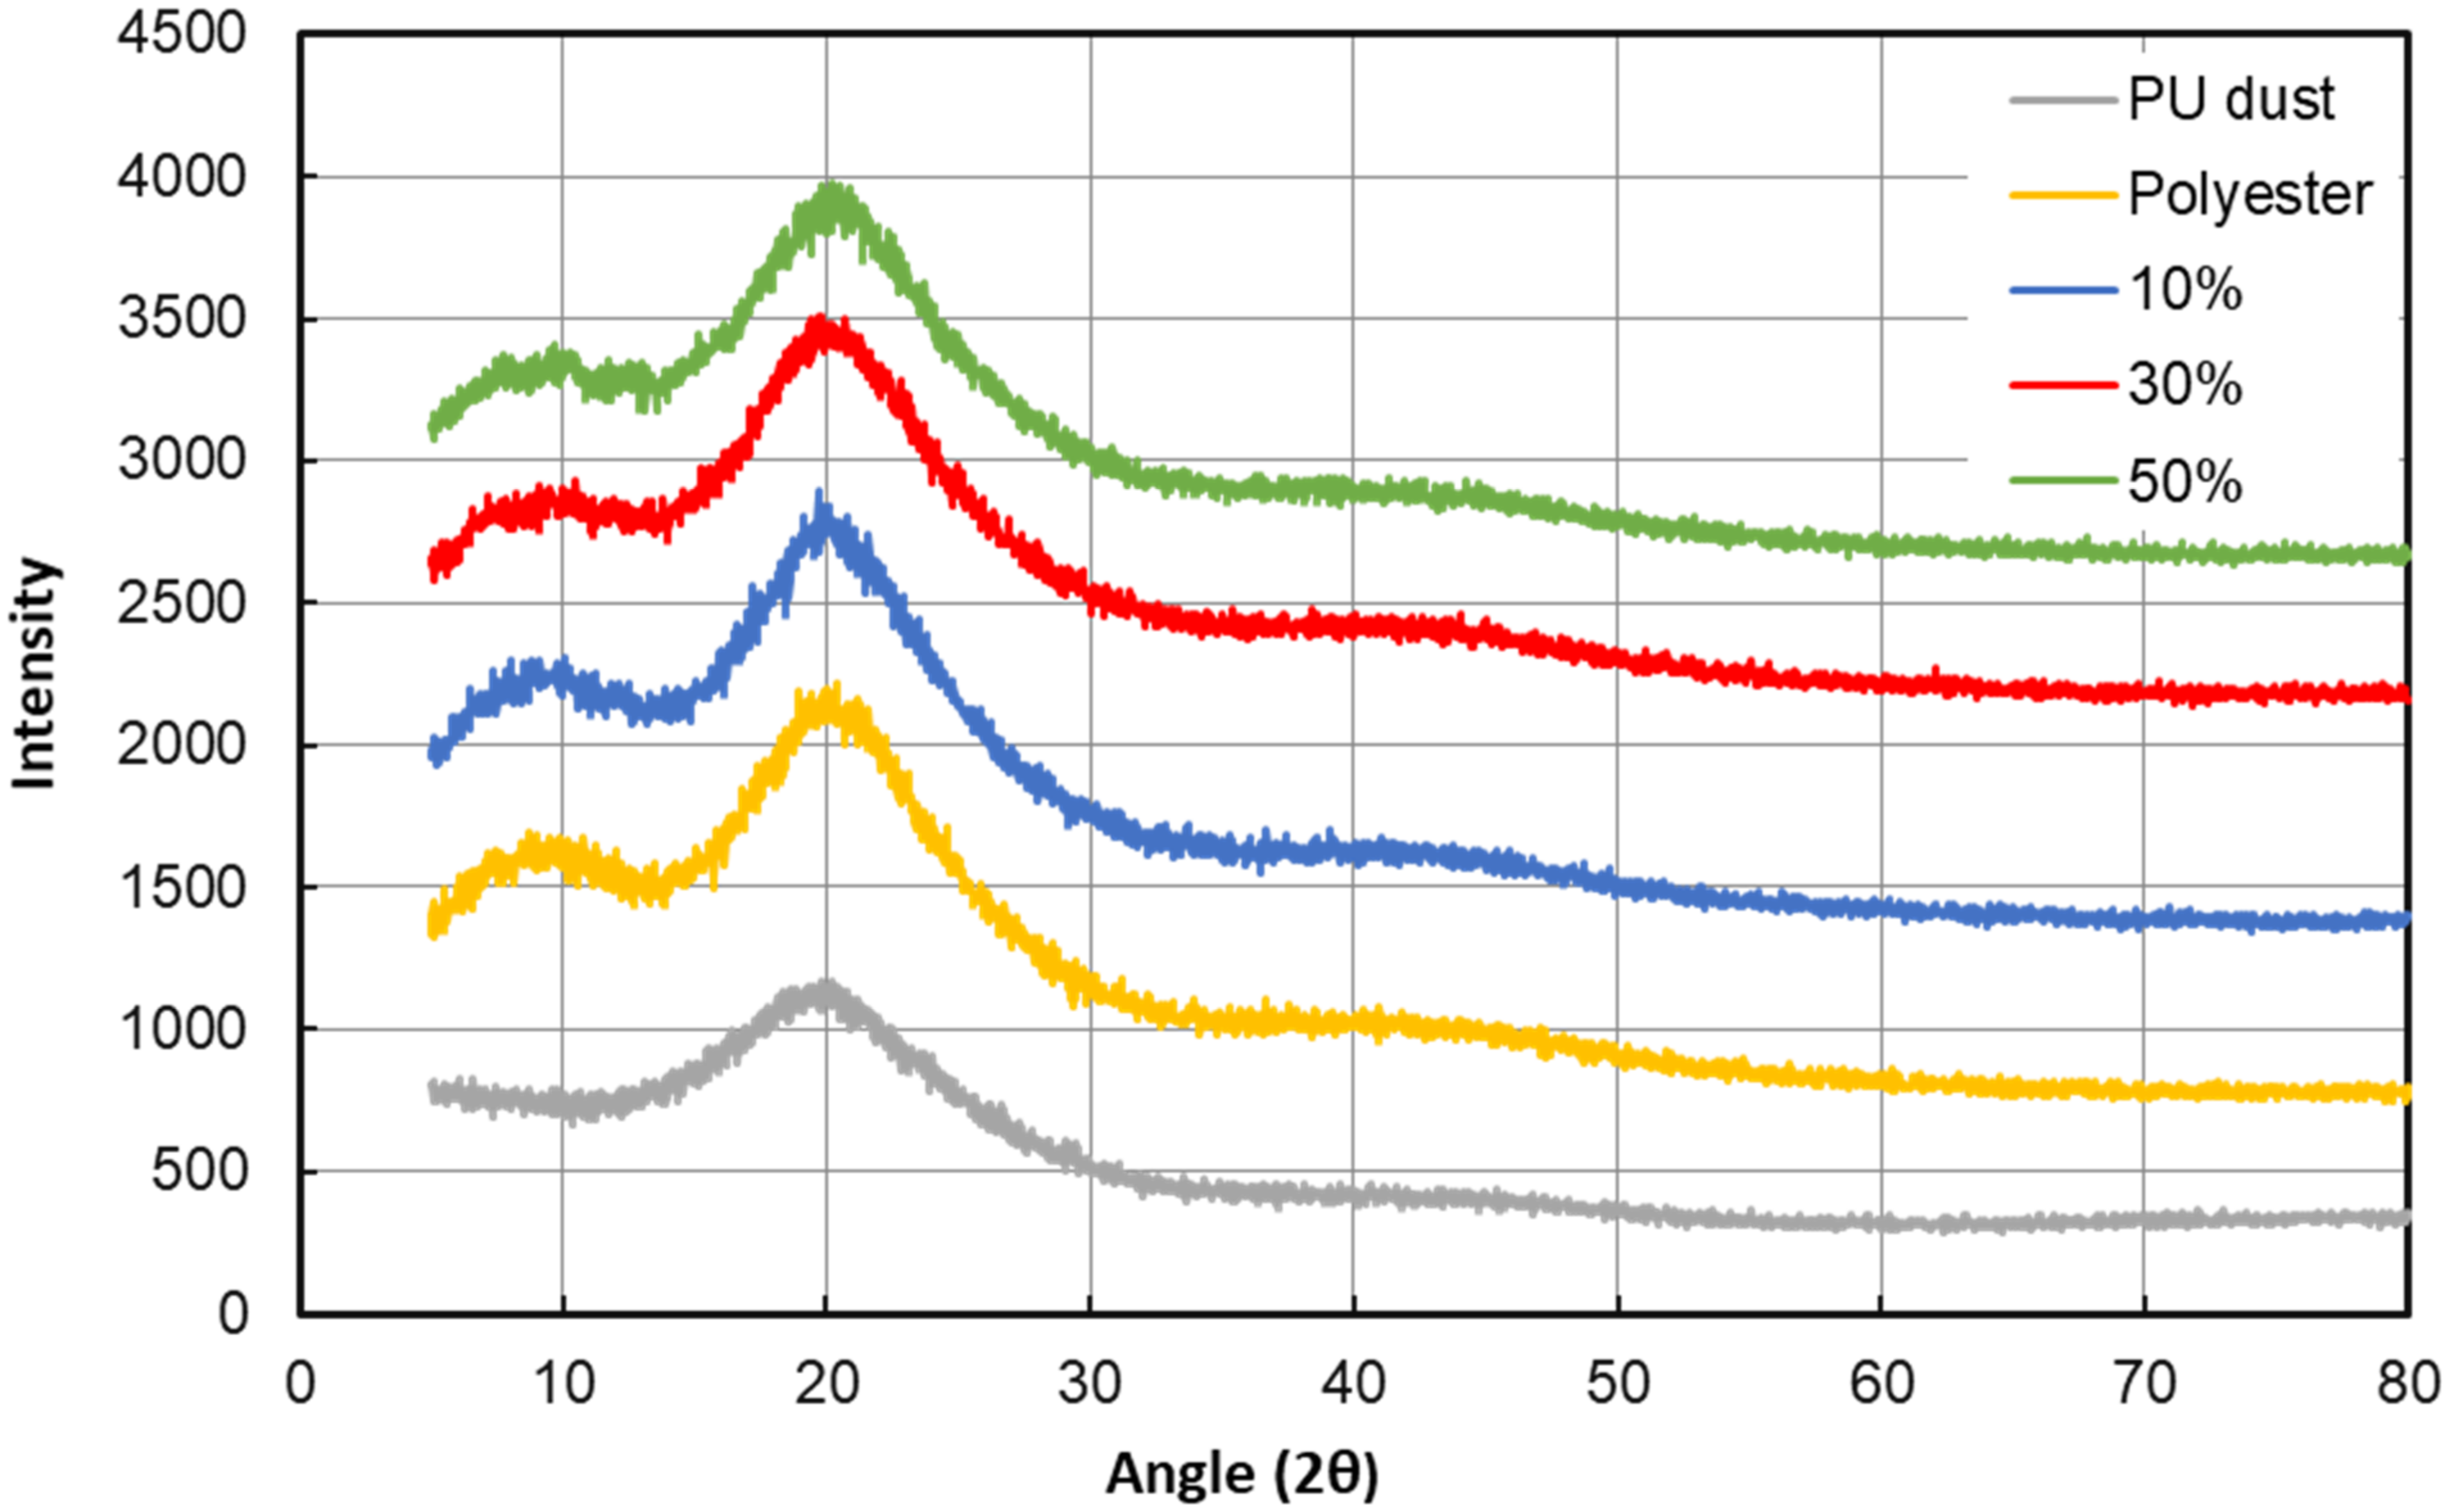
3.3. X-ray Diffraction Analysis (XRD)
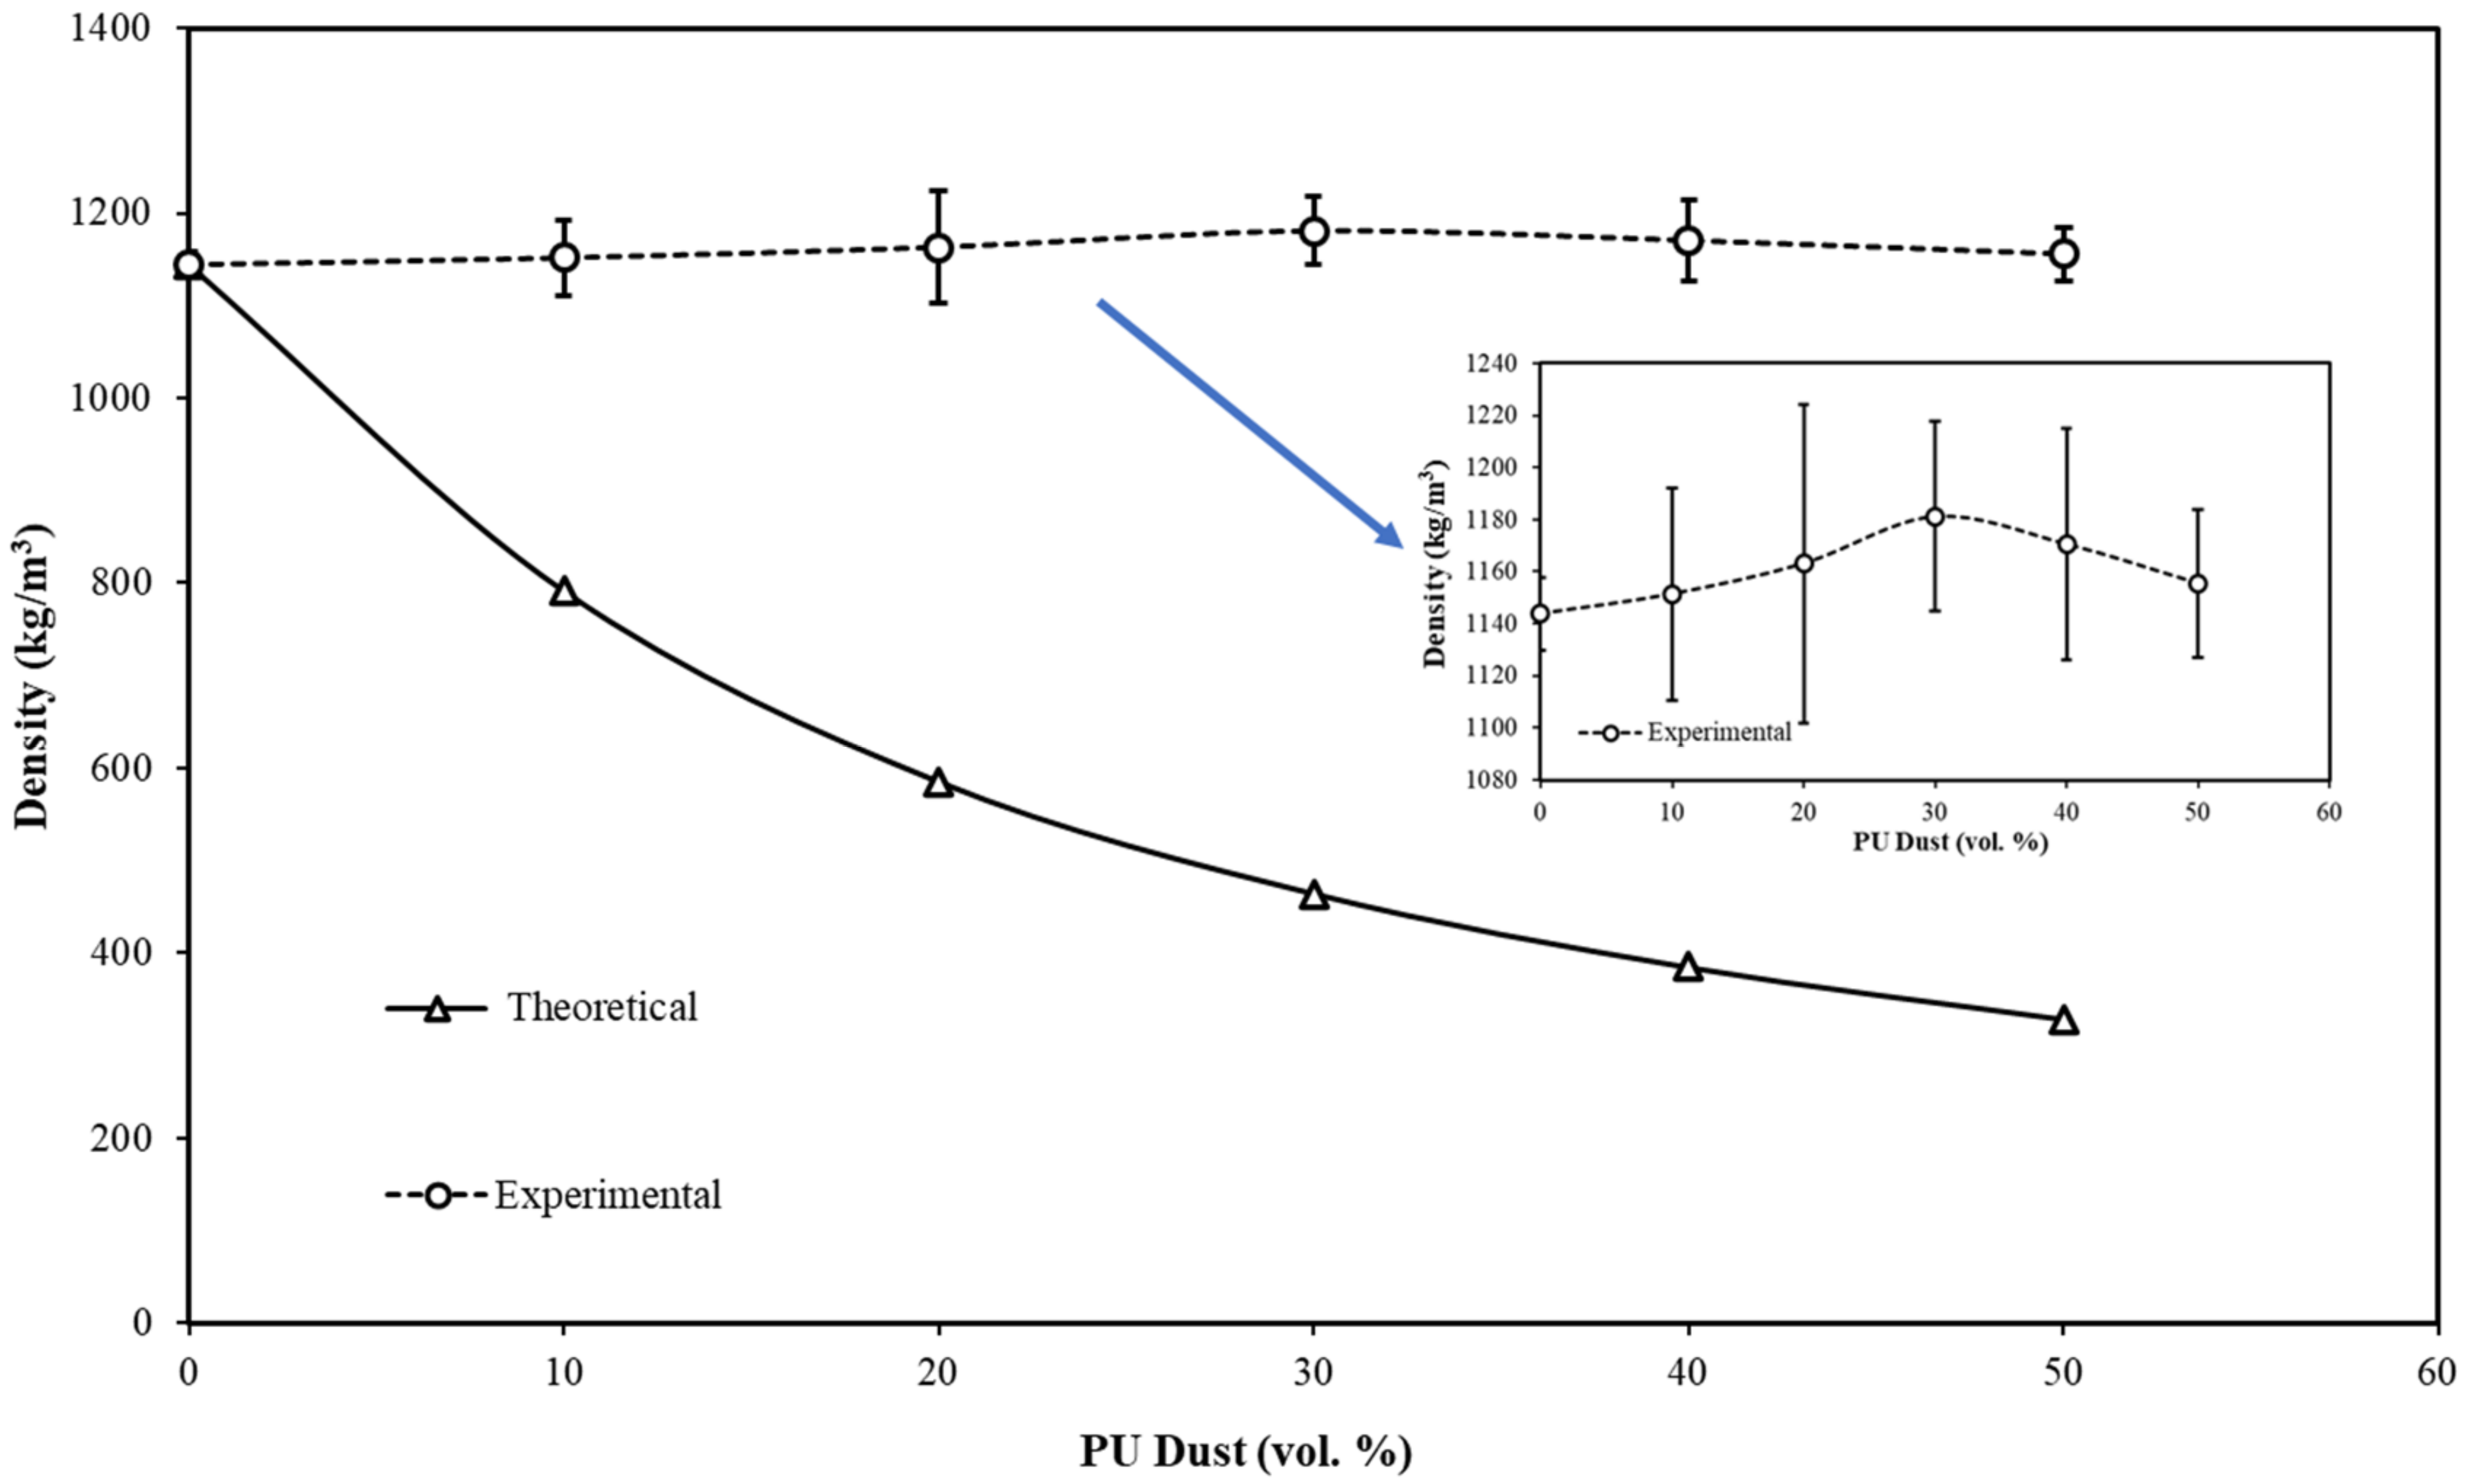
3.4. Composite Density
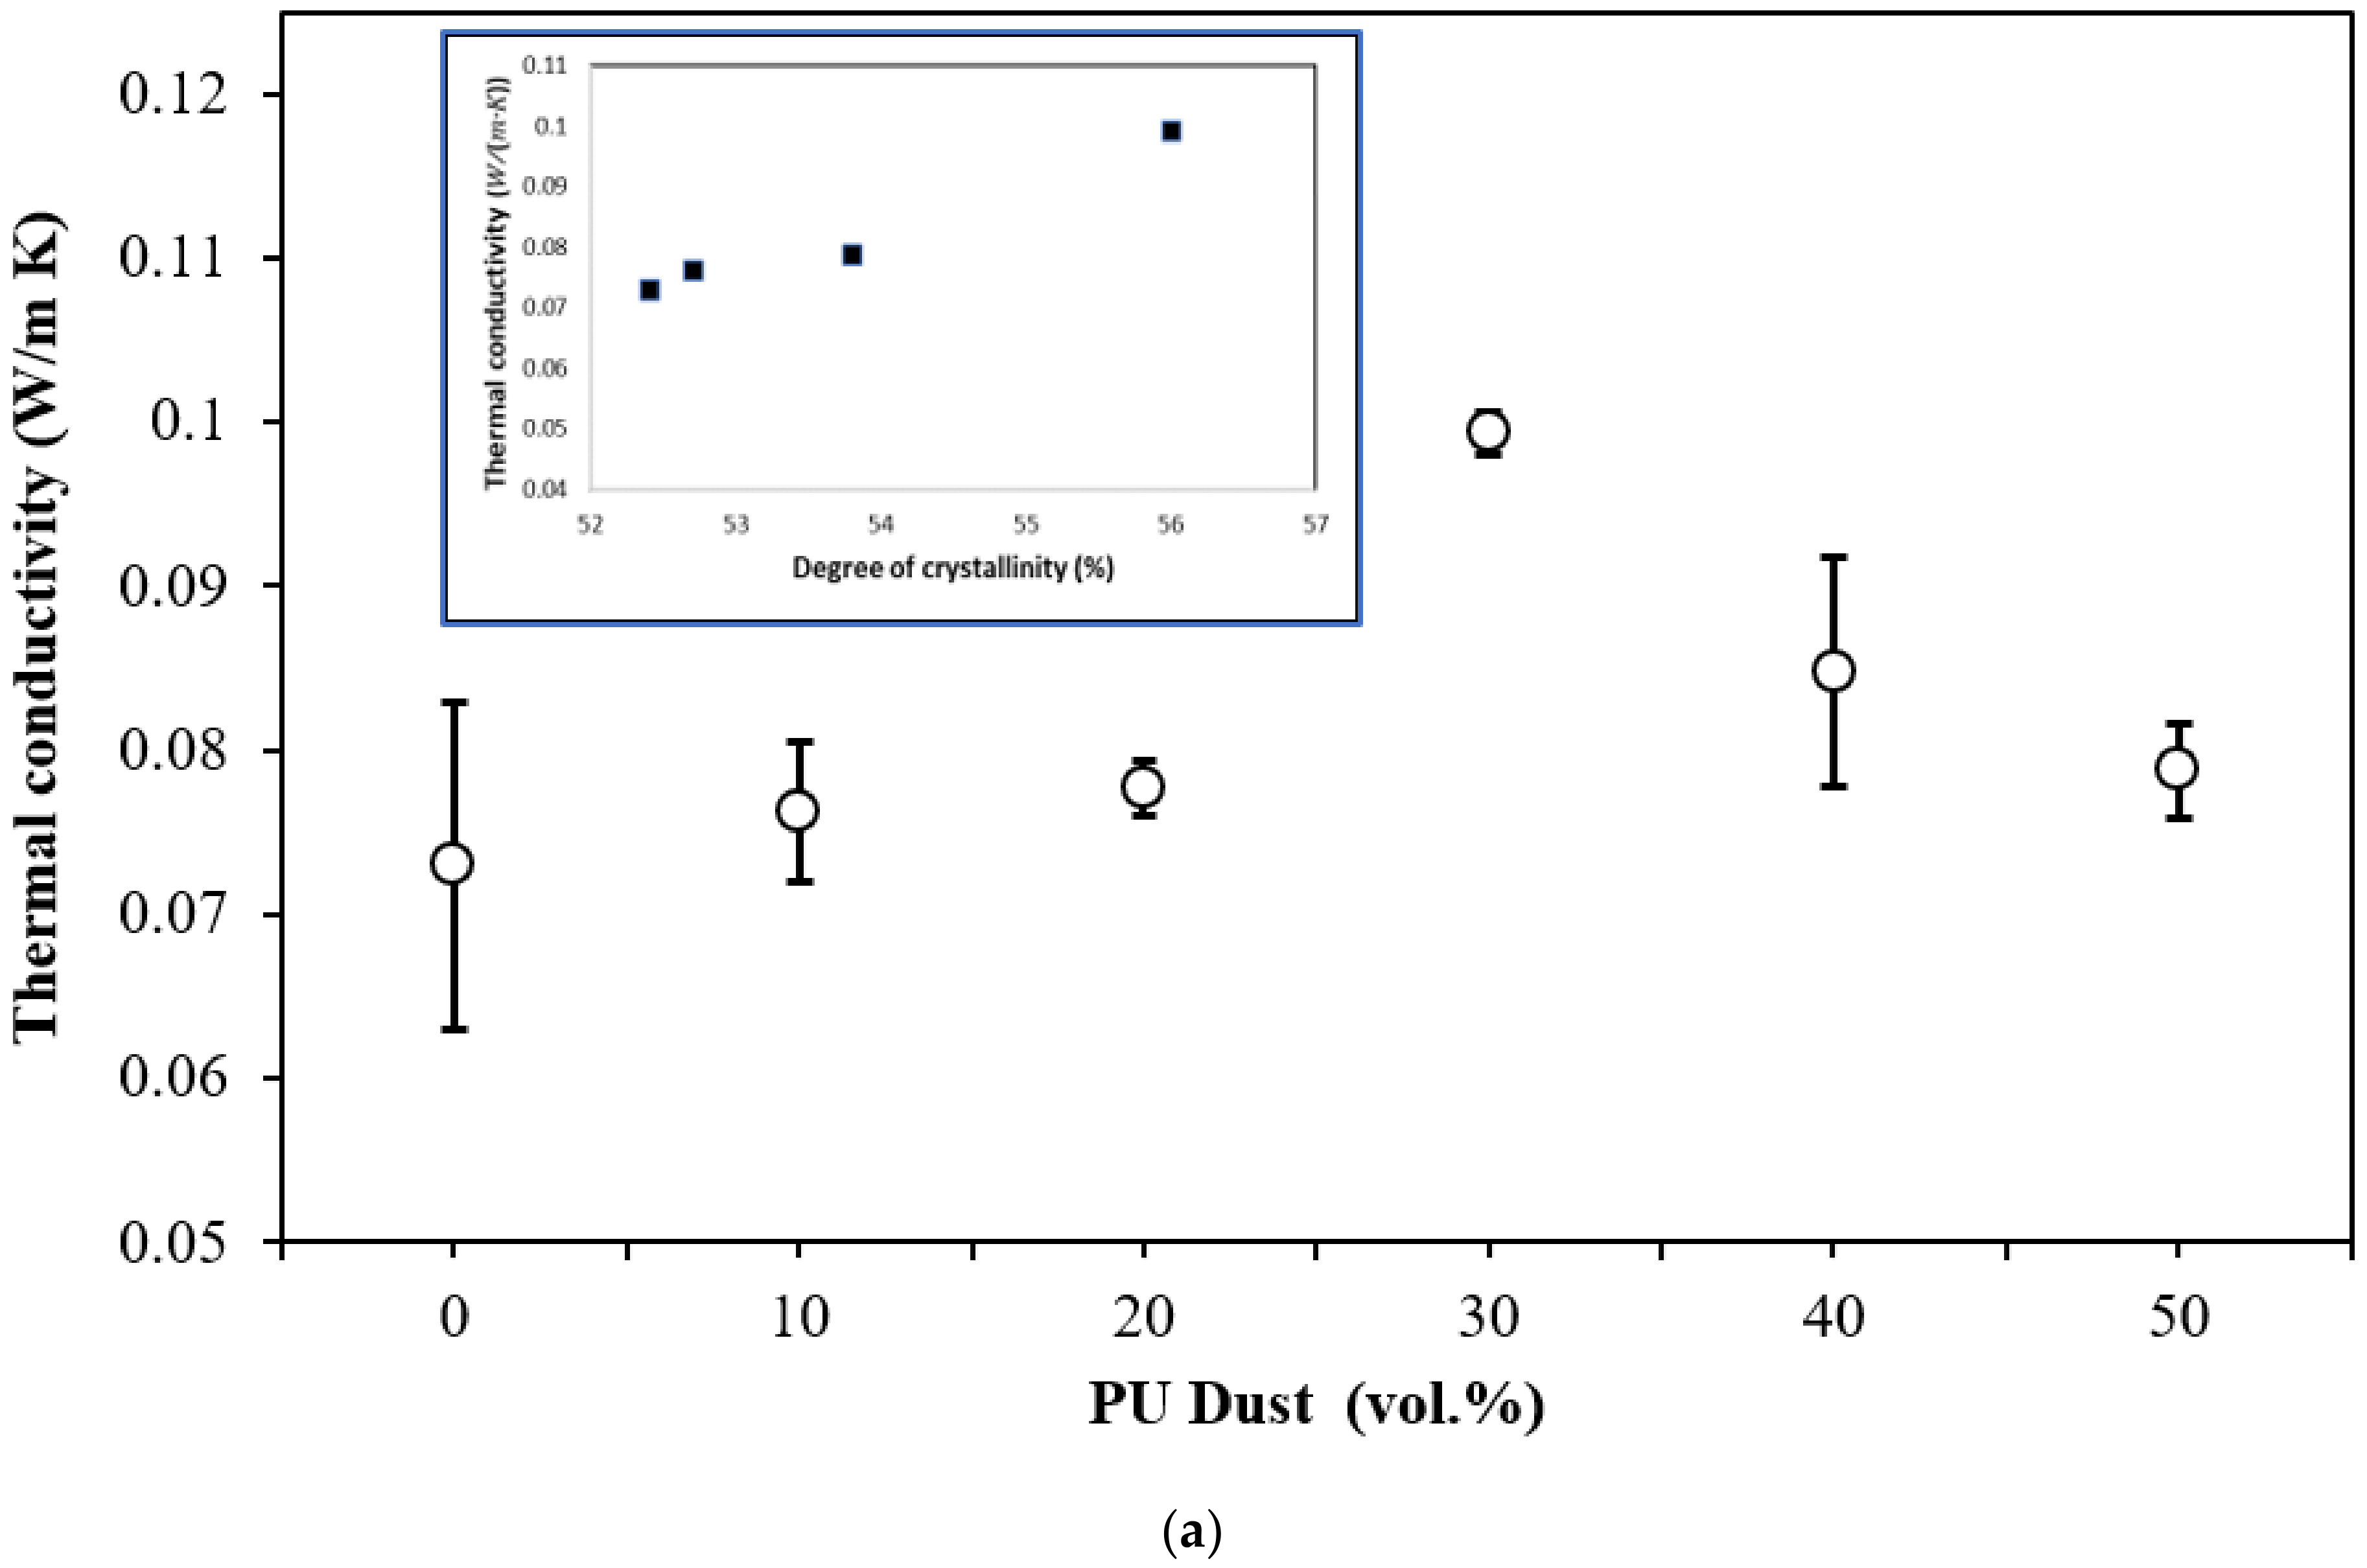
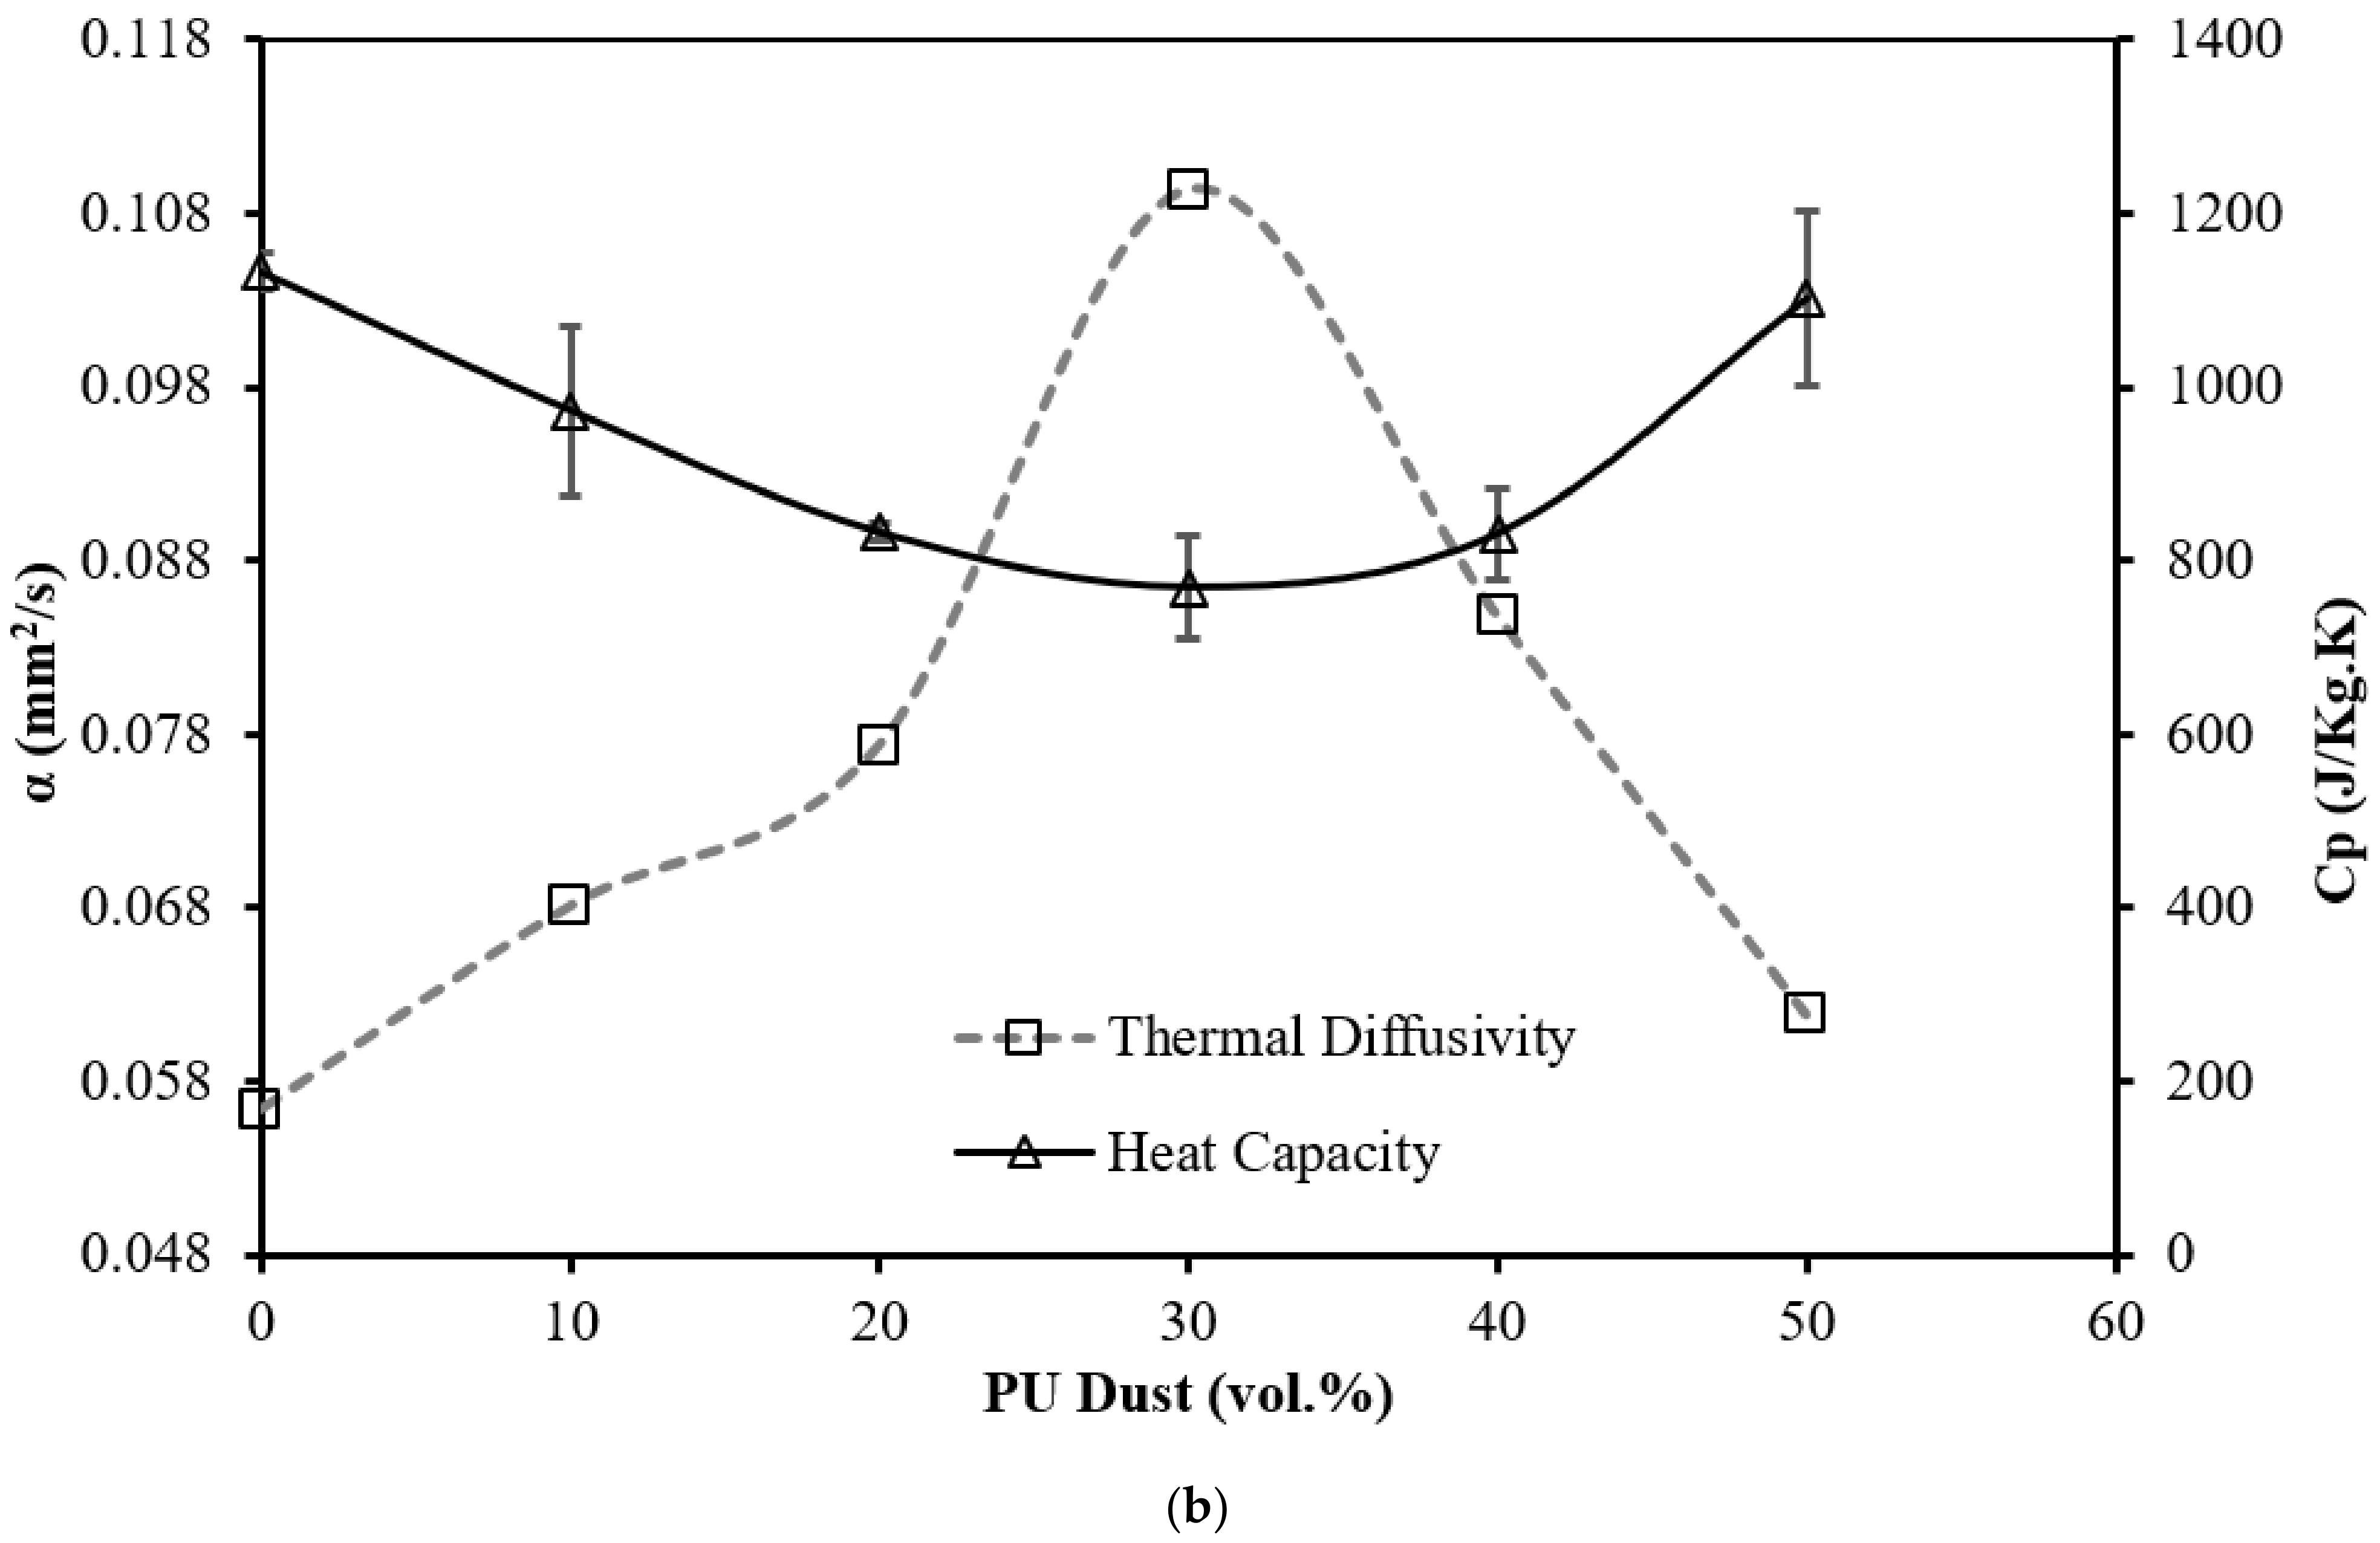
3.5. Thermal Insulation Properties
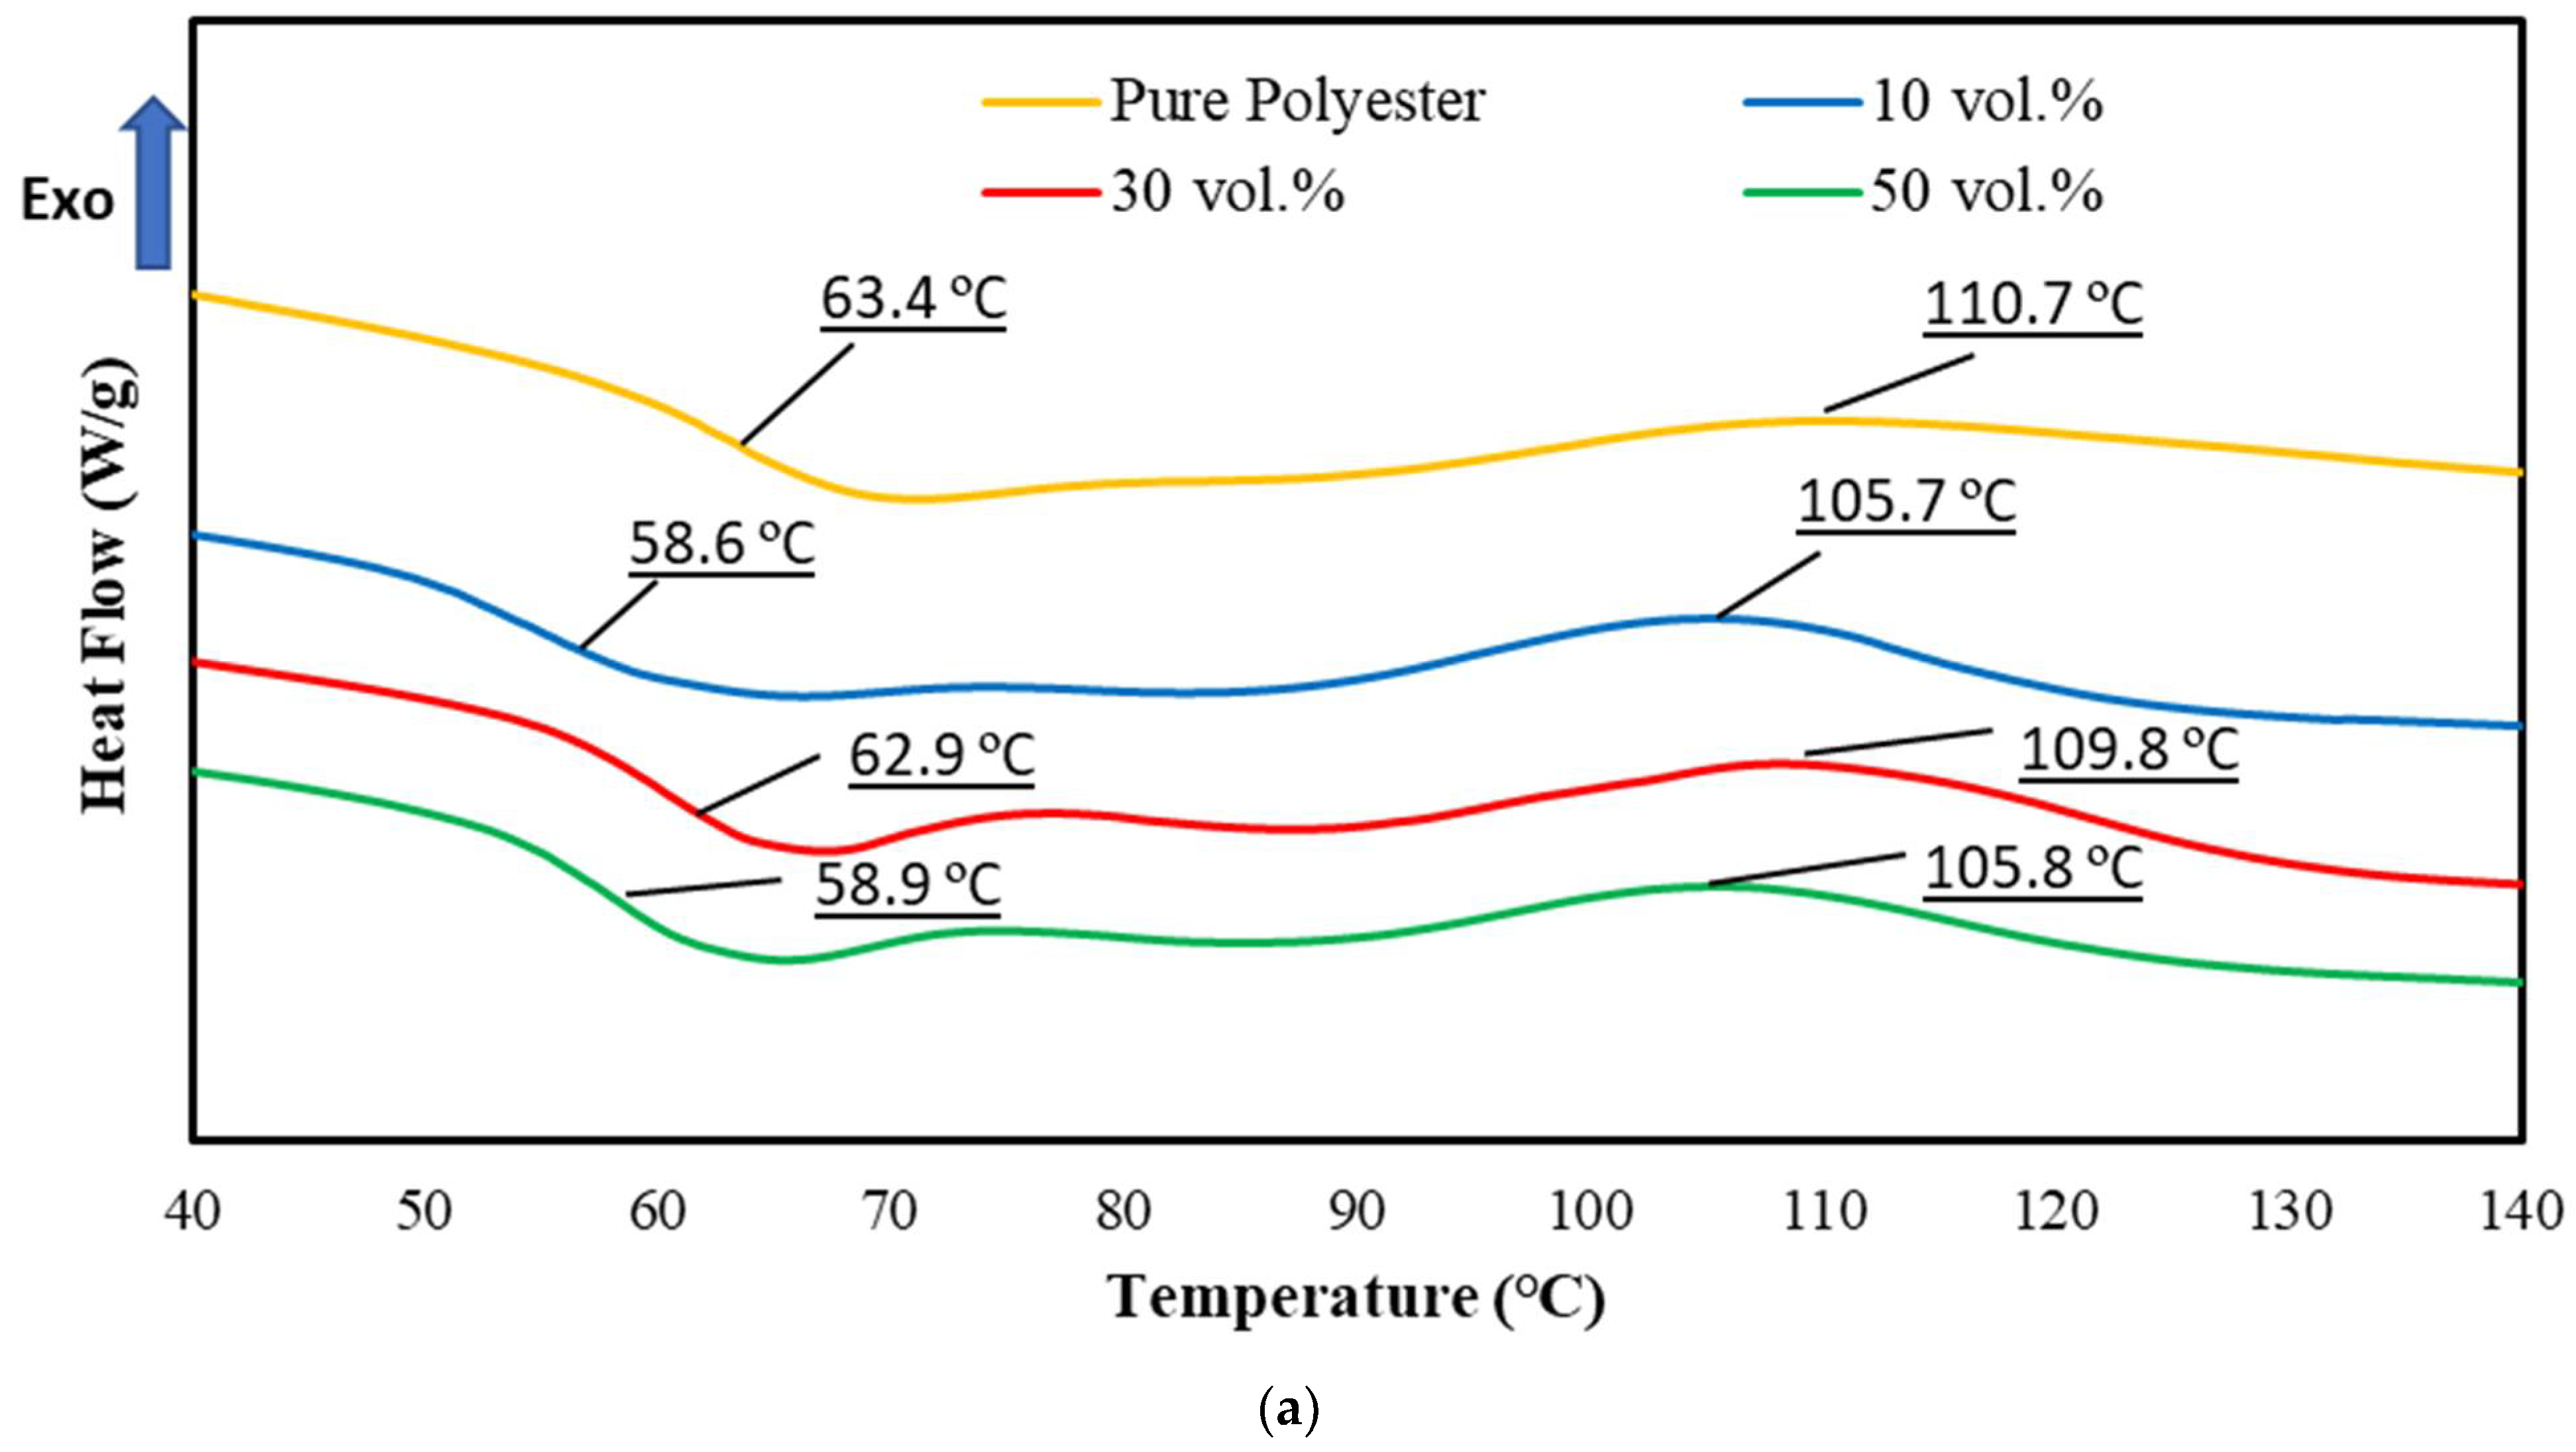
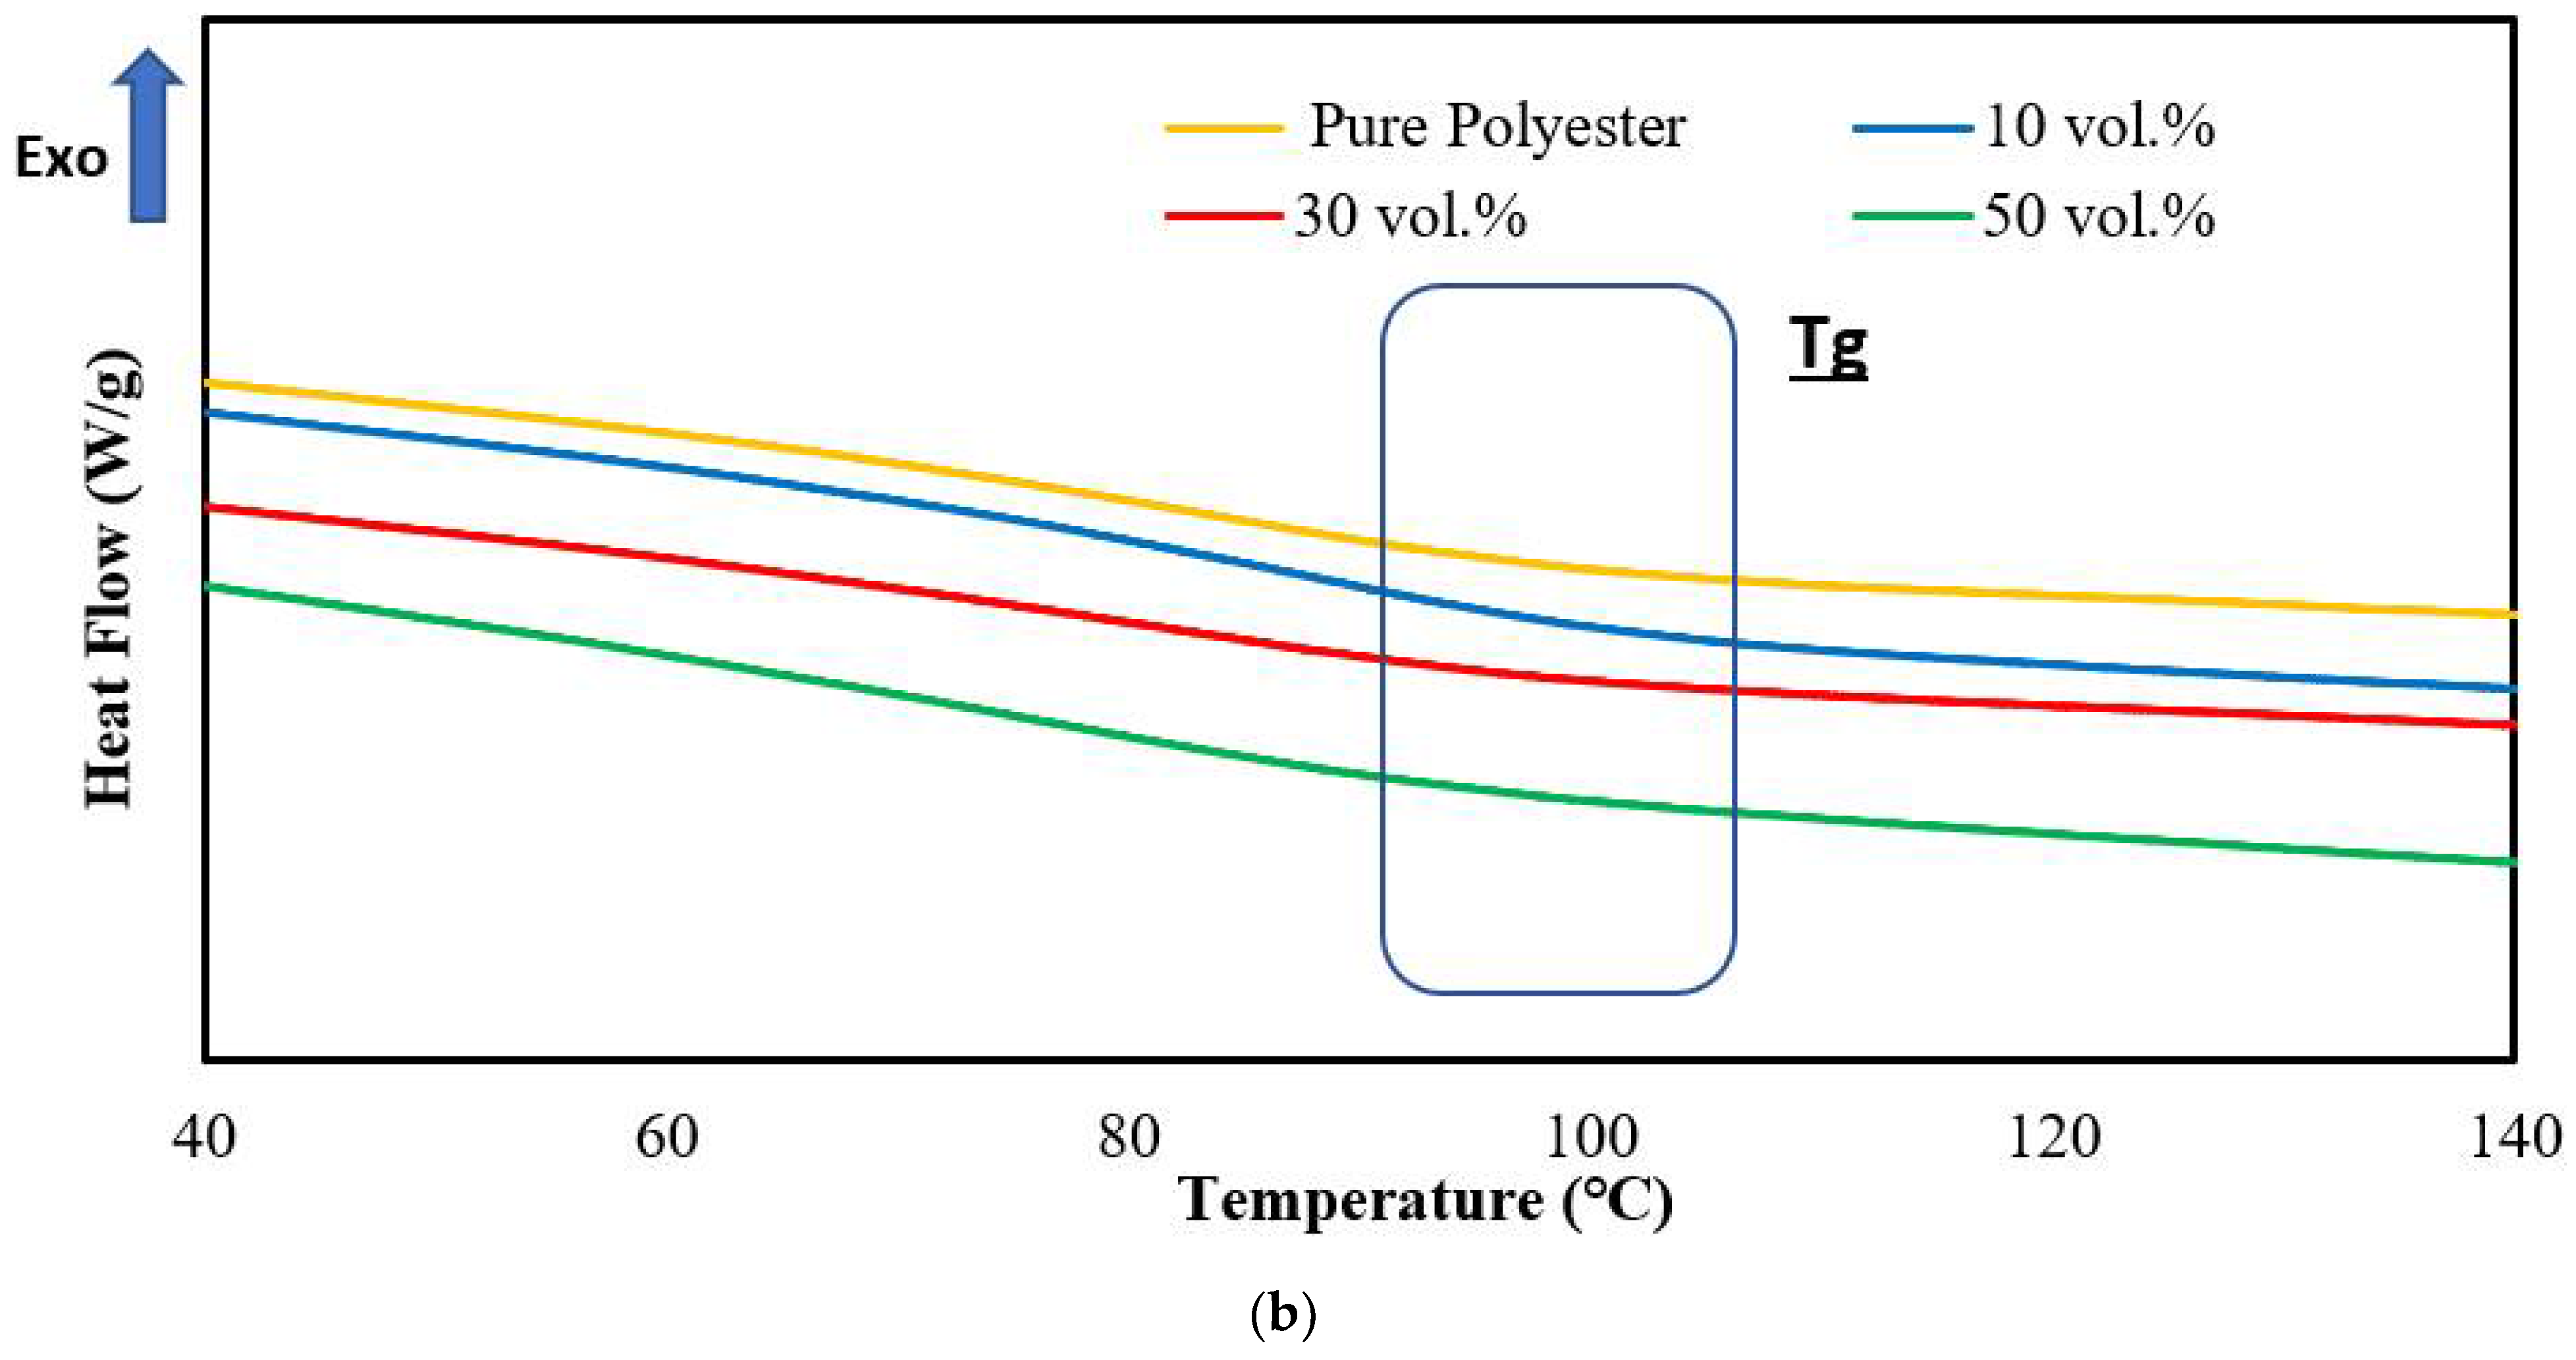
3.6. DSC Analysis
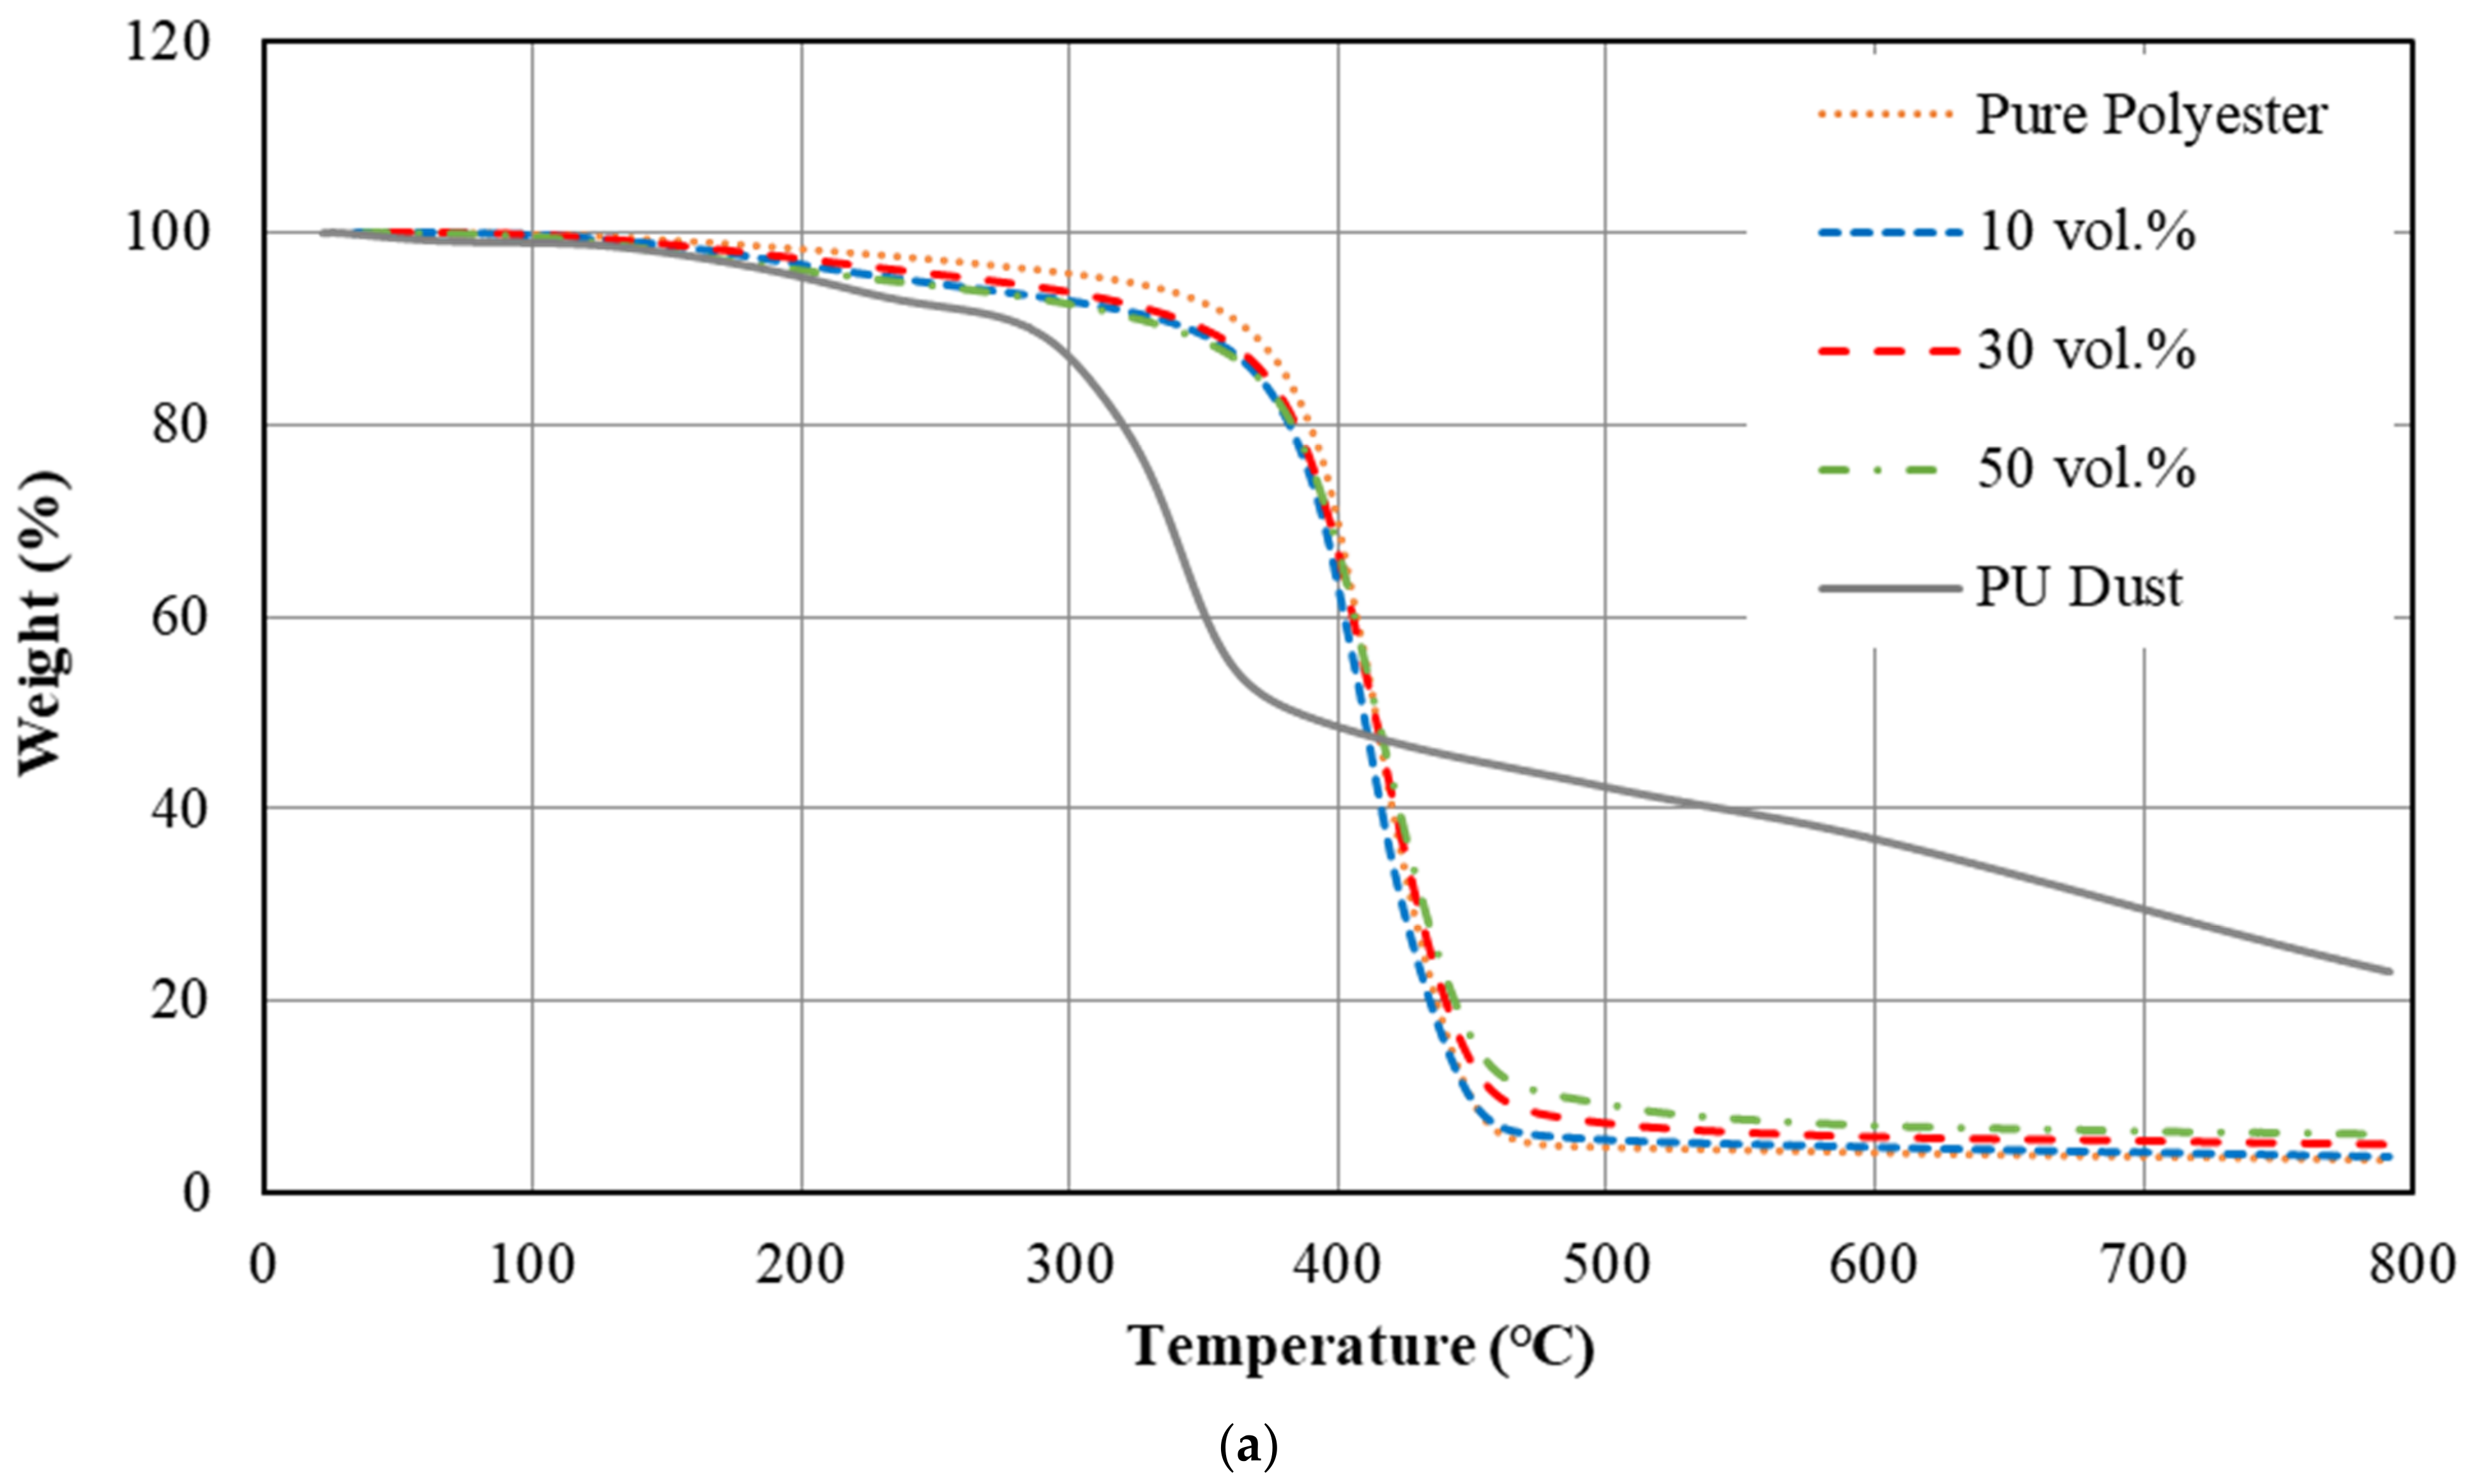
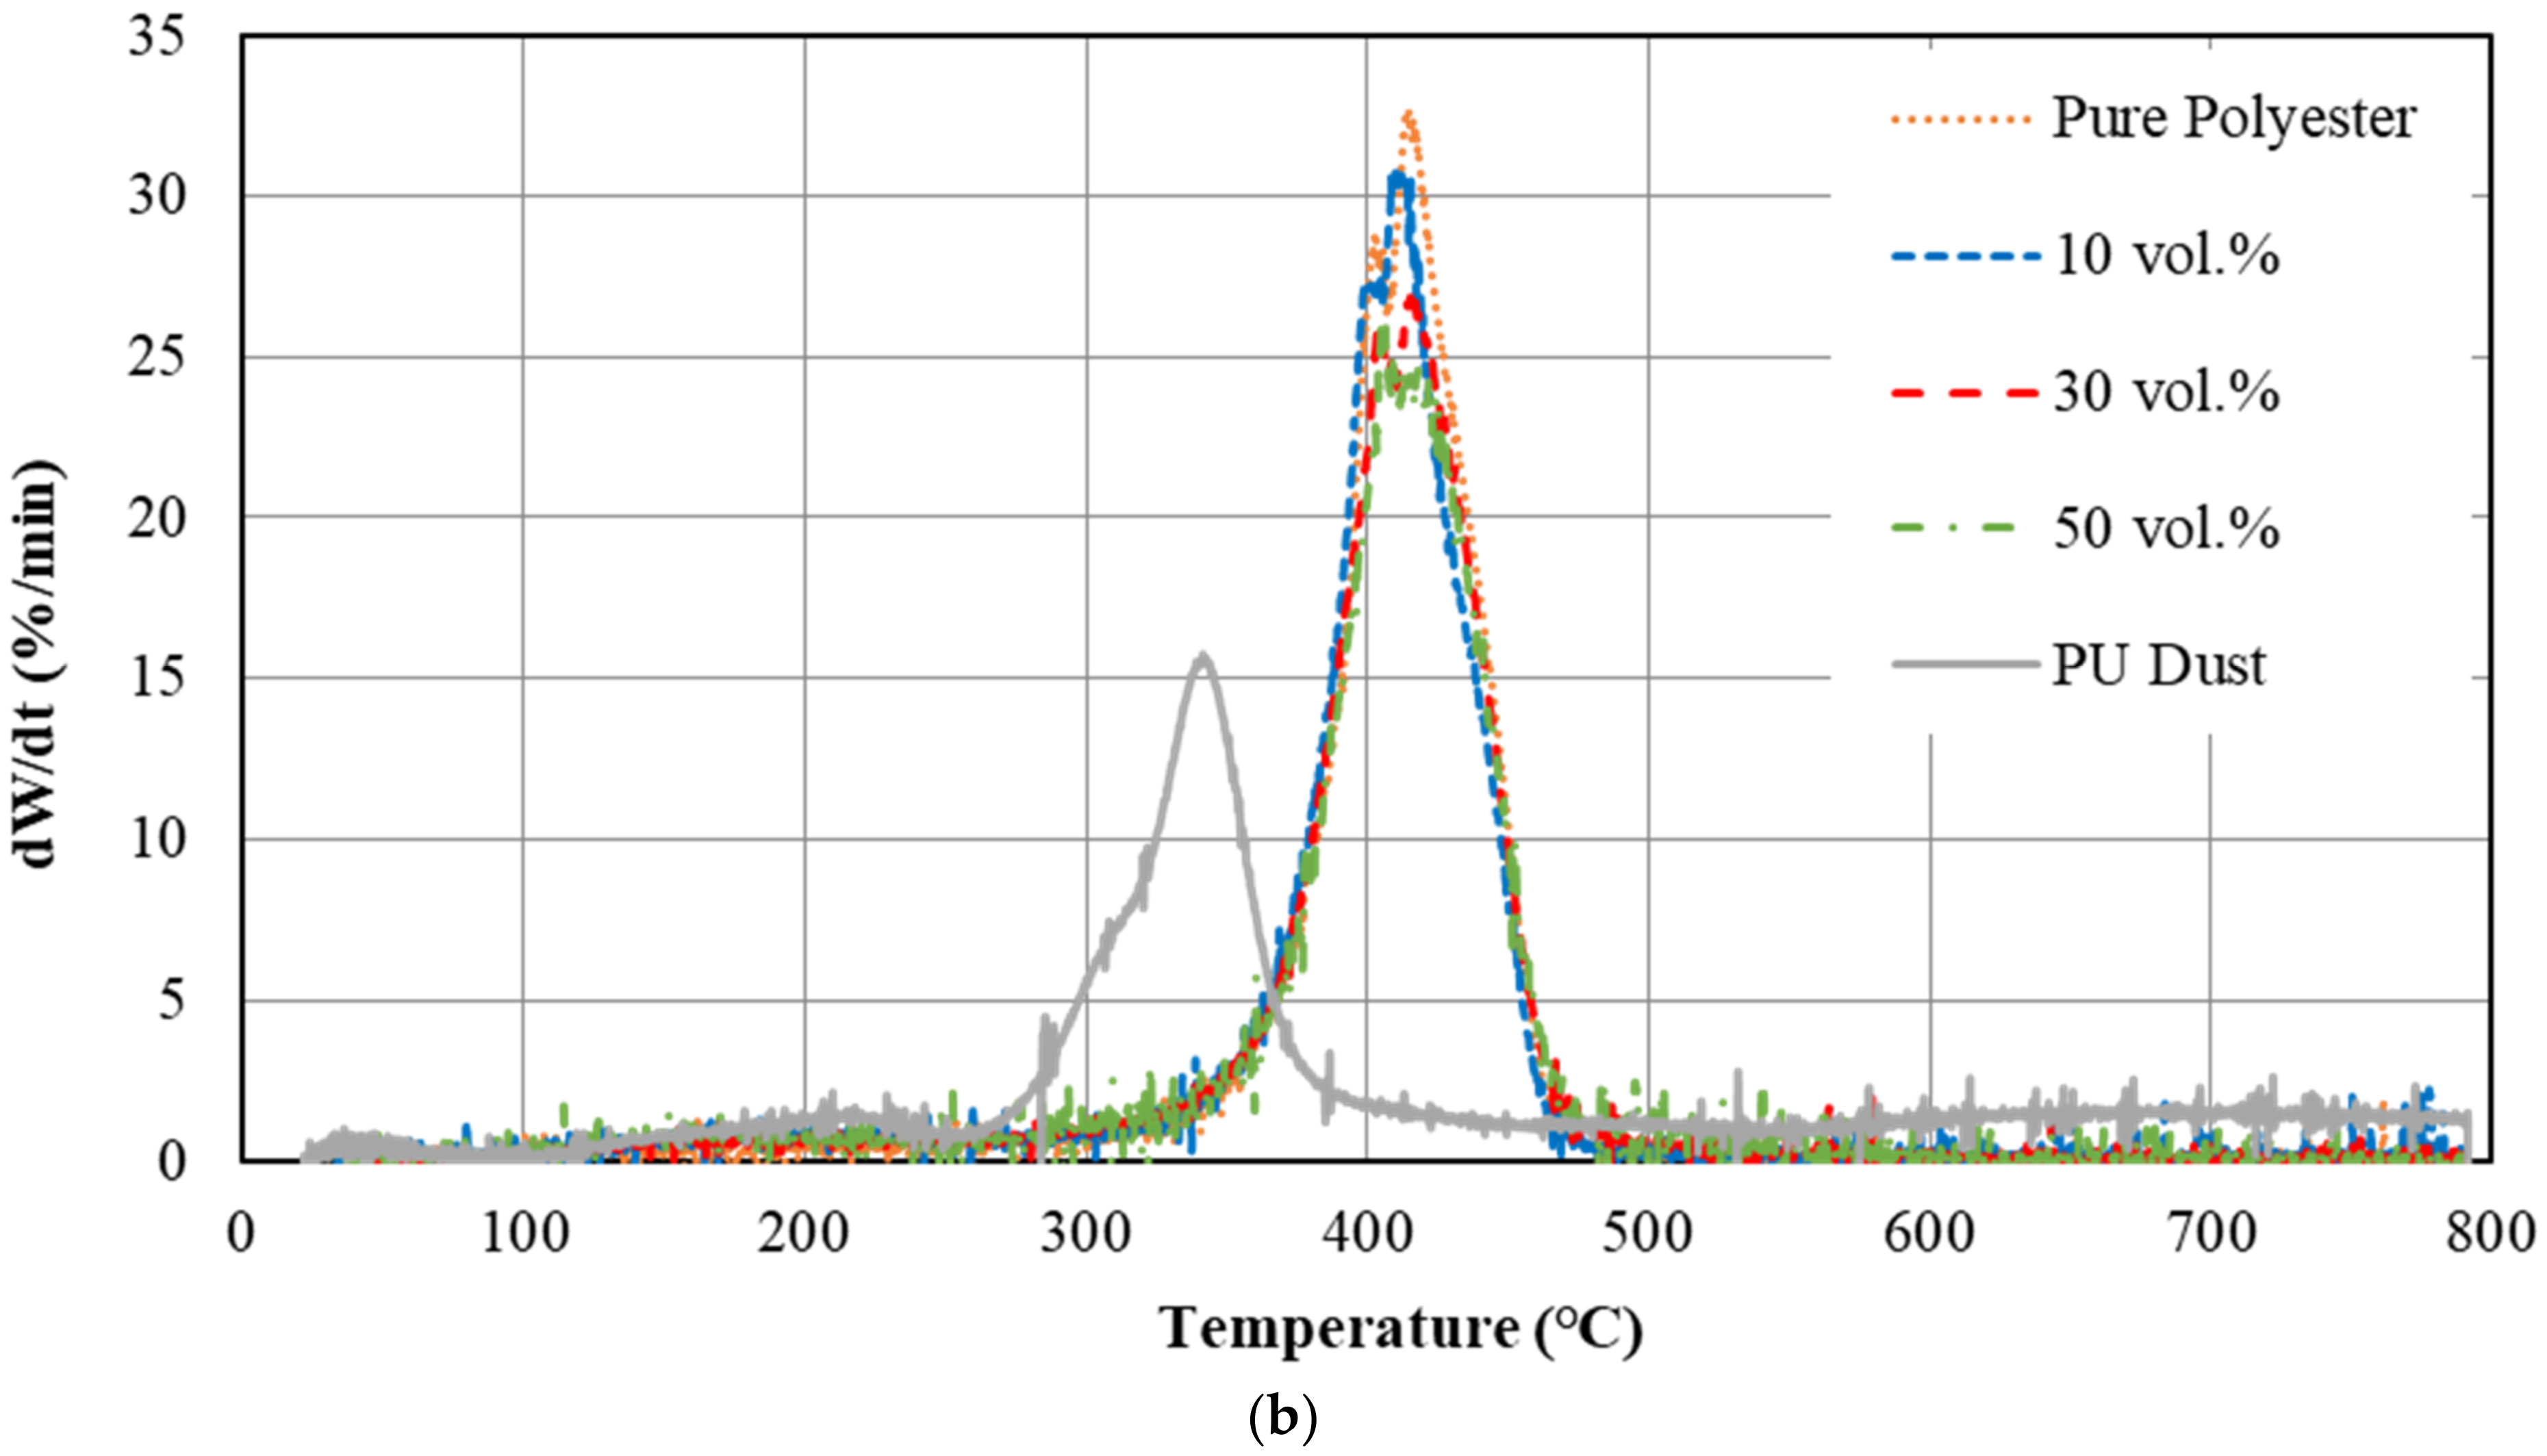
3.7. TGA Analysis
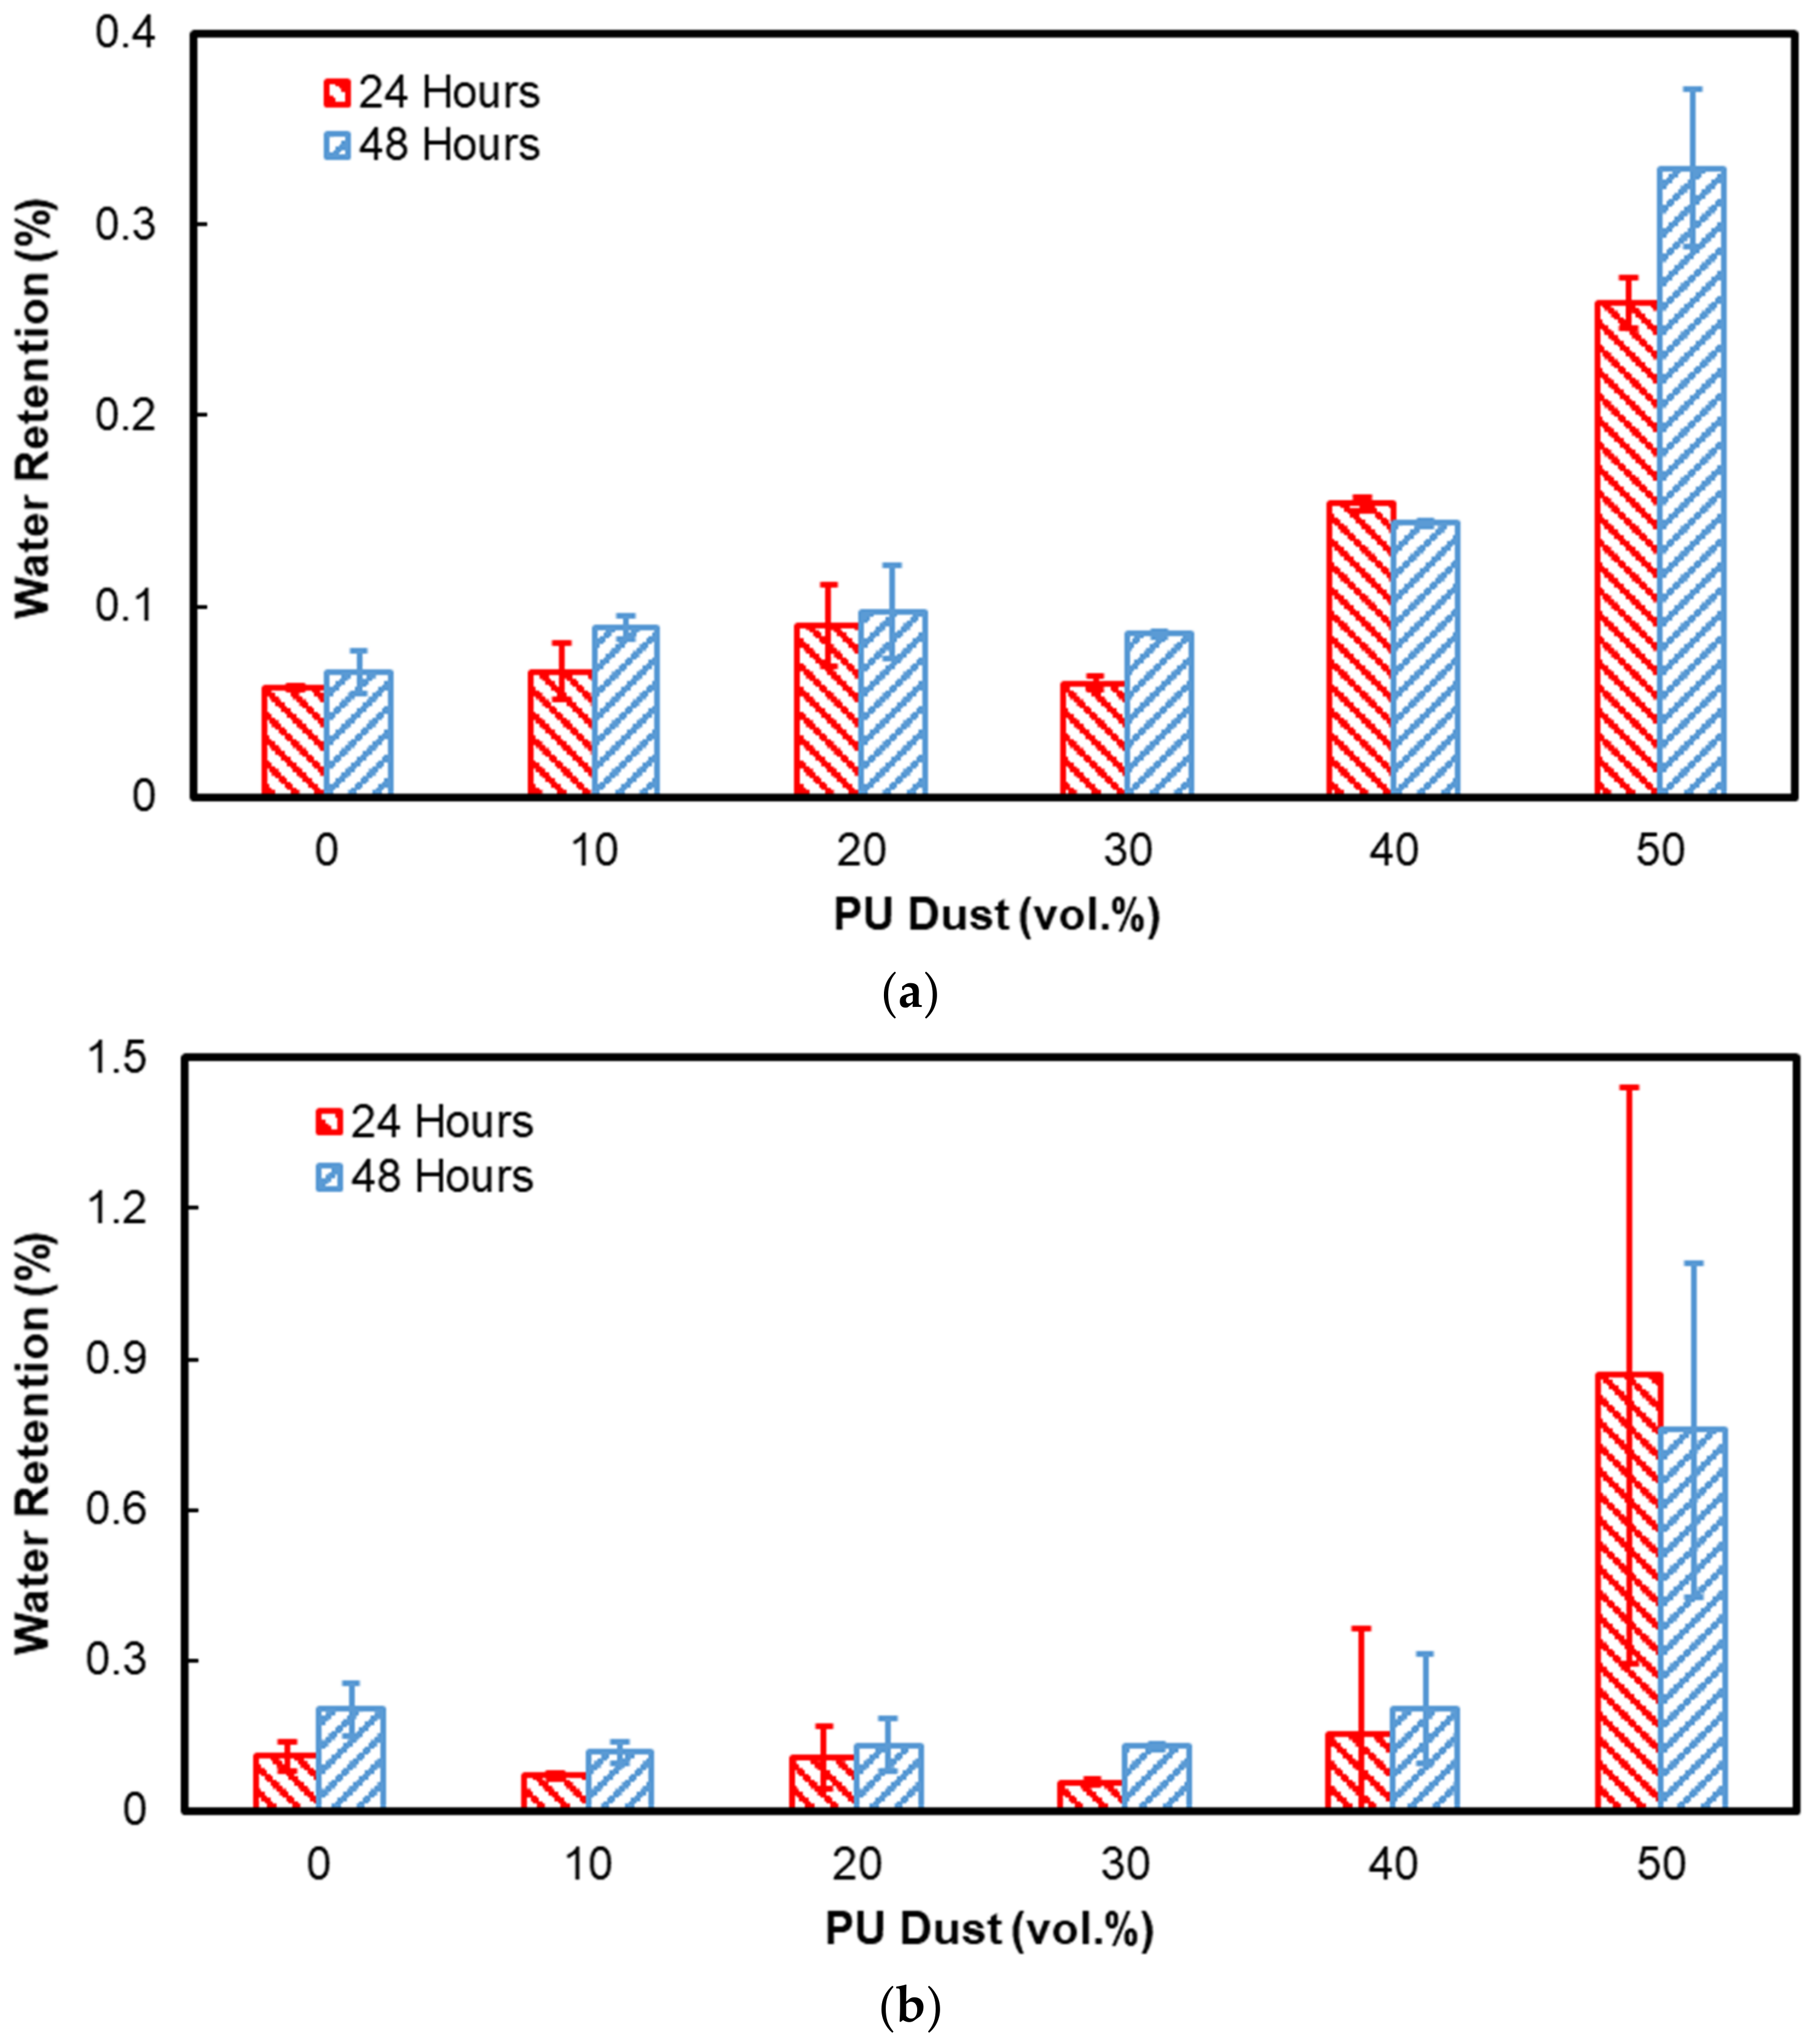
3.8. Water Retention
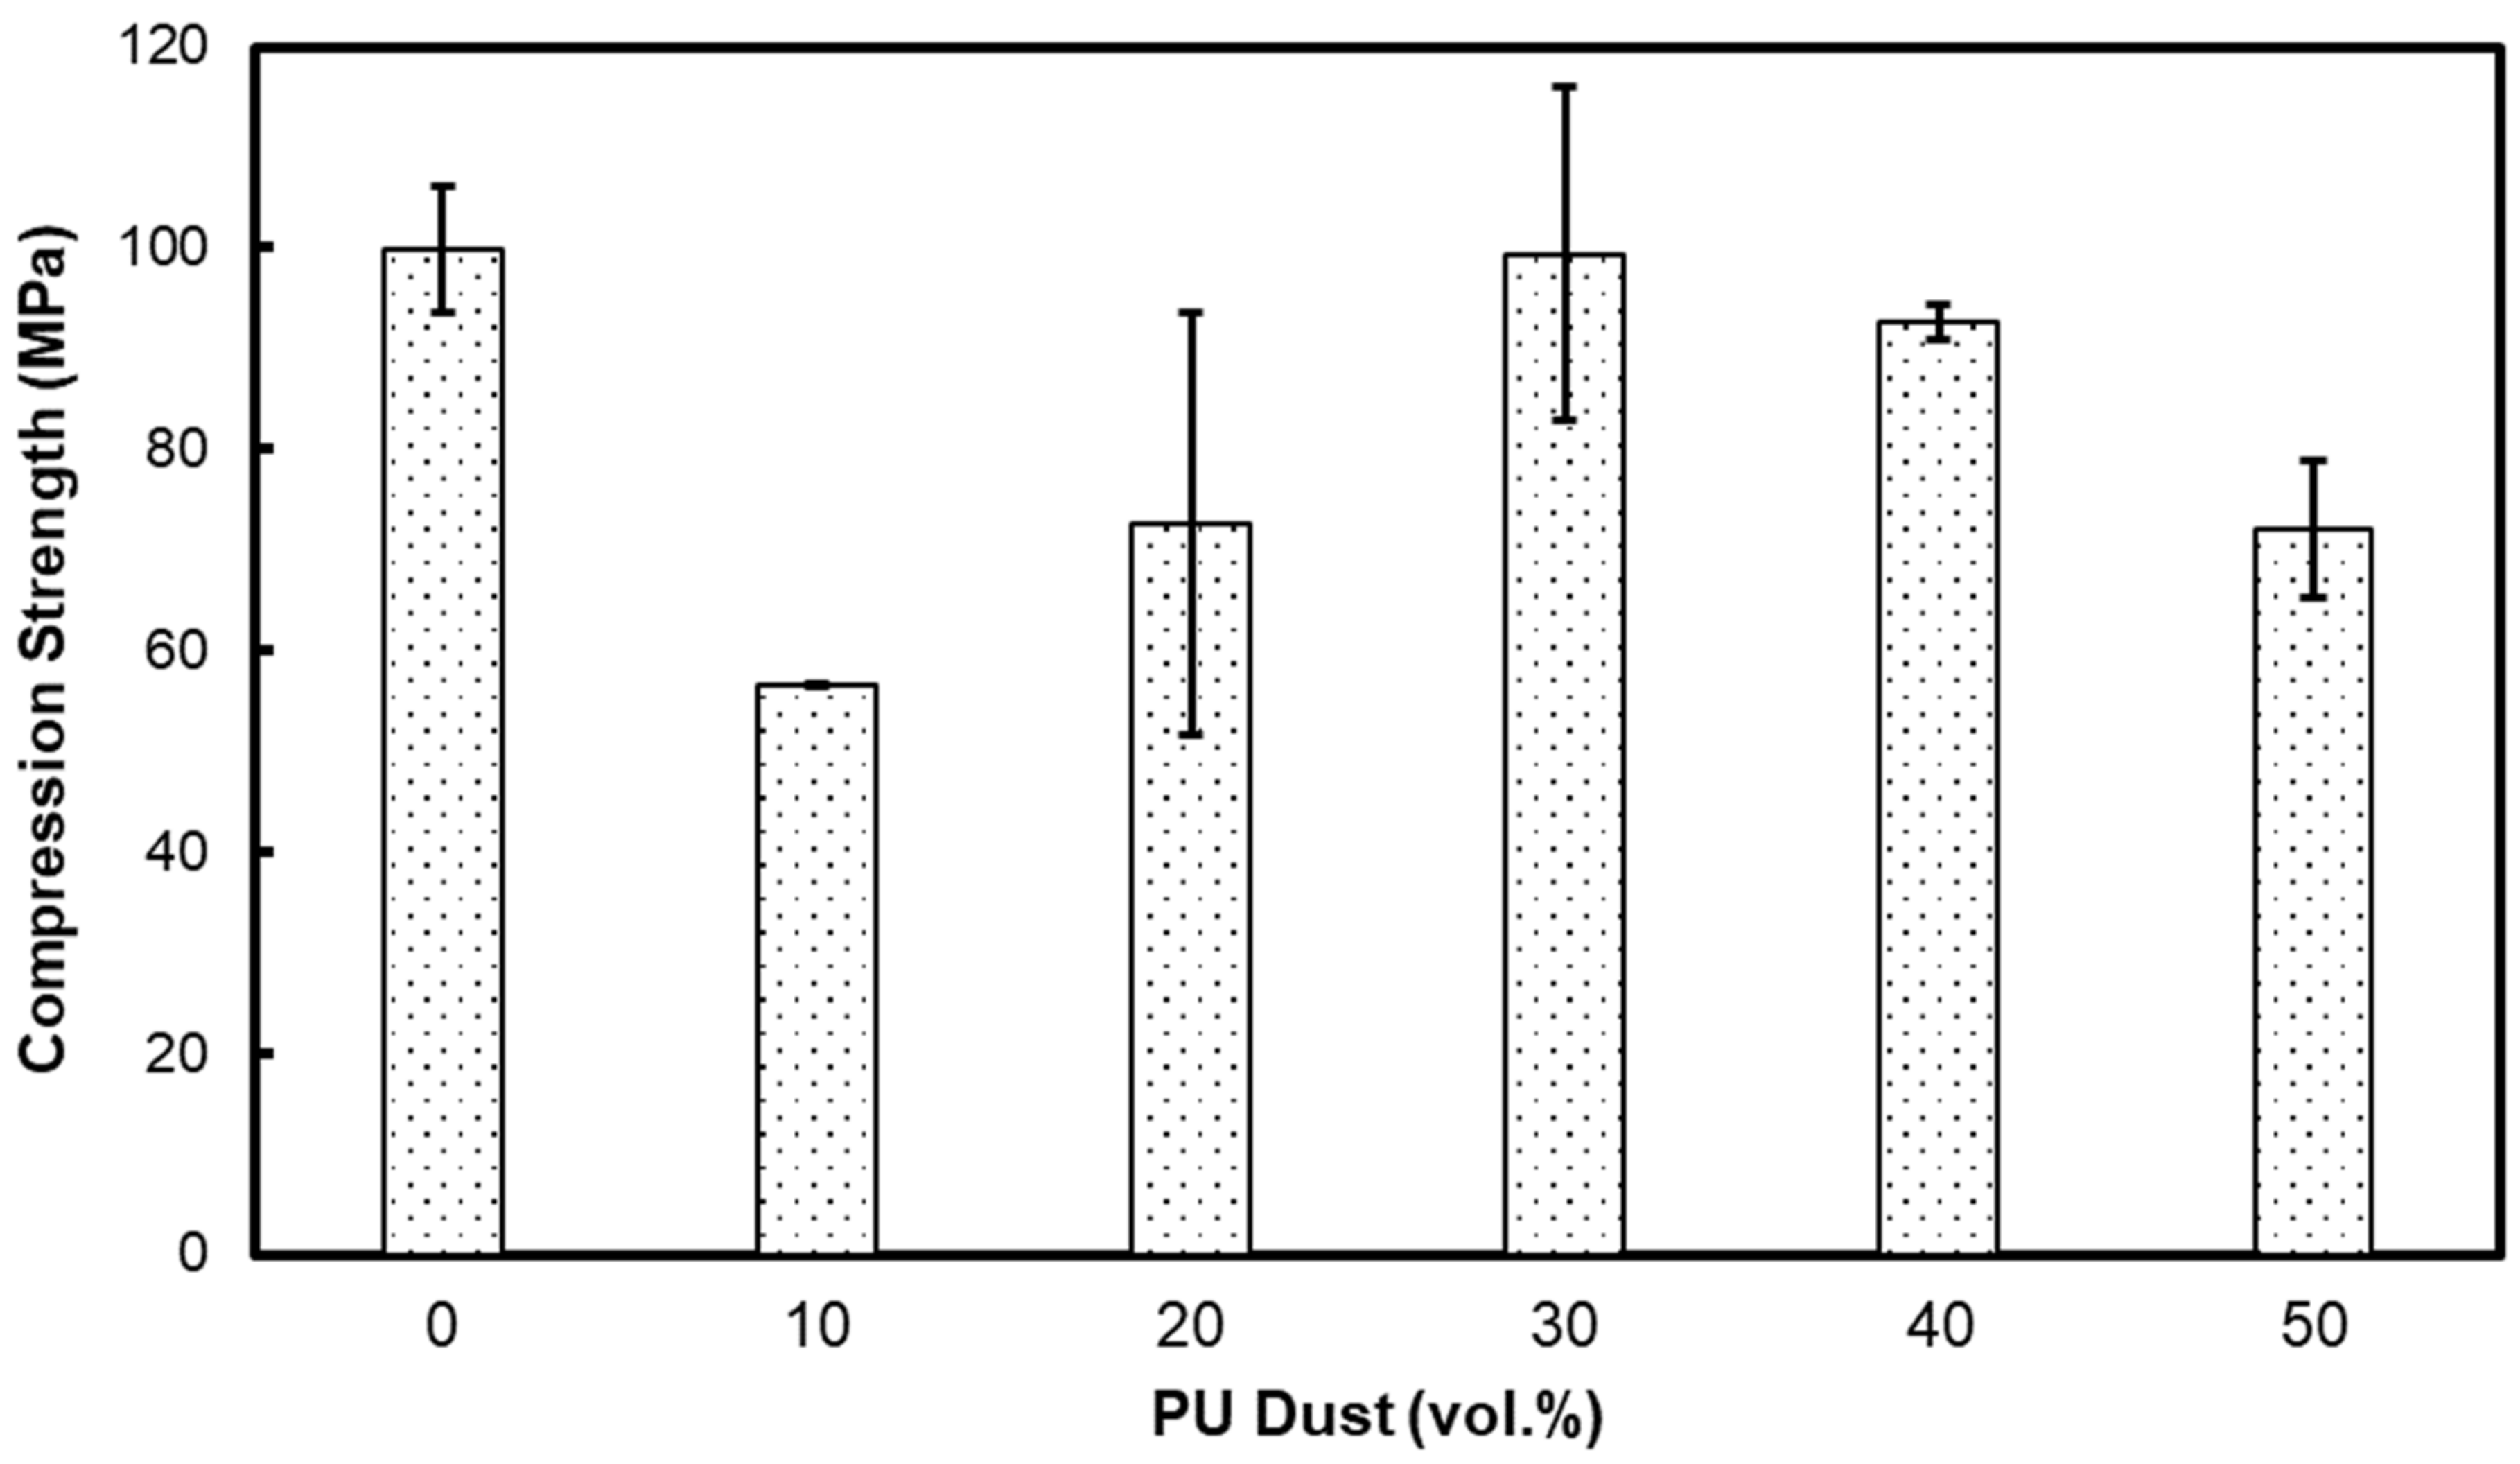
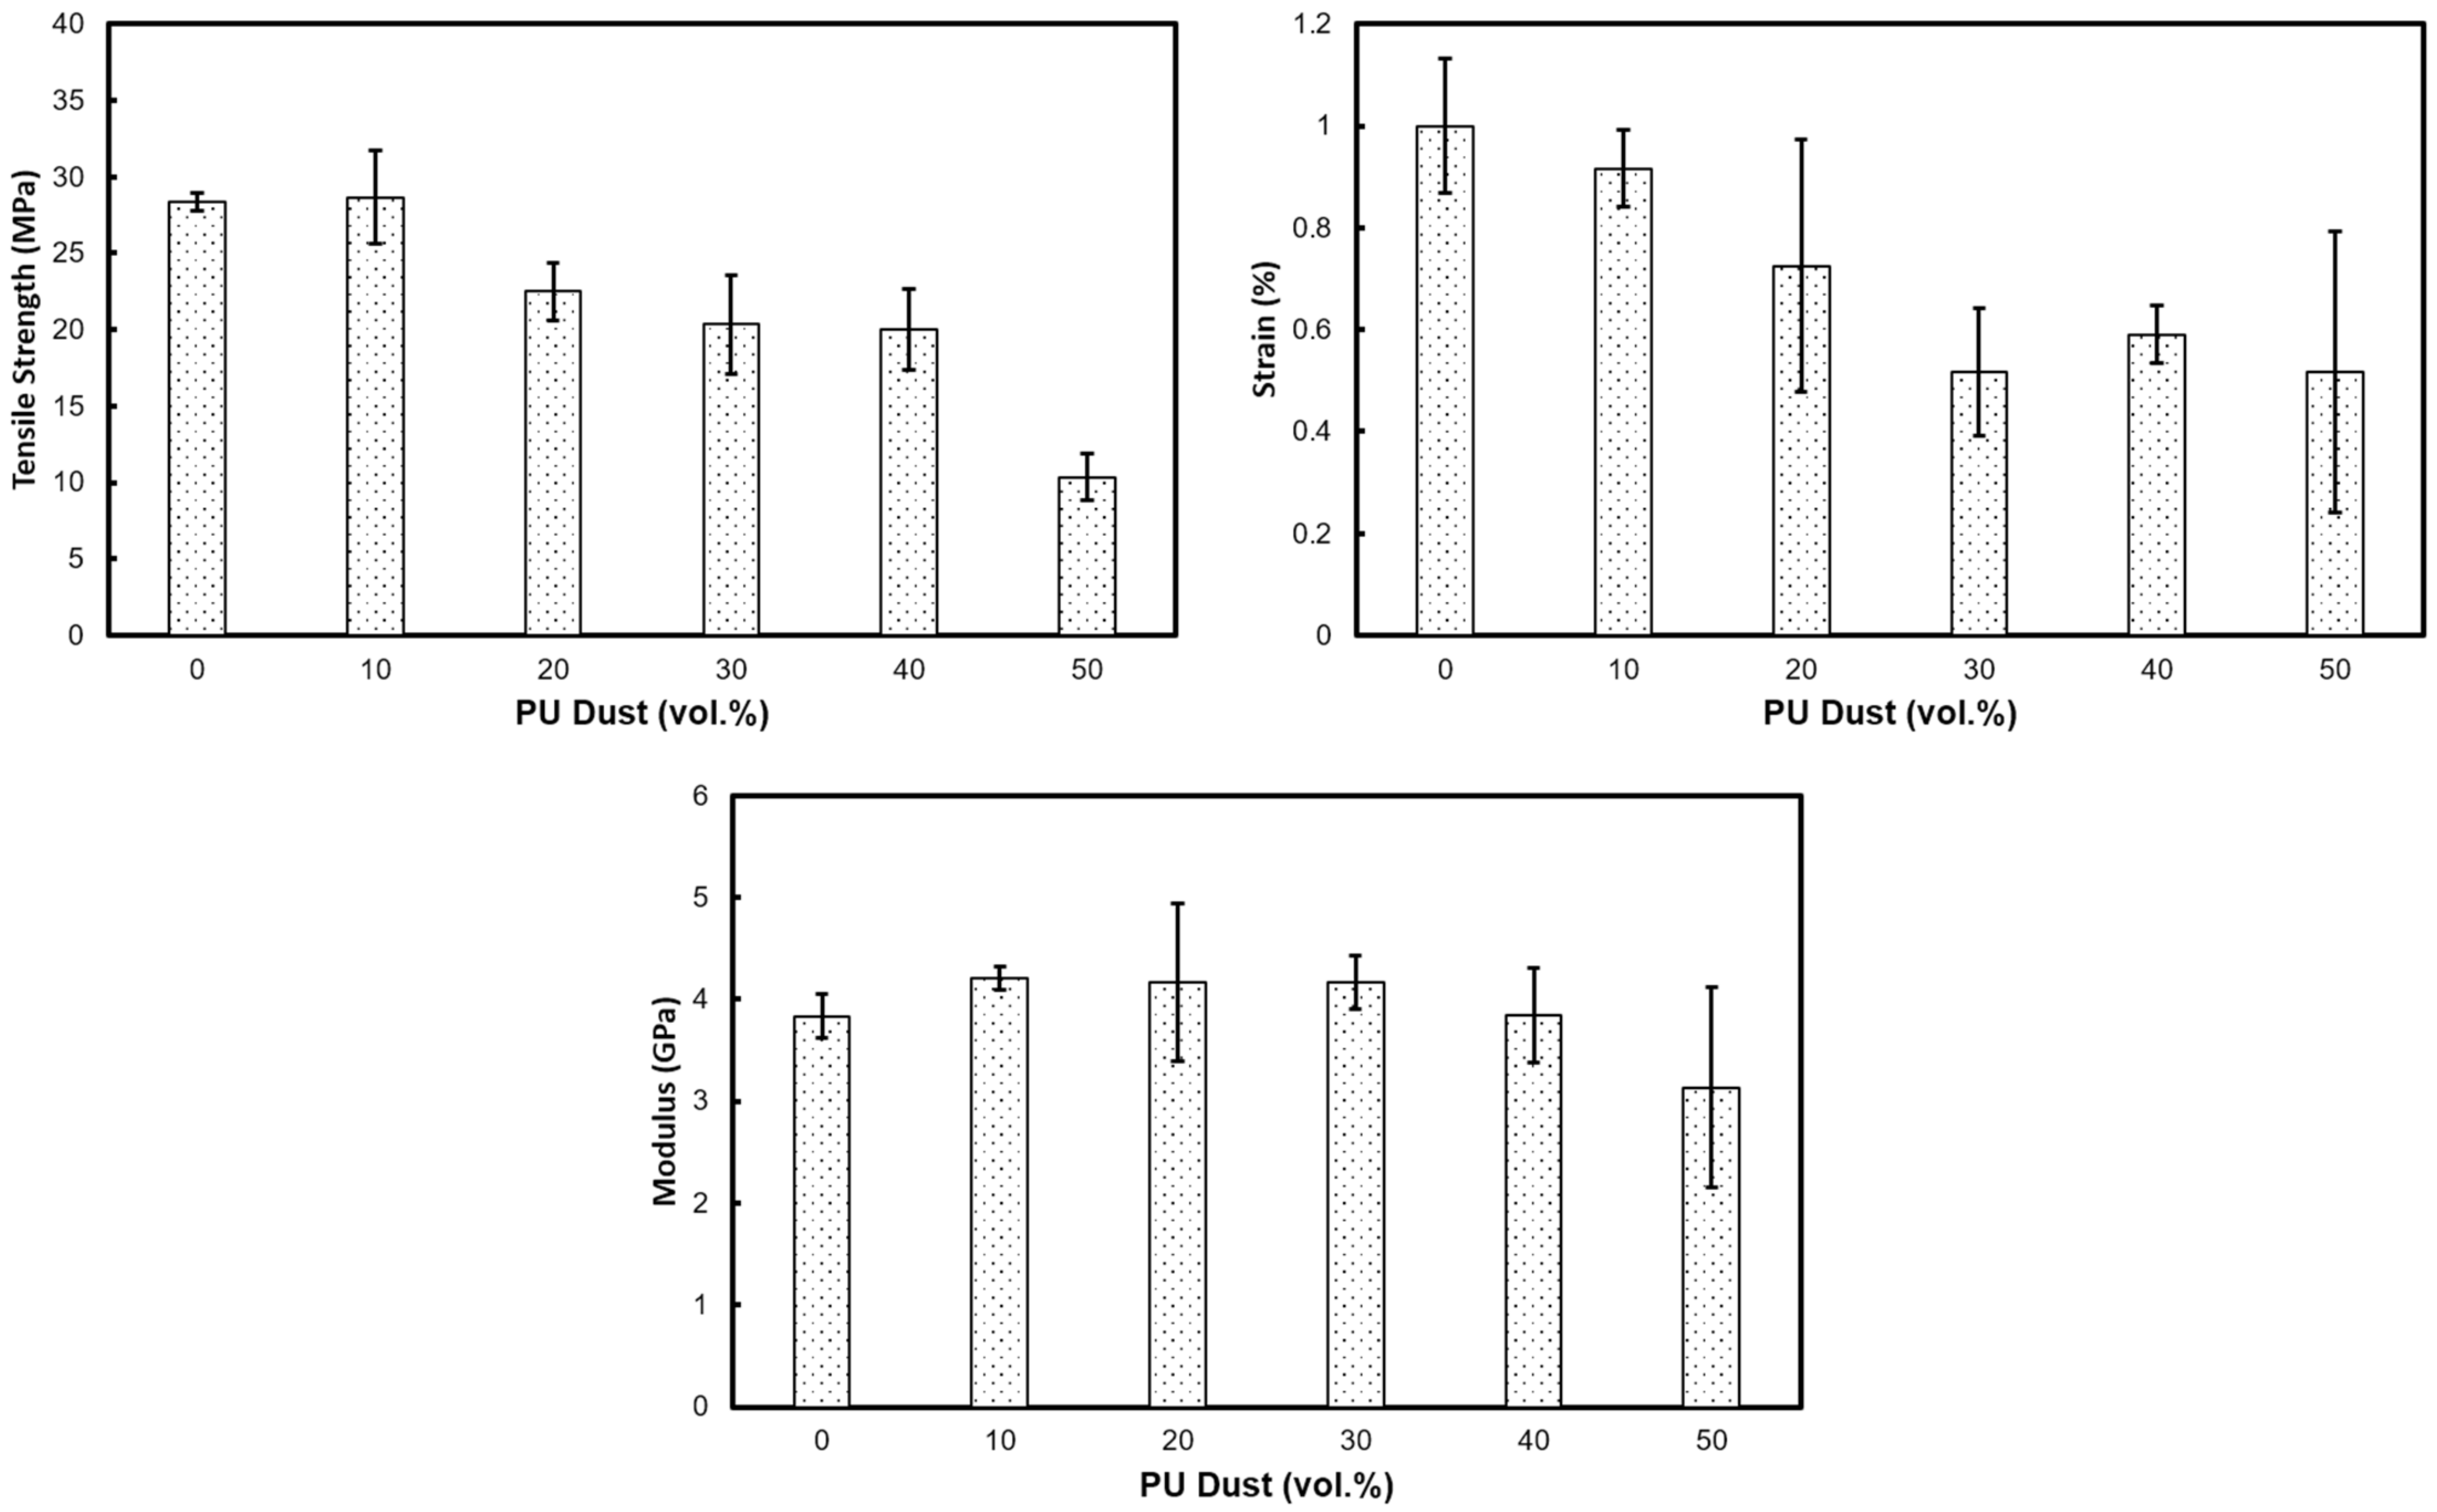
3.9. Mechanical Behavior of Composites
4. Conclusions
Author Contributions
Funding
Institutional Review Board Statement
Informed Consent Statement
Data Availability Statement
Conflicts of Interest
References
- Bayer, O. Das Di-lsocganat-Poluadditionsverfahren (Polyurethane). Angew. Chem. 1947, 59, 257–272. [Google Scholar] [CrossRef]
- Akindoyo, J.O.; Beg, M.D.H.; Ghazali, S.; Islam, M.R.; Jeyaratnam, N.; Yuvaraj, A.R. Polyurethane types, synthesis and applications-a review. RSC Adv. 2016, 6, 114453–114482. [Google Scholar] [CrossRef] [Green Version]
- Chattopadhyay, D.K.; Raju, K.V.S.N. Structural engineering of polyurethane coatings for high performance ap-plications. Prog. Polym. Sci. 2007, 32, 352–418. [Google Scholar] [CrossRef]
- Kiss, G.; Rusu, G.; Peter, F.; Tănase, I.; Bandur, G. Recovery of Flexible Polyurethane Foam Waste for Efficient Reuse in Industrial Formulations. Polymers 2020, 12, 1533. [Google Scholar] [CrossRef] [PubMed]
- Yang, W.; Dong, Q.; Liu, S.; Xie, H.; Liu, L.; Li, J. Recycling and Disposal Methods for Polyurethane Foam Wastes. Procedia Environ. Sci. 2012, 16, 167–175. [Google Scholar] [CrossRef]
- Członka, S.; Bertino, M.F.; Strzelec, K.; Strąkowska, A.; Masłowski, M. Rigid polyurethane foams reinforced with solid waste generated in leather industry. Polym. Test. 2018, 69, 225–237. [Google Scholar] [CrossRef]
- Emadian, S.M.; Onay, T.T.; Demirel, B. Biodegradation of bioplastics in natural environments. Waste Manag. 2017, 59, 526–536. [Google Scholar] [CrossRef]
- Ragaert, K.; Delva, L.; Van Geem, K. Mechanical and chemical recycling of solid plastic waste. Waste Manag. 2017, 69, 24–58. [Google Scholar] [CrossRef]
- Sentryair, Reducing Occupational Exposure to Polyurethane Foam Dust. Available online: https://www.sentryair.com/blog/manufacturing/reducing-occupational-exposure-to-polyurethane-foam-dust/ (accessed on 14 June 2021).
- Nifuku, M.; Tsujita, H.; Fujino, K.; Takaichi, K.; Barre, C.; Paya, E.; Hatori, M.; Fujiwara, S.; Horiguchi, S.; Sochet, I. Ignitability assessment of shredder dusts of refrigerator and the prevention of the dust explosion. J. Loss Prev. Process. Ind. 2006, 19, 181–186. [Google Scholar] [CrossRef]
- Deng, Y.; Dewil, R.; Appels, L.; Ansart, R.; Baeyens, J.; Kang, Q. Reviewing the thermo-chemical recycling of waste polyurethane foam. J. Environ. Manag. 2021, 278, 111527. [Google Scholar] [CrossRef]
- Gama, N.; Godinho, B.; Marques, G.; Silva, R.; Barros-Timmons, A.; Ferreira, A. Recycling of polyurethane scraps via acidolysis. Chem. Eng. J. 2020, 395, 125102. [Google Scholar] [CrossRef]
- Simón, D.; Borreguero, A.M.; De Lucas, A.; Rodríguez, J. Recycling of polyurethanes from laboratory to industry, a journey towards the sustainability. Waste Manag. 2018, 76, 147–171. [Google Scholar] [CrossRef]
- Krosch, K.; Krosch, B.; Krosch, M.; Ecker, R. Recycling Process and Apparatus for Rigid Polyurethane Foam. U.S. Patent 5525278, 11 June 1996. [Google Scholar]
- Zia, K.M.; Bhatti, H.N.; Bhatti, I.A. Methods for polyurethane and polyurethane composites, recycling and recovery: A review. React. Funct. Polym. 2007, 67, 675–692. [Google Scholar] [CrossRef]
- El-Meligy, M.G.; Mohamed, S.H.; Mahani, R.M. Study mechanical, swelling and dielectric properties of prehy-drolysed banana fiber–waste polyurethane foam composites. Carbohydr. Polym. 2010, 80, 366–372. [Google Scholar] [CrossRef]
- Fornasieri, M.; Alves, J.W.; Muniz, E.C.; Ruvolo-Filho, A.; Otaguro, H.; Rubira, A.F.; De Carvalho, G.M. Synthesis and characterization of polyurethane composites of wood waste and polyols from chemically recycled pet. Compos. Part A Appl. Sci. Manuf. 2011, 42, 189–195. [Google Scholar] [CrossRef] [Green Version]
- Otto, G.P.; Moisés, M.P.; Carvalho, G.; Rinaldi, A.W.; Garcia, J.C.; Radovanovic, E.; Fávaro, S.L. Mechanical properties of a polyurethane hybrid composite with natural lignocellulosic fibers. Compos. Part B Eng. 2017, 110, 459–465. [Google Scholar] [CrossRef]
- Vicario, I.S.; Cuenca-Romero, L.A.; González, S.G.; Carpintero, V.C.; Saiz, R. Design and Characterization of Gypsum Mortars Dosed with Polyurethane Foam Waste PFW. Materials 2020, 13, 1497. [Google Scholar] [CrossRef] [Green Version]
- Li, Q.; Pang, Y.; Liu, X.; Xi, E.; Mao, A.; Wan, H. Addition of Polyurethane Foam Waste to Polymeric Diphenyl Methane Diisocyanate to Improve Plywood Binder Performance. For. Prod. J. 2020, 70, 262–267. [Google Scholar] [CrossRef]
- Calvo-Correas, T.; Ugarte, L.; Larraza, I.; Peña-Rodríguez, C.; Corcuera, M.A.; Eceiza, A. Residues from rigid foams and graphene for the synthesis of hybrid polyurethane flexible foams composites. J. Mater. Res. Technol. 2021, 12, 2128–2137. [Google Scholar] [CrossRef]
- Zhang, H.; Su, C.; Bu, X.; Zhang, Y.; Gao, Y.; Huang, M. Laboratory investigation on the properties of polyure-thane/unsaturated polyester resin modified bituminous mixture. Constr. Build. Mater. 2020, 260, 119865. [Google Scholar] [CrossRef]
- Hejna, A.; Kosmela, P.; Olszewski, A.; Zedler, Ł.; Formela, K. The impact of ground tire rubber treatment on the thermal conductivity of flexible polyurethane/ground tire rubber composites. In Proceedings of the 1st International Scientific and Practical Conference, Tallinn, Estonia, 16–18 December 2020; pp. 1062–1068. [Google Scholar]
- Abu-Jdayil, B.; Mourad, A.-H.; Hussain, A. Thermal and physical characteristics of polyester–scrap tire composites. Constr. Build. Mater. 2016, 105, 472–479. [Google Scholar] [CrossRef]
- Adi, M.; Abu-Jdayil, B.; Al Ghaferi, F.; Al Yahyaee, S.; Al Jabri, M. Seawater-Neutralized Bauxite Residue–Polyester Composites as Insulating Construction Materials. Buildings 2021, 11, 20. [Google Scholar] [CrossRef]
- Cherian, A.B.; Abraham, B.T.; Thachil, E.T. Modification of unsaturated polyester resin by polyurethane prepol-ymers. J. Appl. Polym. Sci. 2006, 100, 449–456. [Google Scholar] [CrossRef]
- Dias, R.C.M.; Góes, A.M.; Serakides, R.; Ayres, E.; Oréfice, R.L. Porous biodegradable polyurethane nanocompo-sites: Preparation, characterization, and biocompatibility tests. Mater. Res. 2010, 13, 211–218. [Google Scholar] [CrossRef]
- Mohanty, A.K.; Misra, M.; Drzal, L.T. (Eds.) Natural Fibers, Biopolymers, and Biocomposites; CRC Press Taylor & Francis Group: New York, NY, USA, 2005. [Google Scholar]
- Abu-Jdayil, B. Unsaturated Polyester Microcomposites. In Unsaturated Polyester Resins; Elsevier: Amsterdam, The Netherlands, 2019; pp. 67–100. [Google Scholar]
- Abu-Jdayil, B.; Adi, M.; Al Ghaferi, F.; Al Yahyaee, S.; Al Jabri, M. Physical and thermal insulation properties of the composites based on seawater-neutralised bauxite residue. J. Hazard. Mater. 2021, 403, 123723. [Google Scholar] [CrossRef]
- García, N.A.W.; Sánchez, J.L.A.; Ortiz, R.V.; Macías, A.H.; Ramírez, N.F.; Palazuelos, E.A.; Valenzuela, J.F.; Beltrán, A.C.; Beltrán, C.G.A. Physical and mechanical properties of unsaturated polyester resin matrix from recycled PET (based PG) with corn straw fiber. J. Appl. Polym. Sci. 2021, 138, 51305. [Google Scholar] [CrossRef]
- Abu-Jdayil, B.; Mourad, A.-H.I.; Hussain, A.; Al Abdallah, H. Thermal insulation and mechanical characteristics of polyester filled with date seed wastes. Constr. Build. Mater. 2022, 315, 125805. [Google Scholar] [CrossRef]
- Abu-Jdayil, B.; Mourad, A.-H.; Hassan, M. Development of polymeric heat insulators based on emirati red shale filler: Thermal and physical properties. Polym. Compos. 2018, 39, E1463–E1473. [Google Scholar] [CrossRef]
- Raju, N.S.; Reddy, M.I.; Kumar, M.A.; Ramji, K. Study on thermo physical properties of hemp, jute and glass fiber reinforced polyester composites. Mater. Today Proc. 2018, 5, 5918–5924. [Google Scholar] [CrossRef]
- Tiskatine, R.; Bougdour, N.; Oaddi, R.; Gourdo, L.; Rahib, Y.; Bouzit, S.; Bazgaou, A.; Bouirden, L.; Ihlal, A.; Aharoune, A. Thermo-physical analysis of low-cost ecological composites for building construction. J. Build. Eng. 2018, 20, 762–775. [Google Scholar] [CrossRef]
- Shi, X.; Jiang, S.; Zhu, J.; Li, G.; Peng, X. Establishment of a highly efficient flame-retardant system for rigid polyu-rethane foams based on bi-phase flame-retardant actions. RSC Adv. 2018, 8, 9985–9995. [Google Scholar] [CrossRef] [Green Version]
- Abu-Jdayil, B.; Mourad, A.-H.; Hittini, W.; Hassan, M.; Hameedi, S. Traditional, state-of-the-art and renewable thermal building insulation materials: An overview. Constr. Build. Mater. 2019, 214, 709–735. [Google Scholar] [CrossRef]
- Sarde, B.; Patil, Y.; Dholakiya, B.; Pawar, V. Effect of calcined kaolin clay on mechanical and durability properties of pet waste-based polymer mortar composites. Constr. Build. Mater. 2022, 318, 126027. [Google Scholar] [CrossRef]
- Khedari, J.; Suttisonk, B.; Pratinthong, N.; Hirunlabh, J. New lightweight composite construction materials with low thermal conductivity. Cem. Concr. Compos. 2001, 23, 65–70. [Google Scholar] [CrossRef]
- Gutiérrez-Orrego, D.A.; Garcia-Aristizabal, E.F.; Gomez-Botero, M.A. Mechanical and Physical Properties of Soil-Cement Blocks Reinforced with Mineral Wool and Sisal Fiber. J. Mater. Civ. Eng. 2017, 29, 04016225. [Google Scholar] [CrossRef]
- Mourad, A.-H.I.; Abu-Jdayil, B.; Hassan, M. Mechanical behavior of Emirati red shale fillers/unsaturated polyester composite. SN Appl. Sci. 2020, 2, 497. [Google Scholar] [CrossRef] [Green Version]
- Badakhsh, A.; Lee, Y.-M.; Rhee, K.Y.; Park, C.W.; An, K.-H.; Kim, B.-J. Improvement of thermal, electrical and mechanical properties of composites using a synergistic network of length controlled-CNTs and graphene nanoplatelets. Compos. Part B Eng. 2019, 175, 107075. [Google Scholar] [CrossRef]
- Kovačević, T.; Rusmirović, J.; Tomić, N.; Mladenović, G.; Milošević, M.; Mitrović, N.; Marinković, A. Effects of oxi-dized/treated non-metallic fillers obtained from waste printed circuit boards on mechanical properties and shrinkage of un-saturated polyester-based composites. Polym. Compos. 2019, 40, 1170–1186. [Google Scholar] [CrossRef]
- Hossain, S.; Chowdhury, A.M.S.; Khan, R.A. Effect of disaccharide, gamma radiation and temperature on the physico-mechanical properties of jute fabrics reinforced unsaturated polyester resin-based composite. Radiat. Eff. Defects Solids 2017, 172, 517–530. [Google Scholar] [CrossRef]


| Samples | T50 | Final Mass Residue % |
|---|---|---|
| PU Dust | 385 | 23.1 |
| 50 vol.% polyurethane | 414 | 6.2 |
| 30 vol.% polyurethane | 413 | 5.1 |
| 10 vol.% polyurethane | 409 | 3.8 |
| Pure polyester | 413 | 3.4839 |
Publisher’s Note: MDPI stays neutral with regard to jurisdictional claims in published maps and institutional affiliations. |
© 2022 by the authors. Licensee MDPI, Basel, Switzerland. This article is an open access article distributed under the terms and conditions of the Creative Commons Attribution (CC BY) license (https://creativecommons.org/licenses/by/4.0/).
Share and Cite
Abu-Jdayil, B.; Al Abdallah, H.; Mlhem, A.; Alkhatib, S.; El Sayah, A.; Hussein, H.; Althabahi, A.; AlAydaroos, A. Utilization of Polyurethane Foam Dust in Development of Thermal Insulation Composite. Buildings 2022, 12, 126. https://doi.org/10.3390/buildings12020126
Abu-Jdayil B, Al Abdallah H, Mlhem A, Alkhatib S, El Sayah A, Hussein H, Althabahi A, AlAydaroos A. Utilization of Polyurethane Foam Dust in Development of Thermal Insulation Composite. Buildings. 2022; 12(2):126. https://doi.org/10.3390/buildings12020126
Chicago/Turabian StyleAbu-Jdayil, Basim, Hyder Al Abdallah, Amal Mlhem, Sarah Alkhatib, Asmaa El Sayah, Hend Hussein, Asayel Althabahi, and Alia AlAydaroos. 2022. "Utilization of Polyurethane Foam Dust in Development of Thermal Insulation Composite" Buildings 12, no. 2: 126. https://doi.org/10.3390/buildings12020126