
Method to Identify the Likelihood of Death in Residential Buildings during Coastal Flooding


Abstract
:1. Introduction
2. Materials and Methods
2.1. State of the Art of Fatality Assessment Methods
2.1.1. General Principles of Fatality Assessment
2.1.2. Methods for Assessing Fatalities
2.1.3. Limits of Fatality Assessments
2.2. VIE Index: A Tool to Locate Buildings Which Could Expose Their Occupants to Death
2.2.1. Context
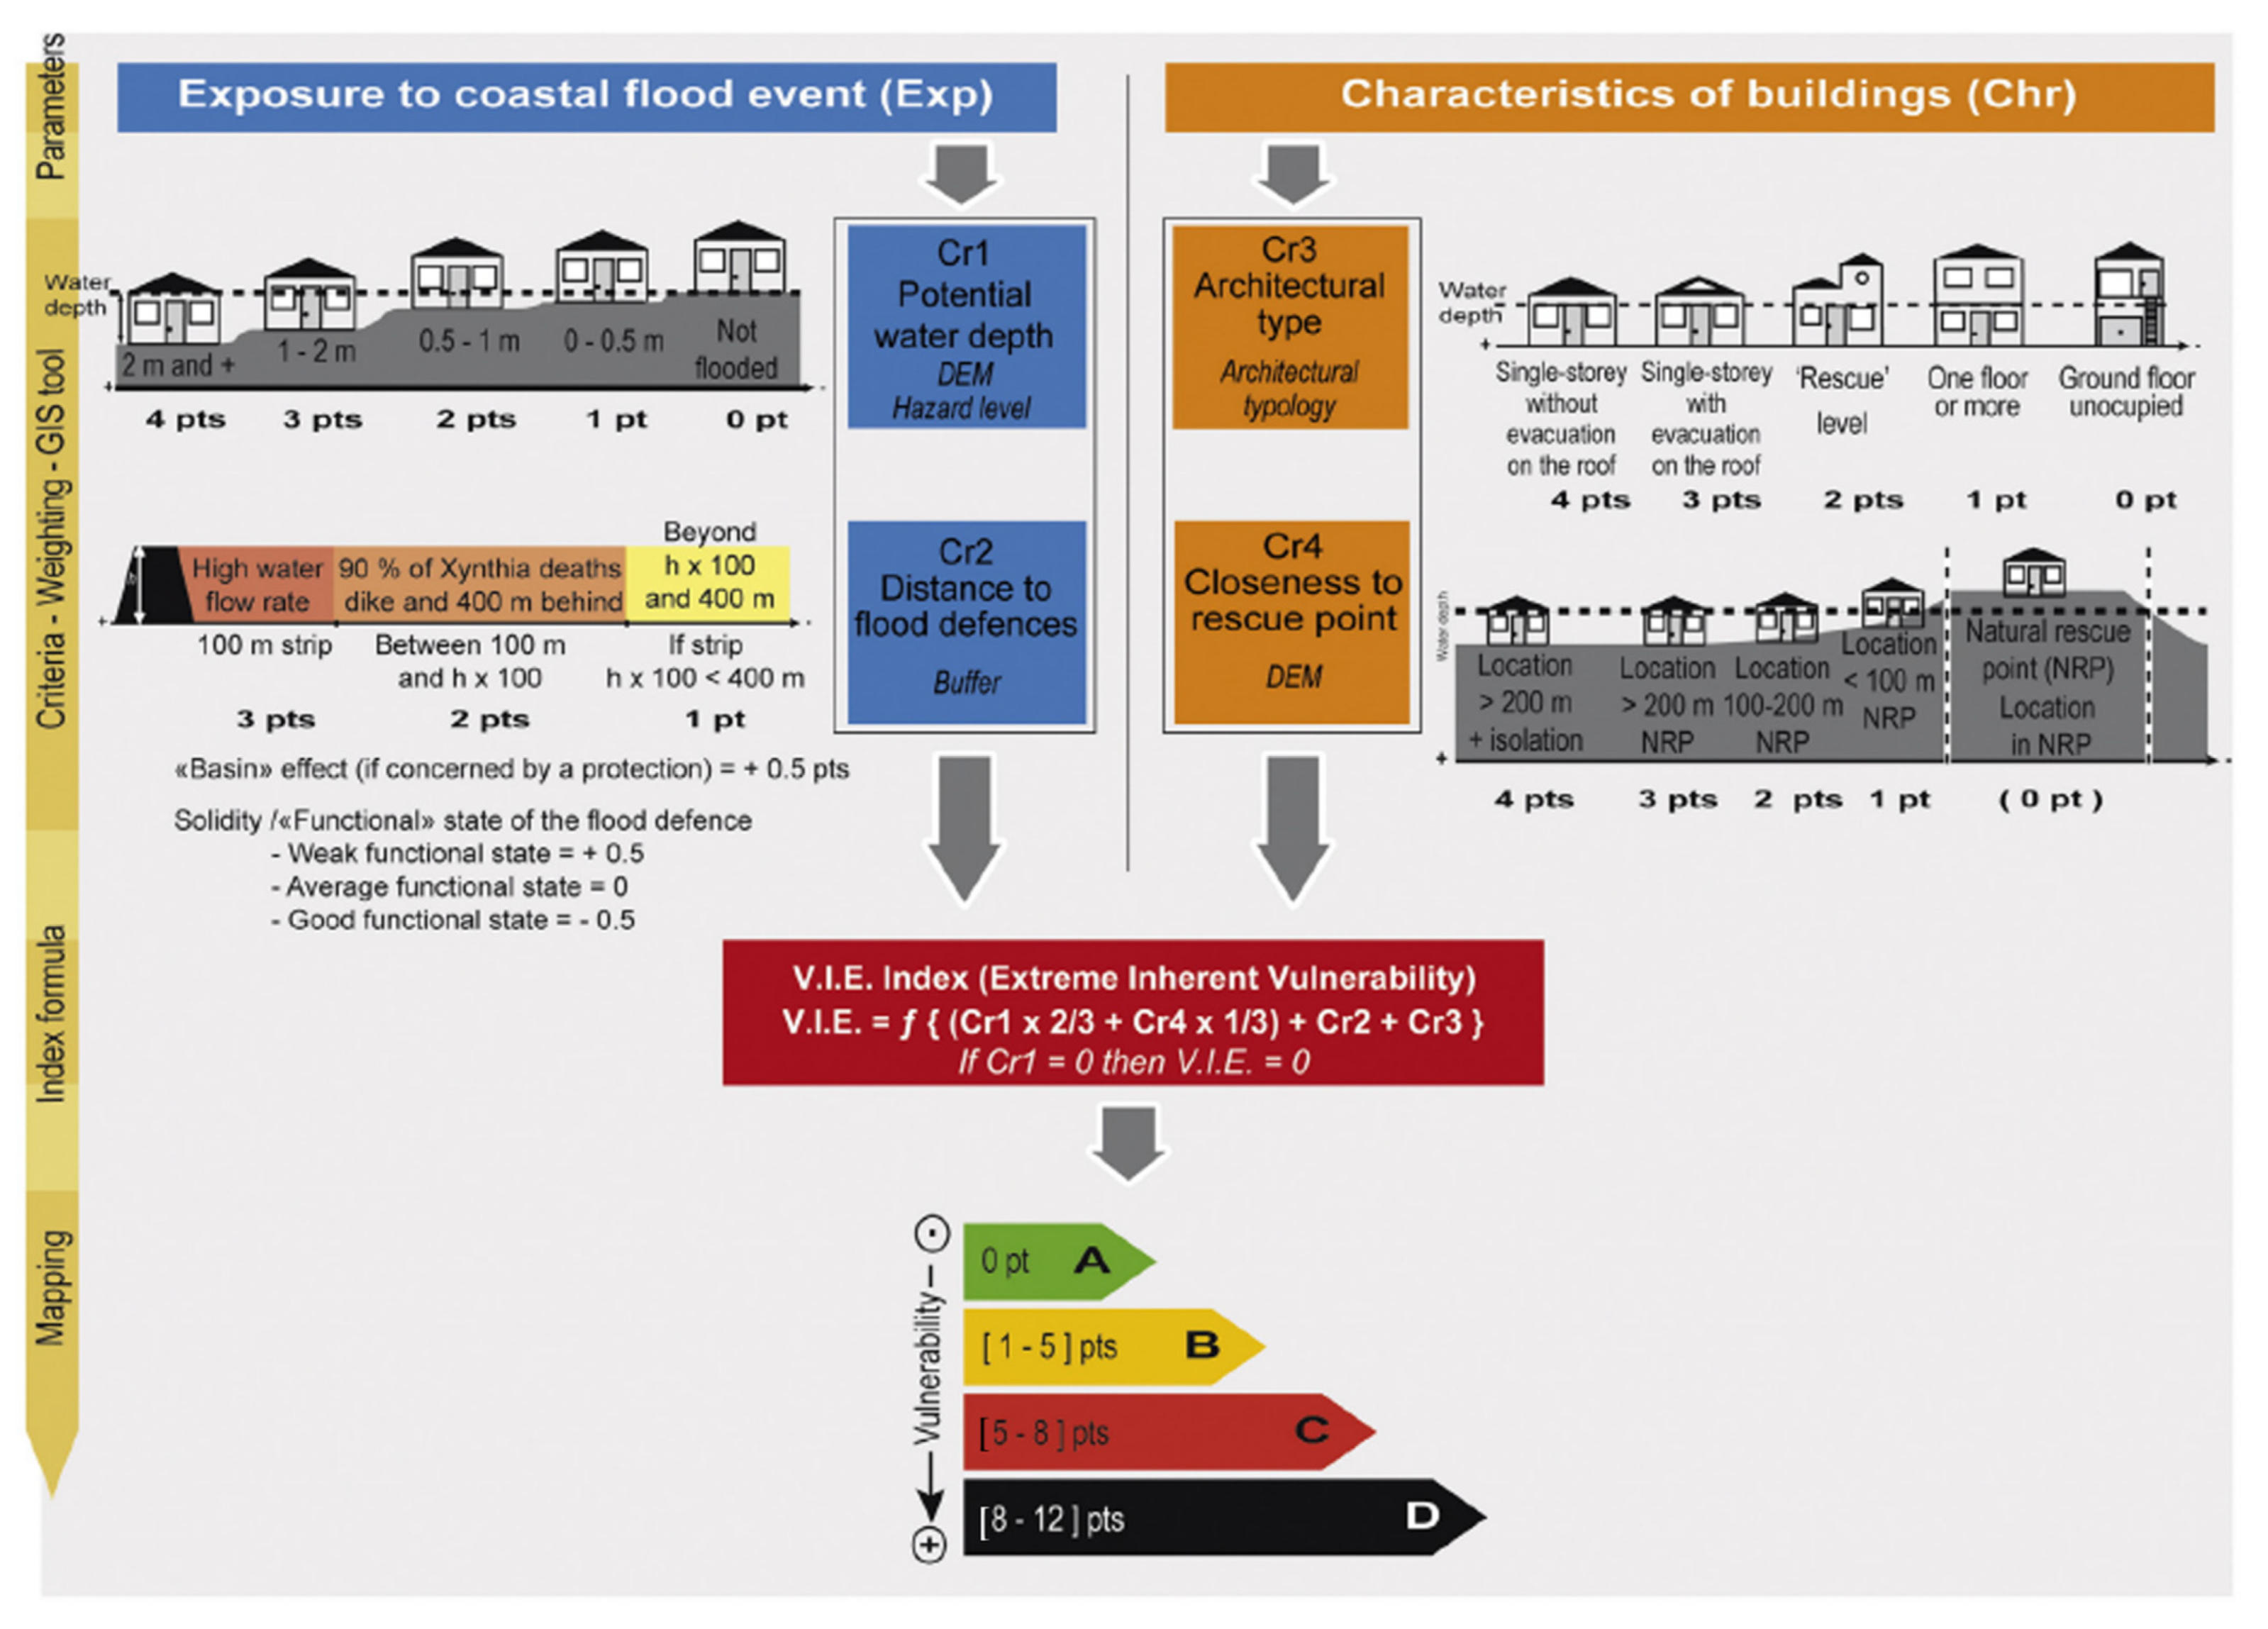
2.2.2. VIE Index Methodology
- Cr1: Potential water depth inside buildings;
- Cr2: Distance to flood defenses;
- Cr3: Architectural typology of buildings, since single-story constructions are more likely to trap people than multi-story buildings, where people could escape upstairs;
- Cr4: Proximity to a rescue point to facilitate ease of evacuation.
- Green class (VIE index = 0): buildings are not exposed to floods and therefore do not endanger people;
- Orange class (VIE index = 1–5): buildings are of a suitable design to reduce risk to people during floods. The level of risk for people is low;
- Red class (VIE index = 5–8): the risk for people is high but non-lethal if appropriate action is taken, except for older, younger, or disabled people;
- Black class (VIE index = 8–12): the risk for people is very high and could result in fatalities in the case of flooding.
2.3. A Derived Method for Evaluating the Risk of Fatalities inside Buildings during Floods
- Focusing on vulnerability more than on hazards;
- Using data about fatalities that occurred inside buildings during Storm Xynthia;
- Incorporating the VIE index method to assess the vulnerability of buildings for people.
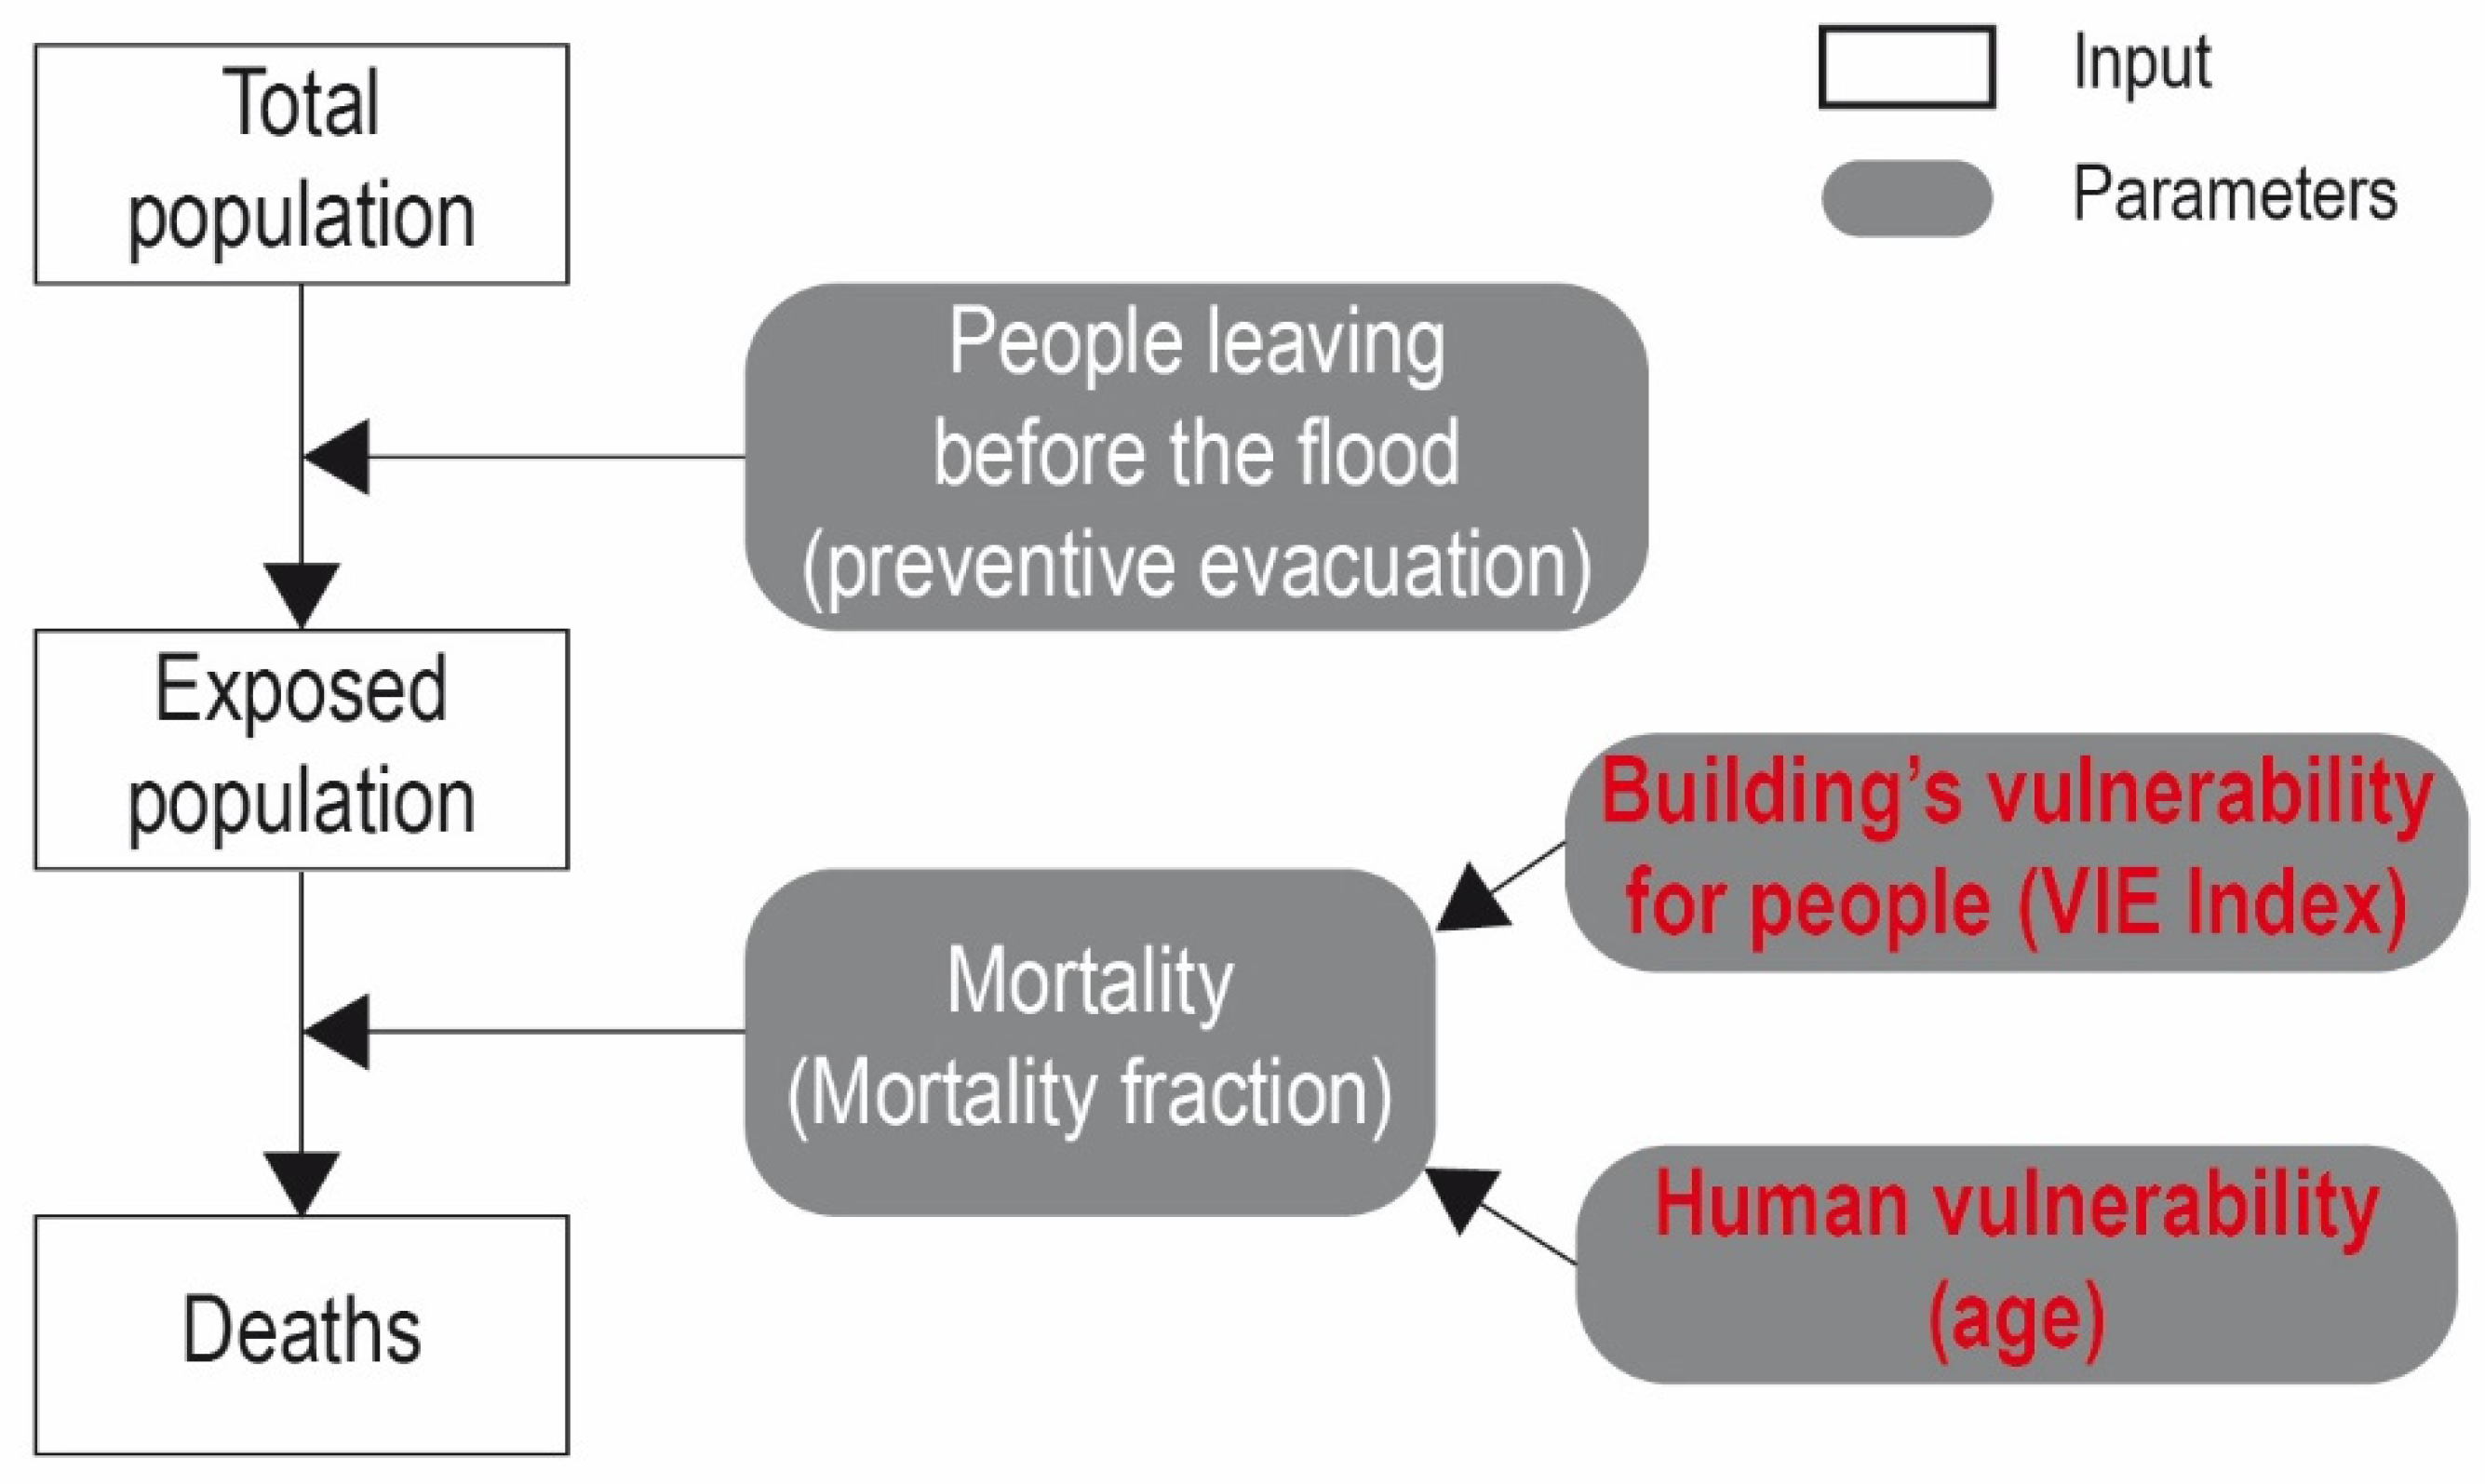
- A relationship between fatalities related to Storm Xynthia and buildings which posed the greatest risk to people, as determined by the VIE index [11]. This allowed us to estimate a parameter close to the FRP framework’s area vulnerability.
- A relationship between the age of deceased people and the total number fatalities. This allowed us to estimate a parameter close to the FRP framework’s people vulnerability.
2.3.1. Lessons Learned from Storm Xynthia’s Fatalities
2.3.2. Estimating a Global Mortality Fraction per Municipality ()
- Age of the local population according to census data;
- Proportion of black and red houses according to the VIE index results.
2.3.3. Estimating the Exposed Population per Municipality (NEXP)
2.3.4. Assessing the Potential Number of Deaths (N)
3. Results
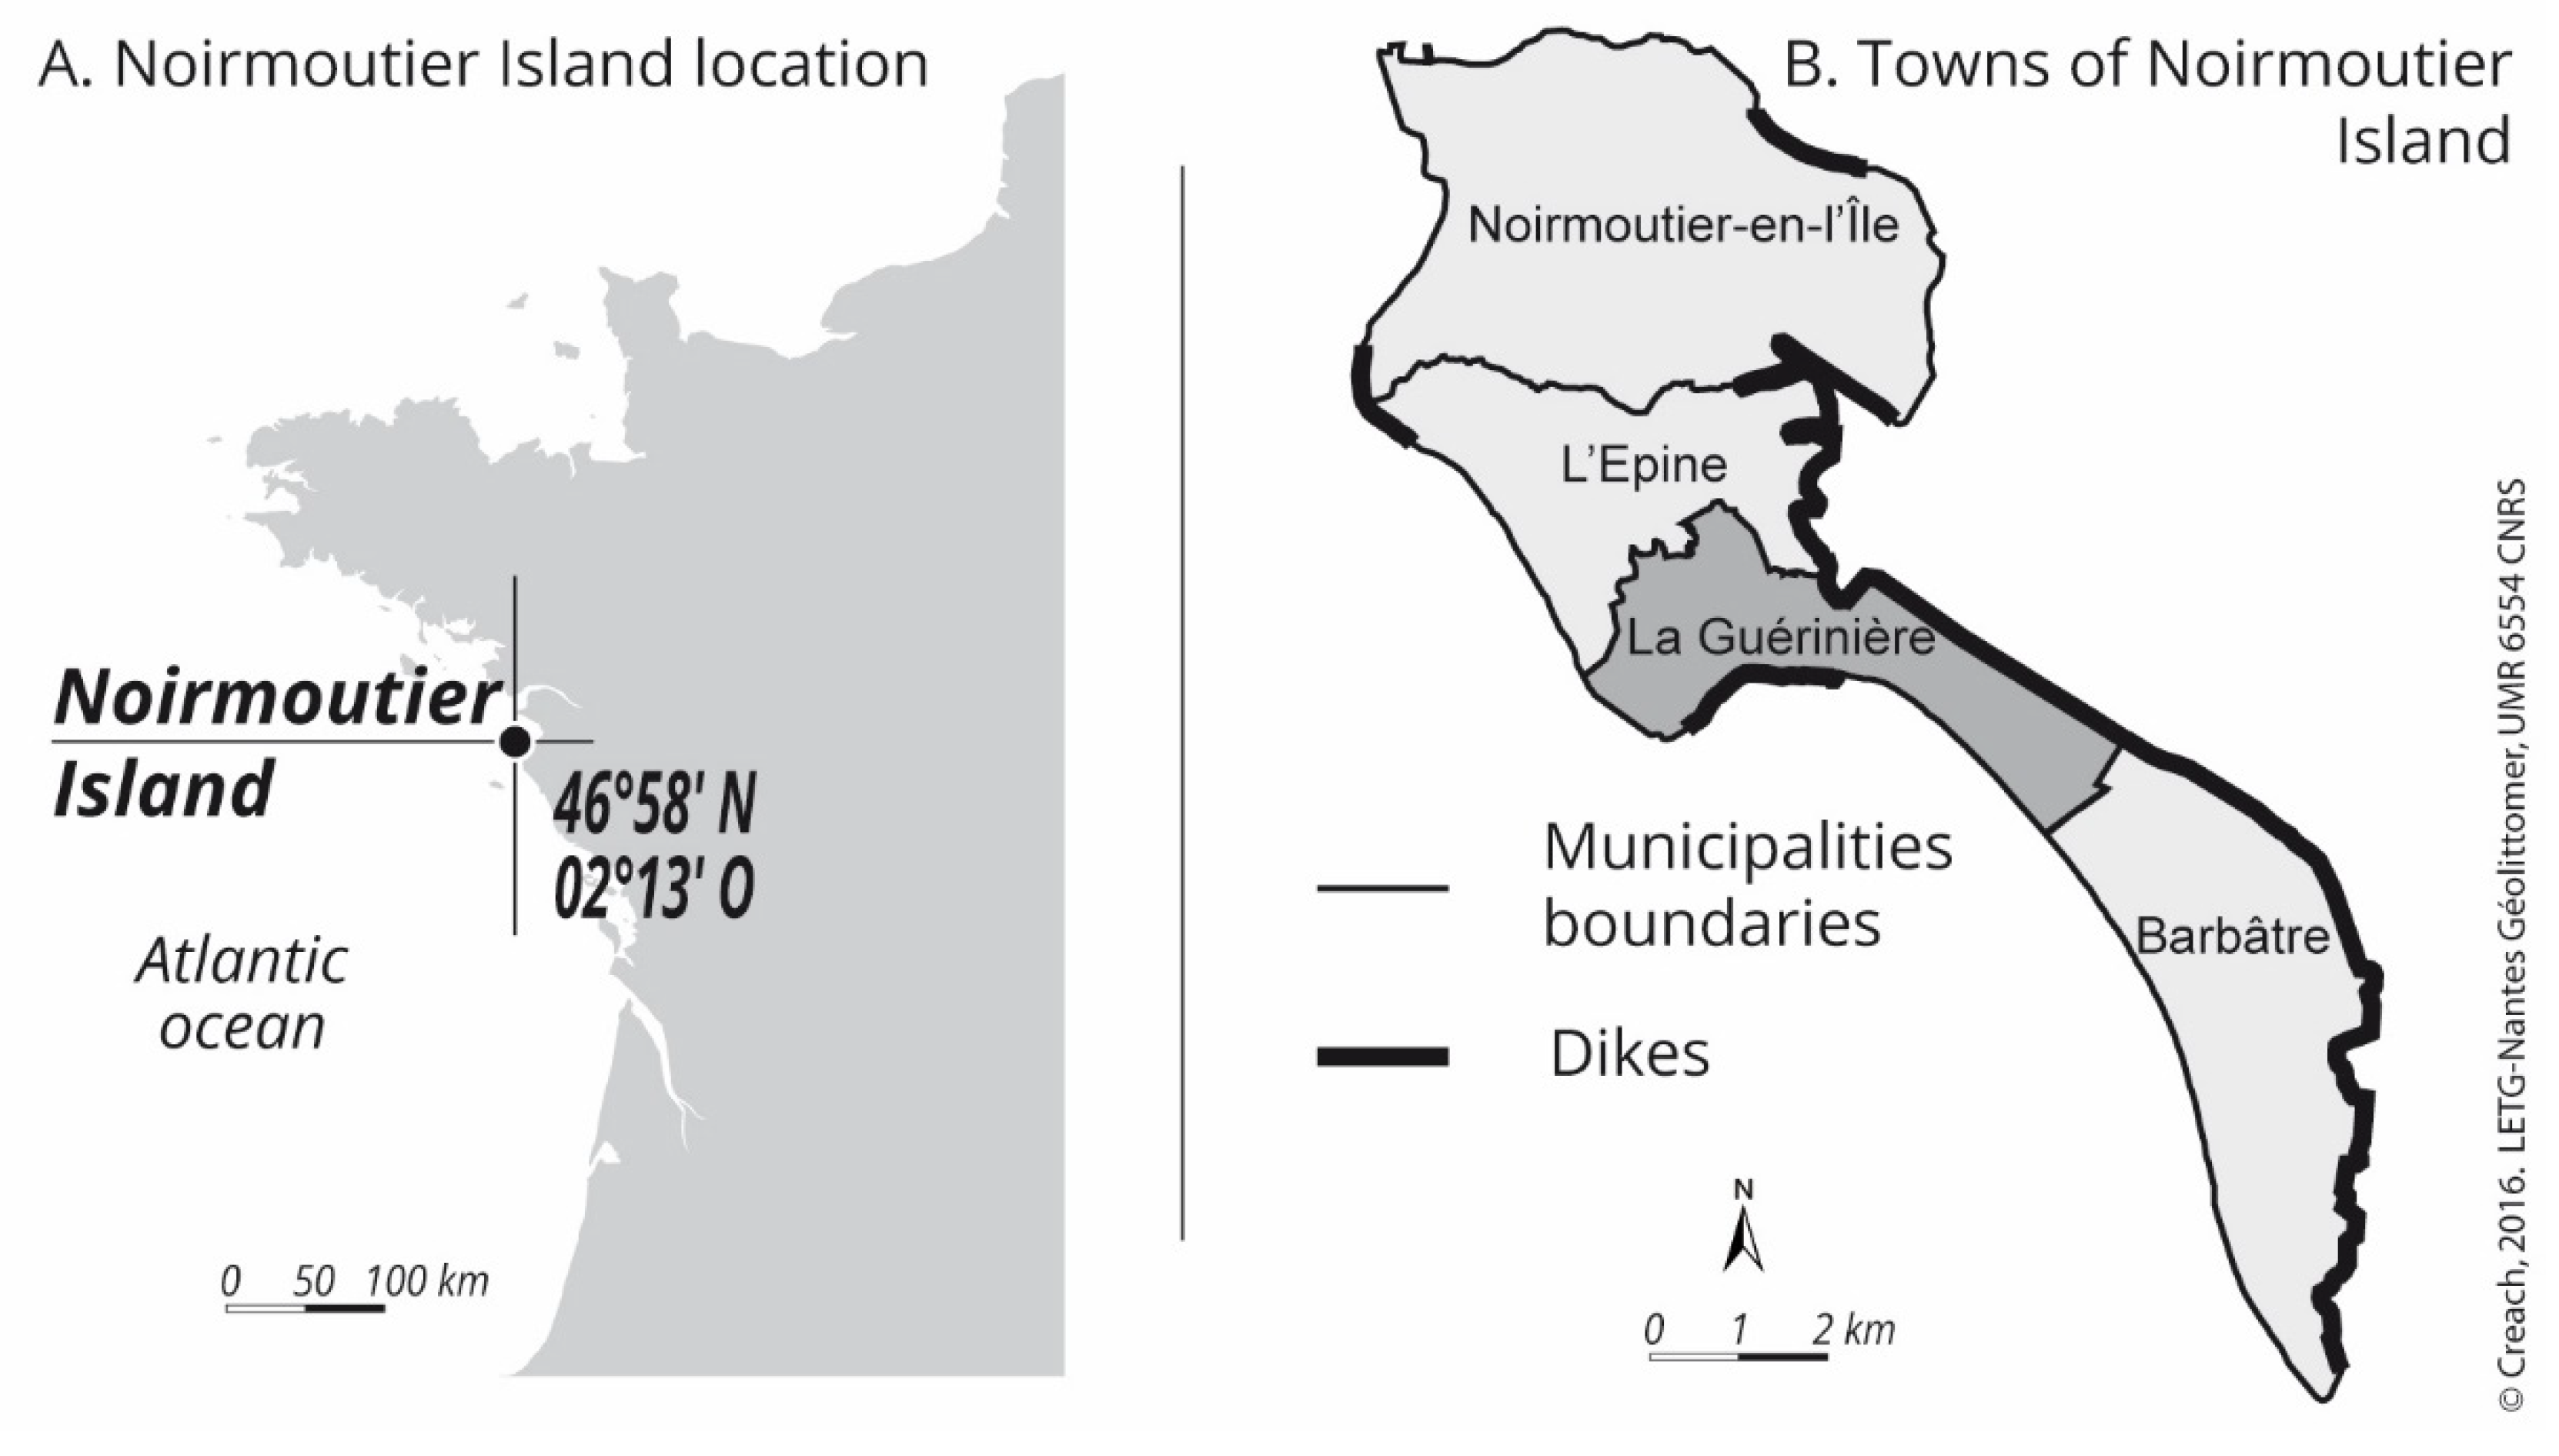
3.1. Study Site
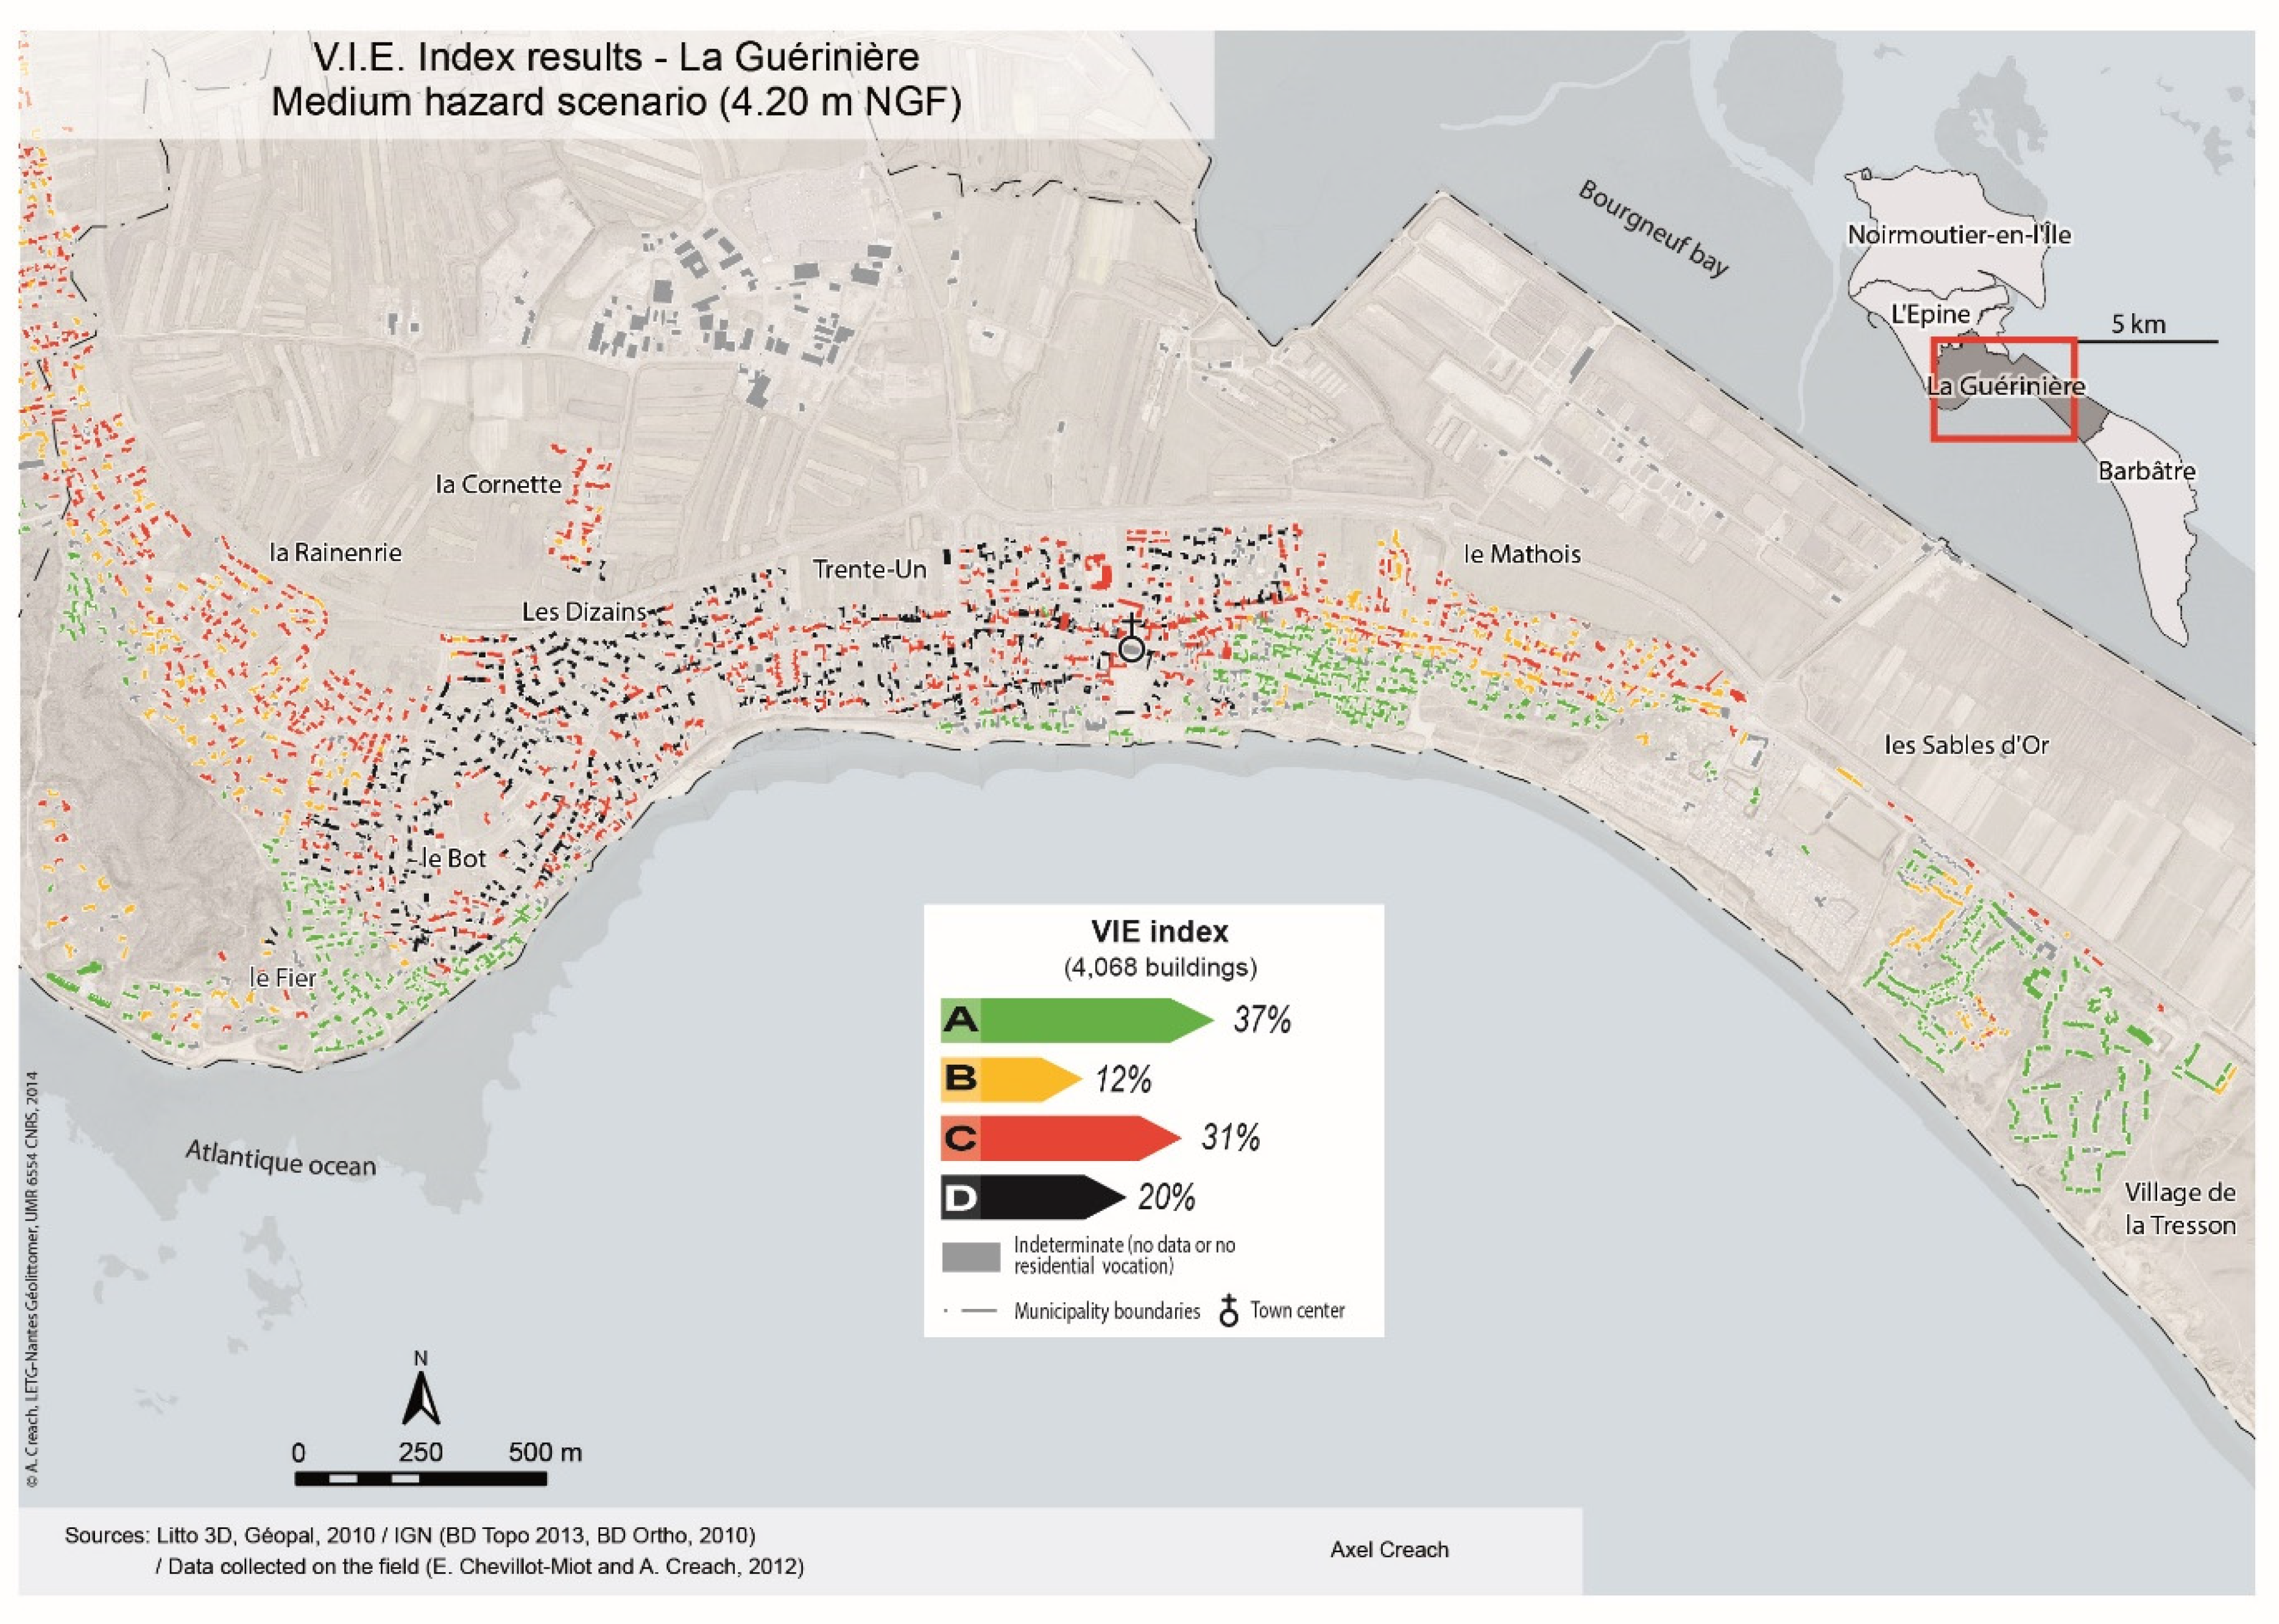
3.2. VIE Index Results
3.3. Potential Fatalities
3.3.1. Estimating the Mortality Fraction (FD)
3.3.2. Estimating the Exposed Population (NEXP)
3.3.3. Number of Potential Fatalities (N)
4. Discussion
5. Conclusions
6. Patents
- Different fatality assessment methods due to floods exist but do not integrate building characteristics;
- The VIE index framework allows one to assess a building’s vulnerability for people;
- Coupled with census data, it allows one to evaluate a specific mortality fraction per municipality;
- This derived fatality assessment method is useful for working on a building’s adaptation.
Author Contributions
Funding
Institutional Review Board Statement
Informed Consent Statement
Data Availability Statement
Acknowledgments
Conflicts of Interest
Appendix A. Estimation of the 1% Value of Deaths in the Case of Storm Xynthia
Appendix B. Calculation of the Mortality Fraction Depending on Building Vulnerability and the Age of Casualties for La Faute-sur-Mer

| Theoritically Flooded (According to VIE Index) for Storm Xynthia | Effectively Flooded for Storm Xynthia | % Effectively or Theoretically Flooded | |
|---|---|---|---|
| Red class | 885 | 604 | 68.2% |
| Black class | 1305 | 1027 | 78.7% |
| Total | 2190 | 1631 | 74.5% |
Appendix B.1. Estimating the Impacted Population (NEXP)
Appendix B.2. Mortality Fraction for People Aged under 15 Living in Black Houses
Appendix B.3. Mortality Fraction for People Aged 15–60 Living in Black Houses
Appendix B.4. Mortality Fraction for People Aged above 60 Living in Black Houses
Appendix B.5. Mortality Fraction for People Aged under 15 Living in Red Houses
Appendix B.6. Mortality Fraction for People Aged 15–60 Living in Red Houses
Appendix B.7. Mortality Fraction for People Aged above 60 Living in Black Houses
Appendix C
| # Line | La Faute-sur-Mer | L’Aiguillon-sur-Mer | Charron | Noirmoutier-en-l’Île | L’Epine | La Guérinière | Barbâtre | ||||||||
| # | % | # | % | # | % | # | % | # | % | # | % | # | % | ||
| (i) | Building’s vulnerability (calculated with VIE Index) | ||||||||||||||
| 1 | Buildings in flood prone area | 2406 | X | 2337 | X | 491 | X | 2227 | X | 1747 | X | 1783 | X | 1775 | X |
| 2 | “Orange” buildings | 216 | X | 253 | X | 187 | X | 1007 | X | 519 | X | 329 | X | 561 | X |
| 3 | “Red” buildings (PR) | 885 | 40.4% | 1262 | 60.6% | 293 | 96.4% | 929 | 76.1% | 1225 | 99.8% | 885 | 60.9% | 1189 | 97.9% |
| 4 | “Black” buildings (PB) | 1305 | 59.6% | 822 | 39.4% | 11 | 3.6% | 291 | 23.9% | 3 | 0.2% | 569 | 39.1% | 25 | 2.1% |
| 5 | Potentially lethal buildings (NRB = #3 + #4) | 2190 | 100% | 2084 | 100% | 304 | 100% | 1220 | 100% | 1228 | 100% | 1454 | 100% | 1214 | 100% |
| Census data (source: INSEE [48]) | |||||||||||||||
| Census’s year | 2006 | 2006 | 2006 | 2011 | 2011 | 2011 | 2011 | ||||||||
| (j) | Population | ||||||||||||||
| 6 | Total population | 1008 | 100% | 2283 | 100% | 2140 | 100% | 4550 | 100% | 1713 | 100% | 1460 | 100% | 1786 | 100% |
| 7 | Under 15 (P−15) | 104 | 10.3% | 225 | 9.9% | 448 | 20.9% | 614 | 13.5% | 204 | 11.9% | 201 | 13.8% | 267 | 14.9% |
| 8 | 15-60 (P15-60) | 451 | 44.7% | 893 | 39.1% | 1259 | 58.8% | 2224 | 48.9% | 802 | 46.8% | 704 | 48.2% | 784 | 43.9% |
| 9 | Above 60 (P+60) | 453 | 44.9% | 1165 | 51.0% | 433 | 20.2% | 1713 | 37.6% | 706 | 41.2% | 554 | 37.9% | 735 | 41.2% |
| Houses | |||||||||||||||
| 10 | Residential houses total | 3737 | 100% | 2334 | 100% | 897 | 100% | 6984 | 100% | 2124 | 100% | 2667 | 100% | 3172 | 100% |
| 11 | Principal houses (PPH) | 499 | 13.4% | 1140 | 48.8% | 839 | 93.5% | 2219 | 31.8% | 846 | 39.8% | 695 | 26.1% | 856 | 27.0% |
| 12 | Secondary houses (PSH) | 3210 | 85.9% | 1116 | 47.8% | 30 | 3.3% | 4554 | 65.2% | 1197 | 56.4% | 1963 | 73.6% | 2221 | 70.0% |
| 13 | Unoccupied houses | 28 | 0.7% | 78 | 3.3% | 29 | 3.2% | 211 | 3.0% | 81 | 3.8% | 9 | 0.3% | 95 | 3.0% |
| Average people per households | |||||||||||||||
| 14 | Average people–Principal houses (NHF = #6/#10) | 2.02 | 2.00 | 2.55 | 2.05 | 2.02 | 2.10 | 2.09 | |||||||
| Standard values (seeSection 2.3) | |||||||||||||||
| Mortality fraction values (FDV) per age and building’s vulnerability | |||||||||||||||
| 15 | FDB–15 | 0.0261 | |||||||||||||
| 16 | FDB15–60 | 0.0120 | |||||||||||||
| 17 | FDB+60 | 0.0538 | |||||||||||||
| 18 | FDR–15 | 0.0222 | |||||||||||||
| 19 | FDR15–60 | 0.0000 | |||||||||||||
| 20 | FDR+60 | 0.0204 | |||||||||||||
| Occupation rate (Tx) per type of houses | |||||||||||||||
| 21 | Tx Principal houses (TPH) | 69.0% | |||||||||||||
| 22 | Tx Secondary houses (TSH) | 31.0% | |||||||||||||
| Mortality fraction (FD) | |||||||||||||||
| FD = [(FDB–15 × P−15) + (FDB15–60 × P15–60) + (FDB+60 × P+60) × PB] + [(FDR–15 × P-15) + (FDR15–60 × P15–60) + (FDR+60 × P+60) × PR] | |||||||||||||||
| 23 | FDMUNICIPALITY = [(#15 × #7) + (#16 × #8) + (#17 × #9) × #4] + [(#18 × #7)+(#19 × #8) + (#20 × #9) × #3] | 2.4% | 2.1% | 0.9% | 1.5% | 1.1% | 1.8% | 1.2% | |||||||
| Exposed population (NEXP) | |||||||||||||||
| NEXP = [PPH × TPH) + (PSH × TSH)] × NRB × NHF | |||||||||||||||
| 24 | NEXPMUNICIPALITY = [(#11 × #21) + (#12 + #22)] × #5 × #14 | 1587 | 2025 | 508 | 1054 | 1118 | 1247 | 1022 | |||||||
| Number of potential fatalities (N = FDMUNICIPALITY × NEXPMUNICIPALITY) | |||||||||||||||
| 25 | N = #23 × #24 | 38 | 43 | 5 | 16 | 12 | 23 | 12 | |||||||
References
- Jonkman, S.N.; Kelman, I. An analysis of the causes and circumstances of flood disaster deaths. Disasters 2005, 29, 75–97. [Google Scholar] [CrossRef]
- Jonkman, S.N.; Maaskant, B.; Boyd, E.; Levitan, M.L. Loss of Life Caused by the Flooding of New Orleans after Hurricane Katrina: Analysis of the Relationship between Flood Characteristics and Mortality. Risk Anal. Off. Publ. Soc. Risk Anal. 2009, 29, 676–698. [Google Scholar] [CrossRef]
- Vinet, F.; Lumbroso, D.; Defossez, S.; Boissier, L. A Comparative Analysis of the Loss of Life during Two Recent Floods in France: The Sea Surge Caused by the Storm Xynthia and the Flash Flood in Var. Nat. Hazards 2012, 61, 1179–1201. [Google Scholar] [CrossRef]
- Vinet, F.; Boissier, L.; Defossez, S. La Mortalité Comme Expression de La Vulnérabilité Humaine Face Aux Catastrophes Naturelles: Deux Inondations Récentes En France (Xynthia, Var, 2010). VertigO—Rev. Électron. Sci. Environ. 2011, 11, 28. [Google Scholar] [CrossRef]
- Boissier, L. La Mortalité Liée Aux Crues Torentielles Dans le Sud de la France: Une Approche de la Vulnérabilité Humaine Face au Risque D’inondation. Ph.D. Thesis, Université Paul Valéry-Montpellier III, Montpellier, France, 2013. [Google Scholar]
- Kolen, B.; Slomp, R.; Jonkman, S.N. The Impacts of Storm Xynthia February 27–28, 2010 in France: Lessons for Flood Risk Management. J. Flood Risk Manag. 2013, 6, 261–278. [Google Scholar] [CrossRef]
- Creach, A.; Pardo, S.; Guillotreau, P.; Mercier, D. The Use of a Micro-Scale Index to Identify Potential Death Risk Areas Due to Coastal Flood Surges: Lessons from Storm Xynthia on the French Atlantic Coast. Nat. Hazards 2015, 77, 1679–1710. [Google Scholar] [CrossRef]
- Cour des Comptes. Les Enseignements des Inondations de 2010 sur le Littoral Atlantique (Xynthia) et Dans le Var; Cours des Comptes: Paris, France, 2012; p. 299. [Google Scholar]
- Mercier, D.; Chadenas, C. La tempête Xynthia et la cartographie des « zones noires » sur le littoral français: Analyse critique à partir de l’exemple de La Faute-sur-Mer (Vendée). Norois 2012, 222, 45–60. [Google Scholar] [CrossRef] [Green Version]
- Pitié, C.; Bellec, P.; Maillot, H.; Nadeau, J.; Puech, P. Expertise des Zones de Solidarité Xynthia en Charente-Maritime; CGEDD/MEEDDM: Paris, France, 2011; p. 186. [Google Scholar]
- Pitié, C.; Puech, P. Expertise Complémentaire des Zones de Solidarité Délimitées en Vendée Suite à la Tempête Xynthia Survenue Dans la Nuit du 27 au 28 Février 2010; CGEDD/MEEDDM: Paris, France, 2010; p. 80. [Google Scholar]
- CETMEF; CETE Méditerranée; CETE Ouest. Vulnérabilité du Territoire National Aux Risques Littoraux; CETMEF/DLCE: Plouzané, France, 2009; p. 163. [Google Scholar]
- MEDDE. Mieux Savoir Pour Mieux Agir: Principaux Enseignements de la Première Evaluation des Risques D’inondation sur le Territoire Français-EPRI 2011; MEDDE: Paris, France, 2012; p. 72. [Google Scholar]
- Nicholls, R.J.; Brown, S.; Hanson, S.; Hinkel, J. Economics of Coastal Zone Adaptation to Climate Change; The World Bank: Washington, DC, USA, 2010; p. 62. [Google Scholar]
- Creach, A. Coastlines with Increased Vulnerability to Sea-level Rise. In Spatial Impacts of Climate Change; ISTE Ltd.: London, UK; John Wiley and Sons Inc.: Hoboken, NJ, USA, 2021; pp. 71–92. ISBN 978-1-78945-009-5. [Google Scholar]
- IPCC. IPCC Special Report on the Ocean and Cryosphere in a Changing Climate; IPCC: Geneva, Switzerland, 2019; p. 1170. [Google Scholar]
- Jonkman, S.N.; Bočkarjova, M.; Kok, M.; Bernardini, P. Integrated Hydrodynamic and Economic Modelling of Flood Damage in the Netherlands. Ecol. Econ. 2008, 66, 77–90. [Google Scholar] [CrossRef]
- Vinet, F. Le Risque Inondation. Diagnostic et Gestion; Sciences du risque et du danger; Tec & Doc Lavoisier: Paris, France, 2010; ISBN 978-2-7430-1263-2. [Google Scholar]
- Yang, Q.; Zheng, X.; Jin, L.; Lei, X.; Shao, B.; Chen, Y. Research Progress of Urban Floods under Climate Change and Urbanization: A Scientometric Analysis. Buildings 2021, 11, 628. [Google Scholar] [CrossRef]
- Brazdova, M.; Riha, J. A Simple Model for the Estimation of the Number of Fatalities Due to Floods in Central Europe. Nat. Hazards Earth Syst. Sci. 2014, 14, 1663–1676. [Google Scholar] [CrossRef] [Green Version]
- Di Mauro, M.; Bruijn, K.M.D.; Meloni, M. Quantitative Methods for Estimating Flood Fatalities: Towards the Introduction of Loss-of-Life Estimation in the Assessment of Flood Risk. Nat. Hazards 2012, 63, 1083–1113. [Google Scholar] [CrossRef]
- Koshimura, S.; Oie, T.; Yanagisawa, H.; Imamura, F. Developing Fragility Functions for Tsunami Damage Estimation Using Numerical Model and Post-Tsunami Data from Banda Aceh, Indonesia. Coast. Eng. J. 2009, 51, 243–273. [Google Scholar] [CrossRef] [Green Version]
- Marchand, M.; Buurman, J.; Pribadi, A.; Kurniawan, A. Damage and Casualties Modelling as Part of a Vulnerability Assessment for Tsunami Hazards: A Case Study from Aceh, Indonesia. J. Flood Risk Manag. 2009, 2, 120–131. [Google Scholar] [CrossRef]
- Zhai, G.; Fukuzono, T.; Ikeda, S. An Empirical Model of Fatalities and Injuries Due to Floods in Japan. JAWRA J. Am. Water Resour. Assoc. 2006, 42, 863–875. [Google Scholar] [CrossRef]
- Jonkman, S.N.; van Gelder, P.H.A.J.M.; Vrijling, J.K. An Overview of Quantitative Risk Measures for Loss of Life and Economic Damage. J. Hazard. Mater. 2003, 99, 1–30. [Google Scholar] [CrossRef]
- Di Mauro, M.; Lumbroso, D.M. Hydrodynamic and Loss of Life Modelling for the 1953 Canvey Island Flood; Keble College: Oxford, UK, 2008; pp. 1117–11126. [Google Scholar]
- Klijn, F.; Baan, P.; De Bruijn, K.M.; Kwadijk, J. Overstromingsrisico’s in Nederland in een Veranderend Klimaat. Verwachtingen, Schattingen en Berekeningen voor het Project Nederland Later; Delft Hydraulics: Delft, The Netherlands, 2007; p. 165. [Google Scholar]
- Johnstone, W.M.; Sakamoto, D.; Assaf, H.; Bourban, S. Architecture, Modelling Framework and Validation of BC Hydro’s Virtual Reality Life Safety Model. In Proceedings of the ISSH 2005, Nijmegen, The Netherlands, 23–24 May 2005. [Google Scholar]
- Lumbroso, D.; Sakamoto, D.; Johnstone, W.; Tagg, A.; Lence, B. The Development of a Life Safety Model to Estimate the Risk Posed to People by Dam Failures and Floods. Dams Reserv. 2011, 21, 21. [Google Scholar] [CrossRef] [Green Version]
- HR Wallingford; Middlesex University; Risk & Policy Analysts Ltd. Flood Risks to People—Phase 2: The Flood Risks to People Methodology; Defra/Environment Agency: London, UK, 2006; p. 103. [Google Scholar]
- HR Wallingford; Middlesex University; Risk & Policy Analysts Ltd. Flood Risks to People—Phase 2: Guidance Document; Defra/Environment Agency: London, UK, 2006; p. 91. [Google Scholar]
- HR Wallingford; Risk & Policy Analysts Ltd.; Middlesex University. Flood Risks to People—Phase 1; Defra/Environment Agency: London, UK, 2003; p. 123.
- Crone, J. Comparing Census Data with Other Geographical Data. Support Census Geography Course; University of Edinburgh: Scoteland, UK, 2013. [Google Scholar]
- Priest, S.; Wilson, T.; Tapsell, S.; Penning-Rowsell, E.; Viavattene, C.; Fernandez-Bilbao, A. Building a Model to Estimate Risk to Life for European Flood Events; Middlesex University, HR Wallingford: London, UK, 2007; p. 185. [Google Scholar]
- Jonkman, S.N. Loss of Life Estimation in Flood Risk Assessment; Theory and Applications; Delft University of Technology: Delft, The Netherlands, 2007. [Google Scholar]
- Di Mauro, M.; de Bruijn, K.M. Application and Validation of Mortality Functions to Assess the Consequences of Flooding to People. J. Flood Risk Manag. 2012, 5, 92–110. [Google Scholar] [CrossRef]
- Waarts, P.H. Method for Determining Loss of Life Caused by Inundation; TU Delft Faculty of Industrial Design Engineering: Delft, The Netherlands, 1992. [Google Scholar]
- Vrouwenvelder, A.C.W.M.; Steenhuis, C.M. Secondary Flood Defences in the HoekscheWaard, Calculation of the Number of Fatalities for Various Flood Scenarios; TU Delft Faculty of Industrial Design Engineering: Delft, The Netherlands, 1997. [Google Scholar]
- Jonkman, S.N.; Vrijling, J.K.; Vrouwenvelder, A.C.W.M. Methods for the Estimation of Loss of Life Due to Floods: A Literature Review and a Proposal for a New Method. Nat. Hazards 2008, 46, 353–389. [Google Scholar] [CrossRef] [Green Version]
- Nofal, O.M.; van de Lindt, J.W.; Cutler, H.; Shields, M.; Crofton, K. Modeling the Impact of Building-Level Flood Mitigation Measures Made Possible by Early Flood Warnings on Community-Level Flood Loss Reduction. Buildings 2021, 11, 475. [Google Scholar] [CrossRef]
- Magnan, A.; Duvat, V. Des Catastrophes... “Naturelles”? Essais et Documents; Editions Le Pommier: Paris, France, 2014; ISBN 978-2-7465-0679-4. [Google Scholar]
- Dall’Osso, F.; Gonella, M.; Gabbianelli, G.; Withycombe, G.; Dominey-Howes, D. Assessing the Vulnerability of Buildings to Tsunami in Sydney. Nat. Hazards Earth Syst. Sci. 2009, 9, 2015–2026. [Google Scholar] [CrossRef] [Green Version]
- Dall’Osso, F.; Dominey-Howes, D. A Method for Assessing the Vulnerability of Buildings to Catastrophic (Tsunami) Marine Flooding; Sydney Coastal Councils Group Inc.: Sydney, Australia, 2009; p. 138. [Google Scholar]
- Gauraz, A.L.; Valencia, N.; Koscielny, M.; Guillande, R.; Gardi, A.; Leone, F.; Salaun, T. Tsunami Damages Assessment: Vulnerability Functions on Buildings Based on Field and Earth Observation Survey. In Proceedings of the EGU General Assembly Conference Abstracts, Vienna, Austria, 19–24 April 2009; Volume 11, p. 5785. [Google Scholar]
- Gonzalez-Riancho, P.; Aguirre-Ayerbe, I.; Garcia-Aguilar, O.; Medina, R.; Gonzalez, M.; Aniel-Quiroga, I.; Gutierrez, O.Q.; Alvarez-Gomez, J.A.; Larreynaga, J.; Gavidia, F. Integrated Tsunami Vulnerability and Risk Assessment: Application to the Coastal Area of El Salvador. Nat. Hazards Earth Syst. Sci. NHESS 2014, 14, 1223–1244. [Google Scholar] [CrossRef] [Green Version]
- Leone, F.; Lavigne, F.; Paris, R.; Denain, J.-C.; Vinet, F. A Spatial Analysis of the December 26th, 2004 Tsunami-Induced Damages: Lessons Learned for a Better Risk Assessment Integrating Buildings Vulnerability. Appl. Geogr. 2011, 31, 363–375. [Google Scholar] [CrossRef]
- Mück, M.; Taubenböck, H.; Post, J.; Wegscheider, S.; Strunz, G.; Sumaryono, S.; Ismail, F.A. Assessing Building Vulnerability to Earthquake and Tsunami Hazard Using Remotely Sensed Data. Nat. Hazards 2013, 68, 97–114. [Google Scholar] [CrossRef]
- Reese, S.; Cousins, W.J.; Power, W.L.; Palmer, N.G.; Tejakusuma, I.G.; Nugrahadi, S. Tsunami Vulnerability of Buildings and People in South Java—Field Observations after the July 2006 Java Tsunami. Nat. Hazards Earth Syst. Sci. 2007, 7, 573–589. [Google Scholar] [CrossRef]
- Kelman, I.; Spence, R. An overview of flood actions on buildings. Eng. Geol. 2004, 73, 297–309. [Google Scholar] [CrossRef]
- Devaux, E.; Désiré, G.; Boura, C.; Lowenbruck, J.; Bérenger, N.; Rouxel, N.; Romain, N. La Tempête Xynthia du 28 Février 2010—Retour D’expérience en Loire-Atlantique et Vendée-Volet Hydaulique et Ouvrages de Protection; CETE-Ouest/DREAL Pays-de-la-Loire/DDTM Loire-Atlantique/DDTM Vendée: Nantes, France, 2012; p. 78. [Google Scholar]
- INSEE. Recensement Général de la Population 2011 (Publié le 26 Juin 2014); INSEE: Paris, France, 2014. [Google Scholar]
- Creach, A.; Pardo, S.; Mercier, D. Diagnostic préventif de la vulnérabilité des constructions résidentielles pour leurs occupants face au risque de submersion marine appliqué à l’île de Noirmoutier (Vendée, France). VertigO—Rev. Électron. Sci. Environ. 2017, 17, 30. [Google Scholar] [CrossRef]
- Creach, A.; Chevillot-Miot, E.; Mercier, D.; Pourinet, L. Vulnerability to Coastal Flood Hazard of Residential Buildings on Noirmoutier Island (France). J. Maps 2015, 12, 371–381. [Google Scholar] [CrossRef]
- Eugène, J.-L. Principales Catastrophes et Cataclysmes Dans l’Île de Noirmoutier Depuis le IIIème siècle: Répertoire–Causes–Remèdes-Vers L’établissement d’un Plan de Prévention des Risques Naturels; Vivre l’île 12 sur 12: Noirmoutier, France, 2016; p. 23. [Google Scholar]
- Garnier, E.; Henry, N.; Desarthe, J. Visions croisées de l’historien et du courtier en réassurance sur les submersions: Recrudescence de l’aléa ou vulnérabilisation croissante? In Gestion des Risques Naturels—Leçons de la Tempête Xynthia; Matière à débattre et décider; Quae: Versailles, France, 2012; p. 23. ISBN 978-2-7592-1820-2. [Google Scholar]
- Fattal, P.; Robin, M.; Paillart, M.; Maanan, M.; Mercier, D.; Lamberts, C.; Costa, S. Effets des tempêtes sur une plage aménagée et à forte protection côtière: La plage des Éloux (côte de Noirmoutier, Vendée, France). Norois 2010, 215, 101–114. [Google Scholar] [CrossRef] [Green Version]
- Creach, A.; Bastidas-Arteaga, E.; Pardo, S.; Mercier, D. Vulnerability and costs of adaptation strategies for housing subjected to flood risks: Application to La Guérinière France. Mar. Policy 2020, 117, 103438. [Google Scholar] [CrossRef] [Green Version]
- Chauvet, A.; Renard, J. La Vendée. Le Pays. Les Hommes; Editions du Cercle d’or: Les Sables-d’Olonne, France, 1978. [Google Scholar]
- Garnier, E.; Surville, F. La Tempête Xynthia Face à L’histoire; Submersions et Tsunamis sur les Littoraux Français du Moyen Âge à nos Jours; Le Croît Vif: Saintes, France, 2010; ISBN 978-2-36199-009-1. [Google Scholar]
- Chadenas, C.; Creach, A.; Mercier, D. The Impact of Storm Xynthia in 2010 on Coastal Flood Prevention Policy in France. J. Coast. Conserv. 2013, 18, 529–538. [Google Scholar] [CrossRef]
- Creach, A. Cartographie et Analyse Economique de la Vulnérabilité du Littoral Atlantique Français Face au Risque de Submersion Marine (2 Volumes). Ph.D. Thesis, Université de Nantes, Nantes, France, 2015. [Google Scholar]
- MEDDTL. Circulaire du 27 Juillet 2011 Relative à la Prise en Compte du Risque de Submersion Marine Dans Les Plans de Prévention des Risques Naturels Littoraux. Available online: https://www.bulletin-officiel.developpement-durable.gouv.fr/notice?id=Bulletinofficiel-0025182&reqId=9497407c-3c16-4990-b1e9-687cb5e0ba7a&pos=8 (accessed on 19 January 2022).
- Bontet, C.; Blondy, C.; Donnat, S.; Plumejeaud, C.; Riollet, J.-P.; Vacher, L.; Vermandé, M.; Vye, D. Propriétaires et Usages des Résidences Secondaires en Charente-Maritime; UMR LIENSs CNRS-Université de La Rochelle, Charente-Maritime Tourisme, CCI La Rochelle & CCI Rochefort et Saintonge: La Rochelle, France, 2016; p. 65. [Google Scholar]
- Bontet, C.; Plumejeaud-Perreau, C.; Blondy, C.; Vacher, L.; Vye, D. Does Inhabitants Having a Second Home Play Only a Second Role in Coastal Territories? A Case-Study in Charente-Maritime (France). In Proceedings of the New Perspectives on Second Homes, Tourism, Leisure and Global Change Commission, Stockholm, Sweden, 9–11 June 2014. [Google Scholar]
- Gerritsen, H. What Happened in 1953? The Big Flood in the Netherlands in Retrospect. Philos. Transact. A Math. Phys. Eng. Sci. 2005, 363, 1271–1291. [Google Scholar] [CrossRef]
- Nicholls, R. Planning for the Impacts of Sea Level Rise. Oceanography 2011, 24, 144–157. [Google Scholar] [CrossRef]


| Type or Scale | Method | Advantages | Drawbacks |
|---|---|---|---|
| Micro | Life Safety Model (LSM) | Realistic, accurate locations of deaths | Technical, fine data needed for modulization |
| Macro | Flood Risk to People (FRP) | Takes into account several dimensions of vulnerability | Data not fully available in France |
| Macro | Mortality functions | Easy to use | Mainly driven by hazard characteristics |
| Model | Sourced | Factors Applied | Data Obtained from Real Floods (HP) or Laboratory Research (L) | ||||||
|---|---|---|---|---|---|---|---|---|---|
| Water Depth | Water Velocity | Rate of Water Level Rise | Warning and Evacuation | Prepardness | Collapse of Buildings | Vulnerability of Individuals (Weight, Height, Gender, Clothing) | |||
| LSM | Lumbroso et al. [29] | X | X | X | X | X | |||
| Mortality Functions | Waarts [37] | X | X | X | X | HP | |||
| Vrouwenvelder and Steenhuis [38] | X | X | X | X | HP | ||||
| Jonkman [35,39] | X | X | X | X | X | HP/L | |||
| FRP | HR Wallingford et al. [31,32] | X | X | X | X | X | X | HP | |
| Priest [34] | X | X | X | X | X | HP | |||
| Number of Deaths | % of Total (29 Deaths) | ||
|---|---|---|---|
| Total Number of Deaths | 29 | 100% | |
| Deaths distribution depending on vulnerability class | Black | 24 | 83% |
| Red | 5 | 17% | |
| Deaths distribution depending on age | Under 15 | 3 | 10% |
| 15–60 | 4 | 14% | |
| Above 60 | 22 | 76% | |
| Deaths distribution depending on occupation | Principal houses | 20 | 69% |
| Secondary houses | 9 | 31% | |
| VIE Index Typology | Age Category | Mortality Fraction |
|---|---|---|
| Black class | ) | 2.61% |
| 1.20% | ||
| ) | 5.38% | |
| Red class | ) | 2.22% |
| 0% | ||
| ) | 2.04% |
| Class | Number of Buildings | % of Buildings among “Total Identified Buildings” |
|---|---|---|
| Green class | 1034 | 37% |
| Orange class | 329 | 12% |
| Red class | 885 | 31% |
| Black class | 569 | 20% |
| Total identified buildings | 2817 | 100% |
| Non-identified buildings | 1251 | ø |
| Total buildings | 4068 | ø |
Publisher’s Note: MDPI stays neutral with regard to jurisdictional claims in published maps and institutional affiliations. |
© 2022 by the authors. Licensee MDPI, Basel, Switzerland. This article is an open access article distributed under the terms and conditions of the Creative Commons Attribution (CC BY) license (https://creativecommons.org/licenses/by/4.0/).
Share and Cite
Creach, A.; Bastidas-Arteaga, E.; Pardo, S.; Mercier, D. Method to Identify the Likelihood of Death in Residential Buildings during Coastal Flooding. Buildings 2022, 12, 125. https://doi.org/10.3390/buildings12020125
Creach A, Bastidas-Arteaga E, Pardo S, Mercier D. Method to Identify the Likelihood of Death in Residential Buildings during Coastal Flooding. Buildings. 2022; 12(2):125. https://doi.org/10.3390/buildings12020125
Chicago/Turabian StyleCreach, Axel, Emilio Bastidas-Arteaga, Sophie Pardo, and Denis Mercier. 2022. "Method to Identify the Likelihood of Death in Residential Buildings during Coastal Flooding" Buildings 12, no. 2: 125. https://doi.org/10.3390/buildings12020125