
Carbon Peak and Carbon Neutrality in the Building Sector: A Bibliometric Review


 ,
,
Abstract
:1. Introduction
- Which countries, institutions, and individuals have conducted extensive and in-depth research on CPCN in buildings, and what is the status quo of their cooperation and contributions?
- What subjects and topics have aroused wide interest and enthusiasm among scholars, and what are their time trajectories?
- What journals and authors have grabbed the attention of many scholars, and what are the research directions related to them?
2. Materials and Methods
2.1. Data Retrieved
2.2. Data Processing Methods
3. Results
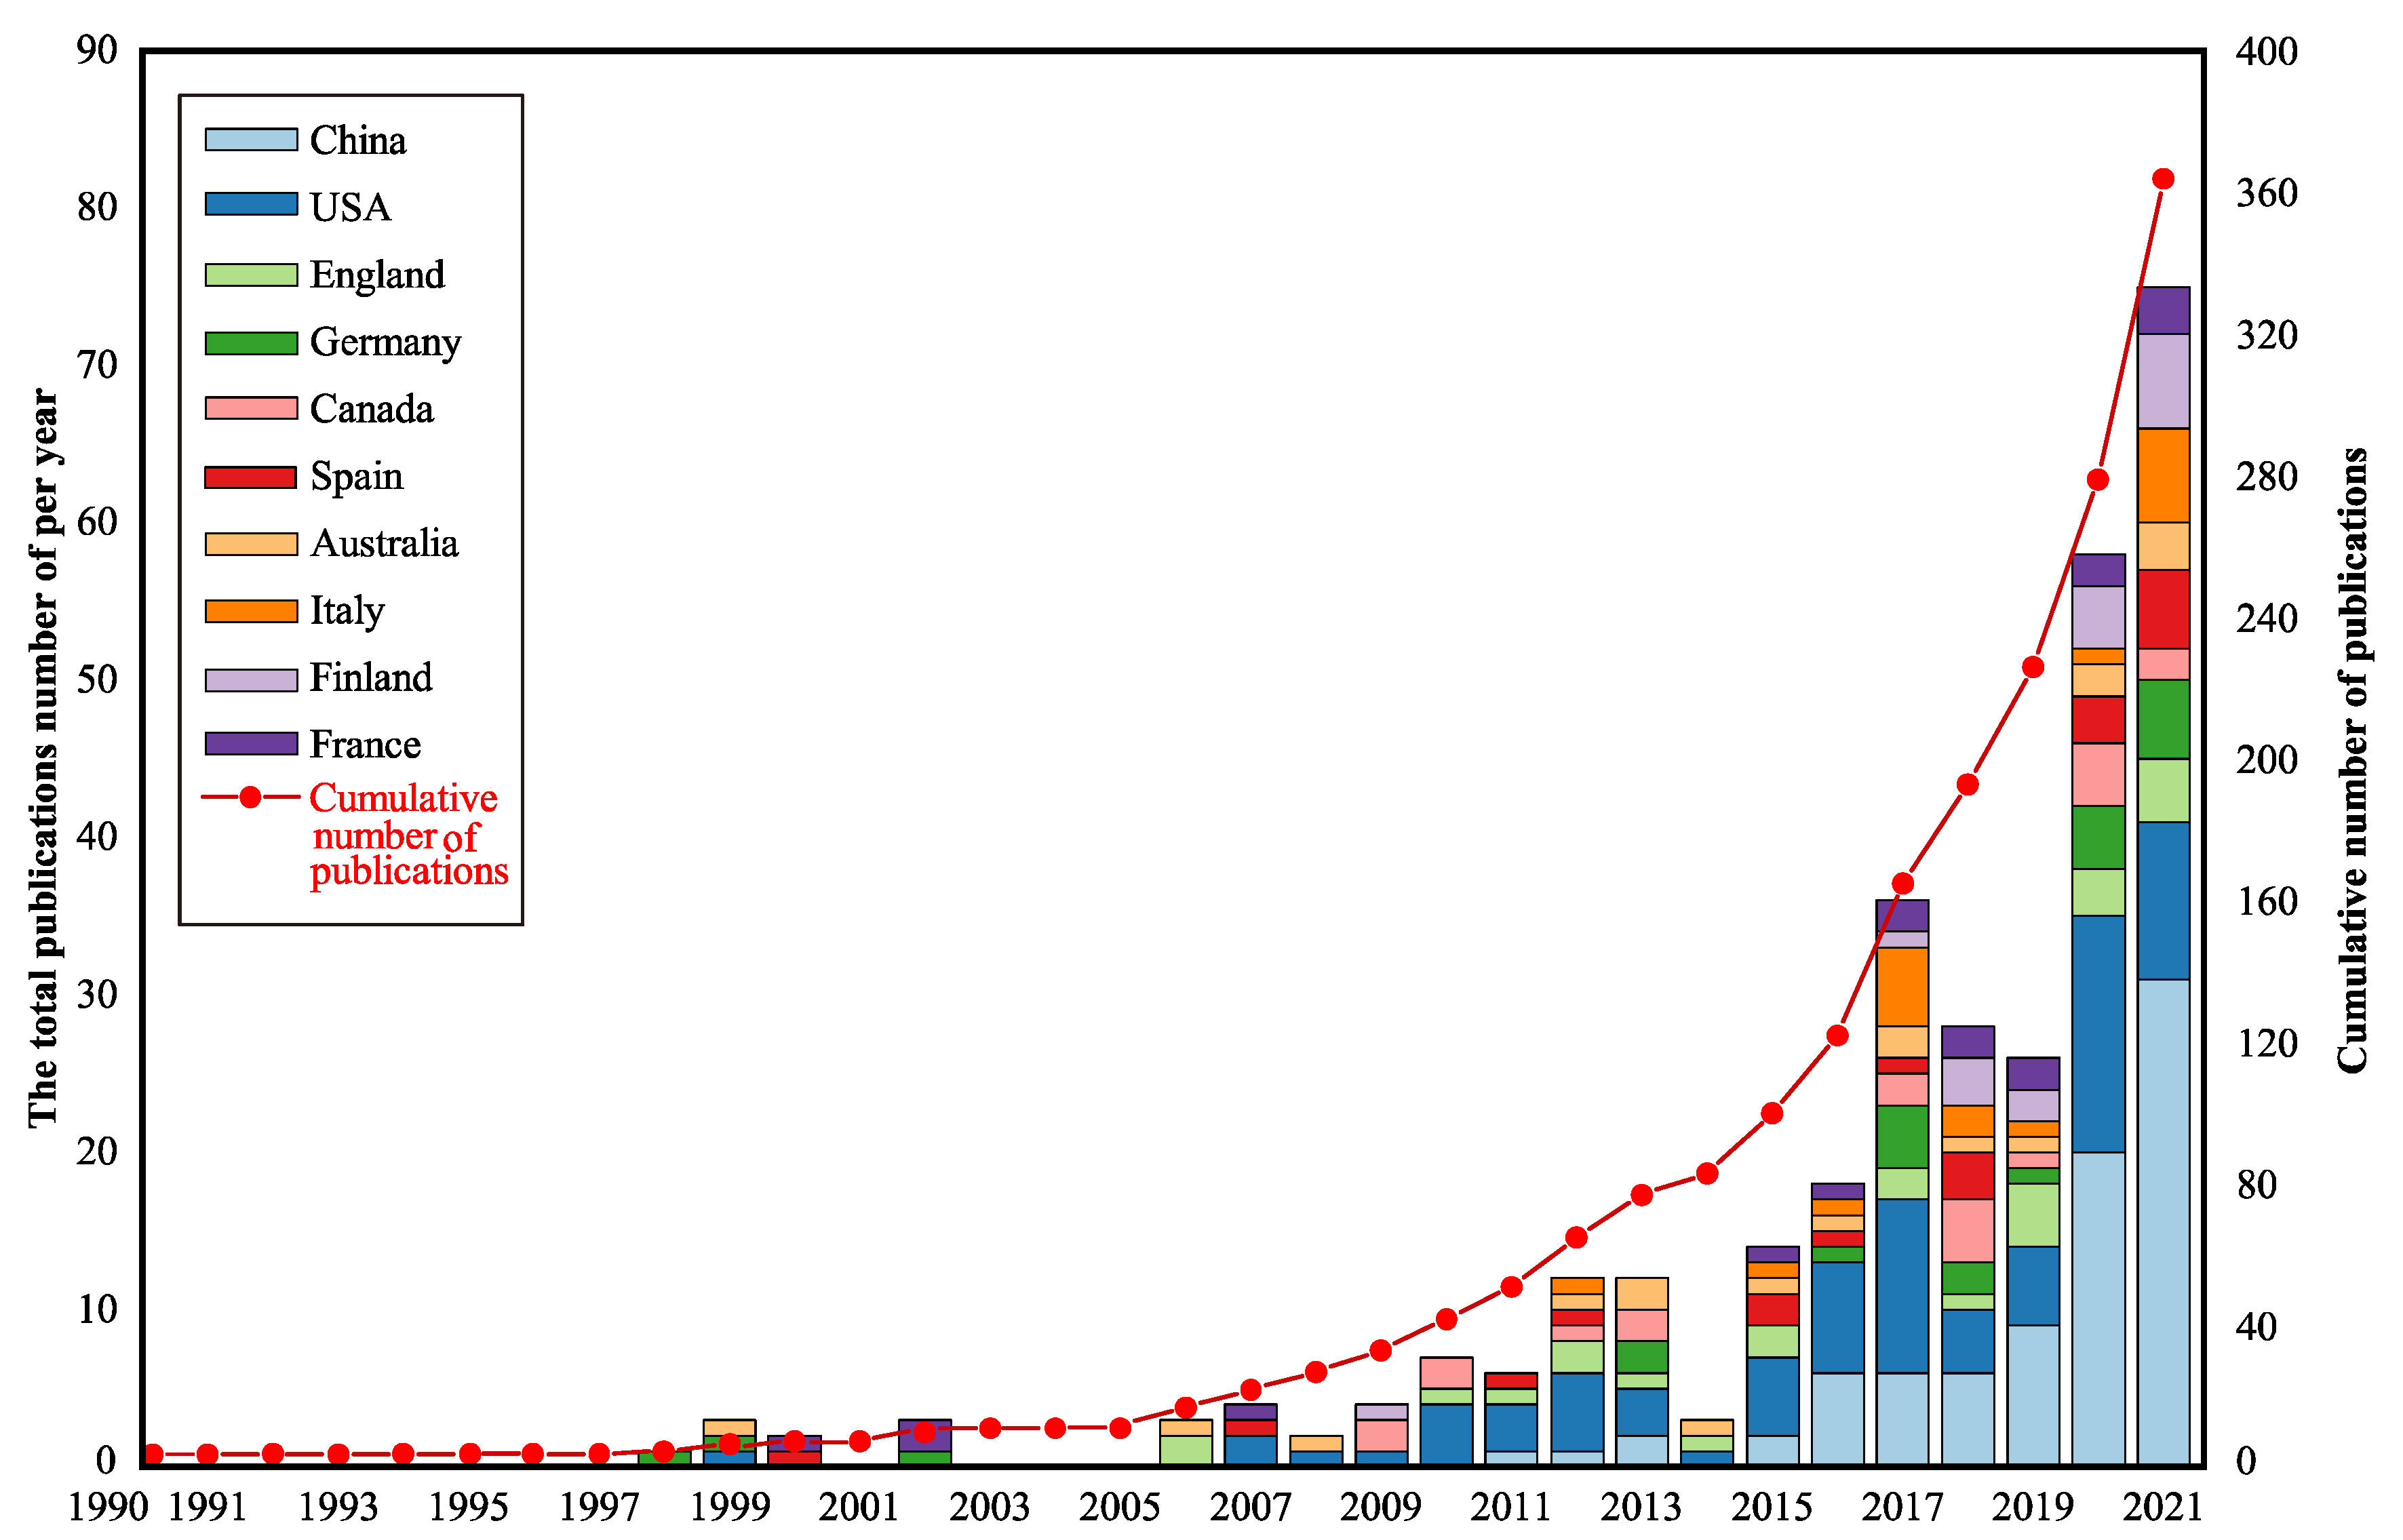
3.1. The Publication Trends
3.2. Contributions and Cooperation from Three Aspects: Author, Institution, and Country
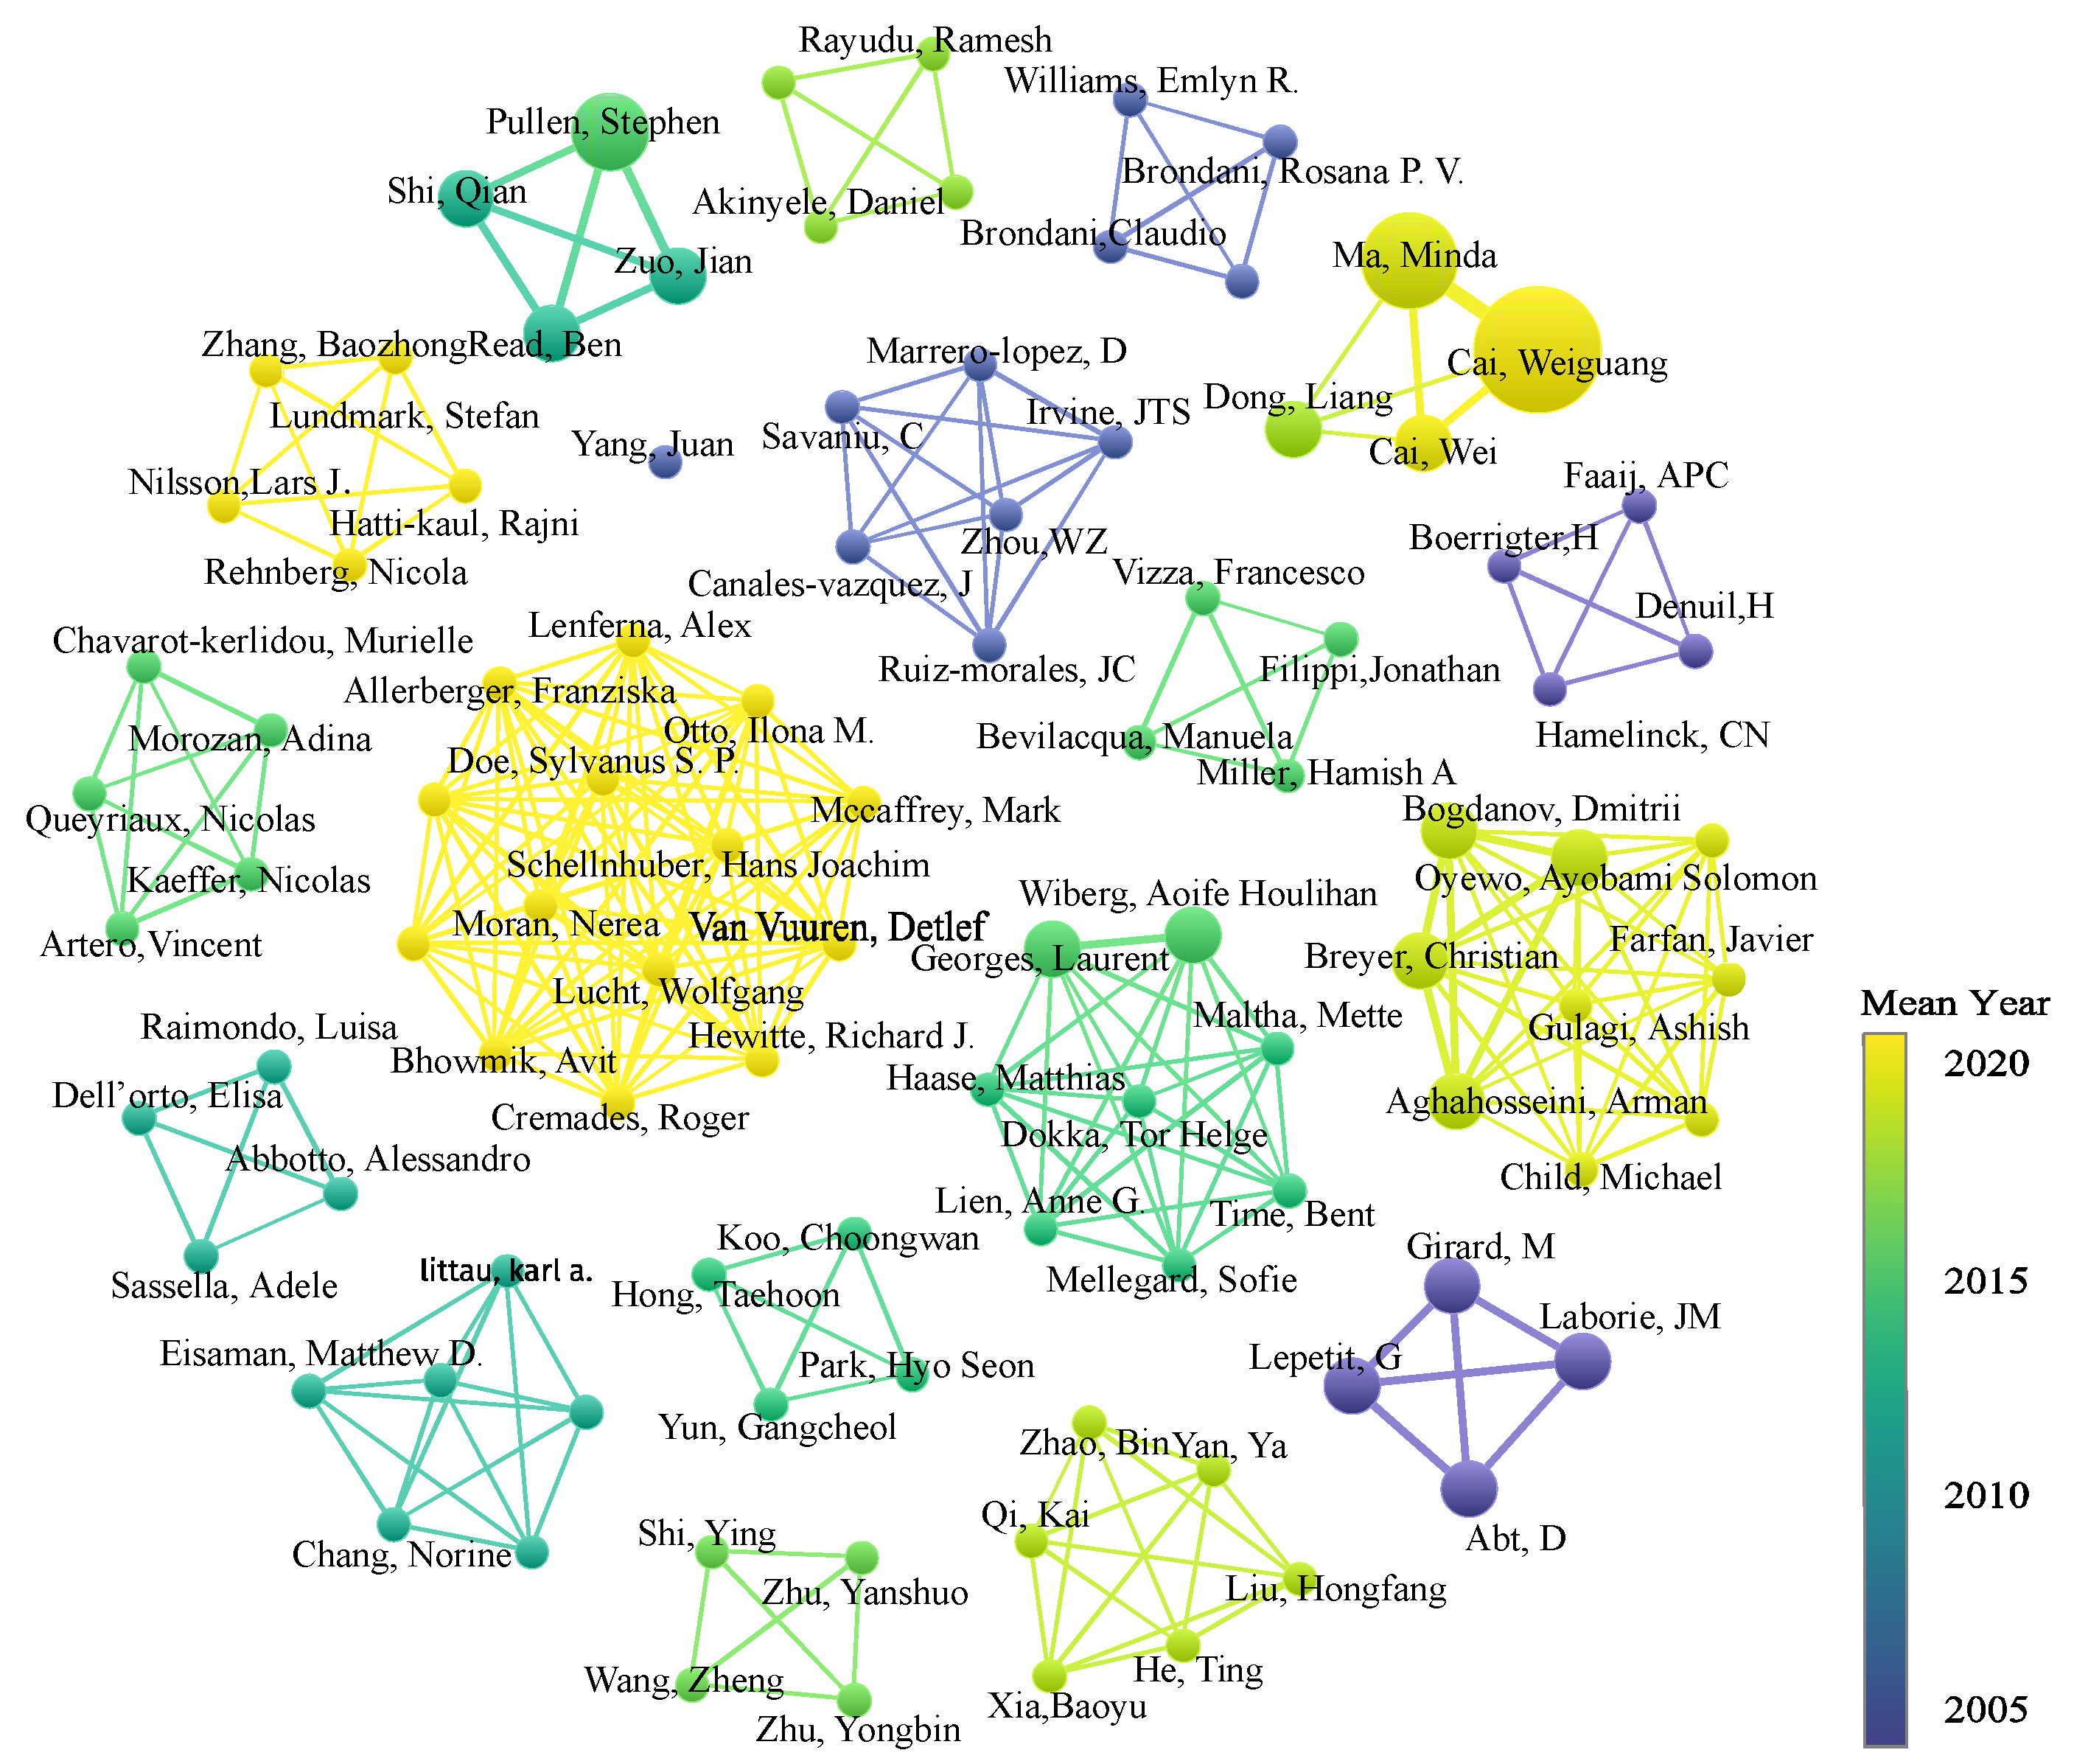
3.2.1. Author Contributions and Collaboration
3.2.2. The Most Influential and Productive Institutions
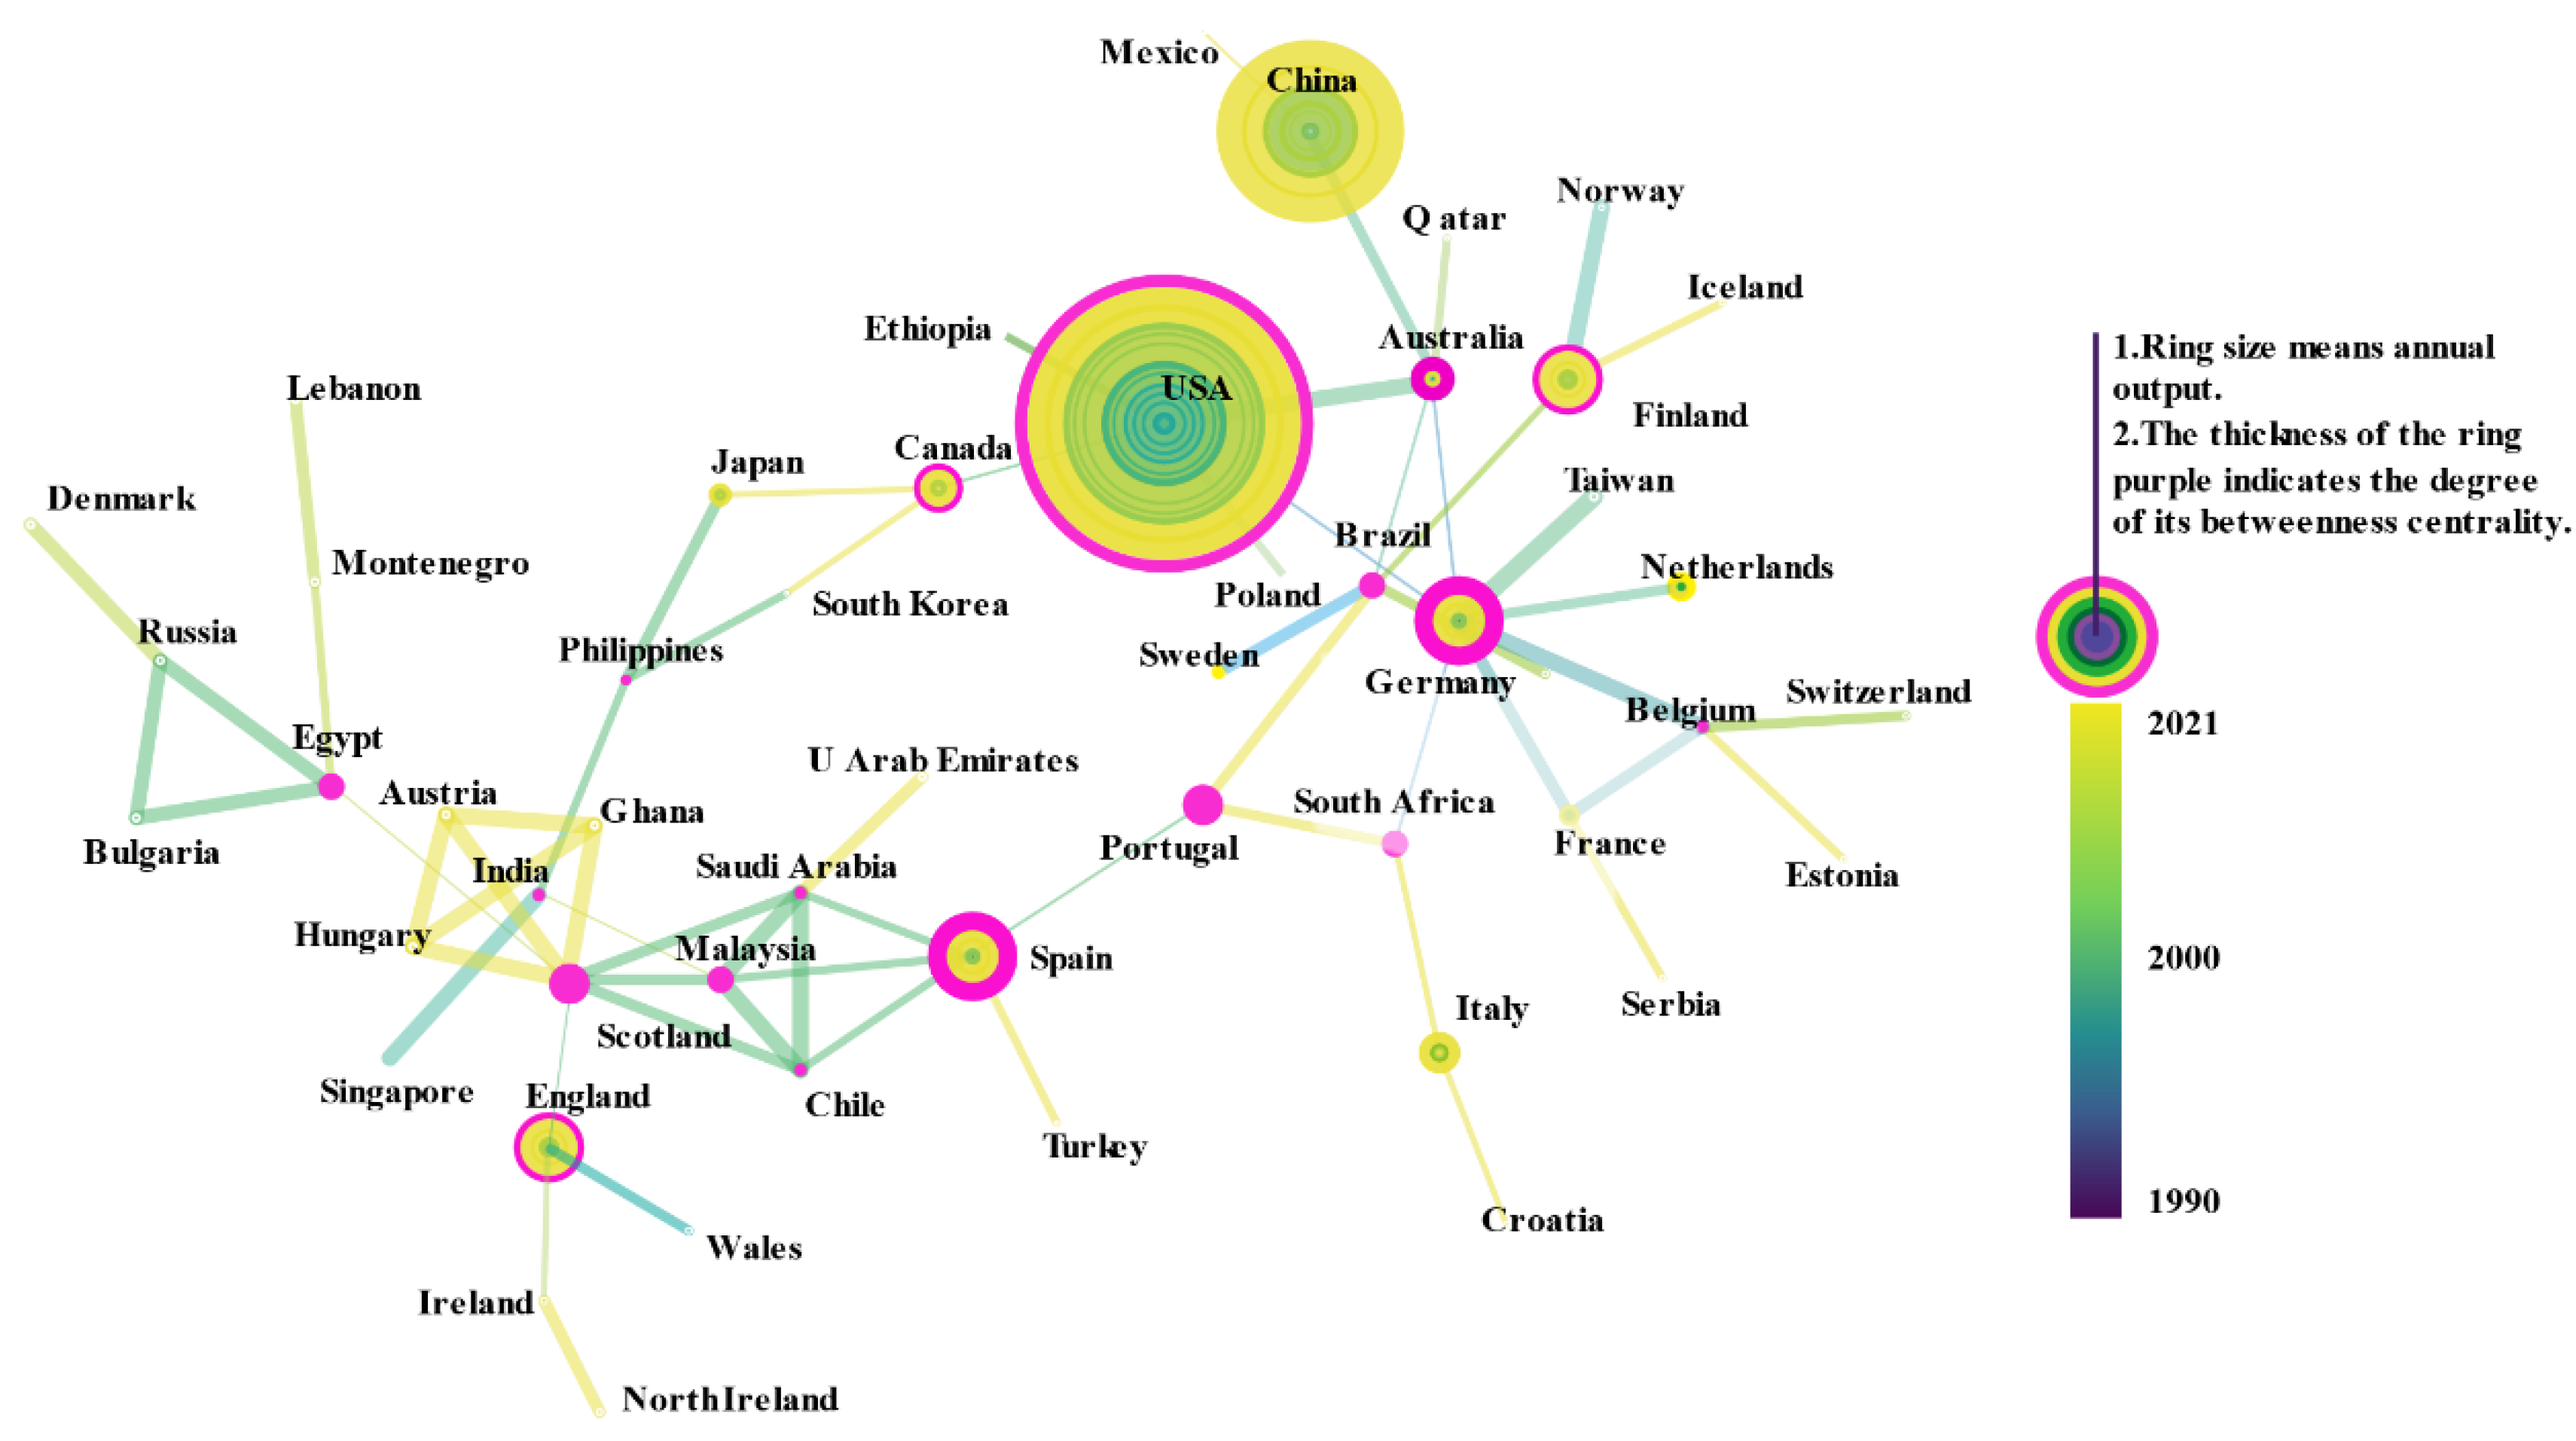
3.2.3. The Most Influential and Productive Countries
3.3. Disciplines and Topics Involved in CPCN in Buildings
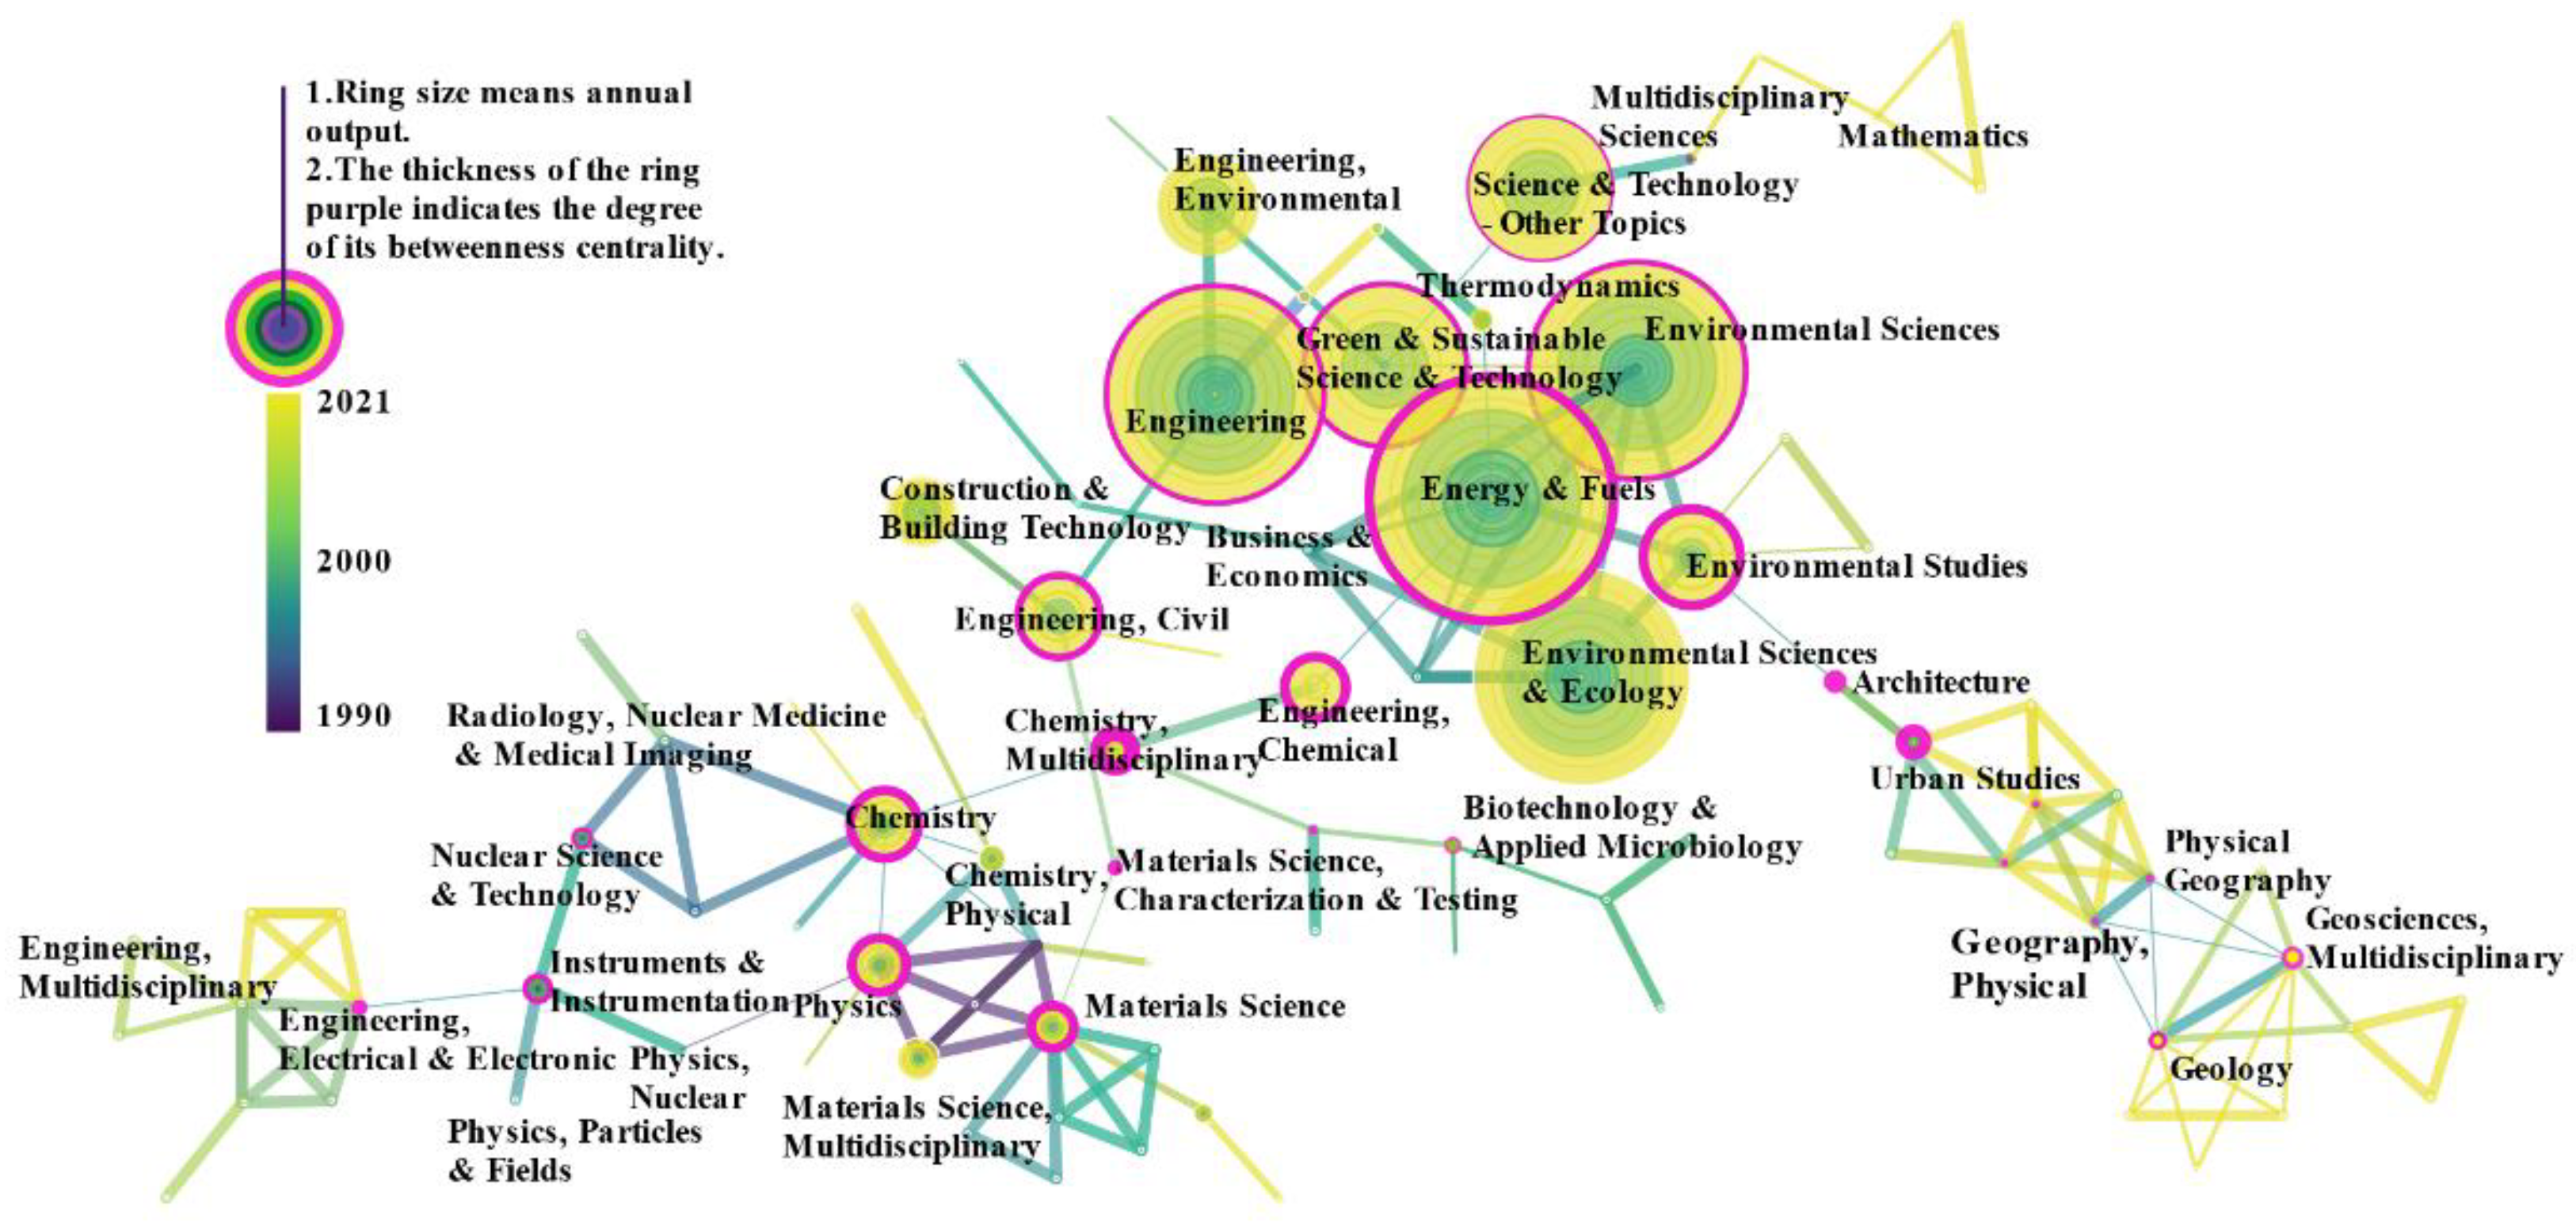
3.3.1. Subject Category Co-Occurrence Network
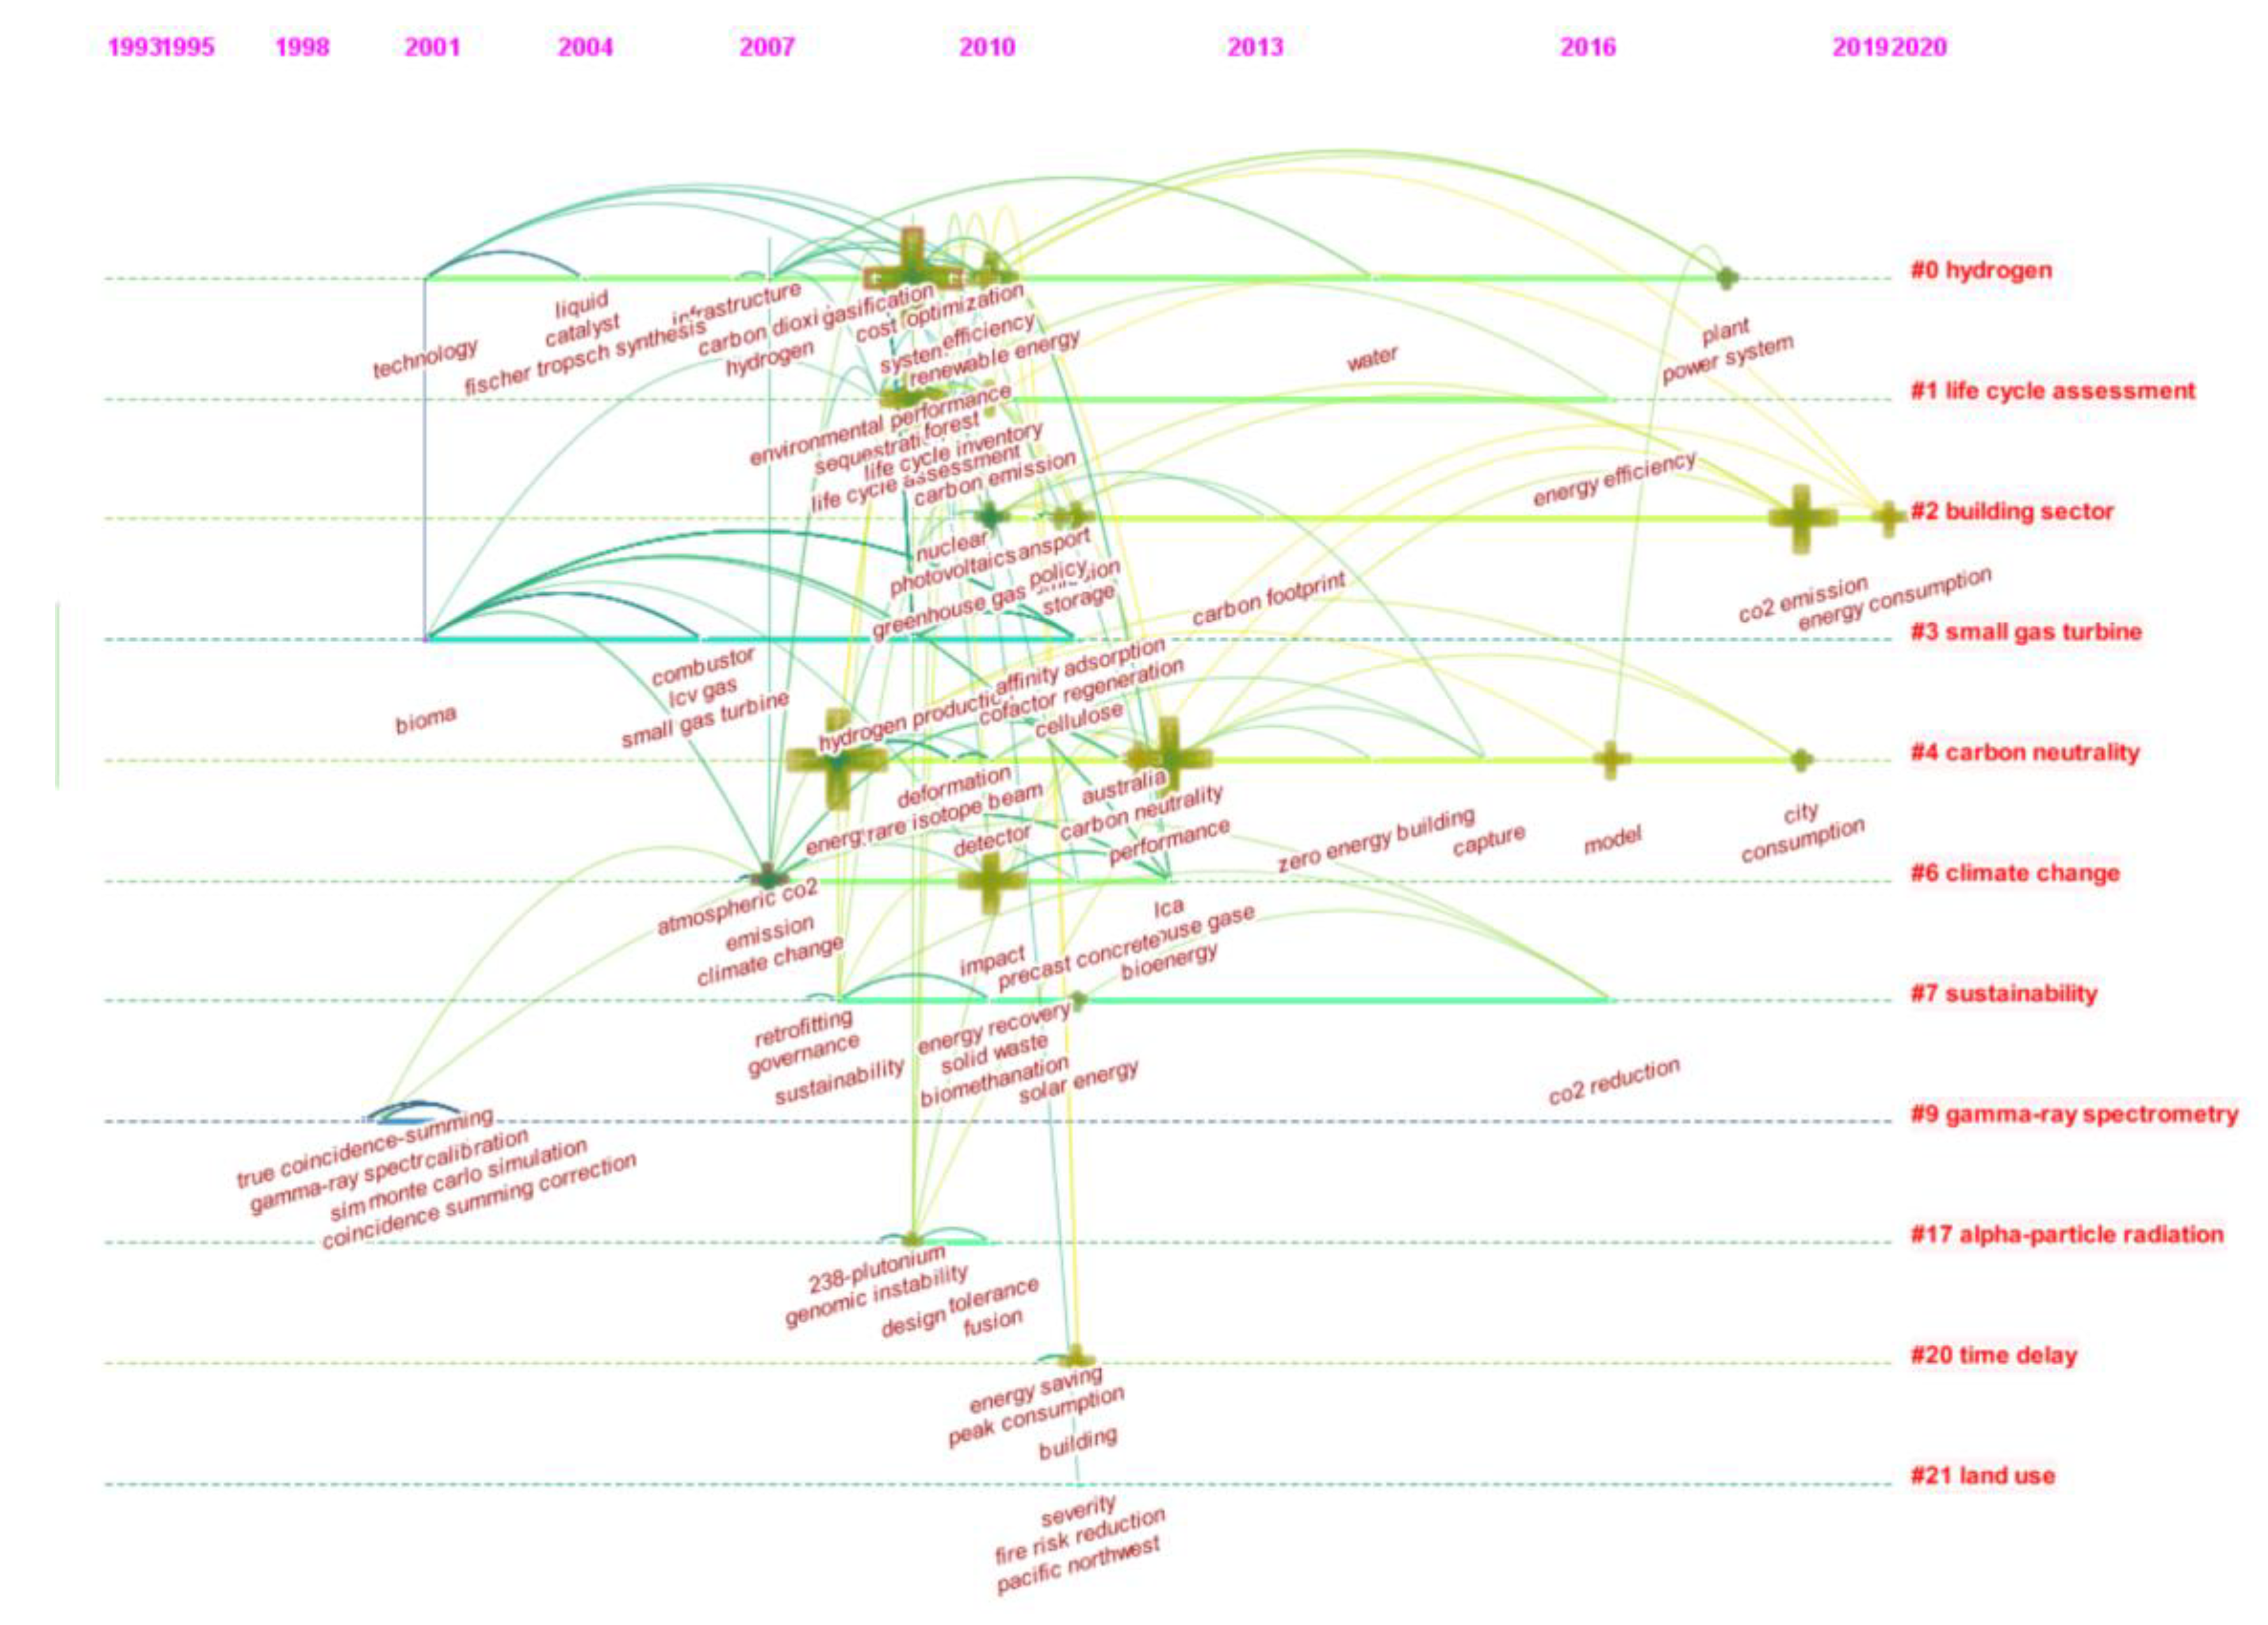
3.3.2. Keyword Co-Occurrence Analysis
3.4. The Intellectual Structure of CPCN in Buildings
3.4.1. Journal Co-Citation Analysis
3.4.2. Document Co-Citation Analysis
3.4.3. Author Co-Citation Analysis
4. Discussion
5. Conclusions
Author Contributions
Funding
Institutional Review Board Statement
Informed Consent Statement
Data Availability Statement
Conflicts of Interest
Abbreviations
| BC | betweenness centrality |
| CPCN | Carbon peak and carbon neutrality |
| CCBCE | Chinese commercial building carbon emissions |
| ECCE | Energy consumption and carbon emissions |
| IPAT | I = Human Impact, P = Population, A = Affluence, T = Technology |
| LMDI | Logarithmic Mean Divisia Index |
| NBES | National building energy savings |
| TLS | Total link strength |
Appendix A

| Rank | Citing Articles | Type | Times Cited | Reference |
|---|---|---|---|---|
| Author, Year, Journal, Volume, Page/Article Number, doi | ||||
| 1 | Ma M.D., 2019, Energ. Convers. Manage., V198, Article No.111915, doi:10.1016/j.enconman.2019.111915 | Article | 104  | [76] |
| 2 | Liang Y., 2019, Sci. Total Environ., V677, P315–327, doi:10.1016/j.scitotenv.2019.04.289 | Article | 73 | [77] |
| 3 | Ma M.D., 2020, Appl. Energ., V273, Article No.115247, doi:10.1016/j.apenergy.2020.115247 | Article | 70 | [7] |
| 4 | Liu W., 2019, J. Energy Chem., V1, Article No. 100008, doi:10.1016/j.enchem.2019.100008 | Review | 40 | [130] |
| 5 | Langevin J., 2019, Joule, V3, P2403–2424, doi:10.1016/j.joule.2019.07.013 | Article | 27 | [131] |
| 6 | Zhang X.G., 2019, J. Co2 Util., V33, P394–404, doi:10.1016/j.jcou.2019.06.019 | Article | 27 | [132] |
| 7 | Jiang J.J., 2019, Renew. Sust. Energ. Rev., V112, P813–833, doi:10.1016/j.rser.2019.06.024 | Review | 23 | [133] |
| 8 | Zhang X., 2020, Appl. Energ., V261, Article No. 114353, doi:10.1016/j.apenergy.2019.114353 | Article | 22 | [134] |
| 9 | Khanna N., 2020, Appl. Energ., V242, P12–26, doi:10.1016/j.apenergy.2019.03.116 | Article | 21 | [135] |
| 10 | Li B., 2019, Sci. Total Environ., V706, Article No.135716, doi:10.1016/j.scitotenv.2019.135716 | Article | 20 | [88] |
| 11 | Cao Z., 2019, Appl. Energ., V238, P 442–452, doi:10.1016/j.apenergy.2019.01.106 | Article | 19 | [136] |
| 12 | Pan Y., 2020, Appl. Energ., V268, Article No.114965, doi:10.1016/j.apenergy.2020.114965 | Article | 16 | [137] |
| 13 | Dai B.M., 2020, Energ. Convers. Manage., V209, Article No.112594, doi:10.1016/j.enconman.2020.112594 | Article | 15 | [138] |
| 14 | Guo S.Y., 2021, Energy, V214, Article No. 119063, doi:10.1016/j.energy.2020.119063 | Article | 13 | [92] |
| 15 | Duan H.M., 2020, J. Clean. Prod., V260, Article No. 120929, doi:10.1016/j.jclepro.2020.120929 | Article | 12 | [139] |
| 16 | Xian Y.J., 2019, J. Clean. Prod., V221, P457–468, doi:10.1016/j.jclepro.2019.02.266 | Article | 10 | [140] |
| 17 | Wang Y.S., 2020, J. Clean. Prod., V251, Article No. 119637, doi:10.1016/j.jclepro.2019.119637 | Article | 9 | [141] |
| 18 | Li W., 2019, J. Mater. Chem. A, V7, P25010–25019, doi:10.1039/c9ta09227g | Article | 9 | [142] |
| 19 | Chen Y.X., 2020, Energ. Buildings, V222, Article No.110100, doi:10.1016/j.enbuild.2020.110100 | Article | 8 | [143] |
| 20 | Zhang S.C., 2021, Energ. Buildings, V241, Article No. 110938, doi:10.1016/j.enbuild.2021.110938 | Article | 7 | [144] |
| 21 | Mata E., 2020, Environ. Res. Lett., V15, Article No.113003, doi:10.1088/1748-9326/abb69f | Review | 7 | [145] |
| 22 | Zhu W.N., 2020, J. Clean. Prod., V269, Article No. 122438, doi:10.1016/j.jclepro.2020.122438 | Article | 7 | [146] |
| 23 | Liu W., 2019, Energ. Convers. Manage., V199, Article No. 111943, doi:10.1016/j.enconman.2019.111915 | Article | 7 | [147] |
| 24 | Deb C., 2021, Renew. Sust. Energ. Rev., V144, Article No.110990, doi:10.1016/j.rser.2021.110990 | Review | 6 | [148] |
| 25 | Zhang S.C., 2020, Energy, V213, Article No. 118792, doi:10.1016/j.energy.2020.118792 | Article | 6 | [149] |
| 26 | Memon S., 2020, Energ. Buildings, V227, Article No. 110430, doi:10.1016/j.enbuild.2020.110430 | Article | 6 | [150] |
| 27 | Liu Q.B., 2020, Energ. Buildings, V224, Article No. 110242, doi:10.1016/j.enbuild.2020.110242 | Article | 6 | [151] |
| 28 | Yu B.Y., 2020, Ecol. Econ., V13, Article No.3210, doi:10.1016/j.ecolecon.2020.106706 | Article | 6 | [152] |
| 29 | Ding C., 2021, Energies, V14, Article No. 7461, doi:10.3390/en13123210 | Article | 6 | [153] |
| 30 | Li H.M., 2021, Energ. Buildings, V244, Article No. 111011, doi:10.1016/j.enbuild.2021.111011 | Article | 5 | [154] |
| 31 | Li H.R., 2021, Energ. Convers. Manage., V231, Article No. 113648, doi:10.1016/j.enconman.2020.113648 | Article | 5 | [155] |
| 32 | Liu P., 2020, Appl. Energ., V277, Article No. 115546, doi:10.1016/j.apenergy.2020.115546 | Article | 5 | [156] |
| 33 | Zhang L.H., 2020, J. Clean. Prod., V271, Article No.122696, doi:10.1016/j.jclepro.2020.122696 | Article | 5 | [157] |
| 34 | Mathew D., 2020, IET Power Electron., V13, P1487–1499, doi:10.1049/iet-pel.2019.1237 | Review | 5 | [158] |
| 35 | Li L.X., 2021, Energy, V227, Article No. 120460, doi:10.1016/j.energy.2021.120460 | Article | 4 | [159] |
| 36 | Mahapatra B., 2021, Energy, V227, Article No. 120485, doi:10.1016/j.energy.2021.120485 | Article | 4 | [160] |
| 37 | Nematchoua M.K., 2020, Renew. Energ., V162, P81–97, doi:10.1016/j.renene.2020.07.141 | Article | 4 | [161] |
| 38 | Levesque A., 2021, Environ. Res. Lett., V16, Article No. 054071, doi:10.1088/1748-9326/abdf07 | Article | 3 | [162] |
| 39 | Yan B., 2021, Renew. Energ., V54, P 2193–2220, doi:10.1007/s10462-020-09902-w | Review | 3 | [163] |
| 40 | Shi Q.W., 2020, Sustainability, V12, Article No. 2695, doi:10.3390/su12072695 | Article | 3 | [164] |
| 41 | Wu W.T., 2020, Renew. Sust. Energ. Rev., V117, Article No. 109516, doi:10.1016/j.rser.2019.109516 | Article | 3 | [165] |
| 42 | Yu L., 2021, Ieee Internet Things, V8, P 12046–12063, doi:10.1109/JIOT.2021.3078462 | Review | 2 | [166] |
| 43 | Zhong X.Y., 2021, J. Clean. Prod., V305, Article No.127098, doi:10.1016/j.jclepro.2021.127098 | Article | 2 | [167] |
| 44 | Nam E., 2021, J. Clean. Prod., V300, Article No.126962, doi:10.1016/j.jclepro.2021.126962 | Article | 2 | [168] |
| 45 | Wang S.Y., 2021, Build. Environ., V195, Article No. 107777, doi:10.1016/j.buildenv.2021.107777 | Article | 2 | [169] |
| 46 | Malek M., 2021, Materials, V14, Article No.1888, doi:10.3390/ma14081888 | Article | 2 | [170] |
| 47 | Zhang T., 2021, Resour. Conserv. Recy., V164, Article No.105124, doi:10.1016/j.resconrec.2020.105124 | Article | 2 | [171] |
| 48 | Lin J., 2019, Sci. Rep-uk, V9, Article No. 16095, doi:10.1038/s41598-019-52653-0 | Article | 2 | [172] |
| 49 | Shimoda Y., 2021, Appl. Energ., V303, Article No. 117510, doi:10.1016/j.apenergy.2021.117510 | Article | 1 | [173] |
| 50 | Li W., 2021, Therm. Sci. Eng. Prog., V25, Article No. 101033, doi:10.1016/j.tsep.2021.101033 | Article | 1 | [174] |
| 51 | Tang B.J., 2021, Appl. Energ., V298, Article No. 117213, doi:10.1016/j.apenergy.2021.117213 | Article | 1 | [12] |
| 52 | Edelenbosch O.Y., 2021, Technol. Forecast Soc. Change, V170, Article No. 120887, doi:10.1016/j.techfore.2021.120887 | Article | 1 | [175] |
| 53 | Tang B.J., 2021, J. Clean. Prod., V 307, Article No. 127206, doi:10.1016/j.jclepro.2021.127206 | Article | 1 | [176] |
| 54 | Zhao Y.J., 2021, Renew. Sust. Energ. Rev., V 145, Article No. 111091, doi:10.1016/j.rser.2021.111091 | Article | 1 | [177] |
| 55 | Yue H., 2021, J. Clean. Prod., V 301, Article No. 126978, doi:10.1016/j.jclepro.2021.126978 | Article | 1 | [178] |
| 56 | Nibedita B., 2021, Environ. Sci. Pollut. R., V28, P56938–56954, doi:10.1007/s11356-021-14642-7 | Article | 1 | [179] |
| 57 | Cao X.Y., 2021, Energ. Buildings, V 236, Article No. 110767, doi:10.1016/j.enbuild.2021.110767 | Article | 1 | [180] |
| 58 | Meuer J., 2021, Energ. Buildings, V 235, Article No. 110710, doi:10.1016/j.enbuild.2020.110710 | Article | 1 | [181] |
| 59 | Cheng S.L., 2021, Environ. Sci. Technol., V55, P 813–822, doi:10.1021/acs.est.0c04026 | Article | 1 | [182] |
| 60 | Shi Q.W., 2020, Sustainability, V12, Article No.10432, doi:10.3390/su122410432 | Article | 1 | [183] |
| 61 | Zhang L.H., 2020, J. Clean. Prod., V272, Article No. 122760, doi:10.1016/j.jclepro.2020.122760 | Article | 1 | [184] |
| 62 | Liu Y.S., 2022, Renew. Sust. Energ. Rev., V154, Article No. 111811, doi:10.1016/j.rser.2021.111811 | Article | 0 | [185] |
| 63 | Li K., 2022, Appl. Energ., V306, Article No. 118098, doi:10.1016/j.apenergy.2021.118098 | Article | 0 | [117] |
| 64 | Meng M., 2022, Energy, V239, Article No. 121912, doi:10.1016/j.energy.2021.121912 | Article | 0 | [186] |
| 65 | Yamaguchi Y., 2022, Appl. Energ., V306, Article No. 117907, doi:10.1016/j.apenergy.2021.117907 | Article | 0 | [187] |
| 66 | Al Shawa B., 2021, Energ. Buildings, V254, Article No.111634, doi:10.1016/j.enbuild.2021.111634 | Review | 0 | [188] |
| 67 | Lin J., 2021, Appl. Energ., V304, Article No. 117741, doi:10.1016/j.apenergy.2021.117741 | Article | 0 | [189] |
| 68 | Zhang S.C., 2021, Energ. Policy, V159, Article No. 112661, doi:10.1016/j.enpol.2021.112661 | Article | 0 | [190] |
| 69 | Su C., 2021, Energies, V14, Article No. 7461, doi:10.3390/en14227461 | Article | 0 | [191] |
| 70 | Zhong X.Y., 2021, Nat. Commun., V12, Article No. 6126, doi:10.1038/s41467-021-26212-z | Article | 0 | [192] |
| 71 | Fan G.J., 2021, Front. Earth Sci., V9, Article No. 694729, doi:10.3389/feart.2021.694729 | Article | 0 | [193] |
| 72 | Jia J.J., 2021, Energ. Effic., V14, Article No. 65, doi:10.1007/s12053-021-09974-9 | Article | 0 | [194] |
| 73 | Liu J.L., 2021, Renew. Sust. Energ. Rev., V149, Article No. 111336, doi:10.1016/j.rser.2021.111336 | Article | 0 | [195] |
| 74 | Wang L., 2021, Appl. Energ., V299, Article No. 117303, doi:10.1016/j.apenergy.2021.117303 | Article | 0 | [196] |
| 75 | Zhang S.C., 2021, Adv. Clim. Chang. Res., V12, P734–743, doi:10.1016/j.accre.2021.07.004 | Article | 0 | [197] |
| 76 | Chi F.A., 2021, Sol. Energy, V225, P1026–1047, doi:10.1016/j.solener.2021.08.020 | Article | 0 | [198] |
| 77 | Liu Q.C., 2021, J. Ind. Ecol., doi:10.1111/jiec.13182 | Article | 0 | [199] |
| 78 | Yang X.Y., 2021, Int. J. Life Cycle Ass., V26, P1721–1734, doi:10.1007/s11367-021-01960-8 | Article | 0 | [200] |
| 79 | Yue H., 2021, Energ. Effic., V14, Article No. 60, doi:10.1007/s12053-021-09979-4 | Review | 0 | [201] |
| 80 | Vand B., 2021, Energ. Convers. Manage., Article No. 114178, doi:10.1016/j.enconman.2021.114178 | Article | 0 | [202] |
| 81 | Jiang J.J., 2021, Environ. Sci. Technol., V55, P7225–7236, doi:10.1021/acs.est.0c06952 | Article | 0 | [203] |
| 82 | Tong H., 2019, J. Clean. Prod., V45, P10989–10996, doi:10.1039/d1nj01464a | Review | 0 | [204] |
| 83 | Gou S.W., 2021, Arab. J. Geosci., V14, Article No. 803, doi:10.1007/s12517-021-07104-4 | Article | 0 | [205] |
| 84 | Fan G.J., 2021, Oil Gas Sci. Technol., V76, Article No. 30, doi:10.2516/ogst/2021007 | Article | 0 | [206] |
| 85 | Yue H., 2021, Appl. Energ., V282, Article No. 116241, doi:10.1016/j.apenergy.2020.116241 | Article | 0 | [207] |
Highly cited paper.References
- Chang, C.-C. A multivariate causality test of carbon dioxide emissions, energy consumption and economic growth in China. Appl. Energy 2010, 87, 3533–3537. [Google Scholar] [CrossRef]
- Zuo, J.; Zhao, Z.-Y. Green building research–current status and future agenda: A review. Renew. Sustain. Energy Rev. 2014, 30, 271–281. [Google Scholar] [CrossRef]
- Wan, K.K.W.; Li, D.H.W.; Pan, W.; Lam, J.C. Impact of climate change on building energy use in different climate zones and mitigation and adaptation implications. Appl. Energy 2012, 97, 274–282. [Google Scholar] [CrossRef]
- Santamouris, M. Innovating to zero the building sector in Europe: Minimising the energy consumption, eradication of the energy poverty and mitigating the local climate change. Sol. Energy 2016, 128, 61–94. [Google Scholar] [CrossRef]
- Zhao, X.B.; Zuo, J.; Wu, G.D.; Huang, C. A bibliometric review of green building research 2000–2016. Archit. Sci. Rev. 2019, 62, 74–88. [Google Scholar] [CrossRef]
- Global Alliance for Buildings and Construction. Towards a Zero-Emission, Efficient and Resilient Buildings and Construction Sector. 2019. Available online: https://www.worldgbc.org/news-media/2019-global-status-report-buildings-and-construction (accessed on 30 November 2021).
- Ma, M.; Ma, X.; Cai, W.; Cai, W. Low carbon roadmap of residential building sector in China: Historical mitigation and prospective peak. Appl. Energy 2020, 273, 115247. [Google Scholar] [CrossRef]
- Lu, H.; Ma, X.; Ma, M.; Zhu, S. Energy price prediction using data-driven models: A decade review. Comput. Sci. Rev. 2021, 39, 100356. [Google Scholar] [CrossRef]
- Eom, J.; Clarke, L.; Kim, S.H.; Kyle, P.; Patel, P. China’s building energy demand: Long-term implications from a detailed assessment. Energy 2012, 46, 405–419. [Google Scholar] [CrossRef]
- Pérez-Lombard, L.; Ortiz, J.; Pout, C. A review on buildings energy consumption information. Energy Build. 2008, 40, 394–398. [Google Scholar] [CrossRef]
- Li, X.; Dong, M.; Jiang, D.; Li, S.; Shang, Y. The effect of surface roughness on normal restitution coefficient, adhesion force and friction coefficient of the particle-wall collision. Powder Technol. 2020, 362, 17–25. [Google Scholar] [CrossRef]
- Tang, B.-J.; Guo, Y.-Y.; Yu, B.; Harvey, L.D.D. Pathways for decarbonizing China’s building sector under global warming thresholds. Appl. Energy 2021, 298, 117213. [Google Scholar] [CrossRef]
- Wang, M.; Wang, P.; Wu, L.; Yang, R.-P.; Feng, X.-Z.; Zhao, M.-X.; Du, X.-L.; Wang, Y.-J. Criteria for assessing carbon emissions peaks at provincial level in China. Adv. Clim. Chang. Res. 2021, 13, 131–137. [Google Scholar] [CrossRef]
- Wu, X.; Tian, Z.; Guo, J. A review of the theoretical research and practical progress of carbon neutrality. Sustain. Oper. Comput. 2022, 3, 54–66. [Google Scholar] [CrossRef]
- Zou, C.; Xue, H.; Xiong, B.; Zhang, G.; Pan, S.; Jia, C.; Wang, Y.; Ma, F.; Sun, Q.; Guan, C.; et al. Connotation, innovation and vision of “carbon neutrality”. Nat. Gas Ind. B 2021, 8, 523–537. [Google Scholar] [CrossRef]
- UNFCC. Copenhagen Accord. In Proceedings of the United Nations Climate Change Conference in Copenhagen, Copenhagen, Denmark, 7–18 December 2009. [Google Scholar]
- Berardi, U. Building Energy Consumption in US, EU, and BRIC Countries. Procedia Eng. 2015, 118, 128–136. [Google Scholar] [CrossRef] [Green Version]
- Fang, K.; Li, C.; Tang, Y.; He, J.; Song, J. China’s pathways to peak carbon emissions: New insights from various industrial sectors. Appl. Energy 2022, 306, 118039. [Google Scholar] [CrossRef]
- Qi, Y.; Stern, N.; He, J.-K.; Lu, J.-Q.; Liu, T.-L.; King, D.; Wu, T. The policy-driven peak and reduction of China’s carbon emissions. Adv. Clim. Chang. Res. 2020, 11, 65–71. [Google Scholar] [CrossRef]
- Broadstock, D.; Ji, Q.; Managi, S.; Zhang, D. Pathways to carbon neutrality: Challenges and opportunities. Resour. Conserv. Recycl. 2021, 169, 105472. [Google Scholar] [CrossRef]
- Mallapaty, S. How China could be carbon neutral by mid-century. Nature 2020, 586, 482–483. [Google Scholar] [CrossRef]
- The White House. Administration Announces U.S. Emission Target for Copenhagen; President to Attend Copenhagen Climate Talks; Office of the Press Secretary, The White House: Washington, DC, USA, 2009. [Google Scholar]
- HM Government. Climate Change Act 2008; The Stationery Office Limited,: London, UK, 2008. [Google Scholar]
- You, F.; Hu, D.; Zhang, H.; Guo, Z.; Zhao, Y.; Wang, B.; Yuan, Y. Carbon emissions in the life cycle of urban building system in China—A case study of residential buildings. Ecol. Complex. 2011, 8, 201–212. [Google Scholar] [CrossRef]
- Zhang, Y.; Yan, D.; Hu, S.; Guo, S. Modelling of energy consumption and carbon emission from the building construction sector in China, a process-based LCA approach. Energy Policy 2019, 134, 110949. [Google Scholar] [CrossRef]
- Danatzko, J.M.; Sezen, H.; Chen, Q. Sustainable design and energy consumption analysis for structural components. J. Green Build. 2013, 8, 120–135. [Google Scholar] [CrossRef]
- Sozer, H. Improving energy efficiency through the design of the building envelope. Build. Environ. 2010, 45, 2581–2593. [Google Scholar] [CrossRef]
- Lam, P.T.I.; Chan, E.H.W.; Poon, C.S.; Chau, C.K.; Chun, K.P. Factors affecting the implementation of green specifications in construction. J. Environ. Manag. 2010, 91, 654–661. [Google Scholar] [CrossRef]
- Chen, M.; Ma, M.; Lin, Y.; Ma, Z.; Li, K. Carbon Kuznets curve in China’s building operations: Retrospective and prospective trajectories. Sci. Total Environ. 2022, 803, 150104. [Google Scholar] [CrossRef]
- Ma, M.; Pan, T.; Ma, Z. Examining the Driving Factors of Chinese Commercial Building Energy Consumption from 2000 to 2015: A STIRPAT Model Approach. J. Eng. Sci. Technol. Rev. 2017, 10, 28–34. [Google Scholar] [CrossRef]
- Yan, R.; Ma, M.; Pan, T. Estimating energy savings in Chinese residential buildings from 2001 to 2015: A decomposition analysis. J. Eng. Sci. Technol. Rev. 2017, 10, 107–113. [Google Scholar] [CrossRef]
- Ma, M.; Cai, W.; Cai, W. Carbon abatement in China’s commercial building sector: A bottom-up measurement model based on Kaya-LMDI methods. Energy 2018, 165, 350–368. [Google Scholar] [CrossRef]
- Ma, M.; Cai, W. Do commercial building sector-derived carbon emissions decouple from the economic growth in Tertiary Industry? A case study of four municipalities in China. Sci. Total Environ. 2019, 650, 822–834. [Google Scholar] [CrossRef]
- Hong, T.; Piette, M.A.; Chen, Y.; Lee, S.H.; Taylor-Lange, S.C.; Zhang, R.; Sun, K.; Price, P. Commercial building energy saver: An energy retrofit analysis toolkit. Appl. Energy 2015, 159, 298–309. [Google Scholar] [CrossRef] [Green Version]
- Zhang, S.; Xiang, X.; Ma, Z.; Ma, M.; Zou, C. Carbon neutral roadmap of commercial building operations by mid-century: Lessons from China. Buildings 2021, 11, 510. [Google Scholar] [CrossRef]
- Zhang, S.; Ma, M.; Li, K.; Ma, Z.; Feng, W.; Cai, W. Historical carbon abatement in the commercial building operation: China versus the US. Energy Econ. 2022, 105, 105712. [Google Scholar] [CrossRef]
- Tian, Z.; Zhang, S.; Li, H.; Jiang, Y.; Dong, J.; Zhang, B.; Yi, R. Investigations of Nearly (net) Zero Energy Residential Buildings in Beijing. Procedia Eng. 2015, 121, 1051–1057. [Google Scholar] [CrossRef] [Green Version]
- Zheng, X.; Wei, C.; Qin, P.; Guo, J.; Yu, Y.; Song, F.; Chen, Z. Characteristics of residential energy consumption in China: Findings from a household survey. Energy Policy 2014, 75, 126–135. [Google Scholar] [CrossRef]
- Yao, C.; Chen, C.; Li, M. Analysis of rural residential energy consumption and corresponding carbon emissions in China. Energy Policy 2012, 41, 445–450. [Google Scholar] [CrossRef]
- Zhang, L.; Yang, Z.; Chen, B.; Chen, G. Rural energy in China: Pattern and policy. Renew. Energy 2009, 34, 2813–2823. [Google Scholar] [CrossRef]
- Zhang, X.; Luo, L.; Skitmore, M. Household carbon emission research: An analytical review of measurement, influencing factors and mitigation prospects. J. Clean. Prod. 2015, 103, 873–883. [Google Scholar] [CrossRef] [Green Version]
- Lu, H.; Ma, X.; Ma, M. A hybrid multi-objective optimizer-based model for daily electricity demand prediction considering COVID-19. Energy 2021, 219, 119568. [Google Scholar] [CrossRef]
- Cai, W.; Liu, C.; Jia, S.; Chan, F.T.S.; Ma, M.; Ma, X. An emergy-based sustainability evaluation method for outsourcing machining resources. J. Clean. Prod. 2020, 245, 118849. [Google Scholar] [CrossRef]
- Ma, M.; Yan, R.; Du, Y.; Ma, X.; Cai, W.; Xu, P. A methodology to assess China’s building energy savings at the national level: An IPAT–LMDI model approach. J. Clean. Prod. 2017, 143, 784–793. [Google Scholar] [CrossRef]
- Ahmad, A.S.; Hassan, M.Y.; Abdullah, M.P.; Rahman, H.A.; Hussin, F.; Abdullah, H.; Saidur, R. A review on applications of ANN and SVM for building electrical energy consumption forecasting. Renew. Sustain. Energy Rev. 2014, 33, 102–109. [Google Scholar] [CrossRef]
- Fadzli Haniff, M.; Selamat, H.; Yusof, R.; Buyamin, S.; Sham Ismail, F. Review of HVAC scheduling techniques for buildings towards energy-efficient and cost-effective operations. Renew. Sustain. Energy Rev. 2013, 27, 94–103. [Google Scholar] [CrossRef]
- Huseien, G.F.; Shah, K.W. A review on 5G technology for smart energy management and smart buildings in Singapore. Energy AI 2022, 7, 100116. [Google Scholar] [CrossRef]
- Tetteh, E.K.; Amankwa, M.O.; Yeboah, C.; Amankwa, M.O. Emerging carbon abatement technologies to mitigate energy-carbon footprint- a review. Clean. Mater. 2021, 2, 100020. [Google Scholar] [CrossRef]
- Wang, F.; Harindintwali, J.D.; Yuan, Z.; Wang, M.; Wang, F.; Li, S.; Yin, Z.; Huang, L.; Fu, Y.; Li, L.; et al. Technologies and perspectives for achieving carbon neutrality. Innovation 2021, 2, 100180. [Google Scholar] [CrossRef]
- Xiang, X.; Ma, X.; Ma, Z.; Ma, M.; Cai, W. Python-LMDI: A tool for index decomposition analysis to building carbon emissions. Buildings 2022, 12, 83. [Google Scholar] [CrossRef]
- Yang, Z.; Liu, B.; Zhao, H.B. Energy saving in building construction in China: A review. Int. J. Green Energy 2004, 1, 209–225. [Google Scholar] [CrossRef]
- Lu, M.; Lai, J. Review on carbon emissions of commercial buildings. Renew. Sustain. Energy Rev. 2020, 119, 109545. [Google Scholar] [CrossRef]
- GhaffarianHoseini, A.; Dahlan, N.D.; Berardi, U.; GhaffarianHoseini, A.; Makaremi, N.; GhaffarianHoseini, M. Sustainable energy performances of green buildings: A review of current theories, implementations and challenges. Renew. Sustain. Energy Rev. 2013, 25, 1–17. [Google Scholar] [CrossRef]
- Han, S.; Yao, R.; Li, N. The development of energy conservation policy of buildings in China: A comprehensive review and analysis. J. Build. Eng. 2021, 38, 102229. [Google Scholar] [CrossRef]
- Verma, P.; Kumari, T.; Raghubanshi, A.S. Energy emissions, consumption and impact of urban households: A review. Renew. Sustain. Energy Rev. 2021, 147, 111210. [Google Scholar] [CrossRef]
- Wang, Y.; Mauree, D.; Sun, Q.; Lin, H.; Scartezzini, J.L.; Wennersten, R. A review of approaches to low-carbon transition of high-rise residential buildings in China. Renew. Sustain. Energy Rev. 2020, 131, 109990. [Google Scholar] [CrossRef]
- Akbarnezhad, A.; Xiao, J.Z. Estimation and minimization of embodied carbon of buildings: A review. Buildings 2017, 7, 5. [Google Scholar] [CrossRef]
- Ma, M.; Cai, W.; Wu, Y. China act on the energy efficiency of civil buildings (2008): A decade review. Sci. Total Environ. 2019, 651, 42–60. [Google Scholar] [CrossRef]
- Chau, C.K.; Leung, T.M.; Ng, W.Y. A review on Life Cycle Assessment, Life Cycle Energy Assessment and Life Cycle Carbon Emissions Assessment on buildings. Appl. Energy 2015, 143, 395–413. [Google Scholar] [CrossRef]
- Pouris, A.; Pouris, A. Scientometrics of a pandemic: HIV/AIDS research in South Africa and the World. Scientometrics 2011, 86, 541–552. [Google Scholar] [CrossRef]
- Archambault, E.; Campbell, D.; Gingras, Y.; Lariviere, V. Comparing of science bibliometric statistics obtained from the Web of Science and Scopus. J. Am. Soc. Inf. Sci. Technol. 2009, 60, 1320–1326. [Google Scholar] [CrossRef]
- Singh, V.K.; Singh, P.; Karmakar, M.; Leta, J.; Mayr, P. The journal coverage of Web of Science, Scopus and Dimensions: A comparative analysis. Scientometrics 2021, 126, 5113–5142. [Google Scholar] [CrossRef]
- Tan, H.; Li, J.; He, M.; Li, J.; Zhi, D.; Qin, F.; Zhang, C. Global evolution of research on green energy and environmental technologies:A bibliometric study. J. Environ. Manag. 2021, 297, 113382. [Google Scholar] [CrossRef]
- Niazi, M.A. CiteSpace: A Practical Guide for Mapping Scientific Literature. Compex Adapt. Syst. Model. 2016, 4, 3. [Google Scholar] [CrossRef] [Green Version]
- Li, X.; Wu, P.; Shen, G.Q.; Wang, X.; Teng, Y. Mapping the knowledge domains of Building Information Modeling (BIM): A bibliometric approach. Autom. Constr. 2017, 84, 195–206. [Google Scholar] [CrossRef]
- Morgan, J. Paris COP 21: Power that Speaks the Truth? Globalizations 2016, 13, 943–951. [Google Scholar] [CrossRef]
- Torstad, V.H. Participation, ambition and compliance: Can the Paris Agreement solve the effectiveness trilemma? Environ. Polit. 2020, 29, 761–780. [Google Scholar] [CrossRef]
- Andresen, S.; Skjaeseth, J.B.; Jevnaker, T.; Wettestad, J. The Paris Agreement: Consequences for the EU and Carbon Markets? Politics Gov. 2016, 4, 188–196. [Google Scholar] [CrossRef]
- The Climate Ambition Summit 2020 celebrated this year five years of the adoption of the Paris Agreement. Future Food 2020, 8, 76.
- Ma, M.D.; Yan, R.; Cai, W.G. Energy savings evaluation in public building sector during the 10th-12th FYP periods of China: An extended LMDI model approach. Nat. Hazards 2018, 92, 429–441. [Google Scholar] [CrossRef]
- State_Council. “Thirteenth Five-Year Plan” Work Plan for Controlling Greenhouse Gas Emissions, Beijing, China. 2016. Available online: http://www.gov.cn/zhengce/content/2016-11/04/content_5128619.htm (accessed on 16 August 2021). (In Chinese)
- Chen, C.M.; Hu, Z.G.; Liu, S.B.; Tseng, H. Emerging trends in regenerative medicine: A scientometric analysis in CiteSpace. Expert Opin. Biol. Ther. 2012, 12, 593–608. [Google Scholar] [CrossRef]
- Macintosh, A. Keeping warming within the 2 °C limit after Copenhagen. Energy Policy 2010, 38, 2964–2975. [Google Scholar] [CrossRef]
- Small, H. Cocitation in scientific literature—New measure of relationship between 2 documents. J. Am. Soc. Inf. Sci. 1973, 24, 265–269. [Google Scholar] [CrossRef]
- Zhou, N.; Khanna, N.; Feng, W.; Ke, J.; Levine, M. Scenarios of energy efficiency and CO2 emissions reduction potential in the buildings sector in China to year 2050. Nat. Energy 2018, 3, 978–984. [Google Scholar] [CrossRef]
- Ma, M.; Ma, X.; Cai, W.; Cai, W. Carbon-dioxide mitigation in the residential building sector: A household scale-based assessment. Energy Convers. Manag. 2019, 198, 111915. [Google Scholar] [CrossRef]
- Liang, Y.; Cai, W.; Ma, M. Carbon dioxide intensity and income level in the Chinese megacities’ residential building sector: Decomposition and decoupling analyses. Sci. Total Environ. 2019, 677, 315–327. [Google Scholar] [CrossRef] [PubMed]
- Ma, M.; Cai, W. What drives the carbon mitigation in Chinese commercial building sector? Evidence from decomposing an extended Kaya identity. Sci. Total Environ. 2018, 634, 884–899. [Google Scholar] [CrossRef] [PubMed]
- Tan, X.; Lai, H.; Gu, B.; Zeng, Y.; Li, H. Carbon emission and abatement potential outlook in China’s building sector through 2050. Energy Policy 2018, 118, 429–439. [Google Scholar] [CrossRef]
- Fargione, J.; Hill, J.; Tilman, D.; Polasky, S.; Hawthorne, P. Land clearing and the biofuel carbon debt. Science 2008, 319, 1235–1238. [Google Scholar] [CrossRef] [Green Version]
- Sartori, I.; Napolitano, A.; Voss, K. Net zero energy buildings: A consistent definition framework. Energy Build. 2012, 48, 220–232. [Google Scholar] [CrossRef] [Green Version]
- Lin, B.; Liu, H. CO2 emissions of China’s commercial and residential buildings: Evidence and reduction policy. Build. Environ. 2015, 92, 418–431. [Google Scholar] [CrossRef]
- McNeil, M.A.; Feng, W.; de la Rue du Can, S.; Khanna, N.Z.; Ke, J.; Zhou, N. Energy efficiency outlook in China’s urban buildings sector through 2030. Energy Policy 2016, 97, 532–539. [Google Scholar] [CrossRef] [Green Version]
- Harvey, L.D.D. Reducing energy use in the buildings sector: Measures, costs, and examples. Energy Effic. 2009, 2, 139–163. [Google Scholar] [CrossRef]
- Chen, X.; Shuai, C.; Wu, Y.; Zhang, Y. Analysis on the carbon emission peaks of China’s industrial, building, transport, and agricultural sectors. Sci. Total Environ. 2020, 709, 135768. [Google Scholar] [CrossRef]
- Huang, Y.; Liao, C.; Zhang, J.; Guo, H.; Zhou, N.; Zhao, D. Exploring potential pathways towards urban greenhouse gas peaks: A case study of Guangzhou, China. Appl. Energy 2019, 251, 113369. [Google Scholar] [CrossRef]
- Wang, J.; Cai, H.; Li, L. Energy demand and carbon emission peak forecasting of Beijing based on leap energy simulation method. Glob. Nest. J. 2020, 22, 565–569. [Google Scholar] [CrossRef]
- Li, B.; Han, S.; Wang, Y.; Wang, Y.; Li, J.; Wang, Y. Feasibility assessment of the carbon emissions peak in China’s construction industry: Factor decomposition and peak forecast. Sci. Total Environ. 2020, 706, 135716. [Google Scholar] [CrossRef] [PubMed]
- Wang, Y.; Su, X.L.; Qi, L.; Shang, P.P.; Xu, Y.H. Feasibility of peaking carbon emissions of the power sector in China’s eight regions: Decomposition, decoupling, and prediction analysis. Environ. Sci. Pollut. Res. 2019, 26, 29212–29233. [Google Scholar] [CrossRef]
- Jiang, J.; Ye, B.; Liu, J. Research on the peak of CO2 emissions in the developing world: Current progress and future prospect. Appl. Energy 2019, 235, 186–203. [Google Scholar] [CrossRef]
- Berardi, U. A cross-country comparison of the building energy consumptions and their trends. Resour. Conserv. Recycl. 2017, 123, 230–241. [Google Scholar] [CrossRef]
- Guo, S.; Yan, D.; Hu, S.; Zhang, Y. Modelling building energy consumption in China under different future scenarios. Energy 2021, 214, 119063. [Google Scholar] [CrossRef]
- Peng, C.; Yan, D.; Guo, S.; Hu, S.; Jiang, Y. Building energy use in China: Ceiling and scenario. Energy Build. 2015, 102, 307–316. [Google Scholar] [CrossRef]
- Gil, L.; Bernardo, J. An approach to energy and climate issues aiming at carbon neutrality. Renew. Energy Focus 2020, 33, 37–42. [Google Scholar] [CrossRef]
- United Nations. Paris Agreement–Status of Ratification. 2018. Available online: https://unfccc.int/process/the-paris-agreement/status-of-ratification (accessed on 26 August 2021).
- Yu, S.; Eom, J.; Evans, M.; Clarke, L. A long-term, integrated impact assessment of alternative building energy code scenarios in China. Energy Policy 2014, 67, 626–639. [Google Scholar] [CrossRef]
- Su, K.; Lee, C.-M. When will China achieve its carbon emission peak? A scenario analysis based on optimal control and the STIRPAT model. Ecol. Indic. 2020, 112, 106138. [Google Scholar] [CrossRef]
- Energy Information Administration. Analysis—Energy Sector Highlights. 2020. Available online: https://www.eia.gov/international/overview/country/IND (accessed on 13 December 2021).
- RMI, India. Reducing Embodied Carbon Is Key to Meeting India’s Climate Targets. 2021. Available online: https://www.eia.gov/consumption/residential/ (accessed on 13 December 2021).
- Goldemberg, J. The evolution of the energy and carbon intensities of developing countries. Energy Policy 2020, 137, 111060. [Google Scholar] [CrossRef]
- De La Peña, L.; Guo, R.; Cao, X.; Ni, X.; Zhang, W. Accelerating the energy transition to achieve carbon neutrality. Resour. Conserv. Recycl. 2022, 177, 105957. [Google Scholar] [CrossRef]
- Tan, S.; Yang, J.; Yan, J.; Lee, C.; Hashim, H.; Chen, B. A holistic low carbon city indicator framework for sustainable development. Appl. Energy 2017, 185, 1919–1930. [Google Scholar] [CrossRef]
- Chen, L.; Cai, W.; Ma, M. Decoupling or delusion? Mapping carbon emission per capita based on the human development index in Southwest China. Sci. Total Environ. 2020, 741, 138722. [Google Scholar] [CrossRef]
- Ma, M.; Cai, W.; Cai, W.; Dong, L. Whether carbon intensity in the commercial building sector decouples from economic development in the service industry? Empirical evidence from the top five urban agglomerations in China. J. Clean. Prod. 2019, 222, 193–205. [Google Scholar] [CrossRef]
- Fang, K.; Tang, Y.; Zhang, Q.; Song, J.; Wen, Q.; Sun, H.; Ji, C.; Xu, A. Will China peak its energy-related carbon emissions by 2030? Lessons from 30 Chinese provinces. Appl. Energy 2019, 255, 113852. [Google Scholar] [CrossRef]
- Yang, Y.; Li, B.; Yao, R. A method of identifying and weighting indicators of energy efficiency assessment in Chinese residential buildings. Energy Policy 2010, 38, 7687–7697. [Google Scholar] [CrossRef]
- Kavgic, M.; Hilliard, T.; Swan, L. Opportunities for Implementation of MPC in Commercial Buildings. Energy Procedia 2015, 78, 2148–2153. [Google Scholar] [CrossRef] [Green Version]
- Xiang, X.; Ma, X.; Ma, Z.; Ma, M. Operational Carbon Change in Commercial Buildings under the Carbon Neutral Goal: A LASSO–WOA Approach. Buildings 2022, 12, 54. [Google Scholar] [CrossRef]
- Wu, C.B.; Huang, G.H.; Xin, B.G.; Chen, J.K. Scenario analysis of carbon emissions’ anti-driving effect on Qingdao’s energy structure adjustment with an optimization model, Part I: Carbon emissions peak value prediction. J. Clean. Prod. 2018, 172, 466–474. [Google Scholar] [CrossRef]
- Huang, W.; Li, F.; Cui, S.-H.; Li, F.; Huang, L.; Lin, J.-Y. Carbon Footprint and Carbon Emission Reduction of Urban Buildings: A Case in Xiamen City, China. Procedia Eng. 2017, 198, 1007–1017. [Google Scholar] [CrossRef]
- Li, D.; Huang, G.; Zhu, S.; Chen, L.; Wang, J. How to peak carbon emissions of provincial construction industry? Scenario analysis of Jiangsu Province. Renew. Sustain. Energy Rev. 2021, 144, 110953. [Google Scholar] [CrossRef]
- Gomi, K.; Shimada, K.; Matsuoka, Y. A low-carbon scenario creation method for a local-scale economy and its application in Kyoto city. Energy Policy 2010, 38, 4783–4796. [Google Scholar] [CrossRef]
- Farzaneh, H. Development of a Bottom-up Technology Assessment Model for Assessing the Low Carbon Energy Scenarios in the Urban System. Energy Procedia 2017, 107, 321–326. [Google Scholar] [CrossRef]
- Jing, Q.; Bai, H.; Luo, W.; Cai, B.; Xu, H. A top-bottom method for city-scale energy-related CO2 emissions estimation: A case study of 41 Chinese cities. J. Clean. Prod. 2018, 202, 444–455. [Google Scholar] [CrossRef]
- Yang, L.; Ma, Z.; Ma, M.; Xu, Y. Decarbonization, Environmental Regulation, and Economic Boom: An Indicator Assessment Based on the Industrial Waste. Front. Energy Res. 2022, 9, 838852. [Google Scholar] [CrossRef]
- National Bureau of Statistics of China. 2020 China Statistical Yearbook; China Statistical Publishing House: Beijing, China, 2020. [Google Scholar]
- Li, K.; Ma, M.; Xiang, X.; Feng, W.; Ma, Z.; Cai, W.; Ma, X. Carbon reduction in commercial building operations: A provincial retrospection in China. Appl. Energy 2022, 306, 118098. [Google Scholar] [CrossRef]
- Du, Q.; Han, X.; Li, Y.; Li, Z.; Xia, B.; Guo, X. The energy rebound effect of residential buildings: Evidence from urban and rural areas in China. Energy Policy 2021, 153, 112235. [Google Scholar] [CrossRef]
- Yang, X.; Jiang, Y.; Yang, M.; Shan, M. Energy and environment in Chinese rural housing: Current status and future perspective. Front. Energy Power Eng. China 2010, 4, 35–46. [Google Scholar] [CrossRef]
- Zhuang, Z.; Li, Y.; Chen, B. Thermal storage performance analysis on Chinese kangs. Energy Build. 2009, 41, 452–459. [Google Scholar] [CrossRef]
- Tonooka, Y.; Liu, J.; Kondou, Y.; Ning, Y.; Fukasawa, O. A survey on energy consumption in rural households in the fringes of Xian city. Energy Build. 2006, 38, 1335–1342. [Google Scholar] [CrossRef]
- Building Energy Research Center of Tsinghua University. 2020 Annual Report on China Building Energy Efficiency; China Architecture and Building Press: Beijing, China, 2020. (In Chinese) [Google Scholar]
- MOHURD. To Celebrate the 70th Anniversary of the Founding of the People’s Republic of China, the Press Center Held the Second Press Conference. 2019. Available online: https://www.mohurd.gov.cn/xinwen/jsyw/201909/20190926_241997.html (accessed on 13 December 2021). (In Chinese)
- Zeng, X.; Zhao, Y.; Cheng, Z. Development and research of rural renewable energy management and ecological management information system under the background of beautiful rural revitalization strategy. Sustain. Comput. Inform. Syst. 2021, 30, 100553. [Google Scholar] [CrossRef]
- Li, J.; Chen, C.; Liu, H. Transition from non-commercial to commercial energy in rural China: Insights from the accessibility and affordability. Energy Policy 2019, 127, 392–403. [Google Scholar] [CrossRef]
- Hu, X.; Xiang, Y.; Zhang, H.; Lin, Q.; Wang, W.; Wang, H. Active–passive combined energy-efficient retrofit of rural residence with non-benchmarked construction: A case study in Shandong province, China. Energy Rep. 2021, 7, 1360–1373. [Google Scholar] [CrossRef]
- Zhuang, Z.; Li, Y.; Chen, B.; Guo, J. Chinese kang as a domestic heating system in rural northern China—A review. Energy Build. 2009, 41, 111–119. [Google Scholar] [CrossRef]
- Xiaohua, W.; Zhenmin, F. Rural household energy consumption with the economic development in China: Stages and characteristic indices. Energy Policy 2001, 29, 1391–1397. [Google Scholar] [CrossRef]
- Wang, P.; Liu, Q.; Qi, Y. Factors influencing sustainable consumption behaviors: A survey of the rural residents in China. J. Clean. Prod. 2014, 63, 152–165. [Google Scholar] [CrossRef]
- Liu, W.; Lustig, W.P.; Li, J. Luminescent inorganic-organic hybrid semiconductor materials for energy-saving lighting applications. EnergyChem 2019, 1, 100008. [Google Scholar] [CrossRef]
- Langevin, J.; Harris, C.B.; Reyna, J.L. Assessing the Potential to Reduce U.S. Building CO2 Emissions 80% by 2050. Joule 2019, 3, 2403–2424. [Google Scholar] [CrossRef] [Green Version]
- Zhang, X.; Ranjith, P.G. Experimental investigation of effects of CO2 injection on enhanced methane recovery in coal seam reservoirs. J. CO2 Util. 2019, 33, 394–404. [Google Scholar] [CrossRef]
- Jiang, J.; Ye, B.; Liu, J. Peak of CO2 emissions in various sectors and provinces of China: Recent progress and avenues for further research. Renew. Sustain. Energy Rev. 2019, 112, 813–833. [Google Scholar] [CrossRef]
- Zhang, X.; Geng, Y.; Shao, S.; Wilson, J.; Song, X.; You, W. China’s non-fossil energy development and its 2030 CO2 reduction targets: The role of urbanization. Appl. Energy 2020, 261, 114353. [Google Scholar] [CrossRef]
- Khanna, N.; Fridley, D.; Zhou, N.; Karali, N.; Zhang, J.; Feng, W. Energy and CO2 implications of decarbonization strategies for China beyond efficiency: Modeling 2050 maximum renewable resources and accelerated electrification impacts. Appl. Energy 2019, 242, 12–26. [Google Scholar] [CrossRef]
- Cao, Z.; Liu, G.; Duan, H.; Xi, F.; Liu, G.; Yang, W. Unravelling the mystery of Chinese building lifetime: A calibration and verification based on dynamic material flow analysis. Appl. Energy 2019, 238, 442–452. [Google Scholar] [CrossRef]
- Pan, Y.; Zhang, L. Data-driven estimation of building energy consumption with multi-source heterogeneous data. Appl. Energy 2020, 268, 114965. [Google Scholar] [CrossRef]
- Dai, B.; Zhao, X.; Liu, S.; Yang, Q.; Zhong, D.; Hao, Y.; Hao, Y. Energetic, exergetic and exergoeconomic assessment of transcritical CO2 reversible system combined with dedicated mechanical subcooling (DMS) for residential heating and cooling. Energy Convers. Manag. 2020, 209, 112594. [Google Scholar] [CrossRef]
- Duan, H.; Wang, D.; Pang, X.; Liu, Y.; Zeng, S. A novel forecasting approach based on multi-kernel nonlinear multivariable grey model: A case report. J. Clean. Prod. 2020, 260, 120929. [Google Scholar] [CrossRef]
- Xian, Y.; Yang, K.; Wang, K.; Wei, Y.-M.; Huang, Z. Cost-environment efficiency analysis of construction industry in China: A materials balance approach. J. Clean. Prod. 2019, 221, 457–468. [Google Scholar] [CrossRef]
- Wang, Y.; Wu, T.; Li, H.; Skitmore, M.; Su, B. A statistics-based method to quantify residential energy consumption and stock at the city level in China: The case of the Guangdong-Hong Kong-Macao Greater Bay Area cities. J. Clean. Prod. 2020, 251, 119637. [Google Scholar] [CrossRef]
- Li, W.; Xia, X.X.; Li, S. Large-scale evaluation of cascaded adsorption heat pumps based on metal/covalent-organic frameworks. J. Mater. Chem. A 2019, 7, 25010–25019. [Google Scholar] [CrossRef]
- Chen, Y.; Yang, C.; Pan, X.; Yan, D. Design and operation optimization of multi-chiller plants based on energy performance simulation. Energy Build. 2020, 222, 110100. [Google Scholar] [CrossRef]
- Zhang, S.; Fu, Y.; Yang, X.; Xu, W. Assessment of mid-to-long term energy saving impacts of nearly zero energy building incentive policies in cold region of China. Energy Build. 2021, 241, 110938. [Google Scholar] [CrossRef]
- Mata, E.; Korpal, A.K.; Cheng, S.H.; Navarro, J.P.J.; Filippidou, F.; Reyna, J.; Wang, R. A map of roadmaps for zero and low energy and carbon buildings worldwide. Environ. Res. Lett. 2020, 15, 19. [Google Scholar] [CrossRef]
- Zhu, W.; Feng, W.; Li, X.; Zhang, Z. Analysis of the embodied carbon dioxide in the building sector: A case of China. J. Clean. Prod. 2020, 269, 122438. [Google Scholar] [CrossRef]
- Liu, W.; Chen, C.; Wu, H.; Guo, C.; Chen, Y.; Liu, W.; Cui, Z. Environmental life cycle assessment and techno-economic analysis of domestic hot water systems in China. Energy Convers. Manag. 2019, 199, 111943. [Google Scholar] [CrossRef]
- Deb, C.; Schlueter, A. Review of data-driven energy modelling techniques for building retrofit. Renew. Sustain. Energy Rev. 2021, 144, 110990. [Google Scholar] [CrossRef]
- Zhang, S.; Xu, W.; Wang, K.; Feng, W.; Athienitis, A.; Hua, G.; Okumiya, M.; Yoon, G.; Cho, D.w.; Iyer-Raniga, U.; et al. Scenarios of energy reduction potential of zero energy building promotion in the Asia-Pacific region to year 2050. Energy 2020, 213, 118792. [Google Scholar] [CrossRef]
- Memon, S.; Eames, P.C. Design and development of lead-free glass-metallic vacuum materials for the construction and thermal performance of smart fusion edge-sealed vacuum glazing. Energy Build. 2020, 227, 110430. [Google Scholar] [CrossRef]
- Liu, Q.; Ren, J. Research on the building energy efficiency design strategy of Chinese universities based on green performance analysis. Energy Build. 2020, 224, 110242. [Google Scholar] [CrossRef]
- Yu, B.; Yang, X.; Zhao, Q.; Tan, J. Causal Effect of Time-Use Behavior on Residential Energy Consumption in China. Ecol. Econ. 2020, 175, 106706. [Google Scholar] [CrossRef]
- Ding, C.; Zhou, N. Using Residential and Office Building Archetypes for Energy Efficiency Building Solutions in an Urban Scale: A China Case Study. Energies 2020, 13, 16. [Google Scholar] [CrossRef]
- Li, H.; Qiu, P.; Wu, T. The regional disparity of per-capita CO2 emissions in China’s building sector: An analysis of macroeconomic drivers and policy implications. Energy Build. 2021, 244, 111011. [Google Scholar] [CrossRef]
- Li, H.; Sun, B.; Zhang, C. Capacity design of a distributed energy system based on integrated optimization and operation strategy of exergy loss reduction. Energy Convers. Manag. 2021, 231, 113648. [Google Scholar] [CrossRef]
- Liu, P.; Lin, B.; Zhou, H.; Wu, X.; Little, J.C. CO2 emissions from urban buildings at the city scale: System dynamic projections and potential mitigation policies. Appl. Energy 2020, 277, 115546. [Google Scholar] [CrossRef]
- Zhang, L.; Ma, X.; Wang, Y.; Song, R.; Li, J.; Yuan, W.; Zhang, S. The increasing district heating energy consumption of the building sector in China: Decomposition and decoupling analysis. J. Clean. Prod. 2020, 271, 122696. [Google Scholar] [CrossRef]
- Mathew, D.; Naidu, R.C. Investigation of single-stage transformerless buck-boost microinverters. IET Power Electron. 2020, 13, 1487–1499. [Google Scholar] [CrossRef]
- Li, L.; Cao, X.; Wang, P. Optimal coordination strategy for multiple distributed energy systems considering supply, demand, and price uncertainties. Energy 2021, 227, 120460. [Google Scholar] [CrossRef]
- Mahapatra, B.; Irfan, M. Asymmetric impacts of energy efficiency on carbon emissions: A comparative analysis between developed and developing economies. Energy 2021, 227, 120485. [Google Scholar] [CrossRef]
- Nematchoua, M.K.; Asadi, S.; Reiter, S. Influence of energy mix on the life cycle of an eco-neighborhood, a case study of 150 countries. Renew. Energy 2020, 162, 81–97. [Google Scholar] [CrossRef]
- Levesque, A.; Pietzcker, R.C.; Baumstark, L.; Luderer, G. Deep decarbonisation of buildings energy services through demand and supply transformations in a 1.5 degrees C scenario. Environ. Res. Lett. 2021, 16, 15. [Google Scholar] [CrossRef]
- Yan, B.; Hao, F.; Meng, X. When artificial intelligence meets building energy efficiency, a review focusing on zero energy building. Artif. Intell. Rev. 2021, 54, 2193–2220. [Google Scholar] [CrossRef]
- Shi, Q.W.; Gao, J.X.; Wang, X.; Ren, H.; Cai, W.G.; Wei, H.F. Temporal and Spatial Variability of Carbon Emission Intensity of Urban Residential Buildings: Testing the Effect of Economics and Geographic Location in China. Sustainability 2020, 12, 23. [Google Scholar] [CrossRef] [Green Version]
- Wu, W.; Zhang, W.; Benner, J.; Malkawi, A. Critical evaluation of analytical methods for thermally activated building systems. Renew. Sustain. Energy Rev. 2020, 117, 109516. [Google Scholar] [CrossRef]
- Yu, L.; Qin, S.Q.; Zhang, M.; Shen, C.; Jiang, T.; Guan, X.H. A Review of Deep Reinforcement Learning for Smart Building Energy Management. IEEE Internet Things J. 2021, 8, 12046–12063. [Google Scholar] [CrossRef]
- Zhong, X.; Hu, M.; Deetman, S.; Rodrigues, J.F.D.; Lin, H.-X.; Tukker, A.; Behrens, P. The evolution and future perspectives of energy intensity in the global building sector 1971–2060. J. Clean. Prod. 2021, 305, 127098. [Google Scholar] [CrossRef]
- Nam, E.; Jin, T. Mitigating carbon emissions by energy transition, energy efficiency, and electrification: Difference between regulation indicators and empirical data. J. Clean. Prod. 2021, 300, 126962. [Google Scholar] [CrossRef]
- Wang, S.; Liu, Y.; Cao, Q.; Li, H.; Yu, Y.; Yang, L. Applicability of passive design strategies in China promoted under global warming in past half century. Build. Environ. 2021, 195, 107777. [Google Scholar] [CrossRef]
- Malek, M.; Jackowski, M.; Lasica, W.; Kadela, M. Influence of Polypropylene, Glass and Steel Fiber on the Thermal Properties of Concrete. Materials 2021, 14, 18. [Google Scholar] [CrossRef]
- Zhang, T.; Tan, Q.; Zhang, S.; Zhang, T.; Zhang, W. A participatory methodology for characterizing and prescribing water-energy-food nexus based on improved casual loop diagrams. Resour. Conserv. Recycl. 2021, 164, 105124. [Google Scholar] [CrossRef]
- Lin, J.; Khanna, N.; Liu, X.; Teng, F.; Wang, X. China’s Non-CO2 Greenhouse Gas Emissions: Future Trajectories and Mitigation Options and Potential. Sci. Rep. 2019, 9, 10. [Google Scholar] [CrossRef] [PubMed]
- Shimoda, Y.; Sugiyama, M.; Nishimoto, R.; Momonoki, T. Evaluating decarbonization scenarios and energy management requirement for the residential sector in Japan through bottom-up simulations of energy end-use demand in 2050. Appl. Energy 2021, 303, 117510. [Google Scholar] [CrossRef]
- Li, W.; Liu, Z.; Li, S. The optimal step locations for high-performance adsorption heat pumps under various working conditions. Therm. Sci. Eng. Prog. 2021, 25, 101033. [Google Scholar] [CrossRef]
- Edelenbosch, O.Y.; Rovelli, D.; Levesque, A.; Marangoni, G.; Tavoni, M. Long term, cross-country effects of buildings insulation policies. Technol. Forecast. Soc. Chang. 2021, 170, 120887. [Google Scholar] [CrossRef]
- Tang, B.; Zou, Y.; Yu, B.; Guo, Y.; Zhao, G. Clean heating transition in the building sector: The case of Northern China. J. Clean. Prod. 2021, 307, 127206. [Google Scholar] [CrossRef]
- Zhao, Y.J.; Fan, G.J.; Song, K.P.; Li, Y.L.; Chen, H.; Sun, H. The experimental research for reducing the minimum miscibility pressure of carbon dioxide miscible flooding. Renew. Sust. Energ. Rev. 2021, 145, 11. [Google Scholar] [CrossRef]
- Yue, H.; Worrell, E.; Crijns-Graus, W.; Zhang, S. The potential of industrial electricity savings to reduce air pollution from coal-fired power generation in China. J. Clean. Prod. 2021, 301, 126978. [Google Scholar] [CrossRef]
- Nibedita, B.; Irfan, M. The role of energy efficiency and energy diversity in reducing carbon emissions: Empirical evidence on the long-run trade-off or synergy in emerging economies. Environ. Sci. Pollut. Res. 2021, 28, 56938–56954. [Google Scholar] [CrossRef]
- Cao, X.; Yao, R.; Ding, C.; Zhou, N.; Yu, W.; Yao, J.; Xiong, J.; Xu, Q.; Pan, L.; Li, B. Energy-quota-based integrated solutions for heating and cooling of residential buildings in the Hot Summer and Cold Winter zone in China. Energy Build. 2021, 236, 110767. [Google Scholar] [CrossRef]
- Meuer, J.; Lamaro, F.; Vetterli, N. Embedding energy optimization in organizations: A case study of a Swiss decentralized renewable energy system. Energy Build. 2021, 235, 110710. [Google Scholar] [CrossRef]
- Cheng, S.L.; Fan, W.; Meng, F.X.; Chen, J.D.; Liang, S.; Song, M.L.; Liu, G.Y.; Casazza, M. Potential Role of Fiscal Decentralization on Interprovincial Differences in CO2 Emissions in China. Environ. Sci. Technol. 2021, 55, 813–822. [Google Scholar] [CrossRef] [PubMed]
- Shi, Q.W.; Ren, H.; Cai, W.G.; Gao, J.X. How to Set the Proper CO2 Reduction Targets for the Provincial Building Sector of China? Sustainability 2020, 12, 10432. [Google Scholar] [CrossRef]
- Zhang, L.; Song, G.; Ma, X.; Zhan, C.; Zhang, S. Decarbonising residential building energy towards achieving the intended nationally determined contribution at subnational level under uncertainties. J. Clean. Prod. 2020, 272, 122760. [Google Scholar] [CrossRef]
- Liu, Y.; Wang, Y.; Shi, C.; Zhang, W.; Luo, W.; Wang, J.; Li, K.; Yeung, N.; Kite, S. Assessing the CO2 reduction target gap and sustainability for bridges in China by 2040. Renew. Sustain. Energy Rev. 2022, 154, 111811. [Google Scholar] [CrossRef]
- Meng, M.; Qu, D. Understanding the green energy efficiencies of provinces in China: A Super-SBM and GML analysis. Energy 2022, 239, 121912. [Google Scholar] [CrossRef]
- Yamaguchi, Y.; Kim, B.; Kitamura, T.; Akizawa, K.; Chen, H.; Shimoda, Y. Building stock energy modeling considering building system composition and long-term change for climate change mitigation of commercial building stocks. Appl. Energy 2022, 306, 117907. [Google Scholar] [CrossRef]
- Al Shawa, B. The ability of Building Stock Energy Models (BSEMs) to facilitate the sector’s climate change target in the face of socioeconomic uncertainties: A review. Energy Build. 2022, 254, 111634. [Google Scholar] [CrossRef]
- Lin, J.; Zhong, X.; Wang, J.; Huang, Y.; Bai, X.; Wang, X.; Shah, N.; Xie, S.; Zhao, Y. Relative optimization potential: A novel perspective to address trade-off challenges in urban energy system planning. Appl. Energy 2021, 304, 117741. [Google Scholar] [CrossRef]
- Zhang, S.; Wang, K.; Xu, W.; Iyer-Raniga, U.; Athienitis, A.; Ge, H.; Cho, D.w.; Feng, W.; Okumiya, M.; Yoon, G.; et al. Policy recommendations for the zero energy building promotion towards carbon neutral in Asia-Pacific Region. Energy Policy 2021, 159, 112661. [Google Scholar] [CrossRef]
- Su, C.; Urban, F. Carbon Neutral China by 2060: The Role of Clean Heating Systems. Energies 2021, 14, 7461. [Google Scholar] [CrossRef]
- Zhong, X.; Hu, M.; Deetman, S.; Steubing, B.; Lin, H.X.; Hernandez, G.A.; Harpprecht, C.; Zhang, C.; Tukker, A.; Behrens, P. Global greenhouse gas emissions from residential and commercial building materials and mitigation strategies to 2060. Nat. Commun. 2021, 12, 6126. [Google Scholar] [CrossRef] [PubMed]
- Fan, G.J.; Zhao, Y.J.; Zhang, X.D.; Li, Y.L.; Chen, H. Research on Minimum Miscible Pressure Between Crude Oil and Supercritical Carbon Dioxide System in Ultra-Low Permeability Reservoir by the Long-Slim-Tube Experiment Method. Front. Earth Sci. 2021, 9, 9. [Google Scholar] [CrossRef]
- Jia, J.J.; Xu, J.H. Estimating residential electricity demand’s response to price policy and income dynamics in China. Energy Effic. 2021, 14, 23. [Google Scholar] [CrossRef]
- Liu, J.L.; Yin, M.J.; Xia-Hou, Q.R.; Wang, K.; Zou, J. Comparison of sectoral low-carbon transition pathways in China under the nationally determined contribution and 2 degrees C targets. Renew. Sust. Energ. Rev. 2021, 149, 13. [Google Scholar] [CrossRef]
- Wang, L.; Lee, E.W.M.; Hussian, S.A.; Yuen, A.C.Y.; Feng, W. Quantitative impact analysis of driving factors on annual residential building energy end-use combining machine learning and stochastic methods. Appl. Energy 2021, 299, 117303. [Google Scholar] [CrossRef]
- Zhang, S.-C.; Yang, X.-Y.; Xu, W.; Fu, Y.-J. Contribution of nearly-zero energy buildings standards enforcement to achieve carbon neutral in urban area by 2060. Adv. Clim. Change Res. 2021, 12, 734–743. [Google Scholar] [CrossRef]
- Chi, F.a.; Wang, R.; Wang, Y. Integration of passive double-heating and double-cooling system into residential buildings (China) for energy saving. Sol. Energy 2021, 225, 1026–1047. [Google Scholar] [CrossRef]
- Liu, Q.C.; Liu, L.T.; Liu, X.J.; Li, S.G.; Liu, G. Building stock dynamics and the impact of construction bubble and bust on employment in China. J. Ind. Ecol. 2021, 25, 1631–1643. [Google Scholar] [CrossRef]
- Yang, X.Y.; Zhang, S.C.; Wang, K. Quantitative study of life cycle carbon emissions from 7 timber buildings in China. Int. J. Life Cycle Assess. 2021, 26, 1721–1734. [Google Scholar] [CrossRef]
- Yue, H.; Worrell, E.; Crijns-Graus, W.; Liu, W.; Zhang, S.H. Saving energy in China’s industry with a focus on electricity: A review of opportunities, potentials and environmental benefits. Energy Effic. 2021, 14, 28. [Google Scholar] [CrossRef]
- Vand, B.; Ruusu, R.; Hasan, A.; Manrique Delgado, B. Optimal management of energy sharing in a community of buildings using a model predictive control. Energy Convers. Manag. 2021, 239, 114178. [Google Scholar] [CrossRef]
- Jiang, J.J.; Ye, B.; Shao, S.; Zhou, N.; Wang, D.S.; Zeng, Z.Z.; Liu, J.G. Two-Tier Synergic Governance of Greenhouse Gas Emissions and Air Pollution in China’s Megacity, Shenzhen: Impact Evaluation and Policy Implication. Environ. Sci. Technol. 2021, 55, 7225–7236. [Google Scholar] [CrossRef] [PubMed]
- Tong, H.; Li, H.B.; Zhou, Z.N.; Cidanpuchi; Wang, F.C.; Liu, W. Strategies for optimizing the luminescence and stability of copper iodide organic-inorganic hybrid structures. New J. Chem. 2021, 45, 10989–10996. [Google Scholar] [CrossRef]
- Gou, S.W.; Li, H.; Li, J.Y.; Zhao, Y. Effective means to alleviate the greenhouse effect: Case study of history match simulations on a brief CO2 injection into less-deep low-rank coal seams. Arab. J. Geosci. 2021, 14, 18. [Google Scholar] [CrossRef]
- Zhao, Y.; Fan, G.; Li, Y.; Zhang, X.; Chen, H.; Sun, H. Research for reducing minimum miscible pressure of crude oil and carbon dioxide and miscible flooding experiment by injecting citric acid isopentyl ester. Arab. J. Chem. 2020, 13, 9207–9215. [Google Scholar] [CrossRef]
- Yue, H.; Worrell, E.; Crijns-Graus, W. Impacts of regional industrial electricity savings on the development of future coal capacity per electricity grid and related air pollution emissions—A case study for China. Appl. Energy 2021, 282, 116241. [Google Scholar] [CrossRef]


| Set | Search Queries | Time Span | Publications | Articles | Reviews |
|---|---|---|---|---|---|
| #1 | TS = (building OR construction) | 1990–2021 | 1,198,060 | 1,142,270 | 55,790 |
| #2 | TS = (“energy consumption *” OR “energy demand *” OR “energy use *”) | 1990–2021 | 116,712 | 109,202 | 7510 |
| #3 | TS = (“carbon emission *” OR “CO2 emission *”) | 1990–2021 | 48,553 | 45,656 | 2897 |
| #4 | TS = (“carbon emission * peak” OR “energy demand * peak” OR “energy peak” OR “carbon peak” OR “CO2 peak”) | 1990–2021 | 2014 | 1995 | 19 |
| #5 | TS = (“carbon neutrality” OR “carbon neutral” OR “net zero emission” OR “nearly zero emission”) | 1990–2021 | 2150 | 1793 | 357 |
| #6 | #2 AND #1 | 1990–2021 | 22,949 | 21,433 | 1516 |
| #7 | #3 AND #1 | 1990–2021 | 7042 | 6522 | 520 |
| #8 | #4 AND #1 | 1990–2021 | 100 | 99 | 1 |
| #9 | #5 AND #1 | 1990–2021 | 270 | 235 | 35 |
| #10 | #9 OR #8 | 1990–2021 | 364 | 328 | 36 |
| Rank | Author | Country | Organization | Documents | Citations | TLS a | CPP b |
|---|---|---|---|---|---|---|---|
| 1 | Cai, Weiguang | China | Chongqing University | 6 | 267 | 17 | 44.50 |
| 2 | Ma, Minda | China | Tsinghua University | 4 | 262 | 8 | 65.50 |
| 3 | Pullen, Stephen | Australia | University of South Australia | 3 | 99 | 8 | 33.00 |
| 4 | Junnila, Seppo | Finland | Aalto University | 3 | 13 | 10 | 4.33 |
| 5 | Cai, Wei | China | Southwest University | 2 | 121 | 6 | 60.50 |
| 6 | Bogdanov, Dmitrii | Finland | Lappeenranta University of Technology | 2 | 120 | 11 | 60.00 |
| 7 | Dong, Liang | China | City University of Hong Kong | 2 | 113 | 10 | 56.50 |
| 8 | Meil, Jamie | Canada | Athena Sustainable Materials Institute | 2 | 106 | 3 | 53.00 |
| 9 | Zuo, Jian | Australia | The University of Adelaide | 2 | 75 | 11 | 37.50 |
| 10 | Georges, Laurent | Norway | Norwegian University of Science and Technology | 2 | 75 | 11 | 37.50 |
| Rank | Institution | Country | Publications | Percentage | Citations | TLS a | CPP b |
|---|---|---|---|---|---|---|---|
| 1 | Chongqing University | China | 8 | 2.20% | 308 | 15 | 38.50 |
| 2 | Chinese Academy of Sciences | China | 8 | 2.20% | 137 | 13 | 17.13 |
| 3 | National University of Singapore | Singapore | 7 | 1.92% | 61 | 5 | 8.71 |
| 4 | Aalto University | Finland | 7 | 1.92% | 19 | 0 | 2.71 |
| 5 | Tsinghua University | China | 6 | 1.65% | 162 | 24 | 27.00 |
| 6 | Lawrence Berkeley National Laboratory | USA | 5 | 1.37% | 178 | 21 | 35.60 |
| 7 | The Hong Kong Polytechnic University | China | 5 | 1.37% | 130 | 7 | 26.00 |
| 8 | Southeast University | China | 5 | 1.37% | 44 | 5 | 8.80 |
| 9 | North China Electric Power University | China | 5 | 1.37% | 14 | 0 | 2.80 |
| 10 | University of Washington | USA | 4 | 1.10% | 188 | 20 | 47.00 |
| 11 | Stockholm University | Sweden | 4 | 1.10% | 92 | 20 | 23.00 |
| 12 | National Institute for Environmental Studies | Japan | 4 | 1.10% | 89 | 9 | 22.25 |
| 13 | Swiss Federal Institute of Technology | Switzerland | 4 | 1.10% | 71 | 3 | 17.75 |
| 14 | The University of Tennessee | USA | 4 | 1.10% | 61 | 12 | 15.25 |
| 15 | The University of Michigan | USA | 4 | 1.10% | 54 | 6 | 13.50 |
| No. | Country | Start Year | Publications | Centrality | Citations | Citations Per Paper | Total Link Strength |
|---|---|---|---|---|---|---|---|
| 1 | China | 2011 | 84 | 0.05 | 1656 | 19.71 | 48 |
| 2 | USA | 1999 | 77 | 0.27 | 1401 | 18.19 | 53 |
| 3 | England | 2006 | 24 | 0.16 | 745 | 31.04 | 15 |
| 4 | Germany | 1998 | 22 | 0.43 | 760 | 34.55 | 30 |
| 5 | Canada | 2009 | 20 | 0.12 | 534 | 26.70 | 9 |
| 6 | Spain | 2000 | 19 | 0.58 | 193 | 10.16 | 22 |
| 7 | Australia | 1999 | 18 | 0.3 | 424 | 23.56 | 13 |
| 8 | Italy | 2012 | 18 | 0.05 | 312 | 17.33 | 16 |
| 9 | France | 2000 | 17 | 0.05 | 291 | 17.12 | 17 |
| 10 | Finland | 2009 | 17 | 0.11 | 189 | 11.12 | 8 |
| 11 | Netherlands | 2004 | 12 | 0 | 669 | 55.75 | 16 |
| 12 | Japan | 1993 | 12 | 0.05 | 139 | 11.58 | 7 |
| 13 | Sweden | 2001 | 11 | 0 | 183 | 16.64 | 18 |
| 14 | India | 2010 | 10 | 0.16 | 255 | 25.50 | 8 |
| 15 | Scotland | 2006 | 9 | 0.6 | 477 | 53.00 | 15 |
| 16 | Norway | 2009 | 8 | 0 | 180 | 22.50 | 3 |
| 17 | South Korea | 2014 | 8 | 0.05 | 132 | 16.50 | 11 |
| 18 | Belgium | 2002 | 8 | 0.11 | 97 | 12.13 | 10 |
| 19 | Switzerland | 2017 | 8 | 0 | 93 | 11.63 | 12 |
| 20 | Singapore | 2010 | 7 | 0 | 61 | 8.71 | 5 |
| Rank | Subject Categories | Years | Count | Centrality |
|---|---|---|---|---|
| 1 | Environmental Sciences & Ecology | 2007 | 124 | 0.01 |
| 2 | Energy & Fuels | 1999 | 118 | 0.56 |
| 3 | Engineering | 2001 | 118 | 0.23 |
| 4 | Environmental Sciences | 2007 | 107 | 0.26 |
| 5 | Science & Technology—other Topics | 2006 | 97 | 0.16 |
| 6 | Green & Sustainable Science & Technology | 2009 | 82 | 0.34 |
| 7 | Environmental Studies | 2007 | 59 | 0.54 |
| 8 | Engineering, Environmental | 2009 | 48 | 0.03 |
| 9 | Construction &Building Technology | 2011 | 42 | 0 |
| 10 | Engineering, Civil | 2011 | 39 | 0.25 |
| 11 | Chemistry | 2000 | 35 | 0.57 |
| 12 | Materials Science | 1993 | 28 | 0.38 |
| 13 | Physics | 1993 | 27 | 0.34 |
| 14 | Engineering Chemical | 2006 | 24 | 0.52 |
| 15 | Materials Science, Multidisciplinary | 1993 | 23 | 0 |
| 16 | Nuclear science & technology | 2000 | 20 | 0.13 |
| 17 | Thermodynamics | 1999 | 18 | 0.03 |
| 18 | Instruments & Instrumentation | 2002 | 17 | 0.3 |
| 19 | Chemistry, Physical | 2007 | 14 | 0.07 |
| 20 | Physics, Nuclear | 1998 | 14 | 0.2 |
| No. | Keywords | Strength | Begin | End | 1990–2021 |
|---|---|---|---|---|---|
| 1 | Emission | 4.19 | 2012 | 2017 | ▂▂▂▂▂▂▂▂▂▂▂▂▂▂▂▂▂▂▂▂▂▂▂▂▂▂▂▂▂▂ |
| 2 | Greenhouse gas emission | 3.78 | 2012 | 2019 | ▂▂▂▂▂▂▂▂▂▂▂▂▂▂▂▂▂▂▂▂▂▂▂▂▂▂▂▂▂▂ |
| 3 | Climate change | 3.48 | 2012 | 2017 | ▂▂▂▂▂▂▂▂▂▂▂▂▂▂▂▂▂▂▂▂▂▂▂▂▂▂▂▂▂▂ |
| 4 | System | 7.92 | 2014 | 2021 | ▂▂▂▂▂▂▂▂▂▂▂▂▂▂▂▂▂▂▂▂▂▂▂▂▂▂▂▂▂▂ |
| 5 | Performance | 6.58 | 2014 | 2021 | ▂▂▂▂▂▂▂▂▂▂▂▂▂▂▂▂▂▂▂▂▂▂▂▂▂▂▂▂▂▂ |
| 6 | Energy | 6.02 | 2016 | 2021 | ▂▂▂▂▂▂▂▂▂▂▂▂▂▂▂▂▂▂▂▂▂▂▂▂▂▂▂▂▂▂ |
| 7 | Life cycle assessment | 5.52 | 2016 | 2021 | ▂▂▂▂▂▂▂▂▂▂▂▂▂▂▂▂▂▂▂▂▂▂▂▂▂▂▂▂▂▂ |
| 8 | Renewable energy | 4.52 | 2016 | 2019 | ▂▂▂▂▂▂▂▂▂▂▂▂▂▂▂▂▂▂▂▂▂▂▂▂▂▂▂▂▂▂ |
| 9 | Design | 3.9 | 2016 | 2019 | ▂▂▂▂▂▂▂▂▂▂▂▂▂▂▂▂▂▂▂▂▂▂▂▂▂▂▂▂▂▂ |
| 10 | Impact | 7.9 | 2018 | 2021 | ▂▂▂▂▂▂▂▂▂▂▂▂▂▂▂▂▂▂▂▂▂▂▂▂▂▂▂▂▂▂ |
| 11 | CO2 emission | 7.68 | 2018 | 2021 | ▂▂▂▂▂▂▂▂▂▂▂▂▂▂▂▂▂▂▂▂▂▂▂▂▂▂▂▂▂▂ |
| 12 | Energy consumption | 5.36 | 2020 | 2021 | ▂▂▂▂▂▂▂▂▂▂▂▂▂▂▂▂▂▂▂▂▂▂▂▂▂▂▂▂▂▂ |
| 13 | Building | 5.19 | 2020 | 2021 | ▂▂▂▂▂▂▂▂▂▂▂▂▂▂▂▂▂▂▂▂▂▂▂▂▂▂▂▂▂▂ |
| 14 | Carbon emission | 4.65 | 2020 | 2021 | ▂▂▂▂▂▂▂▂▂▂▂▂▂▂▂▂▂▂▂▂▂▂▂▂▂▂▂▂▂▂ |
| 15 | Efficiency | 4.65 | 2020 | 2021 | ▂▂▂▂▂▂▂▂▂▂▂▂▂▂▂▂▂▂▂▂▂▂▂▂▂▂▂▂▂▂ |
| 16 | Carbon neutrality | 4.32 | 2020 | 2021 | ▂▂▂▂▂▂▂▂▂▂▂▂▂▂▂▂▂▂▂▂▂▂▂▂▂▂▂▂▂▂ |
| 17 | Model | 4.16 | 2020 | 2021 | ▂▂▂▂▂▂▂▂▂▂▂▂▂▂▂▂▂▂▂▂▂▂▂▂▂▂▂▂▂▂ |
| No. | Cited Journals | Strength | Begin | End | 1990–2021 |
|---|---|---|---|---|---|
| 1 | P. Natl. Acad. Sci. Usa | 9.04 | 2008 | 2019 | ▂▂▂▂▂▂▂▂▂▂▂▂▂▂▂▂▂▂▂▂▂▂▂▂▂▂▂▂▂▂ |
| 2 | Energ. Environ. Sci. | 8.30 | 2008 | 2019 | ▂▂▂▂▂▂▂▂▂▂▂▂▂▂▂▂▂▂▂▂▂▂▂▂▂▂▂▂▂▂ |
| 3 | Int. J. Hydrogen Energ. | 6.65 | 2008 | 2016 | ▂▂▂▂▂▂▂▂▂▂▂▂▂▂▂▂▂▂▂▂▂▂▂▂▂▂▂▂▂▂ |
| 4 | Biomass Bioenerg. | 5.32 | 2008 | 2013 | ▂▂▂▂▂▂▂▂▂▂▂▂▂▂▂▂▂▂▂▂▂▂▂▂▂▂▂▂▂▂ |
| 5 | Bioresource Technol. | 4.63 | 2008 | 2013 | ▂▂▂▂▂▂▂▂▂▂▂▂▂▂▂▂▂▂▂▂▂▂▂▂▂▂▂▂▂▂ |
| 6 | Environ. Sci. Technol. | 4.36 | 2008 | 2016 | ▂▂▂▂▂▂▂▂▂▂▂▂▂▂▂▂▂▂▂▂▂▂▂▂▂▂▂▂▂▂ |
| 7 | J. Am. Chem. Soc. | 4.87 | 2011 | 2016 | ▂▂▂▂▂▂▂▂▂▂▂▂▂▂▂▂▂▂▂▂▂▂▂▂▂▂▂▂▂▂ |
| 8 | Environ. Res. Lett. | 4.73 | 2011 | 2019 | ▂▂▂▂▂▂▂▂▂▂▂▂▂▂▂▂▂▂▂▂▂▂▂▂▂▂▂▂▂▂ |
| 9 | Climate Change | 3.79 | 2011 | 2013 | ▂▂▂▂▂▂▂▂▂▂▂▂▂▂▂▂▂▂▂▂▂▂▂▂▂▂▂▂▂▂ |
| 10 | Sol. Energy | 7.04 | 2014 | 2019 | ▂▂▂▂▂▂▂▂▂▂▂▂▂▂▂▂▂▂▂▂▂▂▂▂▂▂▂▂▂▂ |
| 11 | Build. Res. Inf. | 4.93 | 2014 | 2016 | ▂▂▂▂▂▂▂▂▂▂▂▂▂▂▂▂▂▂▂▂▂▂▂▂▂▂▂▂▂▂ |
| 12 | Phys. Chem. Chem. Phys. | 3.62 | 2014 | 2016 | ▂▂▂▂▂▂▂▂▂▂▂▂▂▂▂▂▂▂▂▂▂▂▂▂▂▂▂▂▂▂ |
| 13 | Chem. Rev. | 3.62 | 2014 | 2016 | ▂▂▂▂▂▂▂▂▂▂▂▂▂▂▂▂▂▂▂▂▂▂▂▂▂▂▂▂▂▂ |
| 14 | Energ. Buildings | 3.57 | 2014 | 2019 | ▂▂▂▂▂▂▂▂▂▂▂▂▂▂▂▂▂▂▂▂▂▂▂▂▂▂▂▂▂▂ |
| 15 | Sustainability | 11.36 | 2017 | 2021 | ▂▂▂▂▂▂▂▂▂▂▂▂▂▂▂▂▂▂▂▂▂▂▂▂▂▂▂▂▂▂ |
| 16 | Energies | 8.28 | 2017 | 2021 | ▂▂▂▂▂▂▂▂▂▂▂▂▂▂▂▂▂▂▂▂▂▂▂▂▂▂▂▂▂▂ |
| 17 | Nat. Clim. Change | 6.12 | 2017 | 2019 | ▂▂▂▂▂▂▂▂▂▂▂▂▂▂▂▂▂▂▂▂▂▂▂▂▂▂▂▂▂▂ |
| 18 | Energy Proced. | 4.98 | 2017 | 2021 | ▂▂▂▂▂▂▂▂▂▂▂▂▂▂▂▂▂▂▂▂▂▂▂▂▂▂▂▂▂▂ |
| 19 | Energ. Econ. | 4.48 | 2017 | 2021 | ▂▂▂▂▂▂▂▂▂▂▂▂▂▂▂▂▂▂▂▂▂▂▂▂▂▂▂▂▂▂ |
| 20 | Appl. Energ. | 4.37 | 2017 | 2021 | ▂▂▂▂▂▂▂▂▂▂▂▂▂▂▂▂▂▂▂▂▂▂▂▂▂▂▂▂▂▂ |
| Rank | Cited References | Year | Co-Citation Times | Times Cited | Centrality |
|---|---|---|---|---|---|
| Author, Year, Journal, Volume, Page, Doi | |||||
| 1 | Zhou N., 2018, Nat. Energy, V3, P978, doi:10.1038/s41560-018-0253-6 | 2018 | 6 | 85 | 0 |
| 2 | Ma M.D, 2017, J. Clean. Prod., V143, P784, doi:10.1016/j.jclepro.2016.12.046 | 2017 | 5 | 93 | 0 |
| 3 | Tan X.C., 2018, Energ. Policy, V118, P429, doi:10.1016/j.enpol.2018.03.072 | 2018 | 5 | 55 | 0 |
| 4 | Fargione J., 2008, Science, V319, P1235, doi:10.1126/science.1152747 | 2008 | 4 | 2434 | 0 |
| 5 | Sartori I., 2012, Energ. Buildings, V48, P220, doi:10.1016/j.enbuild.2012.01.032 | 2012 | 4 | 442 | 0 |
| 6 | Dong K.Y., 2018, Renew. Sust. Energ. Rev., V94, P419, doi:10.1016/j.rser.2018.06.026 | 2018 | 4 | 94 | 0 |
| 7 | Ma M.D., 2018, Sci. Total Environ., V634, P884, doi:10.1016/j.scitotenv.2018.04.043 | 2018 | 4 | 75 | 0 |
| 8 | Lin B.Q., 2015, Build. Environ., V92, P418, doi: 10.1016/j.buildenv.2015.05.020 | 2015 | 4 | 61 | 0 |
| 9 | McNeil M.A., 2016, Energ. Policy, V97, P532, doi:10.1016/j.enpol.2016.07.033 | 2016 | 4 | 49 | 0 |
| 10 | Wu C.B., 2018, J. Clean. Prod., V172, P466, doi:10.1016/j.jclepro.2017.10.216 | 2018 | 4 | 46 | 0 |
| No. | Cited Authors | Strength | Begin | End | 1990–2021 |
|---|---|---|---|---|---|
| 1 | Metz B. | 3.8 | 2011 | 2016 | ▂▂▂▂▂▂▂▂▂▂▂▂▂▂▂▂▂▂▂▂▂▂▂▂▂▂▂▂▂▂▂▂ |
| 2 | Lewis N.S. | 3.68 | 2011 | 2016 | ▂▂▂▂▂▂▂▂▂▂▂▂▂▂▂▂▂▂▂▂▂▂▂▂▂▂▂▂▂▂▂▂ |
| 3 | Sartori I. | 3.61 | 2014 | 2019 | ▂▂▂▂▂▂▂▂▂▂▂▂▂▂▂▂▂▂▂▂▂▂▂▂▂▂▂▂▂▂▂▂ |
| 4 | Zhang Y. | 4.47 | 2017 | 2019 | ▂▂▂▂▂▂▂▂▂▂▂▂▂▂▂▂▂▂▂▂▂▂▂▂▂▂▂▂▂▂▂▂ |
| Rank | Author | Year | Co-Citations | Title | Times Cited |
|---|---|---|---|---|---|
| 1 | Zhang Y. | 2017 | 8 | Analysis on the carbon emission peaks of China’s industrial, building, transport, and agricultural sectors | 44 |
| 2 | Chen X. | 2020 | 8 | Analysis on the carbon emission peaks of China’s industrial, building, transport, and agricultural sectors | 44 |
| 3 | Zhou N. | 2020 | 8 | Exploring potential pathways towards urban greenhouse gas peaks: A case study of Guangzhou, China | 9 |
| 4 | Lin B.Q. | 2020 | 8 | / | 0 |
| 5 | Sartori I. | 2014 | 7 | / | 0 |
| 6 | Wang J. | 2020 | 7 | Energy demand and carbon emission peak forecasting of Beijing based on leap energy simulation method | 0 |
| 7 | Wang Y. | 2020 | 7 | Feasibility assessment of the carbon emissions peak in China’s construction industry: Factor decomposition and peak forecast | 14 |
| Feasibility of peaking carbon emissions of the power sector in China’s eight regions: decomposition, decoupling, and prediction analysis | 7 | ||||
| 8 | Lewis N.S. | 2011 | 6 | / | 0 |
| 9 | Metz B. | 2011 | 6 | / | 0 |
| 10 | Zhang Y.J. | 2020 | 6 | / | 0 |
Publisher’s Note: MDPI stays neutral with regard to jurisdictional claims in published maps and institutional affiliations. |
© 2022 by the authors. Licensee MDPI, Basel, Switzerland. This article is an open access article distributed under the terms and conditions of the Creative Commons Attribution (CC BY) license (https://creativecommons.org/licenses/by/4.0/).
Share and Cite
Sun, Z.; Ma, Z.; Ma, M.; Cai, W.; Xiang, X.; Zhang, S.; Chen, M.; Chen, L. Carbon Peak and Carbon Neutrality in the Building Sector: A Bibliometric Review. Buildings 2022, 12, 128. https://doi.org/10.3390/buildings12020128
Sun Z, Ma Z, Ma M, Cai W, Xiang X, Zhang S, Chen M, Chen L. Carbon Peak and Carbon Neutrality in the Building Sector: A Bibliometric Review. Buildings. 2022; 12(2):128. https://doi.org/10.3390/buildings12020128
Chicago/Turabian StyleSun, Zhaohui, Zhili Ma, Minda Ma, Weiguang Cai, Xiwang Xiang, Shufan Zhang, Minxia Chen, and Liming Chen. 2022. "Carbon Peak and Carbon Neutrality in the Building Sector: A Bibliometric Review" Buildings 12, no. 2: 128. https://doi.org/10.3390/buildings12020128