


Determination of the Target Reliability Index of the Concrete Main Girder of Long-Span Structures Based on Structural Design Service Life

Abstract
:1. Introduction
2. Statistical Analysis of Load and Resistance
2.1. Statistical Analysis of Load
2.1.1. Statistical Analysis of Dead Load
2.1.2. Statistical Analysis of Vehicle Load
2.2. Time-Varying Model of Resistance Degradation
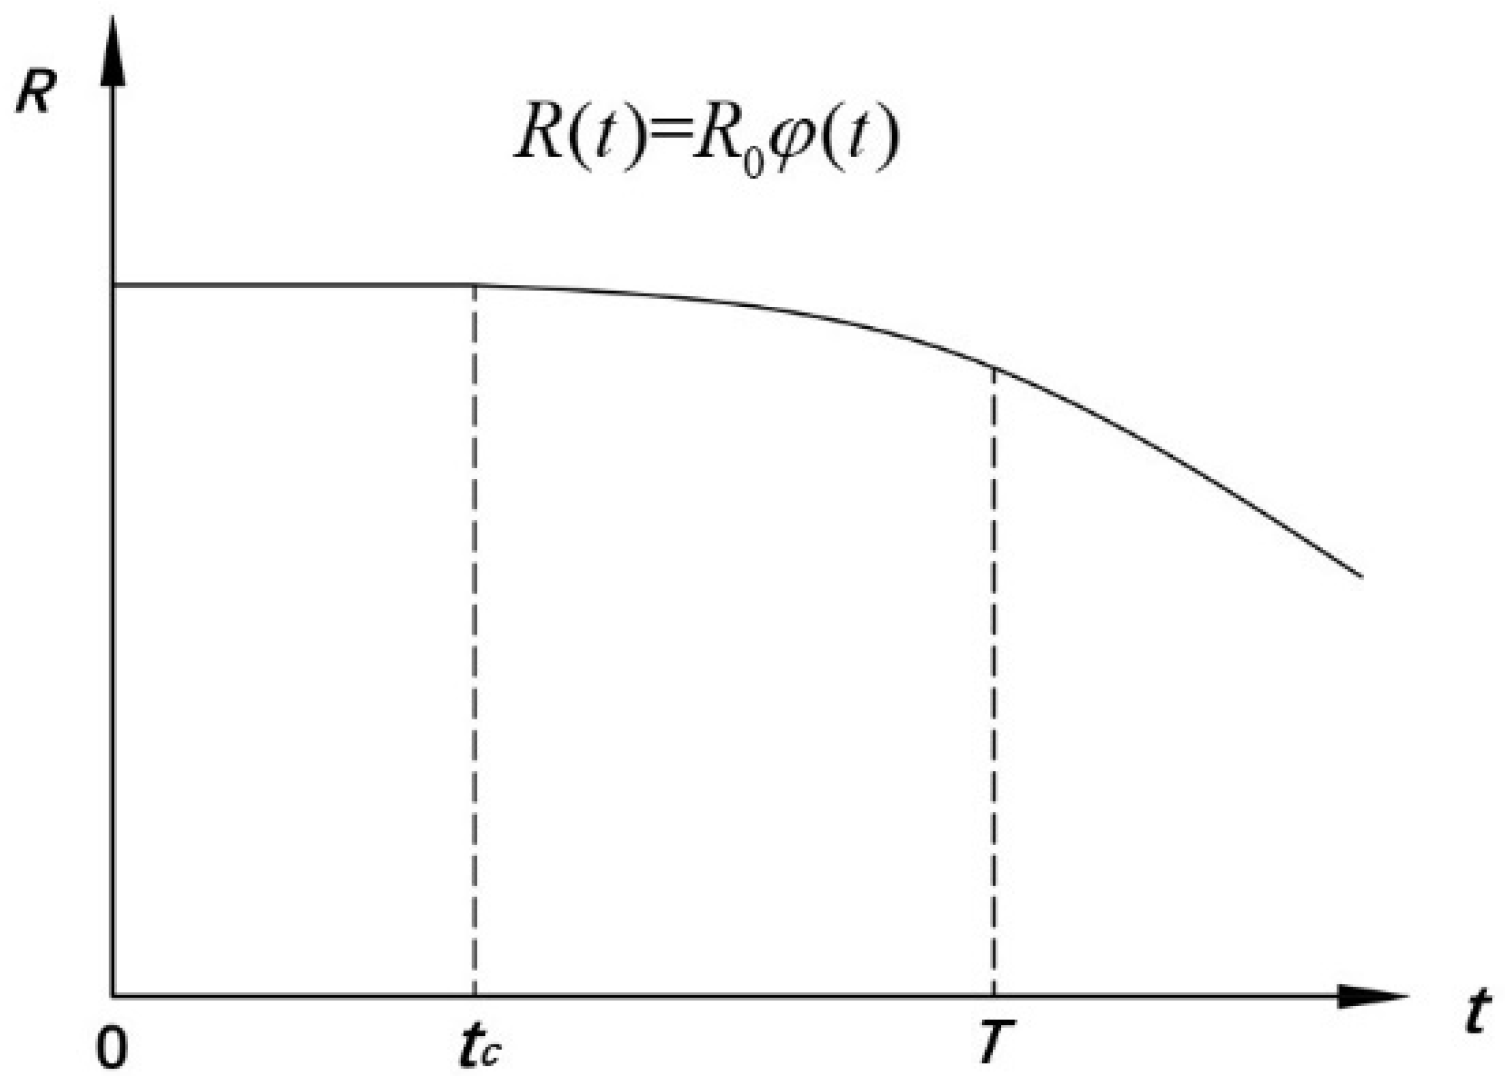
2.2.1. General Trend of Resistance Degradation
2.2.2. A Time-Varying Resistance Model Considering the Concrete carbonation and Steel-Bar Corrosion
- Initial Time of Steel-bar Corrosion
- Ratio of Concrete Section Loss
- Ratio of Steel-Bar Section Loss
3. Reasonable Selection of the Target Reliability Index of the Long-Span Main Girder
3.1. Analysis Flow of Relationship between Service Life and Target Reliability Index
- calculate the standard values of the dead load, and vehicle load of the main girder;
- obtain the mean, standard deviation, and coefficient of variation of dead load, vehicle load, and resistance from the Unified Standard for Structural Reliability Design of Highway Engineering [33];
- calculate the reasonable resistance at the end of the design service life according to the recommended reliability index;
- calculate the resistance deterioration φ(t) at different times according to the resistance degradation model;
- correct the standard and mean value of resistance according to the resistance deterioration;
- calculate the reliability index at different times by the first-order reliability method;
- calculate the suggested value of the initial reliability index under different service life, and then obtain a quantitative relationship between the design service life and the target reliability index.
3.2. Analysis of Internal Force and Resistance of Main Girder of Cable-Stayed Bridge
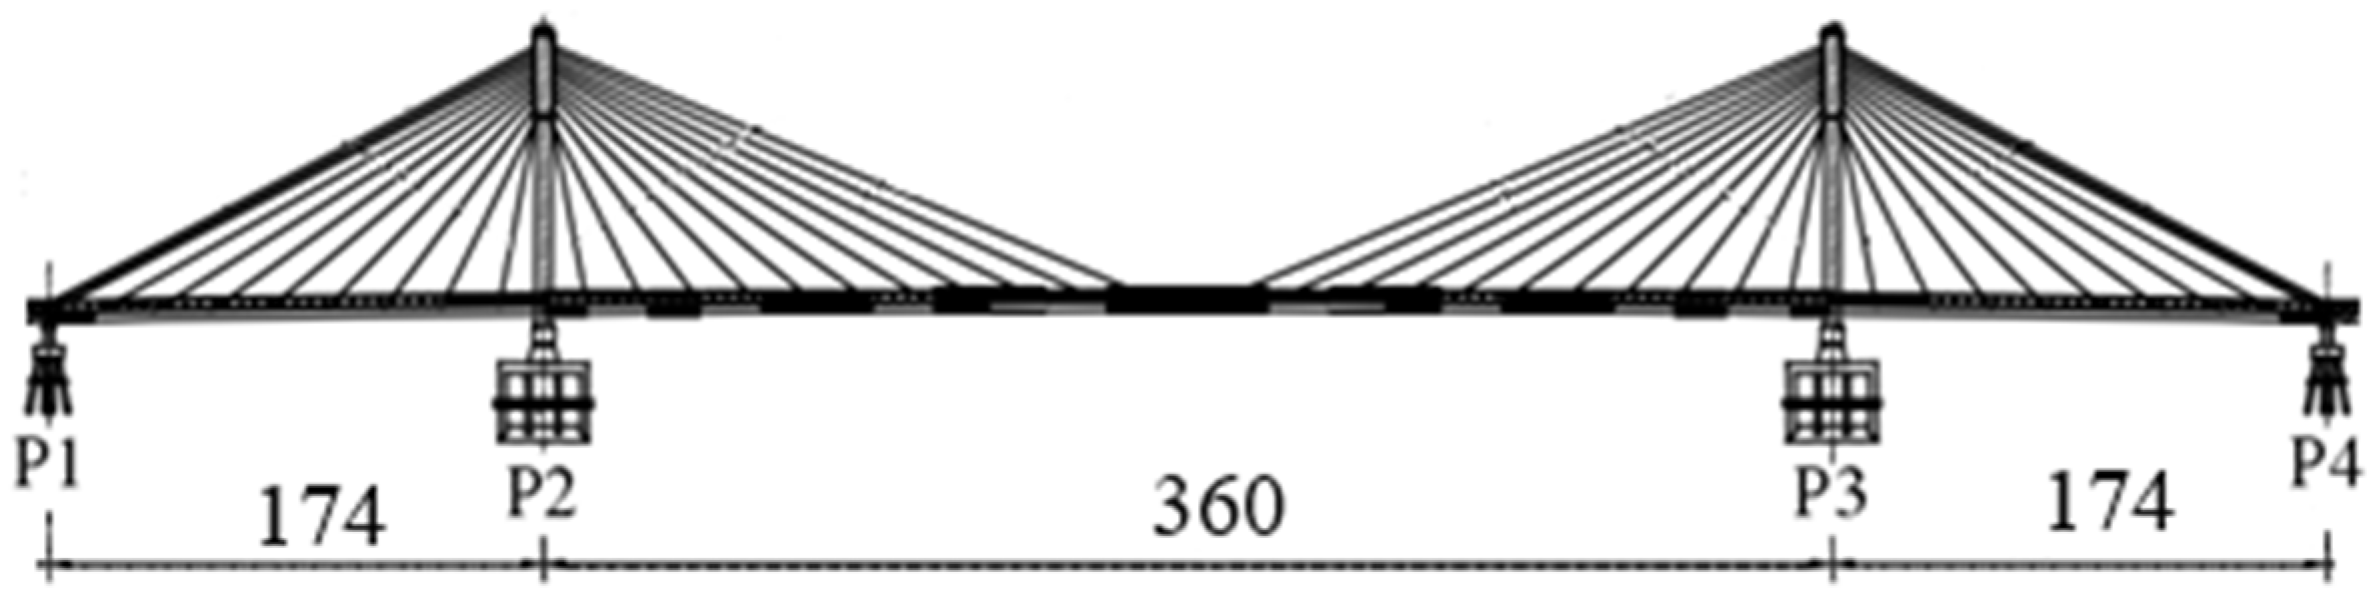
3.2.1. General Engineering Situation
- Material Properties
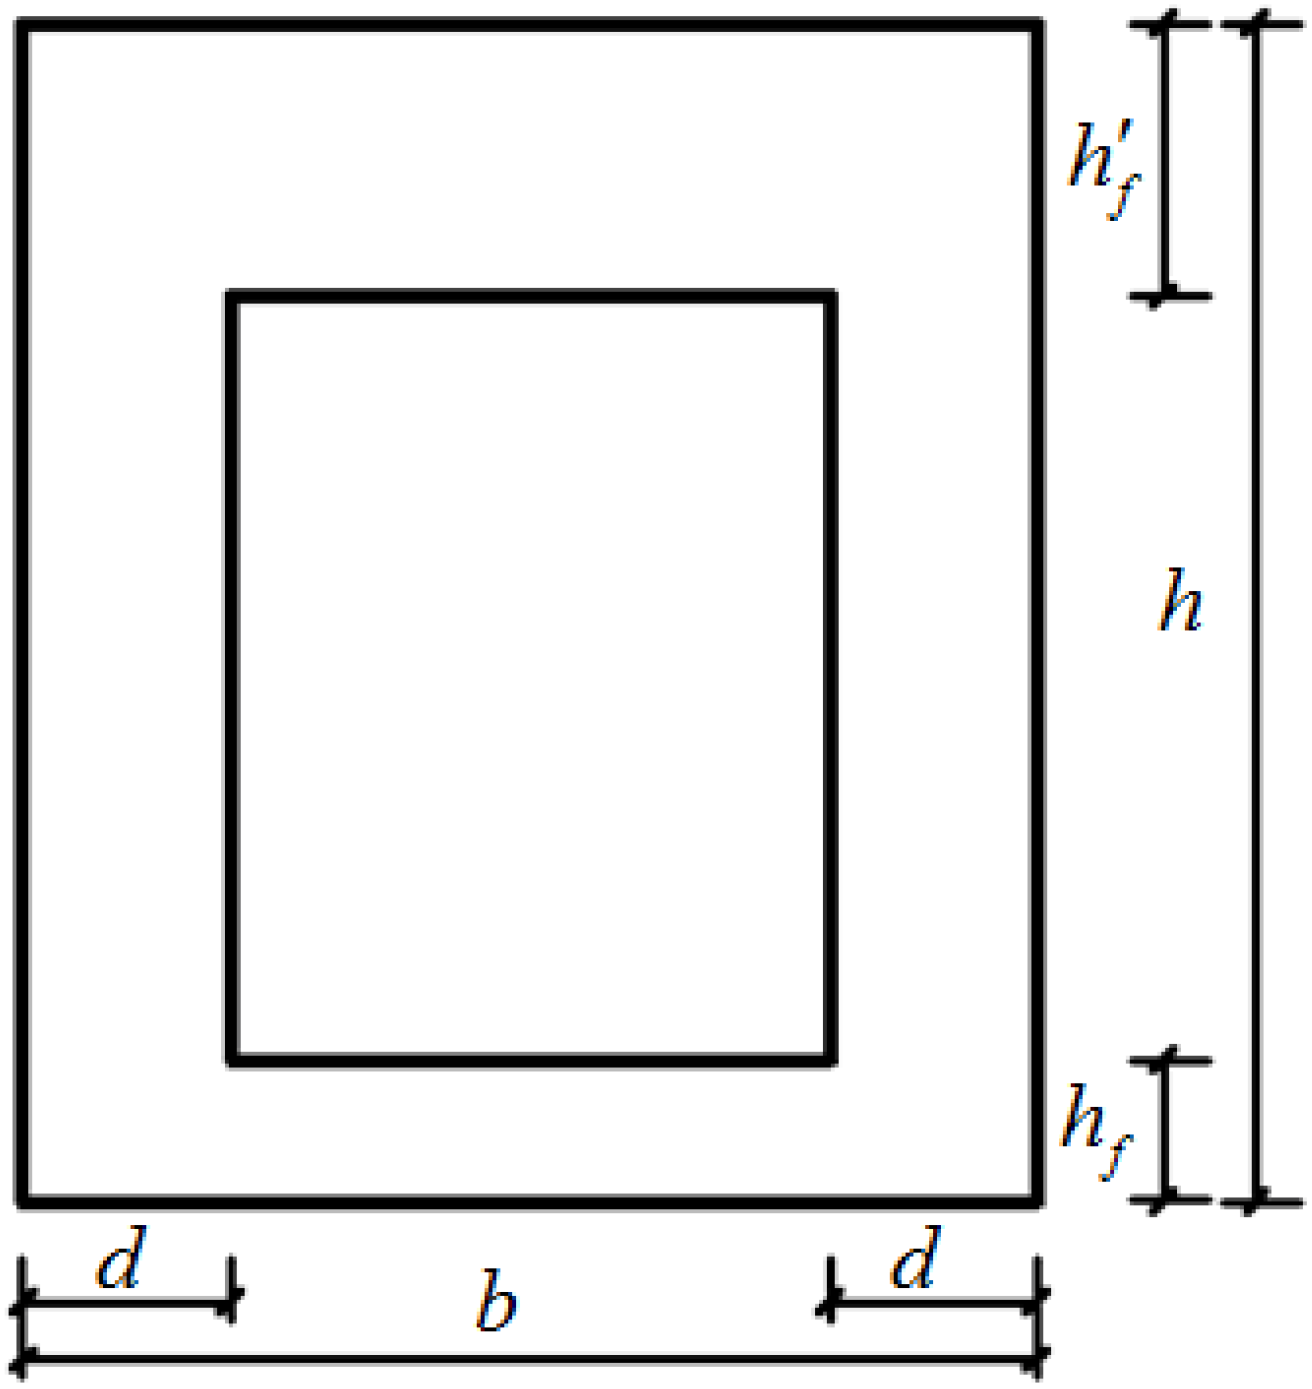
- Geometric Property of Section
- Structural Size
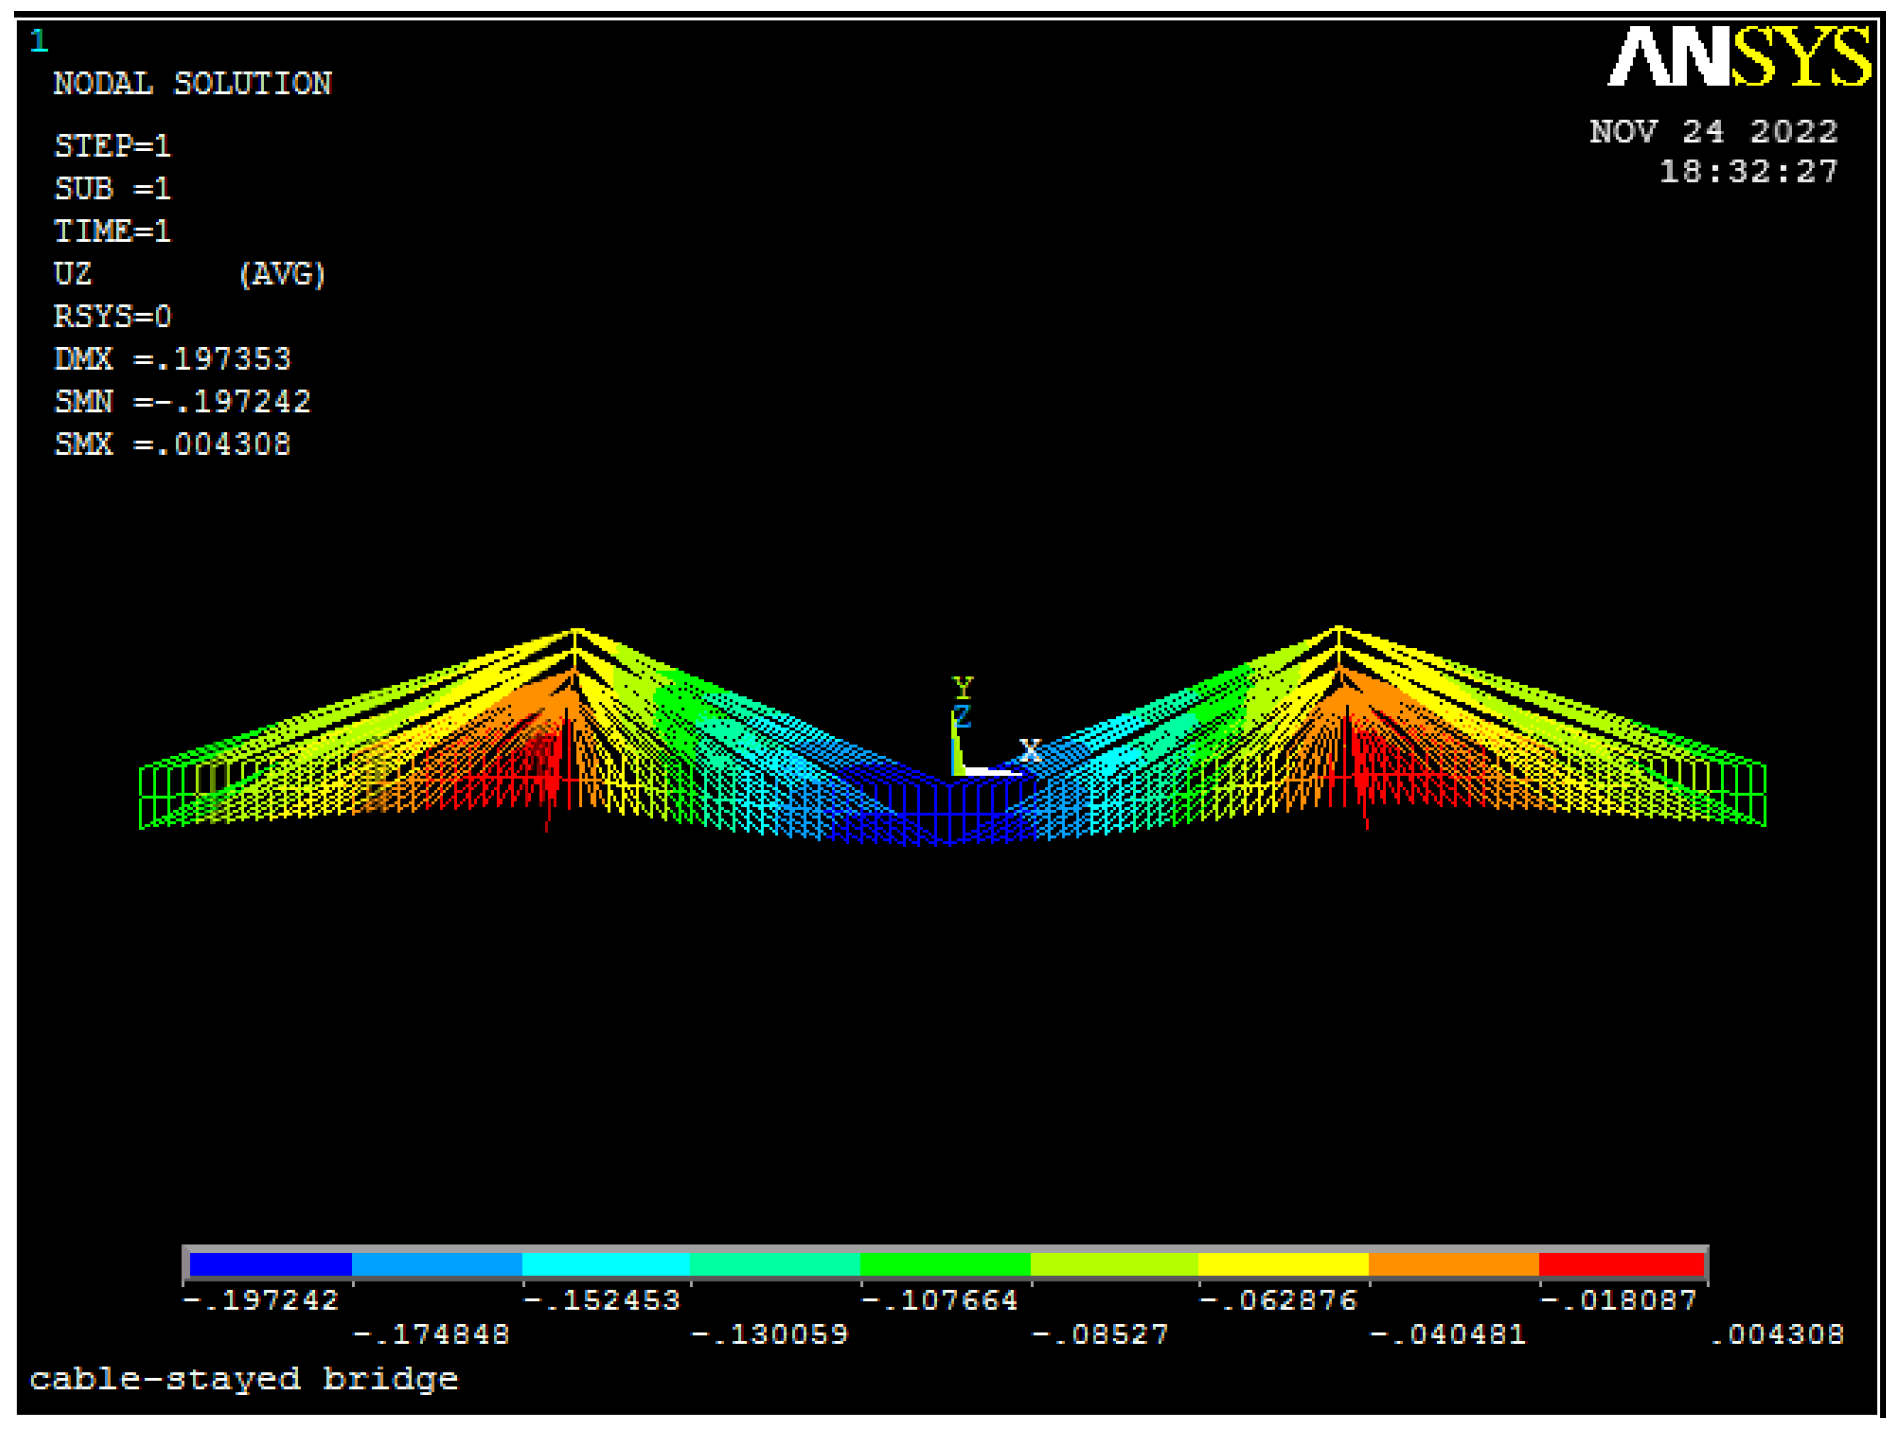
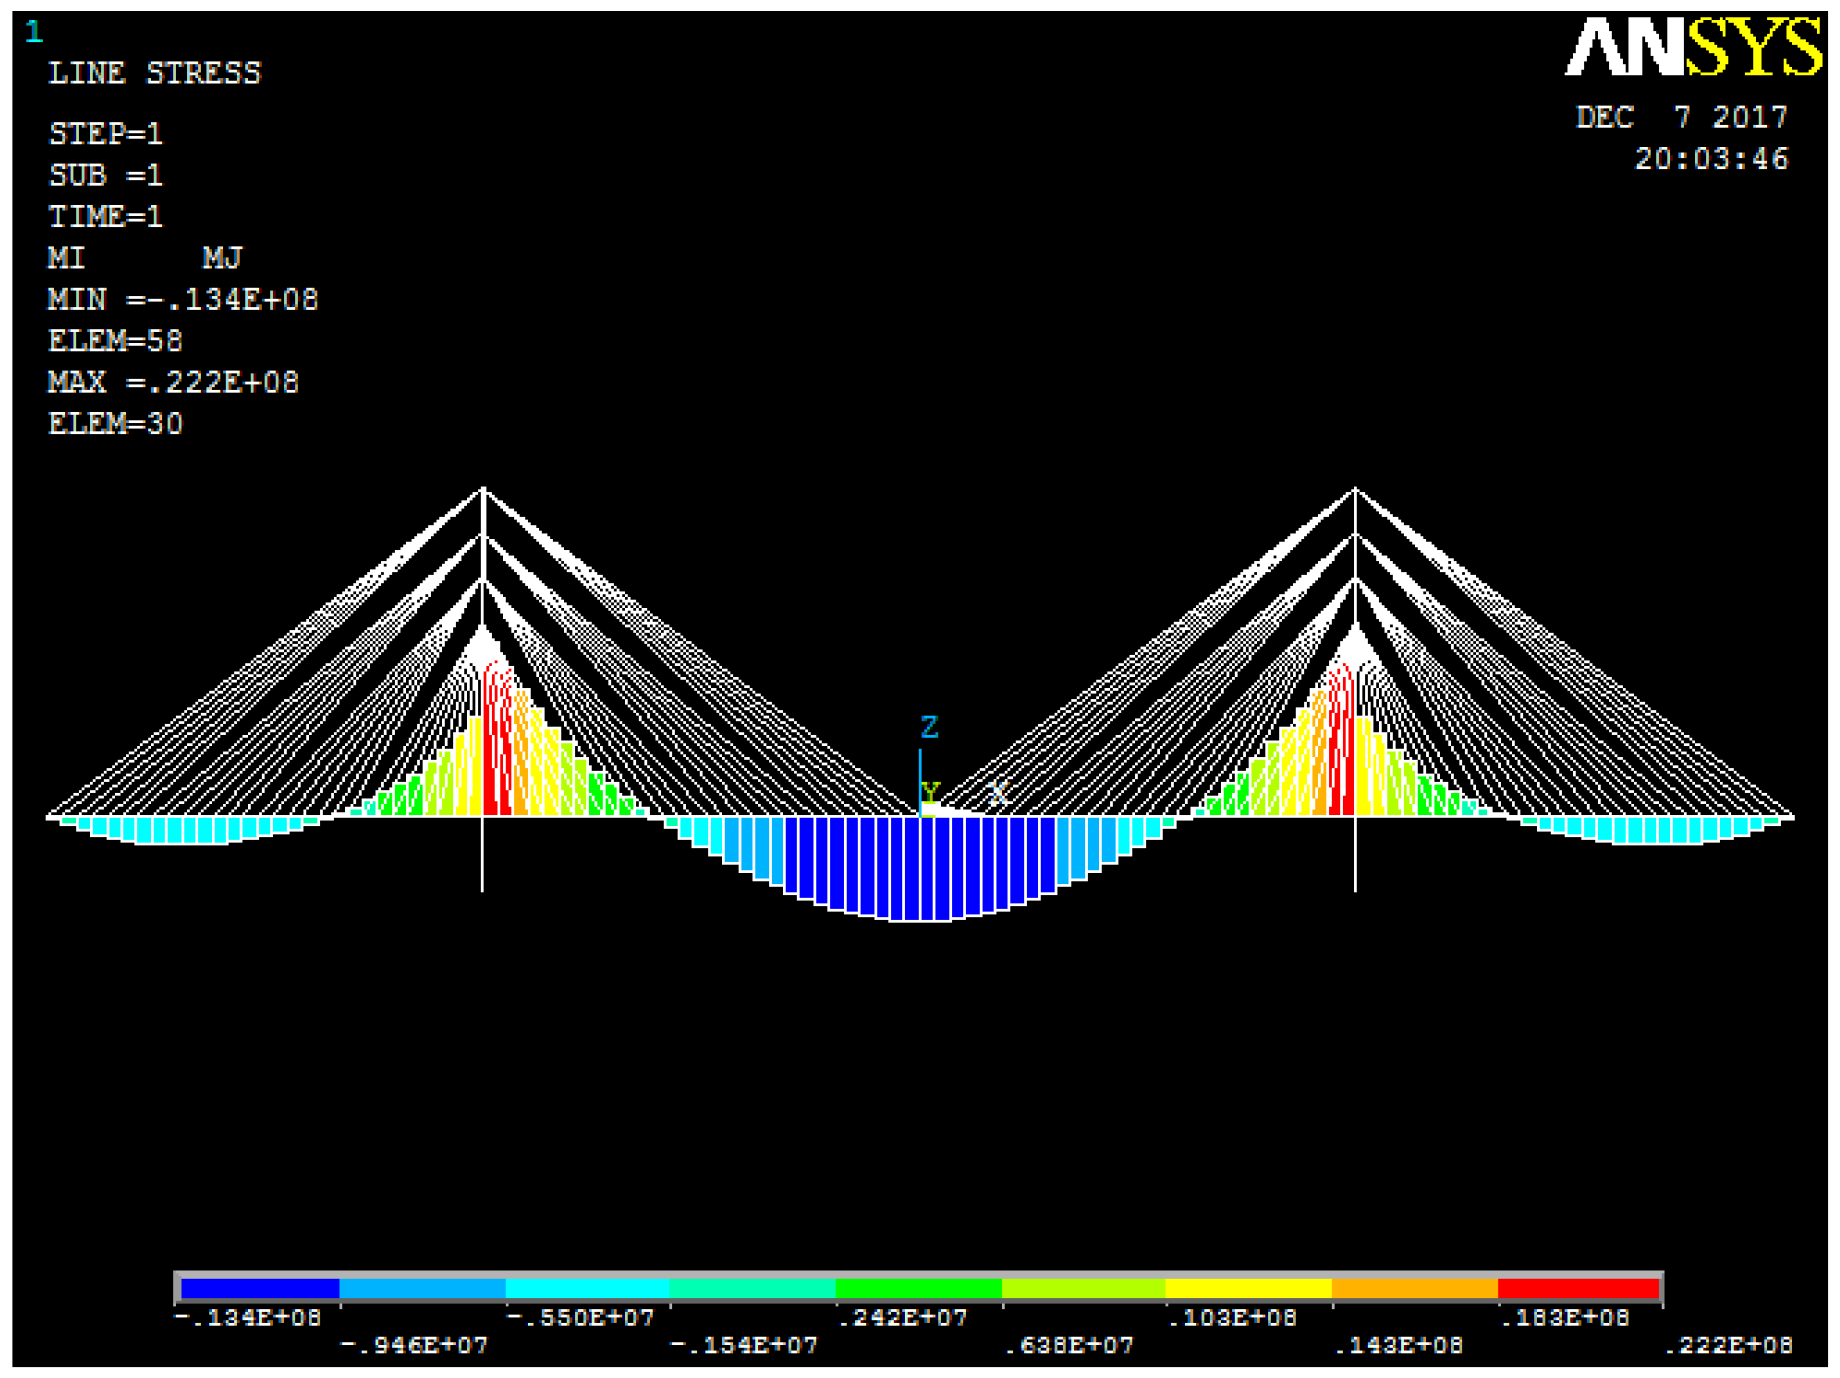
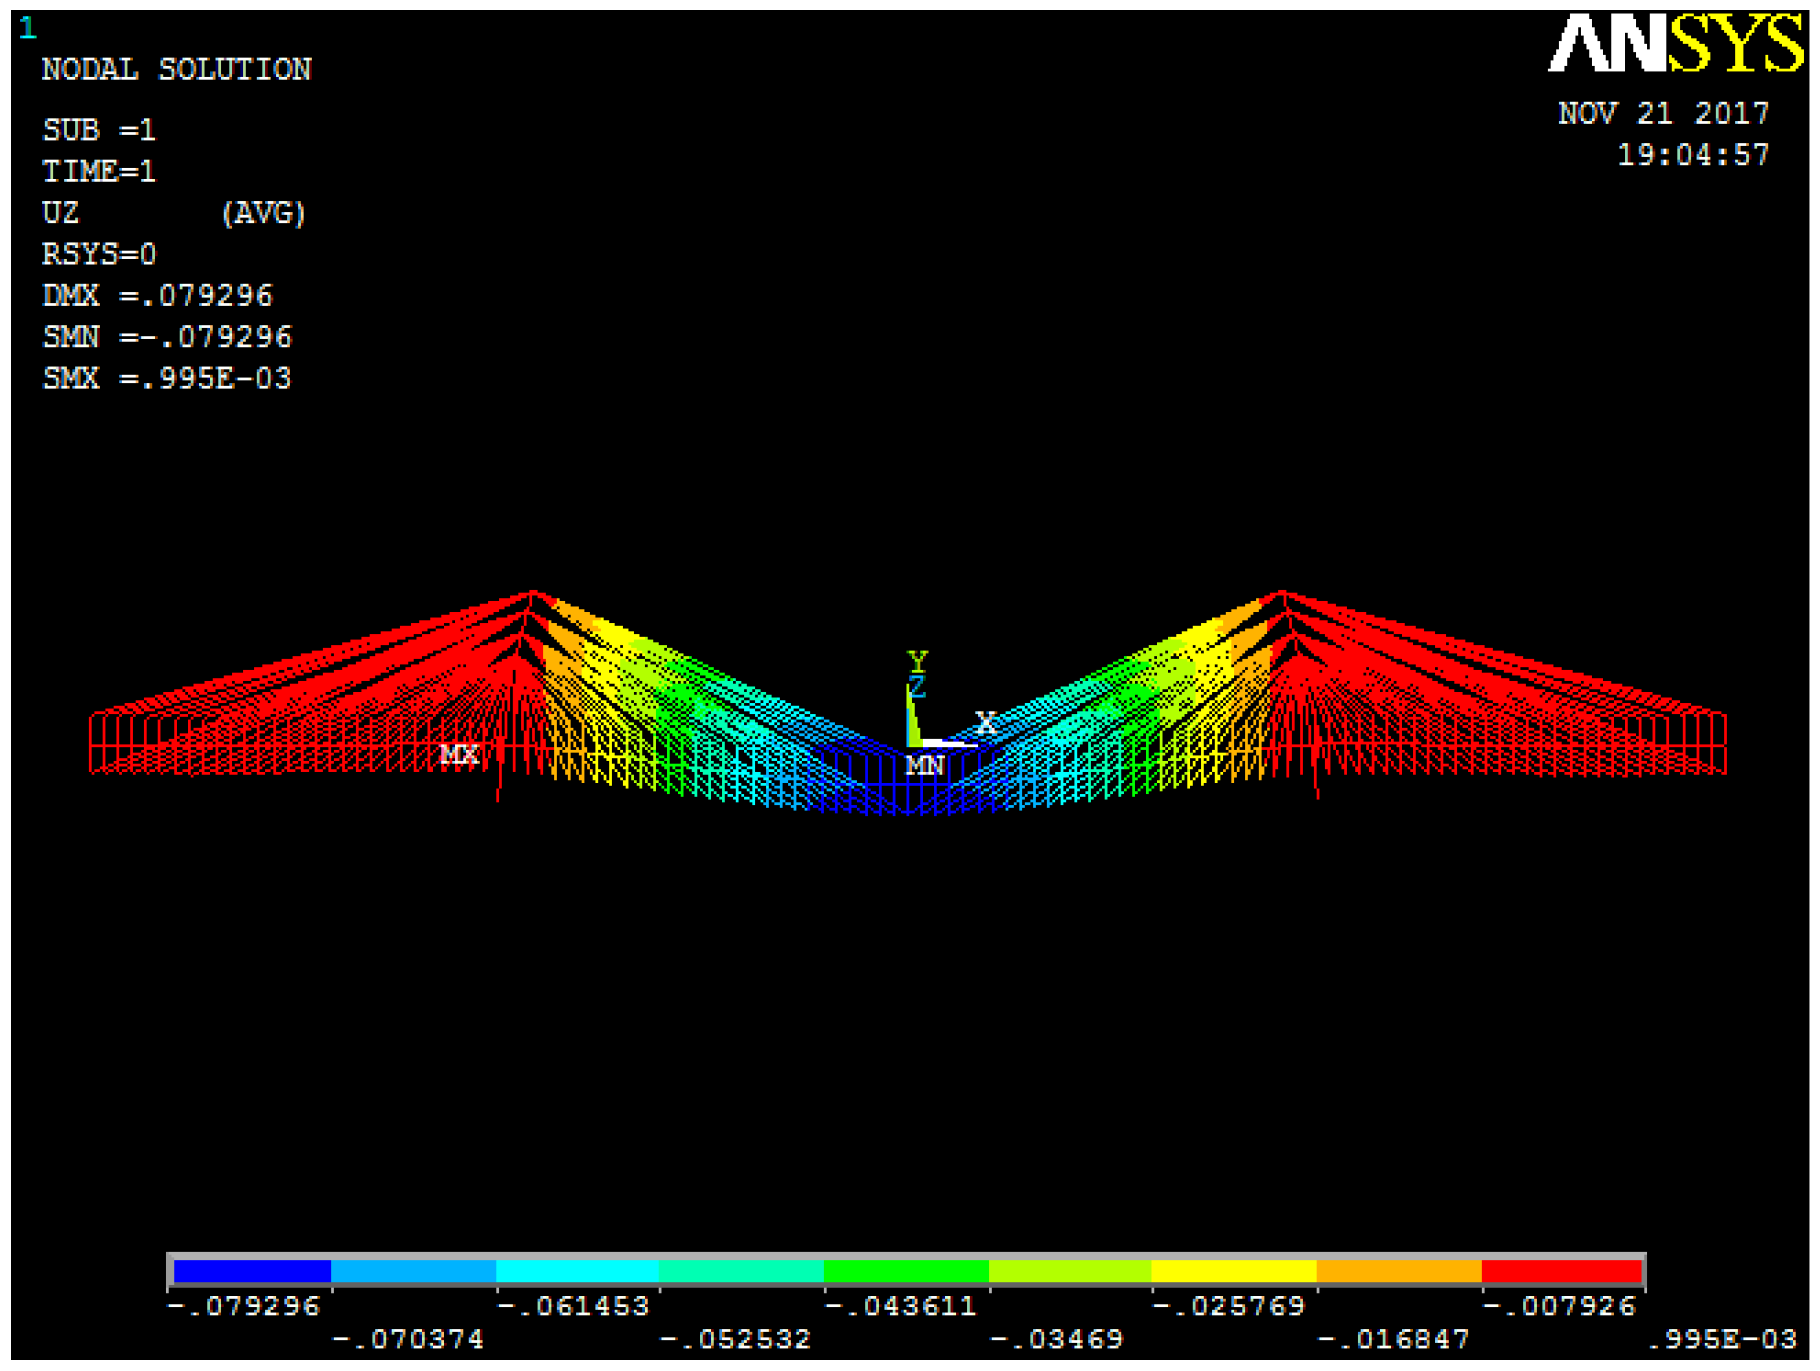
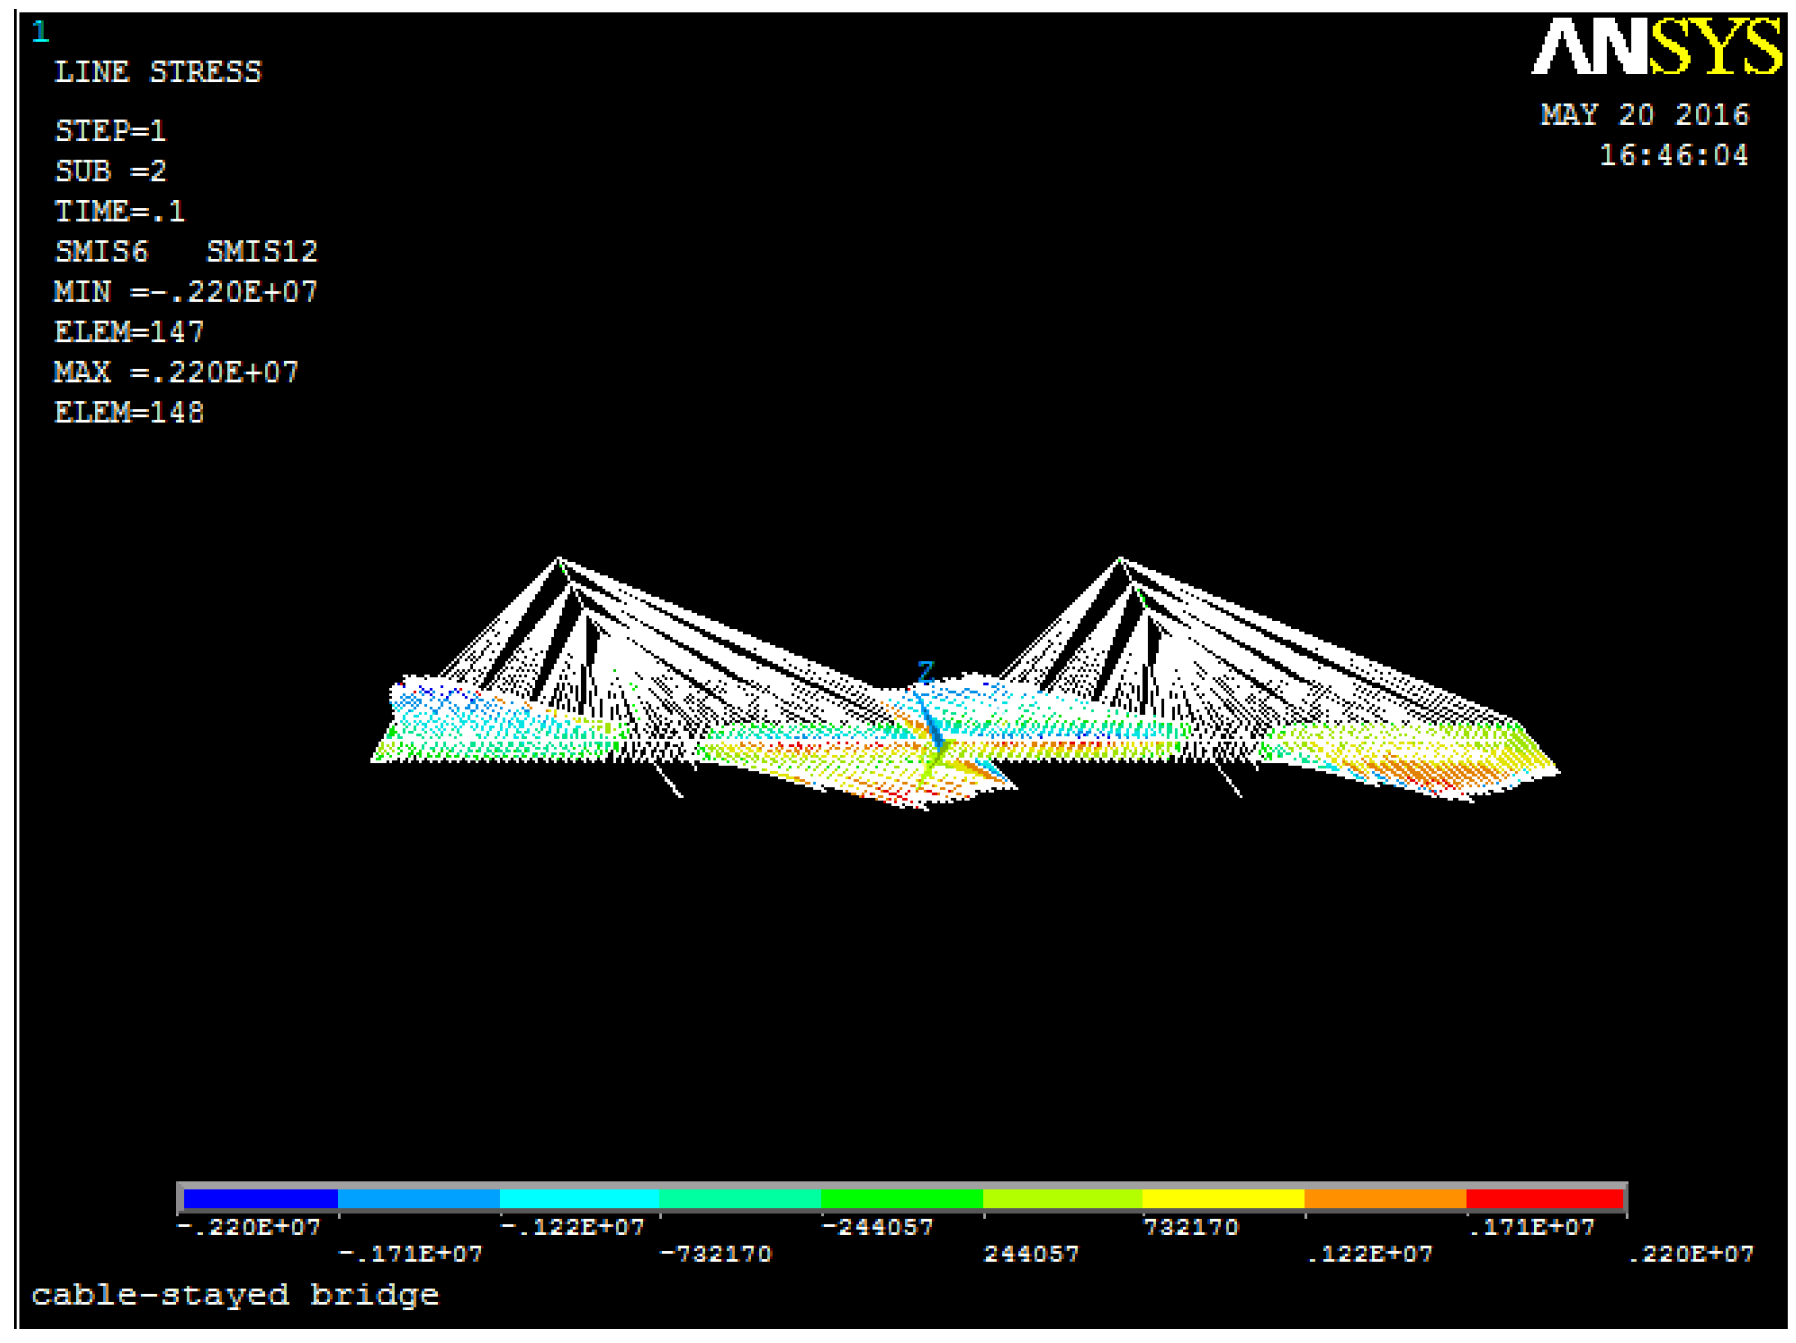
3.2.2. ANSYS Model and Results of Finite Element Analysis
- The main girder of the cable-stayed bridge is completely floating, and at the end of the cable tower and the cable-stayed bridge, the main girder releases longitudinal constraints.
- The middle- and lower-tower columns are simulated by the same beam element, while the upper-tower column is simulated by four beam elements and the cable-tower beam by two rigid beam elements.
- According to General Specifications for Design of Highway Bridge and Culverts (JTG D60-2015, Beijing China), use the Road-I level load as the live load, which contains a uniform load with the value of 10.5 kN/m and a concentrated load with the value of 360 kN. Considering the most dangerous internal force of mid-span section (control section generally), the uniform load is fully distributed between the two towers, and the concentrated load is located at the mid-span position.
- Boundary conditions: Freedom constraints are imposed in both the vertical and lateral directions on the left end of the bridge, and for the rigid cross-beams on the main girder of the cable tower on the right end of the bridge, they are imposed on the right end of the bridge in the lateral direction and on the bottom of the cable tower, and complete hinge constraints are imposed on all cable and beam elements.
3.2.3. Parametric Statistics
- Parametric Statistics of Dead Load
- Parametric Statistics of Live Load
- Resistance Parameters
3.3. Calculation Results of Target Reliability Index
- Based on the resistance model concerning concrete carbonation and steel corrosion, the degradation curve of the reliability index changes slowly.
- Before carbonation reaches the steel surface, the structural reliability index is almost constant. The later the steel bar starts to rust, the better the structural reliability. The initial time of steel bars corrosion is closely related to the local environment. Thus, even if the steel bars have already started to rust, as long as the micro-environment of the main girder is under control, its structural load carrying capacity can be guaranteed.
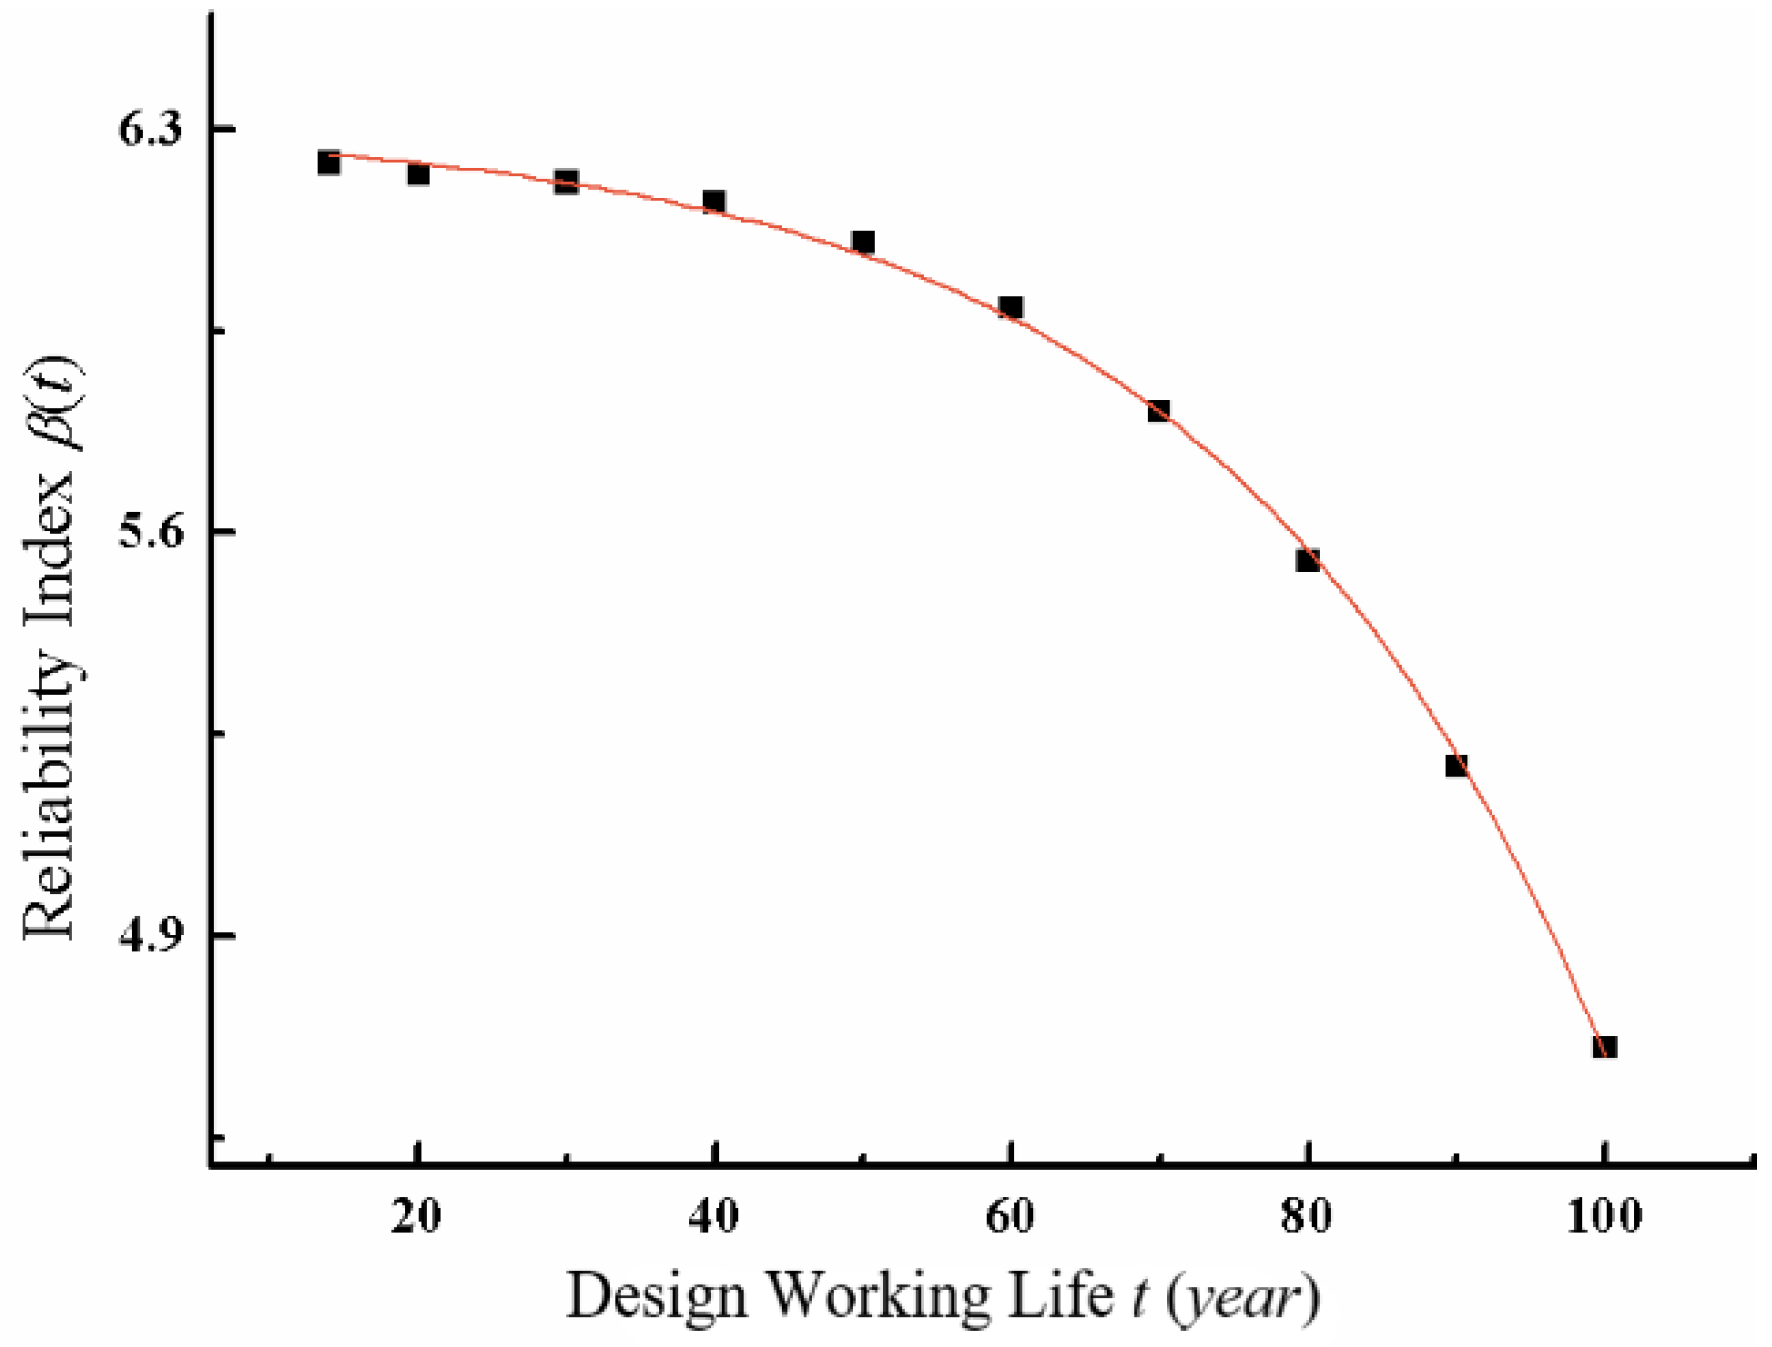
3.4. Relationship between Target Reliability Index and Service Life
3.5. Discussion
4. Conclusions
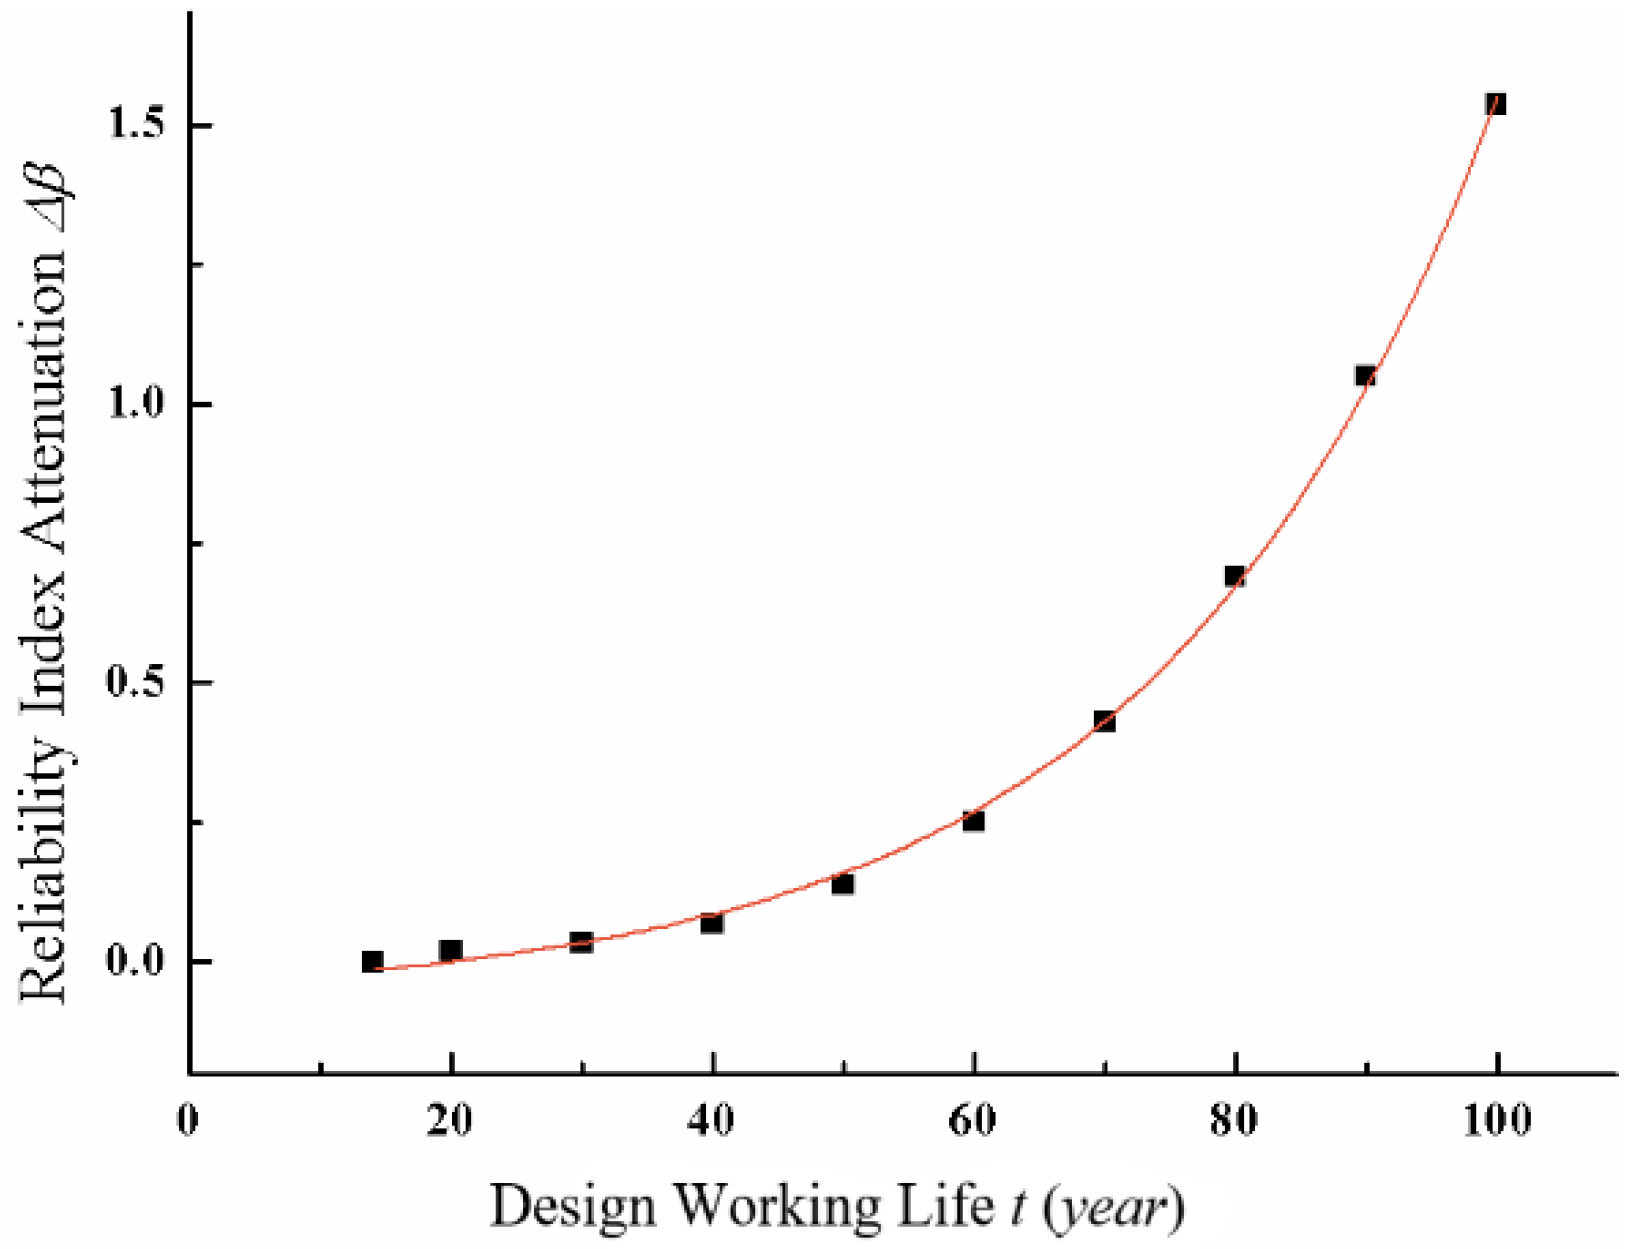
- Through the analysis using the resistance degradation model concerning concrete carbonation and steel corrosion, the reliability index of main girder of cable-stayed bridges decreases exponentially during the structural service life under the failure mode of bending.
- A hybrid analysis framework composed of numerical method and analytical method is constructed for the cable-stayed bridge’s target reliability index analysis, in which the most dangerous moment of the main girder under vehicle load is calculated by finite element analysis and the reliability index calculation is calculated by the first order second moment method.
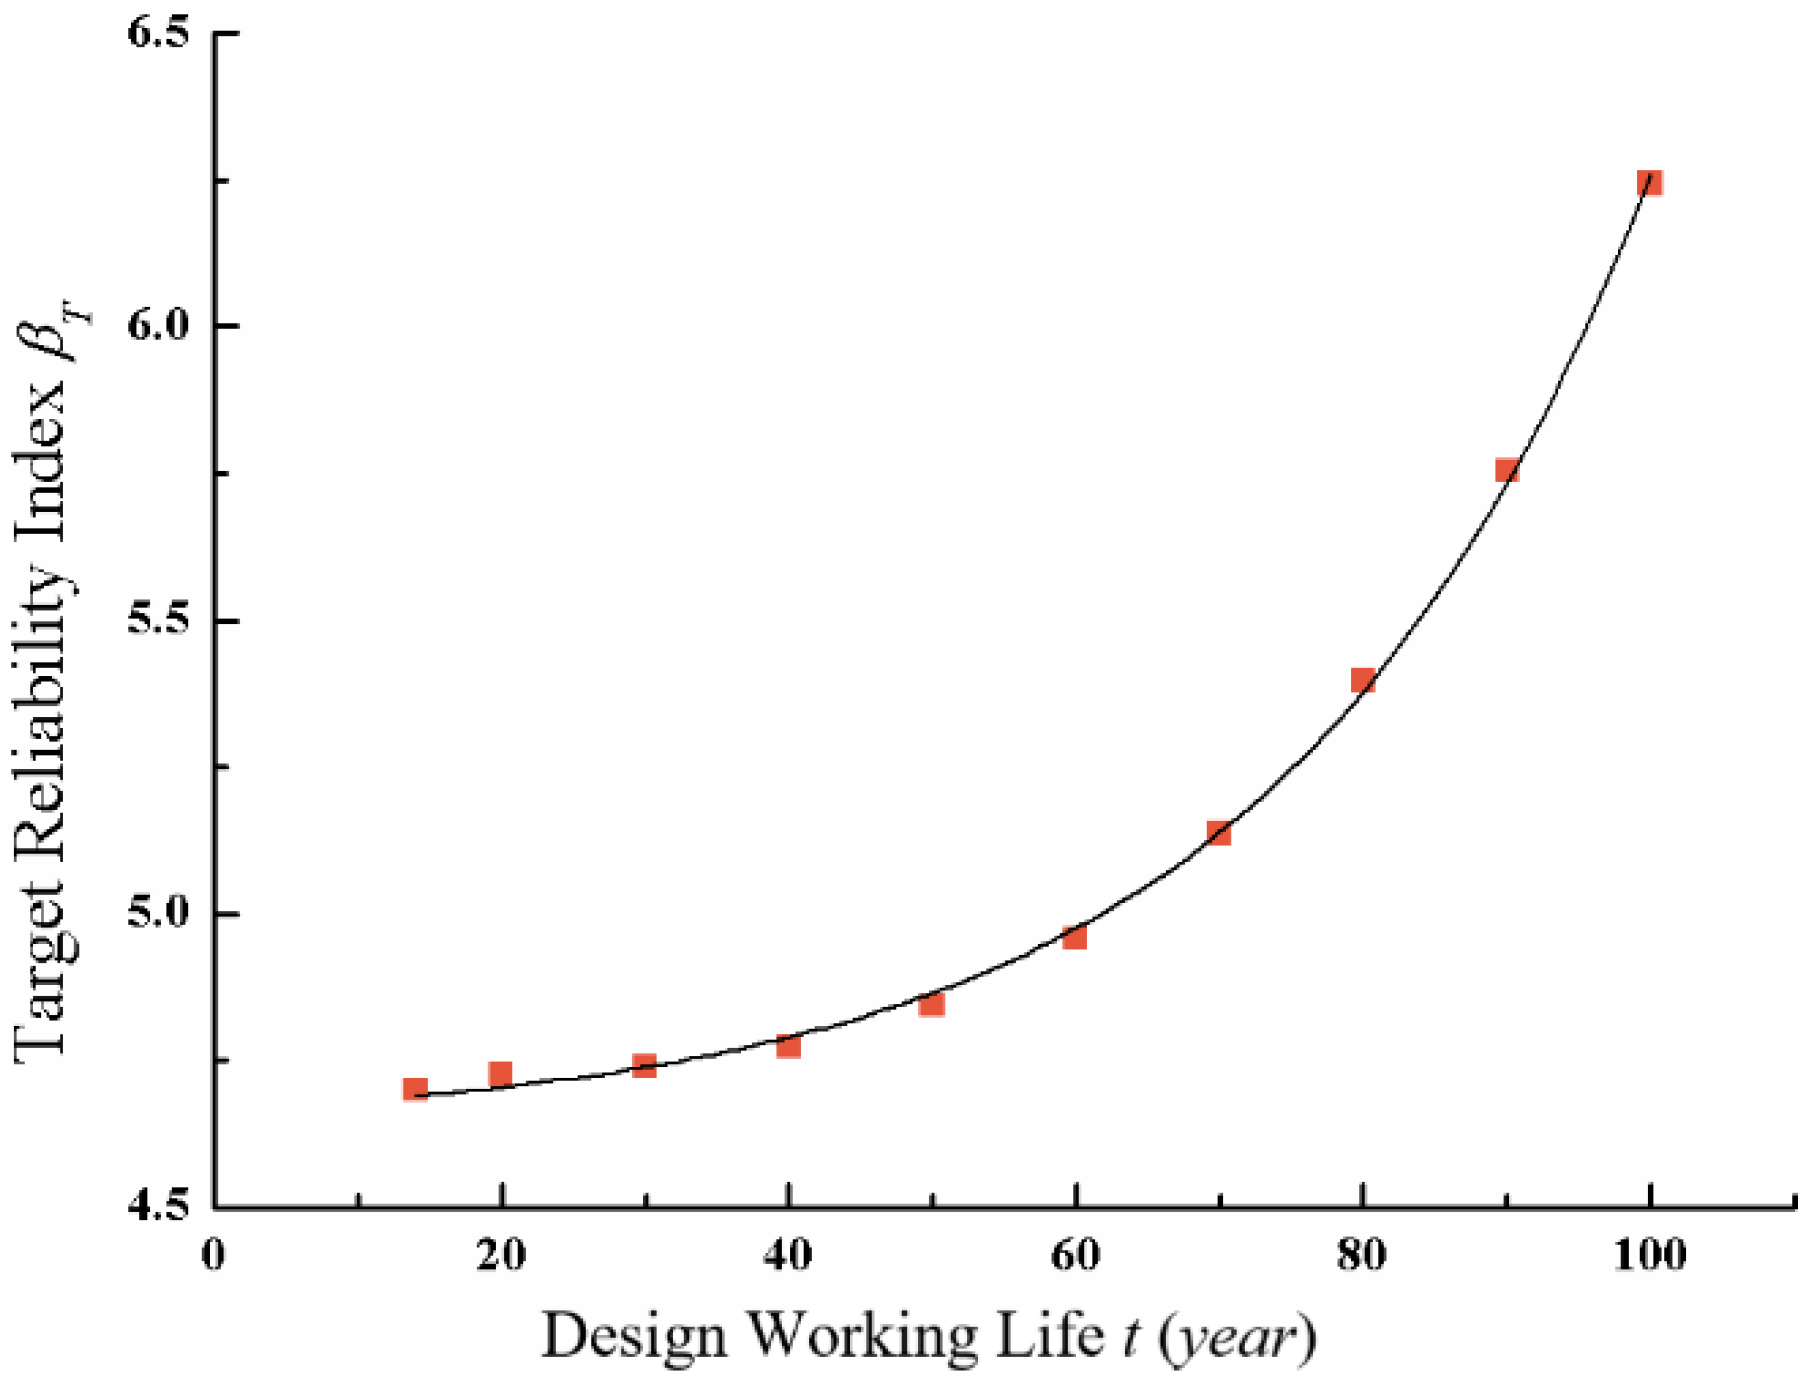
- The quantitative relationship between the target reliability index and the design service life was obtained as Equation (22). Based on that, the target reliability index of the concrete main girder of a cable-stayed bridge with a design service life of 100 years is suggested as 6.24, which is higher than the suggested values from the current relevant codes.
Author Contributions
Funding
Data Availability Statement
Conflicts of Interest
References
- Dan, M.F.; Strauss, A.; Kim, S. Bridge reliability assessment based on monitoring. J. Bridge Eng. 2008, 13, 258–270. [Google Scholar]
- Pape, T.M.; Melchers, R.E. Performance of 45-year-old corroded prestressed concrete beams. Struct. Build. 2013, 166, 547–559. [Google Scholar] [CrossRef] [Green Version]
- Frangopol, D.M.; Soliman, M. Life-cycle of structural systems: Recent achievements and future directions. Struct. Infrastruct. Eng. 2015, 12, 1–20. [Google Scholar] [CrossRef]
- Frangopol, D.M.; Saydam, D.; Kim, S. Maintenance, management, life-cycle design and performance of structures and infrastructures: A brief review. Struct. Infrastruct. Eng. 2011, 8, 1–25. [Google Scholar] [CrossRef]
- Sabatition, S.; Frangopol, D.M.; Dong, Y. Sustainability-informed maintenance optimization of highway bridges considering multi-attribute utility and risk attitude. Eng. Struct. 2015, 102, 310–321. [Google Scholar] [CrossRef]
- Biondini, F.; Frangopol, D.M. Life-Cycle Performance of Deteriorating Structural Systems under Uncertainty: Review. J. Struct. Eng. 2016, 142, F4016001. [Google Scholar] [CrossRef]
- Dong, D.M.F.Y.; Sabatino, S. Bridge life-cycle performance and cost: Analysis, prediction, optimisation and decision-making. Struct. Infrastruct. Eng. 2017, 13, 1–19. [Google Scholar]
- Ministry of Transport of the People’s Republic of China. People’s Republic of China Industry Recommended Standard. In Specifications for Design of Highway Cable-stayed Bridge; JTG/T 3365-01—2020; Ministry of Transport of the People’s Republic of China: Beijing, China, 2020. [Google Scholar]
- Lee, J.Y.; Ellingwood, B.R. Ethical discounting for civil infrastructure decisions extending over multiple generations. Struct. Saf. 2015, 57, 43–52. [Google Scholar] [CrossRef]
- Ellingwood, B.R.; Lee, J.Y. Life cycle performance goals for civil infrastructure: Intergenerational risk-informed decisions. Struct. Infrastruct. Eng. 2015, 12, 1–8. [Google Scholar] [CrossRef]
- Li, G.; Cheng, G. Optimal decision for the target value of performance-based structural system reliability. Struct. Multidiscip. Optim. 2001, 22, 261–267. [Google Scholar] [CrossRef]
- Suh, K.D. Evaluation of target reliability indices and partial safety factors for sliding of caisson breakwaters. J. Coast. Res. 2011, 56, 622–626. [Google Scholar]
- Furuta, H. Bridge reliability experiences in Japan. Eng. Struct. 1998, 20, 972–978. [Google Scholar] [CrossRef]
- Nowak, A.S. Calibration of LRFD Bridge Code. ASCE J. Struct. Eng. 1995, 121, 1245–1251. [Google Scholar] [CrossRef]
- Nowak, A.S. Calibration of LRFD Bridge Code; NCHRP Report 368; Transportation Research Board: Washington, DC, USA, 1999. [Google Scholar]
- American Association of State Highway and Transportation Officials. AASHTO LRFD Bridge Design Specification, 8th ed.; American Association of State Highway and Transportation Officials: Washington, DC, USA, 2017. [Google Scholar]
- Zhang, Z.; Zhou, M.; Hu, C.; Liu, M. Research on Reasonable Value of Target Reliability Index for Steel Main Girder of Cable-Stayed Bridge Considering Durability. Struct. Infrastruct. Eng. 2019, 15, 1382–1391. [Google Scholar] [CrossRef]
- Zhang, Z.; Zhou, M.; Fang, M. First-Passage Probability Analysis of Wiener Process using Different Methods and its Applications in the Evaluation of Structural Durability Degradation. Eur. J. Environ. Civ. Eng. 2019, 25, 1763–1781. [Google Scholar] [CrossRef]
- Zhang, Z.; Li, W.; Yang, J. Analysis of Stochastic Process to Model Safety Risk in Construction Industry. J. Civ. Eng. Manag. 2021, 27, 87–99. [Google Scholar] [CrossRef]
- Ang, A.H.-S.; Leon, D.D. Determination of optimal target reliabilities for design and upgrading of structures. Struct. Saf. 1997, 19, 91–103. [Google Scholar] [CrossRef]
- Ang, A.H.-S.; Leon, D.D. Optimal target reliabilities for aseismic design of R/C buildings. In Proceedings of the Transactions of the 13th International Conference on Structural Mechanics in Reactor Technology, Porto Alegre, Brazil, 13–18 August 1995. [Google Scholar]
- Zhu, B.; Frangopol, D.M. Risk-Based Approach for Optimum Maintenance of Bridges under Traffic and Earthquake Loads. J. Struct. Eng. 2013, 139, 422–434. [Google Scholar] [CrossRef]
- Nowak, A.S.; Kaszynska, M. Target Safety Levels for Design and Evaluation of Bridges. Trans. JWRI 2003, 32, 189–196. [Google Scholar]
- Lee, S.H.; Lee, H.H.; Paik, I.; Lee, H.S. Differentiation of Target Reliability and Design Life in Design of Long-span Cable-supported Bridges. IABSE Symp. Rep. 2014, 102, 64–70. [Google Scholar]
- Wen, Y.K. Reliability and performance-based design. Struct. Saf. 2001, 23, 407–428. [Google Scholar] [CrossRef]
- Katade, R.; Katsuki, S. Target reliability index determination method based on burden risk concept. Doboku Gakkai Ronbunshuu A 2009, 65, 42–60. [Google Scholar] [CrossRef]
- Huaco, D.R.; Bowders, J.J.; Loehr, J.E. Transportation Research Board. Method to develop target levels of reliability for design using LRFD. In Proceedings of the 91th Annual Meeting, Washington, DC, USA, 22–26 January 2012. [Google Scholar]
- Holicky, M. Optimum reliability level for structures. In Vulnerability, Uncertainty, and Risk: Quantification, Mitigation, and Management, Proceedings of the Second International Conference on Vulnerability and Risk Analysis and Management (ICVRAM) and the Sixth International Symposium on Uncertainty, Modeling, and Analysis (ISUMA), Liverpool, UK, 13–16 July 2014; American Society of Civil Engineers: Reston, VA, USA, 2014; pp. 184–193. [Google Scholar]
- Yanaka, M.; Nowak, A.S.; Ghasemi, S.H. Reliability-based and life-cycle-cost oriented design recommendations for prestressed concrete bridge girders. Struct. Concr. 2016, 17, 836–847. [Google Scholar] [CrossRef]
- Ghasemi, S.H.; Nowak, A.S. Target reliability for bridges with consideration of ultimate limit state. Eng. Struct. 2017, 152, 226–237. [Google Scholar] [CrossRef]
- Sunyong Kim, B.G.; Dan, M.F. Optimum Target Reliability Determination for Efficient Service Life Management of Bridge Networks. J. Bridge Eng. 2020, 25, 04020087. [Google Scholar]
- Nguyena, V.; Jeonga, M.C.; Hanb, T.S.; Konga, J.S. Reliability-based optimisation design of post-tensioned concrete box girder bridges considering pitting corrosion attack. Struct. Infrastruct. Eng. 2013, 9, 78–96. [Google Scholar] [CrossRef]
- GB/T50283-1999; Unified Standard for Structural Reliability Design of Highway Engineering. People’s Communications Press: Beijing, China, 1999.
- JTGD60—2015; Common Specifications for Highway Bridges and Culverts Design. People’s Communications Press: Beijing, China, 2015.
- Darmawan, M.S.; Stewart, M.G. Spatial time-dependent reliability analysis of corroding pretensioned prestressed concrete bridge girders. Struct. Saf. 2007, 29, 16–31. [Google Scholar] [CrossRef]
- Enright, M.P.; Dan, M.F. Probabilistic analysis of resistance degradation of reinforced concrete bridge beams under corrosion. Eng. Struct. 1998, 20, 960–971. [Google Scholar] [CrossRef]
- Ahammed, M.; Melchers, R.E. A convenient approach for estimating time-dependent structural reliability in the load space. Probabilistic Eng. Mech. 2009, 24, 467–472. [Google Scholar] [CrossRef]
- Li, Q.; Wang, C.; Ellingwood, B.R. Time-dependent reliability of aging structures in the presence of non-stationary loads and degradation. Struct. Saf. 2015, 52, 132–141. [Google Scholar] [CrossRef]
- Wang, C.; Li, Q.; Ellingwood, B.R. Time-dependent reliability of ageing structures: An approximate approach. Struct. Infrastruct. Eng. 2016, 12, 1566–1572. [Google Scholar] [CrossRef]
- Melchers, R.E. Progress in developing realistic corrosion models. Struct. Infrastruct. Eng. 2018, 14, 843–854. [Google Scholar] [CrossRef]
- Melchers, R.E.; Chaves, I.A. A comparative study of chlorides and longer-term reinforcement corrosion. Mater. Corros. -Werkst. Und Korros. 2017, 68, 613–621. [Google Scholar] [CrossRef]
- Bocchini, P.; Saydam, D.; Frangopol, D.M. Efficient, accurate, and simple Markov chain model for the life-cycle analysis of bridge groups. Struct. Saf. 2013, 40, 51–64. [Google Scholar] [CrossRef]
- Guo, T.; Frangopol, D.M.; Chen, Y. Fatigue reliability assessment of steel bridge details integrating weigh-in-motion data and probabilistic finite element analysis. Comput. Struct. 2012, 112, 245–257. [Google Scholar] [CrossRef]
- Kim, S.; Frangopol, D.M.; Soliman, M. Generalized Probabilistic Framework for Optimum Inspection and Maintenance Planning. J. Struct. Eng. 2013, 139, 435–447. [Google Scholar] [CrossRef]
- García-Segura, T.; Yepes, V.; Frangopol, D.M.; Yang, D.Y. Lifetime reliability-based optimization of post-tensioned box-girder bridges. Eng. Struct. 2017, 145, 381–391. [Google Scholar] [CrossRef]
- Lim, S.; Akiyama, M.; Frangopol, D.M. Assessment of the structural performance of corrosion-affected RC members based on experimental study and probabilistic modeling. Eng. Struct. 2016, 127, 189–205. [Google Scholar] [CrossRef]
- Otsuka, H.; Furukawa, A.; Suzuki, Y.; Betsumiya, T. Reliability analysis of cable-stayed bridge considering uncertain structural properties and input ground motion. Doboku Gakkai Ronbunshuu A 2010, 28, 16. [Google Scholar]
- Sarja, A.; Vesikari, E. Durability Design of Concrete Structures. Mater. Struct. 1996, 33, 14–20. [Google Scholar] [CrossRef]
- Jiang, J.; Yuan, Y. Prediction model for the time-varying corrosion rate of rebar based on micro-environment in concrete. Constr. Build. Mater. 2012, 35, 625–632. [Google Scholar] [CrossRef]
- Revert, A.B.; Weerdt, K.D.; Hornbostel, K.; Geiker, M.R. Carbonation-induced corrosion: Investigation of the corrosion onset. Constr. Build. Mater. 2018, 162, 847–856. [Google Scholar] [CrossRef]
- Torbati-Sarraf, H.; Poursaee, A. Corrosion of coupled steels with different microstructures in concrete environment. Constr. Build. Mater. 2018, 167, 680–687. [Google Scholar] [CrossRef]
- Chang, C.F.; Chen, J.W. The experimental investigation of concrete carbonation depth. Cem. Concr. Res. 2006, 36, 1760–1767. [Google Scholar] [CrossRef]
- Jones, M.R.; Dhir, R.K.; Newlands, M.D.; Abbas, A.M.O. A study of the CEN test method for measurement of the carbonation depth of hardened concrete. Mater. Struct. 2000, 33, 135–142. [Google Scholar] [CrossRef]
- Schneider, J. Some thoughts on the reliability assessment of existing structures. Struct. Eng. Int. 1992, 2, 13–18. [Google Scholar] [CrossRef]
- Yuan, Y.; Ji, Y. Modeling corroded section configuration of steel bar in concrete structure. Constr. Build. Mater. 2009, 23, 2461–2466. [Google Scholar] [CrossRef]
- Melchers, R.E. Structural Reliability Analysis and Prediction, 3rd ed.; John Wiley: Hoboken, NJ, USA, 1999. [Google Scholar]


| t | 14 | 20 | 30 | 40 | 50 | 60 | 70 | 80 | 90 | 100 |
|---|---|---|---|---|---|---|---|---|---|---|
| φ(t) | 1 | 0.997 | 0.995 | 0.990 | 0.980 | 0.964 | 0.939 | 0.904 | 0.858 | 0.799 |
| β(t) | 6.2425 | 6.2219 | 6.2082 | 6.1736 | 6.1041 | 5.9913 | 5.8113 | 5.5512 | 5.1935 | 4.7058 |
| Δβ(t) | 0 | 0.0206 | 0.0343 | 0.0689 | 0.1384 | 0.2512 | 0.4312 | 0.6913 | 1.0490 | 1.5367 |
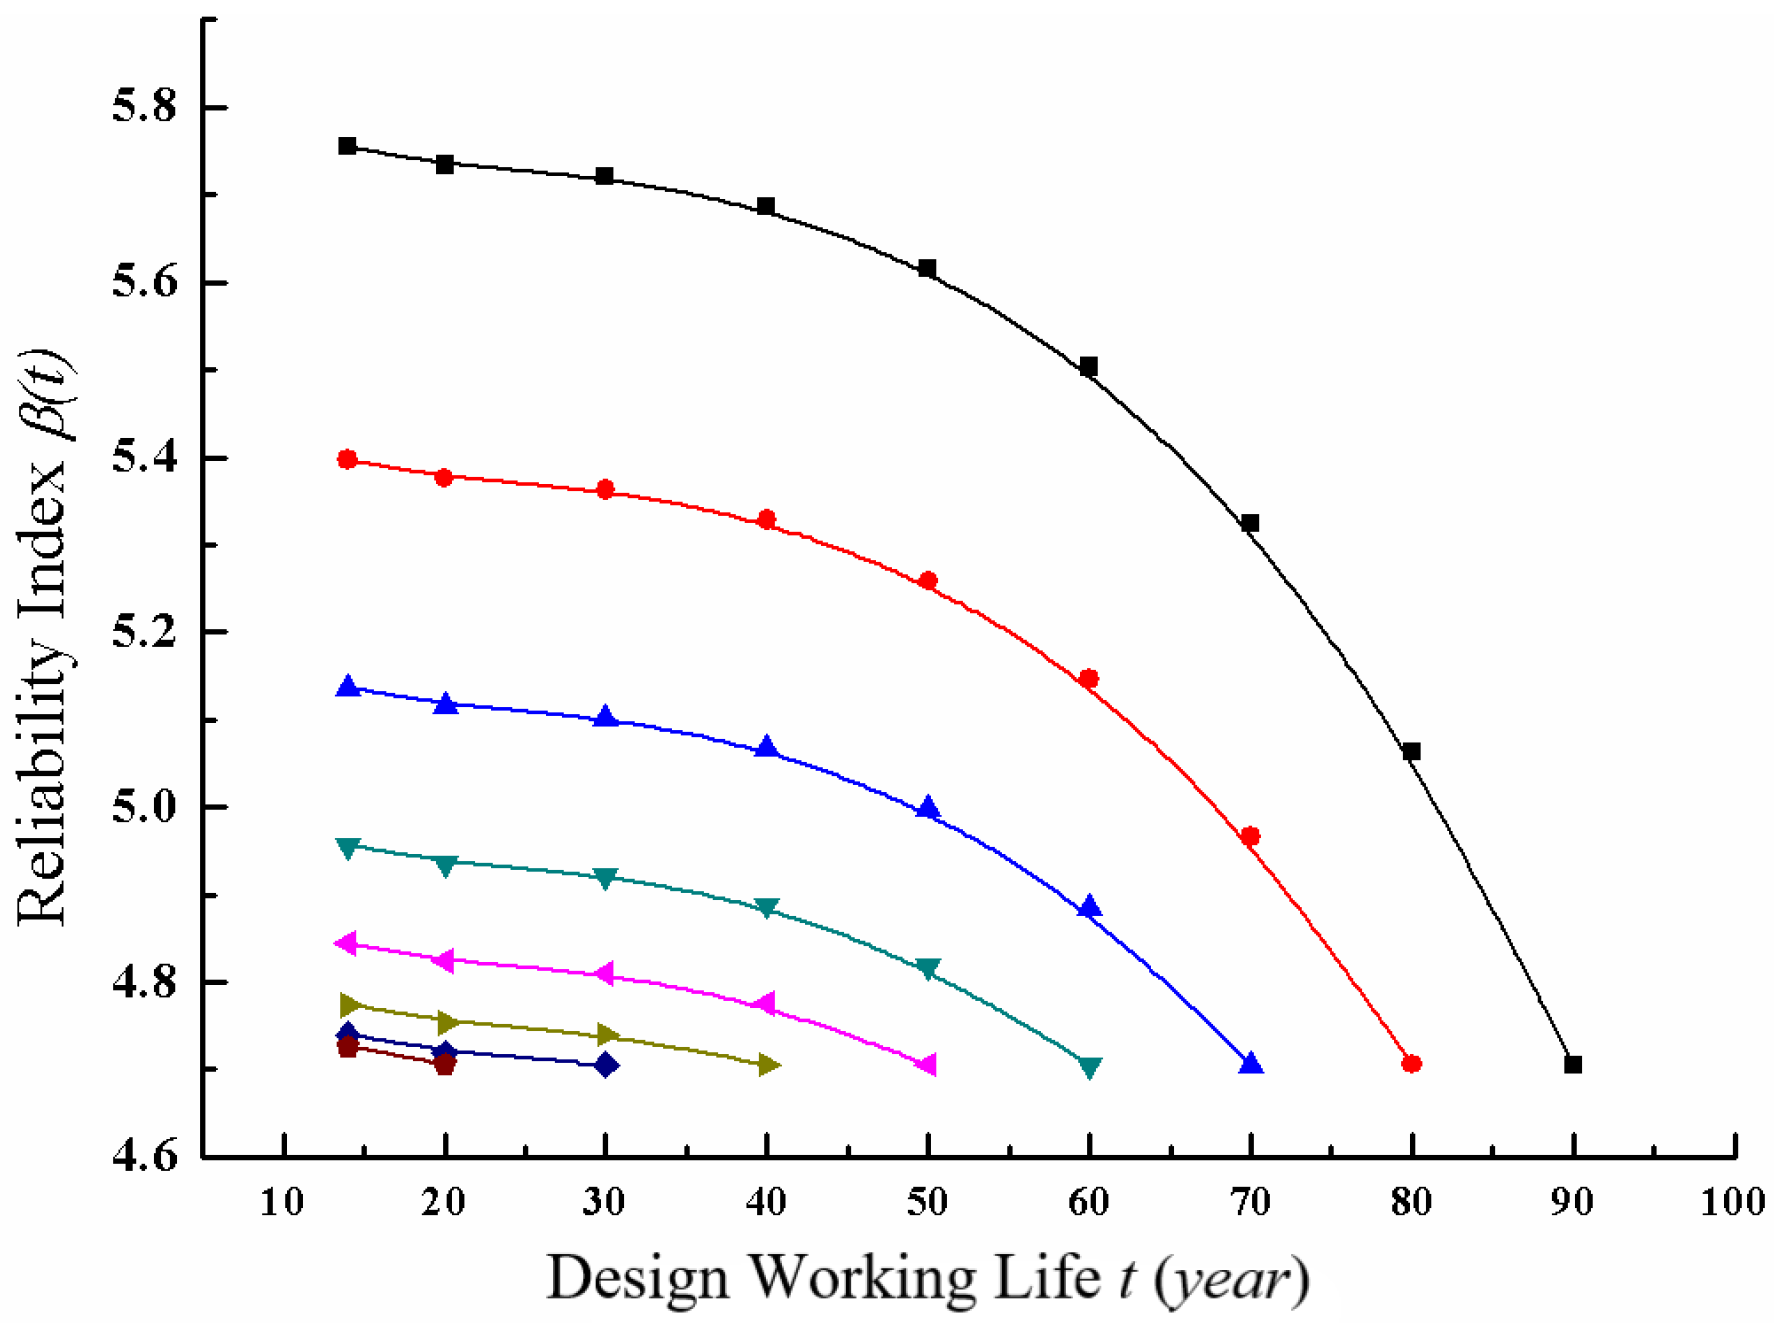
| t | 14 | 20 | 30 | 40 | 50 | 60 | 70 | 80 | 90 |
|---|---|---|---|---|---|---|---|---|---|
| φ(t) | 1 | 0.997 | 0.995 | 0.990 | 0.980 | 0.964 | 0.939 | 0.904 | 0.858 |
| β(t) | 5.7545 | 5.7339 | 5.7201 | 5.6856 | 5.6161 | 5.5033 | 5.3234 | 5.0633 | 4.7058 |
| β(t) | 5.3968 | 5.3762 | 5.3625 | 5.3280 | 5.2584 | 5.1457 | 4.9658 | 4.7058 | / |
| β(t) | 5.1367 | 5.1161 | 5.1024 | 5.0679 | 4.9984 | 4.8857 | 4.7058 | / | / |
| β(t) | 4.9568 | 4.9362 | 4.9225 | 4.8880 | 4.8185 | 4.7058 | / | / | / |
| β(t) | 4.8441 | 4.8235 | 4.8098 | 4.7753 | 4.7058 | / | / | / | / |
| β(t) | 4.7746 | 4.7540 | 4.7403 | 4.7058 | / | / | / | / | / |
| β(t) | 4.7401 | 4.7196 | 4.7058 | / | / | / | / | / | / |
| β(t) | 4.7264 | 4.7058 | / | / | / | / | / | / | / |
| t | 14 | 20 | 30 | 40 | 50 | 60 | 70 | 80 | 90 | 100 |
|---|---|---|---|---|---|---|---|---|---|---|
| βT | 4.7000 | 4.7264 | 4.7401 | 4.7746 | 4.8441 | 4.9568 | 5.1367 | 5.3968 | 5.7545 | 6.2425 |
Publisher’s Note: MDPI stays neutral with regard to jurisdictional claims in published maps and institutional affiliations. |
© 2022 by the authors. Licensee MDPI, Basel, Switzerland. This article is an open access article distributed under the terms and conditions of the Creative Commons Attribution (CC BY) license (https://creativecommons.org/licenses/by/4.0/).
Share and Cite
Zhang, Z.; Li, H.; Xiong, J.; Wang, F.; Wei, L.; Ke, L. Determination of the Target Reliability Index of the Concrete Main Girder of Long-Span Structures Based on Structural Design Service Life. Buildings 2022, 12, 2249. https://doi.org/10.3390/buildings12122249
Zhang Z, Li H, Xiong J, Wang F, Wei L, Ke L. Determination of the Target Reliability Index of the Concrete Main Girder of Long-Span Structures Based on Structural Design Service Life. Buildings. 2022; 12(12):2249. https://doi.org/10.3390/buildings12122249
Chicago/Turabian StyleZhang, Zhenhao, Hesheng Li, Jun Xiong, Fuming Wang, Leijun Wei, and Lu Ke. 2022. "Determination of the Target Reliability Index of the Concrete Main Girder of Long-Span Structures Based on Structural Design Service Life" Buildings 12, no. 12: 2249. https://doi.org/10.3390/buildings12122249