Article

Visualized Failure Prediction for the Masonry Great Wall

1
Beijing Advanced Innovation Center for Future Urban Design, Beijing University of Civil Engineering and Architecture, Beijing 100044, China
2
The Dennis Group, Salt Lake City, UT 84101, USA
3
School of Architecture and Urban Planning, Beijing University of Civil Engineering and Architecture, Beijing 100044, China
*
Author to whom correspondence should be addressed.
Buildings 2022, 12(12), 2224; https://doi.org/10.3390/buildings12122224
Submission received: 16 October 2022 / Revised: 16 November 2022 / Accepted: 5 December 2022 / Published: 14 December 2022

Abstract

:
The cultural, architectural, and historical heritage value of the Great Wall of China drives the need to maintain, rehabilitate, and restore its structural integrity from artificial and natural damage. In this study, a hybrid architectural visualization and structural collapse simulation of the Ming Great Wall (1368–1644 AD) are conducted in Blender based on the unit blocks and a physics engine (i.e., Bullet Constraint Builder). Visualized failure predictions caused by four damages, i.e., stone layer collapse, step collapse, parapet walls inward tilting, and stone layer bulge, are developed and performed on a strength basis. The main input parameters are brick dimensions, friction coefficient, and adhesive/glue strength, while the primary output includes collapse, and global and local stabilities. Finally, the results show that the combination of unit blocks and a physical engine can visually simulate the occurrence process of the Great Wall’s failures with preliminary engineering outcome, especially those related to collapse, and can also predict the adverse consequences of the precipitating factors.

1. Introduction

The Great Wall is a wealth created by the ancient Chinese and one of the most popular world culture heritages. The Ming dynasty (1368–1644 AD) built the Great Wall with a total length of 6259.6 km, standing for about 600 years [1]. Brickwork is one of the major structures for the Ming Great Wall, including stones and bricks on the exterior face and earth mixed with rubbles and rocks inside. Its structural details differ significantly from wood, modern masonry, reinforced concrete (RC), and steel structures. Dramatic structural deterioration and damage have occurred to the Ming Great Wall [2,3,4], due to the natural and artificial impact, including earthquakes, floods, and geological movement, while artificial activities include wars, road construction, mining, tourism development, etc. Watchtowers and side walls collapse, parapet and battlement walls tilting, wall cracks caused by soil erosion, brick and stone units missing, wythe detachment and plant invasion are among the primary damage [5,6,7]. A report published by the State Bureau of Surveying and Mapping of China in 2009 revealed that only 8.2% of the Ming Great Wall was well preserved, while 74.1% was significantly damaged, with only stone foundations and bases remaining. The Chinese government has been increasing the amount of investment to preserve and protect the Great Wall in the last decade.
Numerical analysis of historical buildings is common practice for evaluating the remaining structural capacity and predicting future damage and collapse. In addition, simulating the whole process of historical building collapse with inverse analysis can provide crucial technical support for structural protection, rehabilitation, and restoration. The computational methods that can simulate structural collapses include the finite element method (FEM), discrete element method (DEM), and physics engines. Most commercial FEM programs emphasize collapse resistance analyses [8,9,10,11,12,13,14,15,16], which can accurately predict the structural damage before the collapse. However, these FEM programs can not adequately simulate structural post-collapse behaviors and performance because FEM is more effective in simulating the stress and deformation of continuum bodies, while collapse simulation requires component fracture and post-fracture body movement processing, in which DEM is more proficient.
DEM presents the mechanism of physical structures and microstructures by solving the movement and interaction of particles (or boxed), which can be perfectly applied to simulate the damage progress of non-continuous or uneven items, and items with large deformation, e.g., post-collapse behaviors. DEM was initially used in the jointed rock research [17,18] and was gradually applied to masonry and brick structures. Lemos [19] proved that DEM could simulate the collapse performance of brick masonry structures. Chen et al. [20] adopted DEM to predict the damage development and fracture behavior of bricks and mortar, which supplied valuable references for masonry materials. Lemos and Sarhosis [21] proposed the bonded-block model approach to allow the progressive damage and failure processes in masonry structures.
DEM is also widely used to analyze arch, dome, and other masonry structures. Melbourne et al. [22] and Pulatsu et al. [23] used DEM to numerically observe the collapse performance of masonry arch bridges. Roberti and Calvetti [24] performed a parameter study of a stone arch and introduced the difference between DEM and classical limit load analysis. Mayorca and Meguro [25] confirmed that the DEM results could effectively simulate structural performance. Simon and Bagi [26] presented the relationship between the critical friction coefficients and collapses by performing numerical analyses of an elliptical dome roof structure in the 3DEC [27] DEM software.
A physics engine calculates an object’s movement, rotation, and impact with the assigned natural physics properties. It can simulate rigid body pounding, impact, blast, etc., and is broadly applied to video gaming software. For instance, Blender is a free three-dimensional (3D) image software used in the video gaming industry [28], and its physics engine plugin (i.e., Bullet Constrain Builder (Bullet)] can simulate complicated body movement and collision. Kostack [29] developed the building failure and collapse simulation program, the Bullet [30] plugin in Blender, under the financial support of Laurea University of Applied Sciences (LUAS) in Finland and European Union funded projects, Inachus. The best visualization of this program surpasses FEM and DEM programs while maintaining relative accuracy and computational efficiency. For example, it allows users to set up models, define the interactive relationship between structural elements, define collapse and crushes, and calculate the impact between analytical elements. These characteristics can simulate friction, impact, and other interactions between rigid bodies. Wang et al. [31] and Zheng et al. [32] performed visualization of collapse analyses of RC structures under seismic impacts in BCB programs. Orr [33] conducted a damage and vulnerability analysis of debris flow effects on building with a BCB program.
In addition, Abu-Haifa and Lee [34] evaluated the hazard vulnerability and collapse of masonry structures on an image-based modeling-to-simulation framework. Hu et al. [35] simulated the collapse and reconstruction progress using a building collapse simulator named Bullet. Finally, Fita et al. [36] coupled an earthquake simulator with a structural simulator of physics that is tailored to masonry buildings and validated the feasibility of applying Blender and Bullet in analyzing structural seismic collapse in masonry structures.
Even though the fundamentals between the DEM and the physics engine are marginal, their technical focuses are significantly different. The DEM emphasizes the mechanic’s relationship between discrete elements that require a significant amount of engineering input, while the physics engine targets the movement of block units and provides acceptable preliminary engineering output, which facilities the analysis and visualization process. Thus, a physics engine combined with 3D graphics software provides superior visual and architectural effects than other engineering programs, which provides a significant advantage due to the actual visualization demand requested by government officials, policymakers, and stakeholders for historical structures [37,38,39,40,41,42]. The actual demand for this hybrid architectural, visualization, and preliminary structural analysis has long been ignored in architectural heritage.
Contrary to the traditional method of engineering analysis plus architectural visualization, this study efficiently incorporates both the Bullet physics engine and Blender visualization to simulate the potential failures to the structures of the Ming Great Wall in Yanqing, Beijing, caused by stone layer collapse, steps collapse, parapet walls inward tilting, and stone layer bulge with wythe detachment. Furthermore, the structural failure development process and consequences are investigated to provide early stage technical support for the Great Wall protection, heritage preservation, and structural safety evaluation.
The paper structure starts with the characteristics of the Great Wall of China. Then, the fundamental theories, principles, and methodologies used are introduced, including collision detection, cohesion, friction, and motion calculations. Next, some essential modeling parameters are received from the mortar joint shear strength experiment, which is included in Section 4. Thus, the numerical modeling process is discussed in Section 5, which is validated in the following section. Finally, four types of damage and failure of the Great Wall are analyzed.

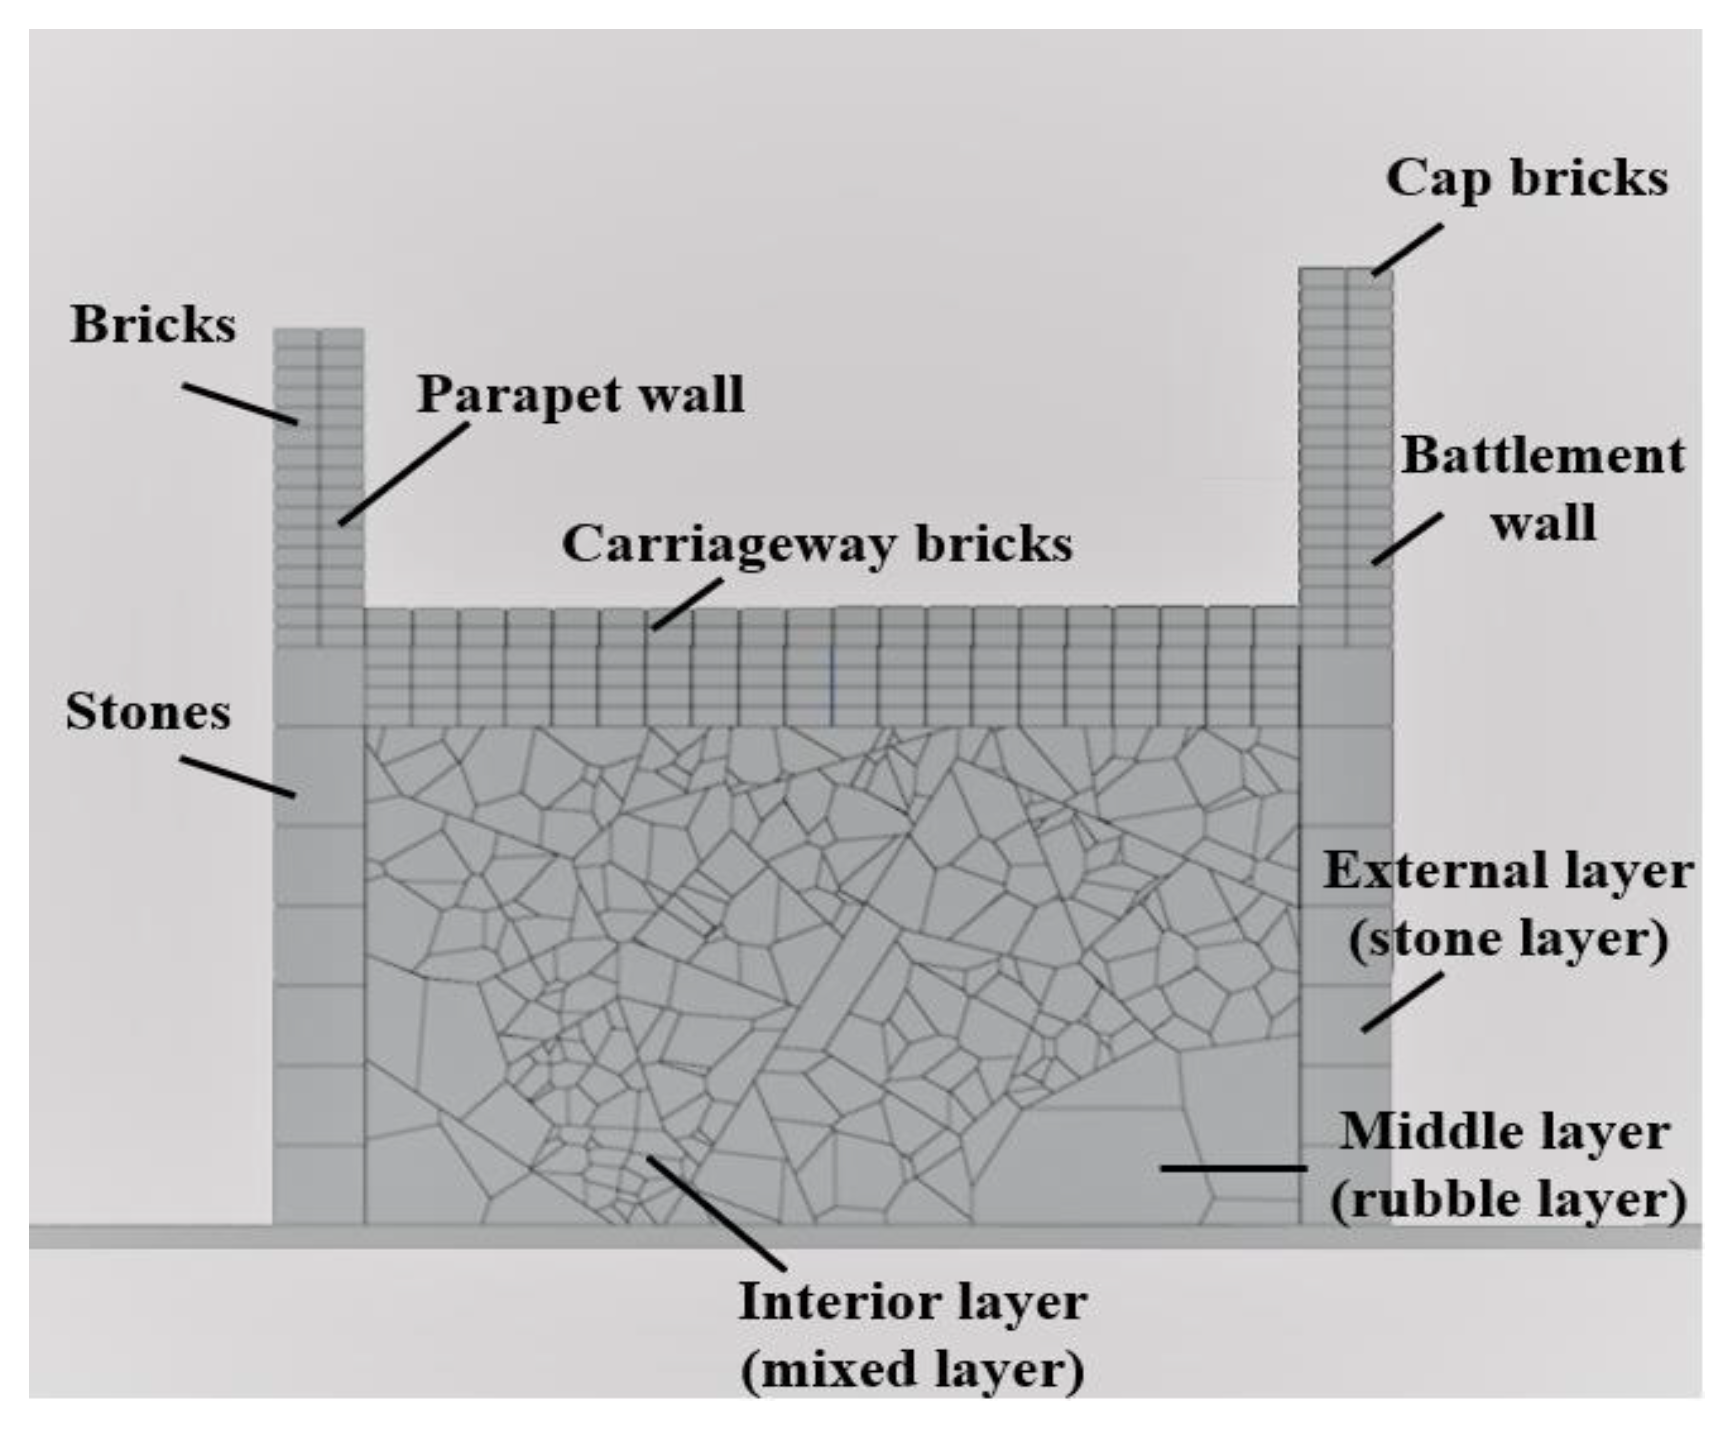
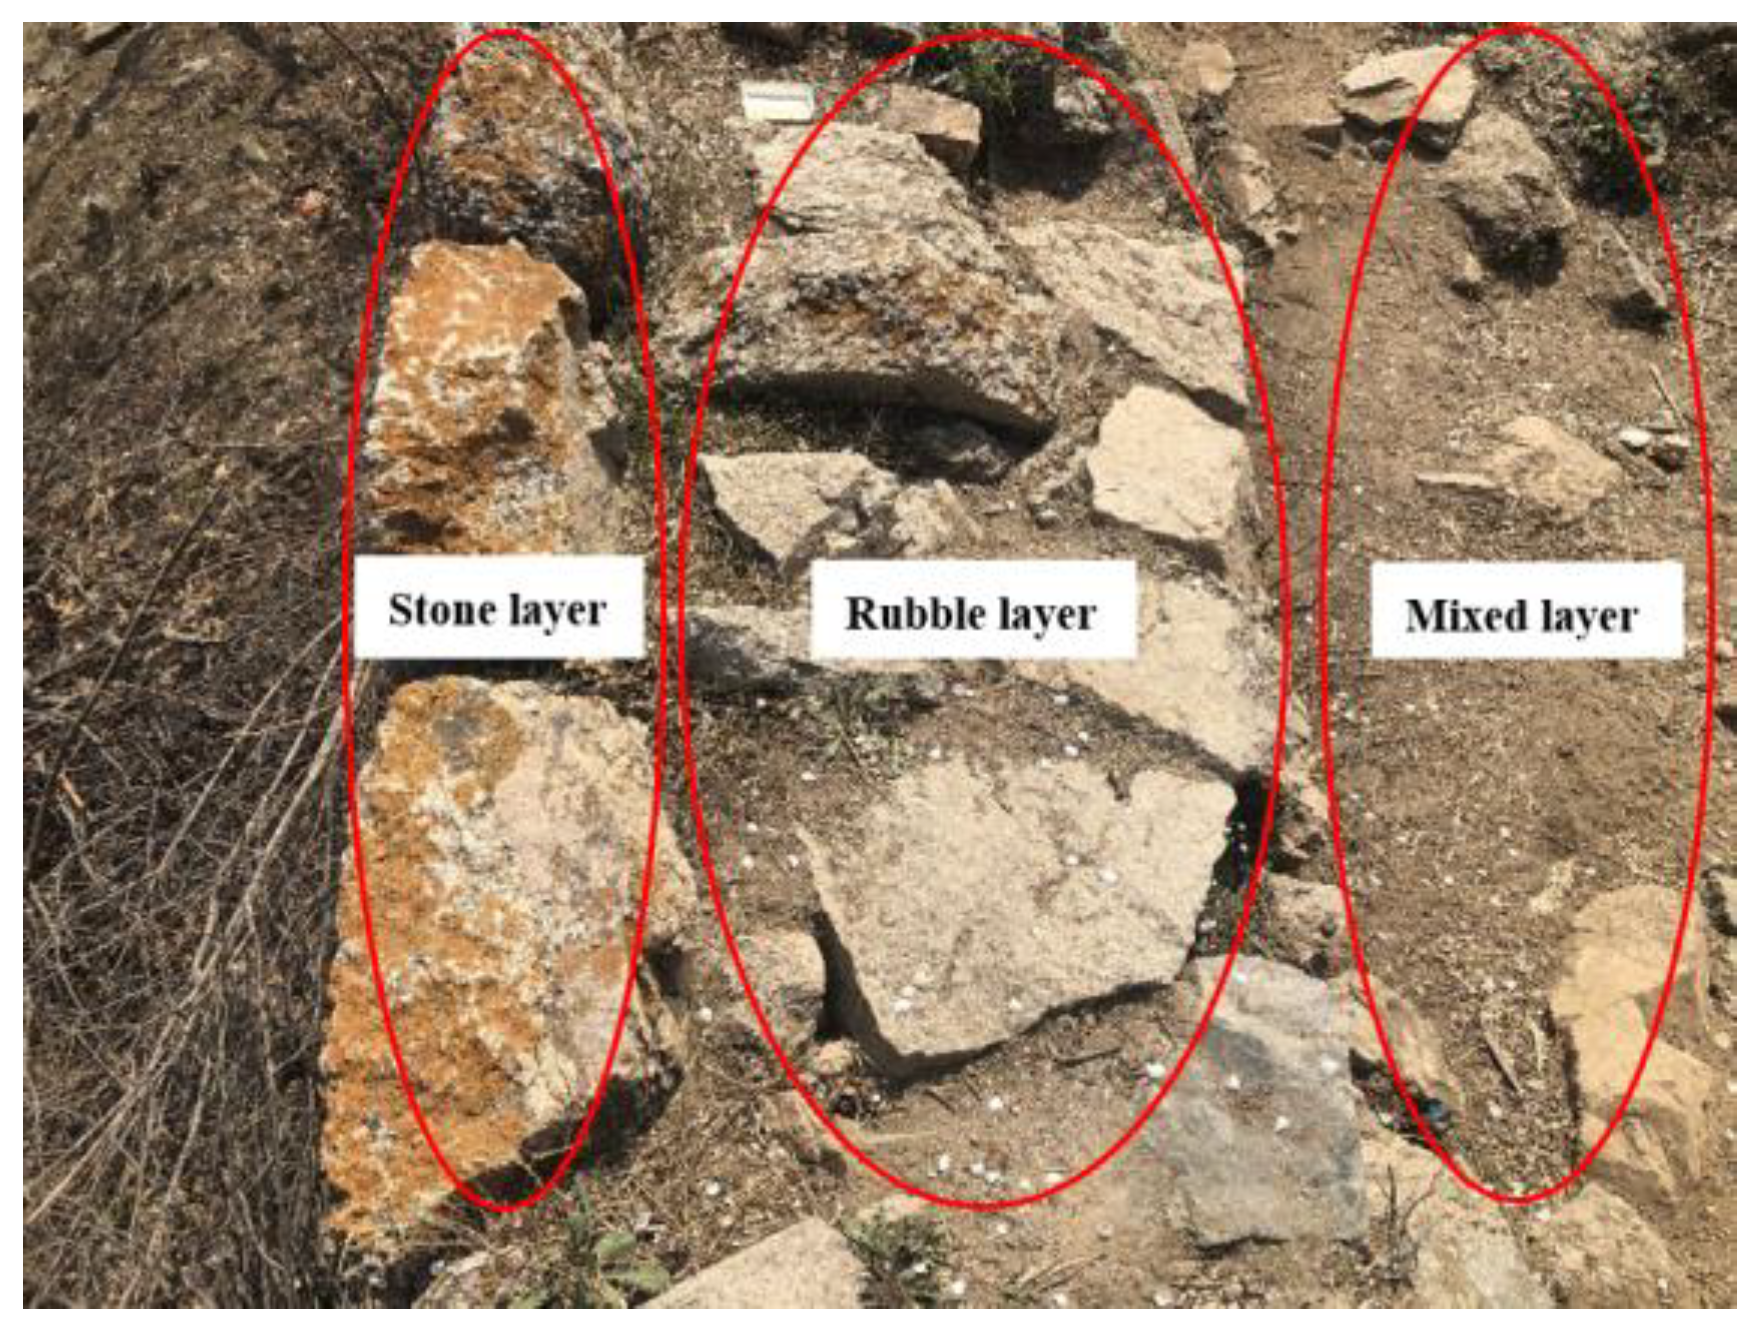
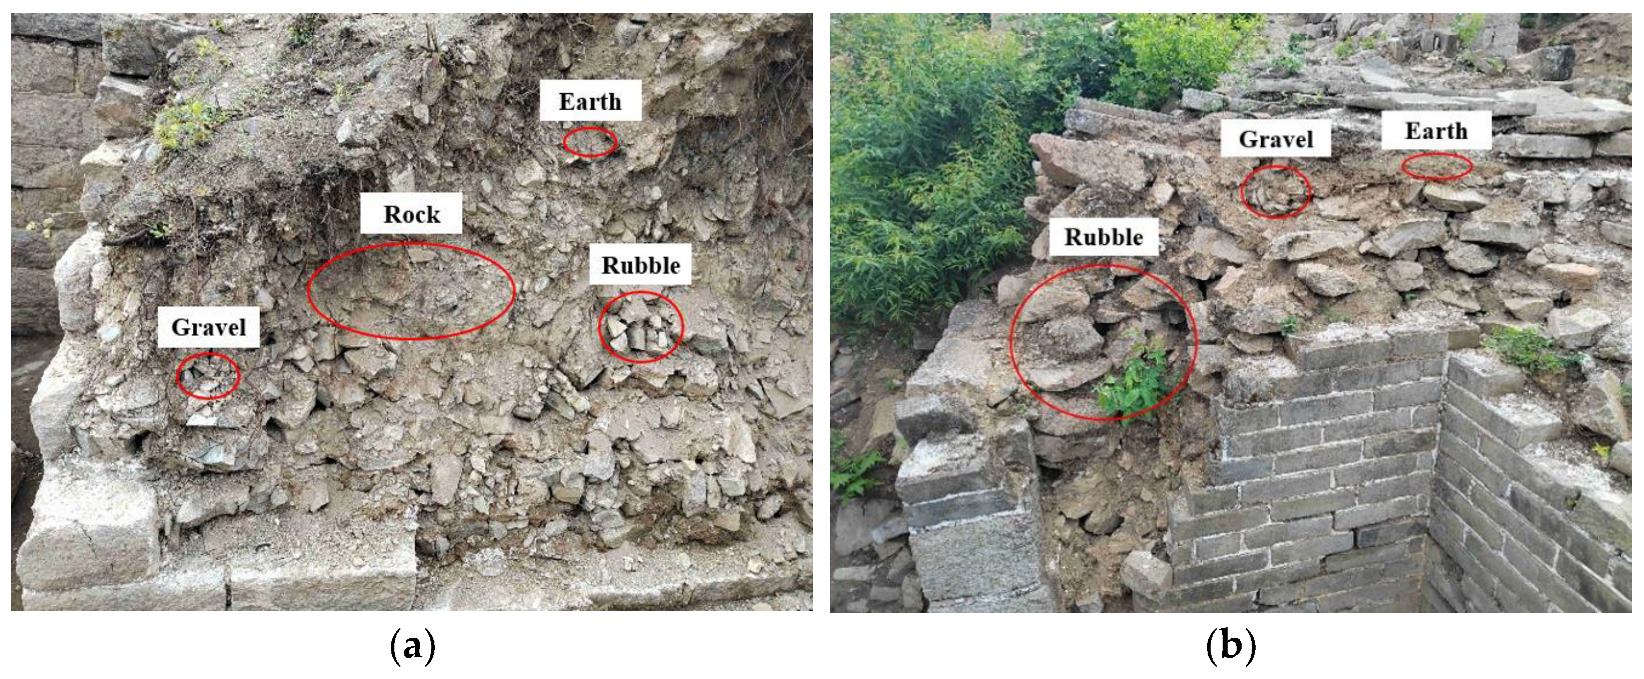
2. Characteristics of The Great Wall

The Great Wall is comprised of watchtowers and side walls (flat and sloped sections), which can be further divided into base walls, parapet (or battlement) walls, carriageways, and towers. For instance, the Ming Great Wall near the No. 5 Watchtower in Dazhuangke, Yanqing, Beijing, is shown in Figure 1a. The superstructure includes parapet or battlement walls, carriageways, and towers in bricks (Figure 1b). In contrast, the substructure (i.e., base walls) is stone (Figure 1b). This part of the Great Wall is roughly 3 m to 8 m in height, and 4 m to 5 m in width. Figure 2 shows the sketch of a typical section of the side wall.
The base walls include three layers in horizontal section, stone layer, rubble layer, and mixed layer, as in Figure 3. The outer surface of each stone is chiseled into a regular rectangle with a dimension of about 1.06   m × 0.32   m × 0.17   m , making the Great Wall look like fine ashlar. However, the stones’ invisible surfaces remained uncarved, especially the left-hand side closer to the rubble layer (Figure 3). The external layer of stones is cemented by excellent mortar, and the middle layer rubbles are paved regularly by mid-level mortars mixed with gravels, while the interior layer is still dominated by rubbles, which are chaotic and mixed with earth, gravels, and rocks (Figure 4).
The upper parapet and battlement are paved by structural bricks, each with a dimension of 0.37   m × 0.17   m × 0.08   m . Each parapet or battlement has two wythes but just headers at the end, where cap bricks compact parapets’ top layer. Herein, the dimension of the cap brick is 0.37   mm × 0.343   mm × 0.11   mm , as in Figure 5.
Four typical damage states occur in Dazhuangke section of the Great Wall. Firstly, mortar loss between stones may cause the local collapse of the base wall’s exterior layer, leave the wall supported by rubbles, and significantly reduce the wall bearing capacity, as in Figure 6. In addition, the carriageway steps on sloped sections are typically formed by three to five layers of carriageway bricks. These bricks are paved with low-grade mortar and directly above the base walls, which are susceptible to collapse under rain erosion (Figure 7). Thus, parapets are prone to gradual collapse by layers and wythe detachment (Figure 8) due to few header bricks between every two wythes. Lastly, wythe detachment is often accompanied by wall outward displacement and stone layer bulge (Figure 9).

3. Methodology

The primary computing principles of collision detection, cohesion, friction, and kinematics utilized in physics engine modeling are discussed in this section.

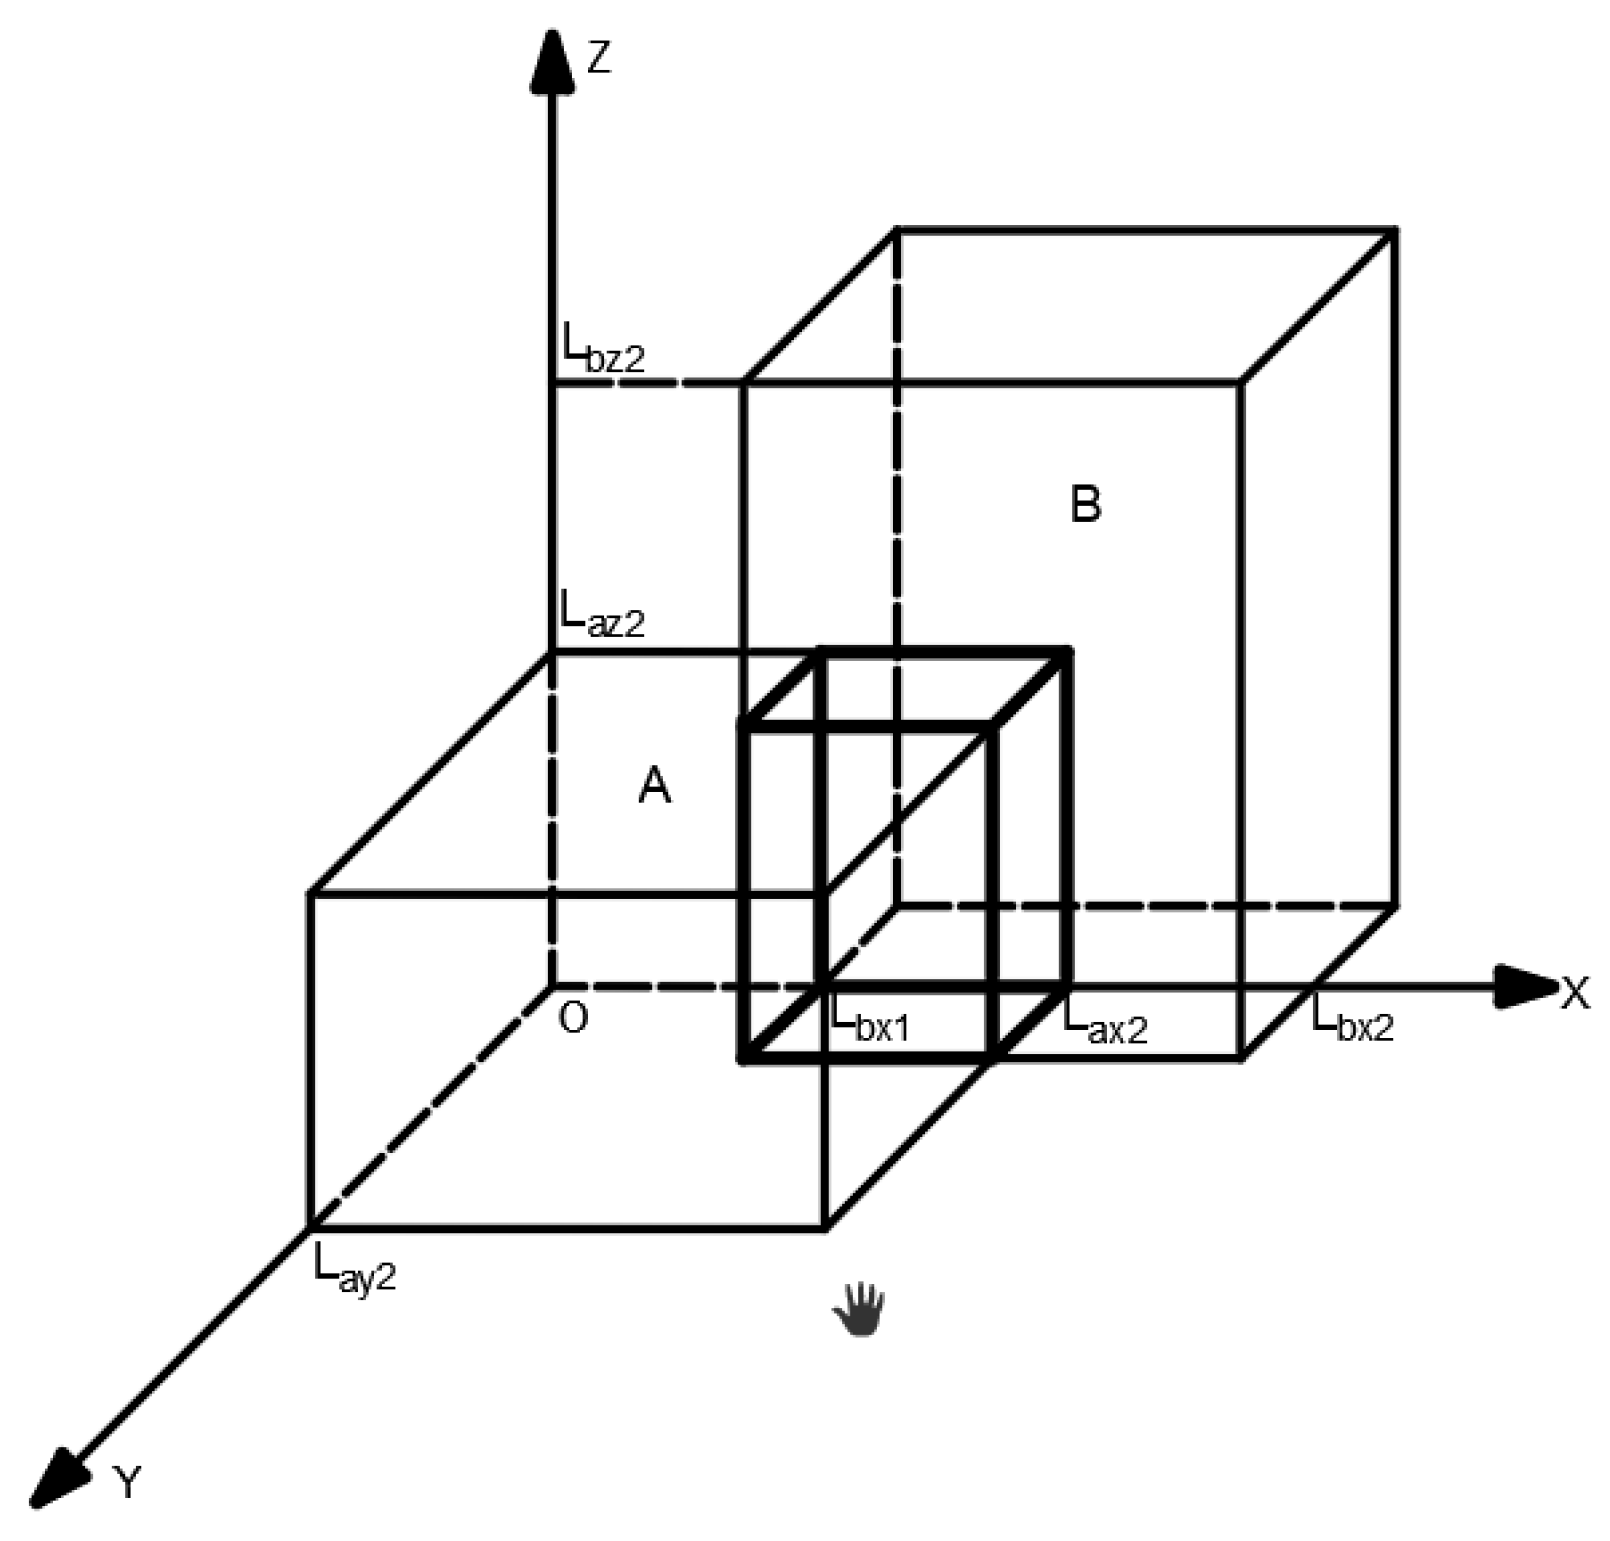
3.1. Collision Detection, Cohesion, and friction

Collision detection is critical to collision analysis and movement calculations for solid units or physical bodies. When two unit blocks intersect or overlap, a collision occurs. Axis-aligned bounding boxes (AABB) [43,44,45,46,47,48] are the quickest algorithm to determine whether the two blocks are overlapping or not, which Bullet adopts. Figure 10 shows an example of checking an AABB box intersecting another AABB box, which only requires one test per axis. L a x 1 and L a x 2 define the lower and upper boundary of box A’s projection on the X axis, while L b x 1 and L b x 2 represent the lower and upper boundary of box B’s projection on the X axis. Similarly, L a y 1 , L a y 2 , L b y 1 , and L b y 2 denotes boxes A and B’s boundaries on the Y axis, and L a z 1 , L a z 2 , L b z 1 , and L b z 2 are the boxes A and B’s boundaries on the Z axis, respectively. No collision is detected when any of the six conditions in Equation (1) is met. On the contrary, a collision occurs when all six expressions are false.
L a x 1 > L b x 2   ,   L a y 1 > L b y 2   ,   L a z 1 > L b z 2 L b x 1 > L a x 2   ,   L b y 1 > L a y 2   ,   L b z 1 > L a z 2
In the Ming Great Wall of China, brick-to-brick, brick-to-stone, and stone-to-stone are connected with mortar, while the gravel infills inside base walls are mainly connected by soil and earth. Therefore, the mortar’s mass and volume are ignored in modeling while mortar and soils’ friction and cohesion are maintained, which are simulated by the inter-block friction and glue strength functionality in Blender. The input parameters are collected in the experiments described in the next section.

3.2. Movement and Kinematics Calculations

The Bullet physics engine treats a unit block as integrated and calculates its movement and rotation. The movement of a unit block is based on Newton’s second law, which calculates the objects’ velocity, acceleration, displacement, and rotation. The physics engine checks one unit block by another, and updates the overall object position and velocity by integral operation. The object position and velocity are calculated as in Equations (2) and (3).
x = x + x ˙ t + 1 2 x ¨ t 2
x ˙ = x ˙ + x ¨ t
where x represents the original displacement, and x denotes the updated displacement.   x ˙ is the initial velocity, x ˙ is the updated velocity, x ¨ represents the initial acceleration, and t is the time interval. The angular velocity represents the object’s rotation when the change of angular velocity is decided by the torque ( τ ) and torsional moment of inertia ( I ) , as in equations 4 and 5. θ ¨ is the angular acceleration, f denotes the applied force, p represents the force arm of f to the objective’s centroid.
θ ¨ = I 1 τ
τ = p f

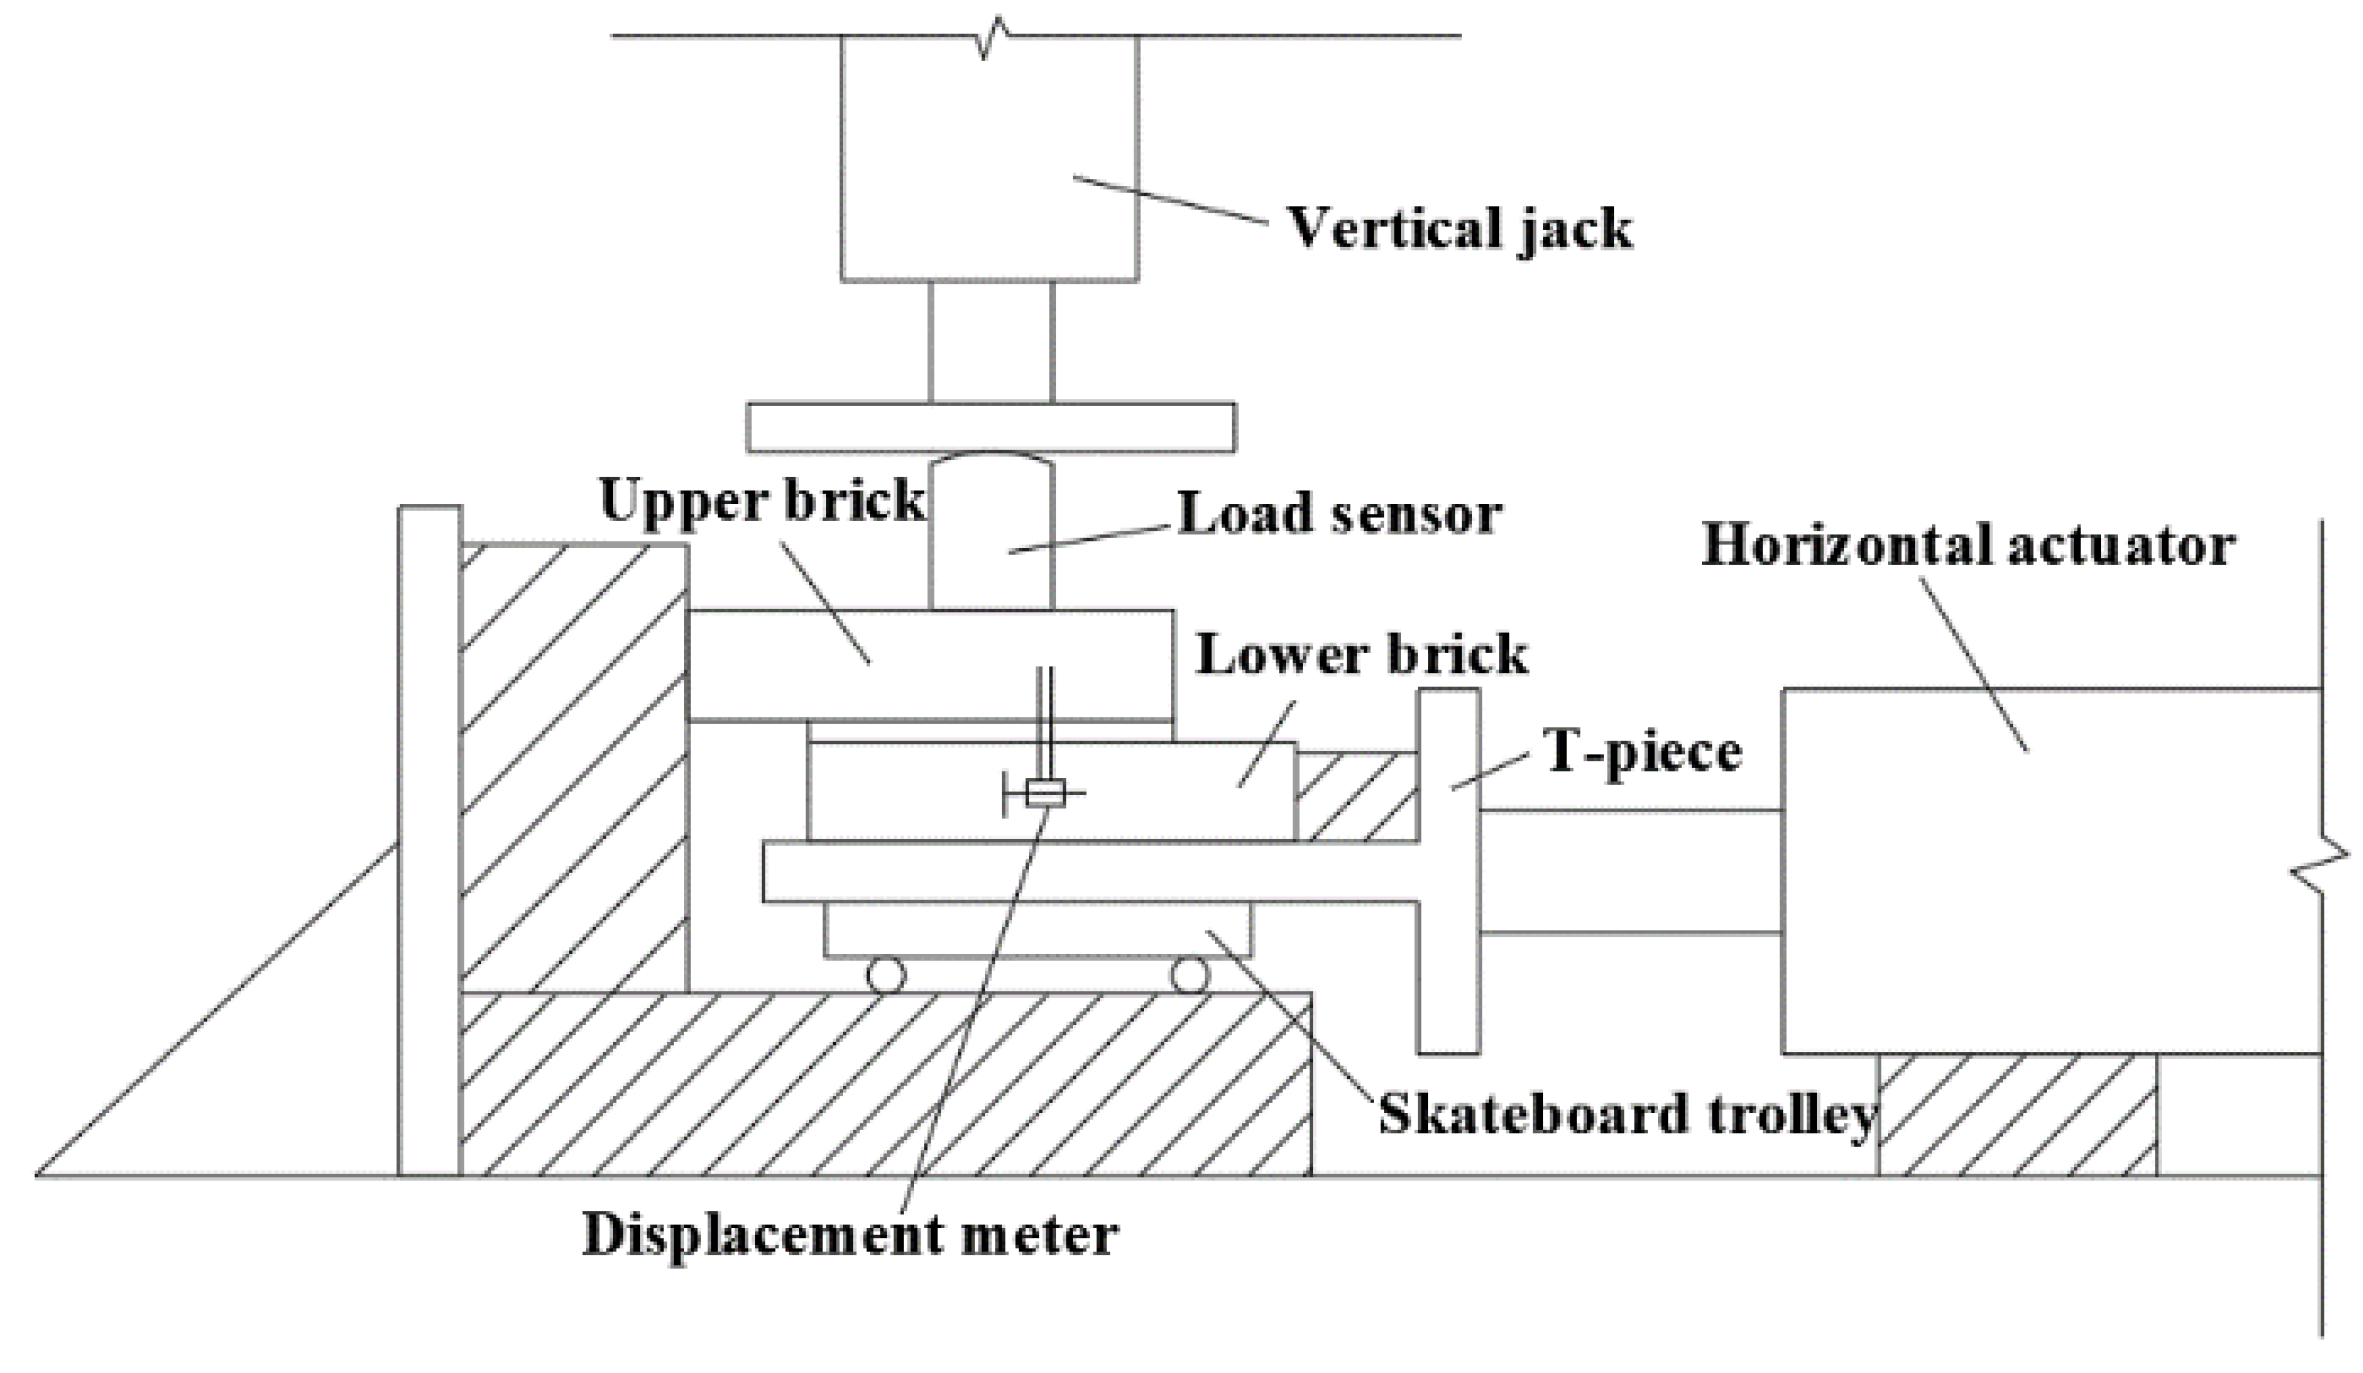
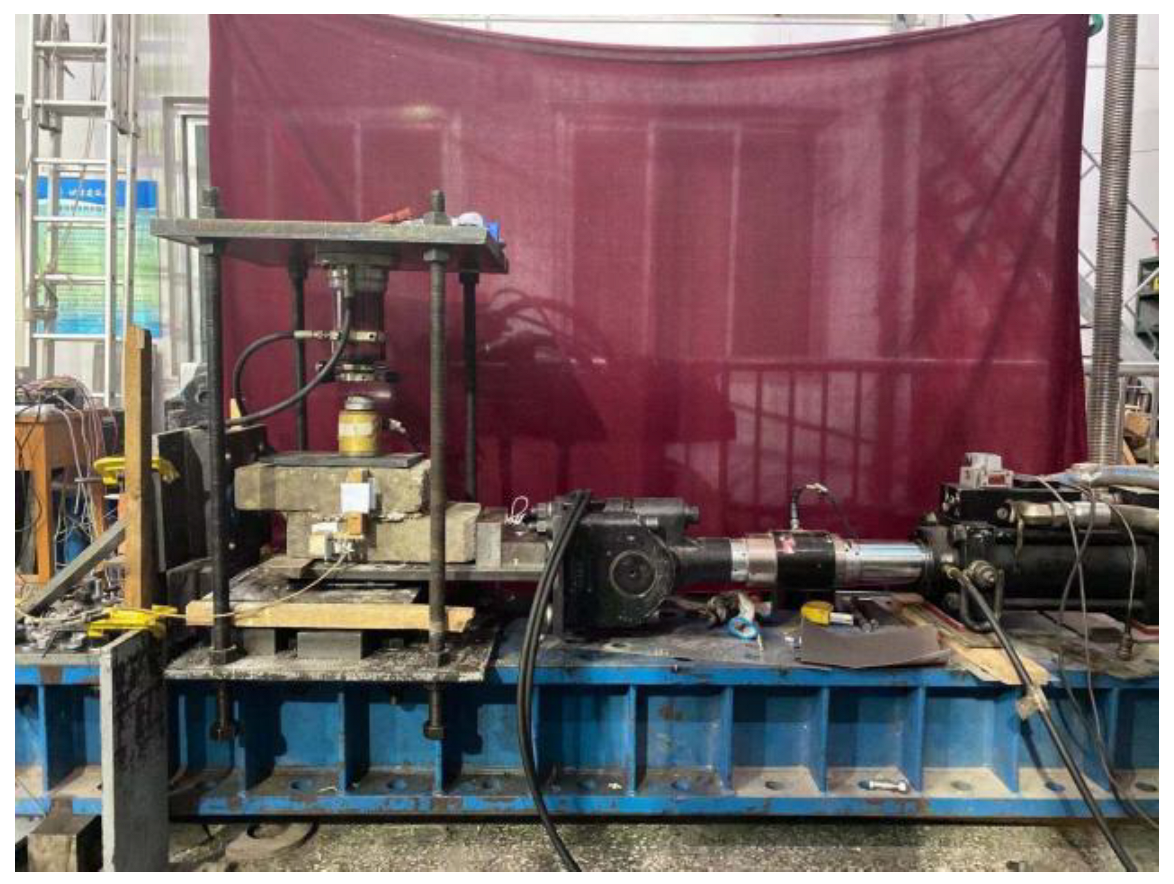
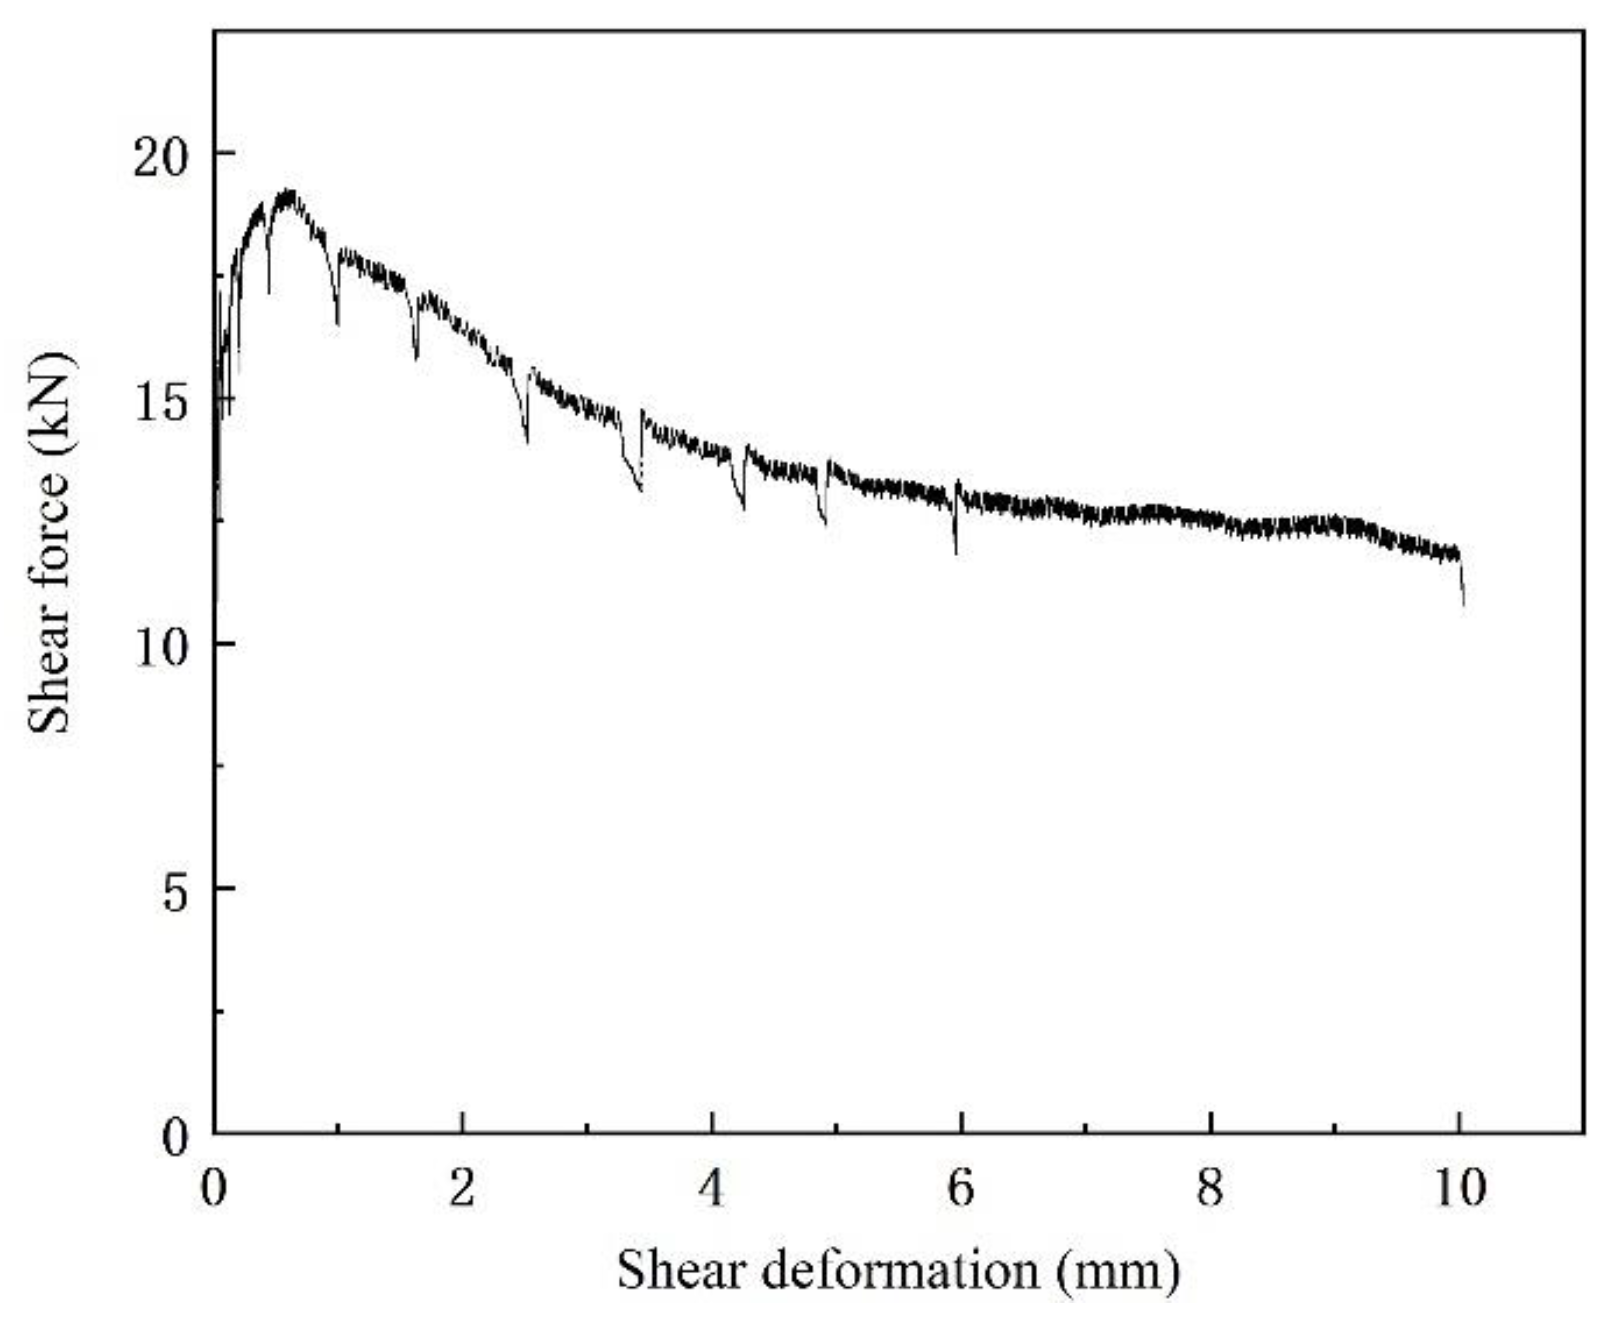
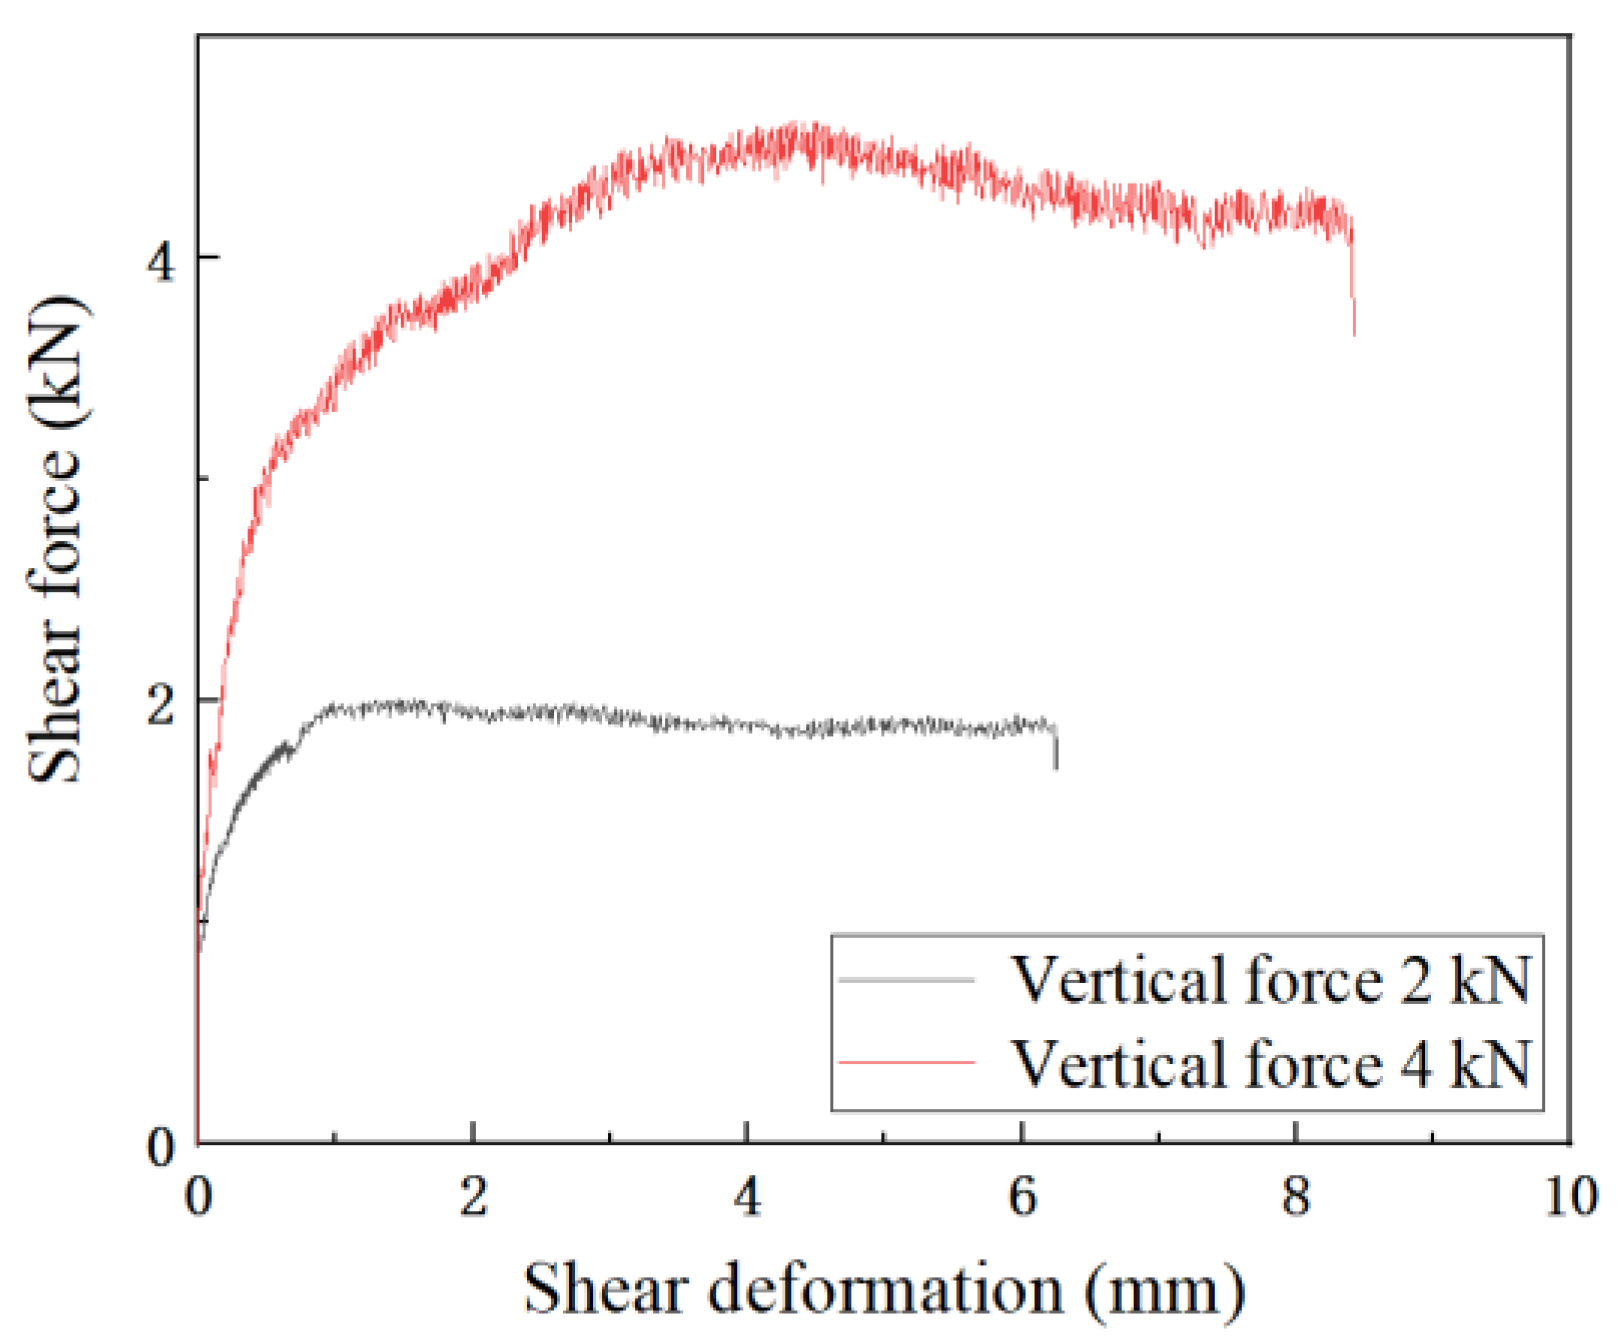
4. Mortar Joint Shear Strength Tests

Lime mortar samples are selected from the collapsed Great Wall in Dazhuangke, Yanqing, Beijing. In addition, extensive experiments are performed on these specimens, including mortar shear resistance and mortar friction resistance tests. All the experiments are conducted in the structural lab at the Beijing University of Civil Engineering and Architecture.
The mortar shear testing standards in “Test methods for wall bricks” [49] are also adopted. A hydraulic jack loaded the vertical brick joint, and a Material Test Systems (MTS) actuator loaded the horizontal joint, as shown in Figure 11 and Figure 12. Firstly, the vertical pressure stress remains at 0.093 MPa constant pressure. The horizontal actuator increases the displacement load input with a constant velocity until the joint fails in shear and relative slip occurs. The testing load–displacement curve is shown in Figure 13. The maximum mortar shear force is 19.3 kN, and the maximum mortar shear strength is 0.36 MPa. The vertical pressure stress is then modified to 0.037 MPa and 0.074 MPa to test two more groups of specimens, aiming to measure the friction after mortar joint cracks. The corresponding load–displacement curves are shown in Figure 14. The average mortar friction coefficient is 0.86.

5. Modeling in Blender with Physics Engine

The 3D models of side walls’ flat and sloped sections are set up in Blender with Bullet physics engine plugin (File S1 shows main modeling steps and inputs). The flat section model is 9.3 m in length, 4.0 m in width, and 5.5 m in height (Figure 15), which includes a battlement wall of 1.1 m in height, parapet walls of 0.5 m in height, and base wall of 3.9 m in height. The flat section’s external layer has 12 layers of stones with infilled rubbles, each of which is 0.15   m × 0.17   m × 0.2   m on average. The sloped section model is 6.0 m in length, 5.0 m in width, and 3.9 m in height (Figure 16), which comprises a battlement wall (0.9 m in height), a parapet wall (0.8 m in height), and a base wall (2.2 m in height). The sloped section’s external layer has seven layers of stones with infilled rubbles, each of which has a dimension of 0.15   m × 0.18   m × 0.17   m .
All material construction elements are modeled in unit blocks including brick, stone, and mortar fillers. The main physics and engineering input include dimensions of structural bricks, cap bricks, carriageway bricks, and stones, friction coefficient and adhesive/glue strength between bricks (Table 1). Since the base wall interior filler is split, it is simulated as irregular blocks resembling gravels and rubbles. Each filler component divides five to seven times during the analysis, closely matching the actual sizes of onsite rubbles and gravels.
Blender utilizes an effective physics engine (i.e., Bullet) to simplify the calculation and simulation process. The force interaction between every two unit blocks is mass, adhesion, and friction, ignoring the volume and mass of the adhesive material (i.e., lime mortar in the case of the Great Wall). By onsite observation, the adhesion between the onsite bricks and stones relies on lime mortar for the Dazhuangke Great Wall. In Blender, the adhesive/glue strength and friction simulate the interactions before and after lime mortar fractures. Considering the difference between the tensile strength and shear strength of masonry line mortar is trivial, the adhesive/glue strength used in Blender is directly received from the experimental shear strength measured in Section 3, and the friction coefficient is also obtained from the same tests. Thus, since the soil in the Dazhuangke area is mainly silty clay, the unit block’s adhesive and friction coefficients refer to the silty clay’s standard cohesion and friction coefficient. All the above parameters are listed in Table 1.

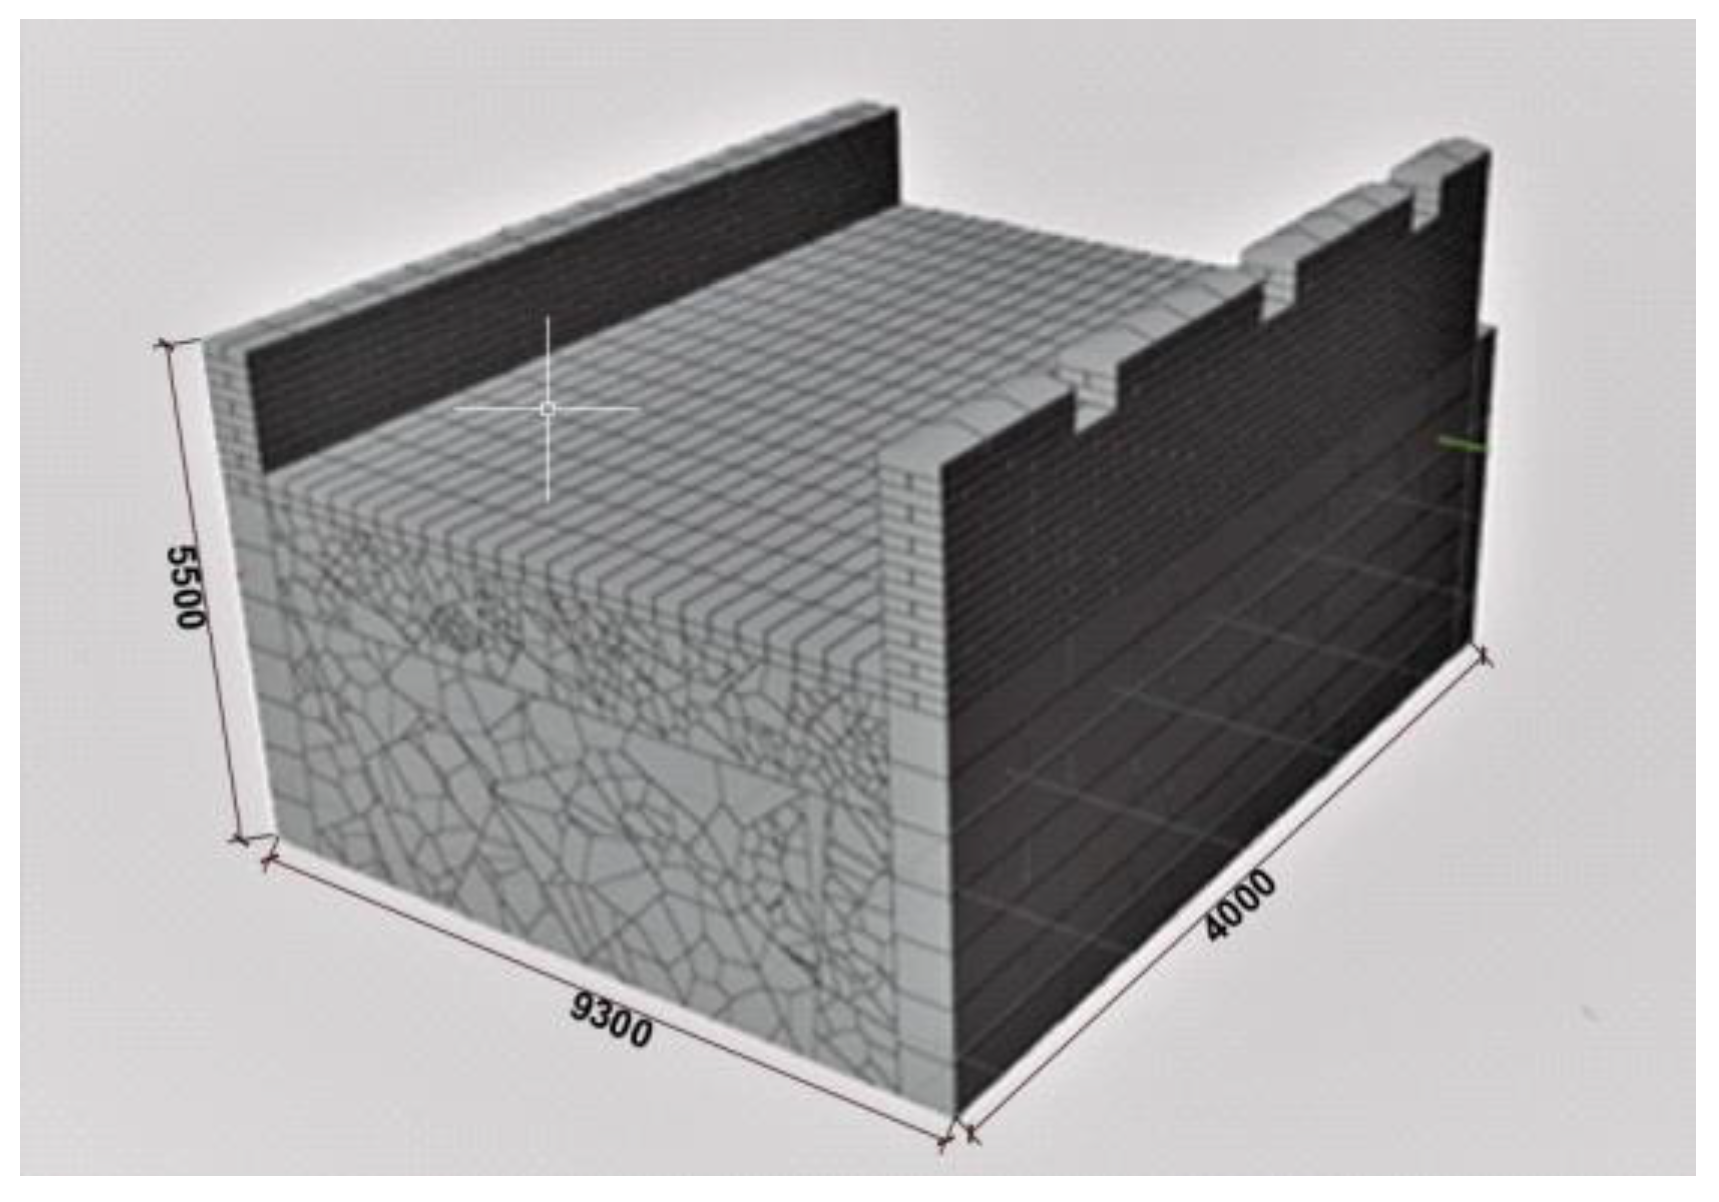
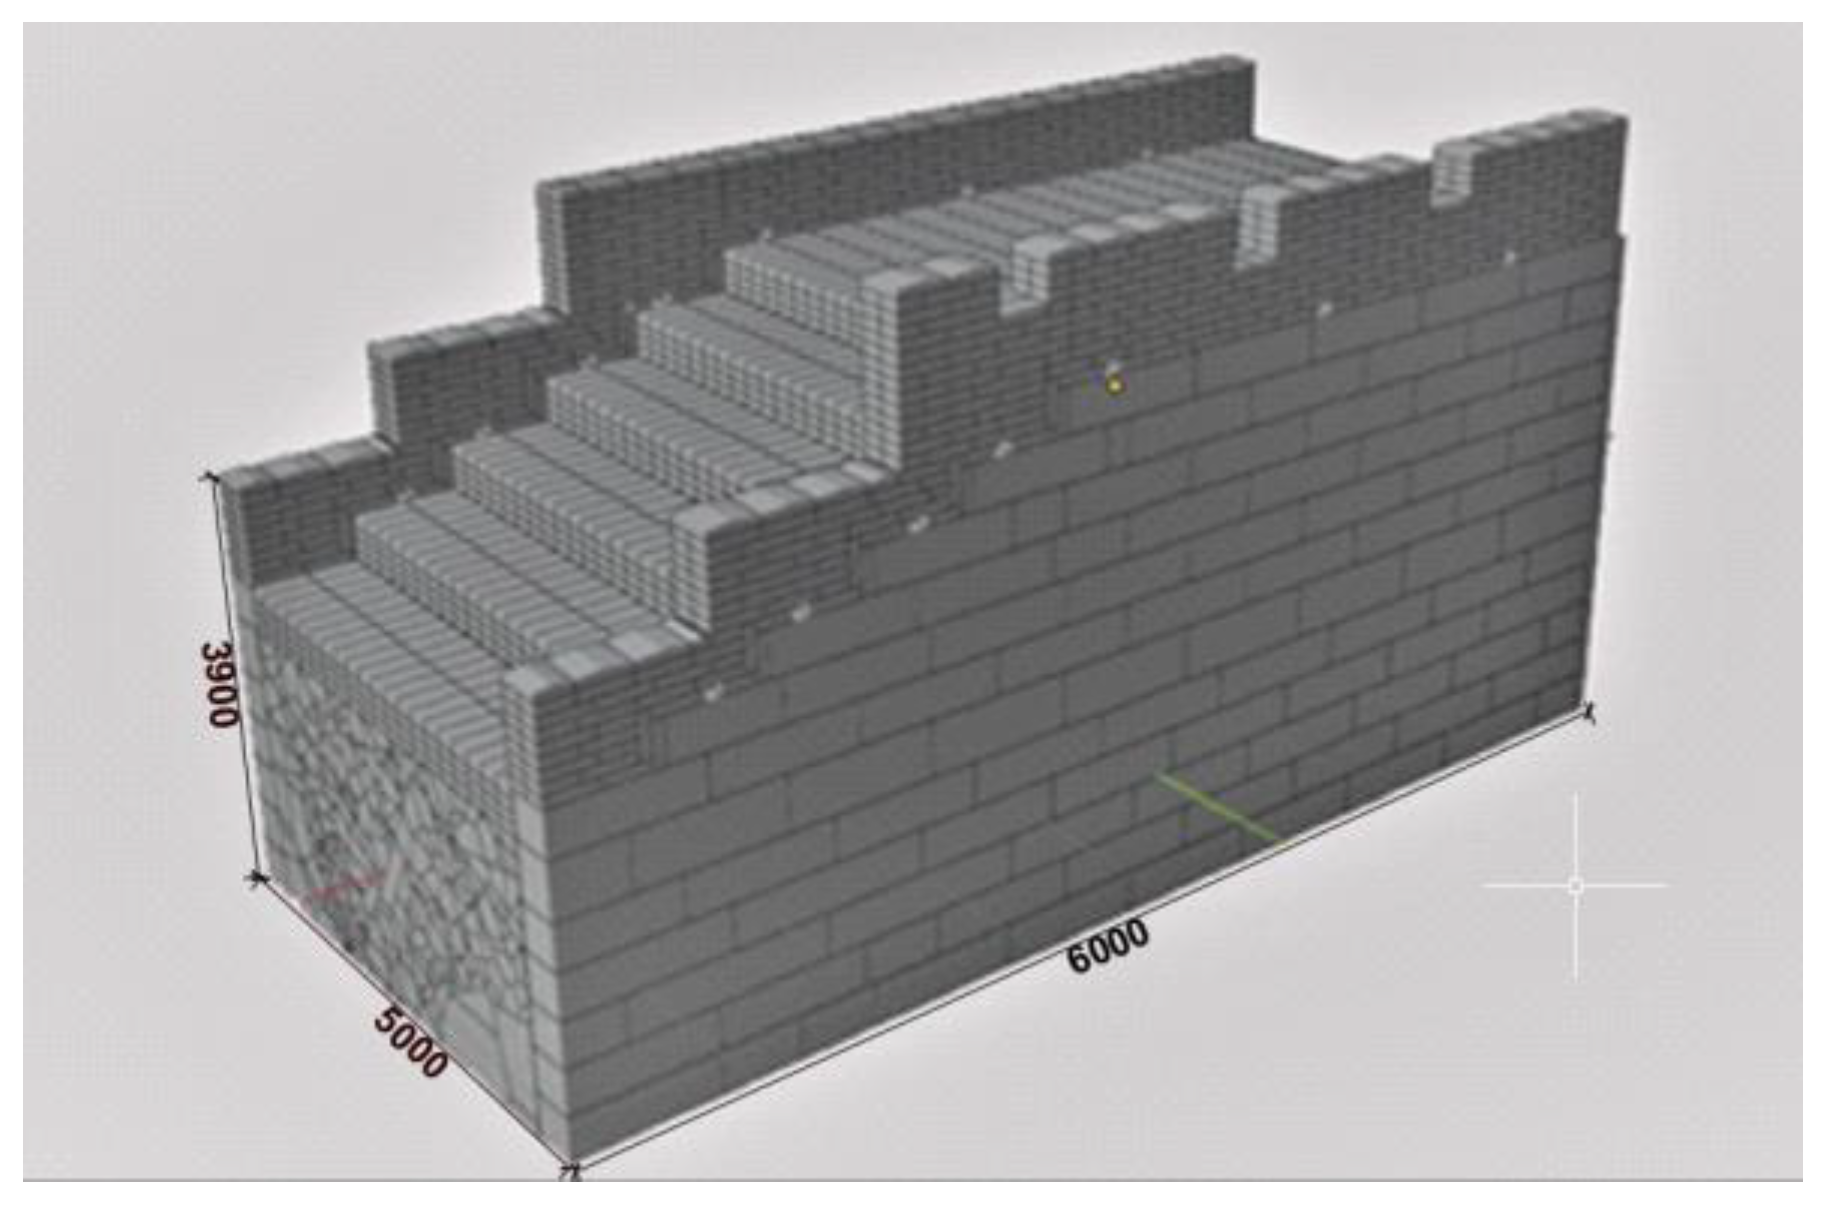
6. Model Validation and Site Observation

The Dazhuangke Great Wall is modeled in Blender with the Bullet plugin to simulate the base walls bulging and parapet wall collapse. The fundamental of physics engine, collision detection, and collision processing is adopted in the modeling. The numerical results and performance are visually validated with the damaged states of the remaining Great Wall onsite due to the artificial and natural damage in the past few hundred years. The efficiency of the Bullet physics engine (plugin) and Blender is more on predicting the potential structural failure outcomes and consequences than replicating the historical failure by material strains or stress.

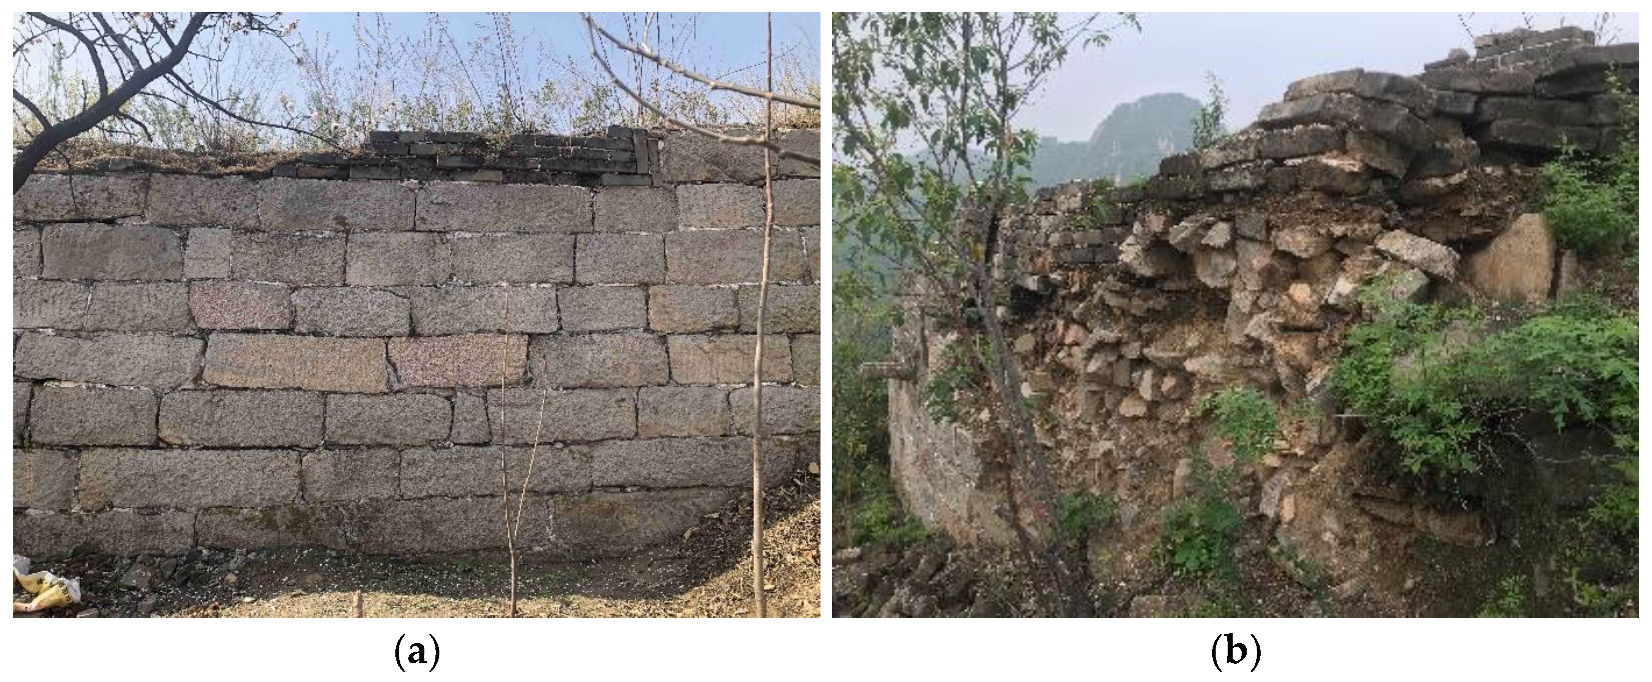
6.1. Base Walls Bulging

Figure 17a shows the base walls bulging on the Ming Great Wall, caused by the superstructure collapse and rainwater getting into the base wall. It leads to cohesion reduction in the internal masonry filler and sliding between gravels, which pressures the stone layer laterally and eventually causes base wall bulging. In Blender (with Bullet physics engine), similar base wall bulging is observed. The mid-wall bulging magnitude measured at the site is 0.383 m, closely matched by the modeling result of 0.391 m (Figure 17b).

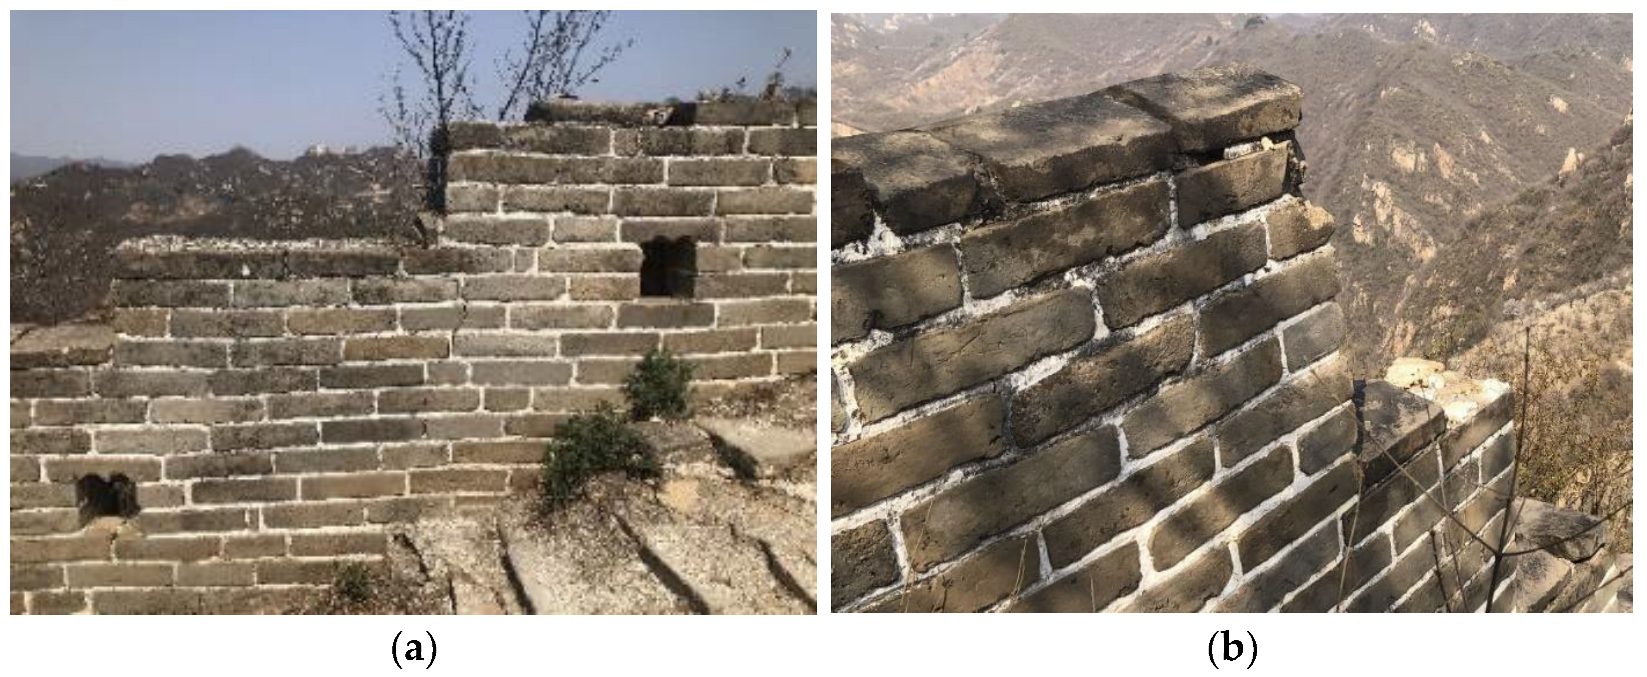
6.2. Parapet Wall Collapse

Another typical damage of the Great wall, parapet wall collapse, is due to the design and setup defect of parapet walls. The exterior side of parapet walls typically sits on stone layers while the interior side bears on infills. With infills settling, parapet walls tilt inwardly and eventually collapse. Blend and Bullet physics engine can predict the collapse progress and closely simulate the collapse consequences. In Figure 18, both numerical and real-time results show the collision between the collapsed parapet walls, mortar fracture, and scattered on the ground.

7. Damage and Failures Visualization

Four hazard factors (stone layer collapse, steps collapse, parapet walls inward tilting, and stone layer bulge) are considered and simulated in Blender after incorporating previously discussed modeling and computational methods. The development process, consequences, and the influence of various structural failures on the Ming Great Wall are discussed herein:

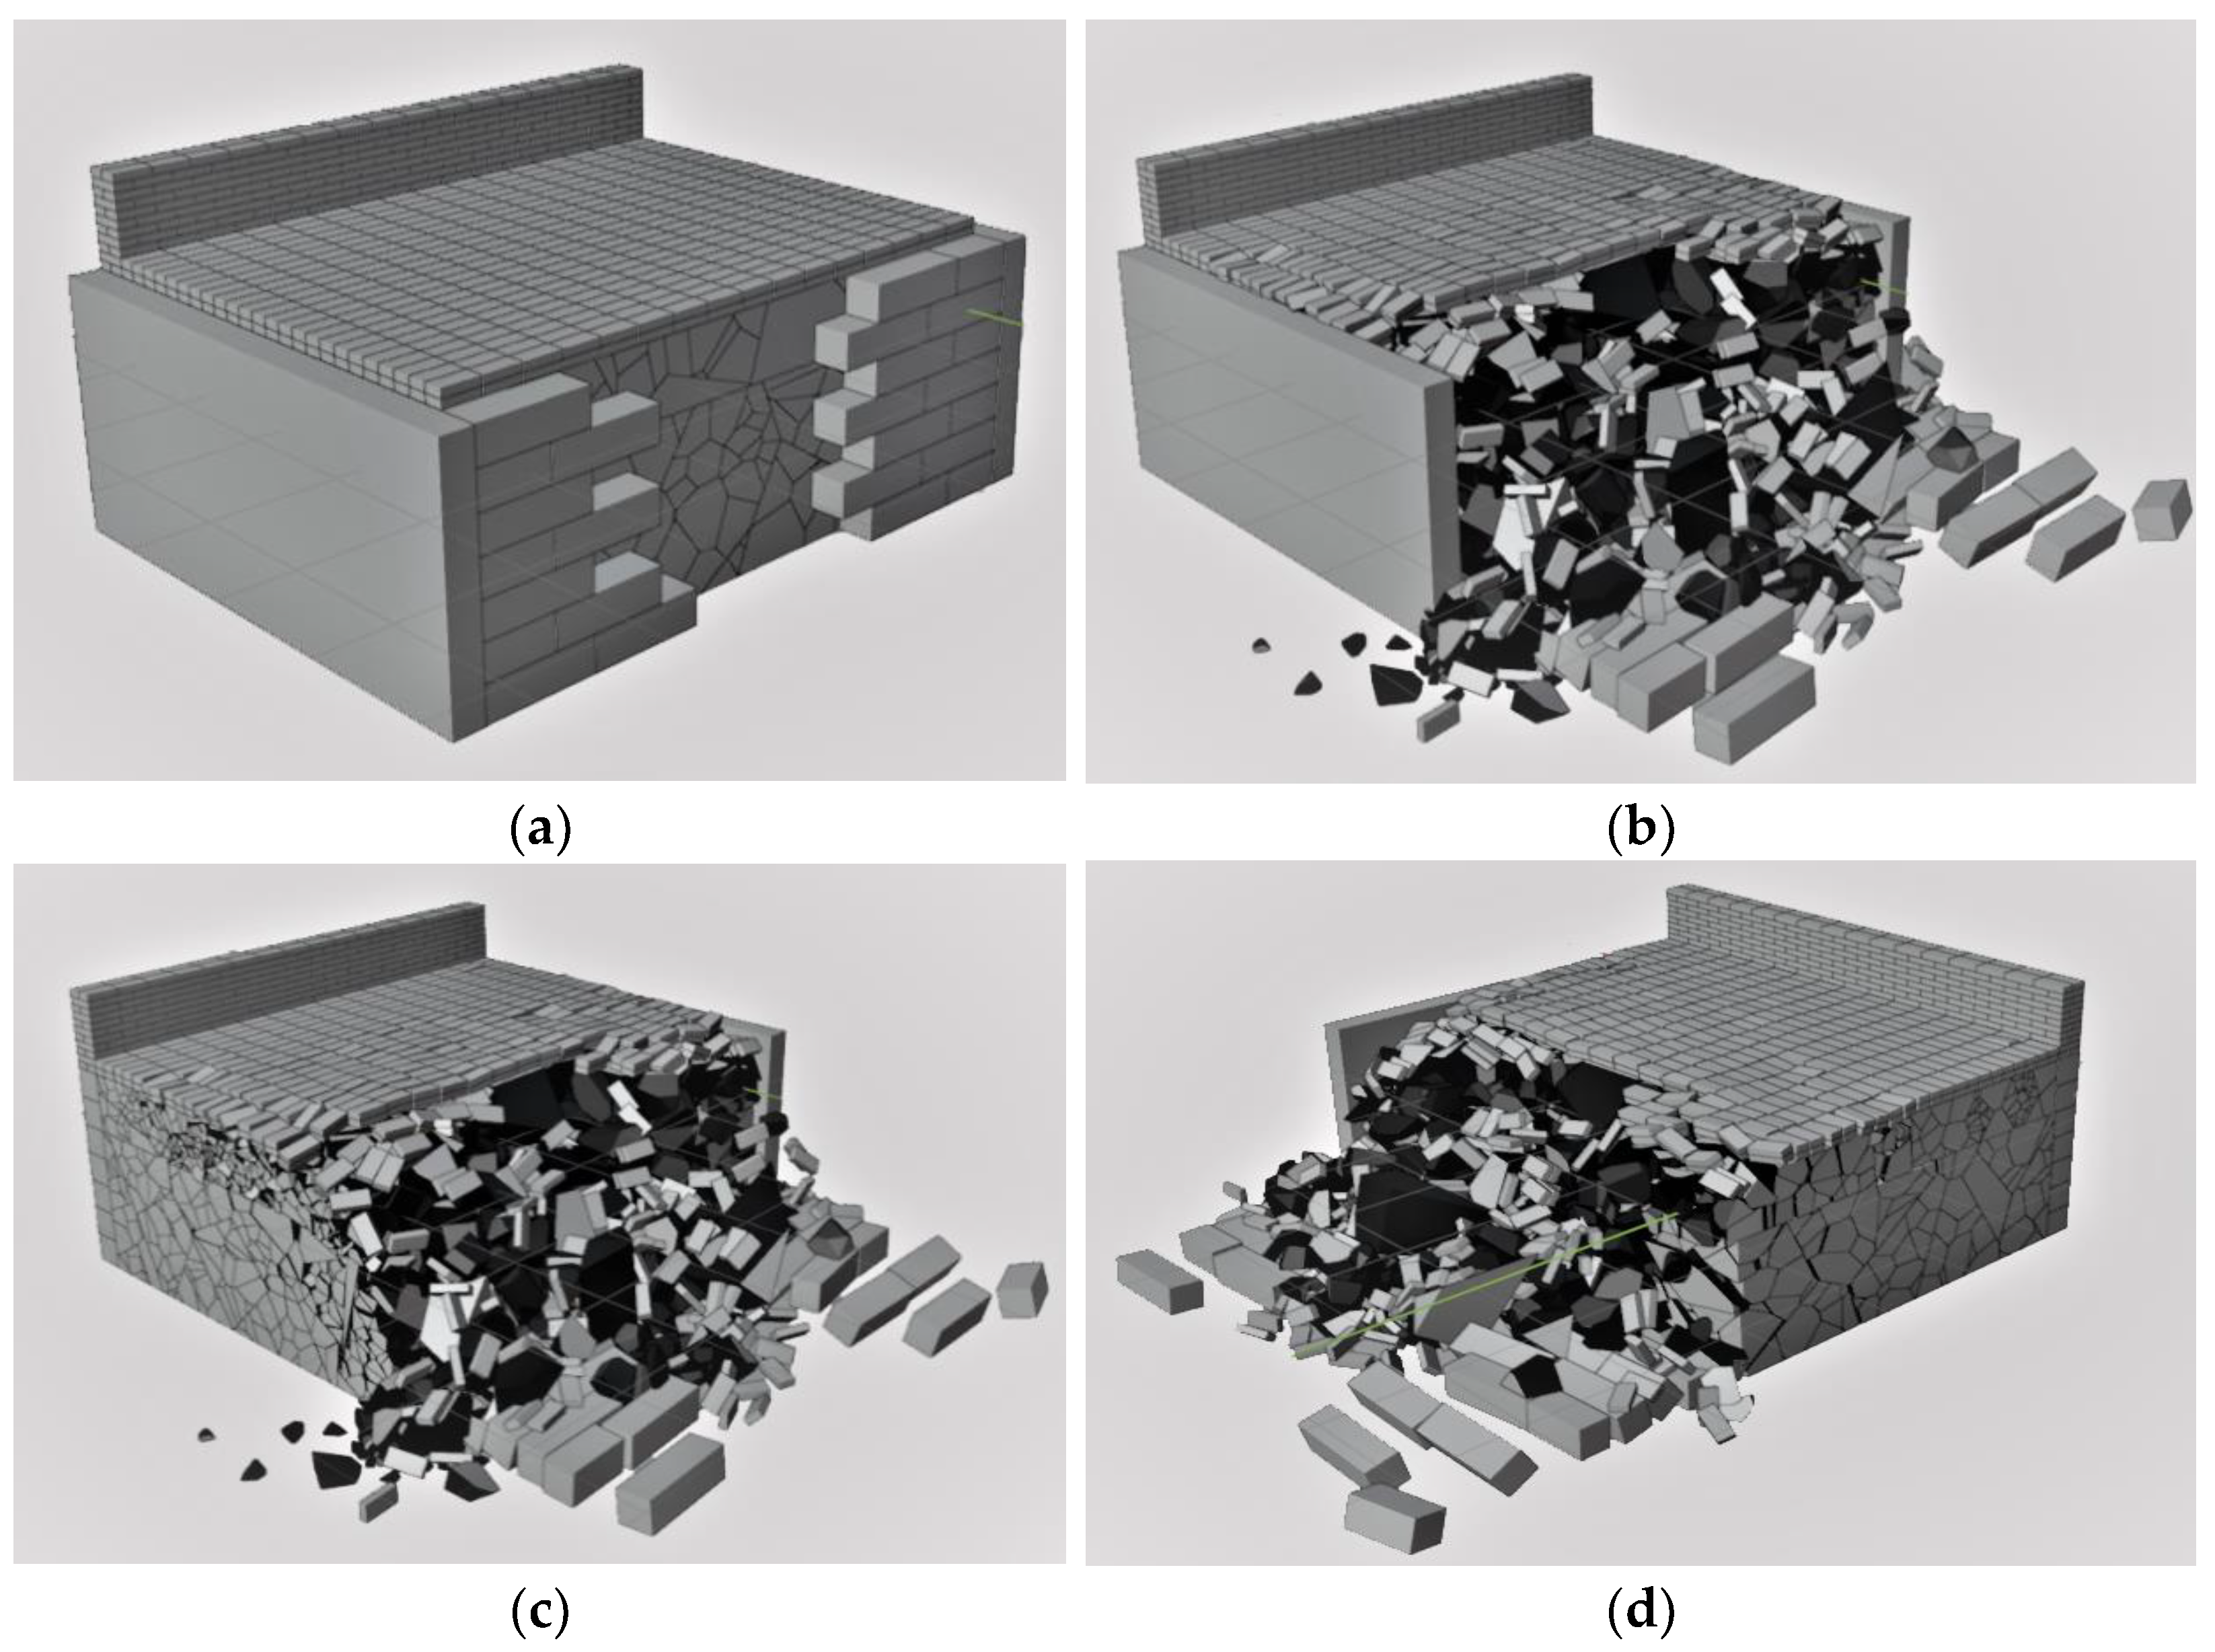
7.1. Stone Layer Collapse
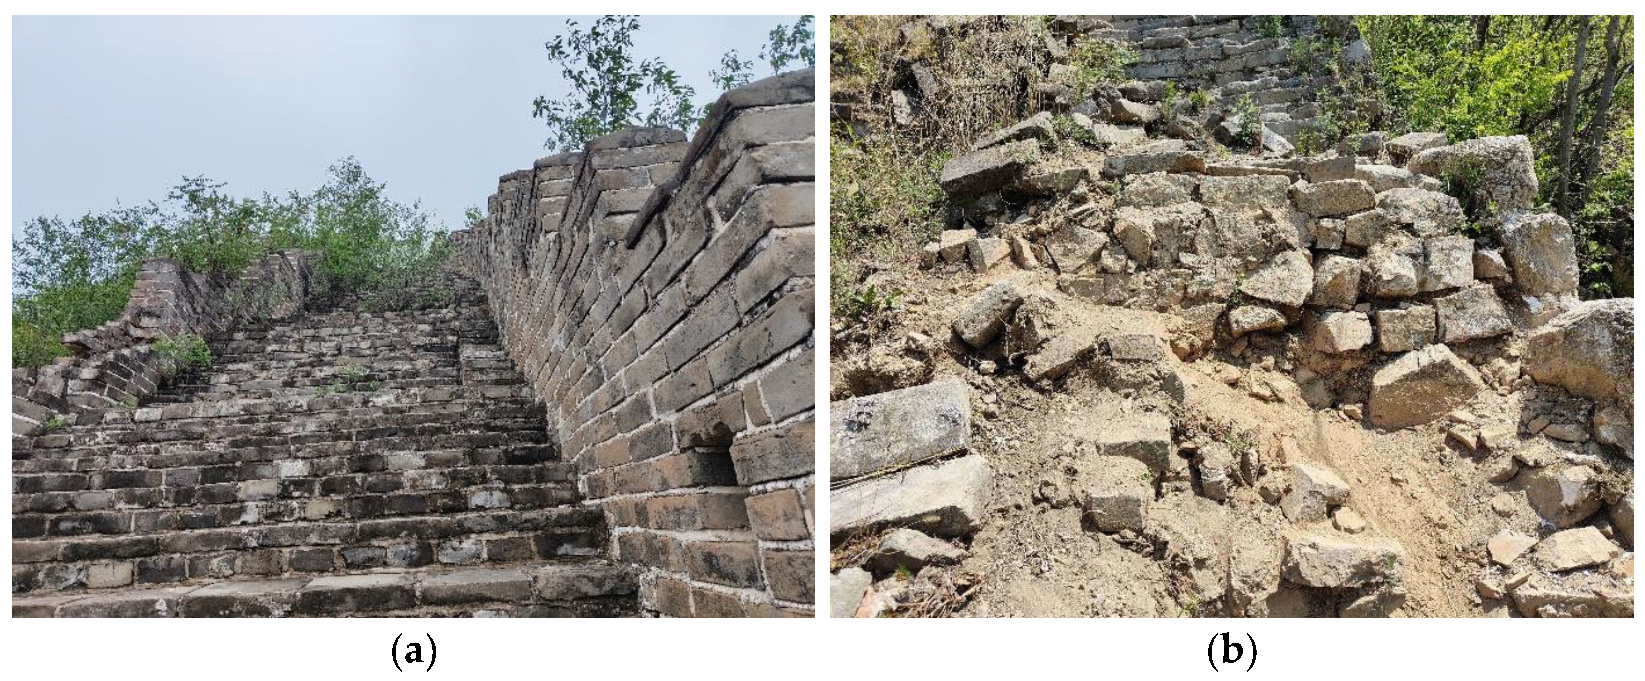
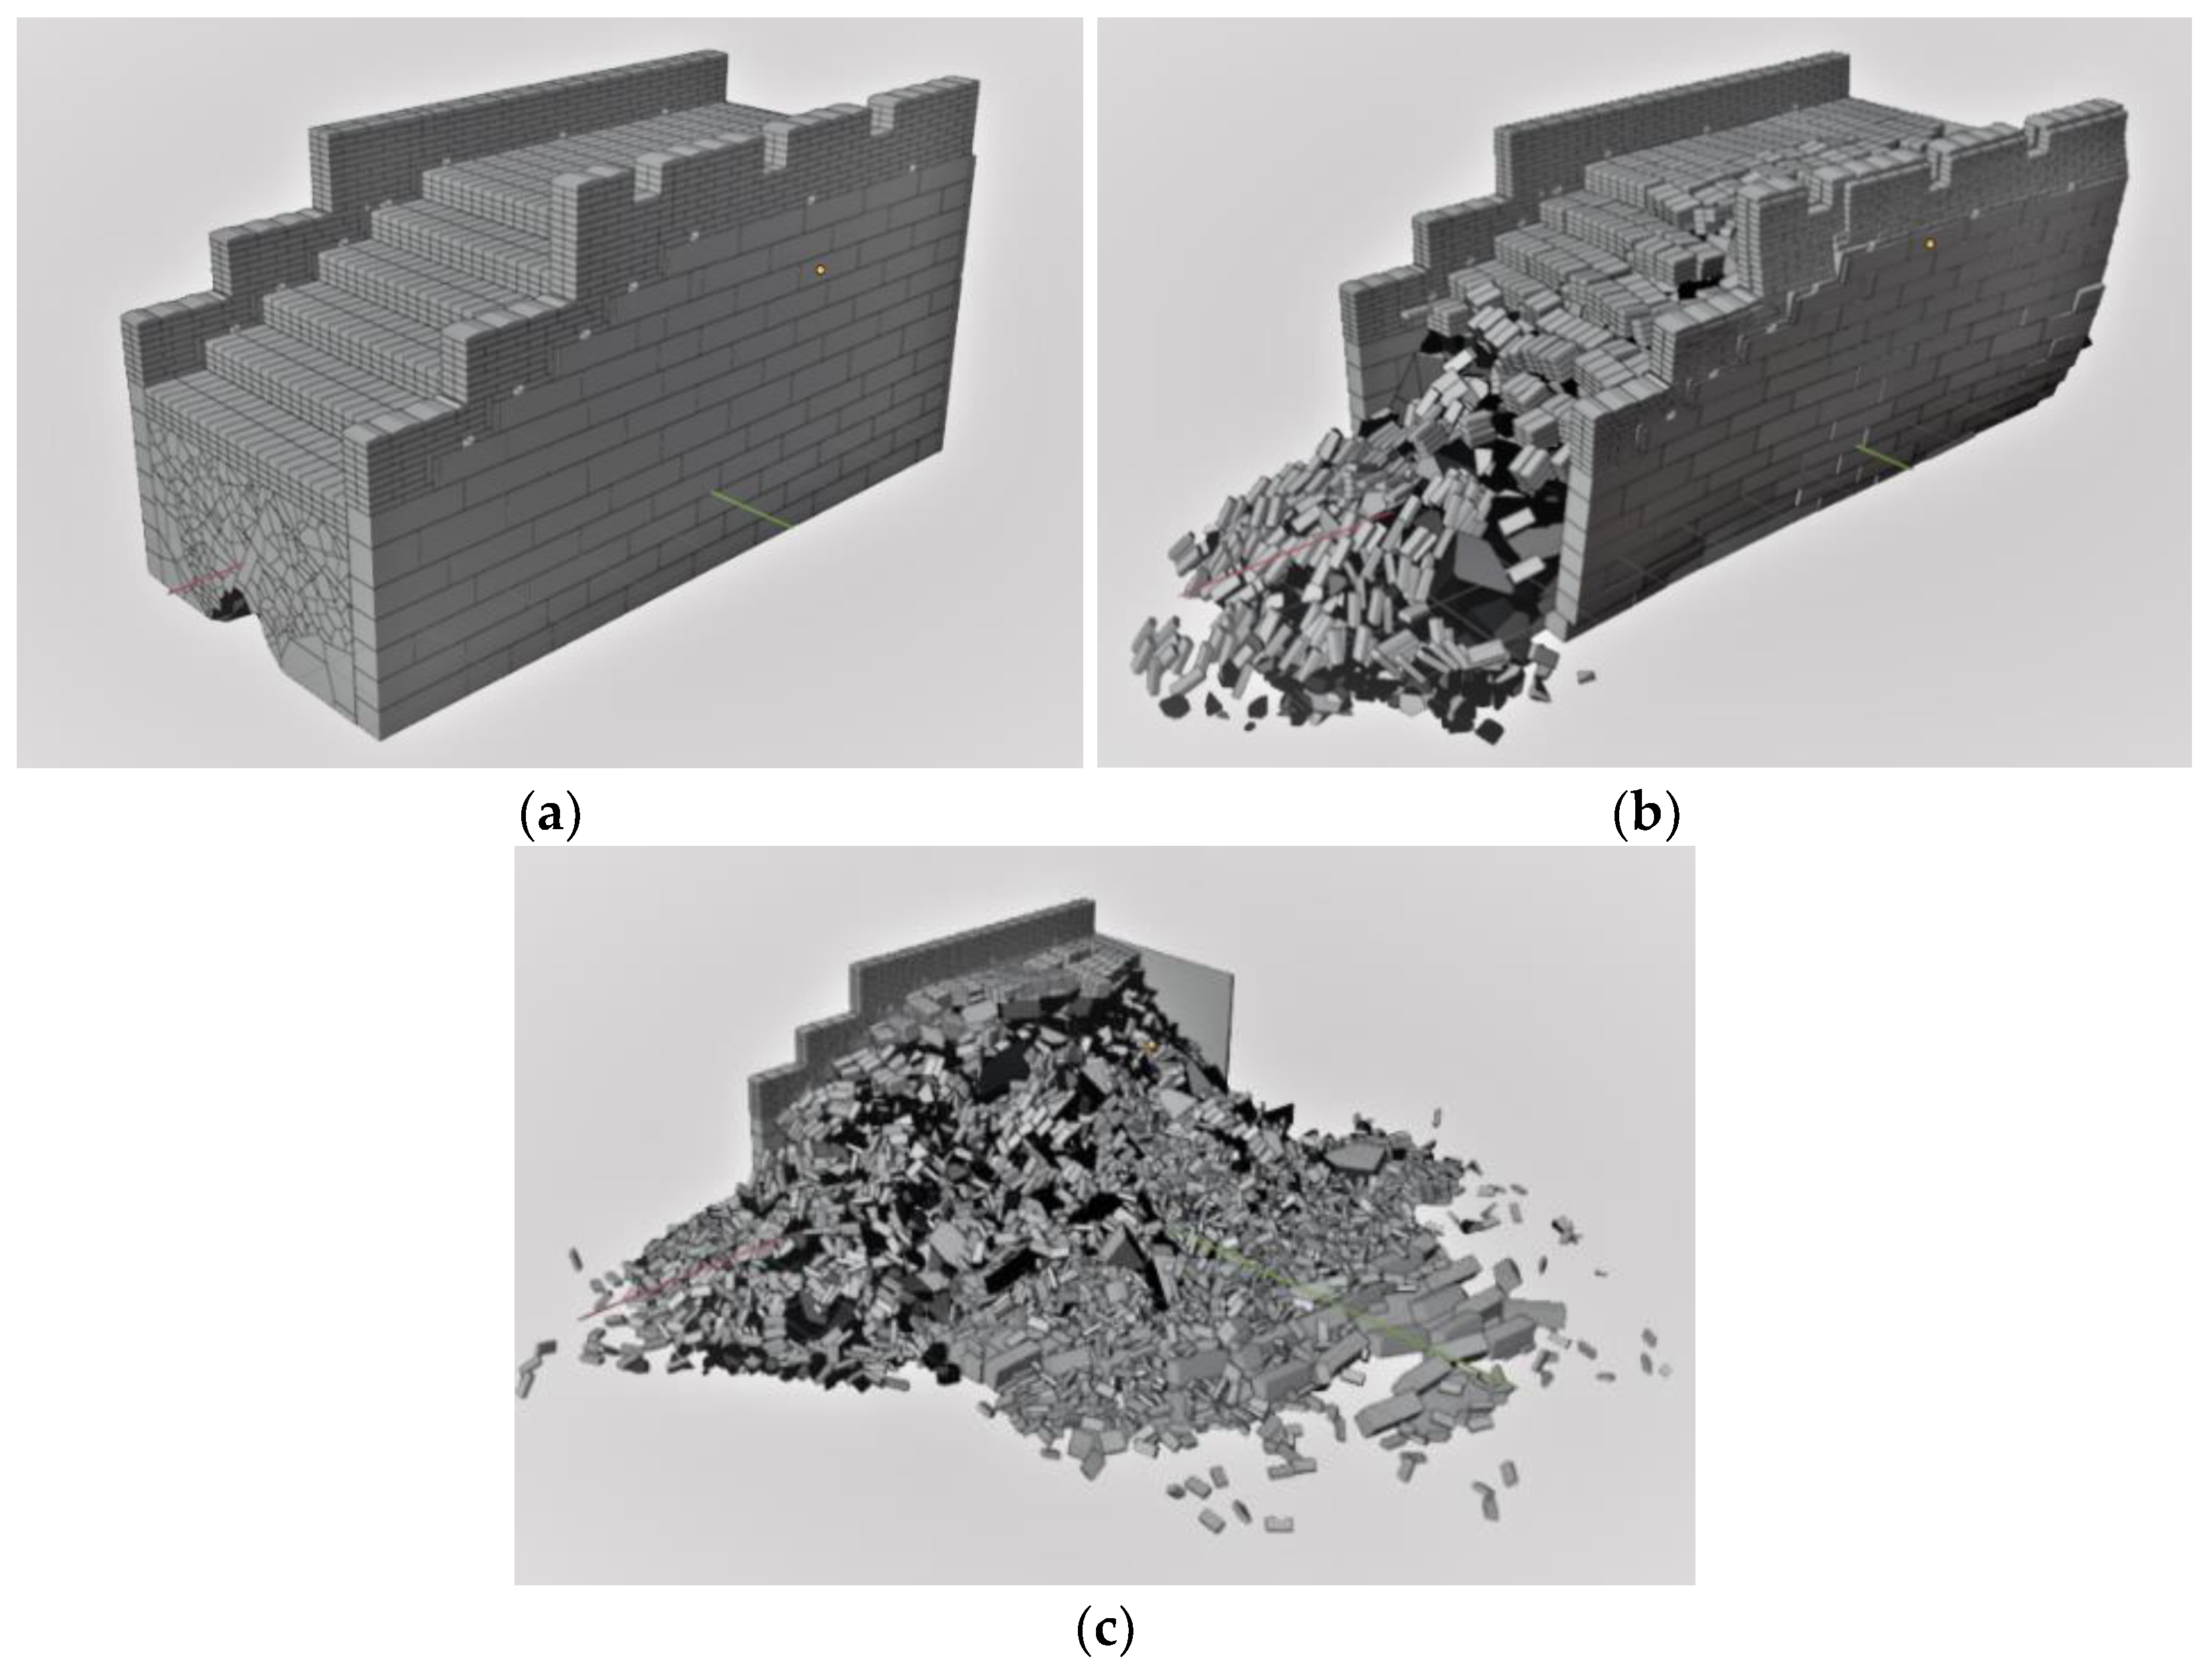
The collapse of the side walls’ stone layer is one of the common failures in the Great Wall. After the stone layer is lost, rain erosion reduces the cohesion of the base wall infill comprising the mixed and middle layers (Figure 2). This study focuses on the aftermath of the side wall’s sloped section after the stone layer collapses. The stone collapse concentrates in the middle of one side with a missing width of 3200 mm. Since the Great Wall is continuous, the collapse does not occur in the longitudinal direction. Correspondingly, rigid retaining walls are defined in the left and right ends of the model (Figure 19a).
The smaller rubbles are squeezed out from the base walls with reduced infill cohesion. Then, the entire infill is loosened, and the rubble layer impacts the remaining stone layers on both sides of the base walls, leading to the base wall’s outward tilting and eventually collapsing. Thus, all face stone and interior rubbles break out, erupt, and scatter around the surrounding ground as in Figure 19b. Figure 19b,c present the consequences of removing left or right rigid retaining walls. See Video S1 for a video of the collapse. As observed, when the base wall collapses, some rubbles gradually break out and erupt while the interior mixed layer is well preserved.
Even though the collapse of the stone layer does not affect the main interior mixed layer, it will cause the collapse of adjacent stone and rubble layers, which induces significant damage to the base wall entirety and corresponding repair difficulty. Therefore, the collapsed stone layer shall be repaired in time to avoid more severe future damage.

7.2. Steps Collapse

The steps collapse of the slope sections’ side wall is also a common failure in the Great Wall. Once the steps collapse, interior infill can easily erode under rainwater, causing the side wall to collapse along the longitudinal direction. This study adopts the sloped section model to simulate the consequences of step collapse at the front section, as in Figure 20a. As the infill cohesion reduces, many rubbles and steps slip and bump the right-side wall, which generates the outward tilting of the stone layer and collapse of the upper battlement wall (Figure 20b). Figure 20c shows the final simulation status in Blender. The right-hand side stone layer, battlement wall, and steps collapse and scatter on the ground. See Video S2 for a video of the collapse.
Since the sloped section of the Great Wall is typically built along the ridge, the wall infill is susceptible to rainwater damage along the Great Wall’s longitudinal direction after the steps collapse. In addition, the side wall damage is irreversible after step collapse, so this failure damage shall also be repaired promptly.

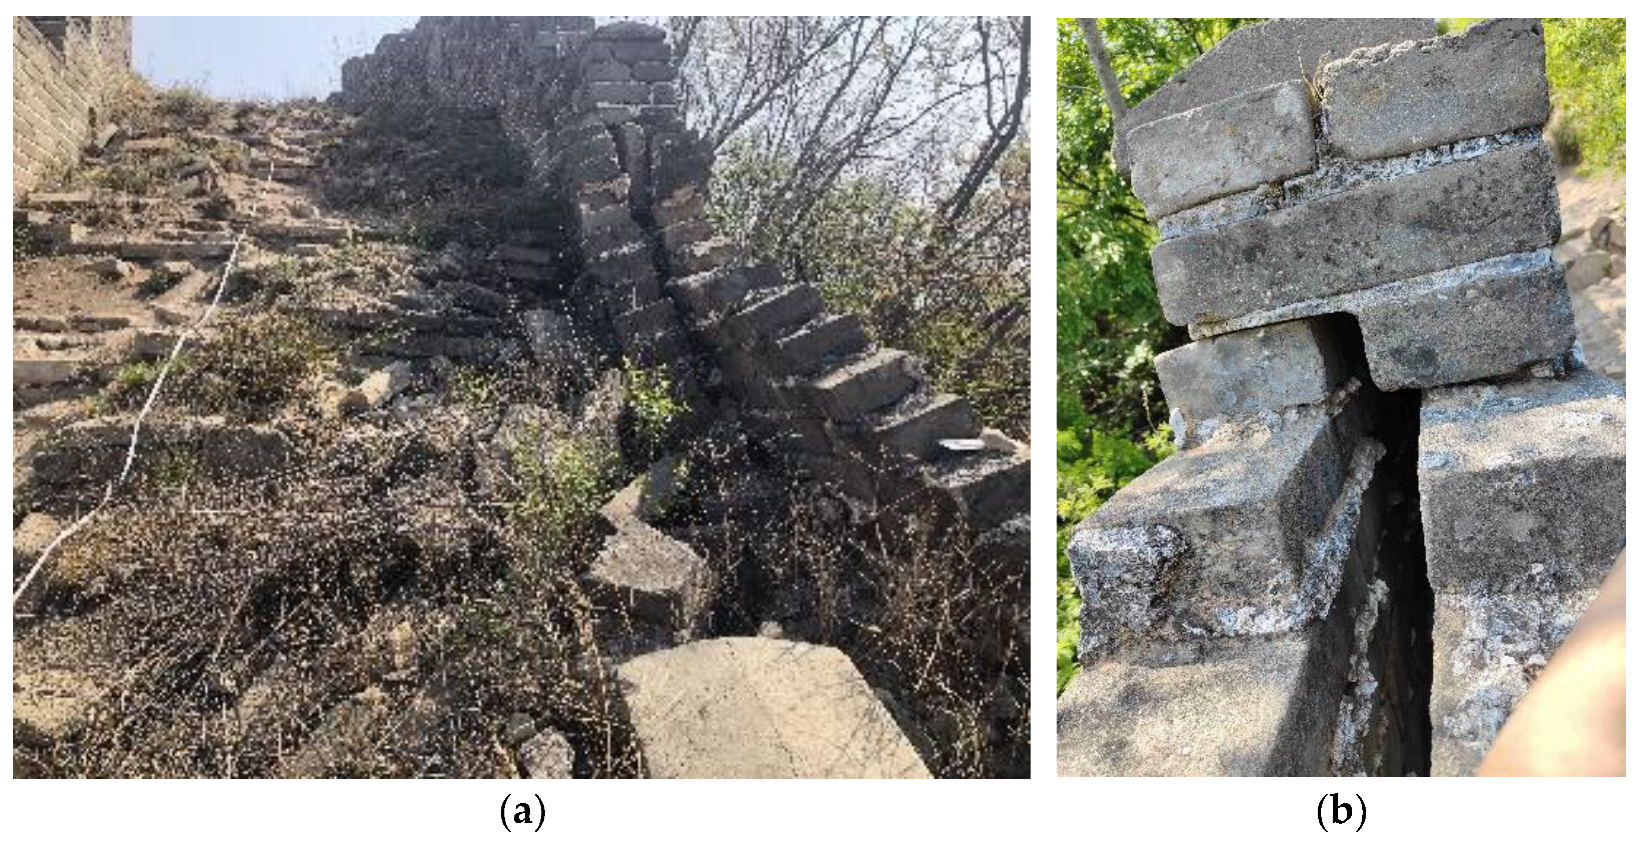
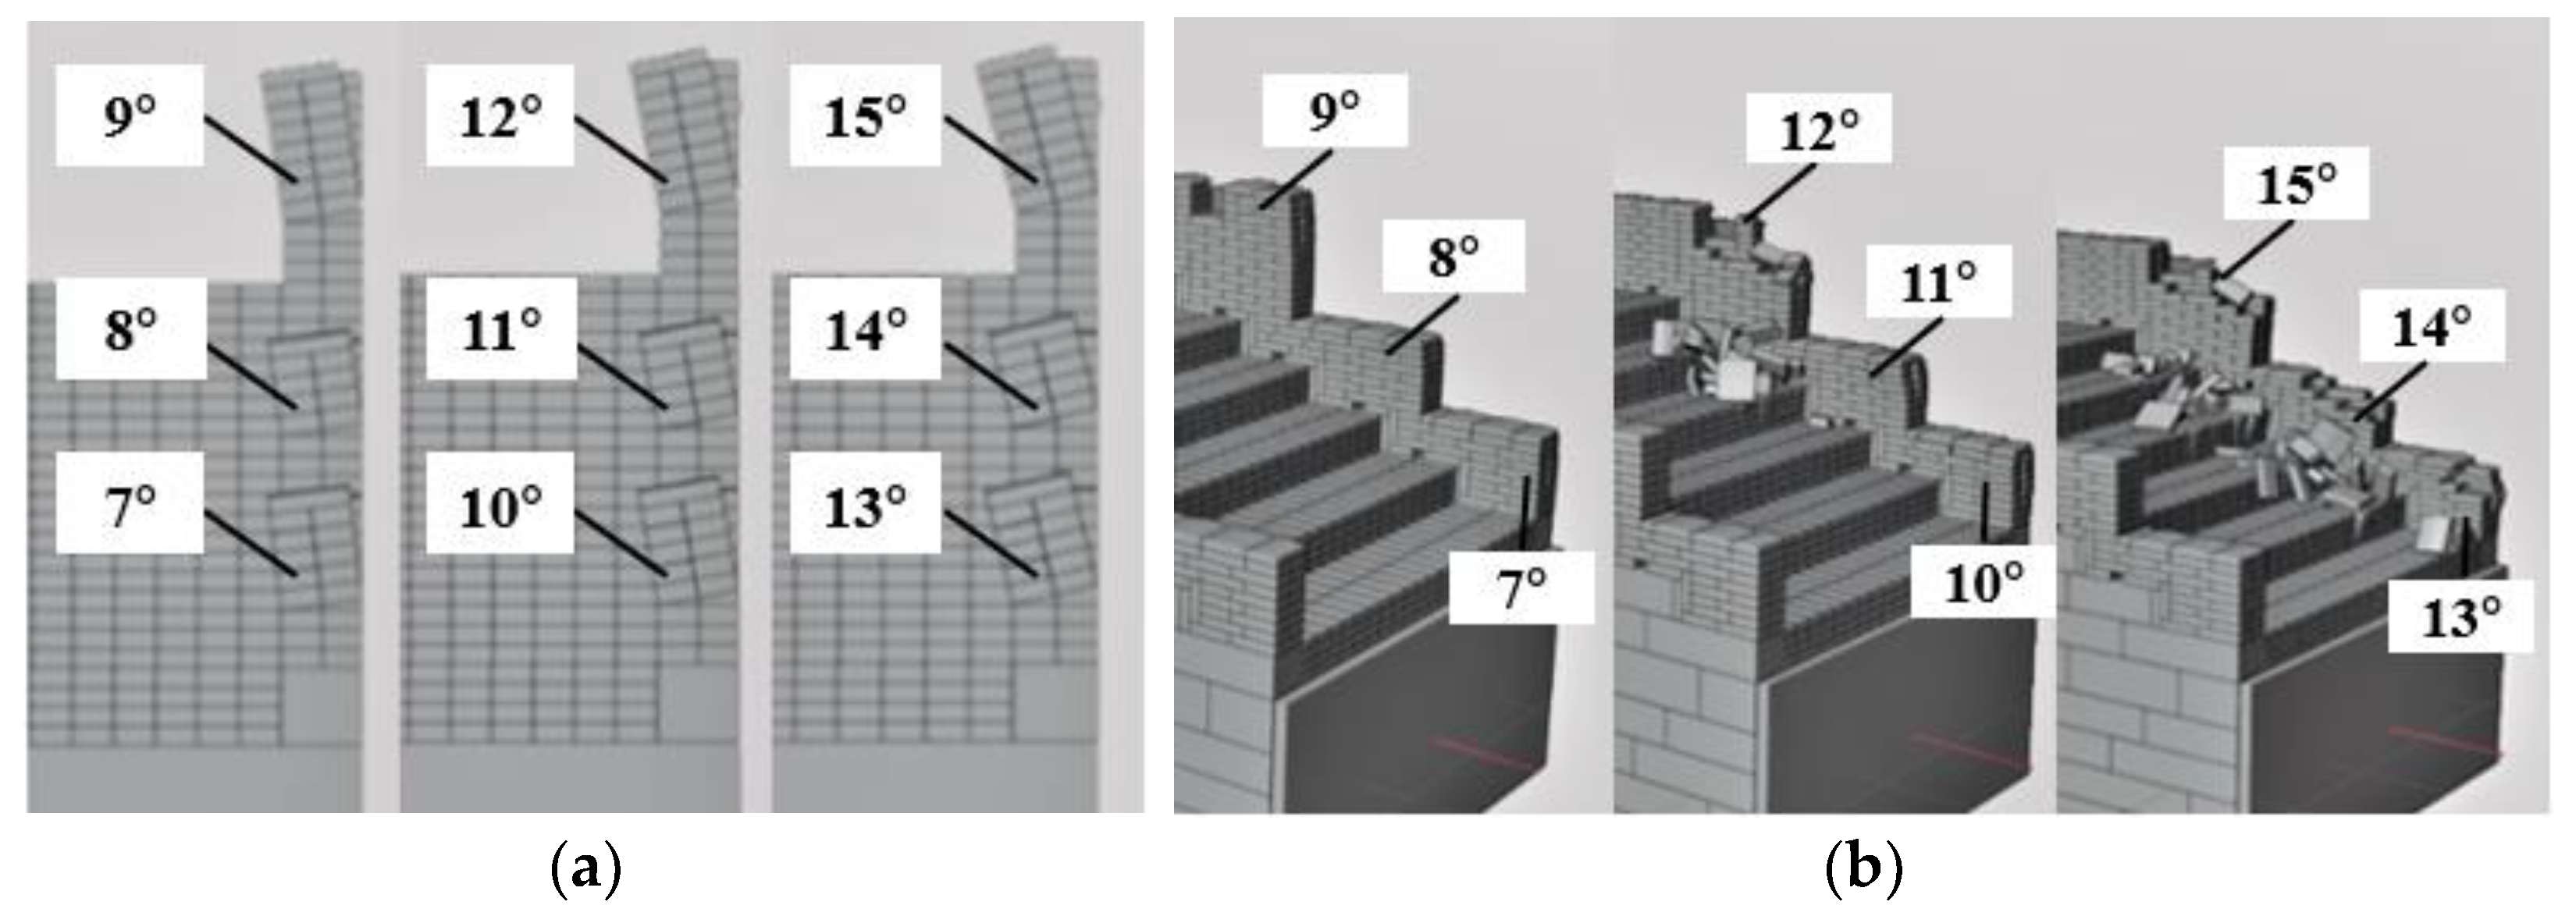
7.3. Parapet Walls Inward Tilting

As the infill layers (i.e., mixed layer and middle layer) settle, the interior base of battlement and parapet walls also settle where inward tilting may occur. This section considers an inward tilting angle of 7° to 15° to simulate the battlement and parapet wall stability under different tilting angles. Figure 21a presents the tilt angles of the original battlement walls, while Figure 21b demonstrates the final status of battlement walls. As observed, some sliding movement occurred between structural bricks under an angle of 7° to 11°, but the battlement did not collapse. As the tilting angle increases from 12° to 15°, some structural bricks fall off, and battlement walls collapse inwardly, which also impacts the steps. The tilting velocity and affected area develop much faster under an angle of 15° than those under 12° to 14°. See Video S3 for a video of the falls.
The battlement and parapet walls collapse when the tilting angles are not less than 12°. The collapse velocity and area increase with the initial tilting angle. However, the tilting-related collapse did not generate the Great Wall global collapse but only affected the steps locally, which could be repaired and rehabilitated relatively quickly.

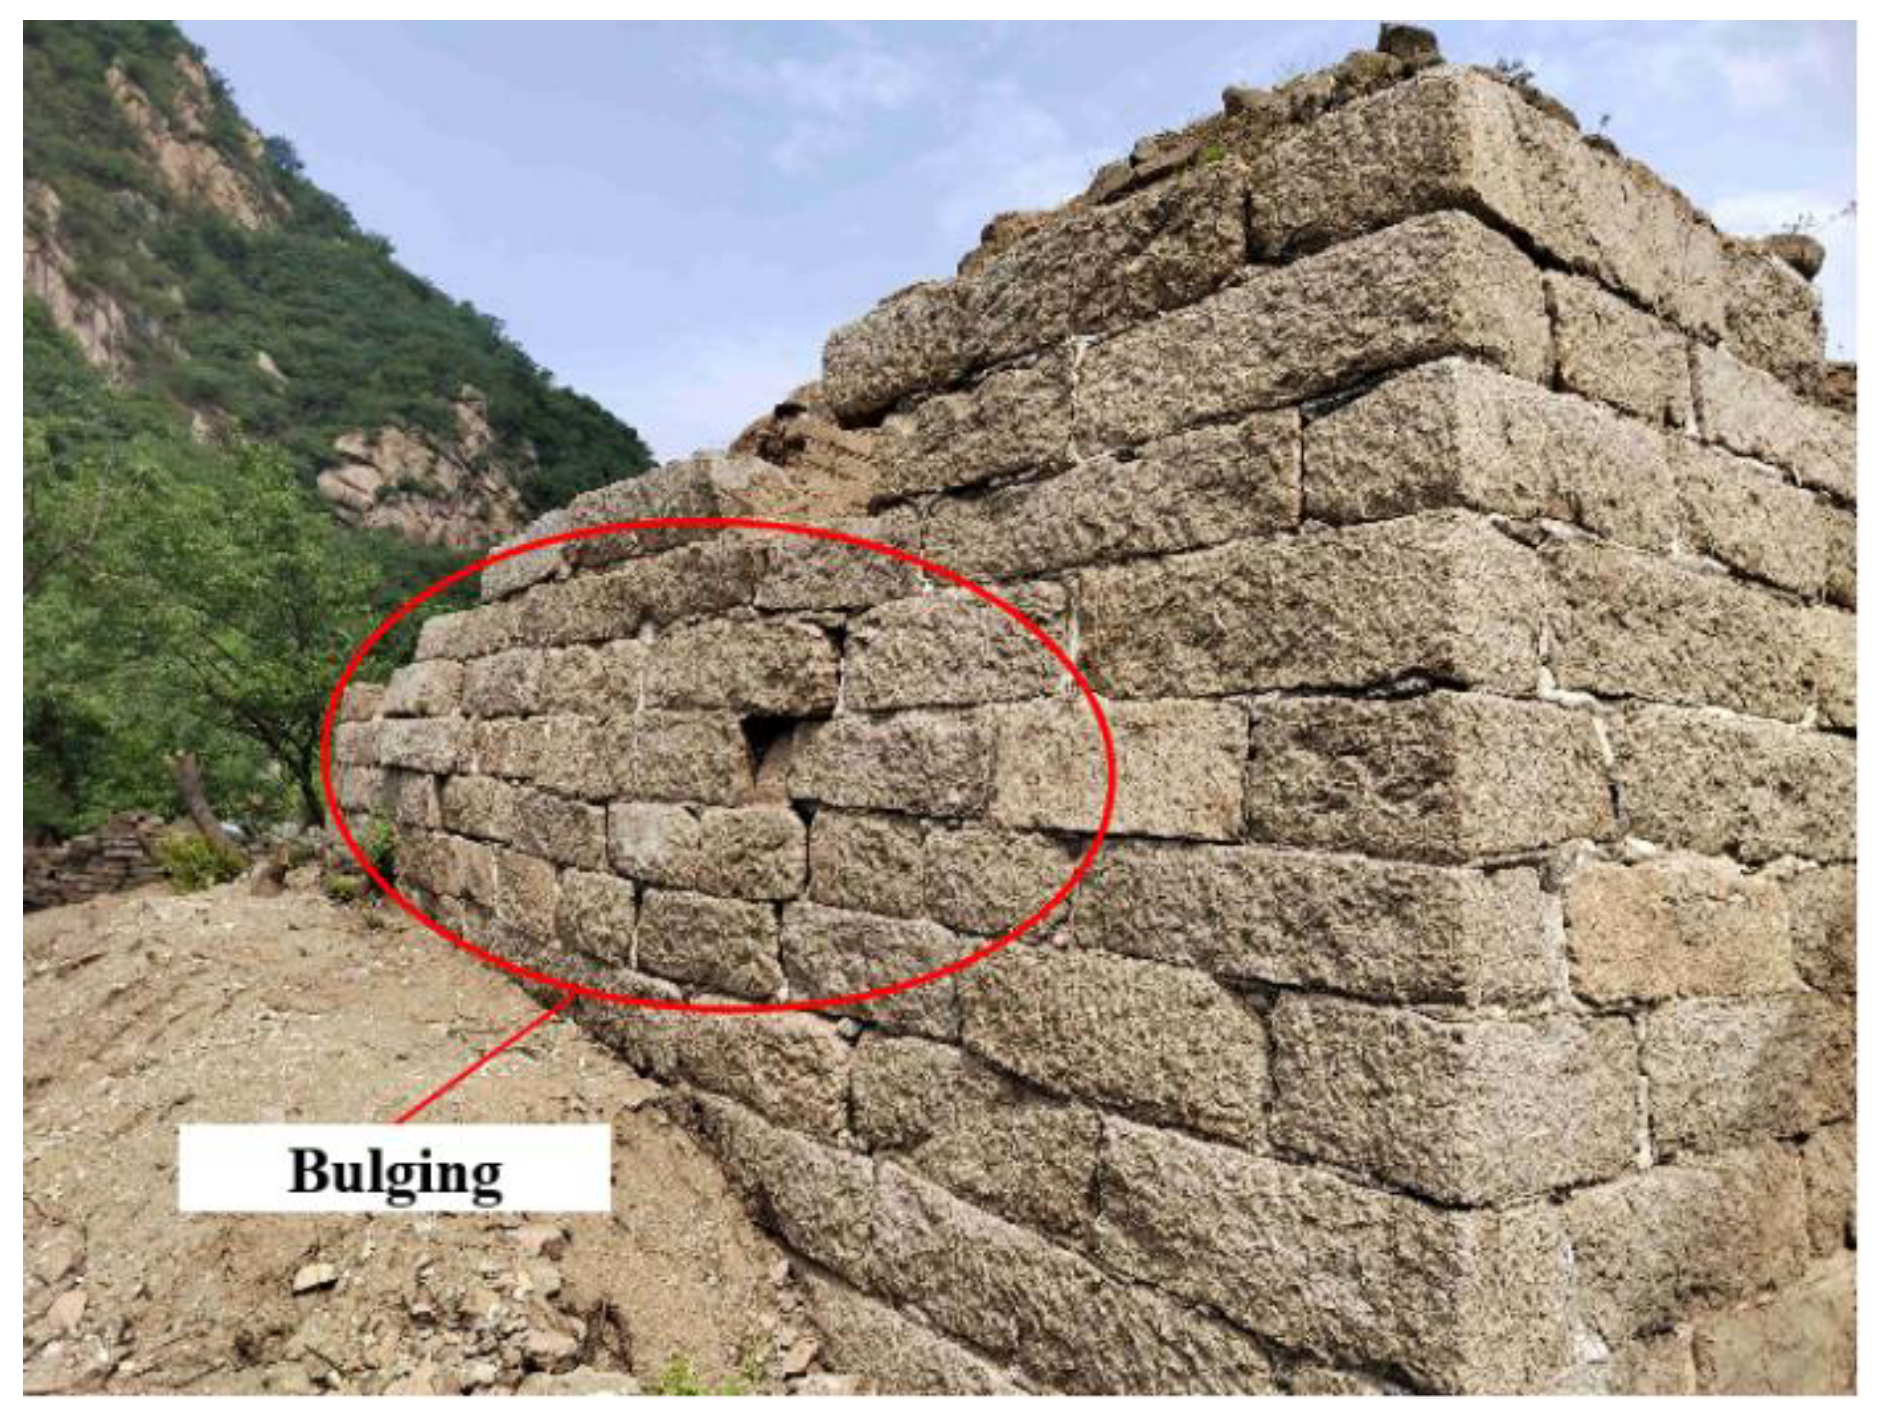
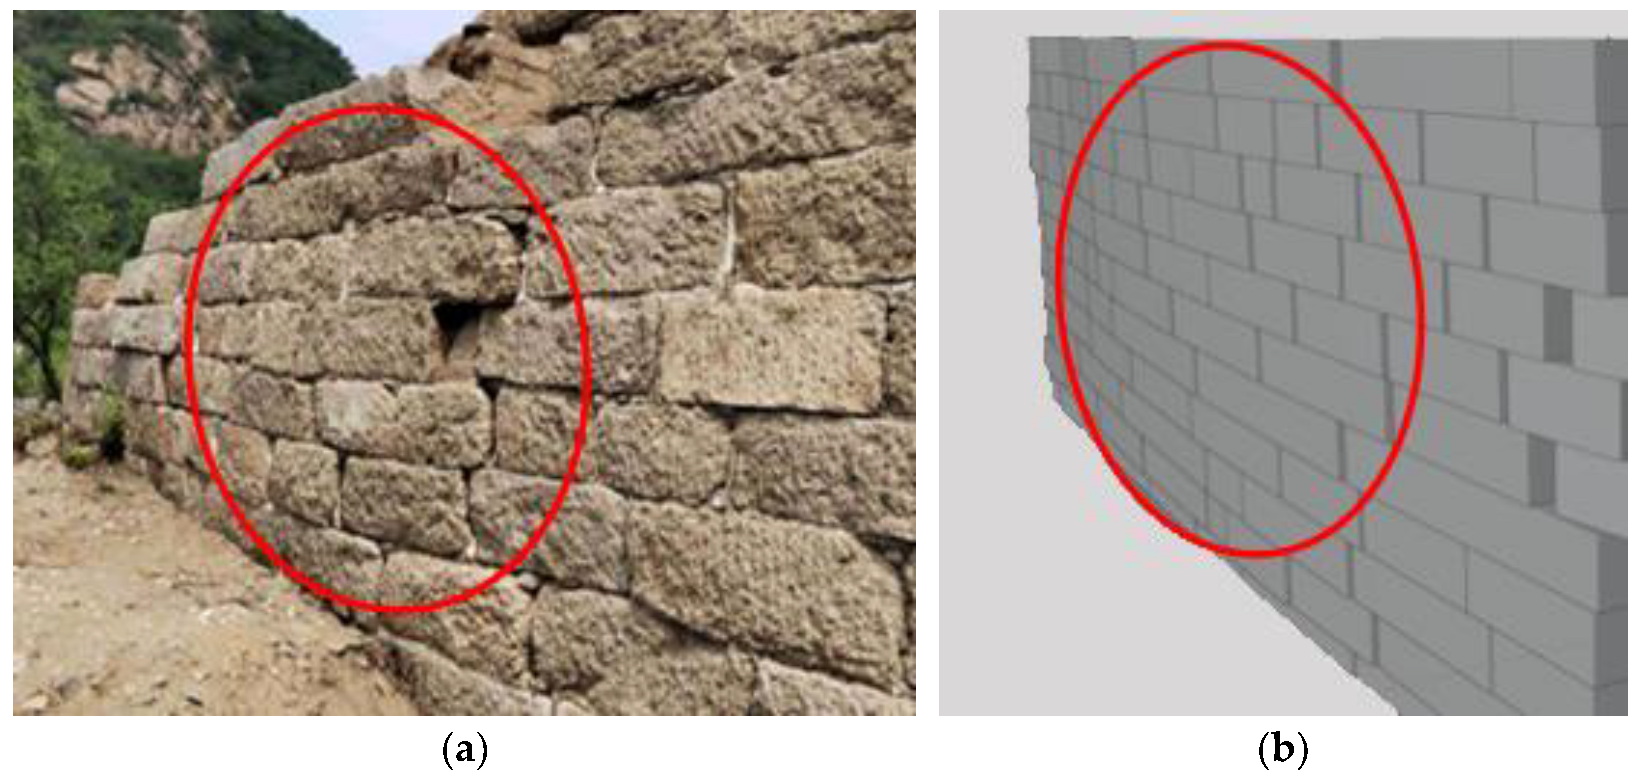
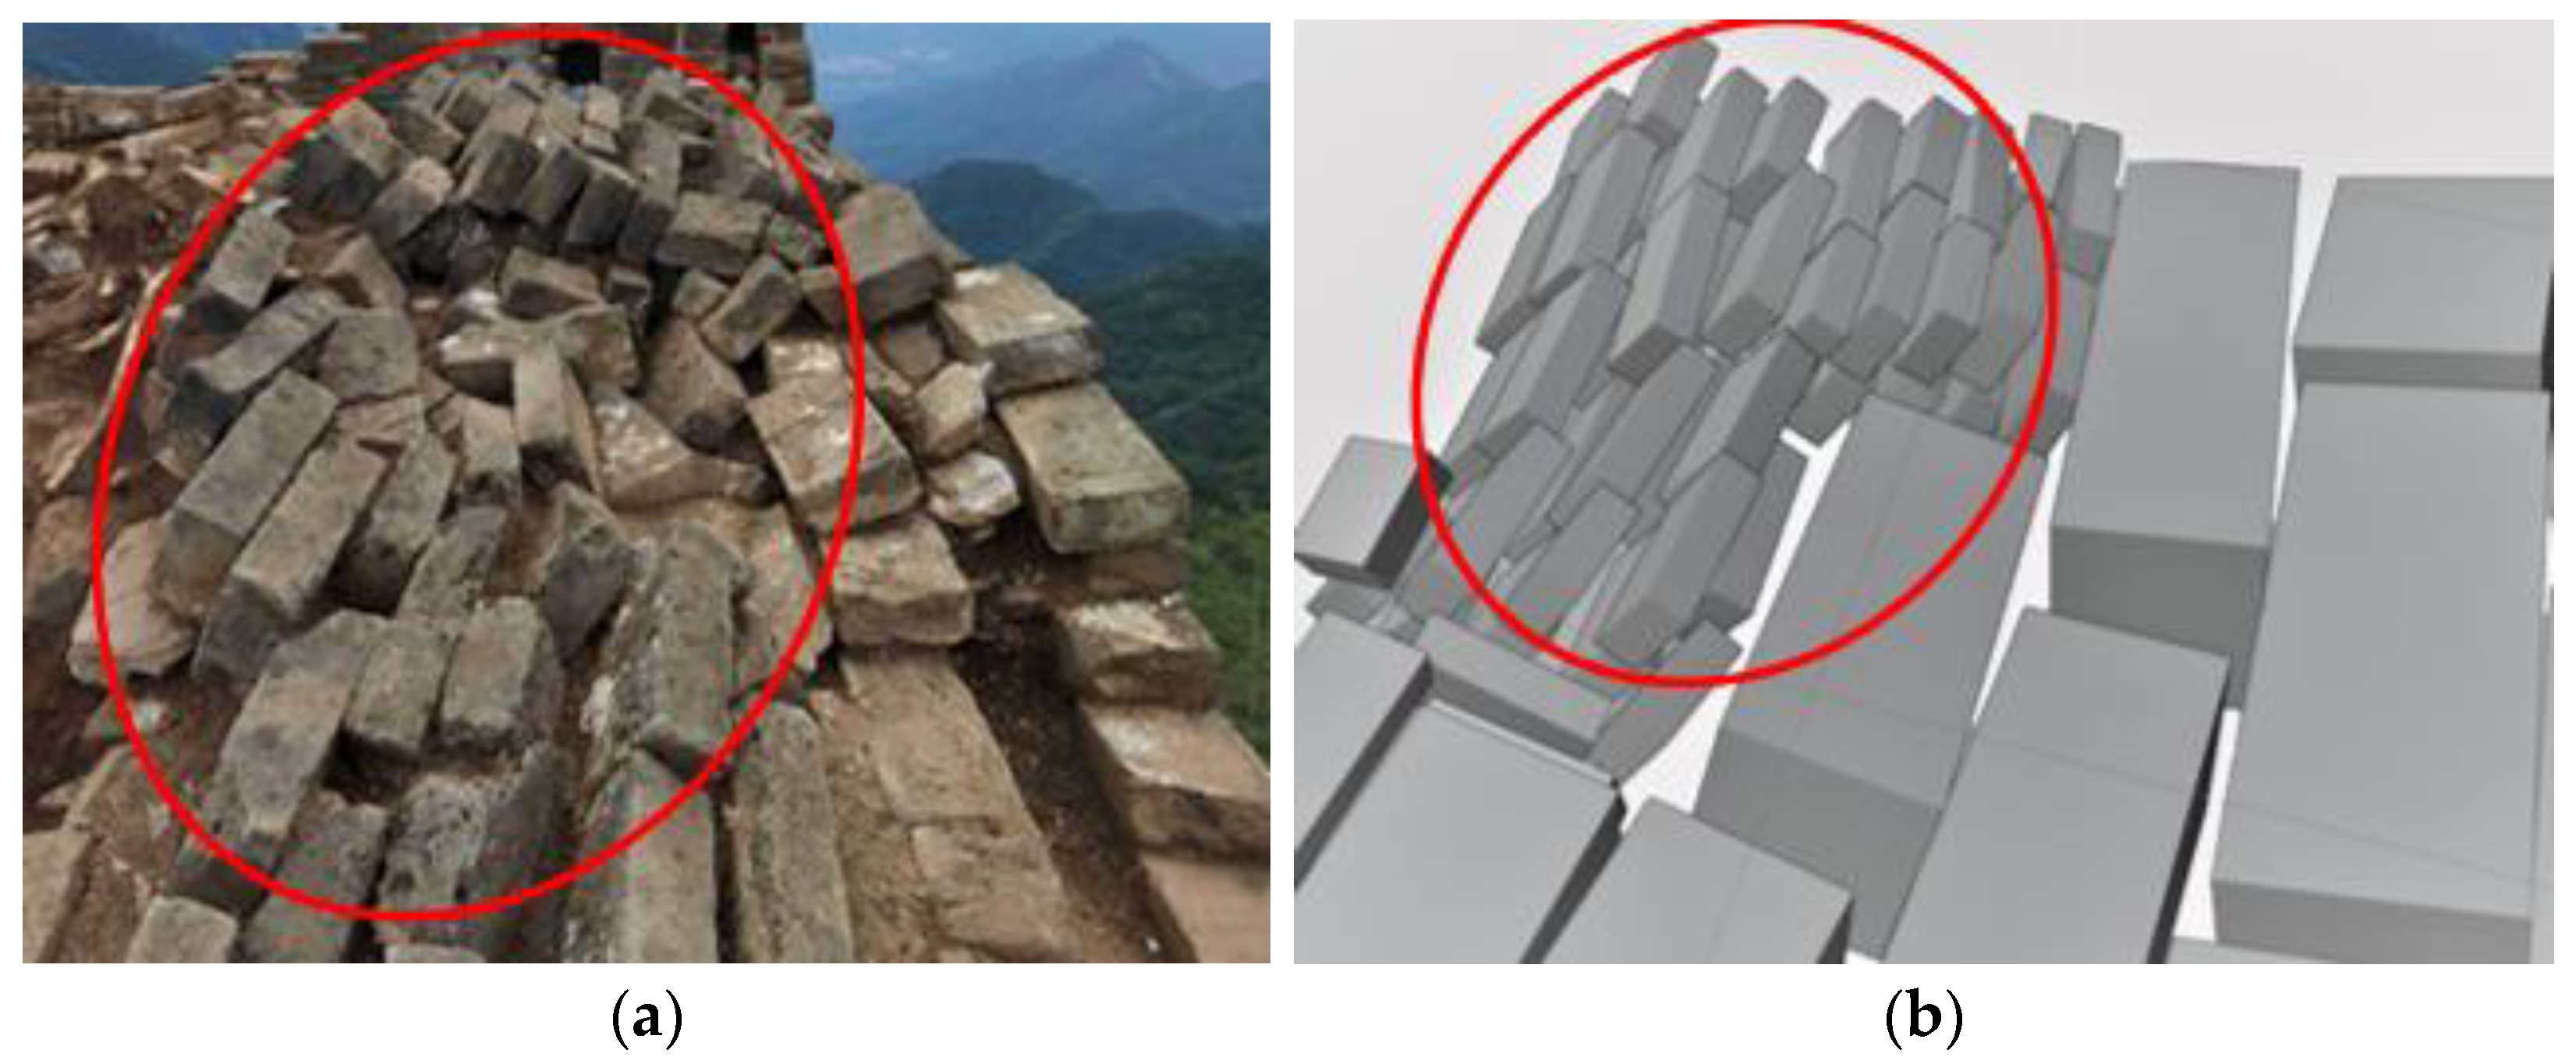
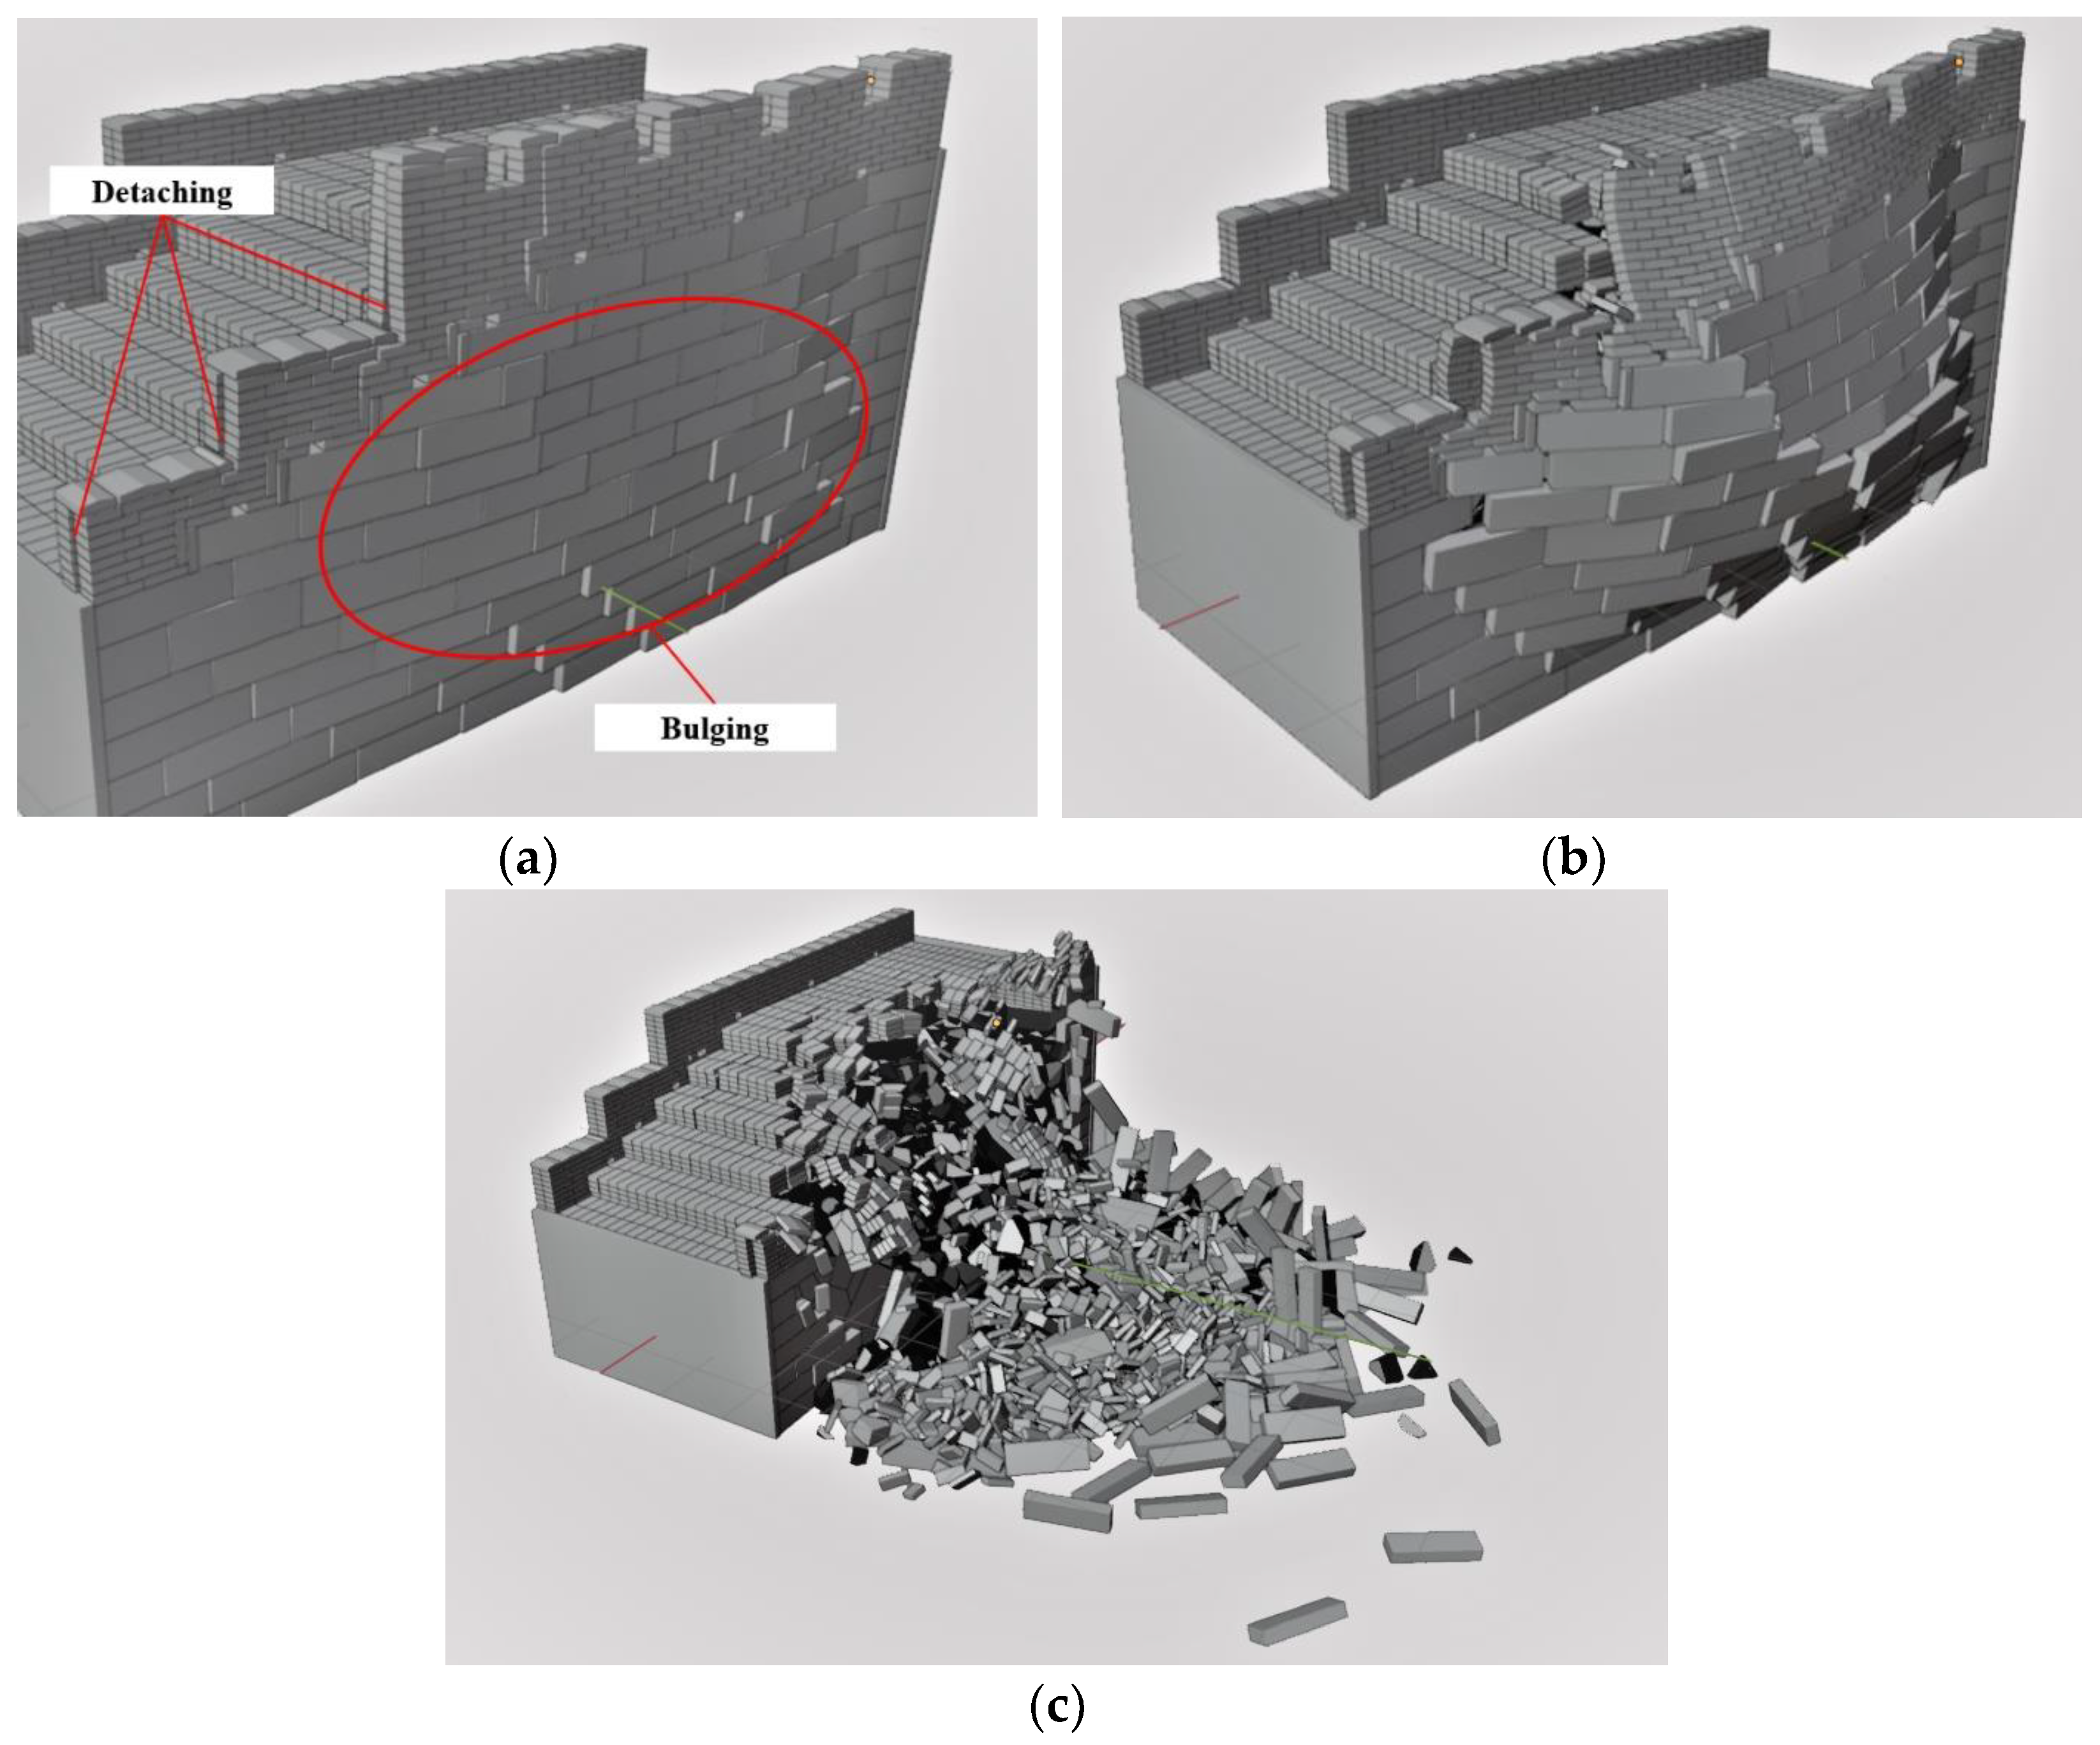
7.4. Stone Layer Bulge

The base wall’s stone layer bulge is typically associated with the battlement and parapet wall wythe detachment, which are also among the Great Wall’s common failures. Figure 22a shows the local stone layer bulge and battlement wall detachment. Figure 22b presents the phenomenon after the infill cohesion is reduced by natural erosion or disasters. The interior rubbles erupt outward, provoking the stone walls’ middle portion to bulge and the upper battlement wall to tilt inwardly. The final collapse status is shown in Figure 22c, where the stone layer collapse outwardly, and upper battlement wall tilts inwardly. All these collapsed and damaged bricks fall on the steps while many rubbles and steps slide and fall on the surrounding ground. In summary, the stone layer bulge may cause severe failure and even a massive collapse of the Great Wall, which requires immediate attention and fix.

8. Conclusions

This study applies four types of hazard factors (i.e., stone layer collapse, steps collapse, parapet walls inward tilting, and stone layer bulge with wythe detachment) to the Ming Great Wall of China (1368–1644 AD) by hybrid architectural visualization and computational simulation. The investigation methodology is based upon Blender’s three-dimensional (3D) modeling and graphic platform, which combines numerical unit blocks and a physics engine (i.e., Bullet Constraints Builder). The physics and mechanical parameters for the Great Wall mortar are obtained from experimental tests. In addition, the failure development process, consequences, and resolution are discussed. The main conclusions are conducted as follows:
  • The average shear strength of ancient lime mortar on the Ming Great Wall is about 0.36 MPa, providing a friction coefficient of 0.86.
  • Blender that combines unit blocks and a physics engine (i.e., Bullet Constraints Builder plugin) can efficiently envision and predict failure progress on the Great Wall, which facilitates visualizing the failure development, and guides failure prevention and rehabilitation methods. As a result, Blender (with Bullet physics engine plugin) is recommended to be used in analyzing similar historical and architectural heritages for preliminary failure prediction, heritage preservation planning, and visualized safety evaluation, when 3D architectural graphics and animations are critical for owners and decision-makers.
  • Stone layer collapse, steps collapse, and stone layer bulge can cause severe damages and undermine the Great Wall’s global safety, among which steps collapse can even cause massive structural collapse. These failures and corresponding damages need immediate repair or rehabilitation.
  • Local wall collapse may occur when the battlement and parapet wall inward tilting angle is not less than 12°. These damages will not trigger dramatic global collapse but only damages some steps and local walls, which can be easily retrofitted.

Supplementary Materials

The following supporting information can be downloaded at: https://www.mdpi.com/article/10.3390/buildings12122224/s1, File S1: Blender Fundamentals in Modeling the Great Walls; Video S1: Stone Layer Collapse; Video S2: Steps Collapse; Video S3: Parapet Walls Inward Tilting.

Author Contributions

H.D.: Conceptualization, Methodology, Investigation, Writing—review and editing, Funding acquisition Supervision; J.Y.: Experiment, Data curation, Validation, Formal analysis, Data curation, Visualization, Writing—original draft; Y.W.: Writing—review and editing, Visualization, Investigation, Supervision; Y.Z.: Investigation, Conceptualization, Methodology; Y.T.: Funding acquisition, Conceptualization, Methodology, Supervision; H.W.: Investigation. All authors have read and agreed to the published version of the manuscript.

Funding

This work was supported and funded by NG Teng Fong Charitable Foundation and Beijing Municipal Social Science Foundation (Z21094).

Data Availability Statement

Not applicable.

Conflicts of Interest

The authors declare that they have no known competing financial interest or personal relationships that could have appeared to influence the work reported in this paper.

References

  1. Li, Y. No human factors can be allowed to cause devastating damage to the Great Wall. Guang Ming Daily, 20 April 2009. (In Chinese) [Google Scholar]
  2. Tang, Y.Y.; Liu, S.W. Reflections on the preparation of the Great Wall protection plan in Beijing. China Cultural Heritage 2018, 3, 7. (In Chinese) [Google Scholar]
  3. Waldron, A. The Great Wall of China: From History to Myth; Cambridge University Press: Cambridge, UK, 1990. [Google Scholar]
  4. Lovell, J. The Great Wall: China against the World, 1000 bc–ad 2000; Open Road+ Grove/Atlantic: New York, NY, USA, 2007. [Google Scholar]
  5. Xu, L.Y. Research on integrated conservation strategy of Ming Great Wall defense system. Ph.D. Thesis, Tianjin University, Tian Jin, China, 2018. [Google Scholar]
  6. Xu, L.Y.; Li, Y.; Yang, H. The principles and methods of conservation of Ming Great wall fortifications: A case study of Great wall in Xuliu area, Hebei Province. Archi. J. 2019, S01, 188–193. (In Chinese) [Google Scholar]
  7. Meng, B.L.; Chen, W.W. Disease analysis of the remains of the Great Wall in Gulang and suggestions for protection and reinforcement measures. J. Chifeng Univ. (Nat. Sci. Ed.) 2012, 7, 3. (In Chinese) [Google Scholar]
  8. Wang, H.Y. Collapse simulation of the wall based on ANSYS/LS-DYNA. Master’s Thesis, Hebei University of Architecture, Zhang Jiakou, China, 2020. [Google Scholar]
  9. Wang, Y.; Ibarra, L.; Pantelides, C. Collapse capacity of reinforced concrete skewed bridges retrofitted with buckling-restrained braces. Eng. Struct. 2019, 184, 99–114. [Google Scholar] [CrossRef]
  10. Cao, P.N. Structural and seismic performance of embrasured watchtower atop Yongning gate of Xi’an ancient city wall. Master’s Thesis, Xi’an University of Architecture and Technology, Xi’an, China, 2015. [Google Scholar]
  11. Lynn, K.M.; Isobe, D. Structural collapse analysis of framed structures under impact loads using ASI-Gauss finite element method. Int. J. Impact Eng. 2007, 34, 1500–1516. [Google Scholar] [CrossRef] [Green Version]
  12. Aydin, A.C.; Zkaya, S.G. The finite element analysis of collapse loads of single-spanned historic masonry arch bridges (Ordu, Sarpdere Bridge). Eng. Fail. Anal. 2018, 84, 131–138. [Google Scholar] [CrossRef]
  13. Fu, F. Progressive collapse analysis of high-rise building with 3-D finite element modeling method. Steel Constr. 2011, 65, 1269–1278. [Google Scholar] [CrossRef]
  14. Kabele, P.; Pokorný, T.; Koska, R. Finite Element Analysis of Building Collapse during Demolition. Czech Technical University in Prague, Prague, Czech Republic. 2003. Available online: https://e-pub.uni-weimar.de/opus4/frontdoor/deliver/index/docId/316/file/M_138_pdfa.pdf (accessed on 9 December 2022).
  15. Bermejo, M.; Santos, A.P.; Goicolea, J.M. Development of practical finite element models for collapse of reinforced concrete structures and experimental validation. Shock Vibr. 2017, 2017, 1–9. [Google Scholar] [CrossRef] [Green Version]
  16. Pagnoni, T. Seismic analysis of masonry and block structures with the discrete element method. In Proceedings of the 10th European Conference on Earthquake Engineering, Vienna, Austria, 28 August–2 September 1994. [Google Scholar]
  17. Cundall, P.A. A computer model for simulating progressive, large-scale movement in blocky rock system. In Proceedings of the International Society for Rock Mechanics, Nancy, France, 4–6 October 1971. [Google Scholar]
  18. Cundall, P.A.; Hart, R.D. Numerical modeling of discontinua. Anal. Des. Methods 1993, 231–243. [Google Scholar] [CrossRef]
  19. Lemos, J.V. Discrete element modeling of masonry structures. Int. Arch. Herit. 2007, 1, 190–213. [Google Scholar] [CrossRef]
  20. Chen, W.; Konietzky, H.; Liu, C. Prediction of brickwork failure using discrete-element method. J. Mater. Civil Eng. 2018, 30, 06018012. [Google Scholar] [CrossRef]
  21. Lemos, J.V.; Sarhosis, V. Discrete element bonded-block models for detailed analysis of masonry. Infrastructures 2022, 7, 31. [Google Scholar] [CrossRef]
  22. Melbourne, C.; Gilbert, M.; Wagstaff, M. The collapse behaviour of multispan brickwork arch bridges. Struct. Eng. 1997, 75, 297–305. [Google Scholar]
  23. Pulatsu, B.; Erdogmus, E.; Lourenço, P.B.; Lemos, J.V.; Tuncay, K. Simulation of the in-plane structural behavior of unreinforced masonry walls and buildings using DEM. Structures 2020, 27, 2274–2287. [Google Scholar] [CrossRef]
  24. Roberti, G.M.; Calvetti, F. Distinct element analysis of stone arches. In Proceedings of the Arch Bridges, Italy, Venice, 6–9 October 1998. [Google Scholar]
  25. Mayorca, P.; Meguro, K. Modeling masonry structures using the applied element method. Seisan Kenkyu 2003, 55, 581–584. [Google Scholar]
  26. Simon, J.; Bagi, K. Discrete element analysis of the minimum thickness of oval masonry domes. Int. J. Arch. Herit. 2014, 10, 457–475. [Google Scholar] [CrossRef]
  27. Itasca Consulting Group. 3DEC Distinct-element Modeling of Jointed and Blocky Material in 3D. 2022. Available online: https://www.itascacg.com/software/3DEC (accessed on 1 December 2022).
  28. Millington, I.; Mi, L.D.; Xu, M.L. Game Physics Engine Development; Tsinghua University Press: Beijing, China, 2013. (In Chinese) [Google Scholar]
  29. Kostack, K.; Walter, O. Bullet Constraints Builder for Collapse Simulation. 2015. Available online: https://www.youtube.com/watch?v=Razr6RJ5-B4&t=432s (accessed on 9 December 2022).
  30. Bullet. Bullet Real-Time Physics Simulation. 2022. Available online: https://pybullet.org/wordpress/ (accessed on 1 January 2022).
  31. Wang, X.; Wang, X.J.; Dong, Y.Q. Visual simulation for structure continuous collapse based on discrete element method and physical engine. J. Vibr. Shock 2020, 39, 9. [Google Scholar]
  32. Zheng, Z.; Tian, Y.; Yang, Z. Hybrid framework for simulating building collapse and ruin scenarios using finite element method and physics engine. Appl. Sci. 2020, 10, 4408. [Google Scholar] [CrossRef]
  33. Orr, A. Damage and vulnerability analysis of debris slide impacts to buildings through analytical methods. Master Thesis, University of Twente, Enschede, The Netherlands, 2019. [Google Scholar]
  34. Abu-Haifa, M.; Lee, S.J. Image-based modeling-to-simulation of masonry walls. J. Arch. Eng. (ASCE) 2022, 28, 06022001. [Google Scholar] [CrossRef]
  35. Hu, D.; Chen, J.; Li, S. Reconstructing unseen spaces in collapsed structures for search and rescue via deep learning based radargram inversion. Autom. Constr. 2022, 140, 104380. [Google Scholar] [CrossRef]
  36. Fita, J.L.; Besuievsky, G.; Patow, G. Earthquake simulation on ancient masonry buildings. J. Comput. Cult. Herit. 2020, 13, 1–8. [Google Scholar] [CrossRef]
  37. Kapliński, O. Architecture: Integration of Art and Engineering. Buildings 2022, 12, 1609. [Google Scholar] [CrossRef]
  38. Zhang, X.; Zhi, Y.; Xu, J.; Han, L. Digital Protection and Utilization of Architectural Heritage Using Knowledge Visualization. Buildings 2022, 12, 1604. [Google Scholar] [CrossRef]
  39. Ou, W.; Chen, X.; Chan, A.; Cheng, Y.; Wang, H. FDEM Simulation on the Failure Behavior of Historic Masonry Heritages Subjected to Differential Settlement. Buildings 2022, 12, 1592. [Google Scholar] [CrossRef]
  40. Croce, P.; Landi, F.; Puccini, B.; Martino, M.; Maneo, A. Parametric HBIM Procedure for the Structural Evaluation of Heritage Masonry Buildings. Buildings 2022, 12, 194. [Google Scholar] [CrossRef]
  41. Fobiri, G.; Musonda, I.; Muleya, F. Reality Capture in Construction Project Management: A Review of Opportunities and Challenges. Buildings 2022, 12, 1381. [Google Scholar] [CrossRef]
  42. Liu, Z.; Lu, Y.; Peh, L.C. A review and scientometric analysis of global building information modeling (BIM) research in the architecture, engineering and construction (AEC) industry. Buildings 2019, 9, 210. [Google Scholar] [CrossRef] [Green Version]
  43. Baggio, C.; Trovalusci, P. Stone assemblies under in-plane actions. Comparison between nonlinear discrete approaches. In Computer Methods Struct Masonry-3; Academic Press: Swansea, UK, 1995; Volume 3, pp. 184–193. [Google Scholar]
  44. Gao, Y.Q.; He, Y.F.; Yu, J.Q. Improved collision detection algorithm based on AABB. Comput. Eng. Des. 2007, 28, 3. [Google Scholar]
  45. Munjiza, A.; Andrews, K. NBS contact detection algorithm for bodies of similar size. J. Numer. Methods Eng. 1998, 43, 131–149. [Google Scholar] [CrossRef]
  46. Munjiza, A.; Rougier, E.; John, N. MR linear contact detection algorithm. Int. J. Numer. Methods Eng. 2006, 66, 46–71. [Google Scholar] [CrossRef]
  47. Wang, L.W. Improvement AABB surrounds examination calculate way of collision box. Comput. Eng. Appl. 2007, 43, 234–236. [Google Scholar]
  48. Wang, X.R.; Wang, M.; Li, C.G. Research on collision detection algorithm based on AABB bonding volume. Comput. Eng. Sci. 2010, 32, 59–61. [Google Scholar]
  49. GB/T 2542-2012; Test Methods for Wall Bricks. China Building Materials Federation: Beijing, China, 2012.
Figure 1. Photos and elements of the Great Wall: (a) Long shot; (b) Close shot.
Buildings 12 02224 g001
Figure 2. Typical numerical cross section of the Great Wall.
Buildings 12 02224 g002
Figure 3. Base wall configurations and components.
Buildings 12 02224 g003
Figure 4. Pictures and components of the base wall’s interior side: (a) Watchtower; (b) Side wall.
Buildings 12 02224 g004
Figure 5. Parapet of the Great Wall: (a) Side view; (b) Detail.
Buildings 12 02224 g005
Figure 6. Flat section of the Great Wall: (a) Normal stone layer of the base wall; (b) Stone layer collapse.
Buildings 12 02224 g006
Figure 7. Slope section of the great wall: (a) Normal; (b) Collapsed steps.
Buildings 12 02224 g007
Figure 8. Parapet failures (a) Gradual collapse; (b) Wythe detachment.
Buildings 12 02224 g008
Figure 9. Bulging base wall.
Buildings 12 02224 g009
Figure 10. Three-dimensional sketch of AABB bounding box.
Buildings 12 02224 g010
Figure 11. Sketch of the mortar joint shear tests.
Buildings 12 02224 g011
Figure 12. Test setup of mortar joint shear.
Buildings 12 02224 g012
Figure 13. Load–displacement curve for the mortar shear test.
Buildings 12 02224 g013
Figure 14. Load–displacement curves of the mortar joint friction tests.
Buildings 12 02224 g014
Figure 15. Flat section model of the Great Wall.
Buildings 12 02224 g015
Figure 16. Sloped section model of the Great Wall.
Buildings 12 02224 g016
Figure 17. Comparison of base wall bulging: (a) Site picture; (b) Simulation.
Buildings 12 02224 g017
Figure 18. Comparison of parapet wall collapse: (a) Site picture; (b) Simulation.
Buildings 12 02224 g018
Figure 19. Stone layer collapse in a flat section: (a) Initial; (b) Final; (c) Final without left retaining wall; (d) Final without right retaining.
Buildings 12 02224 g019
Figure 20. Steps collapse in a sloped section: (a) Initial; (b) In process; (c) Final.
Buildings 12 02224 g020
Figure 21. Parapet wall inward tilting: (a) Initial; (b) Final.
Buildings 12 02224 g021
Figure 22. Stone layer bulge with wythe detachment: (a) Initial; (b) In progress; (c) Final.
Buildings 12 02224 g022
Table 1. Material input parameters.
NameDimension (mm)Quality (kg/unit)FrictionGlue Strength (MPa)
Structural brick 370 × 170 × 80 12.10.860.36
Cap brick 370 × 343 × 110 21.50.860.36
Carriageway brick 370 × 170 × 80 12.10.860.36
Stone about   1060 × 170 × 320 1450.860.36
Earth--0.320.10
Publisher’s Note: MDPI stays neutral with regard to jurisdictional claims in published maps and institutional affiliations.

