Article

A Novel Structural Damage Identification Method Using a Hybrid Deep Learning Framework

1
School of Computer Engineering, Chongqing College of Humanities, Science & Technology, Chongqing 401524, China
2
School of Business, Chongqing College of Humanities, Science & Technology, Chongqing 401524, China
3
School of Civil Engineering, Chongqing University, Chongqing 400045, China
*
Author to whom correspondence should be addressed.
Buildings 2022, 12(12), 2130; https://doi.org/10.3390/buildings12122130
Submission received: 21 October 2022 / Revised: 25 November 2022 / Accepted: 30 November 2022 / Published: 4 December 2022
(This article belongs to the Special Issue Structural Health Monitoring of Buildings, Bridges and Dams)

Abstract

:
In the past few years, structural health monitoring (SHM) has become an important technology to ensure the safety of structures. Structural damage identification methods based on machine learning techniques have gained wide attention due to the advantages of effectively extracting features from monitoring data. However, the existing machine learning-based methods heavily depend on manually selected feature parameters from raw signals. This will cause the selected feature to obtain the optimal solution for a specific condition but may fail to provide a similar performance in other cases. In addition, the feature selection takes a long time, which can fail to achieve real-time performance in a practical structure. To address these problems, this article proposes a hybrid deep learning framework for structural damage identification that includes three components, namely, ensemble empirical mode decomposition (EEMD), Pearson correlation coefficient (PCC), and a convolutional neural network (CNN). The proposed EEMD-PCC-CNN method is capable of automatically extracting features from raw signals to satisfy any damage identification objective. To evaluate the performance of the proposed EEMD-PCC-CNN method, a three-story building structure is investigated. The acceleration signal of the three-story building structure is first analyzed by EEMD. After obtaining the time-frequency information, PCC is utilized to select optimal time-frequency information as the input of the CNN for damage identification. Compared with other classical methods (SVM, KNN, RF, etc.), the experimental results show that the newly proposed EEMD-PCC-CNN method has significant performance advantages in damage identification. In addition, the accuracy of the proposed damage identification method is improved by more than 4% after utilizing EEMD in comparison with CNN alone.

1. Introduction

The safety of civil infrastructures is of the utmost concern to the public because it is prone to damage during service life. Nowadays, SHM is utilized worldwide to maintain civil infrastructure systems to monitor the evolution status of a structure [1,2,3,4]. For example, the SHM system of Sutong Bridge in China has installed 785 sensors and produces 2.5 TB of data each year. Thus, discovering how to effectively mine and utilize SHM data for identifying structural damage has been an important topic [5]. Structural damage identification is generally classified into two categories: model-based [6] and data-driven methods [7]. The model-based method needs to establish the finite element, but boundary conditions and material settings can differ from the actual situation. The result of the finite element model for identifying structural damage is inaccurate. In addition, model-based methods cannot recognize the local damage, and the complex computation and model updating, especially for large-scale structures, is a challenge in SHM [8]. Unlike model-based methods, data-driven methods are inexpensive and only utilize measured data without the need for structural, geometrical, and material information, which has a better promotion in actual engineering. Due to this reason, data-driven methods have drawn much attention from science and industry.
Nowadays, various kinds of data-driven methods have been applied to damage identification, including support vector machine (SVM) [9,10,11], K-nearest neighbor (KNN) [12,13], random forest (RF) [14,15], extreme gradient boosting (XGBoost) [16,17], principal component analysis (PCA) [18,19,20], etc. Wang et al. [21] proposed an improved PCA method to extract damaged features between undamaged and damaged structural responses to identify structural damage. The experimental results showed that PCA exhibited reliable and effective performance in structural damage identification. Leon-Medina et al. [22] proposed a KNN-based algorithm for damage identification. It showed that KNN obtained the best classification accuracy when the isomap algorithm was used as the input of the KNN classification machine. Kourehli et al. [23] presented a least-squares support vector machine (LS-SVM) to evaluate structural damage detection. The result showed that the LS-SVM was sensitive to the location and severity of the structural damage. Lu et al. [24] utilized principal component analysis (PCA) and random forest algorithms to evaluate structural damage. PCA was used to extract the damaged feature from the dynamic response signal. Then, the extracted feature was fed into a random forest algorithm for assessing structural status. The testing result showed that the proposed method was effective. Xu et al. [25] identified damage on a steel girder surface using a restricted Boltzmann machine. The accuracy and ability to identify cracks from new images with different resolutions were validated. Generally, the above methods belong to ‘shallow’ machine learning methods that heavily depend on manually selected feature parameters. It is the best solution for some cases but may generate worse results for other cases [26]. Thus, the ability of feature extraction for damage identification needs to be further improved.
Recently, with computer hardware advances, deep learning has been developed and applied in various application fields. Compared with ‘shallow’ machine learning, deep learning has a significant benefit in the feature-learning field and overcomes the shortcomings of the manual feature. As a commonly used deep learning method, convolutional neural networks (CNNs) have been widely applied in SHM fields. For example, Duan et al. [27] proposed an automatic damage identification method for hanger cables in a tied-arch bridge using a CNN. The method used raw measurement data from Fourier amplitude spectra (FAS), and the results showed that the CNN using FAS data performed better than the CNN using time history data. The robustness of the current CNN has been demonstrated under various observed noise levels and wind speeds. Vu et al. [28] proposed a method for identifying simulated damage in concrete using the CNN method. The method can classify three different damage stages with an overall accuracy of 77%. By analyzing the average envelope of the signals and refining the dataset, the overall accuracy was improved to 90%. Considering that modal frequency is a crucial indicator that facilitates damage diagnosis and condition assessment of long-span bridges, Wang et al. [29] proposed a novel localized thermal–frequency correlation model to remove the temperature interference. The result showed the validity of eliminating the temperature-induced change in modal frequency based on long-term monitoring data of a cable-stayed bridge. Xu et al. [30] proposed an improved region-based convolutional neural network (fast R-CNN) that can automatically identify and localize many types of earthquake damage with an overall average accuracy of 80%. In general, most damage identification studies only use time or frequency information. The feature extraction ability of original data is weak. Developing an extracted method based on time–frequency information for damage identification in building structures is a significant challenge.
Time series data collected from the SHM system have non-stationary and nonlinear characteristics. Ensemble empirical mode decomposition (EEMD), as an improved EMD algorithm, can convert time series to each intrinsic mode functions (IMF) component, including time and frequency information, namely time-frequency information, which can be used as the input of deep learning. Thus, many scholars study EEMD-based algorithms for damage identification. For example, Chen et al. [31] presented an EEMD-LSTM for predicting missing measured data. The experimental results showed the proposed method could predict missing raw acceleration data of a liquefied natural gas (LNG) storage tank. Zhai et al. [32] proposed a new gas consumption prediction method based on EEMD and the backpropagation neural network, which has a unique superiority in data analysis. Considering the advantages of EEMD, this study proposes a hybrid deep learning framework based on EEMD-PCC-CNN for structural damage identification, where EEMD converts time series data into IMF components with time-frequency information. Then, the PCC method selects optimal time-frequency information as the input of CNN for damage identification. Finally, a three-story building structure is utilized to evaluate the effectiveness of the proposed method.
The main contributions of this paper are as follows: (1) A hybrid deep learning framework for structural damage identification is proposed based on the EEMD-PCC-CNN method, which can automatically extract features from raw signals to recognize damage conditions. (2) The PCC method is applied to analyze the correlation between every IMF, residual sequence, and raw acceleration data, which can reduce the dimensions of input samples and improve the training efficiency of EEMD-PCC-CNN. (3) Compared with the classical CNN, SVM, KNN, RF, and XGBoost methods, the experimental results show that the newly proposed EEMD-PCC-CNN has significant performance advantages in damage identification.
The remainder of this article is expanded in the following sections. Section 2 introduces the procedure of a hybrid deep learning framework for damage identification based on EEMD-PCC-CNN. Section 3 presents the training procedure of EEMD-PCC-CNN. Section 4 builds a dataset to verify the feasibility and effectiveness of the proposed method. Section 5 discusses the performance between the proposed method and the classical method. Section 6 concludes this study and discusses future work.

2. Proposed EEMD-PCC-CNN Architecture

Figure 1 depicts a hybrid deep learning framework for damage identification based on EEMD-PCC-CNN. It mainly includes three parts: data acquisition and preprocessing, obtaining time-frequency information, and damage identification based on EEMD-PCC-CNN. Firstly, acceleration sensors installed in a structure collect massive monitoring data. Then, a fixed sliding window is utilized to split acceleration data to obtain datasets [33]. Secondly, the EEMD method converts datasets under damaged conditions into IMF and a residual sequence that includes time-frequency information. To obtain optimal time-frequency information, the PCC method is applied to analyze the correlation between every IMF, residual sequence, and raw acceleration data [34]. The larger correlation value indicates that IMF or the residual sequence has more time-frequency information, which can be selected as the input of the CNN. The lower correlation value is removed, which not only improves the accuracy of damage identification, but also decreases the sample dimension fed into the CNN to improve training efficiency. Finally, the optimal time-frequency information is fed into the CNN to extract features for damage identification. During the training procedure, the CNN has three main layers, namely, a convolutional layer, a pooling layer, and a fully connected layer. The convoluting and pooling layers extract representative features from the time-frequency information. Then, the extracted features are fed into a fully connected network with a ‘softmax’ activation function to identify the structural damage. In addition, the loss function is applied to iterate and update the CNN parameters via training datasets continuously. The CNN finishes the renewal of model parameters and the training procedure when the model obtains a preferred result of structural damage identification on validation datasets. The testing datasets are fed into the trained CNN to assess structural damage.

2.1. Ensemble Empirical Mode Decomposition Layer

Ensemble empirical mode decomposition (EEMD) is a signal processing method proposed by Flandrin et al. [35] that uses white noise signals as an auxiliary process. EEMD is a modification of empirical mode decomposition (EMD) and is well-suited for processing time-series data with non-smoothness and nonlinear properties, such as structural vibration response information [36]. The EEMD operation procedure consists of the following several aspects. Firstly, the white noise of uniform amplitude is added to the original signal. Then, the EMD method decomposes the signal into several intrinsic mode functions (IMF) components and a residual sequence. Since the original signal has the property of a uniform spectral distribution after adding white noise, the signals with different time scales will be automatically distributed to the appropriate reference scale, thus overcoming the mode mixing problem that easily occurs in the EMD method. At the same time, the fitting error problem of the envelope above and below the signal extremum is also overcome so that the IMF components closest to the real values are obtained. The specific process of the EEMD method is as follows.
(1) The white noise sequence is added to the original sequence s t to obtain the new sequence x j t .
x j t = s t + n j t
where n j t is the jth added white noise sequence.
(2) The EMD method decomposes x j t to obtain a residual sequence r j t and several IMF components c i j t .
(3) Repeat step (1) and step (2) for N times with a new white noise sequence added to the original sequence each time, which can obtain N sets of IMF components c i j t and residual sequences r j t .
(4) The mean values of N group c i j t and r j t based on EMD decomposition are calculated respectively.
c i t = 1 N j = 1 N c i j t
r t = 1 N j = 1 N r j t
After the above operation, the N group IMF components and the residual sequence are averaged so that the white noise with zero mean added to the original sequence is eliminated. Therefore, the result obtained by EEMD decomposition of the original sequence is the same as its sequence itself.
(5) The final EEMD decomposition results are described as follows:
s t = j = 1 n c i t + r t
where n denotes the number of IMF components.

2.2. Convolutional Layer

In the convolutional layer, the convolution kernel is utilized to extract the time-frequency features from decomposed data based on EEMD. It uses a fixed stride to slide the decomposed data and convolve with the data until all the receptive fields are traversed. Thus, the output feature can be obtained. The procedure of the convolutional layer reduces the model parameters and increases the efficiency of the network, which is expressed in b.
C j = f s t W j
C = C 1 , C 2 , , C j , , C K C
where s t is the decomposed data based on EEMD; W j is the convolutional kernel; ∗ represents the convolutional operation; f · denotes activation function; C j is the jth output result based on the convolutional operation; and C represents a combination of pooling layers.

2.3. Pooling Layer

After the convolutional layer, the dimension of the output feature remains large and can lead to an overfitting phenomenon during the training procedure. Thus, the pooling layer is introduced to ensure the invariance of feature maps and further reduce the dimension of the feature maps. Max-pooling operations are used in this study, which is described as follows.
P j = M a x P o o l i n g C j
P = P 1 , P 2 , , P j , , P N
where C j is jth convolutional layer, P j is the pooling result of jth convolutional layer, and P represents the combination of pooling layers.

2.4. Fully Connected Layer

Subsequently, the feature extracted by convolution and pooling operations is fed into two fully connected layers. For two fully connected layers, the feature output of the previous fully connected layer is used as the input of the next layer. The final fully connected layer with a softmax activation function is applied to predict the structural damage conditions. It can be expressed as:
y f = P l T w + b
c i = S o f t m a x y f i = e y i f j = 1 N c e y j f
D = a r g m a x i 1 , , N c c i
where y f is the output result of fully connected layer; w, b represents the weight matrix and bias vector; c i = P D = i X is the prediction probability of the ith damaged condition; and D is the final classification result.

3. Structural Damage Identification Method Using Proposed EEMD-PCC-CNN Architecture

For real-time monitoring data, the proposed EEMD-PCC-CNN method has non-stationary and nonlinear properties. This study proposed the EEMD-PCC-CNN method for damage identification based on monitoring data, as shown in Figure 2. Firstly, the datasets are randomly divided into training, validation, and testing datasets with a ratio of 6:2:2. The EEMD, in the proposed method, converts time signal s t into several components including several IMF and residual sequences with time-frequency information. The PCC method is applied to select optimal time-frequency information. During the training procedure of EEMD-PCC-CNN, the optimal time-frequency information is fed into the convolutional and max-pooling layers to extract features. Subsequently, the output feature map P is fed into fully connected networks to predict structural damage conditions D . To reduce overfitting problems, dropout is added to a fully connected network. Finally, considering that the optimizer Adam combines the momentum algorithm and the RMS (rate-monotonic scheduling) prop algorithm, it is utilized to update the parameters of the EEMD-PCC-CNN in every iteration. The initial learning rate is 0.001. The updated Adam procedure is described as follows:
m t = β 1 m t 1 + 1 β g t
v t = β 2 v t 1 + 1 β 2 g t 2
m ^ t = m t 1 β 1 t
v ^ t = v t 1 β 2 t
θ t + 1 = θ t η v ^ t + ε m ^ t
where β 1 t   and β 2 t are set as 0.9 and 0.99; ε is set to 1 × 10⁻⁸; and g t is the gradient.
The dropout value in the fully connected layer is set to 0.5, and the batch size is set to 512 during the training procedure. The cross-entropy function to evaluate the training results is described as follows:
C r o s s E n t r o p y = K = 1 N P K × log   Q k
where Q k and P K represent the predicted value and the real value. If the cross-entropy function is low, it reflects that EEMD-PCC-CNN has an excellent performance in structural damage identification.

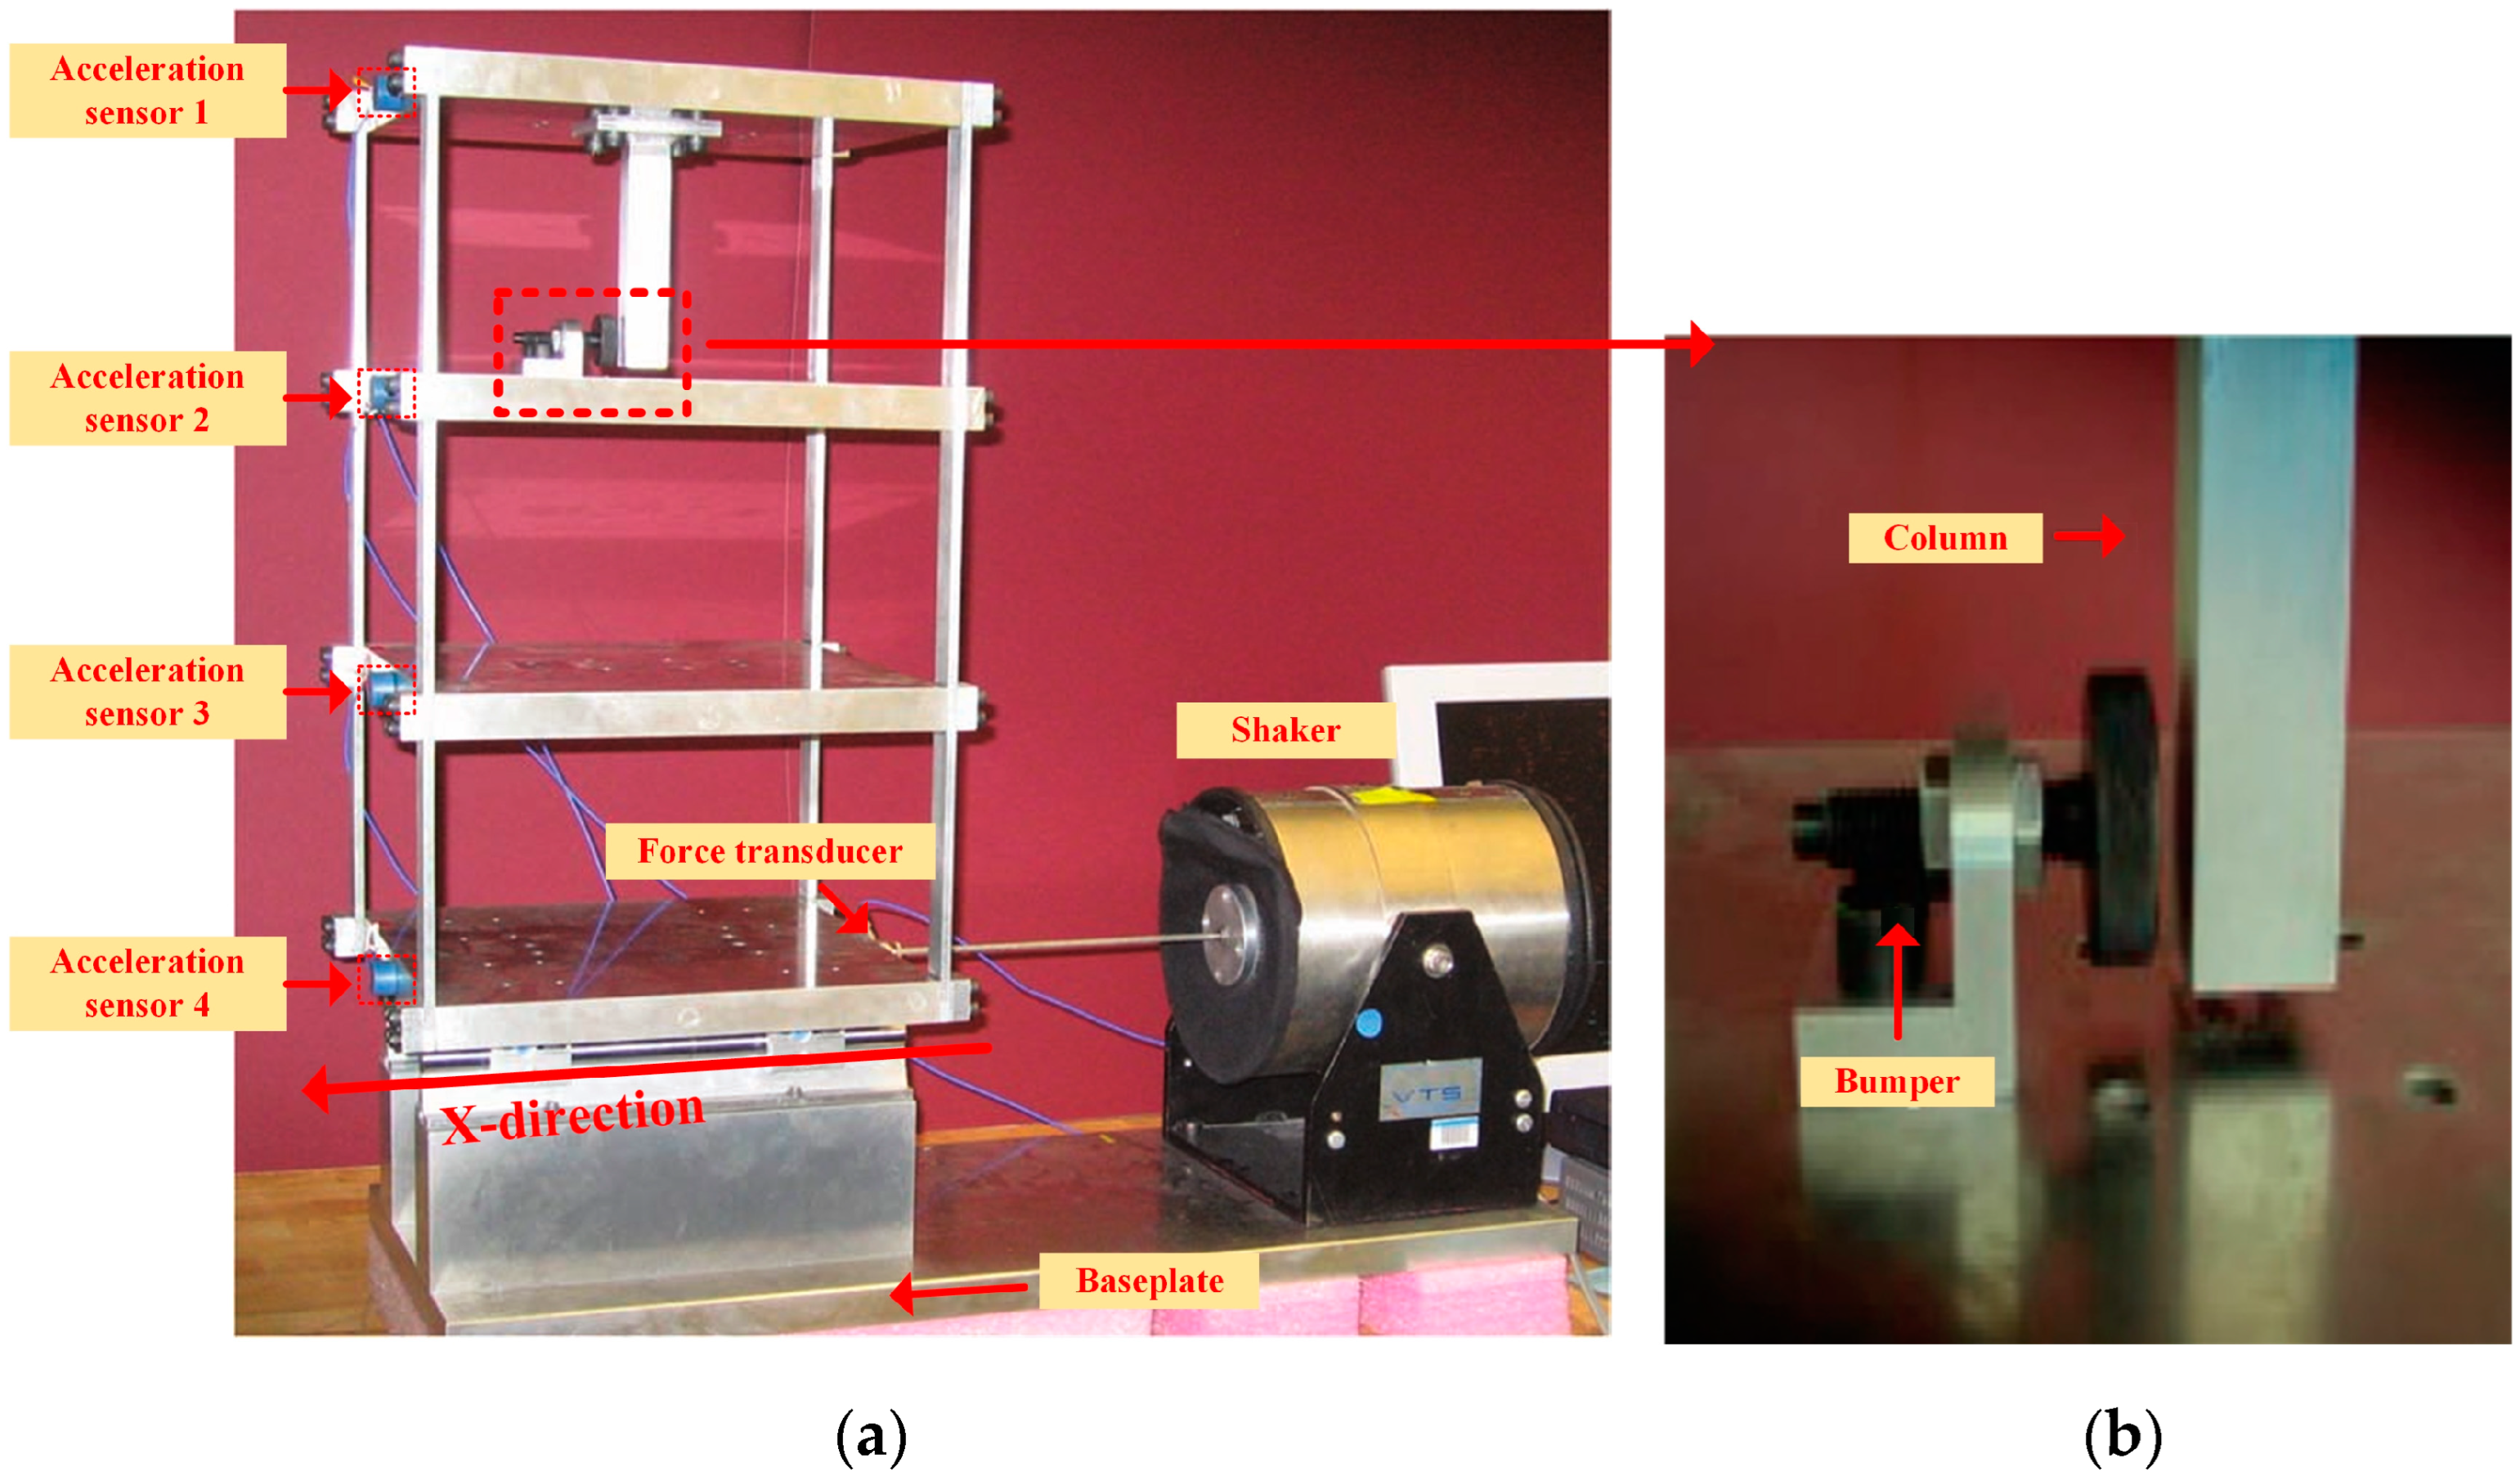
4. Experimental Setups and Data Description

This section mainly introduces a three-story building structure, experimental settings, the flow of EEMD decomposition, and evaluation criteria.

4.1. Data Description

A three-story building structure is used as the baseline benchmark for damage identification, as shown in Figure 3 [37,38]. The structure consists of two parts: an aluminum plate and an aluminum column, connected by bolts with a rigid foundation. At each floor, four aluminum columns are attached to the top and bottom panels, forming a four degree-of-freedom system. In addition, the central column is suspended at the top floor, and a nonlinearity effect can be produced by varying the gap between the buffer and the central column. The structure slides on rails are only moved in the x-direction. A force transducer is utilized to measure input force from the shaker.
The experimental procedure of the structure is as follows. Firstly, the shaker mounted on a baseplate provides excitation to the bottom of the structure with a level of 2.6 V. Then, Dacron Spectralbook FFT Analyzer is utilized to obtain measured data. The sampling interval and frequency are 3.1 ms and 322.58 Hz, respectively. The fixed sliding window is set to 324. According to the different structural state conditions, it can be divided into four states, namely, C1, C2, C3, and C4, as shown in Table 1. The C1 state represents that the gap between the bumper and the suspended column is varied (0.05, 0.10, 0.13). C2 denotes that the gap is increased at the same time, and a 1.2 kg mass is added to the first floor and base. C3 represents that the stiffness of a selected column is reduced by 50%. C4 represents a 50% reduction in the stiffness of several columns.
The original curves obtained from acceleration sensor four under different structural conditions are shown in Figure 4. It can be seen that acceleration data changes with increasing structural damage. The EEMD-PCC-CNN, as a data-driven method, can effectively extract damaged features from acceleration data for damage identification. In addition, the four types of damage conditions can be divided into the training, testing, and validation datasets with a ratio of 6:2:2. The samples number of training, validation, and test datasets are 7883, 2630, and 2627, respectively.

4.2. EEMD Decomposition Results of Acceleration Data

Acceleration data under different damage conditions are decomposed to obtain time–frequency information using EEMD. Figure 5 depicts that these series are sorted according to the order from highest to lowest frequency.
As shown in Figure 6 and Table 2, optimal time–frequency information not only improves the accuracy of damage identification but also reduces input dimensions of the CNN to improve training efficiency. EEMD converts time series into several IMF components and a residual sequence. The PCC method is applied to analyze the correlations between the component and acceleration data. Subsequently, all correlation values are averaged to obtain the correlation coefficient graph. The larger correlation value indicates that the IMF or residual sequence has more time-frequency information. High mean correlation values corresponding to the IMF or residual sequence are selected as the input of the CNN.
It can be seen from the results shown in Table 2 that the mean correlation coefficient from the IMF1 component to the residual component gradually decreases. To be specific, the correlation coefficient between the IMF1 component and the original acceleration signal is close to 1.0, representing that it contains more time-frequency information. IMF1 can be selected as the input of the CNN. Table 2 depicts the mean correlation coefficients of eight components. The mean correlation values of IMF1-IMF4 are more than 0.01, which is selected as the study of structural damage. Finally, the IMF1-IMF4 components are recorded as the feature matrix, which is marked as follows.
E I M F = E I M F 1 ,   E I M F 2 ,     E I M F 3 ,   E I M F 4
where E I M F 1 represents the IMF1 component. E I M F represents a combination of all selected IMF components. E I M F is fed into the CNN for damage identification.

4.3. Evaluation Metric

Four standard evaluation metrics, namely, accuracy, precision, recall, and F1-score, are used to evaluate the performance of the damage identification. Accuracy represents the overall performance of the classification methods, and higher accuracy represents better classification. Precision, Recall, and F1-score represent the classification accuracy for each category. These evaluation metrics are formulated as follows:
A c c u r a c y   = T P + T N T P + F P + T N + F N
P r e c i s i o n   = T P T P + F P
R e c a l l   = T P T P + F N
F 1 - s c o r e   = 2 ×   P r e c i s i o n   ×   R e c a l l     P r e c i s i o n   +   R e c a l l  
where T P , F P , T N , F N indicate true positive, false positive, true negative, and false negative, respectively.

5. Experimental Results and Discussion

To validate the effectiveness of the proposed method in this study, the EEMD-PCC-CNN method is tested on a three-story building structure compared with classical damage identification methods, including CNN, SVM, KNN, RF, and XGBoost.

5.1. Experimental Results of the Proposed EEMD-PCC-CNN

For setting the parameters of EEMD-PCC-CNN, only the CNN parameters need to be set. The parameters of EEMD-PCC-CNN are shown in Table 3, and there is a total of six layers. In the first layer, the size of a convolution kernel is 4 × 120 where 4 represents the IMF components, and 120 is the window width of the convolution kernel. The stride of the convolutional kernel is set to one. Then, obtained feature matrix based on convolution 1 operation is used as the input of the max-pooling second layer. The size of stride is set to four in maximum pooling. Then, the extracted feature is used as the input of convolution 3. In the third layer, the convolutional kernel size is set to 1 × 10. The filter number is set to sixty. Subsequently, the feature is fed into fully connected layers 4 and 5 with 128 and 64 neurons. The activation function of each layer is ReLU. Finally, the damage identification results are output by the fully connected layer 6 using the softmax activation function.
To further validate the superior performance of EEMD-PCC-CNN in structural damage identification, the method is applied to a three-story building structure for testing. The damage identification accuracy curves are shown in Figure 7, from which it can be intuitively shown that the accuracy of the validation dataset will increase gradually with the accuracy of the training dataset. When the iteration number is 200, the accuracy of validation datasets is more than 0.9, indicating that the EEMD-PCC-CNN method has a robust learning and fitting ability. The damage identification loss curves are shown in Figure 8, from which it can be intuitively observed that the validation dataset decreases continuously with the loss of the training dataset. The loss curves show a smooth trend, proving an excellent fitting ability.

5.2. Compared with Other Methods

To further verify superiority of EEMD-PCC-CNN in structural damage identification, it is compared with classical CNN, SVM, KNN, RF, and XGBoost methods.
Moreover, to obtain optimal hyper-parameter tuples in this study, the grid search is utilized to optimize the hyper-parameters for different methods, which is an exhaustive search through a subset of the searching space of the parameters. Table 4 shows the searching space of the hyper-parameters and the corresponding optimal values.
The results of each method in terms of accuracy, precision, recall, and F1-score are shown in Table 5. It shows that the proposed EEMD-PCC-CNN method achieved the highest evaluation result among comparison methods. The EEMD-PCC-CNN achieves accuracy in 94.02%, precision in 92.92%, recall in 92.69%, and F1-score in 92.80%. The main reason is that the EEMD-PCC-CNN method effectively captures time-frequency features from acceleration data, while the comparison methods only capture a single time or frequency feature. In particular, compared with the CNN method, the EEMD-PCC-CNN improves by 4.34%, 4.52%, 5.54%, and 5.11% in accuracy, precision, recall, and F1-score, respectively. The result shows the effectiveness of EEMD decomposition, and EEMD-PCC-CNN based on time-frequency information significantly improves the accuracy of damage identification. Compared with SVM, KNN, RF, and XGBoost methods, the accuracy of EEMD-PCC-CNN is improved by at least 8%.
The specific results of the six methods for four damage conditions are shown in Figure 9 and Table 6, where the EEMD-PCC-CNN method presents an excellent ability to distinguish the structural damage conditions. The precision, recall, and F1-score values of EEMD-PCC-CNN are above 90% in C1, C3, and C4. These metrics are relatively lower, all at 85.40% under C2. For other methods, including CNN, SVM, KNN, RF, and XGBoost, SVM achieves recall in 99.31% under C1, and RF achieves accuracy in 92.86% under C2. However, the above method has lousy accuracy in other conditions. In general, the proposed EEMD-PCC-CNN method has a reliable and higher accuracy than the comparison methods.
To analyze the ability of damage identification in each category, the confusion matrix of EEMD-PCC-CNN and other compared methods is shown in Figure 10. It can be seen that the accuracy of the damage condition for each category is more than 85% using EEMD-PCC-CNN method. To be specific, for C1 and C4, the sample numbers of each category are 1027, 593, and 603, and the correct numbers are 988, 547, and 590. The precision of C1, C3, and C4 are 96.20%, 92.24%, and 97.84%. The total classification accuracy is more than 90%, indicating that EEMD-PCC-CNN has a high classification accuracy. For C2, there are 404 samples where the correct number is 345. The precision of C2 reaches 85.40%. The effect of classification is also acceptable. The damage recognition ability of other methods is lower than that of EEMD-PCC-CNN in C1-C4. This further indicates that the EEMD-PCC-CNN method significantly improves the accuracy of damage identification.

6. Conclusions and Future Work

This study proposes a hybrid deep learning framework for damage identification based on the EEMD-PCC-CNN method. EEMD is responsible for acquiring time-frequency information from monitoring data. PCC selects optimal time-frequency information as the input of the CNN for damage identification. A three-story building structure verifies the effectiveness of the proposed method. The following is a summary of the main findings of this study.
(1) The proposed hybrid framework using EEMD-PCC-CNN to deeply mine the features of building structures not only can significantly improve the accuracy in structural damage identification, but also avoids the feature selection of traditional identification methods.
(2) The PCC selects optimal time-frequency information from components decomposed by EEMD as the input of the CNN, which can reduce the dimensions of input samples and improve the training efficiency of EEMD-PCC-CNN.
(3) The experimental comparison between the EEMD-PCC-CNN and CNN methods shows that acceleration data analyzed by EEMD-PCC are fed into CNN, whose accuracy is improved by 4.34% in damage identification. This indicates that EEMD-PCC-CNN based on time-frequency features can improve the accuracy of structural damage identification in comparison with only the feature extraction method.
(4) Compared with the classical CNN, SVM, KNN, RF, and XGBoost methods that are often used in the direction of damage identification, the EEMD-PCC-CNN method has the highest accuracy of 94.02%, which guarantees the performance of the method in practical applications.
(5) The EEMD-PCC-CNN method proposed in this study also has some limitations. Compared to machine methods such as SVM, KNN, and RF, the method requires a large amount of training data to improve damage recognition accuracy. Therefore, migration learning methods can be utilized to simplify training for accurate identification of future structural damage detection. In addition, the dataset used in this study is the acceleration signal of a three-story building structure, while a large number of different types of sensors are deployed on the actual structure to obtain data, including deflection, stress, strain, etc. Therefore, multimodal fusion of different data can be performed to further improve the accuracy of the method.

Author Contributions

Writing—original draft preparation, Y.H.; data curation, Z.H.; methodology, L.Z.; validation, D.L.; investigation, Y.L.; funding acquisition, Y.H. All authors have read and agreed to the published version of the manuscript.

Funding

The work described in this paper was supported by the Science and Technology Research Program of Chongqing Municipal Education Commission (Grant No. KJQN202201805, KJZD202001801), the Science and Technology Research Program of Chongqing College of Humanities, Science & Technology (Grant No. CRKZK2022006, JSJGC202201), Chongqing Education Science Planning Project (Grant No. 2017-GX-155) and the Teaching Reform Project of Chongqing College of Humanities, Science & Technology (Grant No. 21CRKXJJG25).

Institutional Review Board Statement

Not applicable.

Informed Consent Statement

Not applicable.

Data Availability Statement

The data used to support the findings of this study are available from the corresponding author upon request.

Conflicts of Interest

The authors declare there are no conflict of interest.

References

  1. Li, H.; Ou, J. The State of the Art in Structural Health Monitoring of Cable-Stayed Bridges. J. Civ. Struct. Health Monit. 2016, 6, 43–67. [Google Scholar] [CrossRef]
  2. Hackell, M.W.; Rolfes, R.; Kane, M.B.; Lynch, J.P. Three-Tier Modular Structural Health Monitoring Framework Using Environmental and Operational Condition Clustering for Data Normalization: Validation on an Operational Wind Turbine System. Proc. IEEE 2016, 104, 1632–1646. [Google Scholar] [CrossRef]
  3. Yang, C.; Liang, K.; Zhang, X. Strategy for Sensor Number Determination and Placement Optimization with Incomplete Information Based on Interval Possibility Model and Clustering Avoidance Distribution Index. Comput. Methods Appl. Mech. Eng. 2020, 366, 113042. [Google Scholar] [CrossRef]
  4. An, H.; Youn, B.D.; Kim, H.S. A Methodology for Sensor Number and Placement Optimization for Vibration-Based Damage Detection of Composite Structures under Model Uncertainty. Compos. Struct. 2022, 279, 114863. [Google Scholar] [CrossRef]
  5. Khan, S.; Yairi, T. A Review on the Application of Deep Learning in System Health Management. Mech. Syst. Signal Process. 2018, 107, 241–265. [Google Scholar] [CrossRef]
  6. Ciang, C.C.; Lee, J.-R.; Bang, H.-J. Structural Health Monitoring for a Wind Turbine System: A Review of Damage Detection Methods. Meas. Sci. Technol. 2008, 19, 122001. [Google Scholar] [CrossRef] [Green Version]
  7. Feng, D.; Feng, M.Q. Computer Vision for SHM of Civil Infrastructure: From Dynamic Response Measurement to Damage Detection—A Review. Eng. Struct. 2018, 156, 105–117. [Google Scholar] [CrossRef]
  8. Adewuyi, A.P.; Wu, Z. Vibration-Based Damage Localization in Flexural Structures Using Normalized Modal Macrostrain Techniques from Limited Measurements: Damage Localization Using Normalized Modal Macrostrain. Comput.-Aided Civ. Infrastruct. Eng. 2011, 26, 154–172. [Google Scholar] [CrossRef]
  9. Zidi, S.; Moulahi, T.; Alaya, B. Fault Detection in Wireless Sensor Networks Through SVM Classifier. IEEE Sens. J. 2018, 18, 340–347. [Google Scholar] [CrossRef]
  10. Cuong-Le, T.; Nghia-Nguyen, T.; Khatir, S.; Trong-Nguyen, P.; Mirjalili, S.; Nguyen, K.D. An Efficient Approach for Damage Identification Based on Improved Machine Learning Using PSO-SVM. Eng. Comput. 2022, 38, 3069–3084. [Google Scholar] [CrossRef]
  11. Huang, M.; Lei, Y.; Li, X.; Gu, J. Damage Identification of Bridge Structures Considering Temperature Variations-Based SVM and MFO. J. Aerosp. Eng. 2021, 34, 4020113. [Google Scholar] [CrossRef]
  12. Vitola, J.; Pozo, F.; Tibaduiza, D.; Anaya, M. A Sensor Data Fusion System Based on K-Nearest Neighbor Pattern Classification for Structural Health Monitoring Applications. Sensors 2017, 17, 417. [Google Scholar] [CrossRef] [PubMed] [Green Version]
  13. Okfalisa, O.; Nugraha, S.; Saktioto, S.; Zulkifli, Z.; Fauzi, S.S.M. The Prediction of Earthquake Building Structure Strength: Modified K-Nearest Neighbour Employment. J. Electr. Eng. Inform. 2020, 8, 733–745. [Google Scholar] [CrossRef]
  14. Chencho; Li, J.; Hao, H.; Wang, R.; Li, L. Development and Application of Random Forest Technique for Element Level Structural Damage Quantification. Struct. Control Health Monit. 2021, 28, e2678. [Google Scholar] [CrossRef]
  15. Chun, P.; Yamane, T.; Izumi, S.; Kuramoto, N. Development of a Machine Learning-Based Damage Identification Method Using Multi-Point Simultaneous Acceleration Measurement Results. Sensors 2020, 20, 2780. [Google Scholar] [CrossRef]
  16. Trizoglou, P.; Liu, X.; Lin, Z. Fault Detection by an Ensemble Framework of Extreme Gradient Boosting (XGBoost) in the Operation of Offshore Wind Turbines. Renew. Energy 2021, 179, 945–962. [Google Scholar] [CrossRef]
  17. Leon-Medina, J.X.; Anaya, M.; Parés, N.; Tibaduiza, D.A.; Pozo, F. Structural Damage Classification in a Jacket-Type Wind-Turbine Foundation Using Principal Component Analysis and Extreme Gradient Boosting. Sensors 2021, 21, 2748. [Google Scholar] [CrossRef]
  18. Pozo, F.; Arruga, I.; Mujica, L.E.; Ruiz, M.; Podivilova, E. Detection of Structural Changes through Principal Component Analysis and Multivariate Statistical Inference. Struct. Health Monit. 2016, 15, 127–142. [Google Scholar] [CrossRef] [Green Version]
  19. Massumi, A.; Gholami, F. The Influence of Seismic Intensity Parameters on Structural Damage of RC Buildings Using Principal Components Analysis. Appl. Math. Model. 2016, 40, 2161–2176. [Google Scholar] [CrossRef]
  20. Ruiz, M.; Mujica, L.E.; Sierra, J.; Pozo, F.; Rodellar, J. Multiway Principal Component Analysis Contributions for Structural Damage Localization. Struct. Health Monit. 2018, 17, 1151–1165. [Google Scholar] [CrossRef]
  21. Wang, C.; Guan, W.; Gou, J.; Hou, F.; Bai, J.; Yan, G. Principal Component Analysis Based Three-Dimensional Operational Modal Analysis. Int. J. Appl. Electromagn. Mech. 2014, 45, 137–144. [Google Scholar] [CrossRef]
  22. Leon-Medina, J.X.; Anaya, M.; Tibaduiza, D.A.; Pozo, F. Manifold Learning Algorithms Applied to Structural Damage Classification. J. Appl. Comput. Mech. 2020, 7, 1158–1166. [Google Scholar] [CrossRef]
  23. Kourehli, S.S. Structural Damage Diagnosis Using Incomplete Static Responses and LS-SVM. Inverse Probl. Sci. Eng. 2017, 25, 418–433. [Google Scholar] [CrossRef]
  24. Lu, S.; Li, Q.; Yu, H.; Wang, X. Damage Evaluation Method of CFRP Structures Based on PCA and Random Forest Algorithm. In Proceedings of the 2020 Chinese Automation Congress (CAC), Shanghai, China, 6 November 2020; IEEE: Piscataway, NJ, USA, 2020; pp. 3804–3807. [Google Scholar]
  25. Xu, Y.; Li, S.; Zhang, D.; Jin, Y.; Zhang, F.; Li, N.; Li, H. Identification Framework for Cracks on a Steel Structure Surface by a Restricted Boltzmann Machines Algorithm Based on Consumer-Grade Camera Images. Struct. Control Health Monit. 2018, 25, e2075. [Google Scholar] [CrossRef]
  26. Abdeljaber, O.; Avci, O.; Kiranyaz, S.; Gabbouj, M.; Inman, D.J. Real-Time Vibration-Based Structural Damage Detection Using One-Dimensional Convolutional Neural Networks. J. Sound Vib. 2017, 388, 154–170. [Google Scholar] [CrossRef]
  27. Duan, Y.; Chen, Q.; Zhang, H.; Yun, C.B.; Wu, S.; Zhu, Q. CNN-Based Damage Identification Method of Tied-Arch Bridge Using Spatial-Spectral Information. Smart Struct. Syst. 2019, 23, 507–520. [Google Scholar] [CrossRef]
  28. Vu, G.; Timothy, J.J.; Singh, D.S.; Saydak, L.A.; Saenger, E.H.; Meschke, G. Numerical Simulation-Based Damage Identification in Concrete. Modelling 2021, 2, 355–369. [Google Scholar] [CrossRef]
  29. Wang, Z.; Yi, T.-H.; Yang, D.-H.; Li, H.-N.; Liu, H. Eliminating the Bridge Modal Variability Induced by Thermal Effects Using Localized Modeling Method. J. Bridge Eng. 2021, 26, 4021073. [Google Scholar] [CrossRef]
  30. Xu, Y.; Wei, S.; Bao, Y.; Li, H. Automatic Seismic Damage Identification of Reinforced Concrete Columns from Images by a Region-Based Deep Convolutional Neural Network. Struct. Control Health Monit. 2019, 26, e2313. [Google Scholar] [CrossRef]
  31. Chen, Z.; Yuan, C.; Wu, H.; Zhang, L.; Li, K.; Xue, X.; Wu, L. An Improved Method Based on EEMD-LSTM to Predict Missing Measured Data of Structural Sensors. Appl. Sci. 2022, 12, 9027. [Google Scholar] [CrossRef]
  32. Zhai, H.; Xiong, W.; Li, F.; Yang, J.; Su, D.; Zhang, Y. Prediction of Cold Rolling Gas Based on EEMD-LSTM Deep Learning Technology. Assem. Autom. 2022, 42, 181–189. [Google Scholar] [CrossRef]
  33. Fu, L.; Tang, Q.; Gao, P.; Xin, J.; Zhou, J. Damage Identification of Long-Span Bridges Using the Hybrid of Convolutional Neural Network and Long Short-Term Memory Network. Algorithms 2021, 14, 180. [Google Scholar] [CrossRef]
  34. Jebli, I.; Belouadha, F.-Z.; Kabbaj, M.I.; Tilioua, A. Prediction of Solar Energy Guided by Pearson Correlation Using Machine Learning. Energy 2021, 224, 120109. [Google Scholar] [CrossRef]
  35. Flandrin, P.; Gonçalvès, P.; Rilling, G. Emd Equivalent Filter Banks, from Interpretation to Applications. In Interdisciplinary Mathematical Sciences; World Scientific: Singapore, 2005; Volume 5, pp. 57–74. ISBN 978-981-256-376-7. [Google Scholar]
  36. Huang, N.E.; Shen, Z.; Long, S.R.; Wu, M.C.; Shih, H.H.; Zheng, Q.; Yen, N.-C.; Tung, C.C.; Liu, H.H. The Empirical Mode Decomposition and the Hilbert Spectrum for Nonlinear and Non-Stationary Time Series Analysis. Proc. R. Soc. Lond. A 1998, 454, 903–995. [Google Scholar] [CrossRef]
  37. Gui, G.; Pan, H.; Lin, Z.; Li, Y.; Yuan, Z. Data-Driven Support Vector Machine with Optimization Techniques for Structural Health Monitoring and Damage Detection. KSCE J. Civ. Eng. 2017, 21, 523–534. [Google Scholar] [CrossRef]
  38. Figueiredo, E.; Park, G.; Figueiras, J.; Farrar, C.; Worden, K. Structural Health Monitoring Algorithm Comparisons Using Standard Data Sets; LA-14393, 961604; Los Alamos National Laboratory: Los Alamos, NM, USA, 2009. [Google Scholar]
Figure 1. A hybrid deep learning framework for damage identification based on EEMD-PCC-CNN.
Buildings 12 02130 g001
Figure 2. Flowchart of the proposed EEMD-PCC-CNN for structural damage identification.
Buildings 12 02130 g002
Figure 3. Test structure setup. (a) Three-story building structure; (b) An adjustable bumper.
Buildings 12 02130 g003
Figure 4. The acceleration curves on the three-story building structure.
Buildings 12 02130 g004
Figure 5. Results of EEMD decomposition of the accelerometer. (a) C1; (b) C2; (c) C3; (d) C4.
Buildings 12 02130 g005aBuildings 12 02130 g005b
Figure 6. The procedure of optimal time-frequency selection.
Buildings 12 02130 g006
Figure 7. Accuracy curves of EEMD-PCC-CNN during the training procedure.
Buildings 12 02130 g007
Figure 8. Loss curves of EEMD-PCC-CNN during the training procedure.
Buildings 12 02130 g008
Figure 9. Classification results on the testing dataset for the three-story building structure.
Buildings 12 02130 g009
Figure 10. Confusion matrices of different methods.
Buildings 12 02130 g010
Table 1. Different state conditions of the structure.
Damaged ConditionsState Condition
C1Different gap
C2Different gaps and 1.2 kg mass on the 1st floor
C350% reduction in stiffness of a selected column
C450% reduction in stiffness of several columns
Table 2. Mean correlation coefficient between each component and the original acceleration signal.
Mean Value of ComponentsCorrelation Coefficient
IMF10.921
IMF20.442
IMF30.101
IMF40.070
IMF50.001
IMF60.001
IMF70.000
IMF80.000
Residual sequence0.000
Table 3. Parameters setting of EEMD-PCC-CNN.
LayerFilter SizeKernel SizeStridePaddingInput/OutputActivation
Convolution 1304 × 1201SAME4 × 324/4 × 324ReLU
Max-pooling 2304 × 44VALID4 × 324/1 × 81ReLU
Convolution 3601 × 101VALID1 × 81/1 × 72ReLU
Fully connected layer 4----4320/128ReLU
Dropout----0.5-
Fully connected layer 5----128/64ReLU
Fully connected layer 6----64/4softmax
Table 4. Hyper-parameters optimization of different methods.
AlgorithmOptimal ParametersSearch SpaceOptimal Value
SVM1. Kernel coefficient
2. Regularization parameter
{0.1, 0.4, 0.6, …,10}
{1, 2, 3, 4, 5, …, 20}
{1.4}
{10}
RF1. Maximum leaf nodes
2. Maximum tree depth
3. Features number
{5, 10, 15, 20, …, 100}
{1, 2, 4, 6, 8, 10, …, 26}
{10, 20, 40, 60, 80, …, 320}
{40}
{16}
{100}
KNN1. Leaf size{10, 20, 30, 40, …, 200}{30}
XGBoost1. N_estimators
2. Maximum depth
3. Learning_rate
{1, 2, 4, 6, 8, 10, …, 26}
{5, 10, 15, 20, …, 100}
{0.1, 0.2, 0.3, 0.4, …,1}
{10}
{80}
{0.5}
Table 5. Experimental results of EEMD-PCC-CNN on the three-story building structure.
MethodsEEMD-PCC-CNNCNNSVMKNNRFXGBoost
Accuracy0.94020.89680.85610.68370.69170.7545
Precision0.92920.88400.84110.64780.77160.7172
Recall0.92690.87150.81260.62140.58820.6897
F1-score0.92800.87690.82360.62790.57230.6963
Table 6. Classification results of the three-story building structure under four damage conditions.
MethodsC1C2C3C4
PrecisionRecallF1-ScorePrecisionRecallF1-ScorePrecisionRecallF1-ScorePrecisionRecallF1-Score
EEMD-PCC-CNN0.96200.97730.96960.85400.85400.85400.92240.90260.91240.97840.97360.9760
CNN0.92590.96440.94480.81440.72770.76860.84130.86630.85370.95420.92740.9406
SVM0.87920.99310.93270.75930.60890.67580.79200.78550.78870.93390.86300.8971
KNN0.72030.90410.80180.40800.37870.39280.62750.45870.53000.83520.74420.7871
RF0.63700.92860.67560.92860.06440.12040.67560.49830.57360.84510.79210.8177
XGBoost0.80430.96340.87670.59260.39600.47480.66540.59410.62770.80660.80530.8059
Publisher’s Note: MDPI stays neutral with regard to jurisdictional claims in published maps and institutional affiliations.

