1. Introduction
Finger joints are essential for the production of long structural timber elements with respect to available timber resources, as well as the changing forest and plantation management and drying characteristics [
1]. Research in this area has increased in recent times to determine the possibility of using hardwood as a structural feedstock [
2,
3,
4]. While essential for the structural utilisation of timber in construction, finger joints are considered a weak component in mass timber products, similar to natural features such as knots and pith [
5,
6,
7]; therefore, their strength influences the bending strength of glulam [
8]. Burdzik [
9] concluded that finger joints or defects could predict the strength of laminated beams. Hence, the mechanical properties of finger-jointed boards from fibre-managed
E. nitens is an urgent research topic to promote the utilisation of this species in engineered wood products.
Although no studies have focused on the stiffness properties of finger-jointed laminations made using fibre-managed
E. nitens, promising research results have been reported on other hardwood species. Some existing studies have found that finger joints have a minimal influence on the modulus of elasticity (MoE) values of the boards. For example, Ong, Ansell [
5] investigated the bending properties of finger-jointed specimens made using Dark Red Meranti (Shorea spp.) with different end pressure values and test directions. They concluded that the MoE of the finger-jointed specimens was not affected by the finger jointing of the pieces by comparing the results of 10 solid specimens. Others concluded that finger joints reduced the MoE value of the sawn boards. For instance, Amoah, Kwarteng [
10] researched tropical hardwoods species in dry and green states. They found that the joint efficiencies with respect to the MoE of finger-jointed samples in the dry state ranged between 58 and 89%. On rare occasions, the literature reports that finger joints enhance MoE values. In the available literature, only Vassiliou, Barboutis [
11] found that the MoE value of the steamed specimens increased slightly compared with control solid timber, but the unsteamed ones were not affected by finger jointing.
In this research, clear solid specimens were tested and used as a benchmark to calculate the finger joint efficiency. This method needs improvement to be used on fibre-managed
E. nitens. Firstly, timber is a natural material; every single board is different even if they are from the same tree. The mechanical properties of the sawn boards are impacted by the fibre angle and the position on the trunk [
7,
12]. Secondly, fibre-managed
E. nitens is a hardwood species, and the variation in stiffness is considerable [
13]. This means that the difference in the MoE value between the clear solid boards and the boards before finger jointing might be large. So, if clear solid boards were used as benchmark, the calculated efficiency would deviate significantly from the actual value.
This study measured the MoE values of the boards before finger jointing as the benchmark to investigate the influence of finger joints on the stiffness of sawn boards.
All tested boards had their defects retained and were re-joined with finger joints using a strict and closely controlled manufacturing sequence. Before and after finger jointing, the boards were tested both edgewise and flatwise for comparison.
This study aimed to achieve the following:
Explore the suitability of the finger jointing technique on fibre-managed E. nitens.
Obtain the finger joint efficiency in terms of edgewise and flatwise stiffnesses using bending tests as a primary method.
2. Materials and Methods
2.1. Materials
A total of 72 boards (90 × 35 × 2300 mm) were selected randomly from a total of 331 boards. Prior to testing, the moisture content and basic density of each board were measured.
The moisture content and basic density of each board were determined with the oven-drying method. The procedure for the oven-drying test and the calculation of basic density and moisture content were in accordance with AS 1080.1:2012 [
14]. The edgewise and flatwise MoE values were obtained using bending tests. In terms of flatwise tests, each board was tested every 100 mm for 14~17 times, which depended on the length of the board [
15]. Then, the average flatwise MoE value was calculated. The cumulative distributions of these mechanical parameters are shown in
Figure 1.
The boards were ordered based on the average flatwise MoE value of 14~17 sections. For example, board number 1 had the highest mean value.
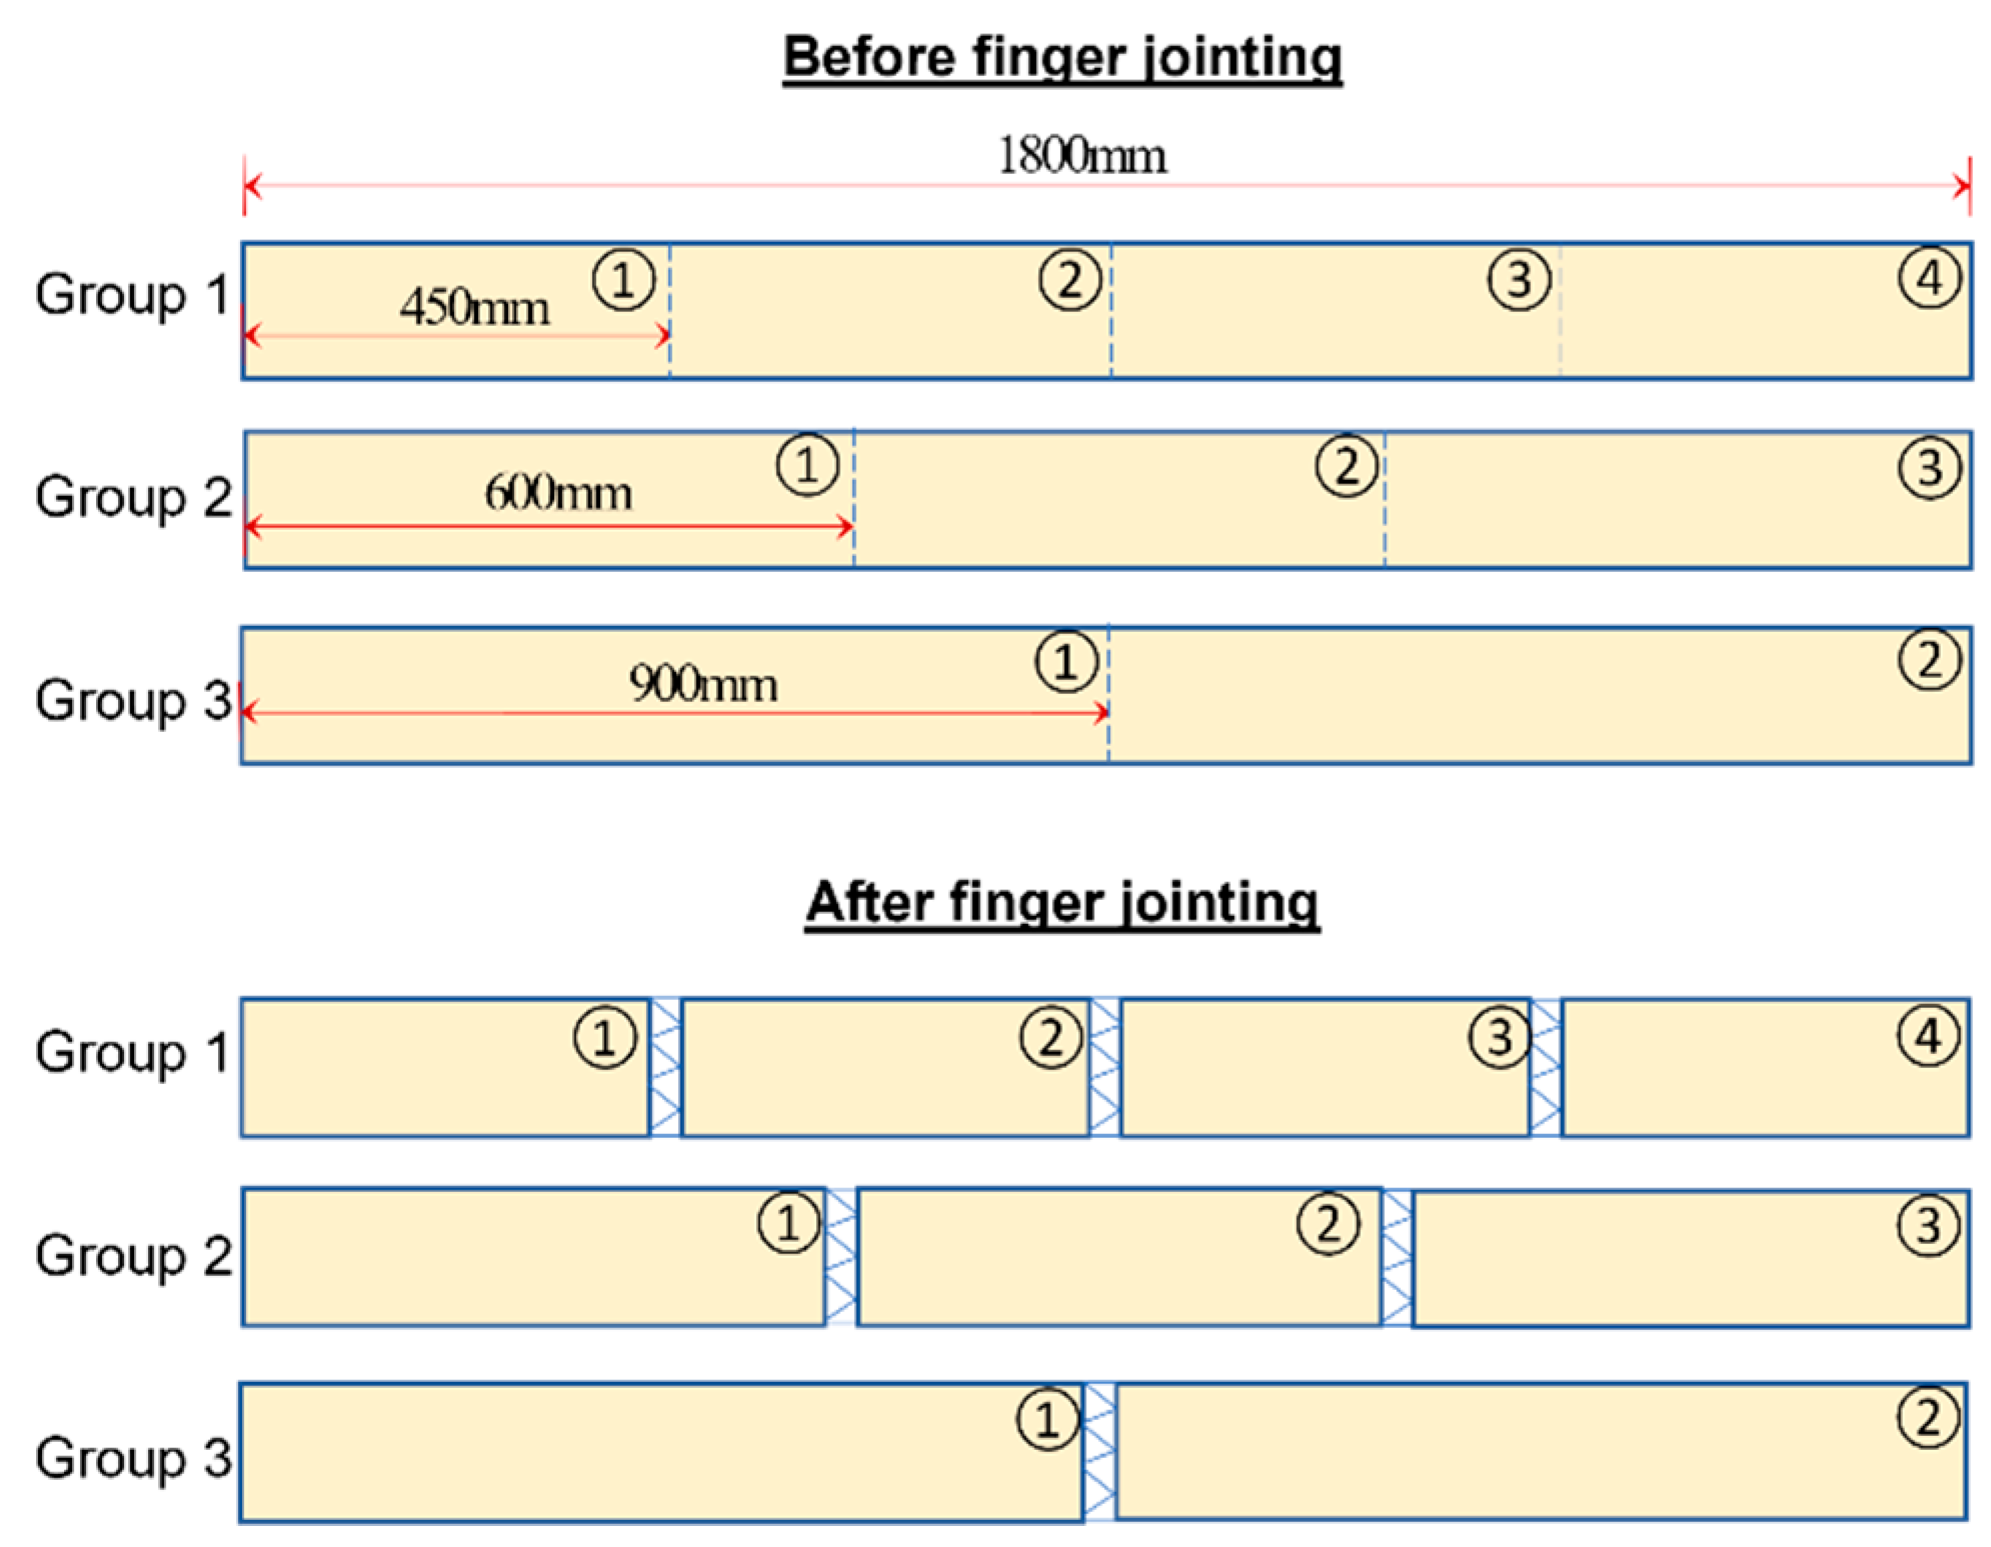
After cutting the oven-dried test samples, the boards were separated into three groups randomly (each group included 24 boards). The first group of boards were cut into four 450 mm long shooks, the second group into three 600 mm long shooks, and the third group into two 900 mm long shooks. All features were kept, including knots, pith, and wane.
These shooks were then re-joined using the finger jointing technique. The first group of boards were re-joined using three finger joints, the second group using two finger joints, and the third group using only one finger joint (
Figure 2).
2.2. Finger Joint Parameters
The finger joints were processed using an automatic finger jointing system. The 15 mm finger joint length was chosen based on existing research results; Morin-Bernard, Blanchet [
16] investigated the influence of the finger joint geometries on the tensile strength of lamellae from three hardwood species using two types of adhesives, including Melamine Formaldehyde (MF) and Two-component polyurethane (2C-PUR). The groups with a finger length of 15 mm had higher tensile strength than the 22 mm groups.
The finger joint geometry is illustrated in
Figure 3. One finger joint per board was selected to measure the tip gaps using digital callipers.
The One-component polyurethane (1C-PUR) used in this study was a formaldehyde-free adhesive without any emission from spreading to full curing. Its choice for this study was based on previous studies reporting that 1C-PUR works well on hardwood species, particularly that of Lehmann, Clerc [
17], who conducted tensile shear and delamination tests on samples made using beech and found that 1C-PUR for finger joint bonding could meet the requirements of the standards.
The other gluing parameters, including end pressure, pressing time, glue spread rate, and curing time, were based on the manufacturer’s recommendations (see
Table 1). End pressure 1 was applied to 24 samples across groups, and end pressure 2 was applied to the other 48 samples.
2.3. Bending Tests
In this study, bending tests were used to determine the MoE value of the samples before and after finger jointing (
Figure 4). The testing procedure was as follows:
Before cutting and finger jointing, a four-point bending test according to AS/NZS 4063.1:2010 was conducted to determine the edgewise MoEs of all 72 boards.
Then, five sections per board were selected and tested with flatwise three-point bending tests according to ASTM D 198 (ASTM 2010). The span-to-depth ratio was 17.1.
After cutting and finger jointing (as described in
Section 2.1), the 72 re-jointed boards were tested with four-point bending test.
Then, flatwise three-point bending tests were conducted on the selected sections (five sections per board).
In the flatwise bending test, a total of 360 sections (5 per board) were tested. The average flatwise MoE value was the mean value of the five sections. The tested sections were in the middle of the span. They were divided into non-jointed sections, jointed sections, and influenced sections as follows:
Non-jointed sections: When this kind of section was tested, there was no finger joint at any position in the bending span.
Influenced sections: There was (were) one (or two) finger joint(s) within the span but none in the middle.
Jointed sections: When this kind of section was tested, there was only one finger joint in the middle of the span.
2.4. Data Analysis
Statistical analyses were conducted using RStudio as follows:
The Shapiro–Wilk test [
18] was conducted to confirm the distribution of the data sets. Levene’s test was performed to assess the homogeneity of variance.
The paired
t-test [
19] with unequal variances was conducted to compare the mean values of the stiffness before and after finger jointing.
The one-way analysis of variance (ANOVA) [
20] was used to compare the mean values of the testing data using the number of finger joints, the width of tip gap, and end pressure as the factor variables. The level of significance was set at 5% (
p < 0.05).
The characteristic values were calculated as per Australian Standard AS/NZS 4063.2:2010. According to this standard, the characteristic value of the MoE should be the mean or adjusted mean value, estimated with 75% confidenceThe lesser value of mean or adjusted mean was used to calculate the finger joint efficiency.
The finger joint efficiency is a decimal and is the stiffness value after finger jointing compared with the corresponding value before finger jointing. In this study, three efficiencies were calculated, including the edgewise and average flatwise MoEs of all the samples and the flatwise MoE of the jointed sections.
3. Results
Out of all 72 boards, only one board was excluded from this study, as it showed abnormal MoE values due to a longitudinal crack across the whole thickness of the board.
3.1. Overview
3.1.1. Edgewise MoE Value
The static edgewise MoE values of the 71 boards before and after finger jointing are shown in
Figure 5. The deviation of the data between before and after finger jointing was from −26.9% to 11.4% with a mean value of this deviation of −9.2%.
The Shapiro–Wilk test indicated that the static edgewise MoE values of the samples before finger jointing followed a normal distribution (W (71) = 0.98;
p = 0.47 > 0.05). A different conclusion was obtained for the samples after finger jointing (W (71) = 0.93;
p = 0.001 < 0.05). The quantile–quantile (Q-Q) plots of the two data sets showed the same conclusion as the Shapiro–Wilk tests (
Figure 6). Regarding the data before jointing, the Q-Q plot had both ends deviating from the straight line and its centre approximately following a straight line, which means that the data sets followed a normal distribution. Regarding the data after jointing, the observations formed a curve that deviated markedly from a straight line, which means that these data did not follow a normal distribution.
Levene’s test was performed to assess the homogeneity of variance of the two data sets. The p-value associated with Levene’s test was 0.01, and the assumption was violated (Levene’s test, F = 6.55; p = 0.01 < 0.05). Then, a paired t-test with unequal variances was conducted to compare the mean values of the edgewise MoE before and after finger jointing. The results showed that the edgewise MoE values before and after finger jointing were statistically different (t-test, t = 2.34; p = 0.02 < 0.05). The mean value of the samples before finger jointing was 14,284.5 MPa, and it was 13,118.6 MPa after jointing. The 95% confidence interval of the difference was from −179.3 MPa to −2152.5 MPa.
3.1.2. Average Flatwise MoE Value
The average flatwise MoE values of 71 boards before and after finger jointing are shown in
Figure 7. The deviation of the data between before and after finger jointing was from −14.2% to 19.6% with a mean value of this deviation of 1.77%.
The Shapiro–Wilk test and quantile–quantile (Q-Q) plots were used to confirm the distribution of the two data sets. The average static flatwise MoE values before finger jointing did not follow a normal distribution (W (71) = 0.99;
p = 0.001 < 0.05). The values of these boards after finger jointing followed a normal distribution (W (71) = 1.00;
p = 0.44 > 0.05). The quantile–quantile (Q-Q) plots of the two data sets showed the same conclusion as the Shapiro–Wilk tests (
Figure 8).
Levene’s test was performed to assess the homogeneity of variance. The p-value associated with Levene’s test was 0.65, which indicated that the variances were equal across these two data sets (Levene’s test, F 1,140 = 0.20; p = 0.65 > 0.05). Then, a paired t-test with equal variances was conducted to compare the mean values of the average flatwise MoE before and after the finger jointing process. The results showed that the finger jointing process did not significantly change the average flatwise MoE values (t-test, t 138.7 = −0.50; p = 0.61 > 0.05). The mean value of the average flatwise MoE before the finger jointing process was 13,034.5 MPa, and it was 13,207.3 MPa after jointing. The 95% confidence interval of the difference was from −502.0 to 847.6 MPa.
3.2. Impact of Finger Joint Number
3.2.1. Edgewise MoE Value
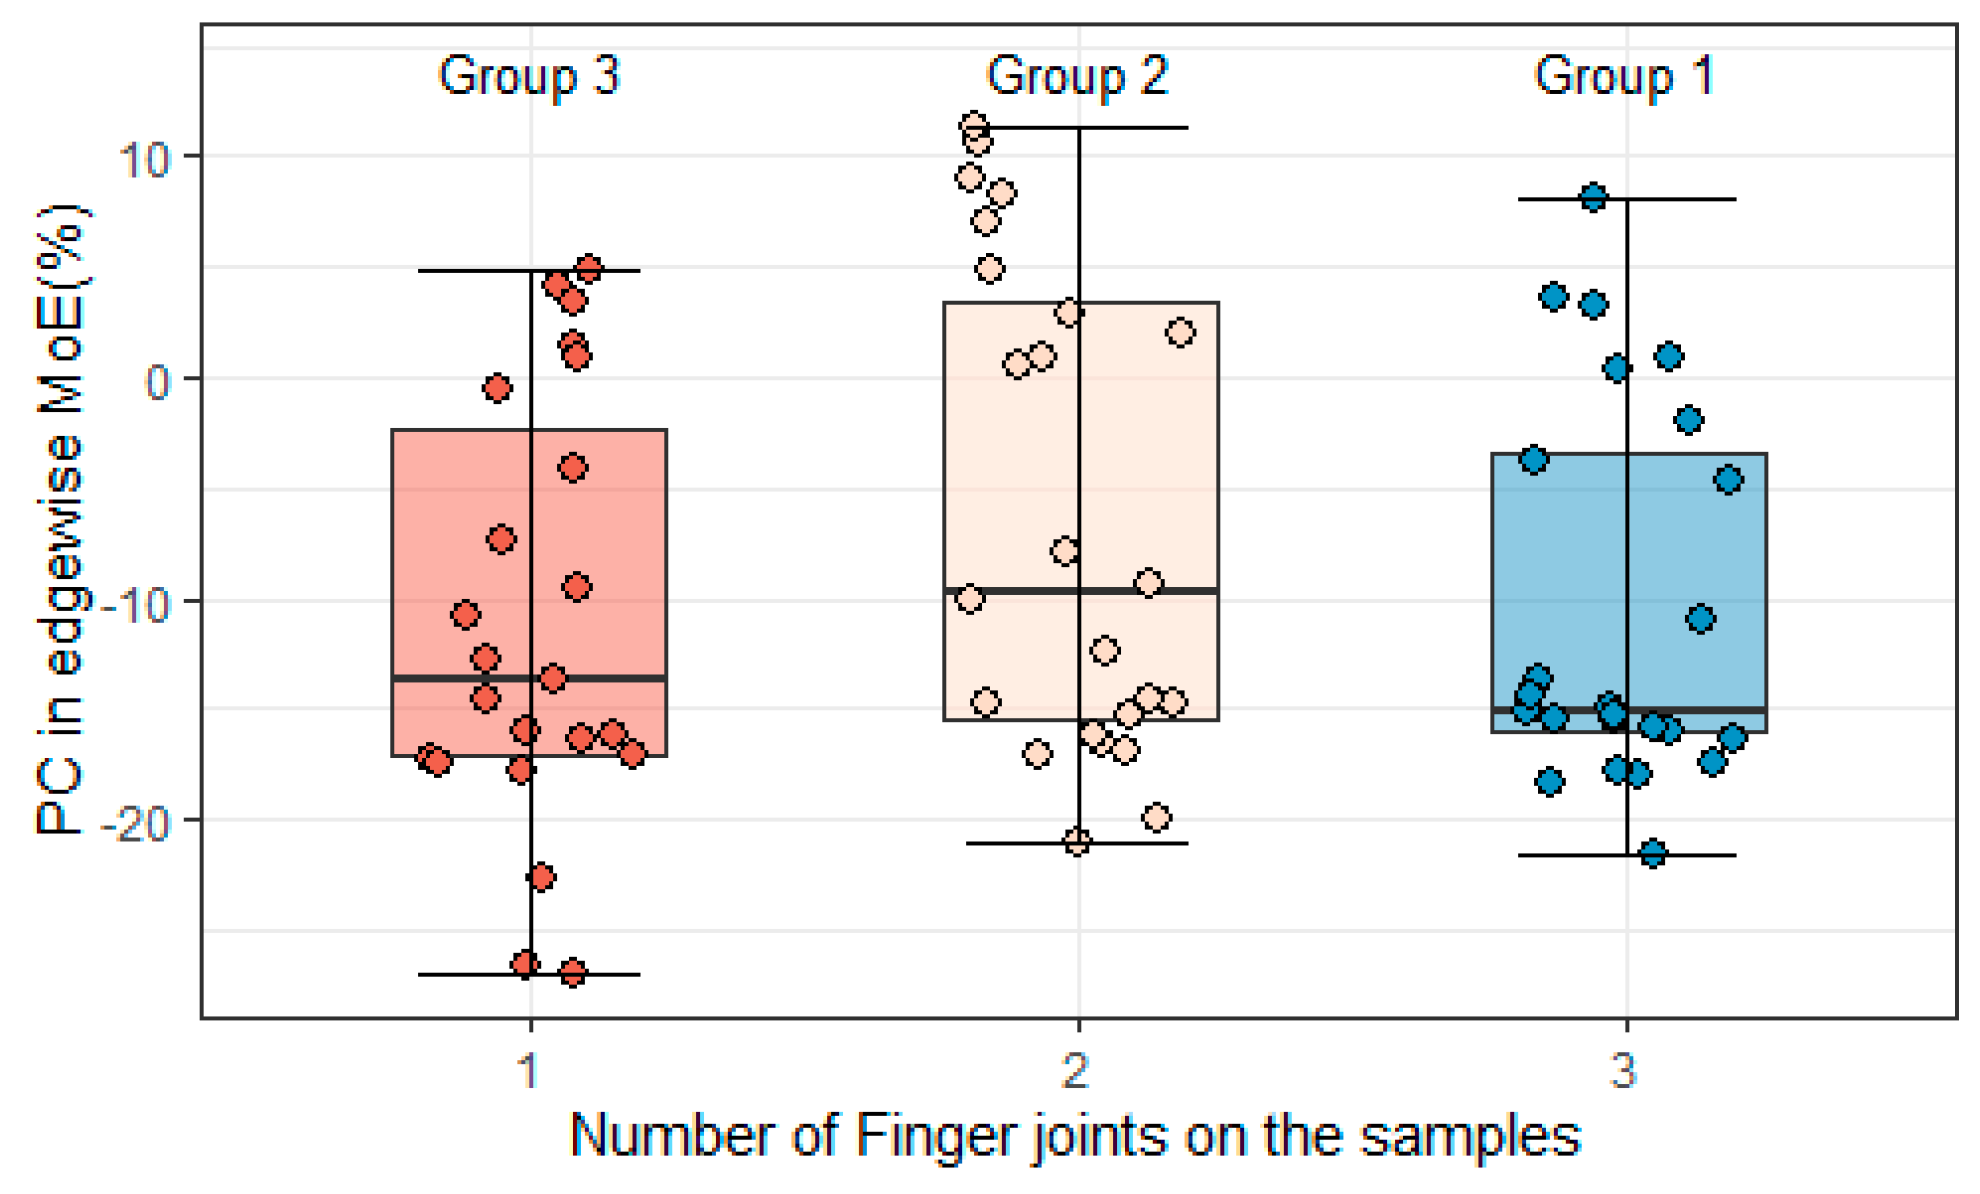
As mentioned above, the samples were re-joined with one, two, or three finger joints, and the percentage changes in the static edgewise MoE values are shown in
Figure 9. A one-way ANOVA was performed to explore the impact of the finger joint number on the percentage changes in the edgewise MoEs. Because the
p-value was larger than 0.05, the null hypothesis was not rejected. There was no statistical evidence that the percentage change in the edgewise MoE values differed among the samples with one, two, or three finger joints (ANOVA, F
2,68 = 1.68;
p = 0.19 > 0.05).
The static edgewise MoE values were reduced by an average of −11.01% in the group with one finger joint. The 95% confidence interval of the reduction was from −6.93% to −15.10%. The mean value of the samples with three finger joints was −10.47%, which was close to the value of those with one finger joint (95% CI (−15.64, −4.21)%). Although the mean value of the samples with two finger joints was 4.77% greater than that of samples with one finger joint, this difference was not statistically significant (Tukey’s test, p = 0.23 > 0.05; 95% CI (−0.94, 10.49)%).
3.2.2. Average Flatwise MoE Value
The percentage changes in the average flatwise MoE values of samples with one, two, and three finger joints are shown in
Figure 10. A one-way ANOVA was performed to explore the impact of the finger joint number on the percentage change. Because the
p-value was smaller than 0.05, the null hypothesis was rejected. Statistical evidence showed that the percentage change in the average flatwise MoE values differed among the samples with one, two, or three finger joints (ANOVA, F
2,68 = 3.79;
p = 0.03 < 0.05).
In the sample group with one finger joint, the average flatwise MoE values were reduced by an average of −1.1%. The 95% confidence interval of the reduction was from −3.68% to 1.48%. Although the mean value of the samples with two finger joints was 3.76% larger than that of those with one finger joint, there was no statistical evidence that they were different (Tukey’s test, p = 0.10 > 0.05; 95% CI (0.15, 7.37)%). The mean value of the samples with three finger joints was 4.72% lager than that of those with one finger joint. This difference was statistically significant (Tukey’s test, p = 0.03 < 0.05; 95% CI (1.11, 8.33)%).
3.3. Impact of Pressure
3.3.1. Finger Joint Appearance
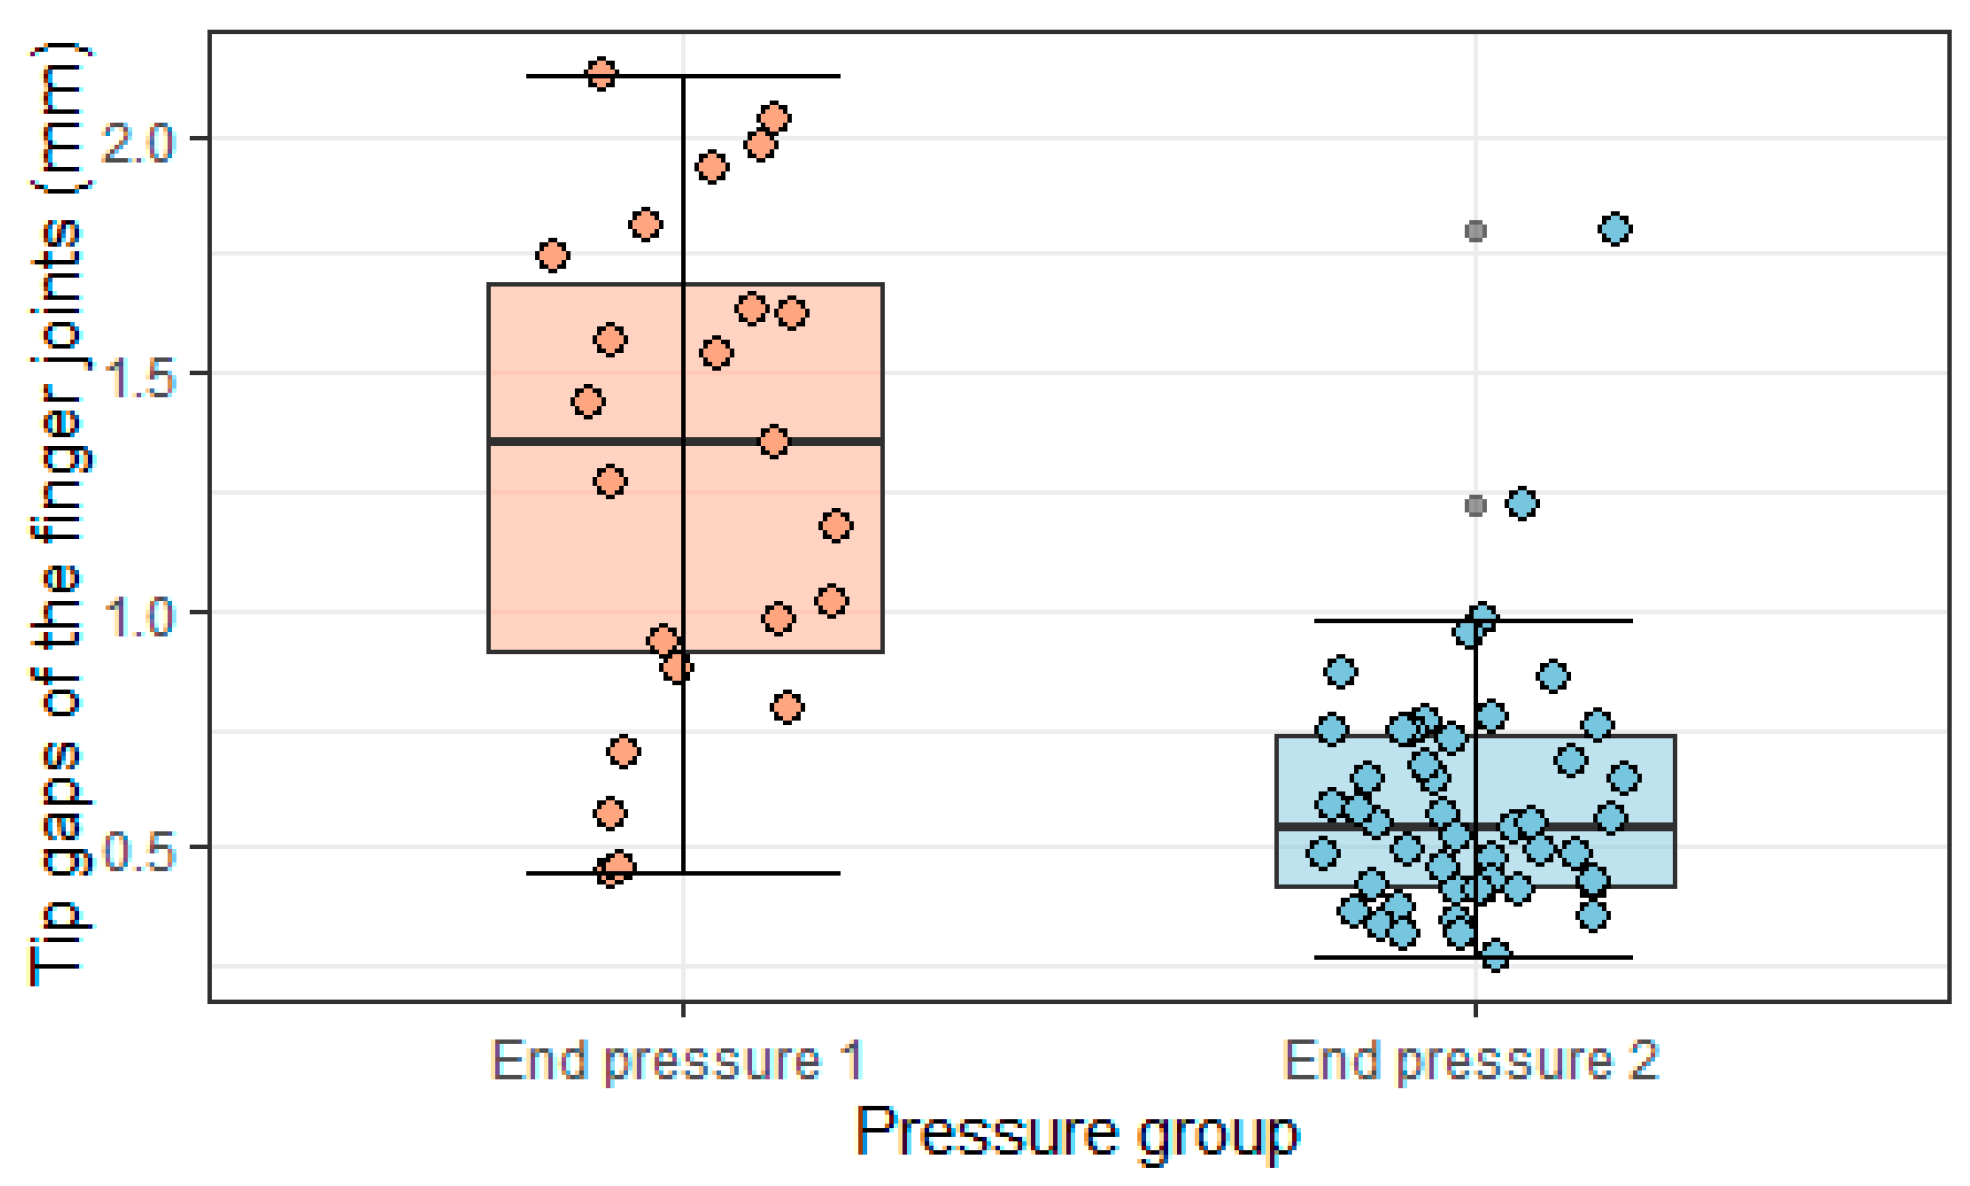
Different end pressure values induced different appearances of the finger joints (
Figure 11). The tip gaps in finger joints under low pressure were bigger than those in finger joints under high pressure (
Figure 12).
A one-way ANOVA was conducted on the tip gap data of the samples to obtain statistical evidence. The null hypothesis was not rejected, because the p-value was small. Strong evidence indicated that the tip gaps of finger joints under high pressure were smaller than those under low pressure (ANOVA, F 1,69 = 57.55; p = 0.001 < 0.05). The mean value of the tip gaps of the high-pressure group was 0.60 mm, and the 95% confidence interval was from 0.49 mm to 0.70 mm. The mean value of the low-pressure group was 0.71 mm greater than that of the high-pressure group (95% CI (0.52, 0.90) mm).
3.3.2. Edgewise MoE Value
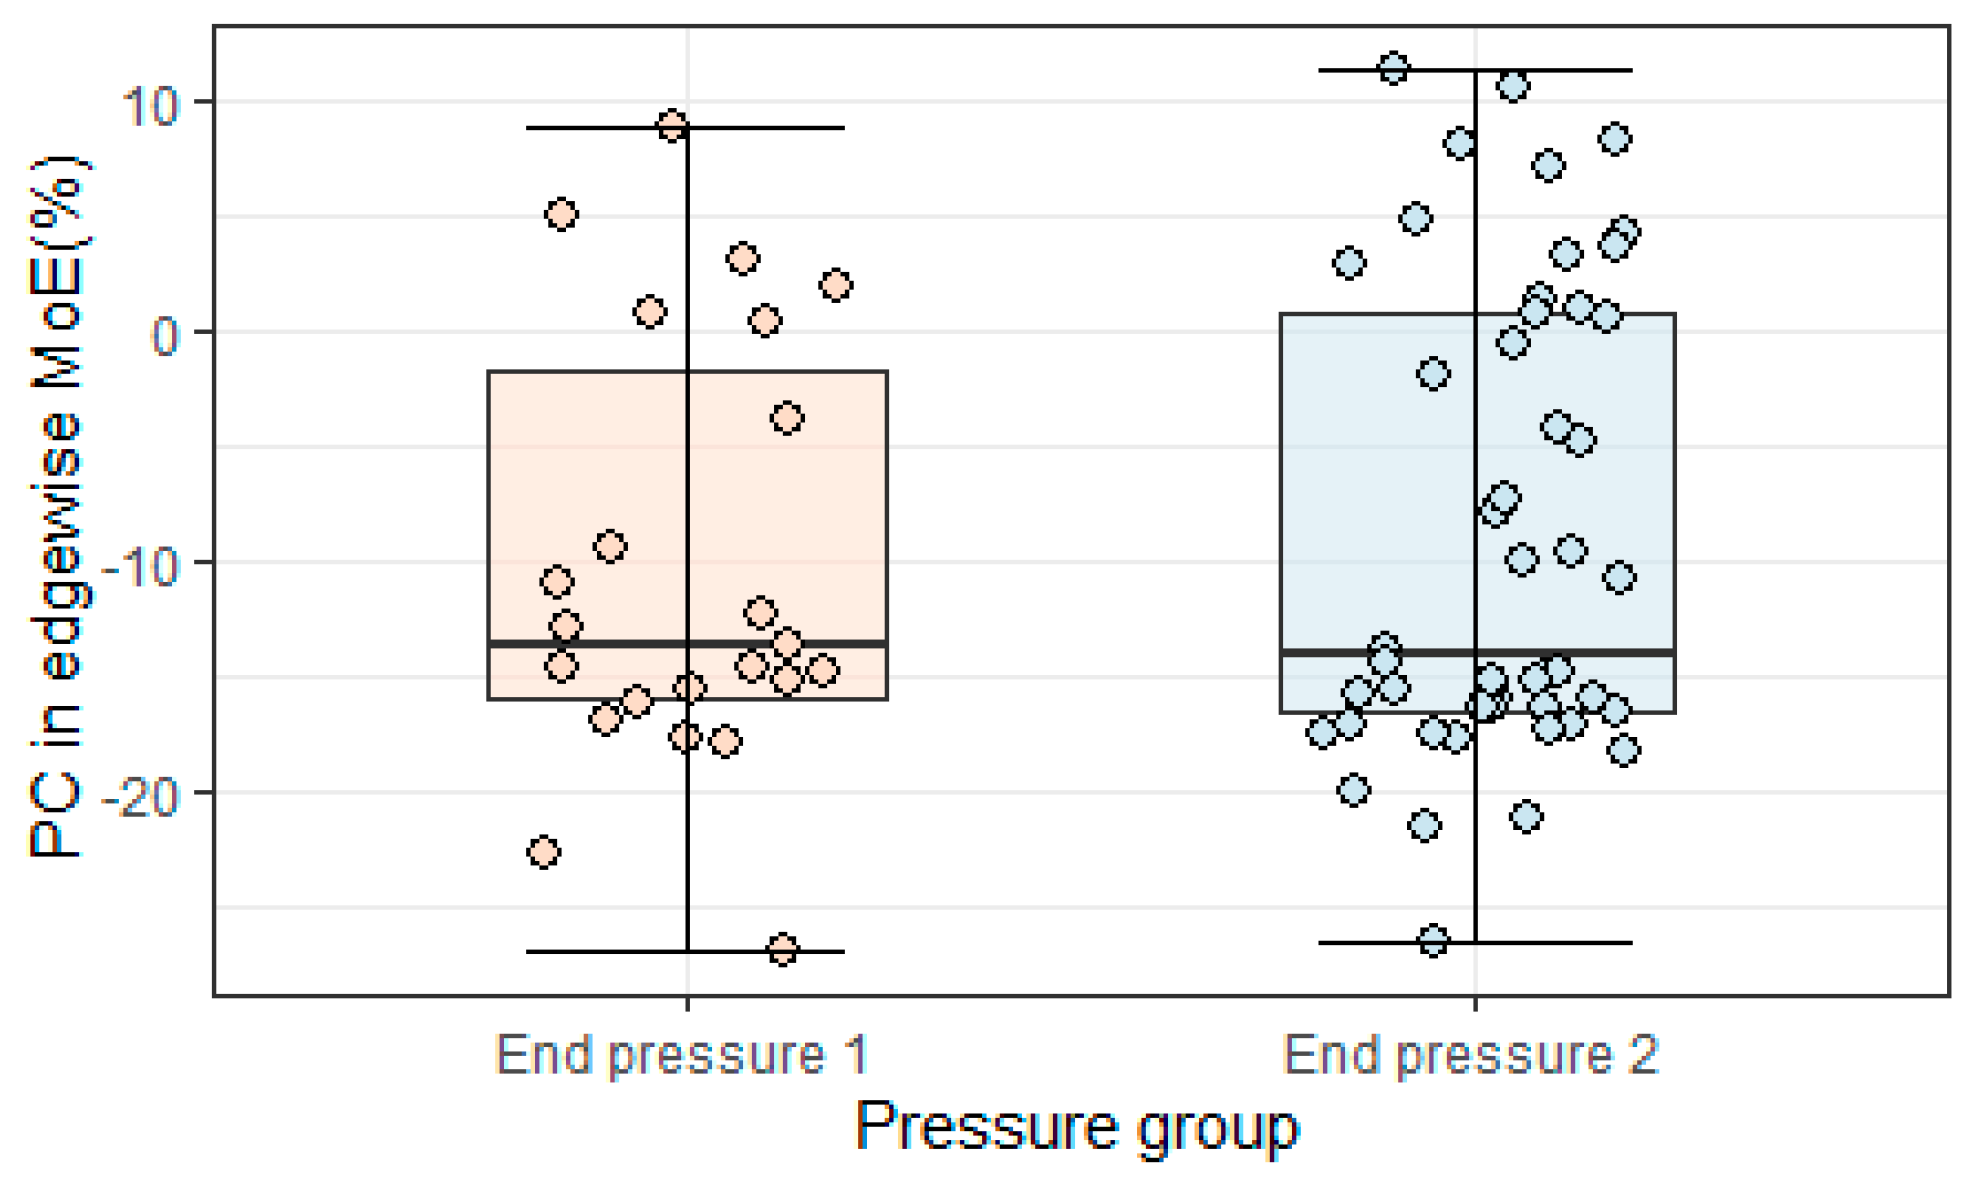
Although the dimensions of the tip gap were statistically different, the effect of the two pressure values on stiffness was not significantly different. The percentage changes in the edgewise MoEs of samples under different pressure values are shown in
Figure 13. The null hypothesis for the one-way ANOVA was that the edgewise MoE of samples under two pressure values had the same mean and the same variance. This null hypothesis was accepted because of the high
p-value (ANOVA, F
1,69 = 0.37;
p = 0.54 > 0.05).
In the sample group under high pressure, the static edgewise MoE values were reduced by an average of −8.72%. The 95% confidence interval of the reduction was from −5.85% to −11.58%. Although the mean value of the group under low pressure was 1.54% smaller than that of the group under high pressure (95% CI (−3.50, 6.58)%), this difference was not statistically significant.
3.3.3. Average Flatwise MoE Value
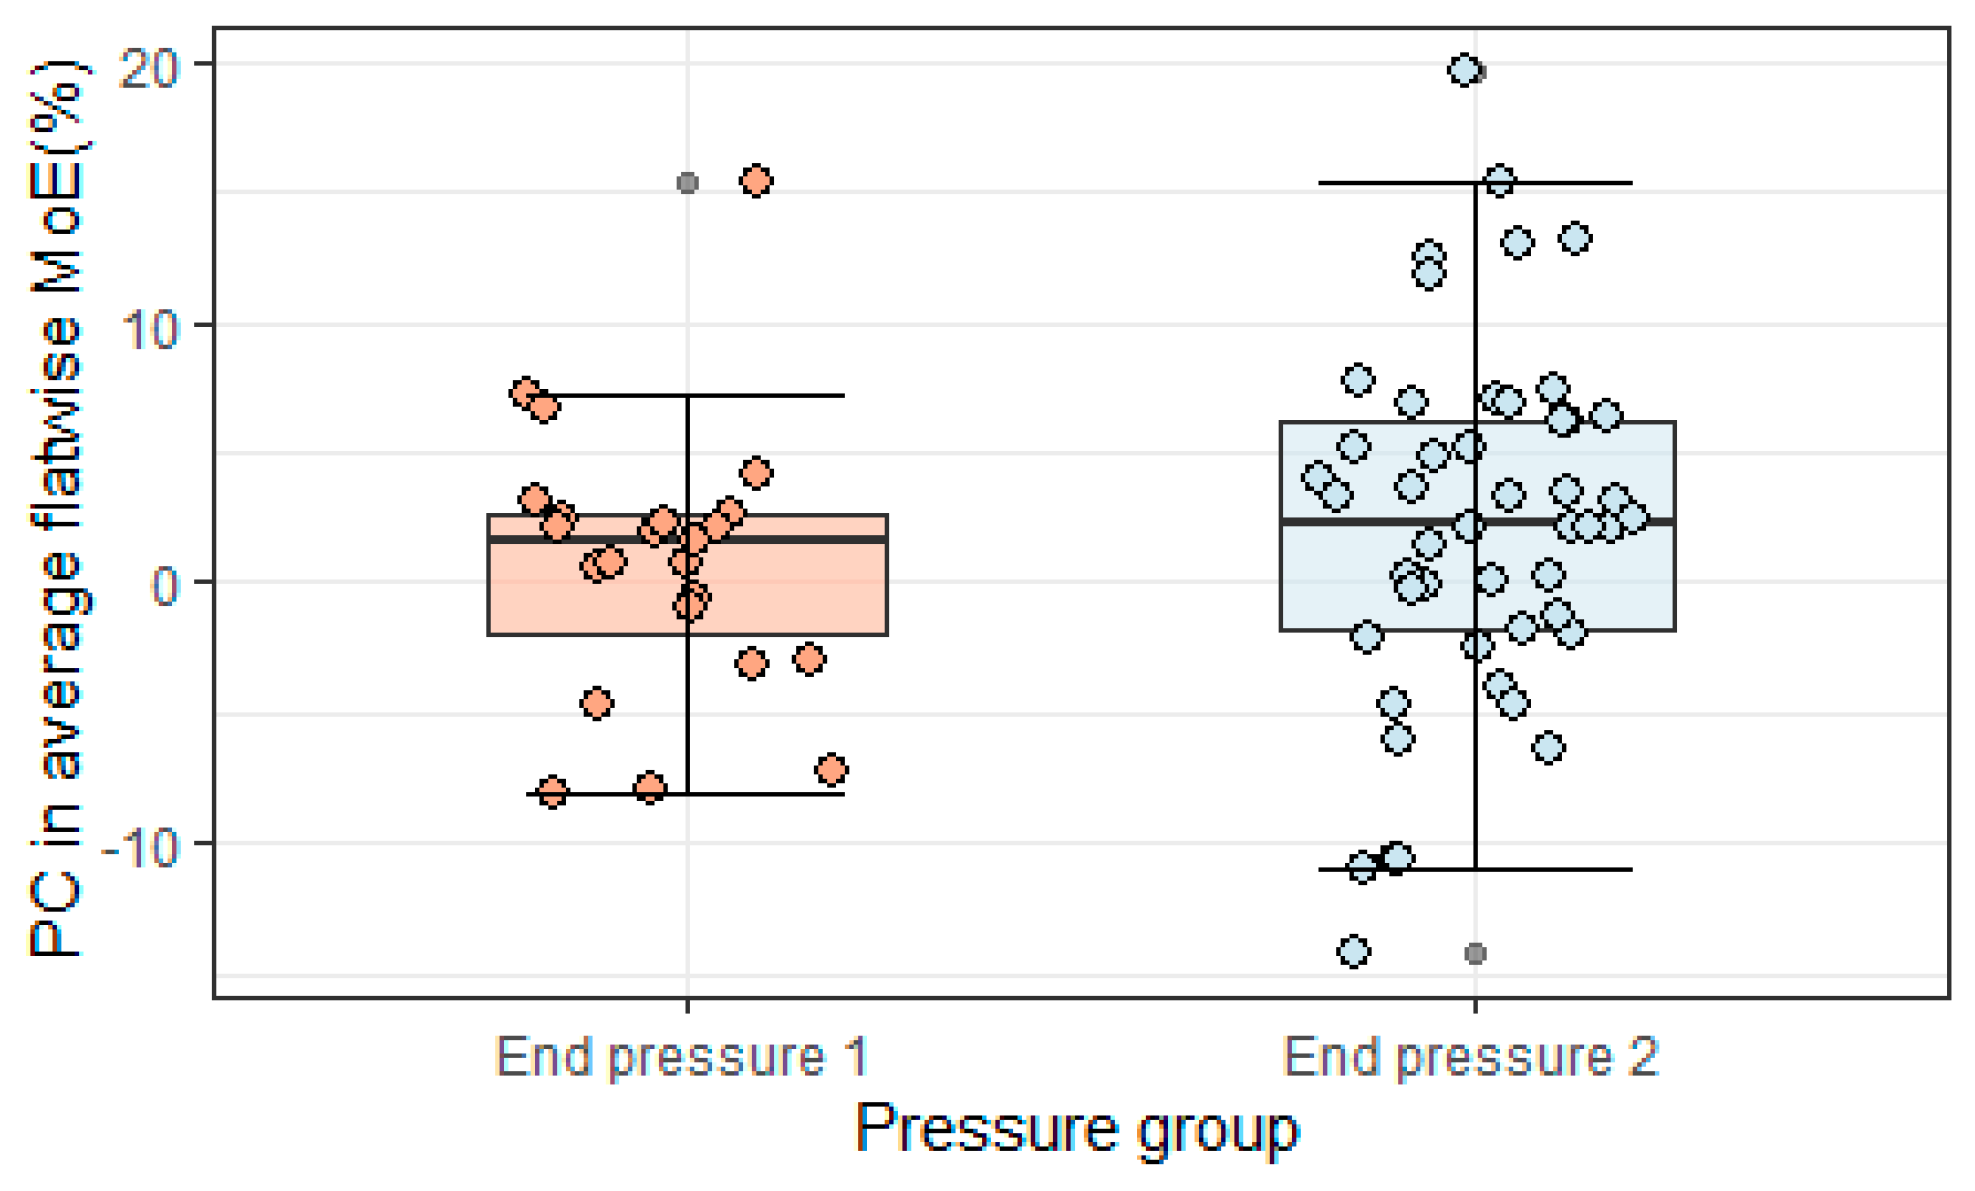
As with the edgewise MoE values, the effect of the two pressure values on the average flatwise MoEs was not significantly different. The percentage changes in the average flatwise MoE values of the sections under different pressure values are shown in
Figure 14. The null hypothesis for the one-way ANOVA was that the average flatwise MoEs of sections with two pressure values had the same mean and the same variance. This null hypothesis was accepted because of the
p-value (ANOVA, F
1,69 = 0.76;
p = 0.39 > 0.05). The average flatwise MoE value was improved by an average of 2.23% in the samples under high pressure. The 95% confidence interval of the percentage change was from 0.37% to 4.09%. Although the mean value of the group under low pressure was 1.42% lower, this difference was not statistically significant (95% CI (−4.69, 1.84)%).
3.4. Finger Joint Efficiency
To evaluate the joint potential, the finger joint efficiencies of edgewise and flatwise stiffness were calculated. The characteristic MoE values of samples after finger jointing were compared to the data before finger jointing. The characteristic values of the edgewise MoEs of the samples before and after finger jointing were 14,069.3 MPa (n = 71) and 11,597.7 MPa (n = 71), respectively. The finger joint efficiency of the edgewise MoE value was 0.824.
In terms of the flatwise stiffness, the finger joint efficiencies of the average value of the boards (
n = 71) and the individual value of the jointed sections (
n = 143) were considered. The characteristic flatwise MoE values and related finger joint efficiencies are listed in
Table 2.
The joint efficiency of the jointed sections was higher than the efficiency of the average value, which meant that the jointed sections might have had higher MoE values than the other two groups of sections. A one-way ANOVA was performed to find the statistical evidence of this improvement. The percentage changes in the individual values across section groups are shown in
Figure 15. The
p-value was small, and the null hypothesis was rejected. Strong evidence showed that the flatwise MoE values differed across groups (ANOVA, F
2,352 = 15.5;
p = 0.001 < 0.05).
The mean value of the percentage change in the flatwise MoEs of the non-jointed sections was −1.37% (95% CI (−2.92, 0.17)%). Compared with the non-jointed sections, the flatwise MoE values of the jointed sections were statistically significantly improved (Tukey’s test, p = 0.001 < 0.05). The mean increase was 5.59% (95% CI (3.11, 8.08)%). Meanwhile, the flatwise MoE values of the influenced sections were not significantly different from those of the jointed sections (Tukey’s test, p = 0.99 > 0.05).
4. Discussion
4.1. Suitability of Finger Jointing
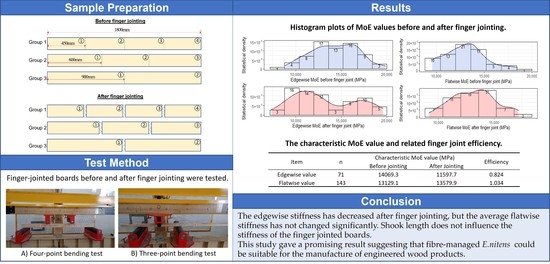
Finger jointing technology is an efficient way to improve timber recovery from timber with dense knots and other defects. This study obtained promising results in stiffness, suggesting that finger jointing could be suitable for manufacturing engineered wood products from fibre-managed E. nitens. The finger joint efficiency of edgewise and flatwise stiffness were 0.824 and 1.034, respectively. The characteristic edgewise and flatwise MoE values after finger jointing were 11,597.7 MPa and 13,579.9 MPa, respectively.
Although the finger joints resulted in a 17.6% reduction in the characteristic edgewise MoE value, the stiffness values after finger jointing were applicable to the structural application. As per Australian Standard 1720.1-2010, the edgewise stiffness of the seasoned timber in this study met the stiffness requirements of F11 (F grade: MoE > 10,500 MPa) and MGP10 (MGP grade: MoE >10,000 MPa).
The flatwise MoEs of the jointed sections were improved statistically compared with those of the non-jointed sections. As per Australian Standard 1720.1-2010, the flatwise stiffness of the seasoned timber in this study met the stiffness requirements of F14 (F grade: MoE > 12,000 MPa) and MGP12 (MGP grade: MoE > 12,700 MPa).
In this study, the characteristic stiffness value could be lower than that of streamlined laminations because all the defects were kept without docking. Therefore, considering the stiffness, finger-jointed fibre-managed
E. nitens boards could be used as structural components in either the edgewise or flatwise direction. Further research should explore the dynamic measurements of the MoE values of finger-jointed boards [
21]. This could facilitate the streamline production of the material.
4.2. Shook Length
Shook length plays a vital role in predicting glulam beams’ bending and tensile strength as per Australian Standard AS/NZS 1328.1: 1998. According to the standard, the shorter the shook of the outer laminations is, the weaker the glulam is. This specification is also considered as a strategy to incentivise manufacturers to use greater shook lengths whenever possible [
22]. No studies nor standards specify the effect of shook length on stiffness.
In this study, the number of finger joints in the boards was considered as a factor. The related parameter was the shook length. The shook lengths of samples with one, two, and three finger joints were 900 mm, 600 mm, and 450 mm, respectively. There was no statistical evidence that the number of finger joints impacted the percentage change in the edgewise MoE values. That meant that the shook length did not impact the edgewise MoE values. Meanwhile, the analysis of the effect of the finger joint number on the average MoE values showed that the shook length did not affect the percentage change in the average flatwise MoE values much.
However, it does not mean that finger-jointed boards can have any number of finger joints, because the edgewise stiffness would be reduced regardless of the shook length. While the mean values of average flatwise MoE were improved slightly regardless of the shook length, the variation existed. The flatwise stiffness of 34 boards out of 71 decreased (
Figure 7). A shorter shook length means more finger joints and more risks.
4.3. Finger Joint Orientation
The results showed that the finger jointing process decreased the edgewise stiffness (3.1.1) but not the flatwise stiffness (3.1.2). There might be two reasons.
The first one is the testing direction. In this study, all the samples had the finger joint profile on the width face. That meant that the finger joints were horizontal in the edgewise bending test and vertical in the flatwise bending test. Some researchers reported that the orientation of the finger joints in bending tests affects the joint efficiency [
5,
11,
23]. In this case, the joints are stressed more equally in the flatwise test. So, the stiffness increases because of the extra structural adhesive. In the edgewise test, each finger is at a different distance from the neutral axis. So, the outer fingers are the most highly stressed. In addition, the outer fingers tend to be inclined to spread out because of the end pressure [
24] (
Figure 11). This makes the outer fingers weaker than the inner ones, so they become the weak points in the edgewise test.
The second one is the influence of the pressing process. In this study, the finger joint profile was shown on the faces, which meant that the end pressure applied on the side wall of the fingers had a component, the in-plane splitting force. End pressure was applied along with top pressure but without lateral pressure. So, there is a possibility that when the fingertip is pushed further, cracks in the wood propagate. Bustos, Hernández [
25] found microscopic evidence of the crack propagation in black spruce timber caused by an end pressure of 4.9 MPa. Cracks are a form of energy dissipation. Low-stiffness boards tend to have lower density and more defects, which means that the influenced length is greater than in stiffer boards. In
Figure 5, it can be observed that the edgewise MoE values of the boards with low stiffness obviously decreased after finger jointing. Meanwhile, the influence of the in-plane splitting force does not impact the flatwise stiffness.
Therefore, a better finger joint orientation is to ensure that the surface of the finger joint profile is perpendicular to the force.
4.4. Finger Joint Parameters
Finger joint parameters such as the geometry of the fingers, end pressure, and adhesive parameters impact the quality of the finger-jointed product [
1]. For instance, the applicable end pressure can be varied from 0.7 to 12.0 MPa depending on the wood density and species [
26,
27]. The parameters used in this study were verified to be feasible for fibre-managed
E. nitens regarding stiffness. The characteristic stiffness values met the requirements of structural applications.
However, there is a need to optimise the finger joint parameters. Researchers reported that the finger joint has very limited influence on the MoE values of sawn boards from other hardwood species [
5,
28]. Optimised parameters may not reduce the edgewise stiffness of boards from fibre-managed
E. nitens.
In addition, a 10% increase in end pressure significantly reduced the tip gap but did not significantly affect the stiffness. Srivaro, Cherdchim [
29] reported similar results indicating that the length of finger-contacted surfaces did not significantly affect the properties of finger-jointed oil palm wood products. However, Lara-Bocanegra, Majano-Majano [
30] analysed the influence of end pressure on the tip gaps. They reported that the finger joint performed best when the tip gap was minimal before fingertip contact. This kind of tip gap came from matched end pressure and geometry. Further study should focus on matching the end pressure and geometry to explore ways to achieve a high quality of wood products from fibre-managed
E. nitens.
4.5. Limitations
Firstly, the maximum force was estimated based on visual features, not the 40% of the ultimate force as per Australian Standard [
31]. To ensure that the boards were in the elastic region and not damaged, the maximum applied force ranged between 150 kg and 300 kg, depending on the strength-reducing characteristics of each board. For example, boards or sections with larger knots were tested with lower maximum force.
Secondly, the tests before and after finger jointing were conducted in different seasons. The original boards were tested in summer. Finger joint manufacturing was conducted in autumn, and finger-jointed boards were tested in winter. MoE values are affected by certain parameters, including moisture content [
32], temperature [
33], and the interaction with the grain direction [
34]. This was evidenced by the test results of the non-jointed group. The maximum percentage change could have been smaller if the tests had been conducted under strict control of environmental parameters. Nevertheless, for the whole population, the influence of these parameters was ignored, since the average percentage change of the non-jointed sections was only −1.37%.
Thirdly, the finger joint profile was explored considering the bending strength, not the stiffness. The effect of the finger joint geometry was not investigated in this study; thus, further study on the effect of finger joints on stiffness could be conducted using both experimental and numerical methods by considering multiple groups of finger joint geometries [
6,
35].
Finally, the main objective of this research was to test the mechanical properties before and after a finger jointing process as the primary method. This study did not include theoretical modelling to predict the MoE value after finger jointing.
5. Conclusions
The bending test results showed that the finger jointing technique is feasible for the structural application of fibre-managed E. nitens regarding stiffness. The characteristic MoE values met the requirements of Australian Standard. In addition, the edgewise stiffness decreased after finger jointing, but the average flatwise stiffness did not change significantly. The finger joint efficiency was 0.824 for the edgewise stiffness of the samples and 1.034 for the flatwise stiffness of the jointed sections.
The shook length did not influence the stiffness of the finger-jointed boards. However, from the perspective of reducing risk, the shook length should be as great as possible. The two applied end pressure values did not affect the stiffness of the finger-jointed boards. However, a 10% increase in end pressure reduced the tip gap significantly.
Therefore, this study gave a promising result suggesting that fibre-managed E. nitens could be suitable for the manufacturing of engineered wood products, although further research is required for optimising the finger joint parameters to increase the joint efficiency of edgewise stiffness.


