
Cyclic Behavior of Multiple Hardening Precast Concrete Shear Walls

 , and
, and
Abstract
:
1. Introduction
2. Experimental Program
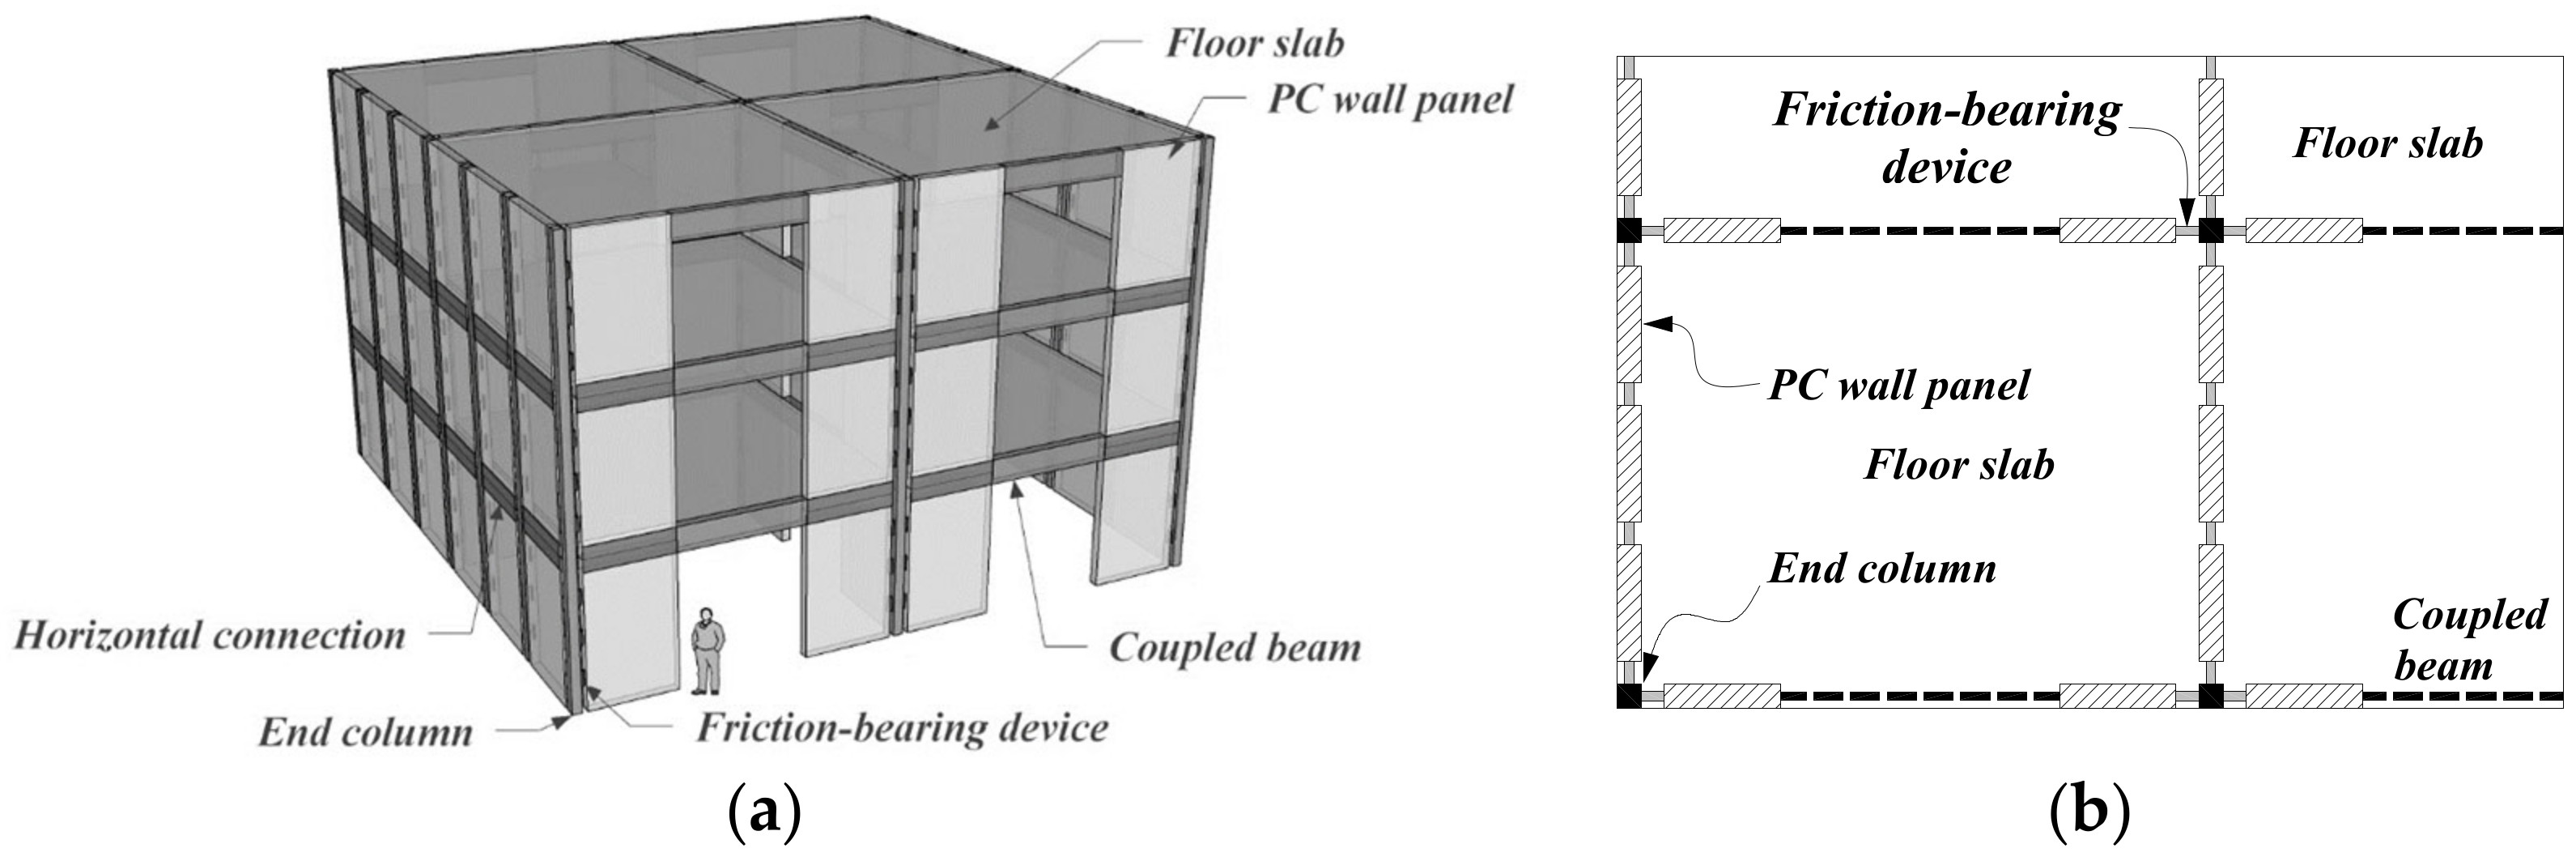
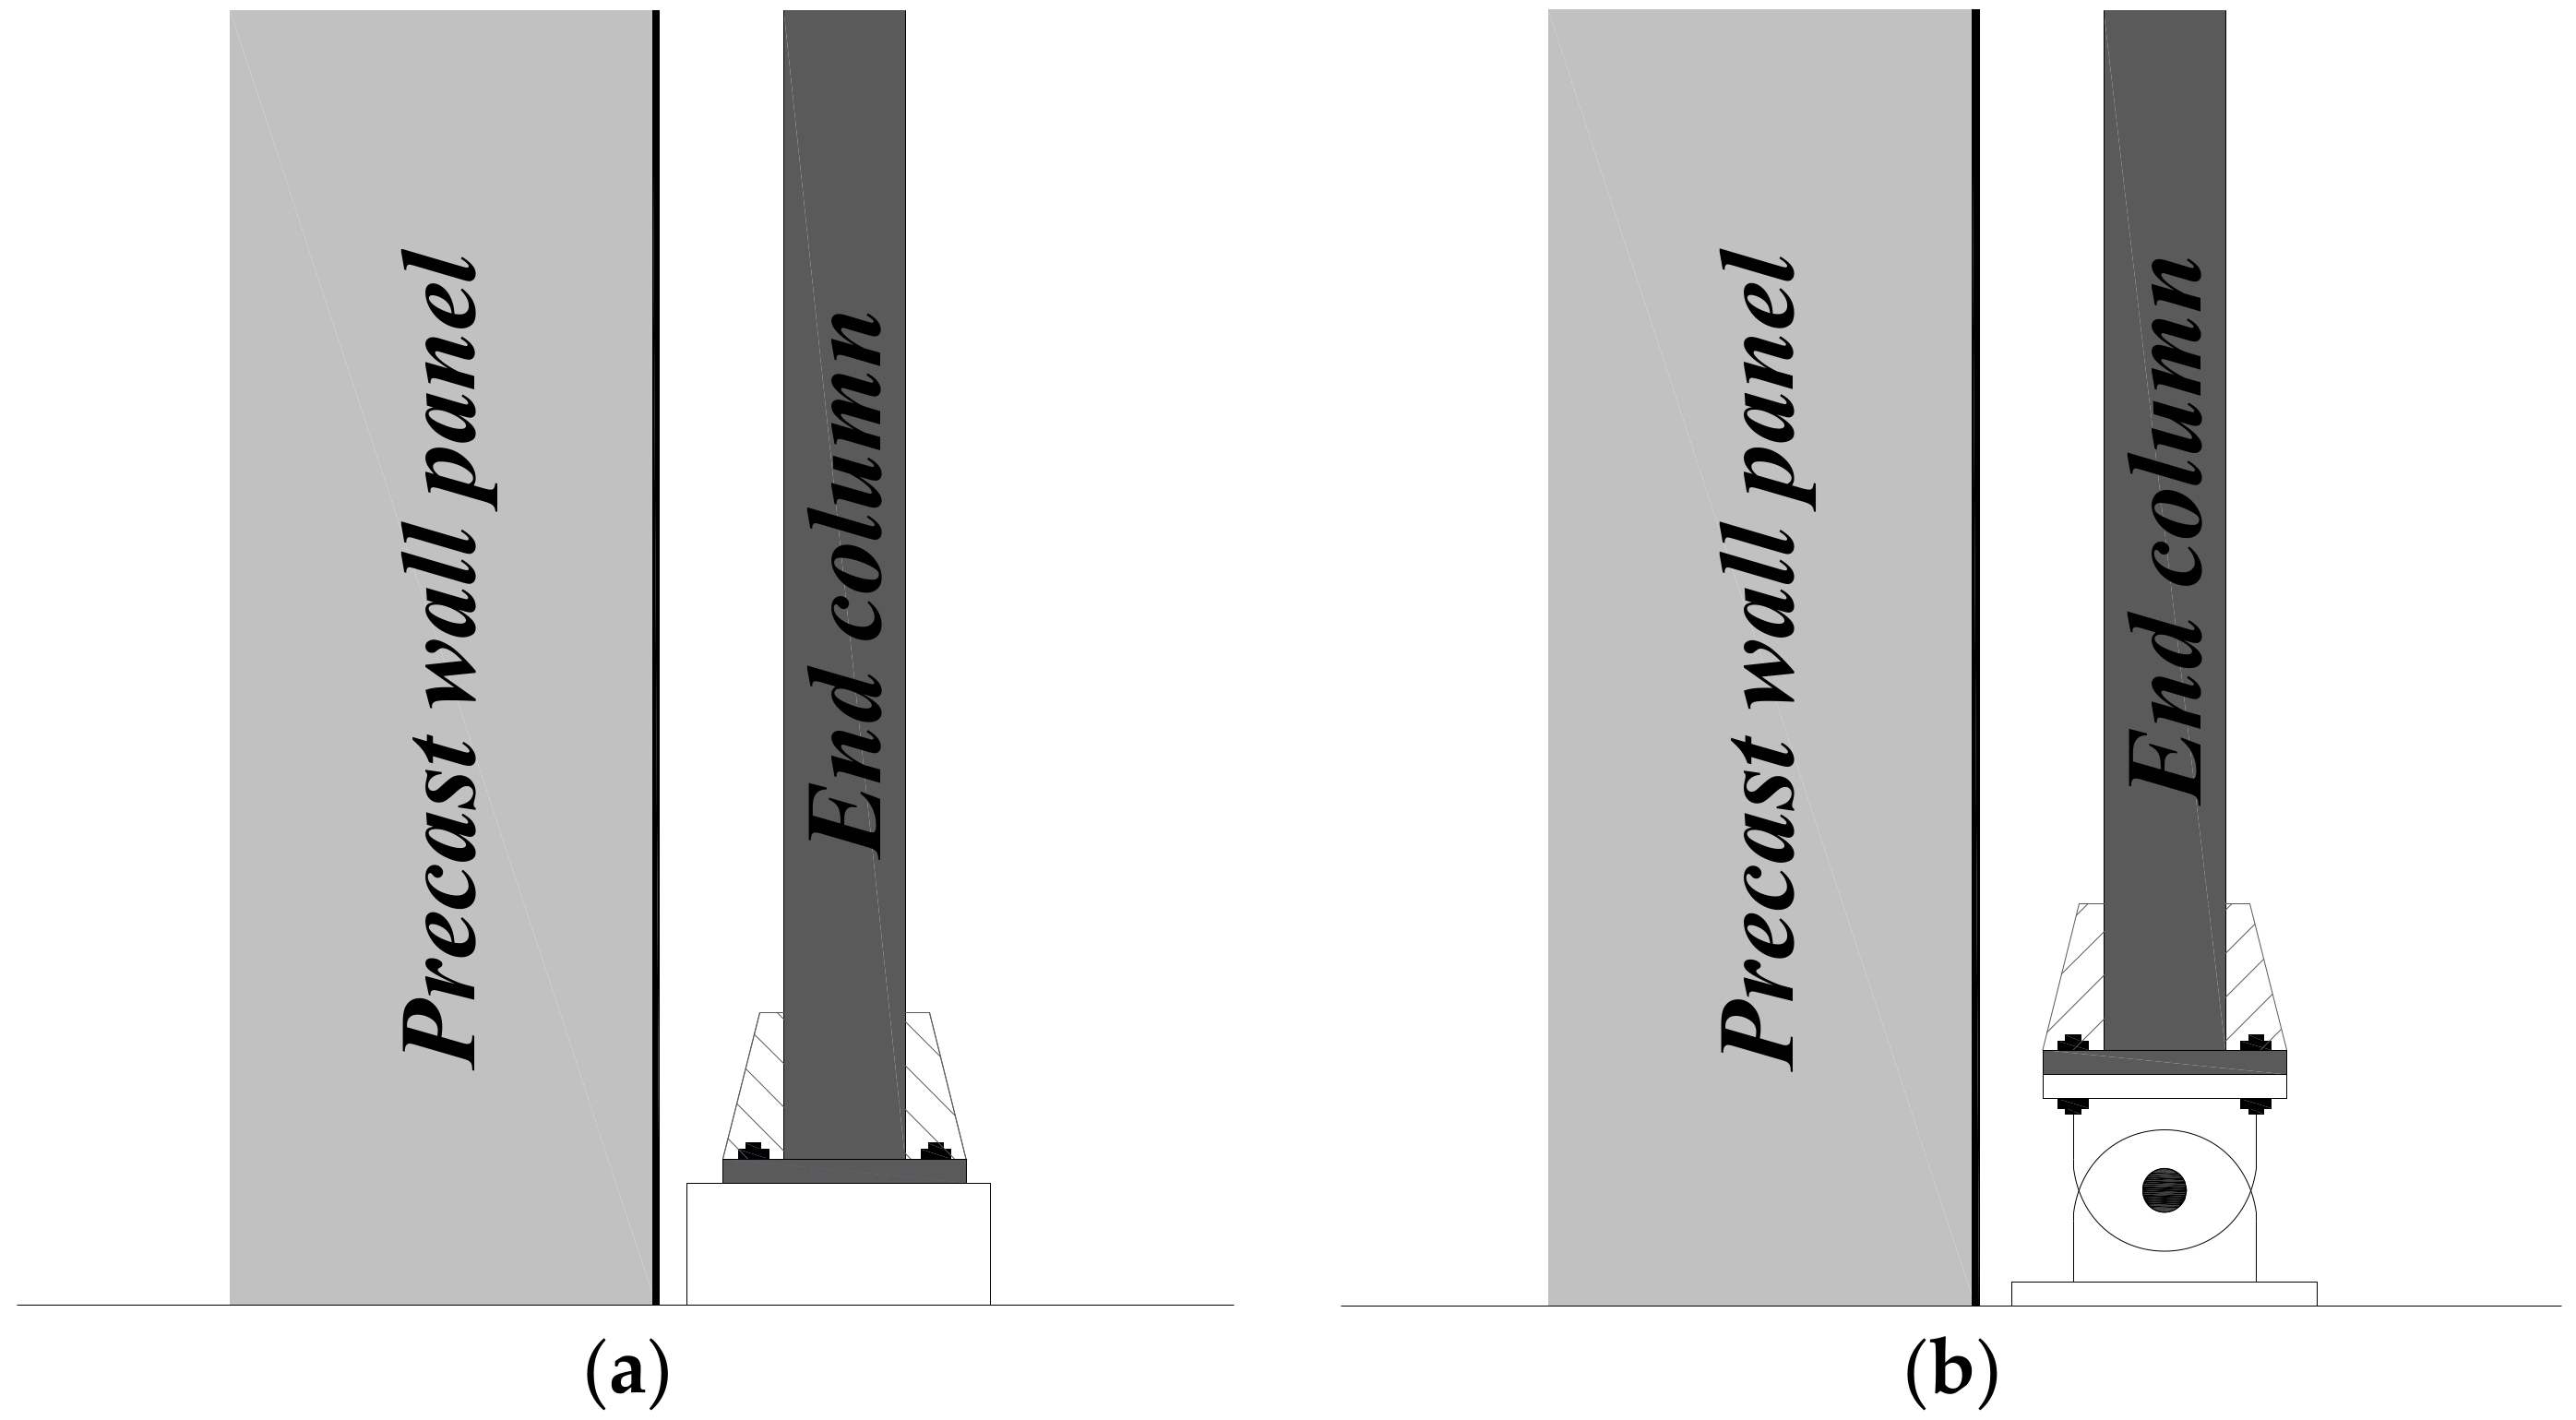
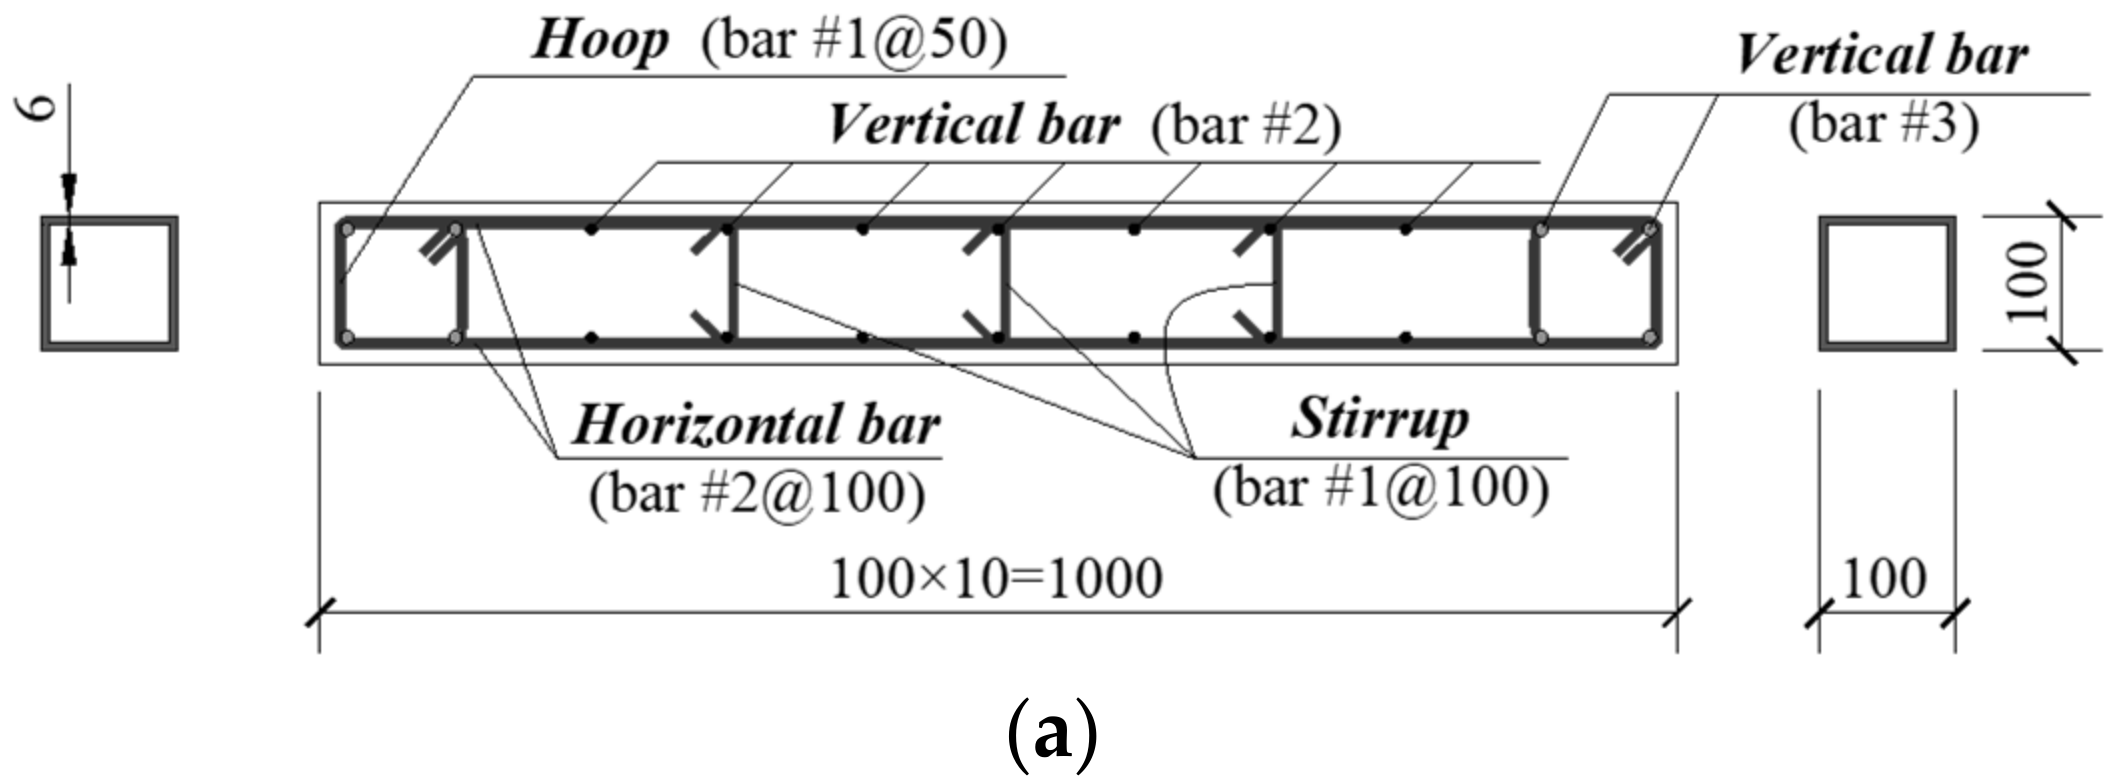
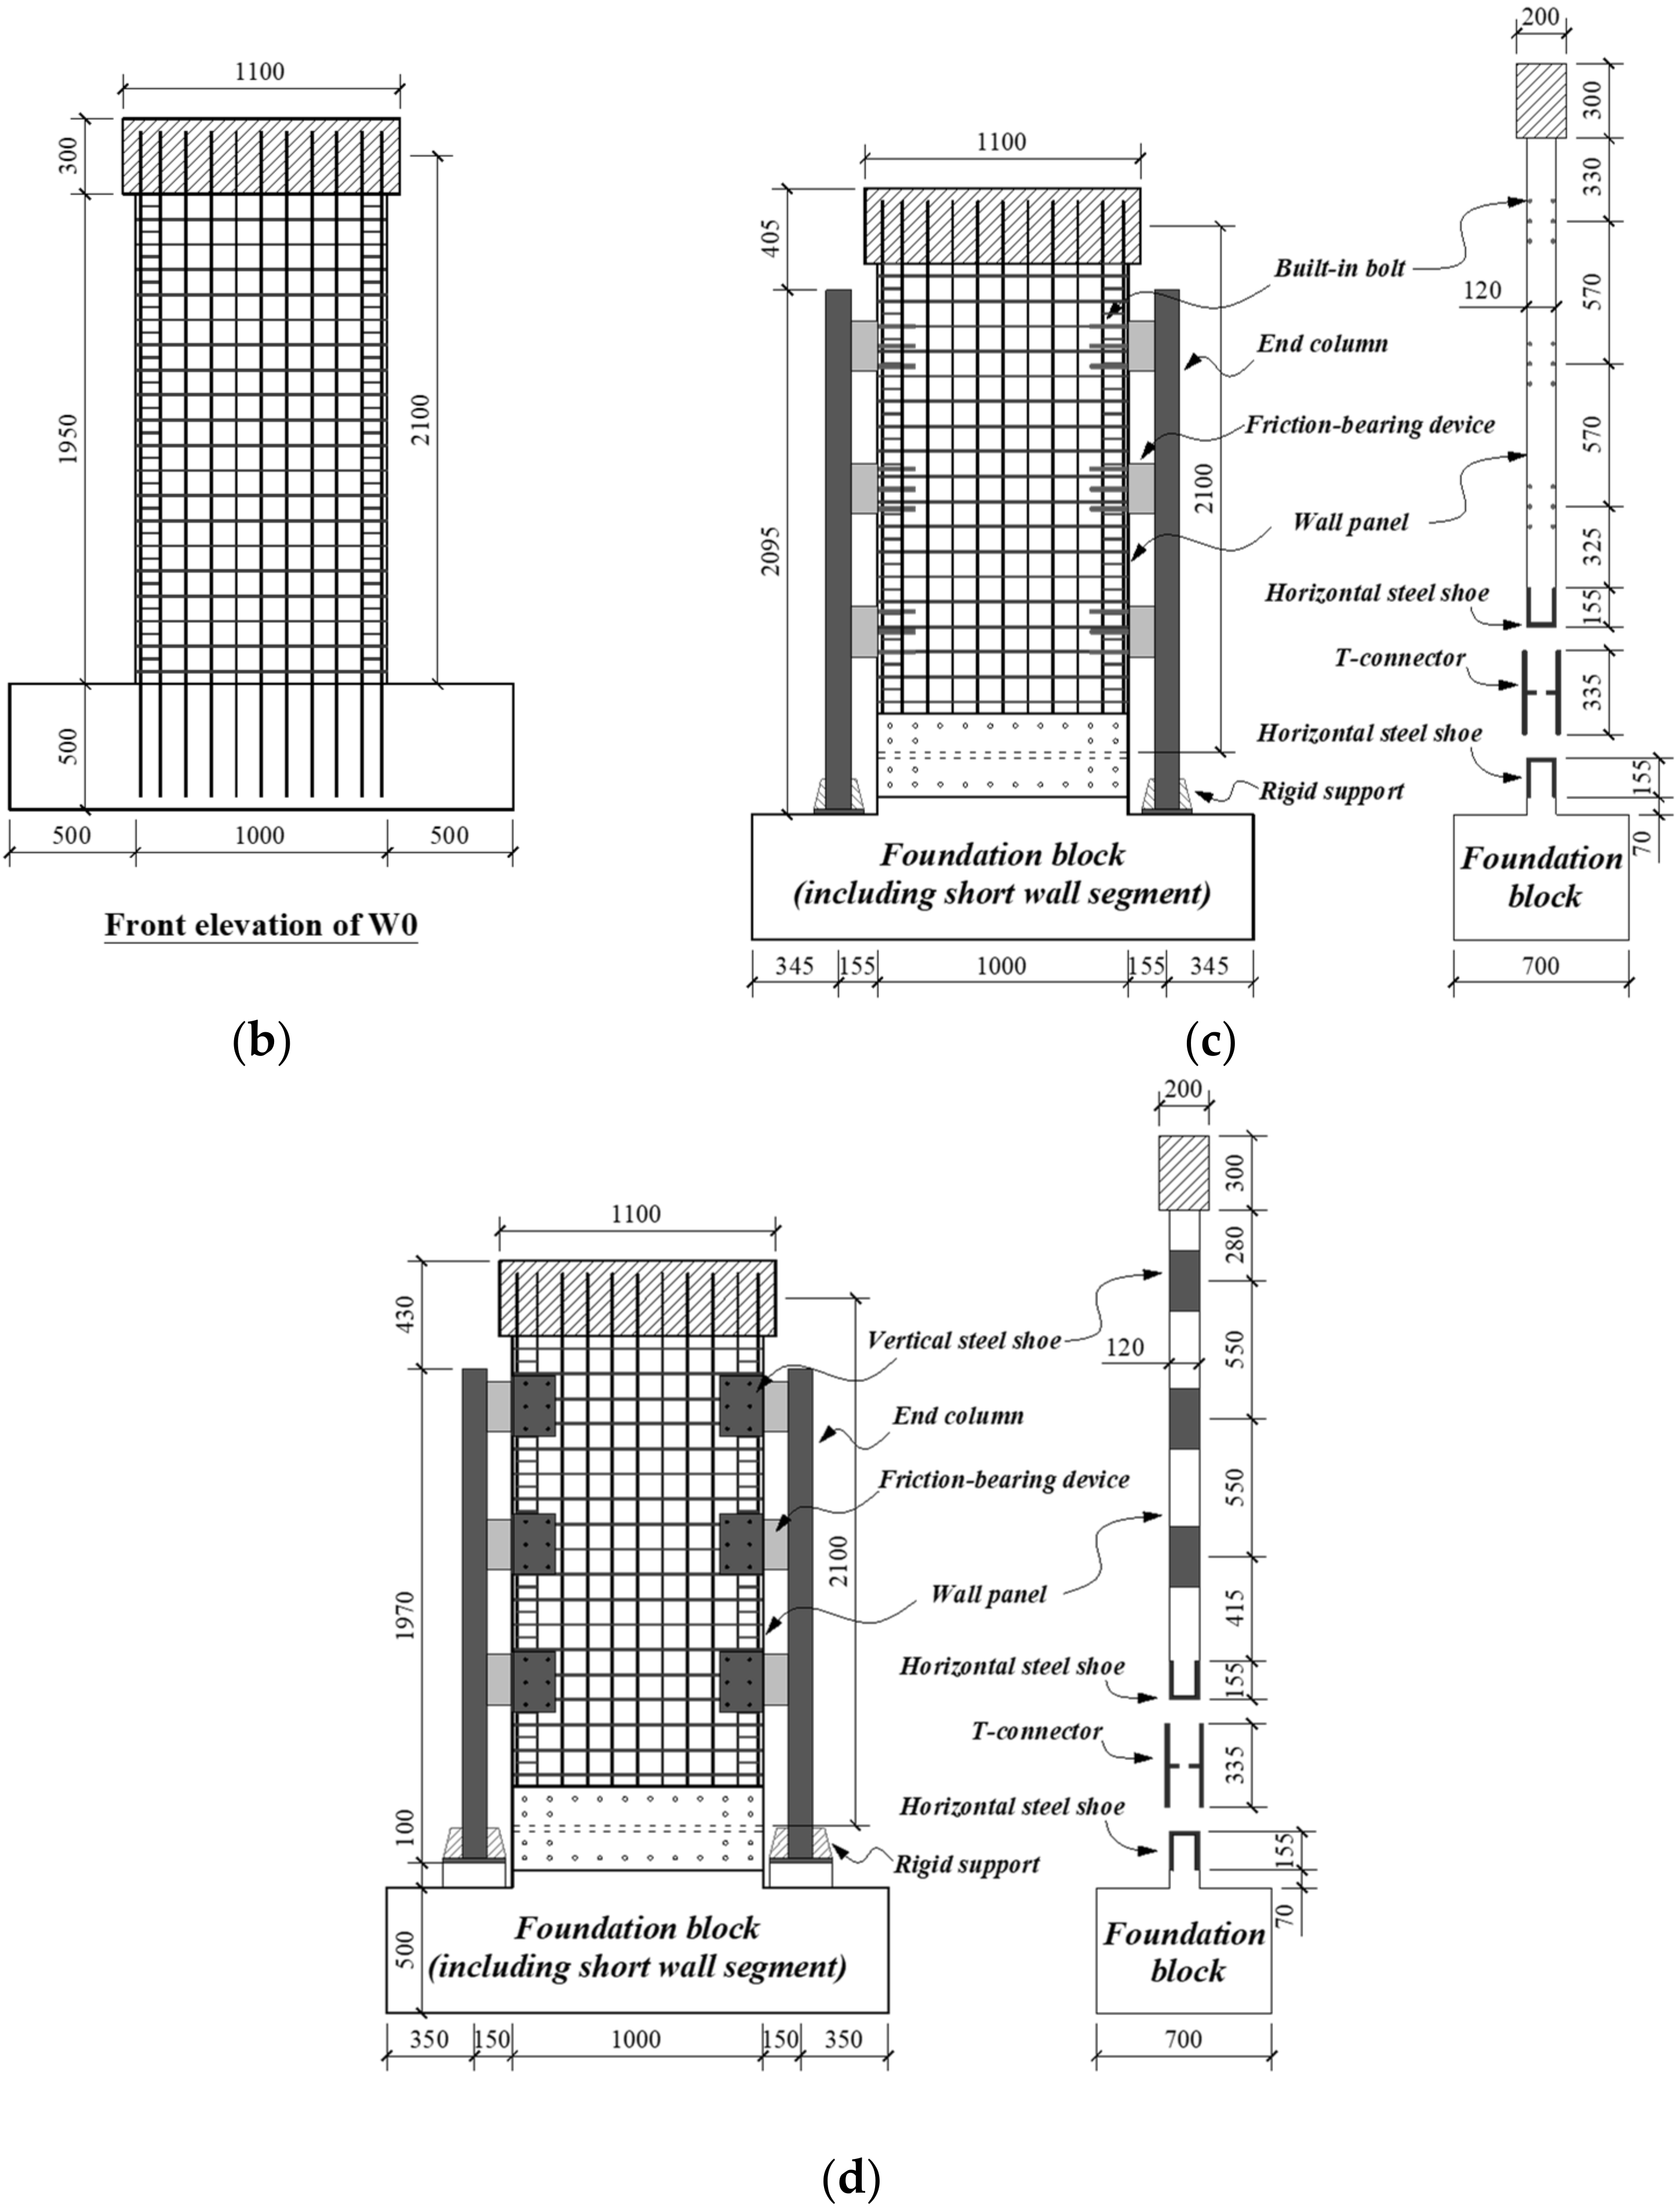
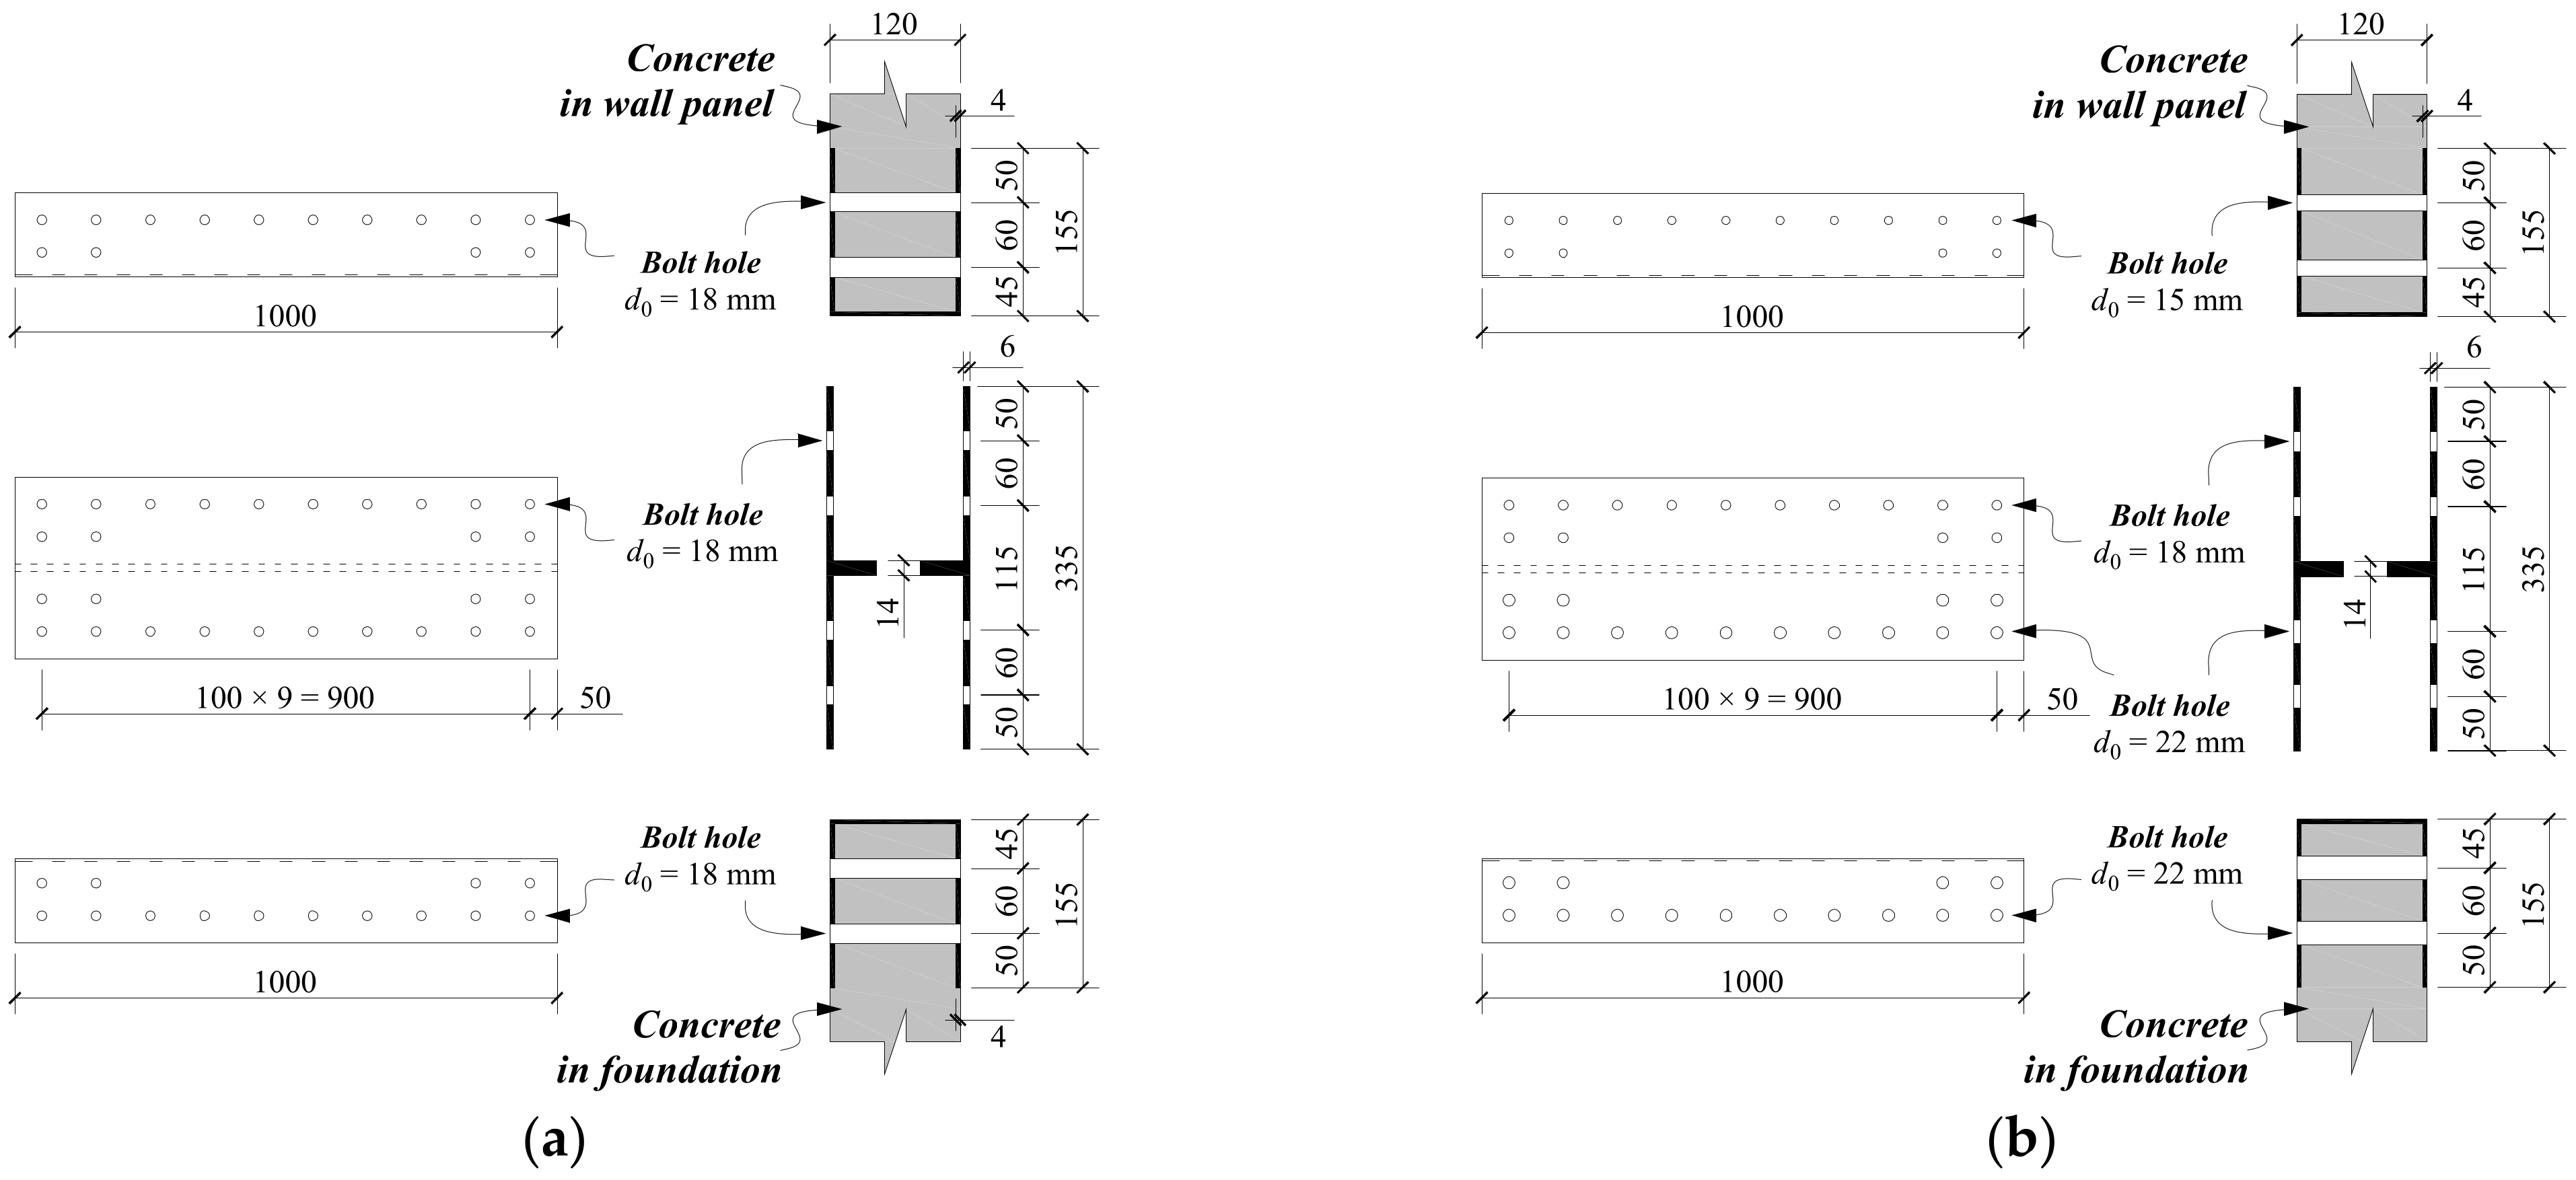
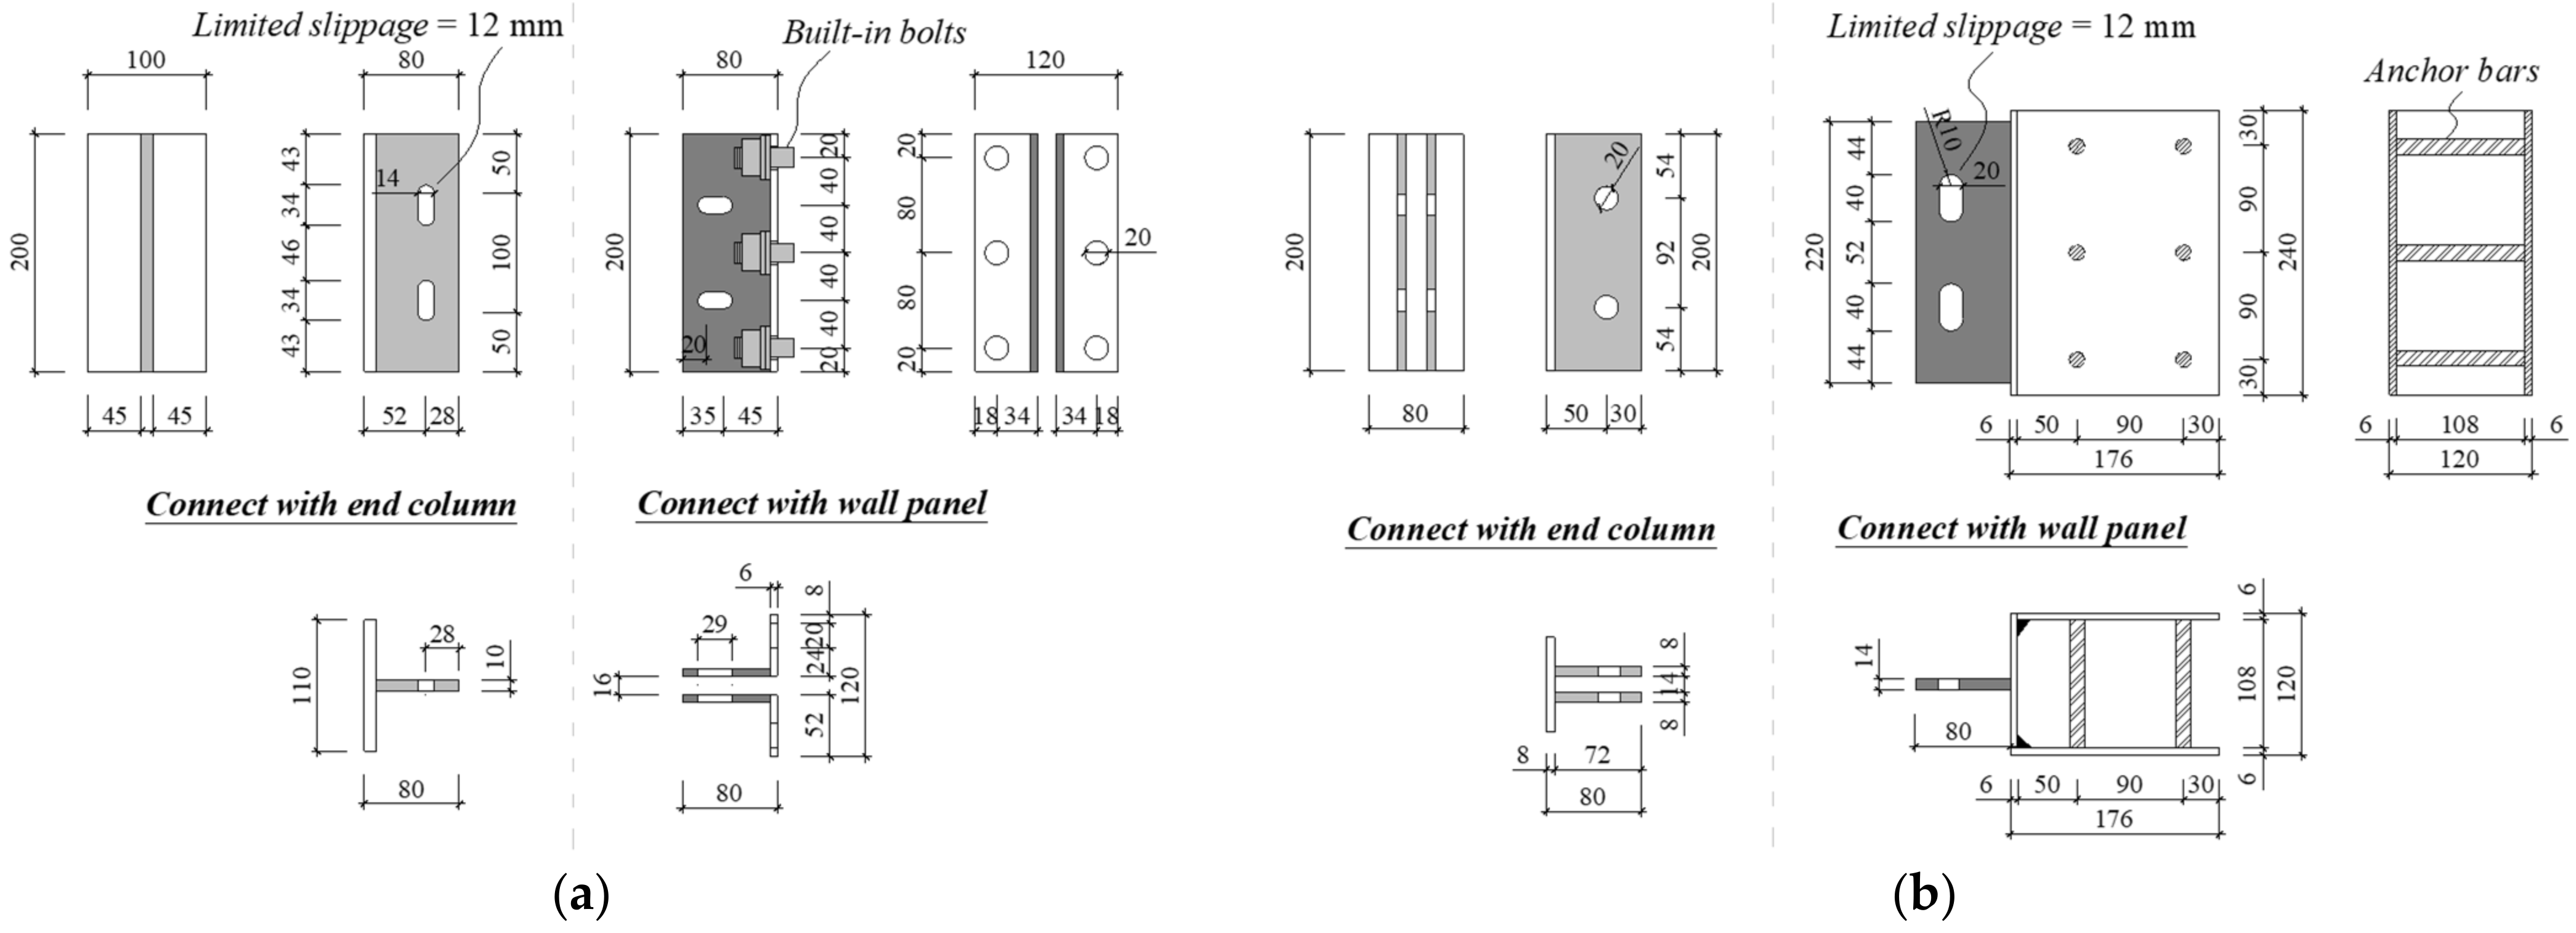
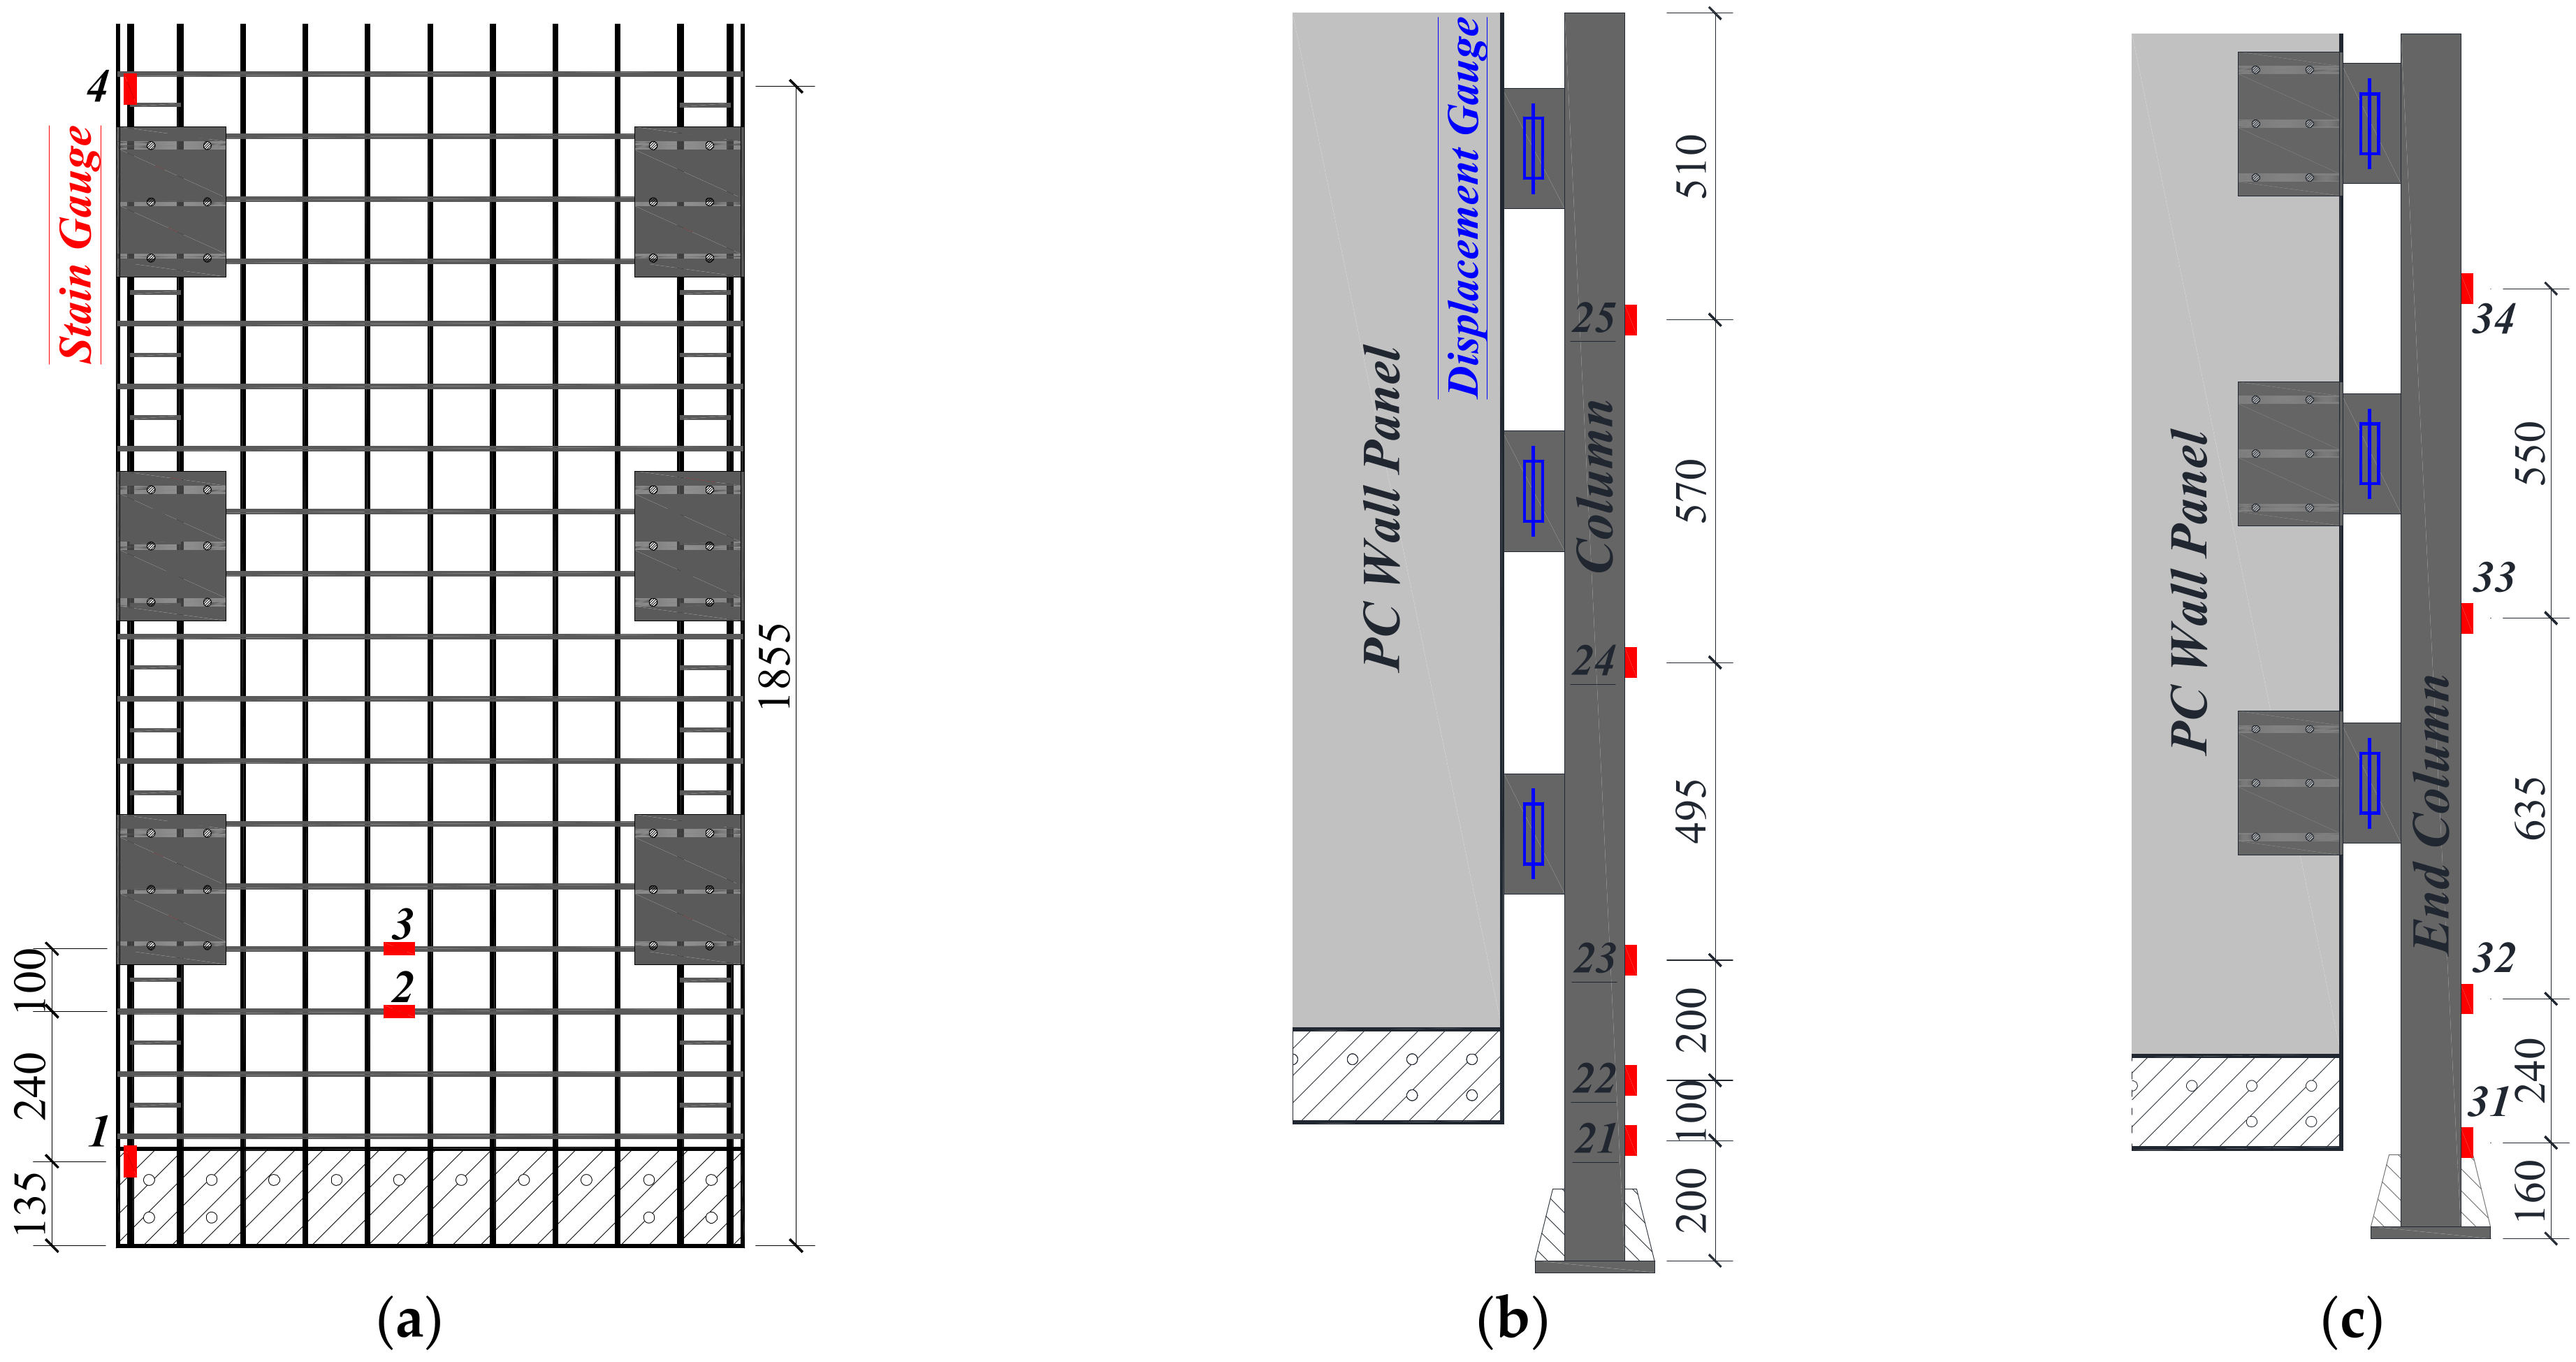
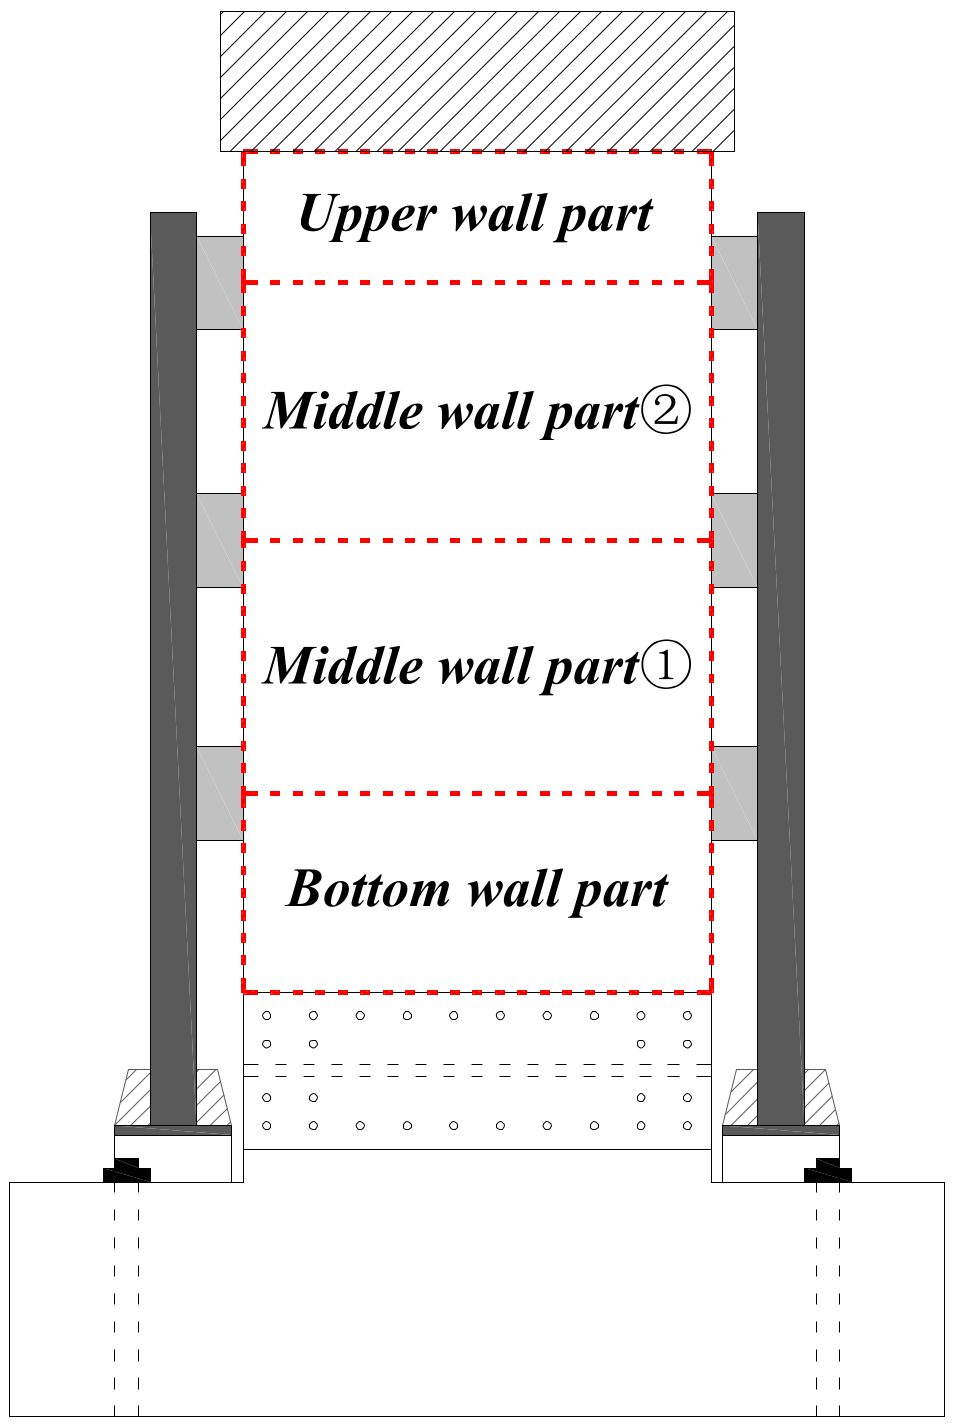
2.1. Testing Walls
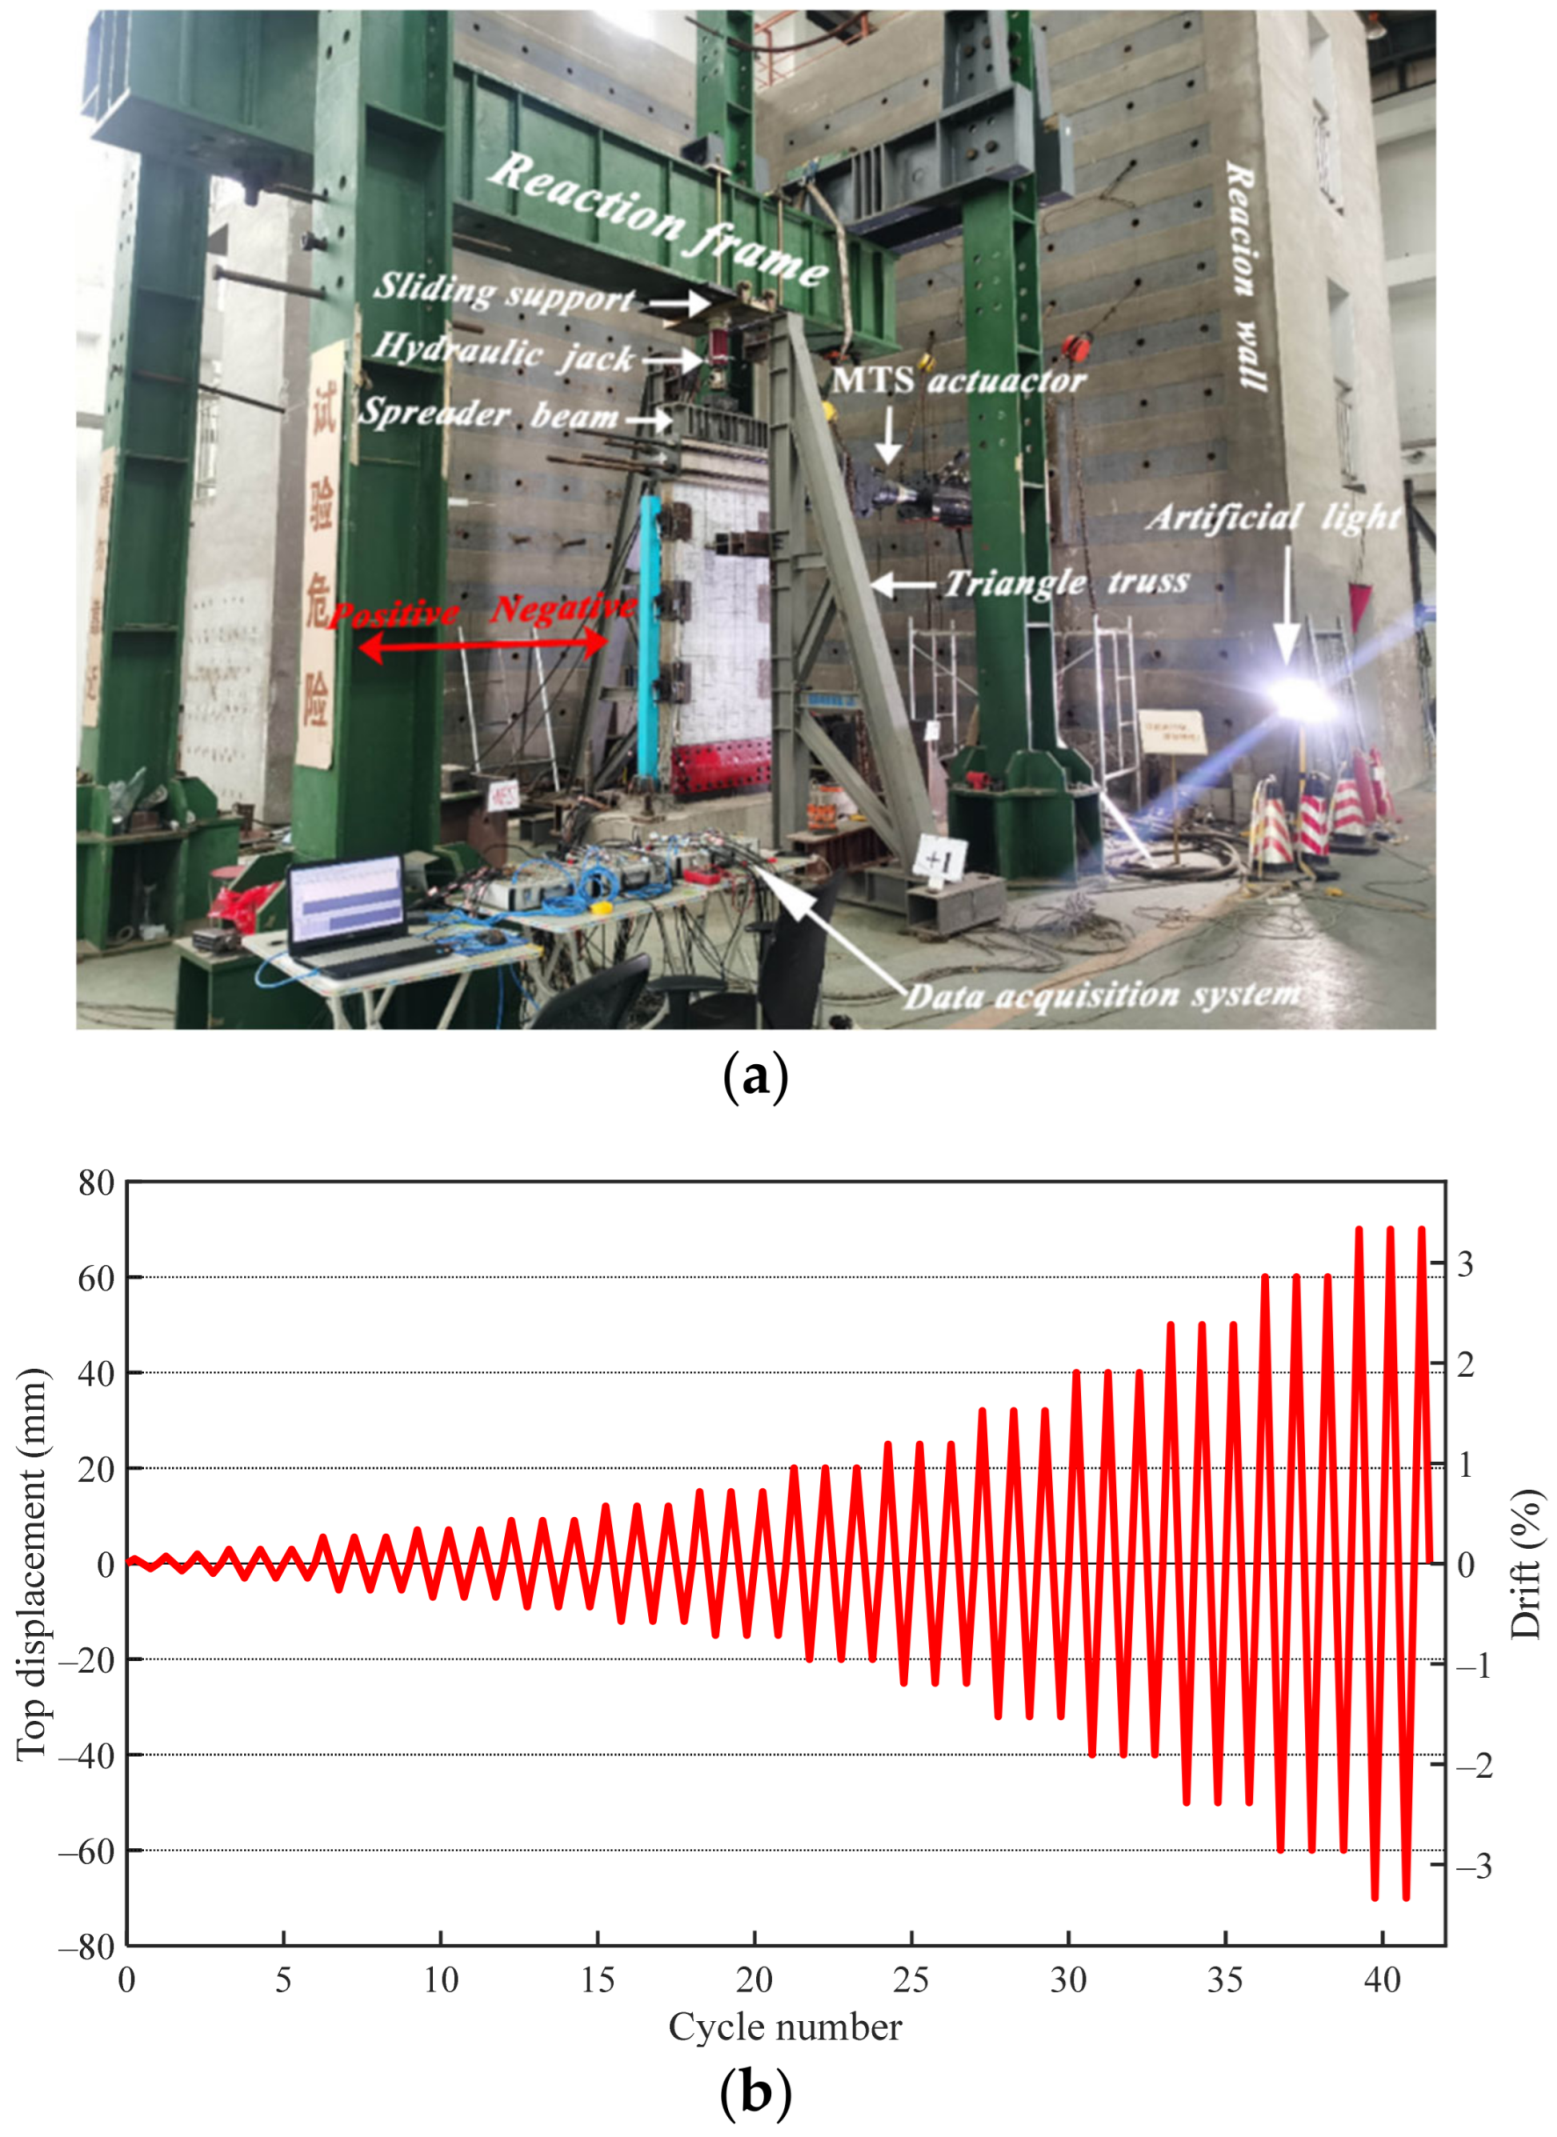
2.2. Loading Scheme
3. Experimental Results
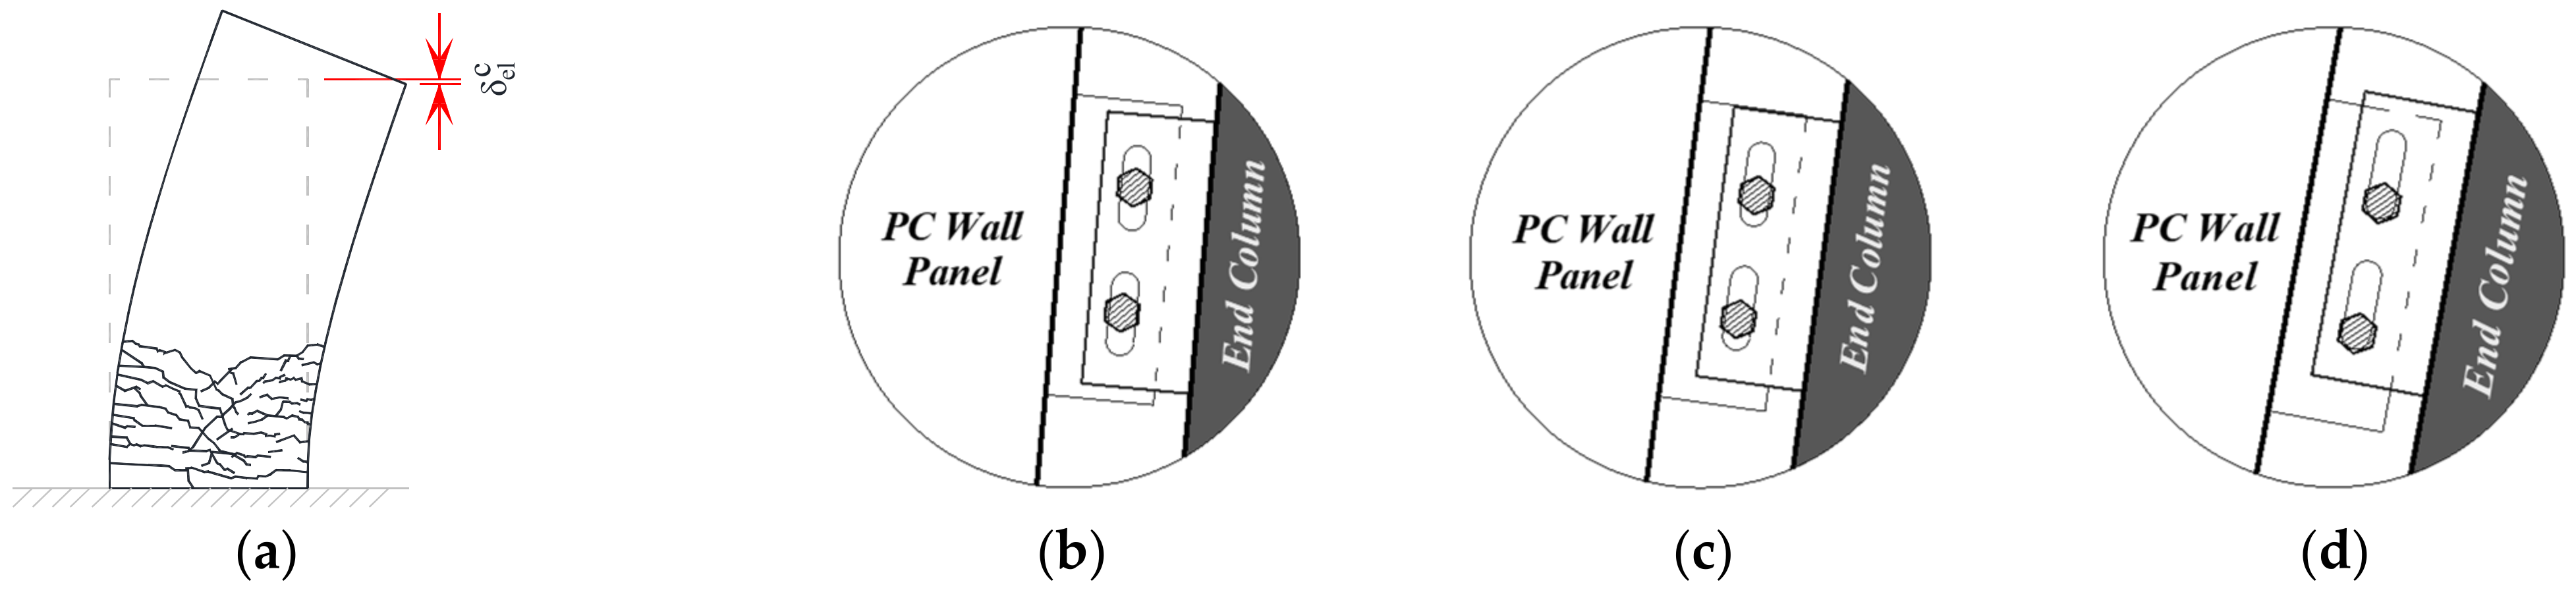
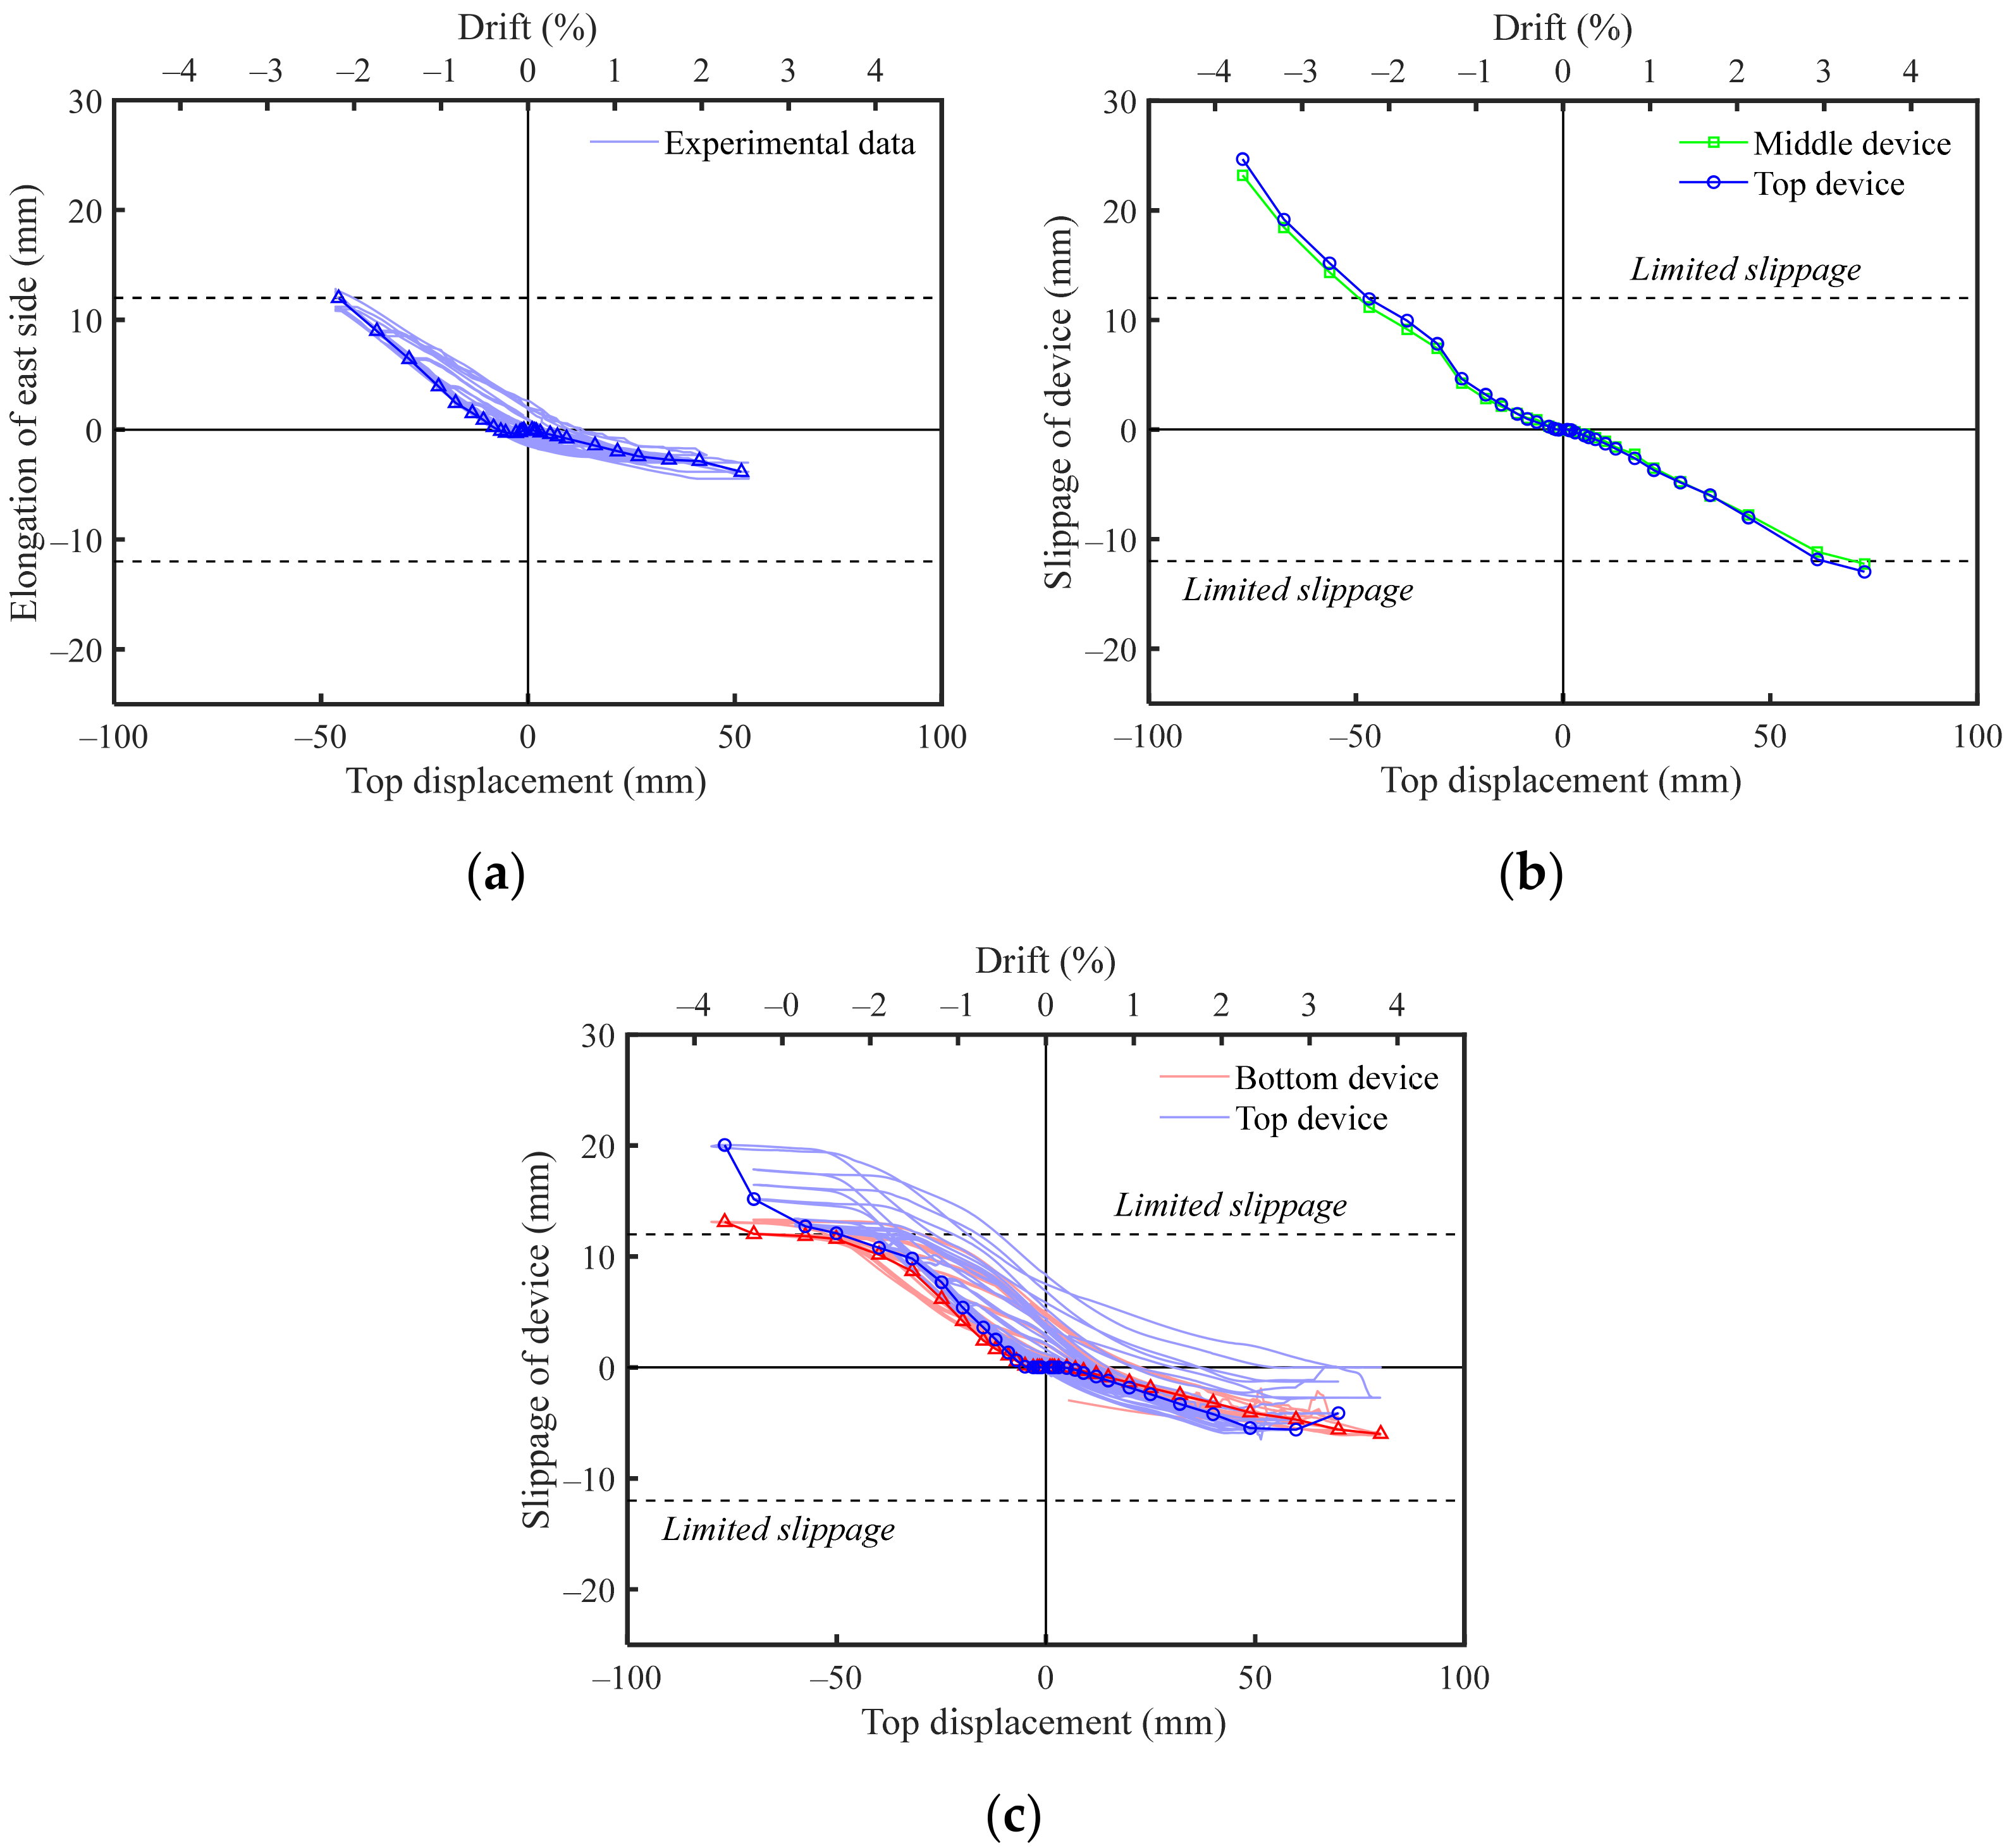
3.1. Working Mechanism and Response of Friction-Bearing Devices
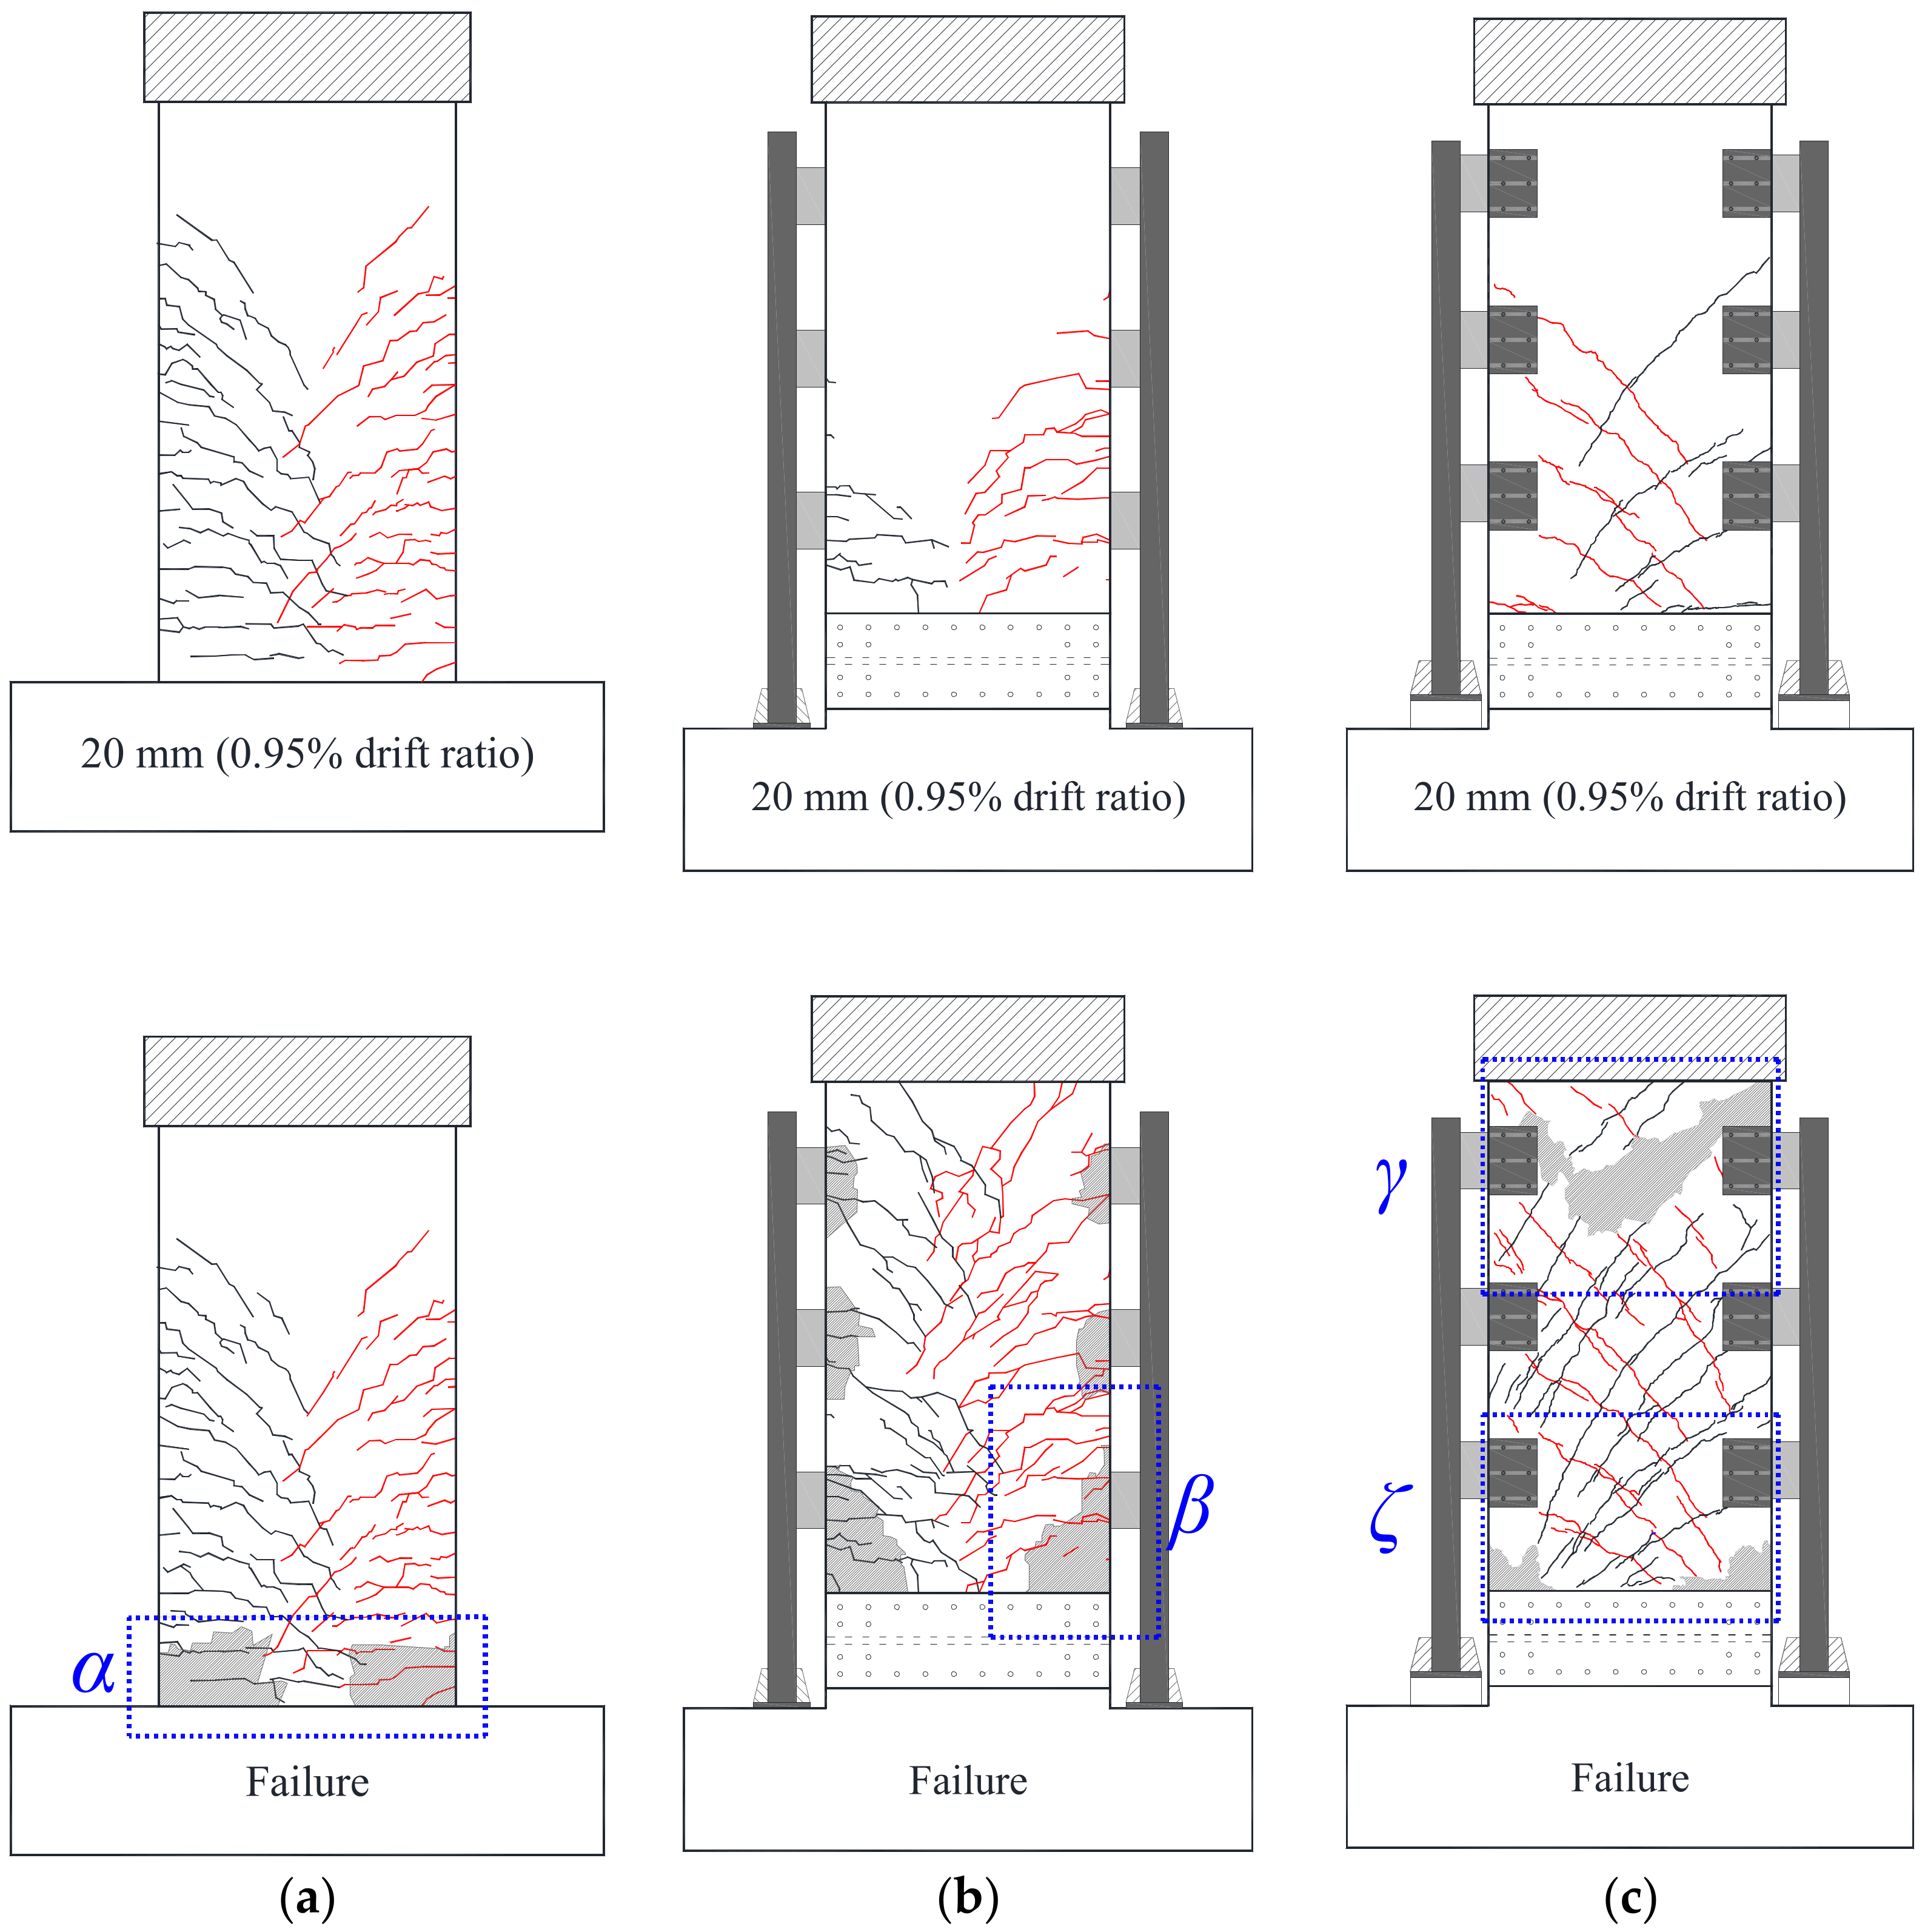
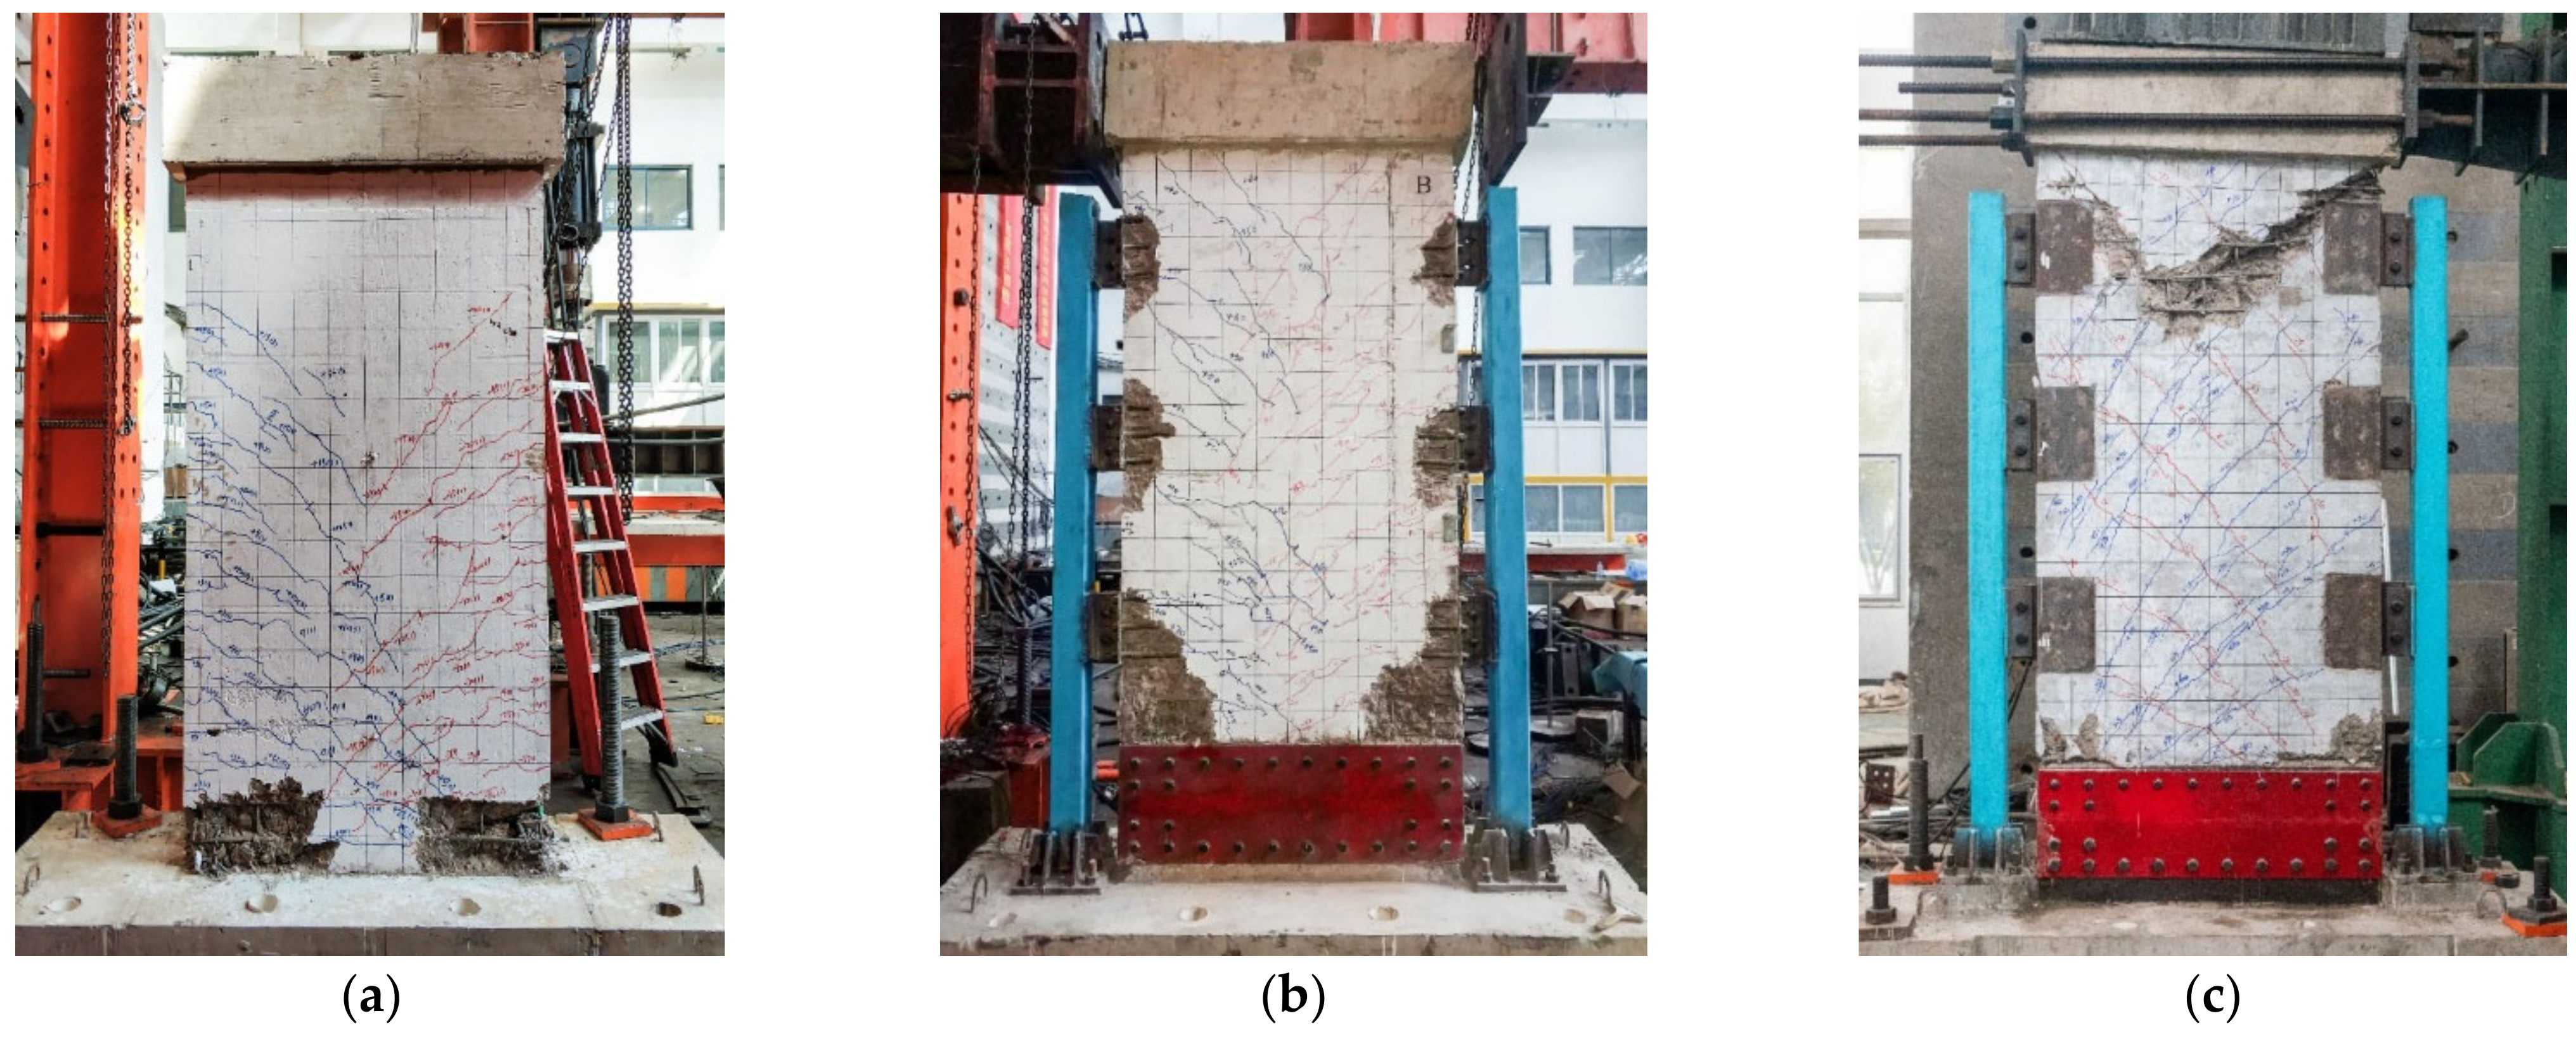
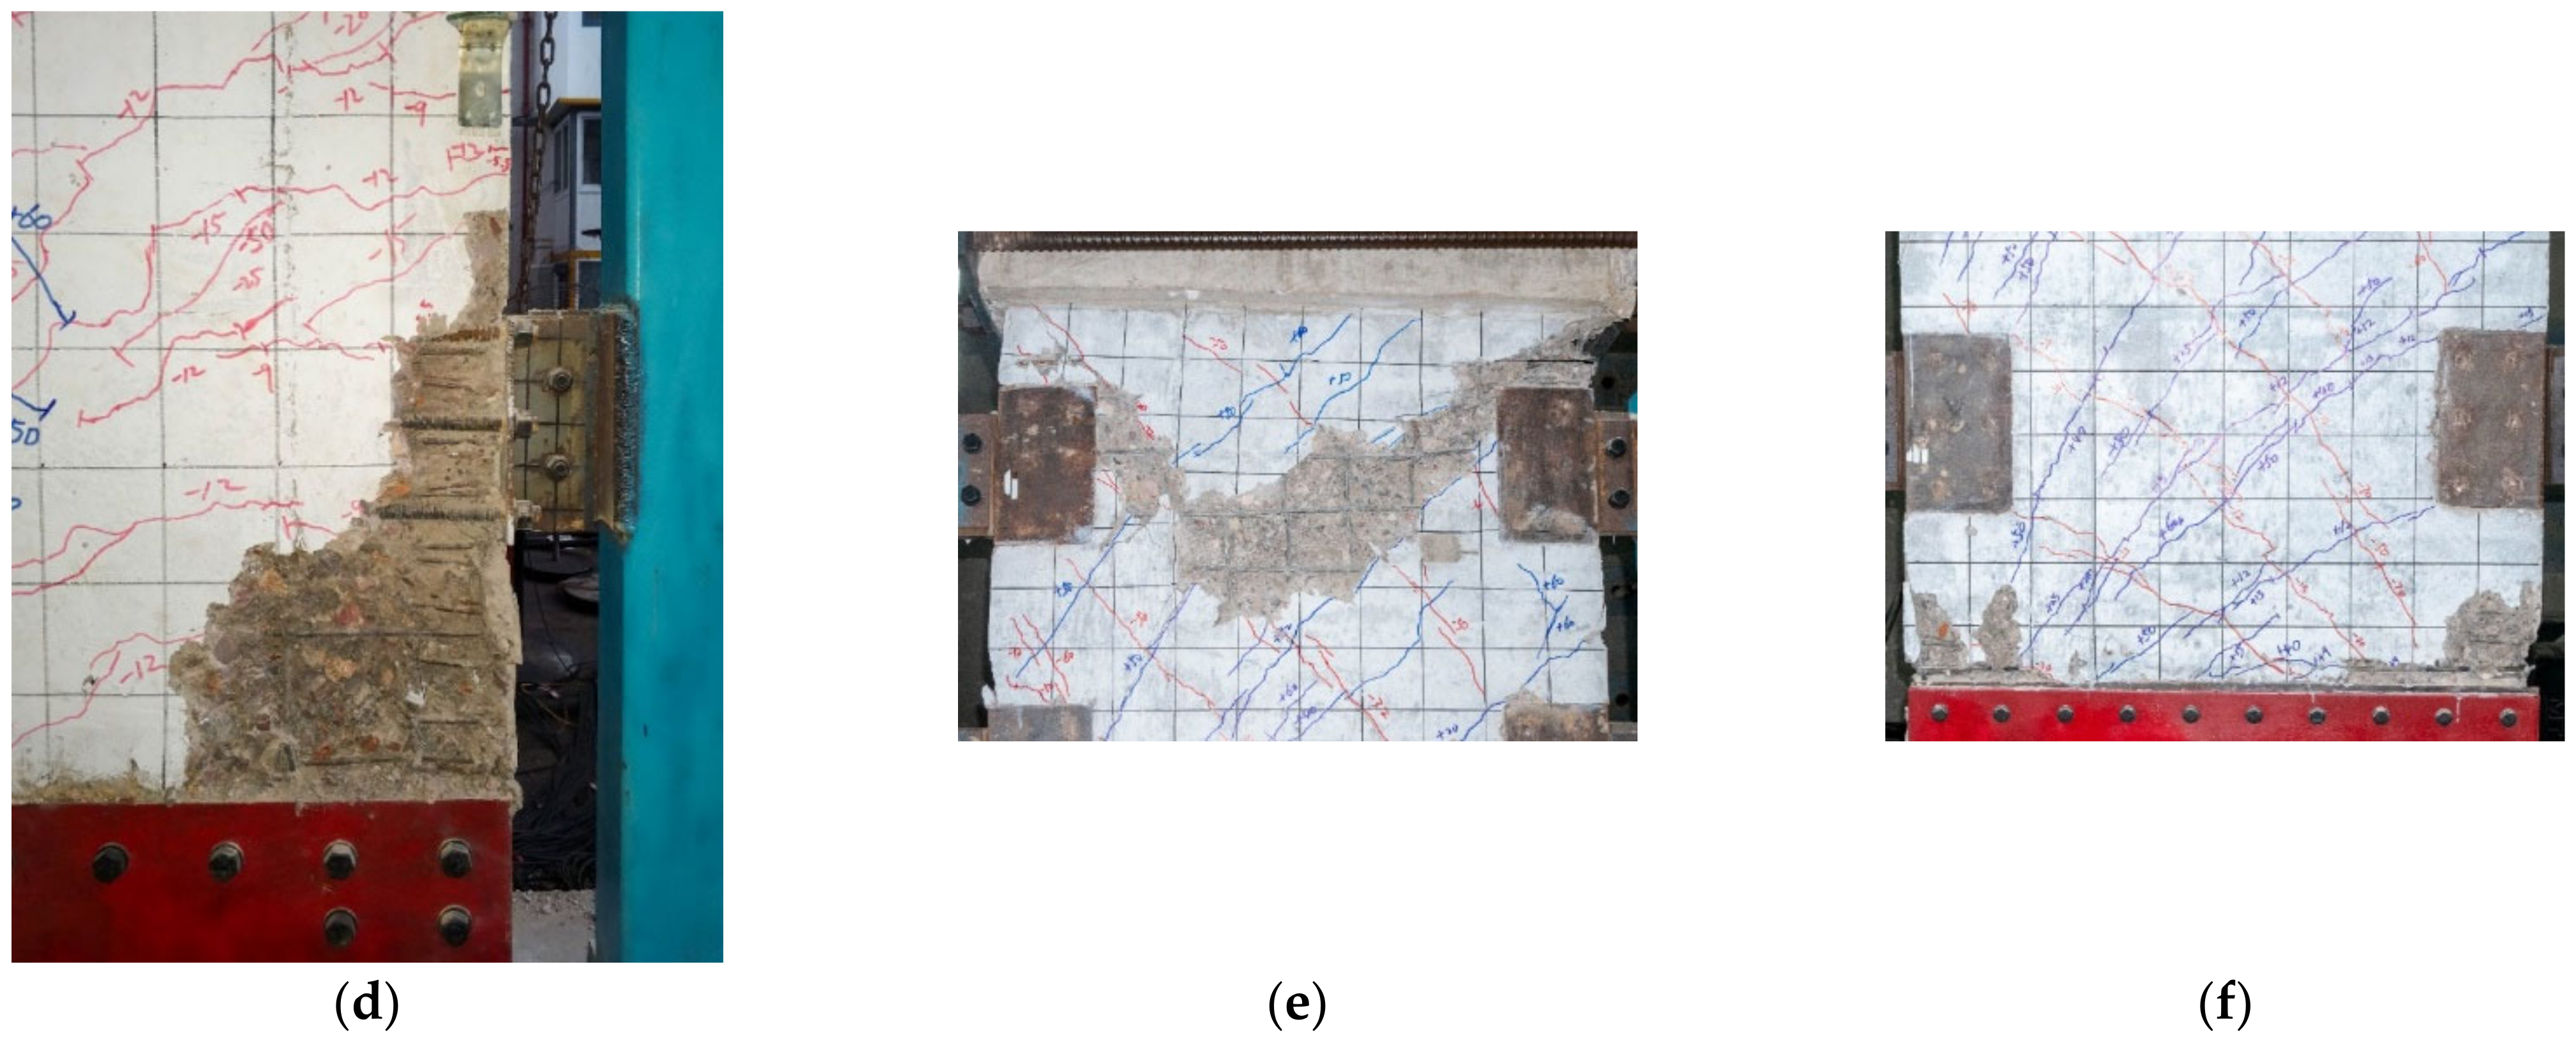
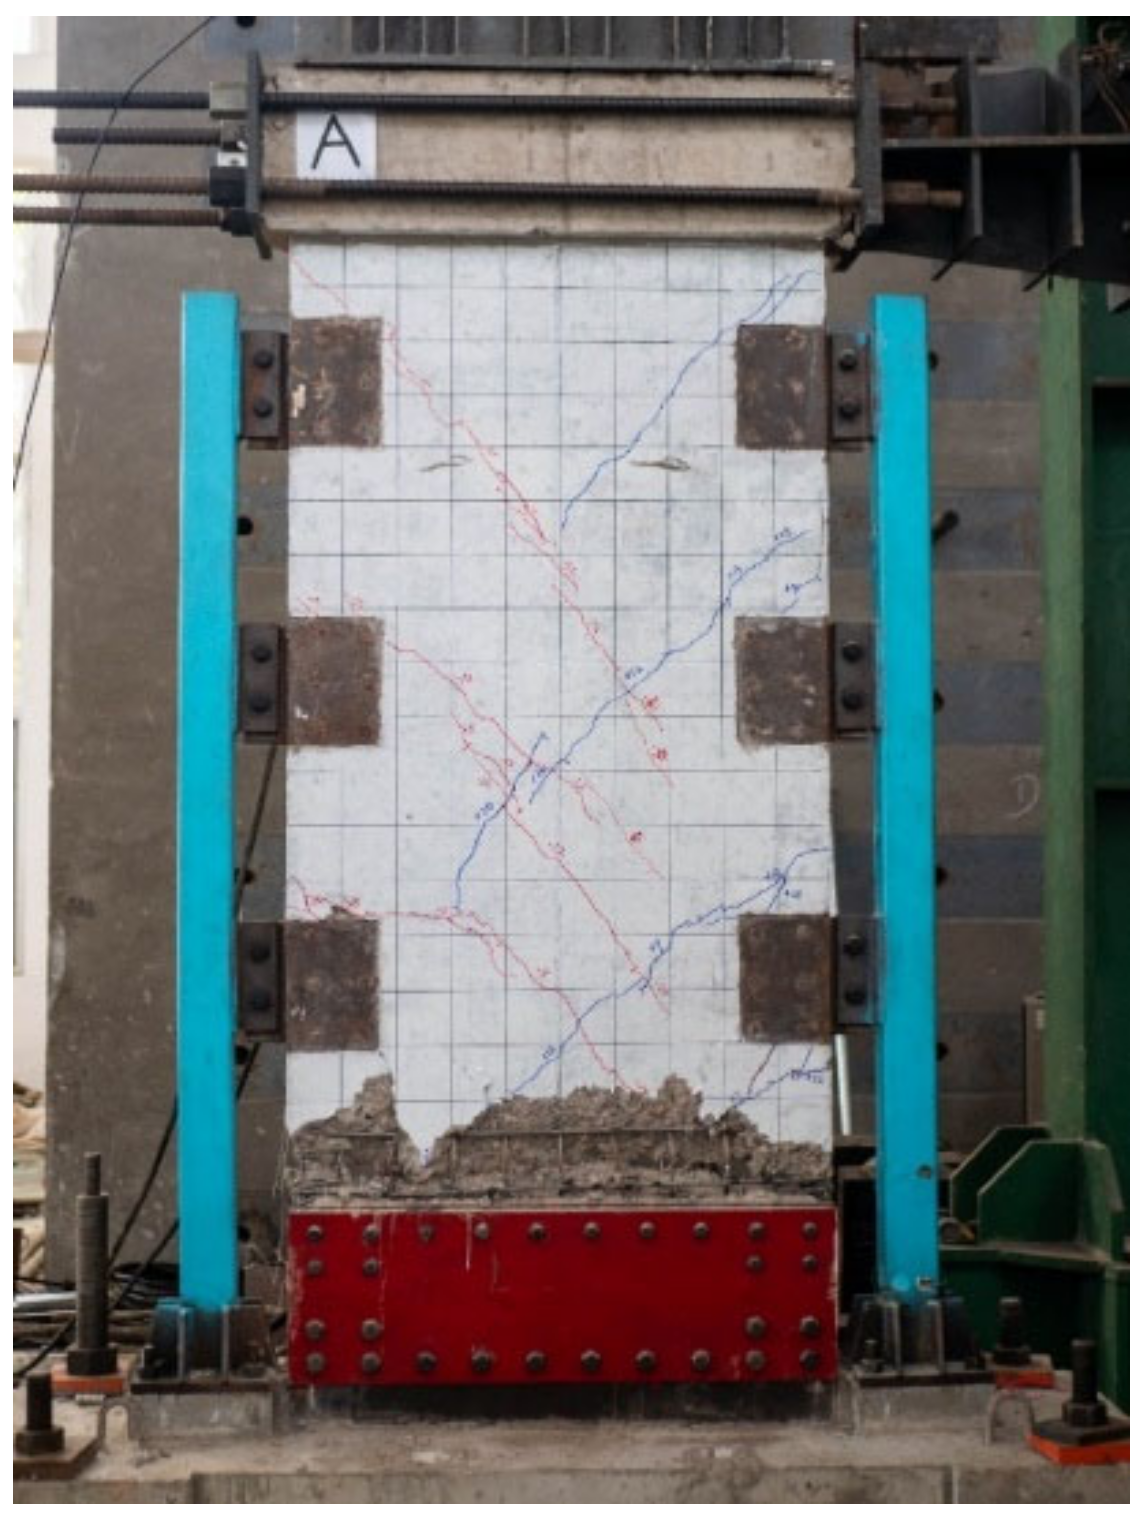
3.2. Damage and Failure Mode
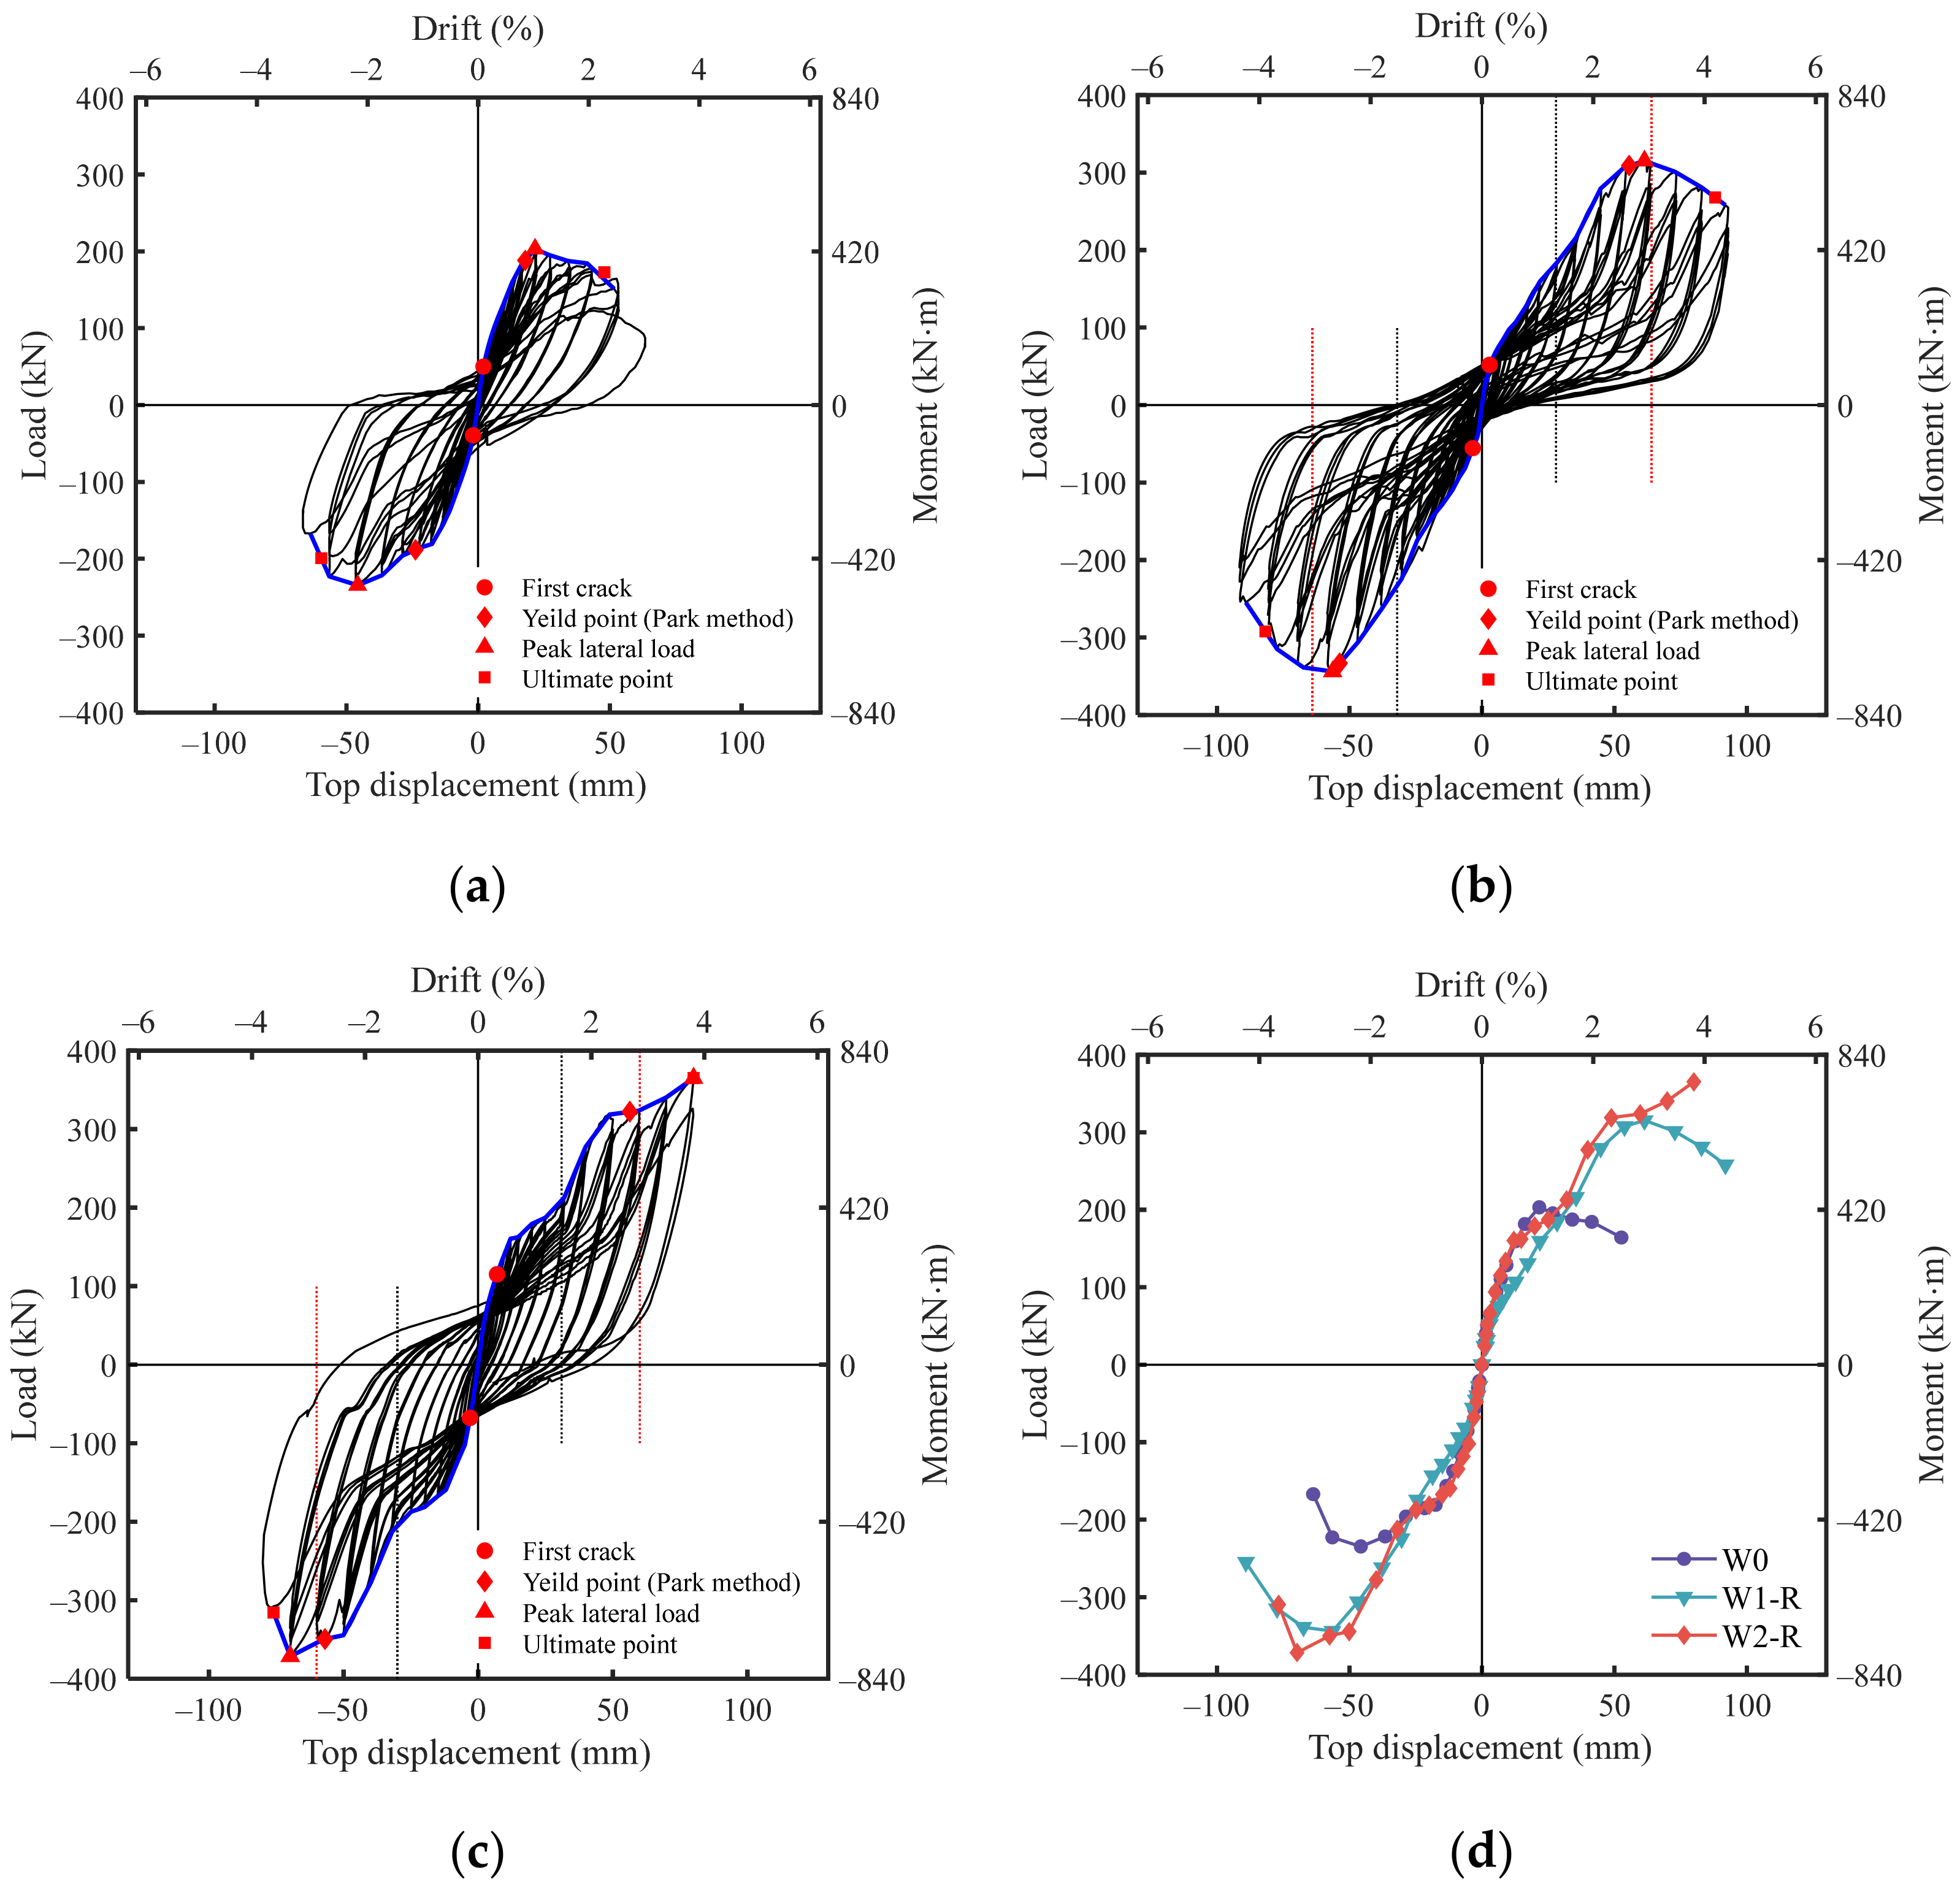
3.3. Lateral Load–Top Displacement Relationship
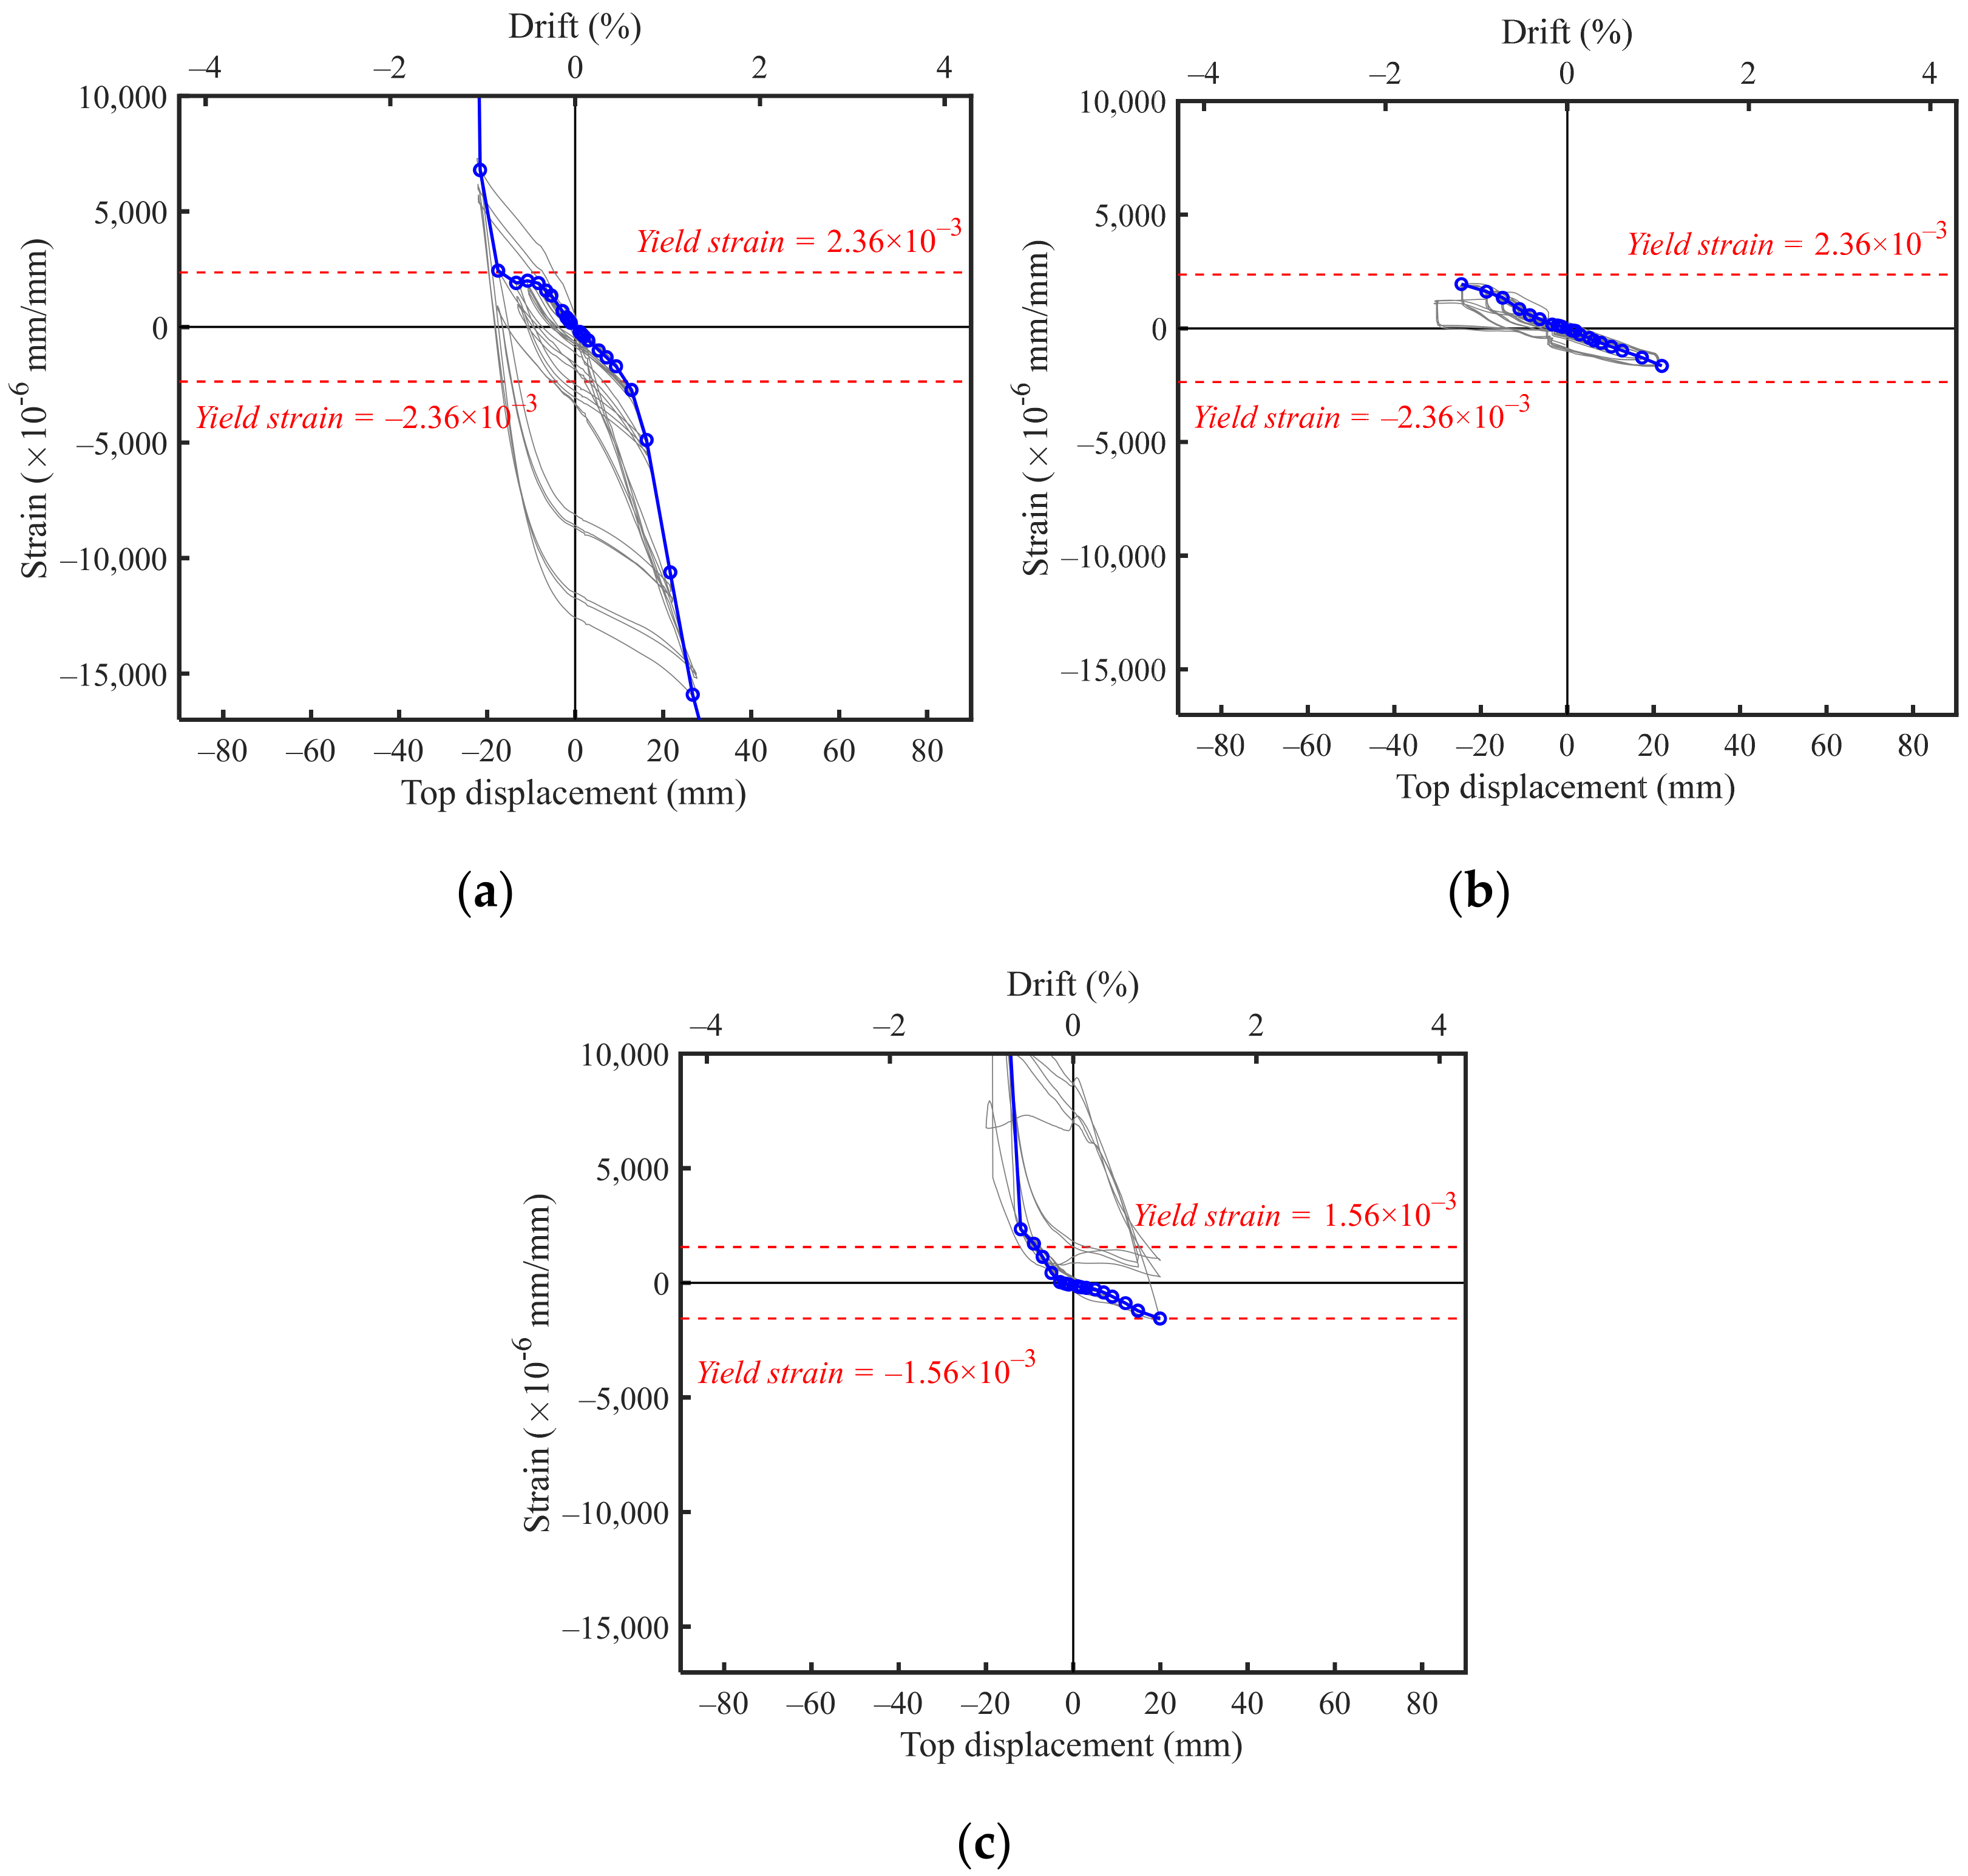
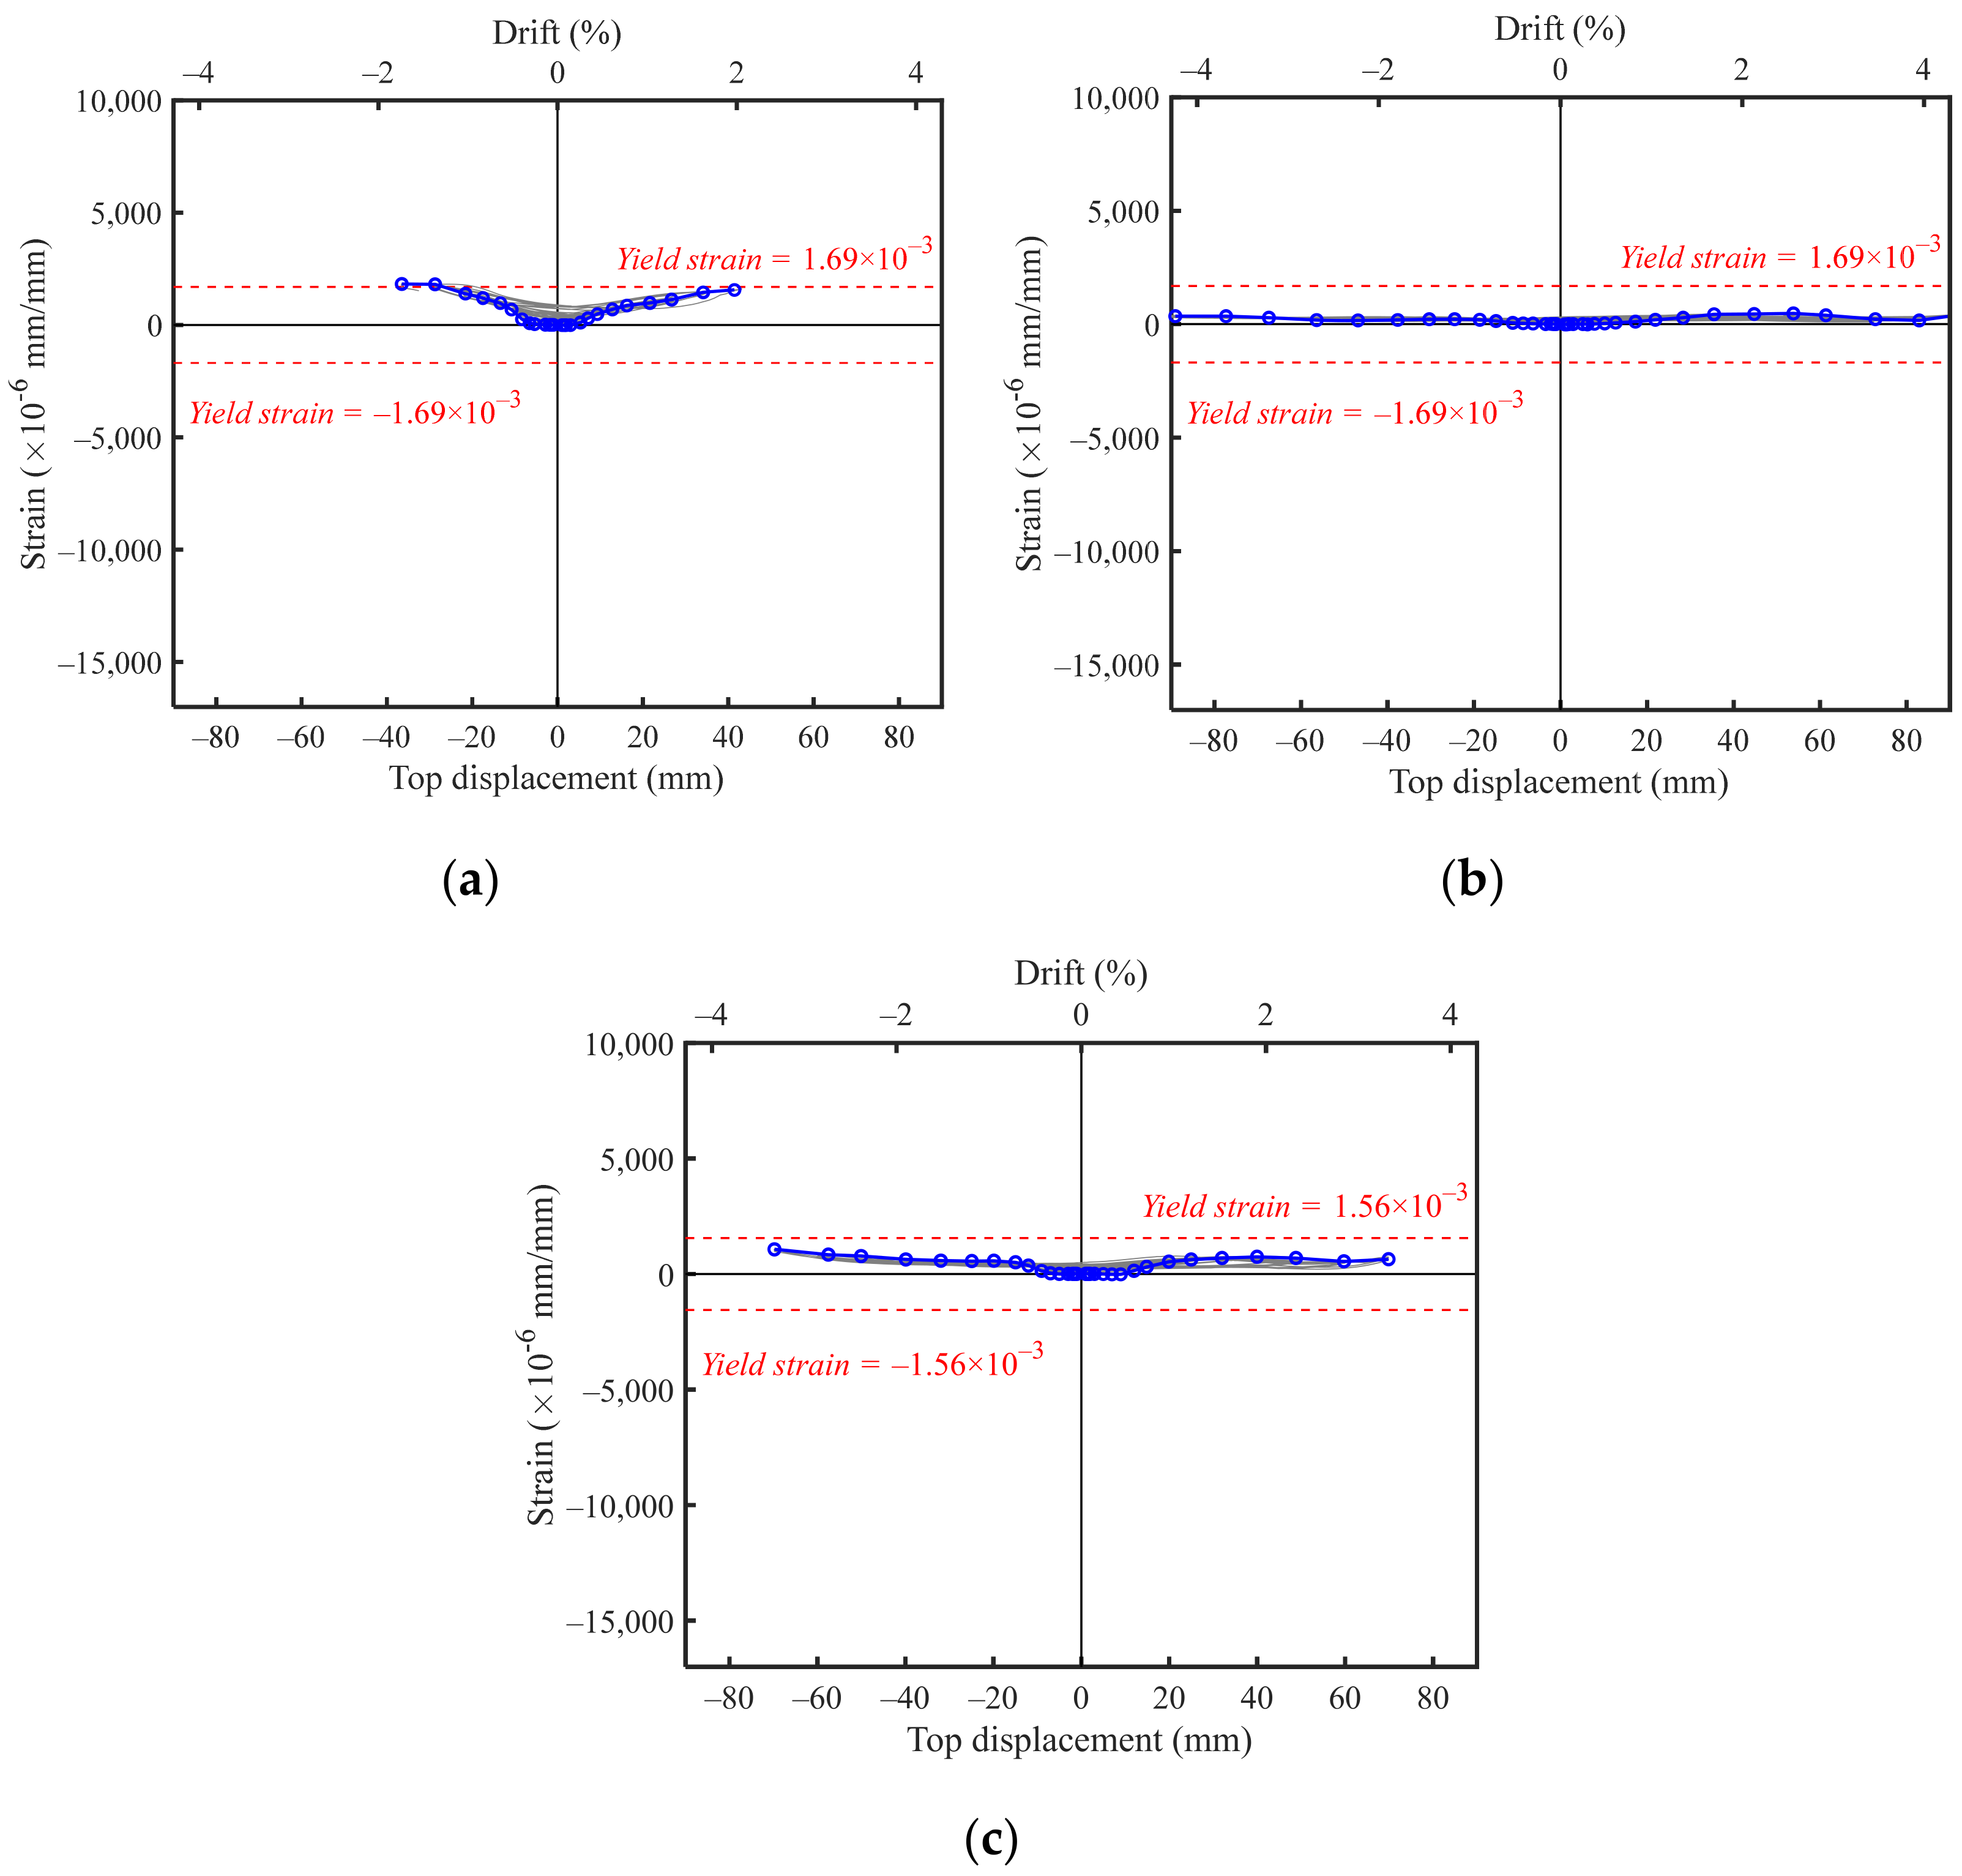
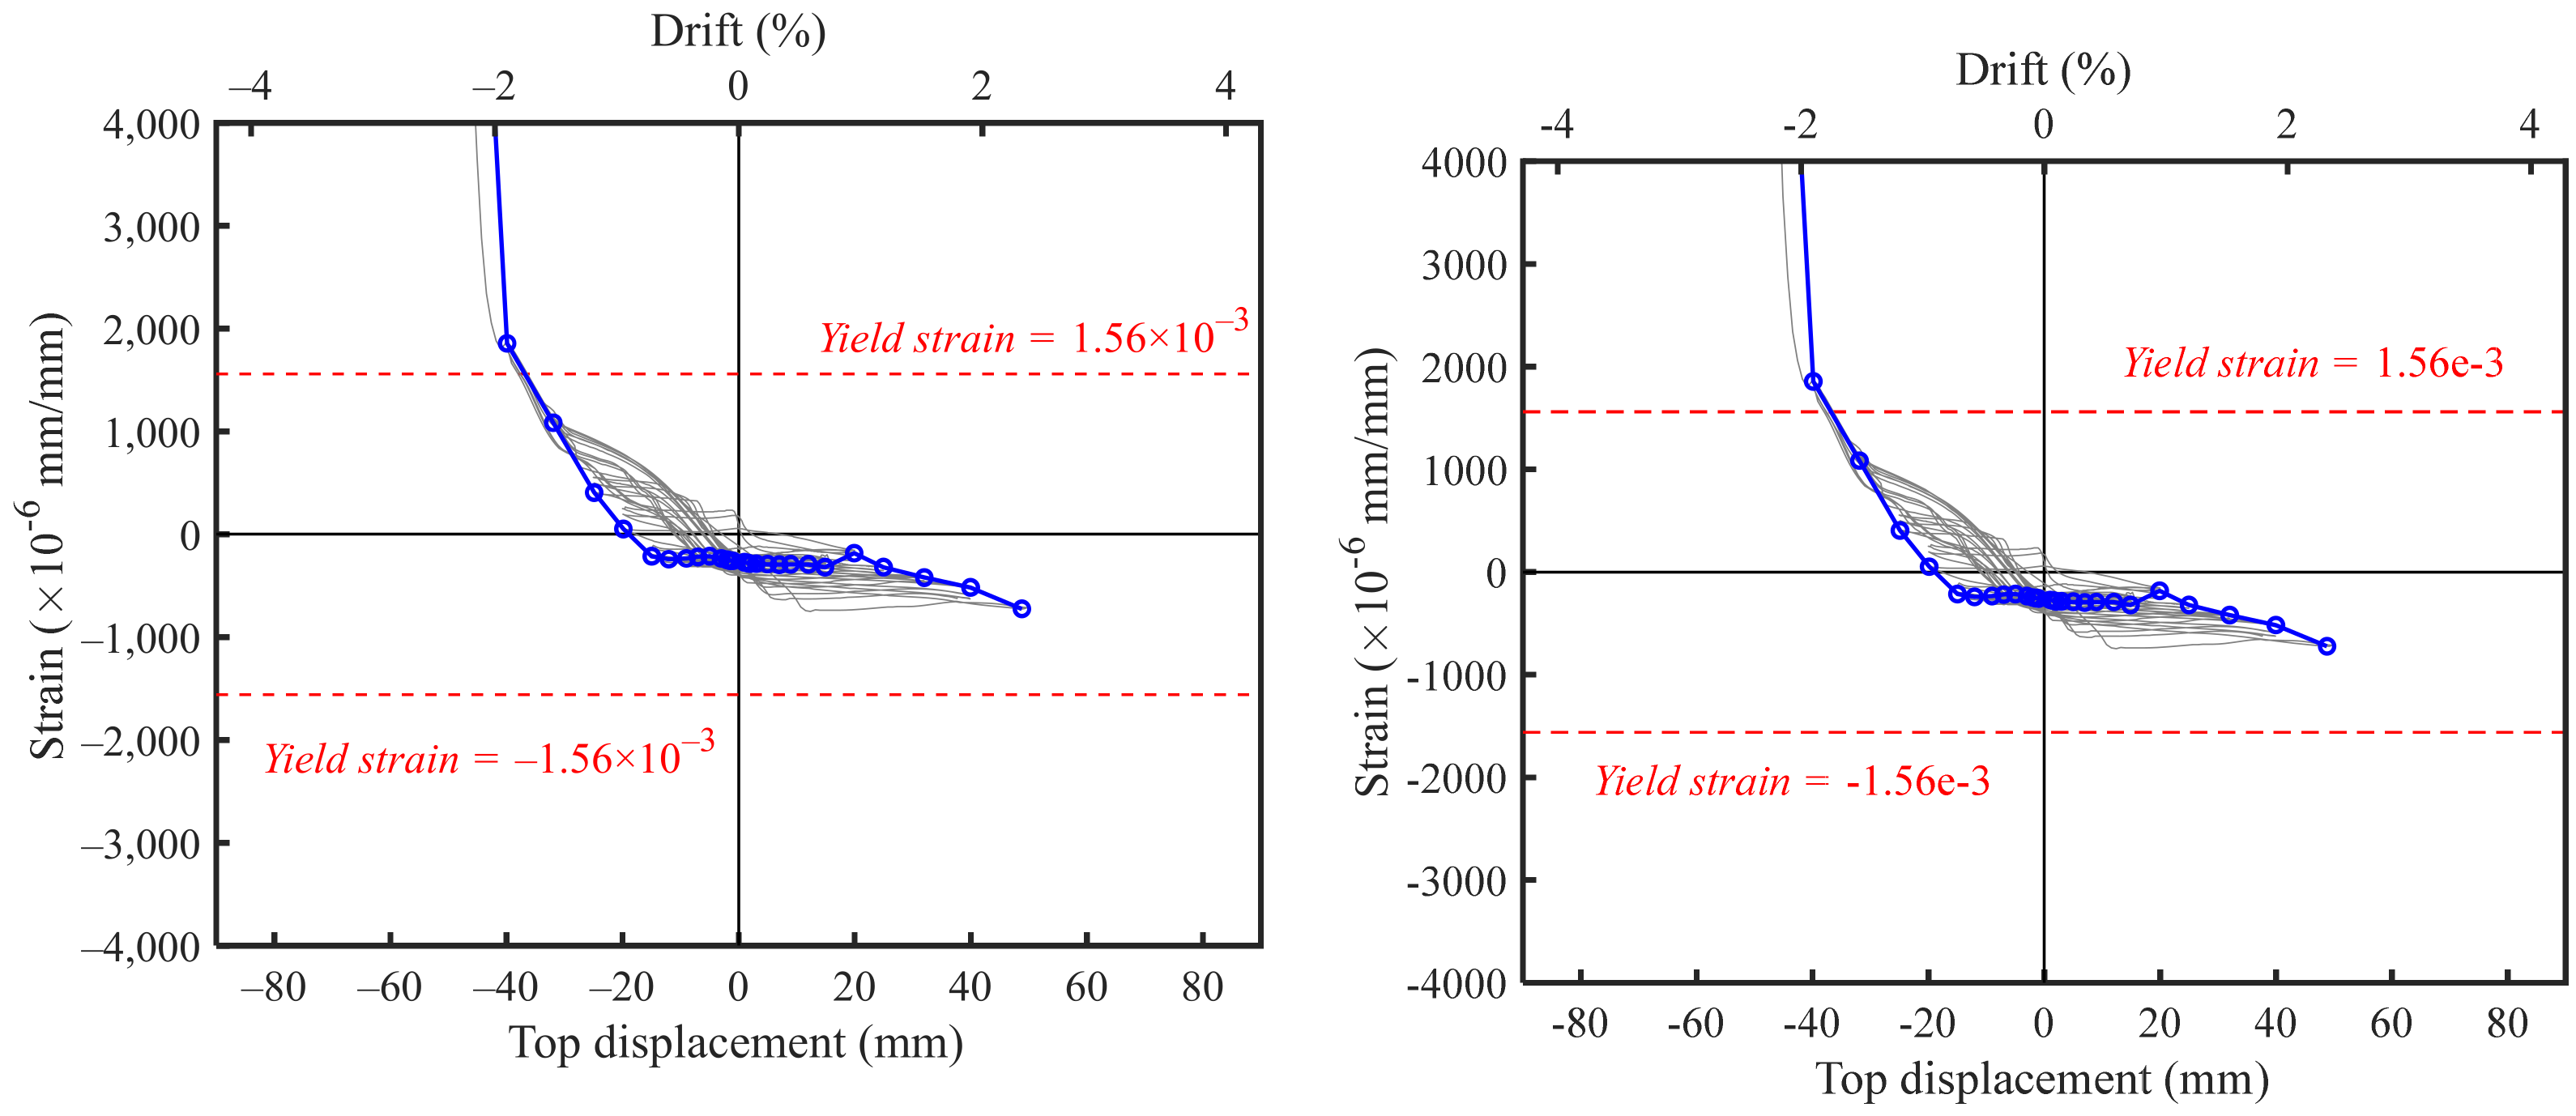
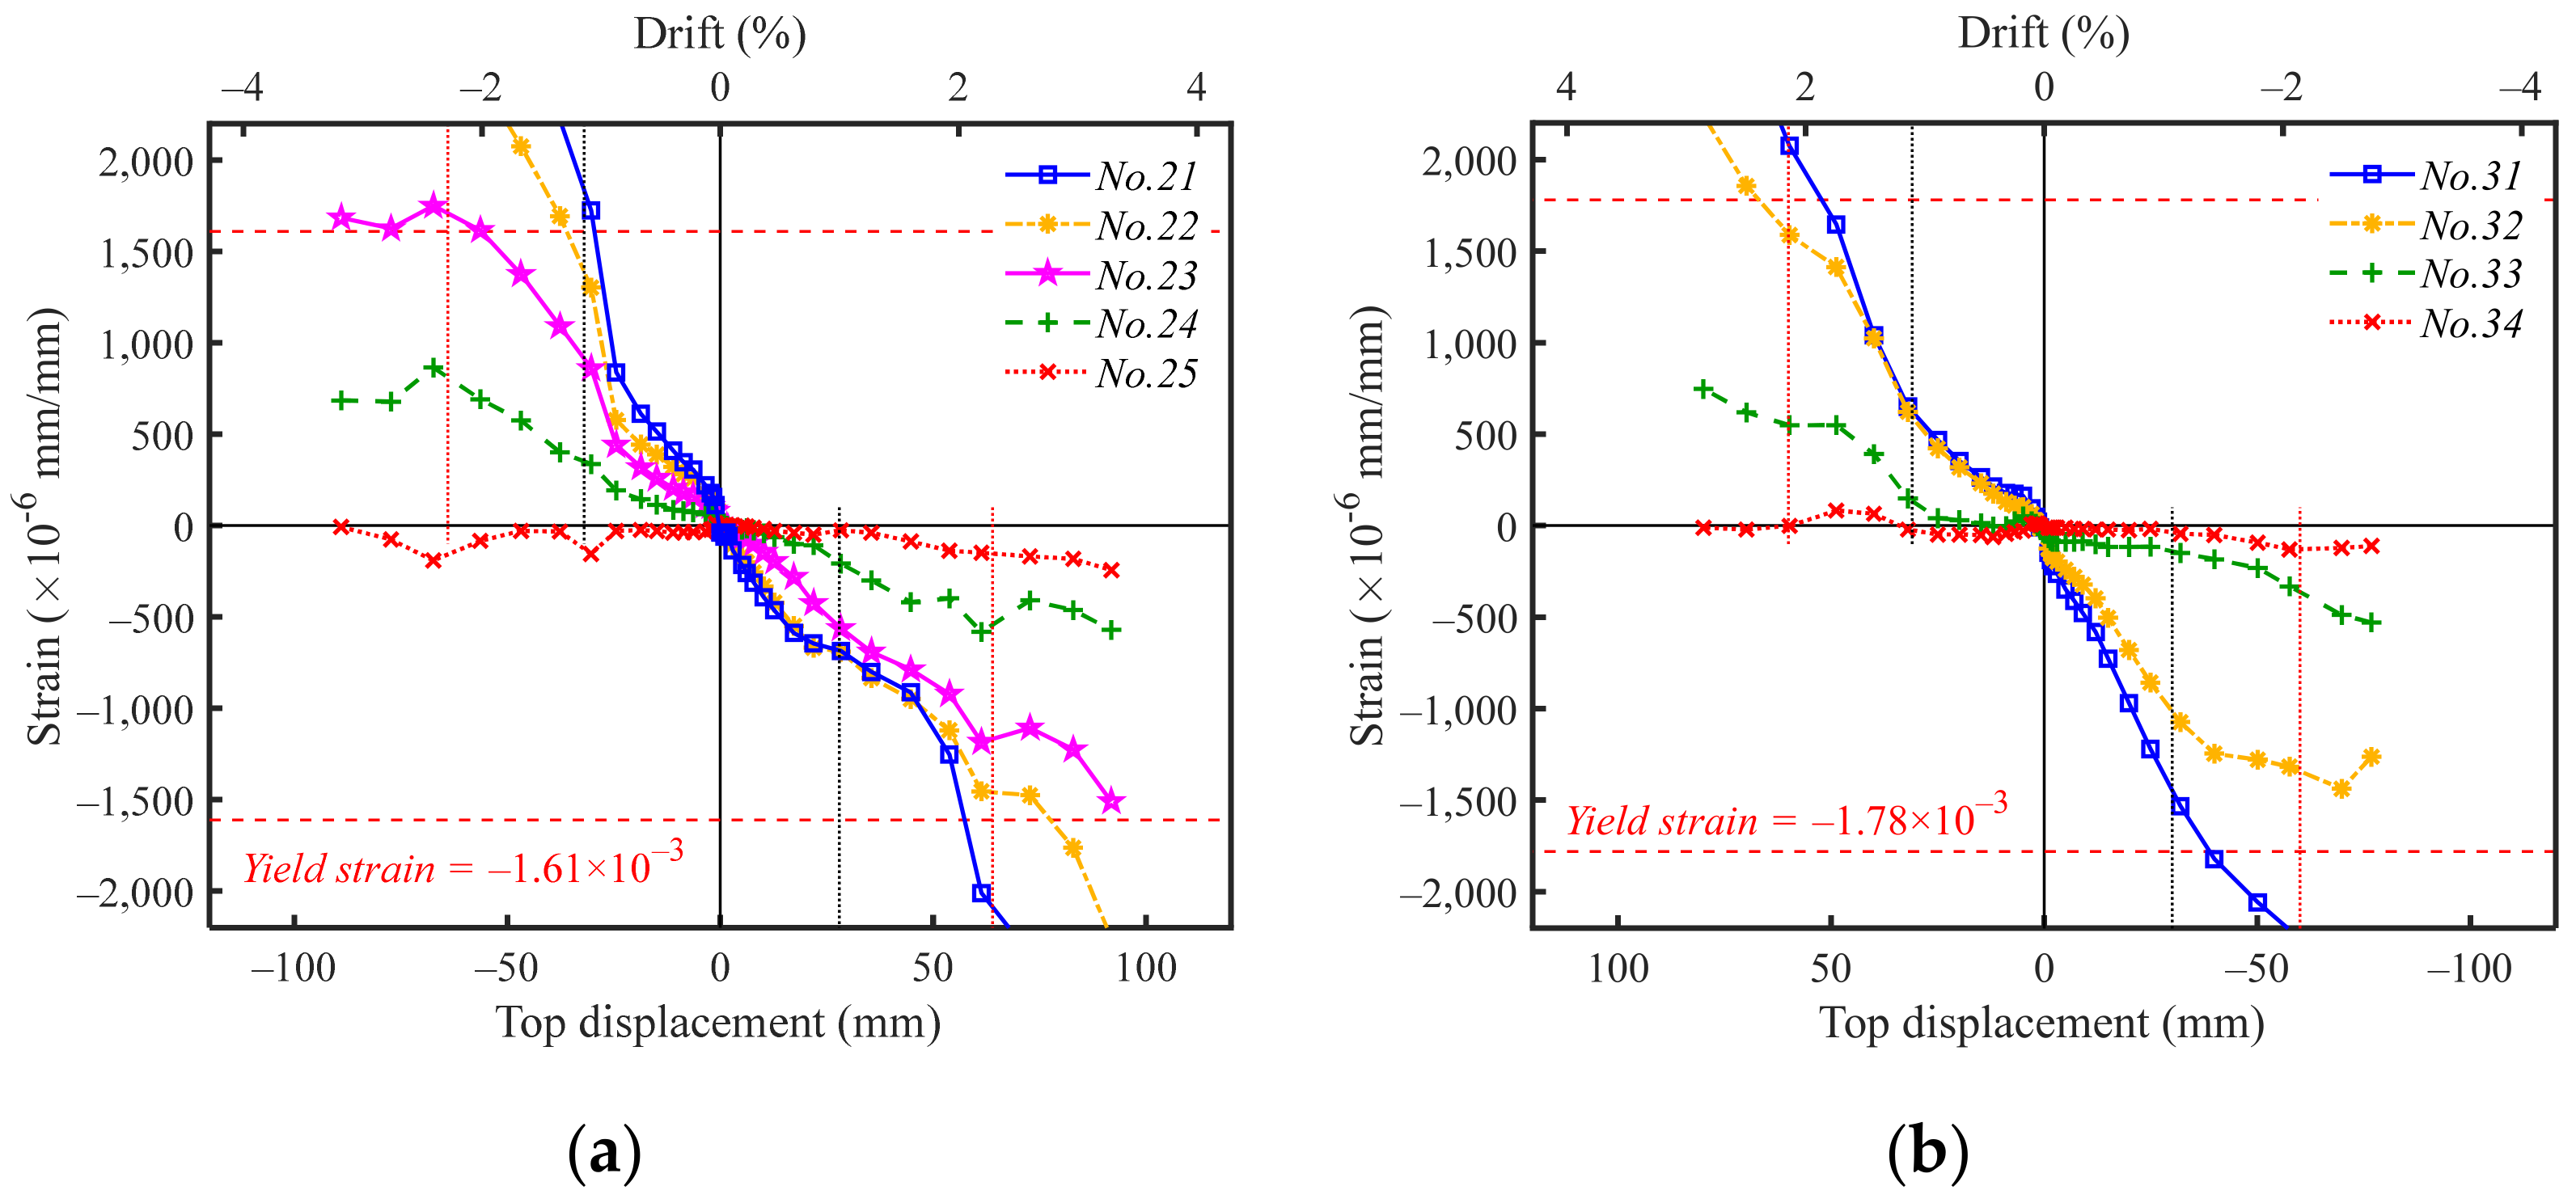
3.4. Measured Strain
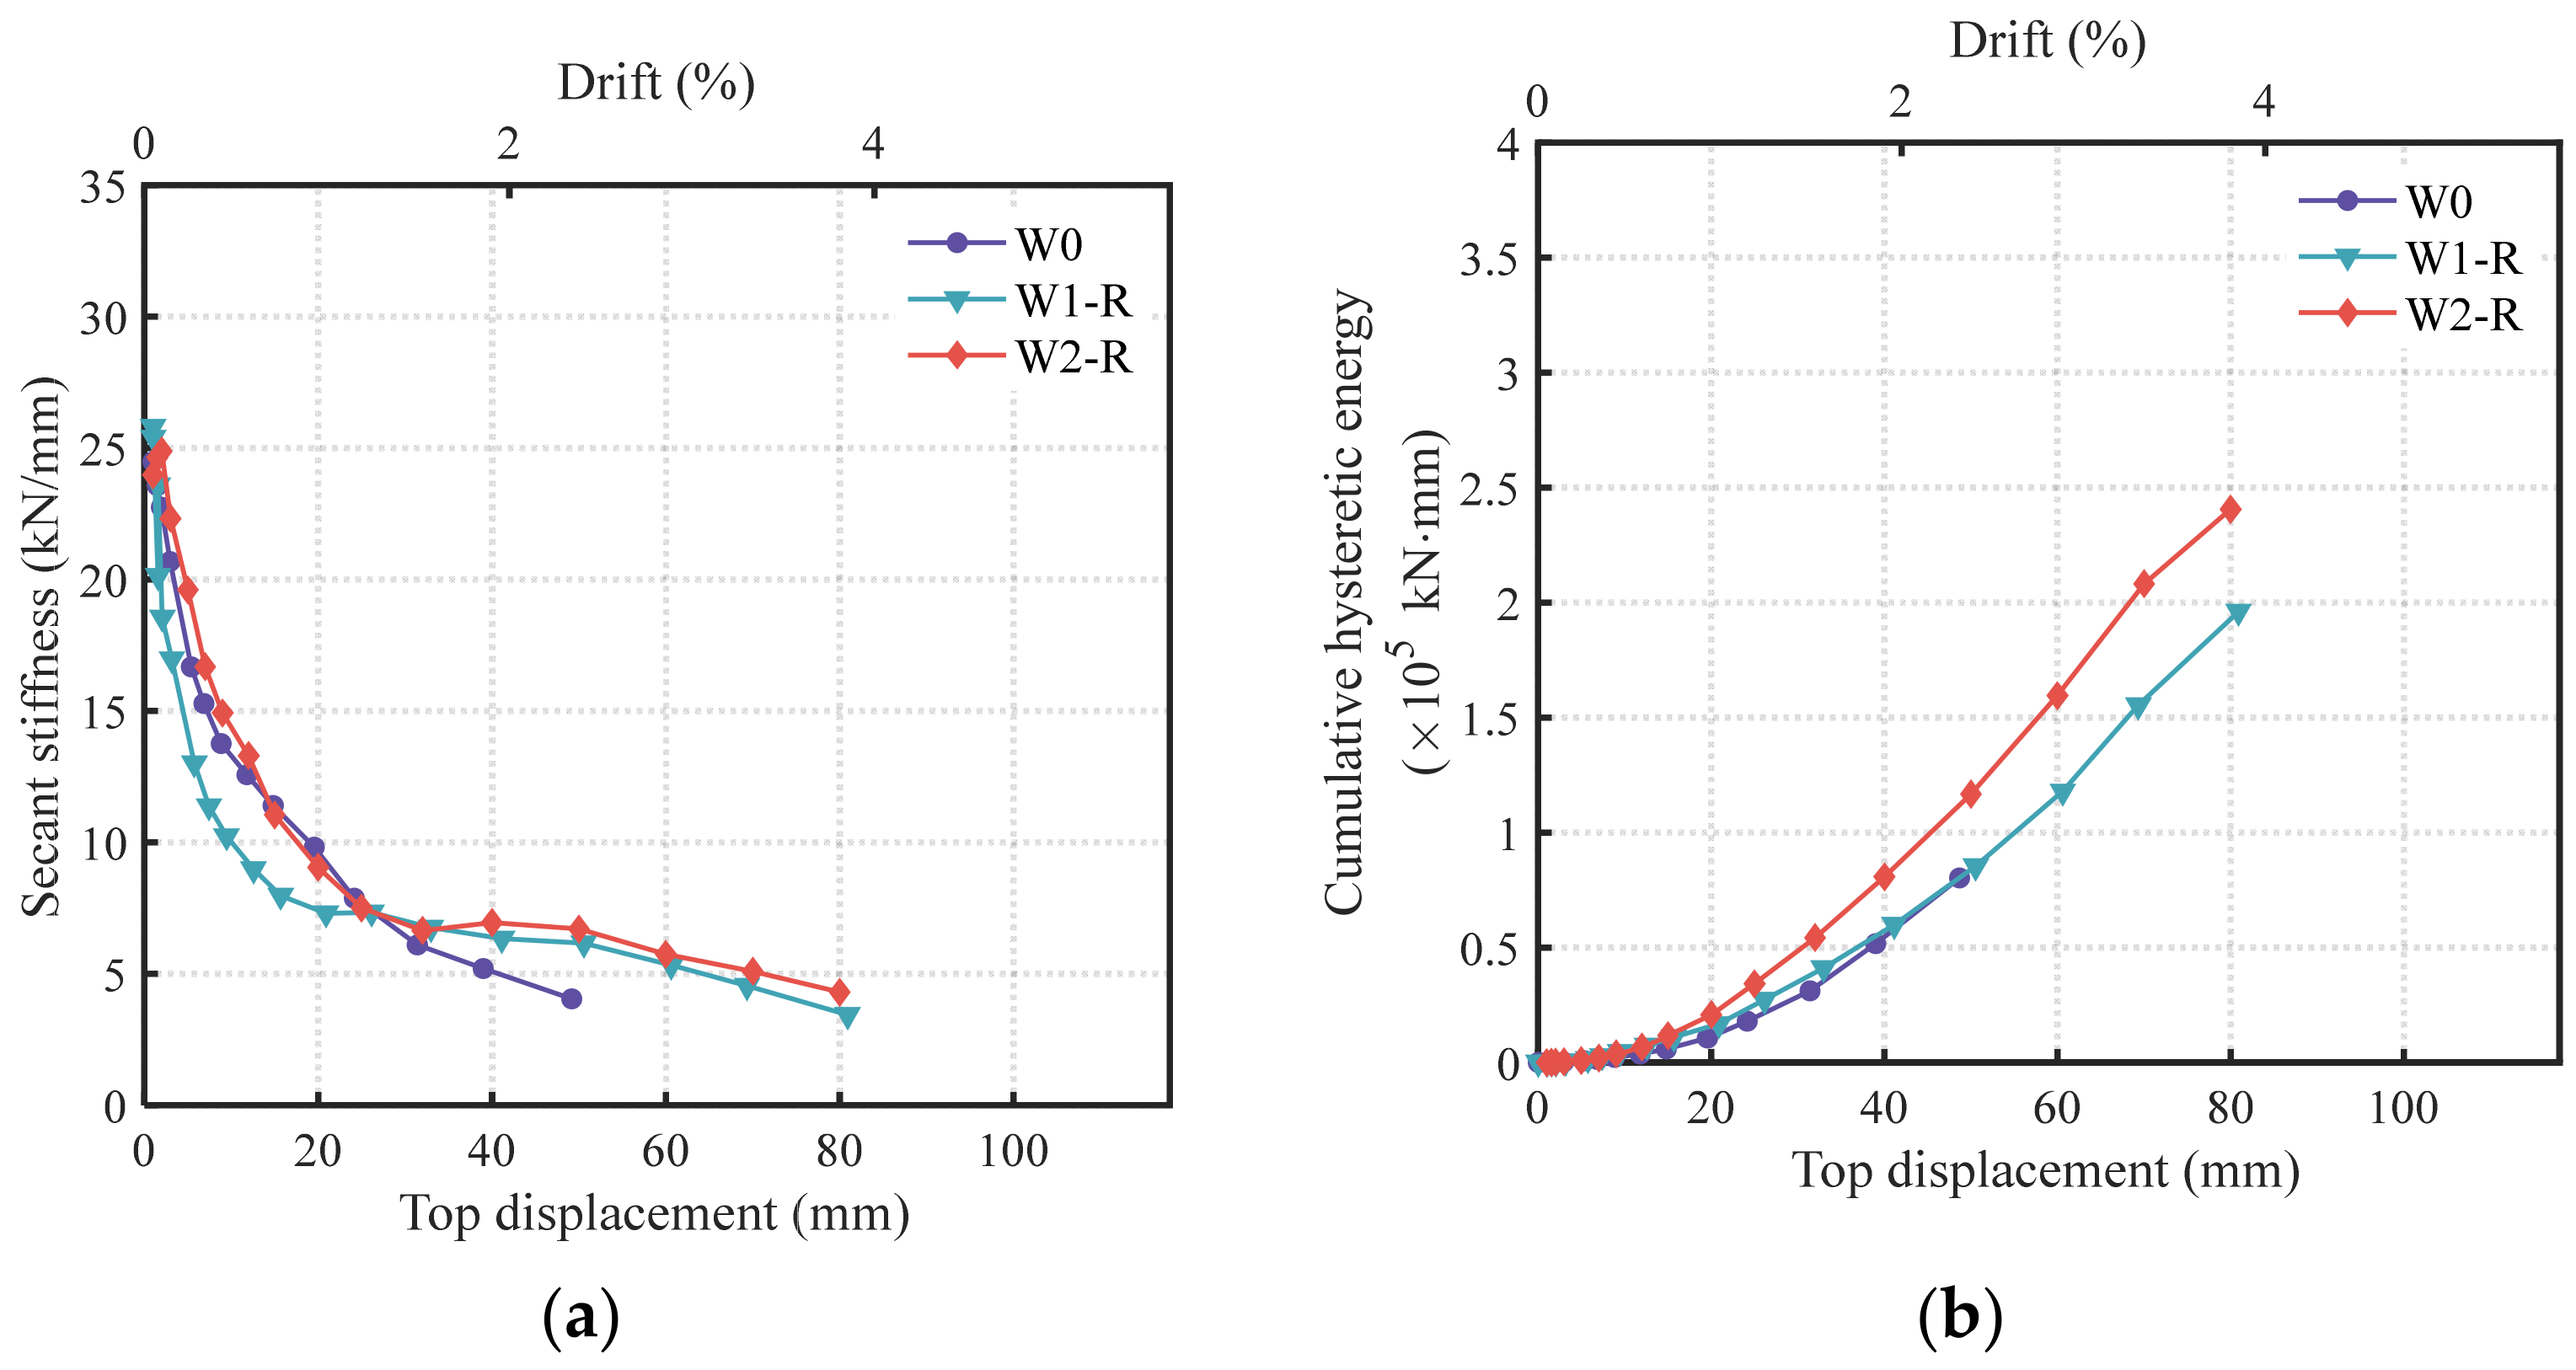
3.5. Stiffness Reduction and Energy Dissipation
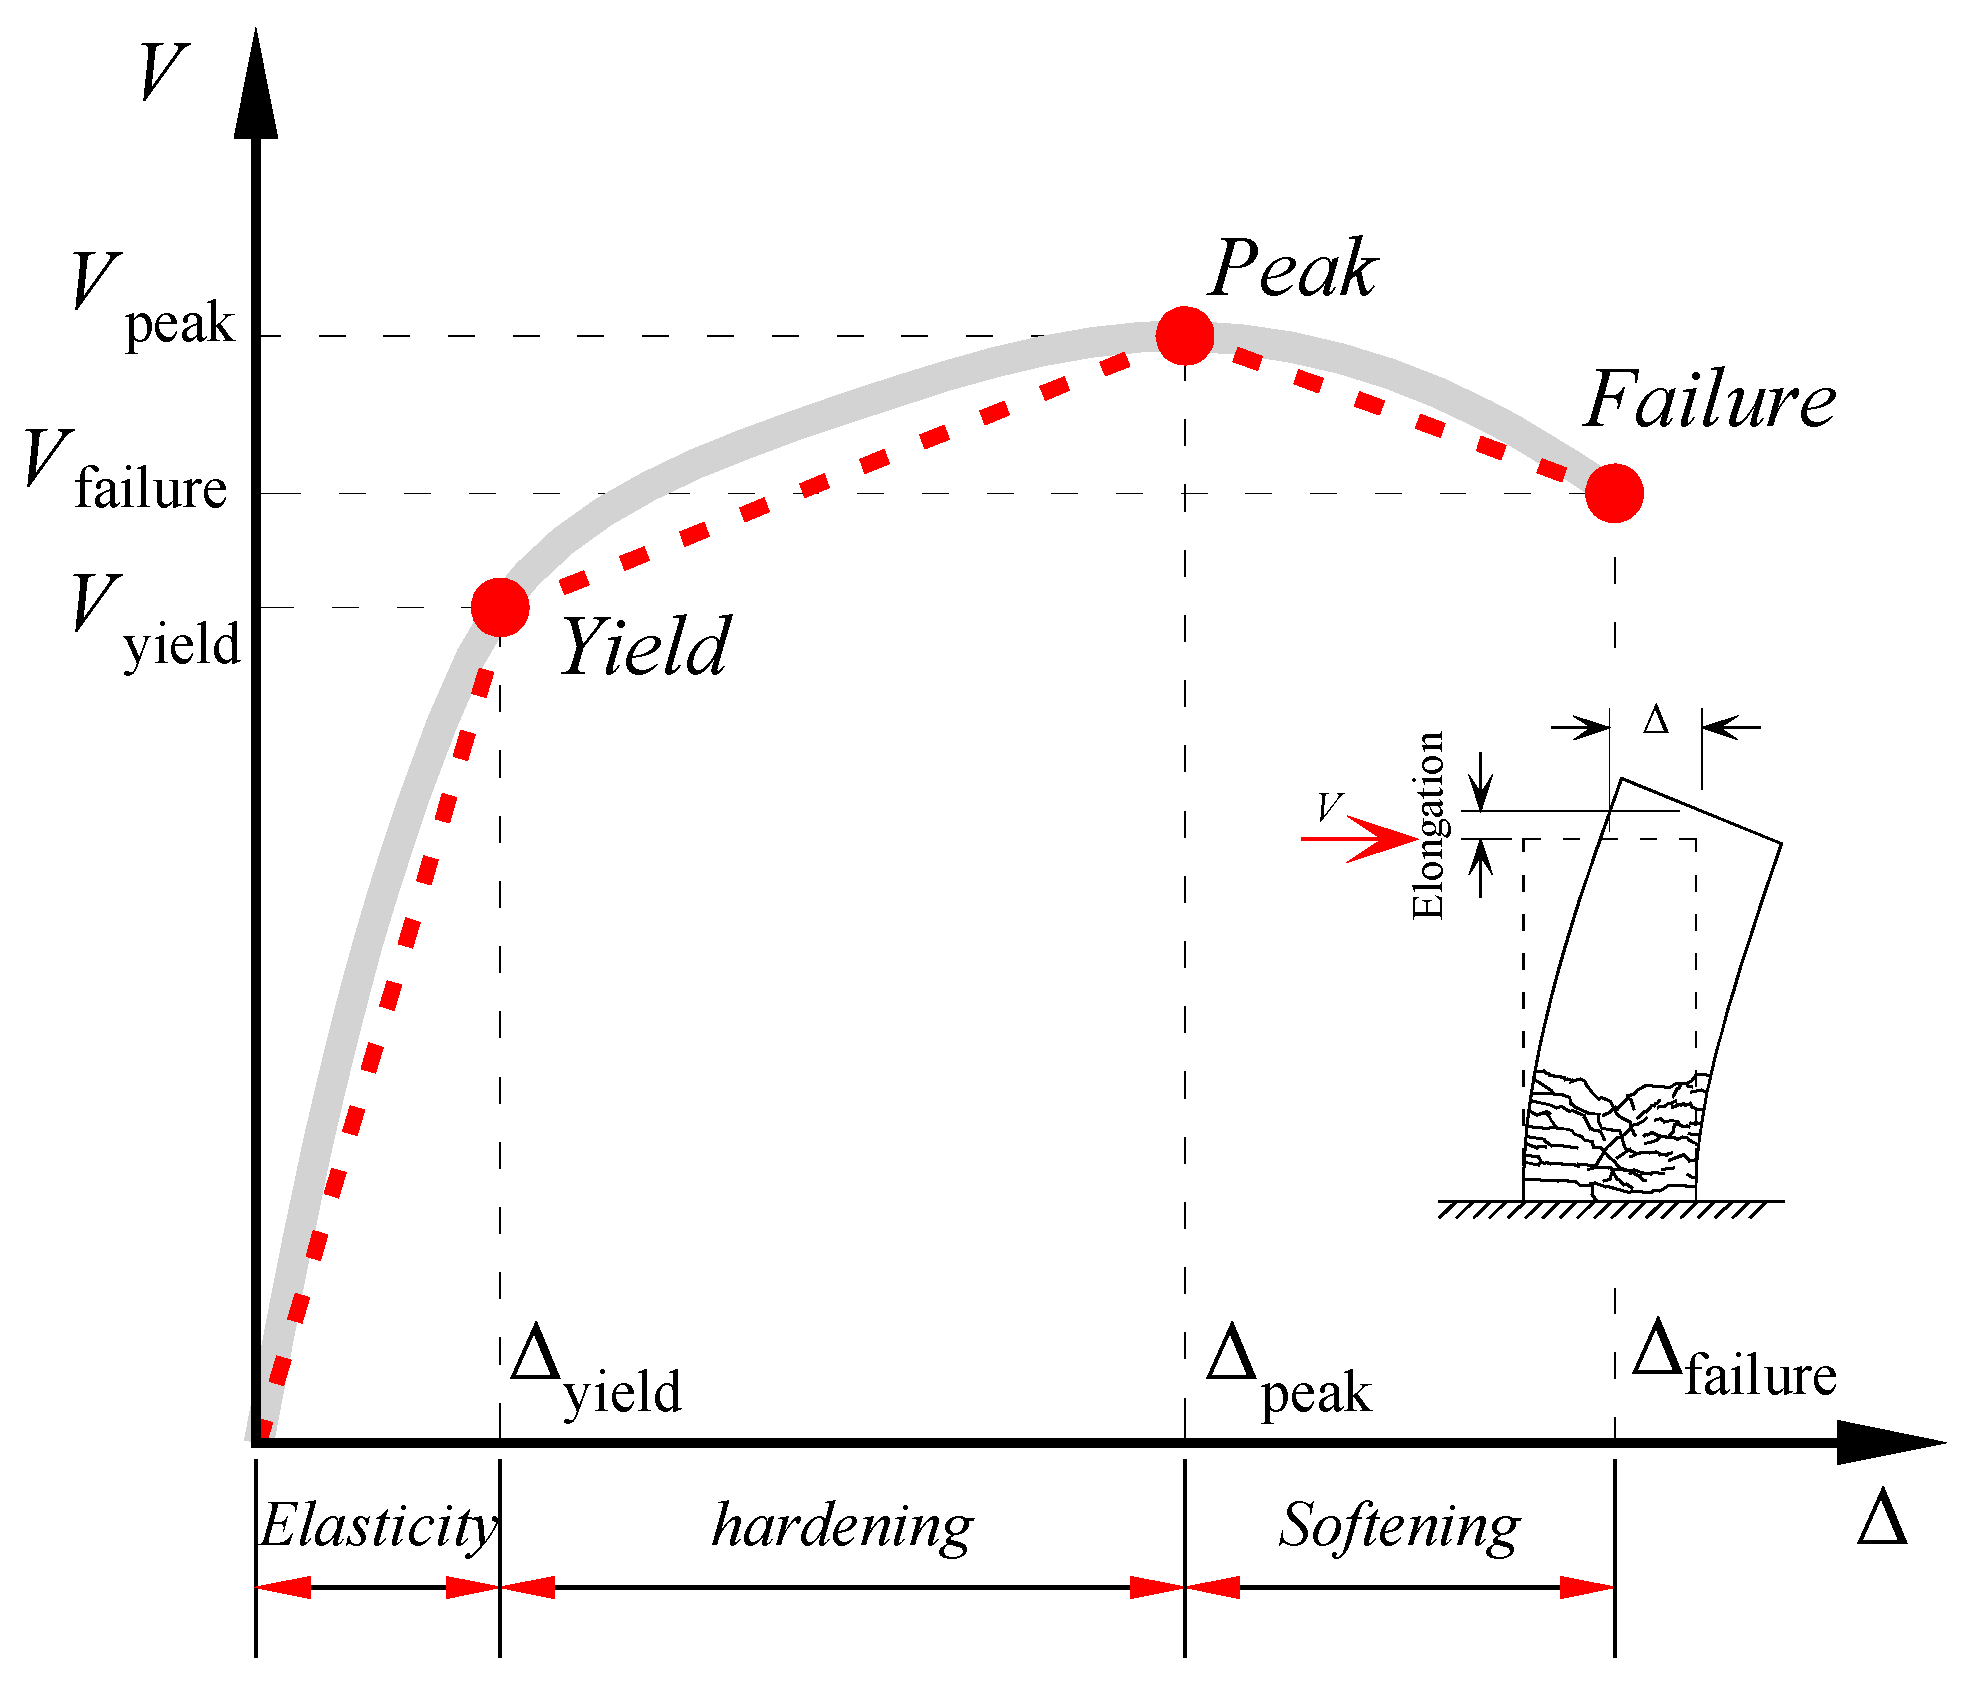
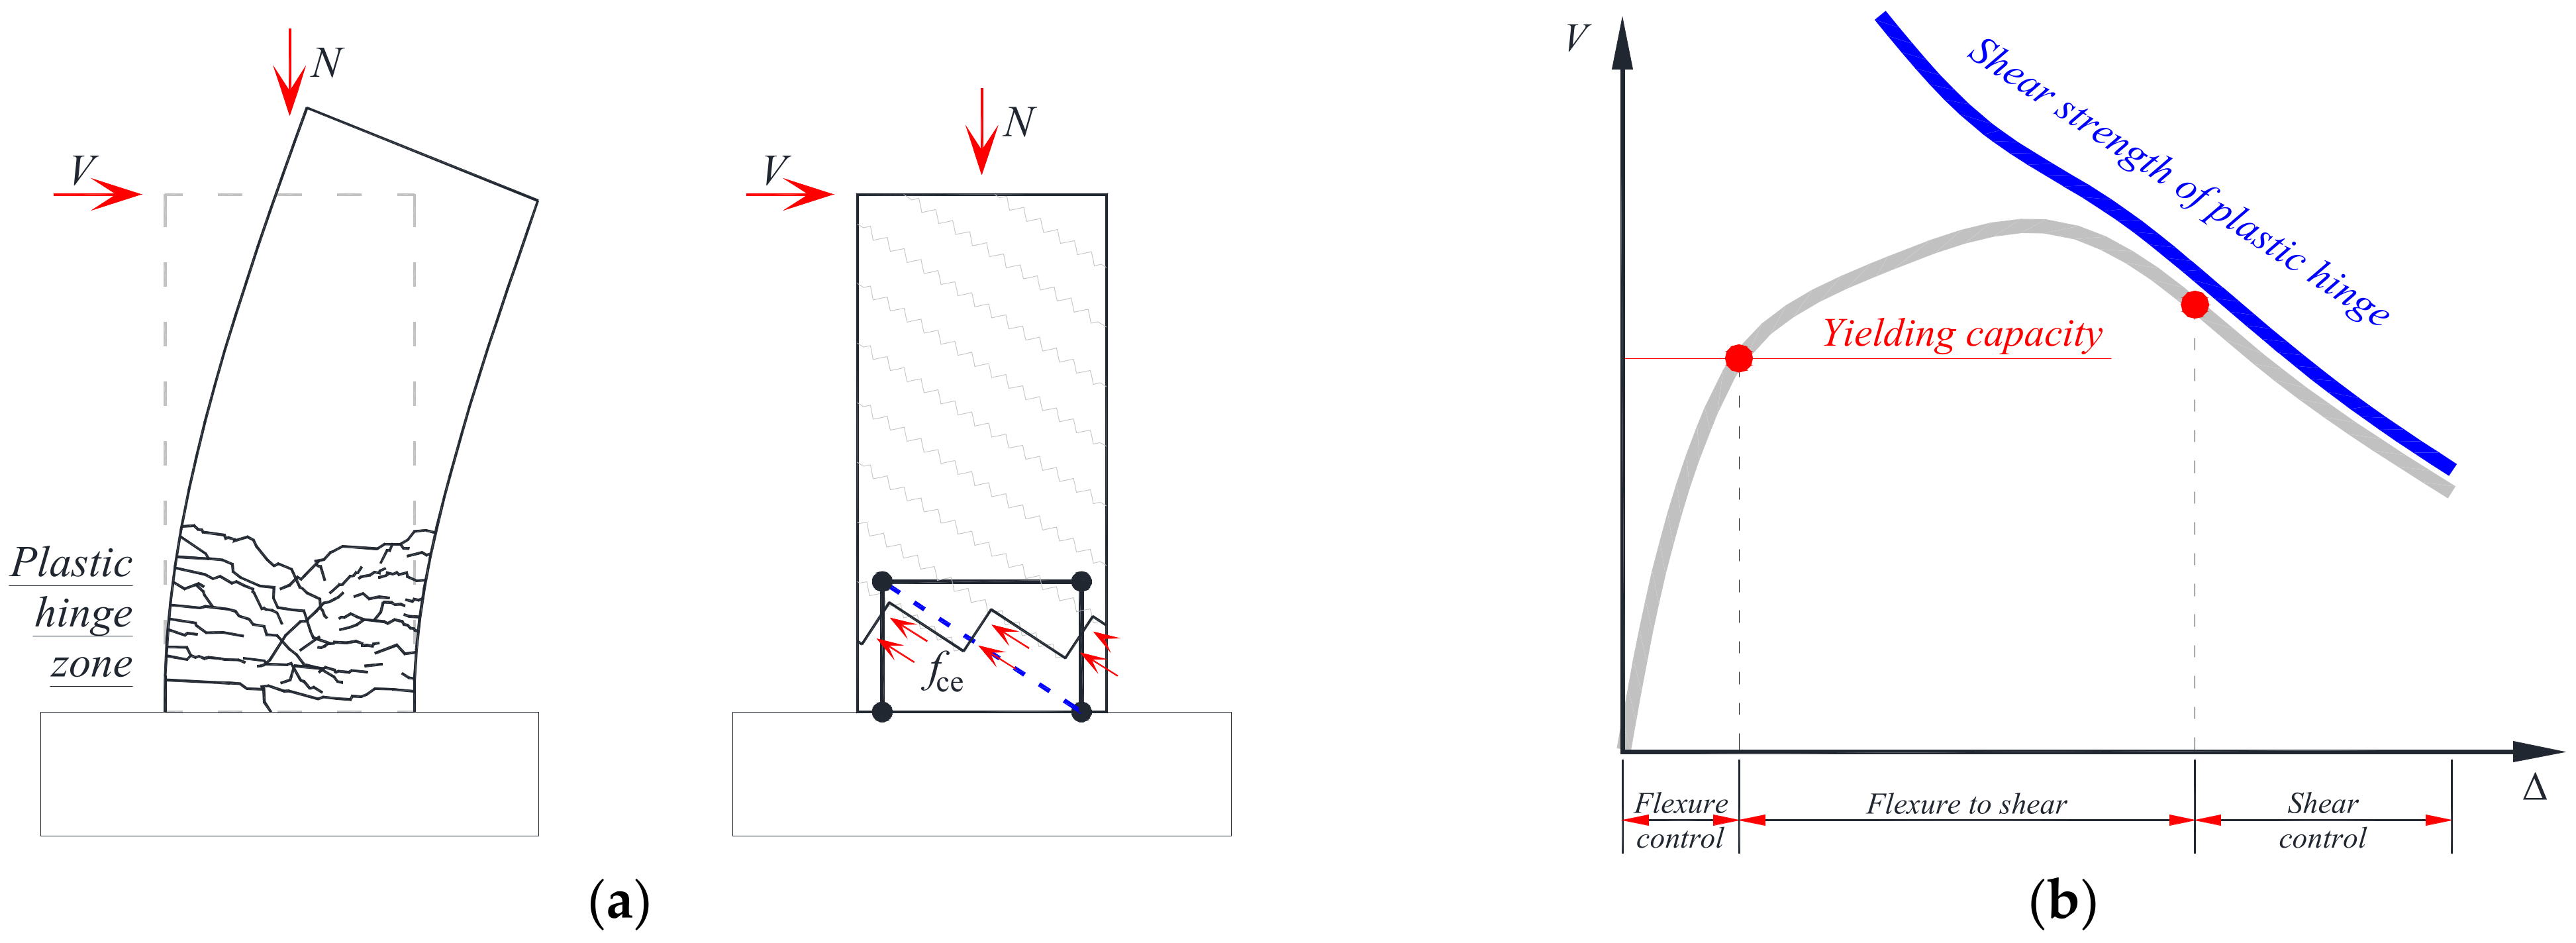
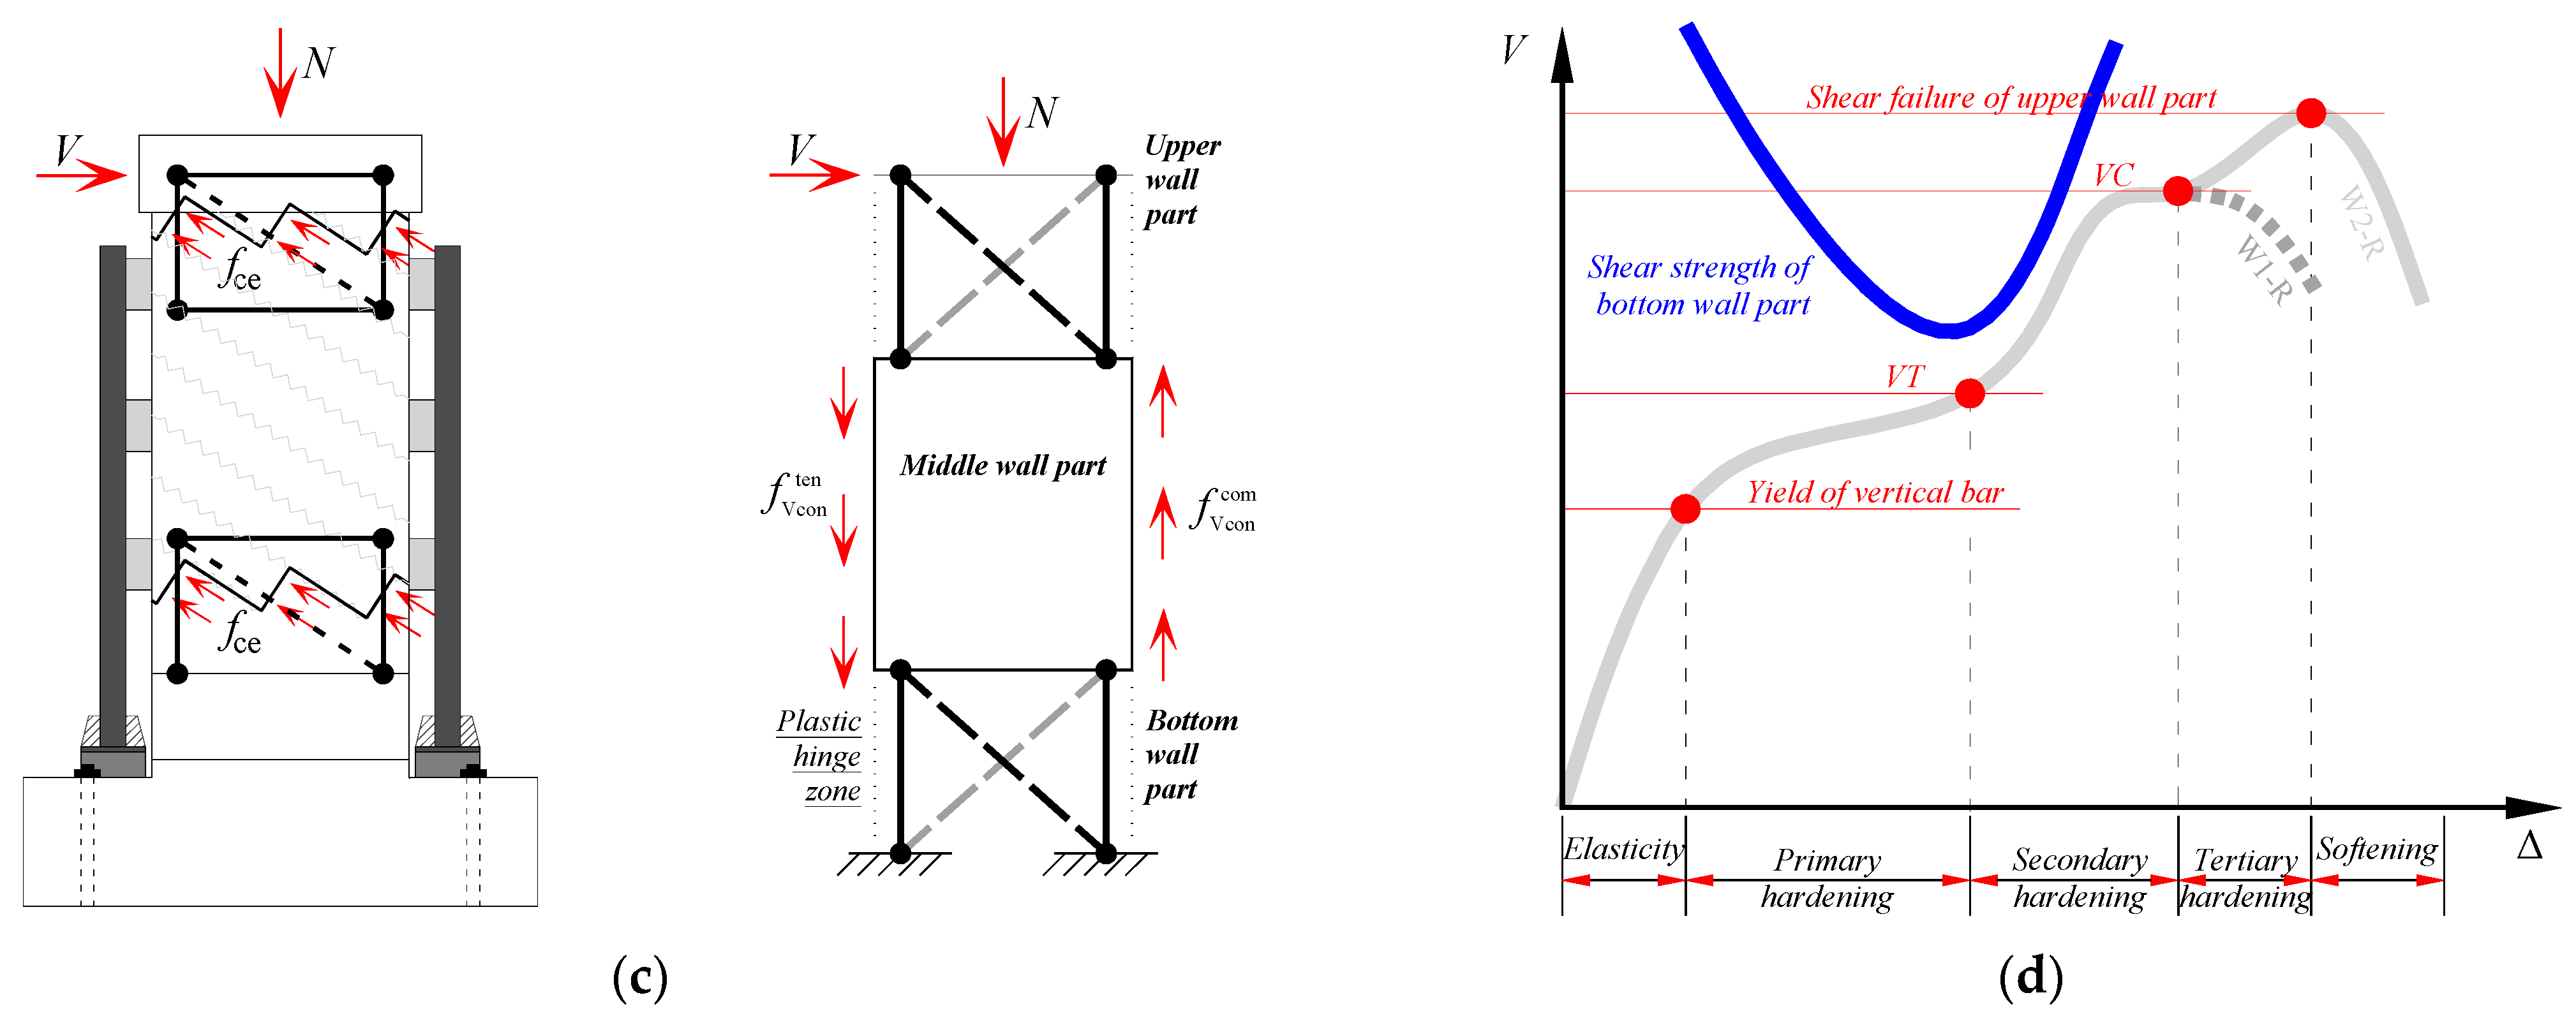
4. Discussion of Multiple Hardening
5. Conclusions
- (1)
- The proposed PC shear walls first achieved “Vertical bearing of Tensile side” (“VT” for short), and then achieved “Vertical bearing of Compressive side” (“VC” for short). Once VT occurred, strong vertical connection almost stopped the vertical connection from slipping, while weak vertical connection did not.
- (2)
- The PC shear walls cracked slower than cast-in-place walls. Eventually, different failure modes were observed on three walls: W0 (cast-in-place wall) failed in flexure; W1-R (PC shear wall with weak vertical connection) failed with concrete crushing occurring around the friction-bearing devices and toes of the PC wall panels; and W2-R (PC shear wall with strong vertical connection) prevented the failure mode like W1-R, and later failed in a mixed mode of shear and flexure at the upper wall part.
- (3)
- The VT delayed the stiffness degradation of PC shear walls, thus leading to additional drift capacity and moment capacity. For wall W1-R, the time of VT was consistent with the time when the backbone curve achieved “secondary hardening”; the time of VC was consistent with the failure of vertical connection. For wall W2-R, benefitting from the strengthened vertical connection, the wall also achieved “tertiary hardening”. In detail, the moment capacity of PC shear walls was increased by more than 60% when compared with the testing cast-in-place W0. The moment capacity of wall W2-R was higher than wall W1-R.
- (4)
- The magnitude of friction in the devices had a great influence on the energy dissipation, but not on the stiffness reduction and elongation. The cumulative hysteretic energy of the PC shear wall was increased by approximately two times compared with the cast-in-place W0.
Author Contributions
Funding
Institutional Review Board Statement
Informed Consent Statement
Data Availability Statement
Conflicts of Interest
References
- Carrillo, J.; Vargas, D.; Sánchez, M. Stiffness degradation model of thin and lightly reinforced concrete walls for housing. Eng. Struct. 2018, 168, 179–190. [Google Scholar] [CrossRef]
- Kurama, Y.C.; Sritharan, S.; Fleischman, R.B.; Restrepo, J.I.; Henry, R.S.; Cleland, N.M.; Ghosh, S.K.; Bonelli, P. Seismic-Resistant Precast Concrete Structures: State of the Art. J. Struct. Eng. 2018, 144, 03118001. [Google Scholar] [CrossRef] [Green Version]
- Clarivate Analytics. Web of Science. Available online: https://www.webofscience.com (accessed on 1 May 2022).
- Dang, L.J.; Liang, S.T.; Zhu, X.J.; Zhang, M.; Song, Y.M. Seismic performance of precast concrete wall with vertical energy-dissipating connection. Struct. Des. Tall Spec. 2021, 30, e1820. [Google Scholar] [CrossRef]
- Wu, D.; Liang, S.; Shen, M.; Guo, Z.; Zhu, X.; Sun, C. Experimental estimation of seismic properties of new precast shear wall spatial structure model. Eng. Struct. 2019, 183, 319–339. [Google Scholar] [CrossRef]
- Yan, J.-B.; Yan, Y.-Y.; Wang, T. Cyclic tests on novel steel-concrete-steel sandwich shear walls with boundary CFST columns. J. Constr. Steel Res. 2020, 164, 105760. [Google Scholar] [CrossRef]
- JGJ 1-2014; Technical Specification for Precast Concrete Structures. China Architecture & Building Press: Beijing, China, 2014.
- GB/T 51231-2016; Technical Standard for Assembled Buildings with Concrete Structure. China Architecture & Building Press: Beijing, China, 2017.
- Shen, S.-D.; Cui, Y.; Pan, P.; Gong, R.-H.; Miao, Q.-S.; Li, W.-F. Experimental Study of RC Prefabricated Shear Walls with Shear Keys Affected by a Slotted Floor Slab. J. Aerosp. Eng. 2019, 32, 04019013. [Google Scholar] [CrossRef]
- Wang, Y.L.; Zhang, Y.M.; Cui, H.J.; Cai, Z.J.; Xu, L.X. Experimental study on fabricated shear wall structure with energy-dissipating vertical joint. Struct. Concr. 2020, 21, 2654–2668. [Google Scholar] [CrossRef]
- Zhang, H.; Li, H.N.; Chen, X.Y.; Li, C. Experimental investigation on the hysteretic behavior of precast concrete walls with energy-dissipated dry connections. Struct. Concr. 2020, 21, 2836–2853. [Google Scholar] [CrossRef]
- Li, X.H.; Wu, G.; Kurama, Y.C.; Cui, H.R. Experimental comparisons of repairable precast concrete shear walls with a monolithic cast-in-place wall. Eng. Struct. 2020, 216, 110671. [Google Scholar] [CrossRef]
- Xu, L.H.; Xiao, S.J.; Li, Z.X. Behaviors and Modeling of New Self-Centering RC Wall with Improved Disc Spring Devices. J. Eng. Mech. 2020, 146, 04020102. [Google Scholar] [CrossRef]
- Han, Q.H.; Wang, D.Y.; Zhang, Y.S.; Tao, W.J.; Zhu, Y. Experimental investigation and simplified stiffness degradation model of concrete shear wall with steel connectors. Eng. Struct. 2020, 220, 110943. [Google Scholar] [CrossRef]
- Mangalathu, S.; Jang, H.; Hwang, S.-H.; Jeon, J.-S. Data-driven machine-learning-based seismic failure mode identification of reinforced concrete shear walls. Eng. Struct. 2020, 208, 110331. [Google Scholar] [CrossRef]
- Eom, T.-S.; Park, H.-G.; Kim, J.-Y.; Lee, H.-S. Web Crushing and Deformation Capacity of Low-Rise Walls Subjected to Cyclic Loading. ACI Struct. J. 2013, 110, 575–584. [Google Scholar]
- Paulay, T.; Priestley, M.J.N. Stability of ductile structural walls. ACI Struct. J. 1993, 90, 385–392. [Google Scholar]
- Cheng, X.W.; Ji, X.D.; Henry, R.S.; Xu, M.C. Coupled axial tension-flexure behavior of slender reinforced concrete walls. Eng. Struct. 2019, 188, 261–276. [Google Scholar] [CrossRef]
- Shegay, A.; Dashti, F.; Hogan, L.; Lu, Y.; Niroomandi, A.; Seifi, P.; Zhang, T.; Dhakal, R.; Elwood, K.; Henry, R.; et al. Research programme on seismic performance of reinforced concrete walls: Key recommendations. Bull. N. Z. Soc. Earthq. 2020, 53, 54–69. [Google Scholar] [CrossRef]
- Masoudi, M.; Khajevand, S. Revisiting flexural overstrength in RC beam-and-slab floor systems for seismic design and evaluation. Bull. Earthq. Eng. 2020, 18, 5309–5341. [Google Scholar] [CrossRef]
- NZS 3101:2006; Concrete Structures Standard. Standards New Zealand: Wellington, New Zealand, 2017.
- Jiang, H.; Qiu, H.; Sun, J.; Del Rey Castillo, E.; Ingham, J.M. Influence of friction-bearing devices on seismic behavior of PC shear walls with end columns. Eng. Struct. 2020, 210, 110293. [Google Scholar] [CrossRef]
- Mehrabani, R.V.; Sigrist, V. Elongation of Reinforced Concrete Plastic Hinges Subjected to Reversed Cyclic Loading. J. Struct. Eng. 2015, 141, 04014188. [Google Scholar] [CrossRef]
- Henry, R.S.; Dizhur, D.; Elwood, K.J.; Hare, J.; Brunsdon, D. Damage to concrete buildings with precast floors during the 2016 Kaikoura earthquake. Bull. N. Z. Soc. Earthq. Eng. 2017, 50, 174–186. [Google Scholar] [CrossRef] [Green Version]
- Dashti, F.; Dhakal, R.P.; Pampanin, S. Out-of-Plane Response of In-Plane-Loaded Ductile Structural Walls: State-of-the-Art and Classification of the Observed Mechanisms. J. Earthq. Eng. 2020, 26, 1325–1346. [Google Scholar] [CrossRef]
- GB 50010-2010; Code for Design of Concrete Structures. China Architecture & Building Press: Beijing, China, 2016.
- GB/T 50081-2002; Standard for Test Method of Mechanical Properties on Ordinary Concrete. China Architecture & Building Press: Beijing, China, 2003.
- GB/T 228.1-2010; Metallic Materials-Tensile Testing-Part 1: Method of Test at Room Temperature. Standards Press of China: Beijing, China, 2011.
- GB/T 50152-2012; Standard for Test Method of Concrete Structures. China Architecture & Building Press: Beijing, China, 2012.
- JGJ/T 101-2015; Specification for Seismic Test of Buildings. China Architecture & Building Press: Beijing, China, 2015.
- Vecchio, F.J.; Collins, M.P. The modified compression-field theory for reinforced concrete elements subjected to shear. ACI J. 1986, 83, 219–231. [Google Scholar]
- Hsu, T.T.C. Softened truss model theory for shear and torsion. ACI Struct. J. 1988, 85, 624–635. [Google Scholar]
- Lee, J.Y.; Watanabe, F. Shear deterioration of reinforced concrete beams subjected to reversed cyclic loading. ACI Struct. J. 2003, 100, 480–489. [Google Scholar]
- Jiang, H. Behaviour of Precast Shear Wall with End Column Subjected to Seismic Loading. Ph.D. Thesis, Southeast University, Nanjing, China, 2020. [Google Scholar]
- Fang, Q.; Qiu, H.X.; Sun, J.; Dal Lago, B.; Jiang, H.B. Performance study of precast reinforced concrete shear walls with steel columns containing friction-bearing devices. Arch. Civ. Mech. Eng. 2021, 21, 110. [Google Scholar] [CrossRef]


| Testing PC Walls | Column Base | Friction-Bearing Device | ||
|---|---|---|---|---|
| High Strength Bolt | Friction Applied by One Bolt | Friction Applied by One Device | ||
| W1-R | Rigid | M12 | 11.4 kN | 22.8 kN |
| W2-R | Rigid | M18 | 20.0 kN | 40.0 kN |
| Material | Diameter/Thickness (mm) | Yield Strength (MPa) | Ultimate Strength (MPa) |
|---|---|---|---|
| Bar #1 | 6.7 (6.5) | 370.9 (314.4) | 523.0 (527.5) |
| Bar #2 | 8.0 (8.0) | 338.8 (308.1) | 509.4 (488.1) |
| Bar #3 | 9.5 (8.0) | 490.0 (308.1) | 544.3 (488.1) |
| Plate | 6.0 (6.0) | 372.0 (337.1) | 431.8 (380.5) |
| Test Walls | “Vertical Bearing of Tensile Side” | “Vertical Bearing of Compressive Side” | ||
|---|---|---|---|---|
| Positive (mm) | Negative (mm) | Positive (mm) | Negative (mm) | |
| W1-R | 28 | 32 | 64 | 64 |
| W2-R | 31 | 30 | 60 | 60 |
Publisher’s Note: MDPI stays neutral with regard to jurisdictional claims in published maps and institutional affiliations. |
© 2022 by the authors. Licensee MDPI, Basel, Switzerland. This article is an open access article distributed under the terms and conditions of the Creative Commons Attribution (CC BY) license (https://creativecommons.org/licenses/by/4.0/).
Share and Cite
Jiang, H.; Sun, J.; Qiu, H.; Cao, D.; Ge, W.; Fang, Q.; Cui, H.; Chen, K. Cyclic Behavior of Multiple Hardening Precast Concrete Shear Walls. Buildings 2022, 12, 2069. https://doi.org/10.3390/buildings12122069
Jiang H, Sun J, Qiu H, Cao D, Ge W, Fang Q, Cui H, Chen K. Cyclic Behavior of Multiple Hardening Precast Concrete Shear Walls. Buildings. 2022; 12(12):2069. https://doi.org/10.3390/buildings12122069
Chicago/Turabian StyleJiang, Hongbo, Jian Sun, Hongxing Qiu, Dafu Cao, Wenjie Ge, Qiang Fang, Hengwei Cui, and Kongyang Chen. 2022. "Cyclic Behavior of Multiple Hardening Precast Concrete Shear Walls" Buildings 12, no. 12: 2069. https://doi.org/10.3390/buildings12122069