Article

Parametric Study on Contact Explosion Resistance of Steel Wire Mesh Reinforced Geopolymer Based Ultra-High Performance Concrete Slabs Using Calibrated Continuous Surface Cap Model

1
Protective Structures Centre, School of Civil Engineering, Guangzhou University, Guangzhou 510006, China
2
Hubei RockTek Limited Company, Daye 435100, China
*
Authors to whom correspondence should be addressed.
Buildings 2022, 12(11), 2010; https://doi.org/10.3390/buildings12112010
Submission received: 22 October 2022 / Revised: 12 November 2022 / Accepted: 15 November 2022 / Published: 17 November 2022

Abstract

:
This paper conducts a parametric analysis on the response of geopolymer-based ultra-high-performance concrete (G-UHPC) slabs reinforced with steel wire mesh (SWM) subjected to contact explosions using the validated Continuous Surface Cap (CSC) model. Firstly, based on the available experimental data, the CSC model parameters, which account for the yield surface, damage formulation, kinematic hardening, and strain rate effect, were comprehensively developed for G-UHPC. The modified CSC model was initially assessed by comparing the quasi-static test results of G-UHPC. Then, the numerical modeling was performed on 200 mm thick SWM-reinforced G-UHPC slabs against 0.4 kg and 1.0 kg TNT contact explosions. The fair agreement between the numerical and experimental data concerning the local damage of the slabs was reported to demonstrate the applicability of the material and structural models. With the validated numerical models, a parametric study was further acted upon to explore the contribution of the variables of SWM, slab thickness, and TNT equivalence on the local damage and energy evolution of G-UHPC slabs subjected to contact blasts. Moreover, based on simulation results from the parametric study, an updated empirical model was derived to evaluate the local damage pattern and internal energy absorption rate of SWM-reinforced G-UHPC slabs.

Graphical Abstract

1. Introduction

In recent years, hazardous loads induced by various blast accidents have been a serious concern in civil and military constructions [1,2,3,4,5]. Under close-in or contact explosions, normal concrete typically exhibits brittle failure with highly localized damage due to the low material strength and ductility [6,7,8]. To strengthen the resistance of concrete structures against close-in and contact explosions, advanced concrete materials, e.g., engineered cementitious composites (ECC), ultra-high-performance concrete (UHPC), etc., have undergone extensive development and investigation over the last few decades [9,10,11]. Compared to normal concrete, the advanced concrete materials exhibited superior dynamic material strength, toughness, and energy absorption capacity due to the existence of fiber reinforcement, which could effectively restrain the propagation of blast stress waves within the concrete structures [12].
With the global focus on sustainability in civil and military constructions, a geopolymer binder system is deemed to be an alternative to the conventional Portland cement in the concrete mixture [13,14,15] since the manufacture of geopolymer can consume less energy and produce lower levels of carbon dioxide. After continuous development in these decades, the raw materials of geopolymer include natural minerals, e.g., kaolin, metakaolin, etc., and industrial by-products, e.g., fly ash, granulated blast furnace slag, red mud, etc. [16,17]. To activate the aluminosilicates in geopolymer and trigger the formation of the binding structure, alkaline activators, e.g., sodium hydroxide and sodium silicate, potassium hydroxide and potassium silicate, etc., are essential. Recently, efforts have been made to the utilization of the geopolymer binder for the mix design of UHPC with steel fiber reinforcement [18,19,20]. Existing studies also confirmed that the geopolymer-based ultra-high performance concrete (G-UHPC) had comparable static performance to the Portland-cement-based UHPC (PC-UHPC) [19,21] and superior blast resistance to normal concrete [22], especially when more steel fibers were adopted within a reasonable range. However, it is worth noting that excessive steel fibers may cause workability and cost issues for G-UHPC [23]. Moreover, it is of great difficulty to ensure the uniform and random distribution of excessive steel fibers within G-UHPC due to the fast setting of the mixture [24].
To solve the workability, cost, and fast-setting issues, SWM can be considered as an alternative reinforcement scheme in G-UHPC to resist blast loads. Thus far, many studies have been carried out to prove the effectiveness of SWM-reinforced concrete with less or no coarse aggregates to tolerate blast loads. Li et al. [25,26,27] tested the local damage of concrete slabs reinforced with SWM subjected to blast loads via a series of experiments and numerical studies. These studies confirmed that SWM could help strengthen the blast resistance of concrete slabs owing to the local membrane effect. Moreover, SWM with a close spacing was effective in inhibiting the blast wave propagation, thereby contributing to the less concrete crater and scabbing damage. Meng et al. [28,29] investigated SWM reinforced high strength geopolymer concrete plates under medium and far-field blasts, wherein it was found that SWM could increase the ductility of the concrete slabs and the efficiency of blast force transmission as compared to the steel rebars. Liu et al. [30] examined the resistance of SWM-reinforced high-performance geopolymer concrete walls to medium field explosions. The test results demonstrated that SWM-reinforced performance geopolymer concrete walls exhibited less brittle injury and latitudinally deflection in comparison with the traditional reinforced concrete walls. In a later study by Liu et al. [31], SWM was incorporated into the G-UHPC slab, and its resistance to contact explosions concerning the crater and scabbing damage was examined. Although SWM was reported to significantly decrease the local damage area and maintain the structural integrity, the efficiency and effectiveness of SWM parameters on the resistance of G-UHPC slabs subjected to contact explosion still need a further comprehensive investigation.
In order to allow for a more detailed analysis of the dynamic behavior of SWM-reinforced G-UHPC structures against blast loads, numerical simulations can be advantageously performed as a favorable supplement to the physical tests. For the high-fidelity numerical simulation of the blast response, a suitable material model which can accommodate the dynamic behavior of G-UHPC is generally required. In the commercial finite element software LS-DYNA, a number of constitutive concrete models, e.g., Elastic Plastic Hydrodynamic model [32], Karagozian and Case Concrete (KCC) model [33], Holmquist–Johnson–Cook (HJC) model [32], etc., have been widely adopted for UHPC structures under blast loads [6,10,31,34]. Apart from the aforementioned concrete models, the Continuous Surface Cap (CSC) model [35] can also be used to reproduce the dynamic behavior of concrete structures when the material is subjected to large strains, high strain rates, and high pressure [36]. Although the suitability of the CSC model for UHPC structures under low-velocity impact has been extensively demonstrated in recent studies [37,38,39], the relevant study on its applicability for G-UHPC structures under blast loads is still limited.
In the current study, the CSC model parameters, which account for the yield surface, damage formulation, kinematic hardening, and strain rate effect, were systematically modified for G-UHPC on the basis of the available material test data and constitutive theory. Numerical simulations were then conducted on G-UHPC slabs reinforced with SWM subjected to 0.4 kg and 1.0 kg TNT contact explosions. Through comparing the numerical and test data concerning the local damage, the applicability of the calibrated CSC model and structural model was validated. Using the verified numerical models, a parametric study on SWM-reinforced G-UHPC slabs was further carried out concerning the TNT equivalent, slab thickness, and SWM variables (i.e., number of layers, space between adjacent wires, and steel wire diameter). Furthermore, an updated empirical model was proposed to evaluate the local damage pattern and internal energy absorption rate of SWM-reinforced G-UHPC slabs against contact explosions. As mentioned above, although several experiments on G-UHPC members with SWM reinforcement subjected to dynamic loads have been reported, the corresponding numerical simulations were urgently required to further interpret the efficiency and effectiveness of SWM parameters. Moreover, rare studies were conducted to adopt the CSC model to simulate the G-UHPC in contact explosions. This paper detailed performed the CSC model calibration, the structural model validation, and the parametric study of SWM variables.

2. A Brief Overview of CSC Model in LS-DYNA

In LS-DYNA, the CSC model mainly includes the failure surface, damage functions, and strain rate formulations. The failure surface is combined with the shear failure surface and cap hardening surface, in which these two surfaces are continuously and smoothly connected, as presented in Figure 1. The failure surface is characterized by three stress tensor invariants ( J 1 , J 2 and J 3 ) and the cap hardening parameter κ , which is given by:
F ( J 1 ,   J 2 ,   J 3 ,   κ )   =   J 2     2 F c F f 2
where J 1   =   3 P denotes the first stress tensor invariant; J 2   =   1 2 S i j S i j denotes the second invariant of the deviatoric stress tensor; J 3   =   1 2 S i j S j k S k i denotes the third stress tensor invariant; P is the pressure; S i j , S j k and S k i are the deviatoric stress tensors, the indexes i, j, k refer to elements of this stress tensor; κ is the value of J 1 at the intersection of the shear damage surface and the cap surface; is the Rubin three-invariant decay coefficient; Fc is the abbreviation of hardened cap function; the full formula definition is listed in Equation (5). Ff is the abbreviation of the shear surface function; the full formula definition is listed in Equation (2).
The shear surface consists of a triaxial compression (TXC) surface, a triaxial extension (TXE) surface, and a triaxial torsion (TOR) surface. Figure 2 presents the triaxial compression and tension meridians, respectively. The controlling equation for the TXC is given by:
F f ( J 1 ) = α λ exp ( β J 1 ) + θ J 1
where α, β, λ and θ are the material constants as derived through fitting the data from the triaxial compressive tests.
The TXC intensity ratio of the Rubin scale function at any stress level defines the triaxial torsional and tensile radial functions [40]. The controlling functions for TOR and TXE are given by:
Q 1   =   α 1     λ 1 exp ( β 1 J 1 )   +   θ 1 J 1
Q 2   =   α 2     λ 2 exp ( β 2 J 1 )   +   θ 2 J 1
where Q 1 is the TOR/TXC intensity ratio and Q 2 is the TXE/TXC intensity ratio; α 1 , β 1 , λ 1 and θ 1 are the TOR input parameters; α 2 , β 2 , λ 2 and θ 2 are the TXE input parameters.
The cap hardening surface is a two-part function that is either uniform or elliptical. When the stress state is in the region of the tension or very low confining pressure, the cap hardening surface function is uniform. When the stress state is in the region of the low to high confining pressure, the cap hardening function is elliptical. The cap hardening surface is defined as:
F c ( J 1 ,   κ ) = { 1 , J 1     L ( κ ) 1     [ J 1     L ( κ ) ] [ | J 1     L ( κ ) | + J 1     L ( κ ) ] 2 [ X ( κ )     L ( κ ) ] 2 , J 1 > L ( κ )
L ( κ ) = { κ ,   κ > κ 0 κ 0 ,   κ     κ 0
where κ 0 denotes the value of J 1 corresponding to the initial intersection between the shear failure and cap hardening surface; X ( κ ) denotes the intersection between the cap hardening surface and the axis of J 1 , which is given by:
X ( κ )   =   L ( κ )   +   R F f   [ L ( κ ) ]
where R is the ellipticity ratio of the cap hardening surface. The cap moves to reflect the plastic volume change, in which the cap expansion and contraction are in the light of an isotropic hardening rule [41], which is given by:
ε ν p   =   W { 1     exp ( D 1 [ X κ     X 0 ]     D 2 [ X κ     X 0 ] 2 ) }
where ε ν p denotes the plastic volumetric strain; W denotes the maximum plastic volumetric strain; D1 and D2 are the material constants; X 0 is the initial position of the cap if κ   =   κ 0 .
The damage formulations define the strain softening and modulus reduction behavior. The damage criterion is on the basis of the damage energy release rate method as established by Simo et al. [42], which is defined as:
σ i j   =   ( 1     d ) σ ¯ i j
where d denotes a scalar damage parameter that can be converted to a stress tensor σ ¯ i j in the absence of damage or a stress tensor σ i j in the presence of damage.
The strain rate is accommodated by applying the viscoplastic algorithm, which was extended by Simo et al. [43] on the basis of the Duvaut–Lions formulation. The strength calculation for the strain rate effect is based on the dynamic increase factor (DIF), in which the DIF value equals the ratio of the dynamic strength of the concrete material to quasi-static strength. The relevant strain rate effect equation is defined as:
σ i j vp   =   ( 1     γ ) σ i j T   +   γ σ i j P
where σ i j vp is viscoplastic stress; σ i j T is elastic stress; σ i j P is plastic stress; γ = Δ t / η 1 + Δ t / η , η is fluidity coefficient parameter; Δ t is the time step. The DIF for the compressive and tensile strengths is expressed as:
DIF c = f c , d f c = 1 + E ε ˙ η c f c
DIF t = f t , d f t = 1 + E ε ˙ η t f t
where f c is uniaxial compressive strength; f t is direct tensile strength; f c , d is dynamic compressive strength; f t , d is dynamic tensile strength; ε ˙ is strain rate; η c and η t respectively denote the fluidity coefficient for compressive and tensile strengths, and are defined as follows:
η c = η oc ε ˙ N c
η t = η ot ε ˙ N t
where η oc and Nc are strain rate parameters for compression; η ot and Nt are strain rate parameters for tension.

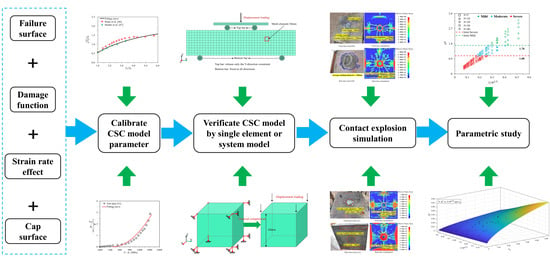
3. Calibration of the CSC Model

In this study, 38 active input parameters were required for the CSC model modification, including modulus parameters (i.e., G, K), triaxial compression surface parameters (i.e., α , θ , λ , β ), triaxial extension and torsion surface parameters (i.e., α 1 , θ 1 , λ 1 , β 1 , α 2 , θ 2 , λ 2 , β 2 ), cap hardening parameters (i.e., X0, R, W, D1, D2, NH, CH), damage parameters (i.e., B, D, GFC, GFT, GFS, pwrt, pwrc, pmod) and strain rate parameters (i.e., η oc , η ot , Nc, Nt, overc, overt, srate, repow). The calibration of some key input model parameters to reflect the material behavior of G-UHPC is introduced in the following contents.

3.1. Bulk and Shear Moduli

The bulk modulus K represents the response of material under hydrostatic pressure. The shear modulus G represents the response of material under shear stress. In this study, these two moduli are not independent, and for isotropic materials, they related to Young’s modulus Ec through the equations:
K   =   E c / 3 ( 1     2 ν )
G   =   E c / 2 ( 1   +   ν )
where E c denotes the elastic modulus of G-UHPC, which was determined to be 33 GPa as obtained from the elastic stage in the uniaxial compressive stress–strain curve [31]; ν is the Poisson’s ratio of G-UHPC, which was determined to be 0.2 according to the previous review study by Ranjbar and Zhang [44].

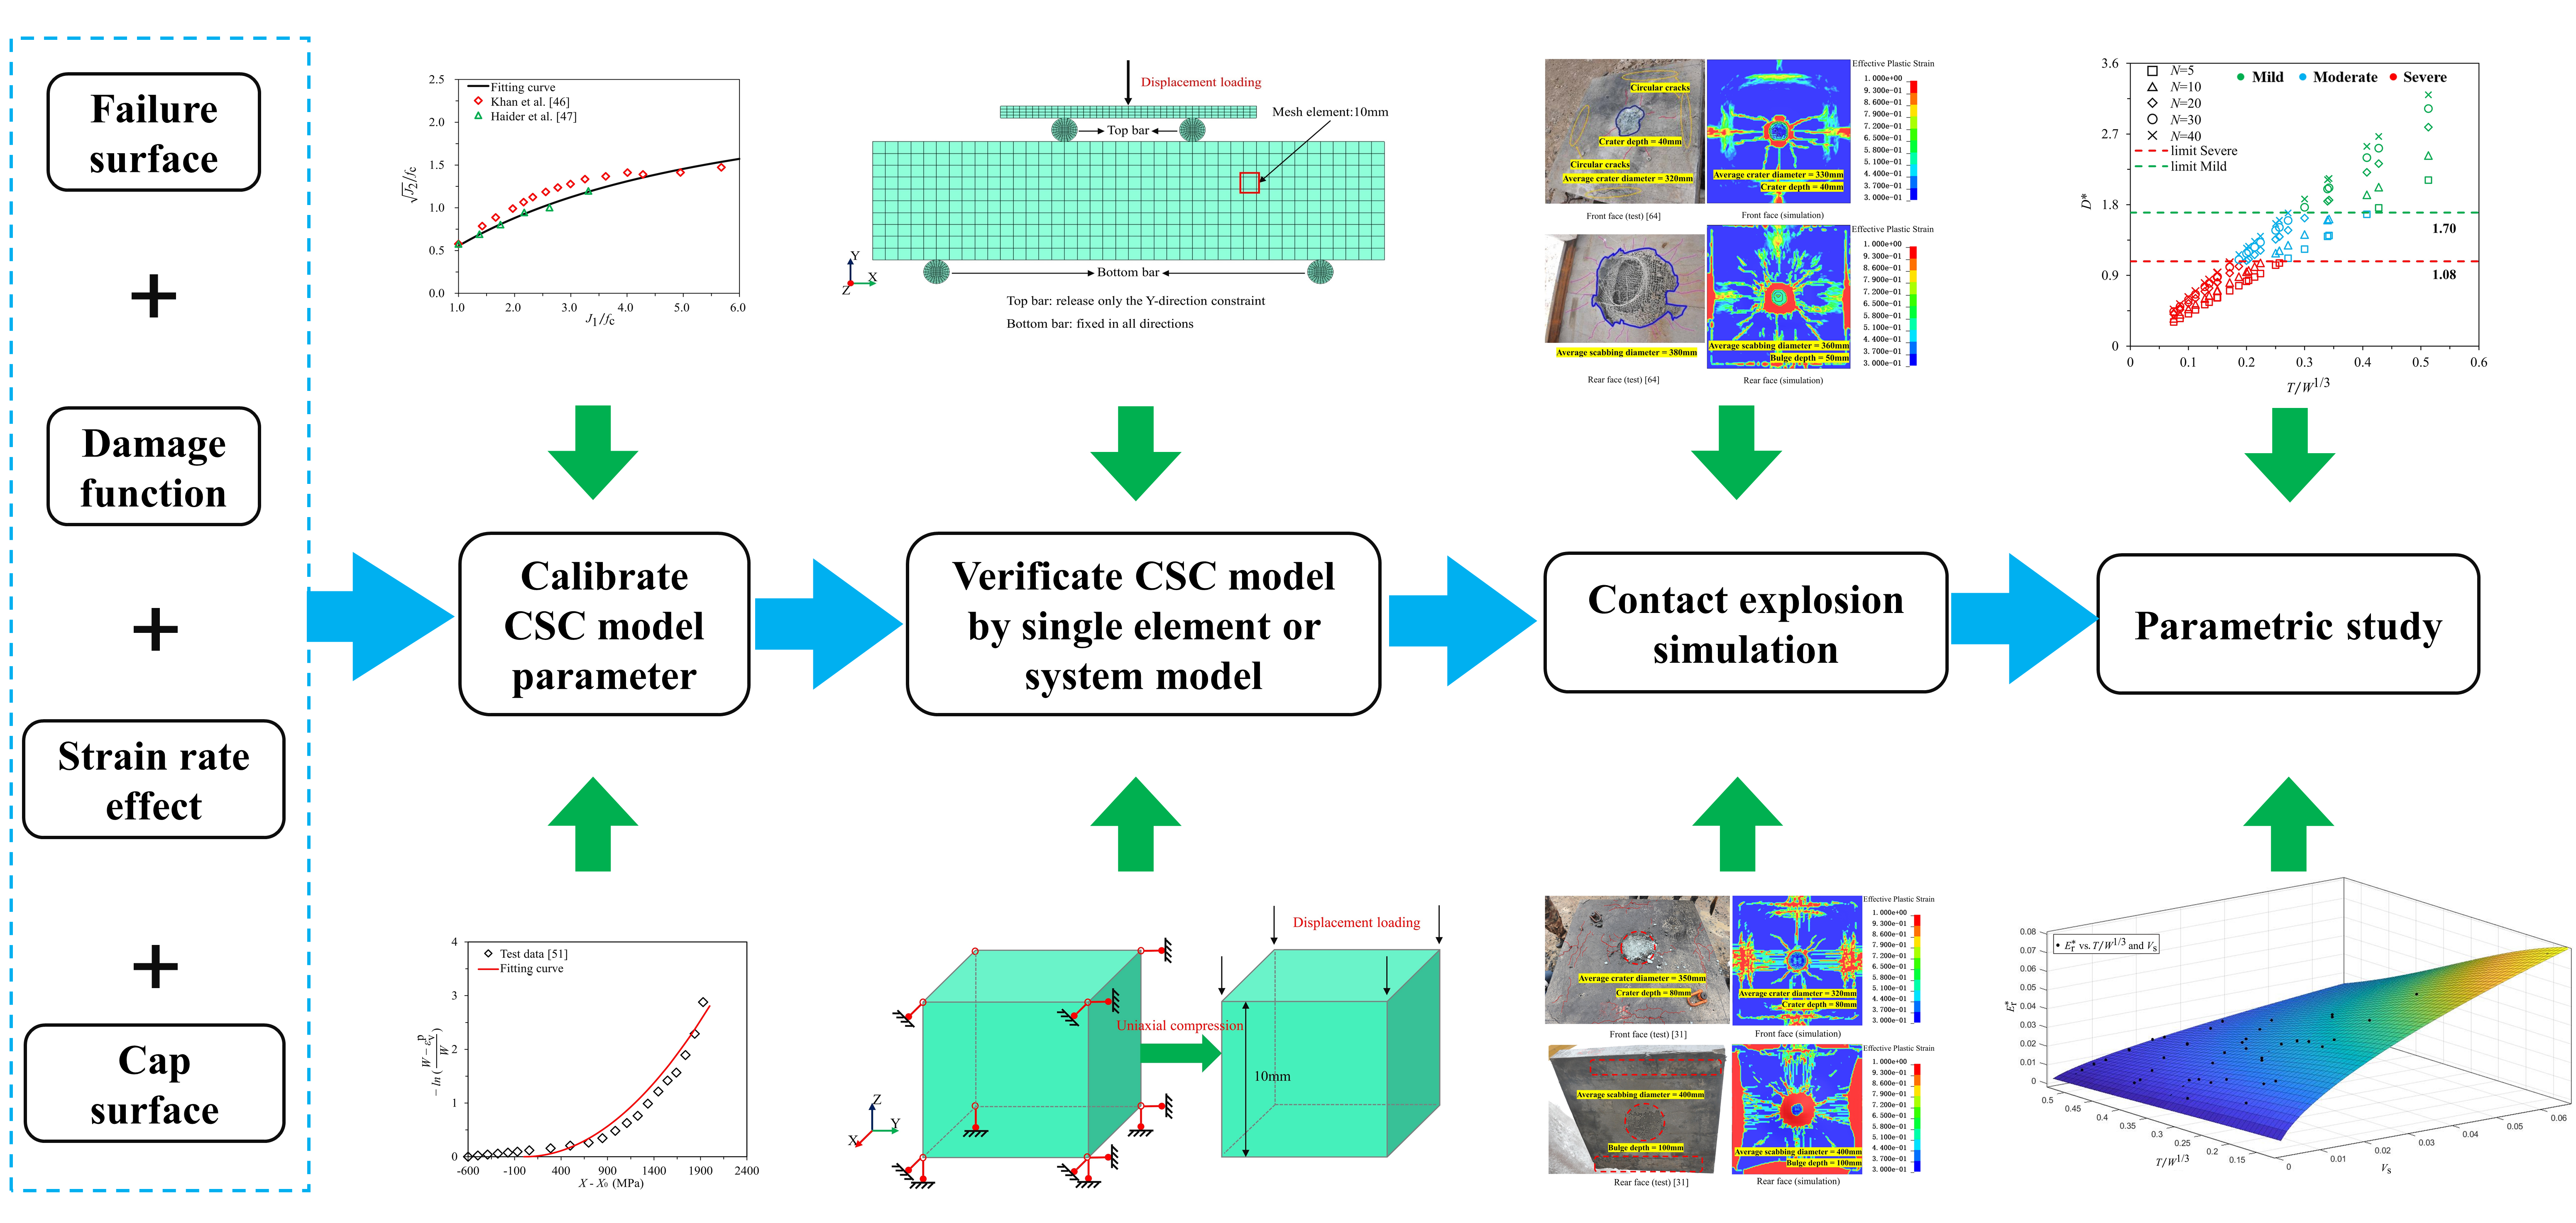
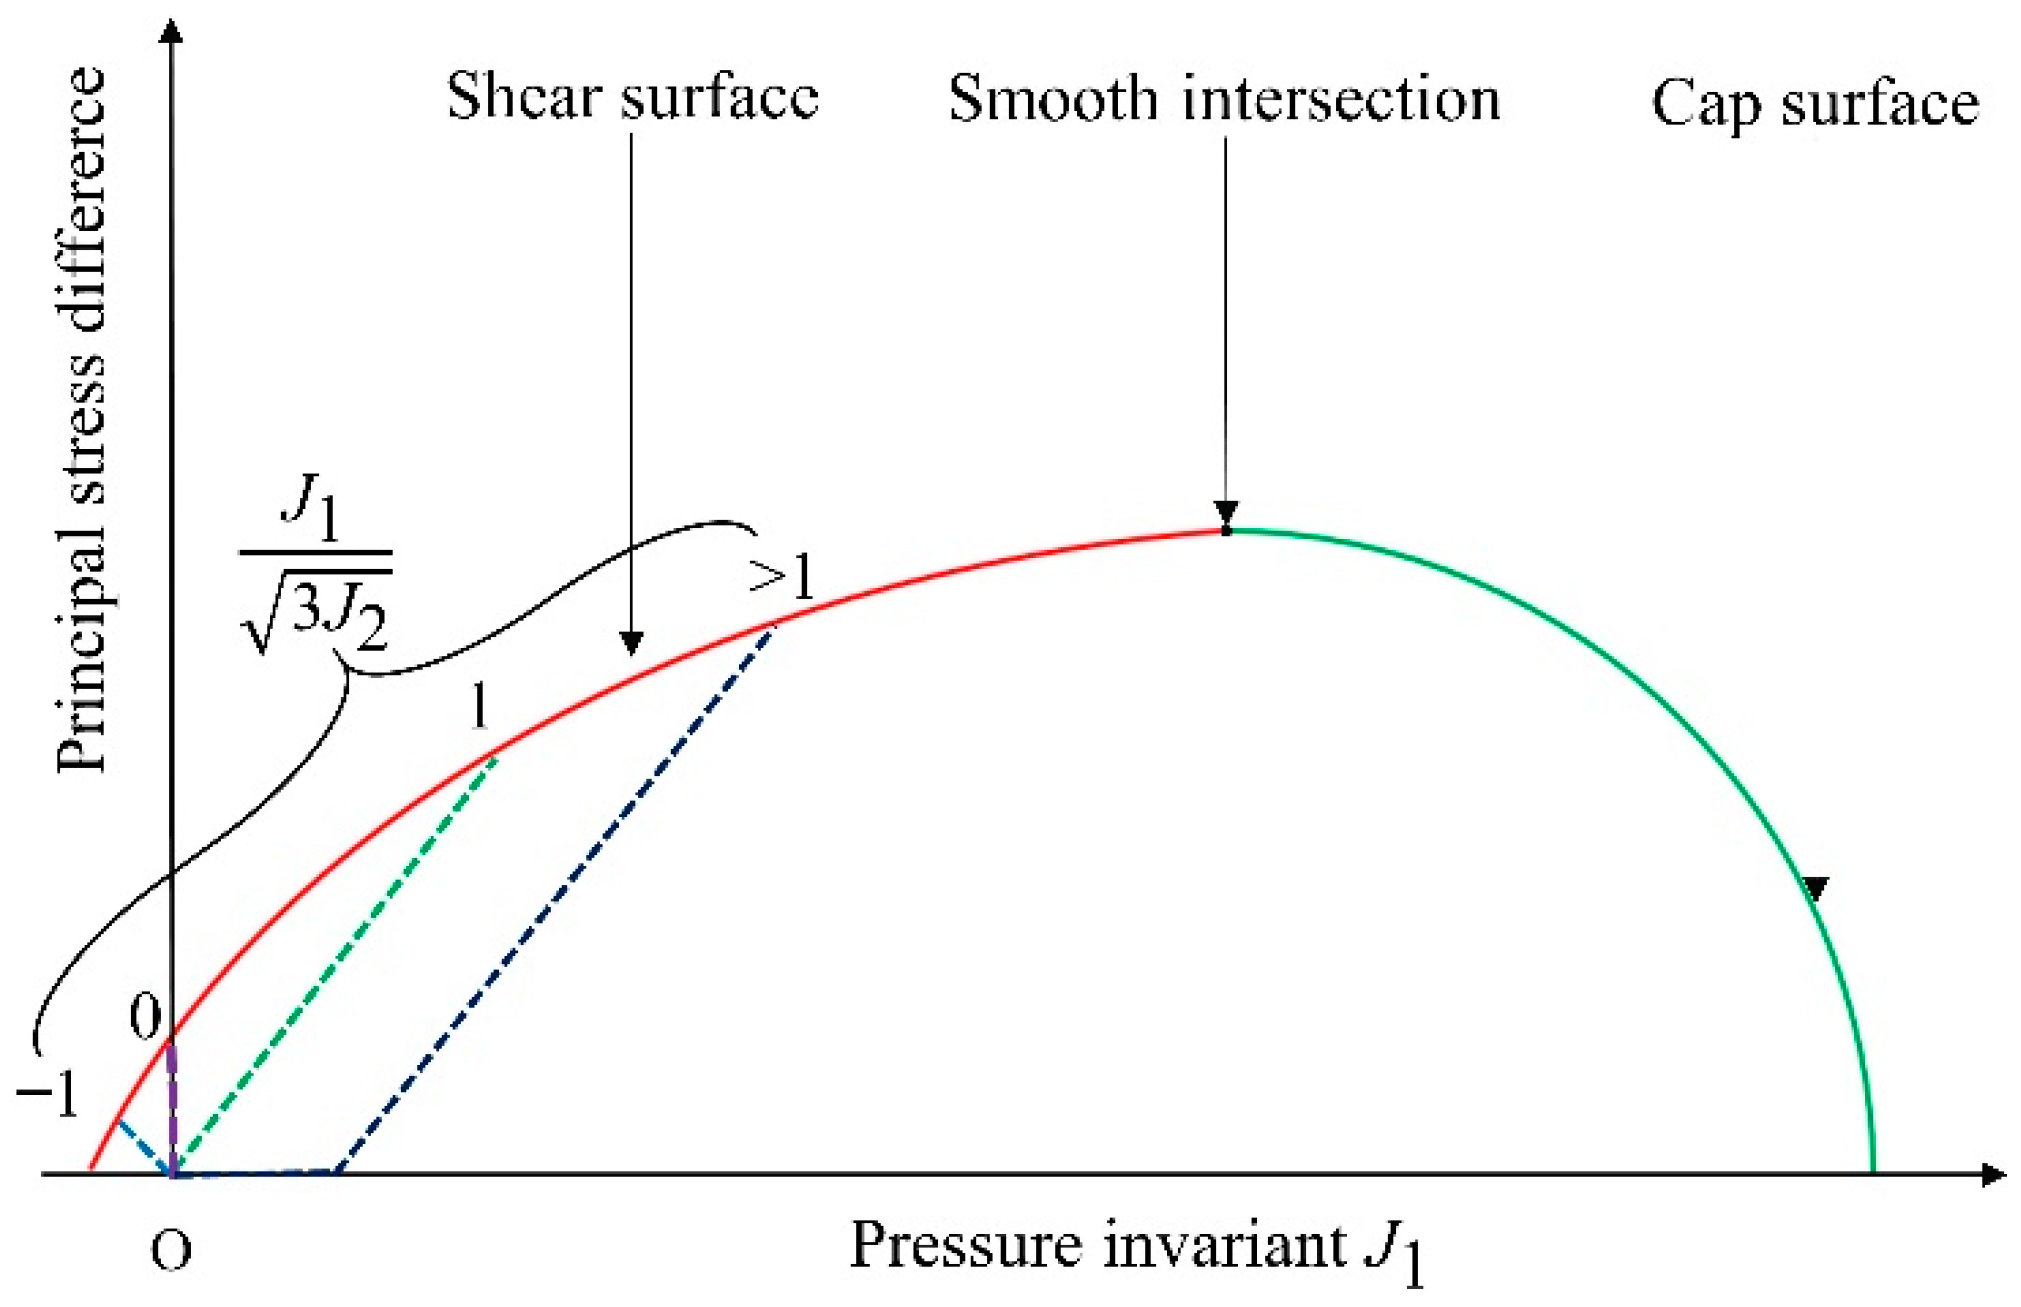
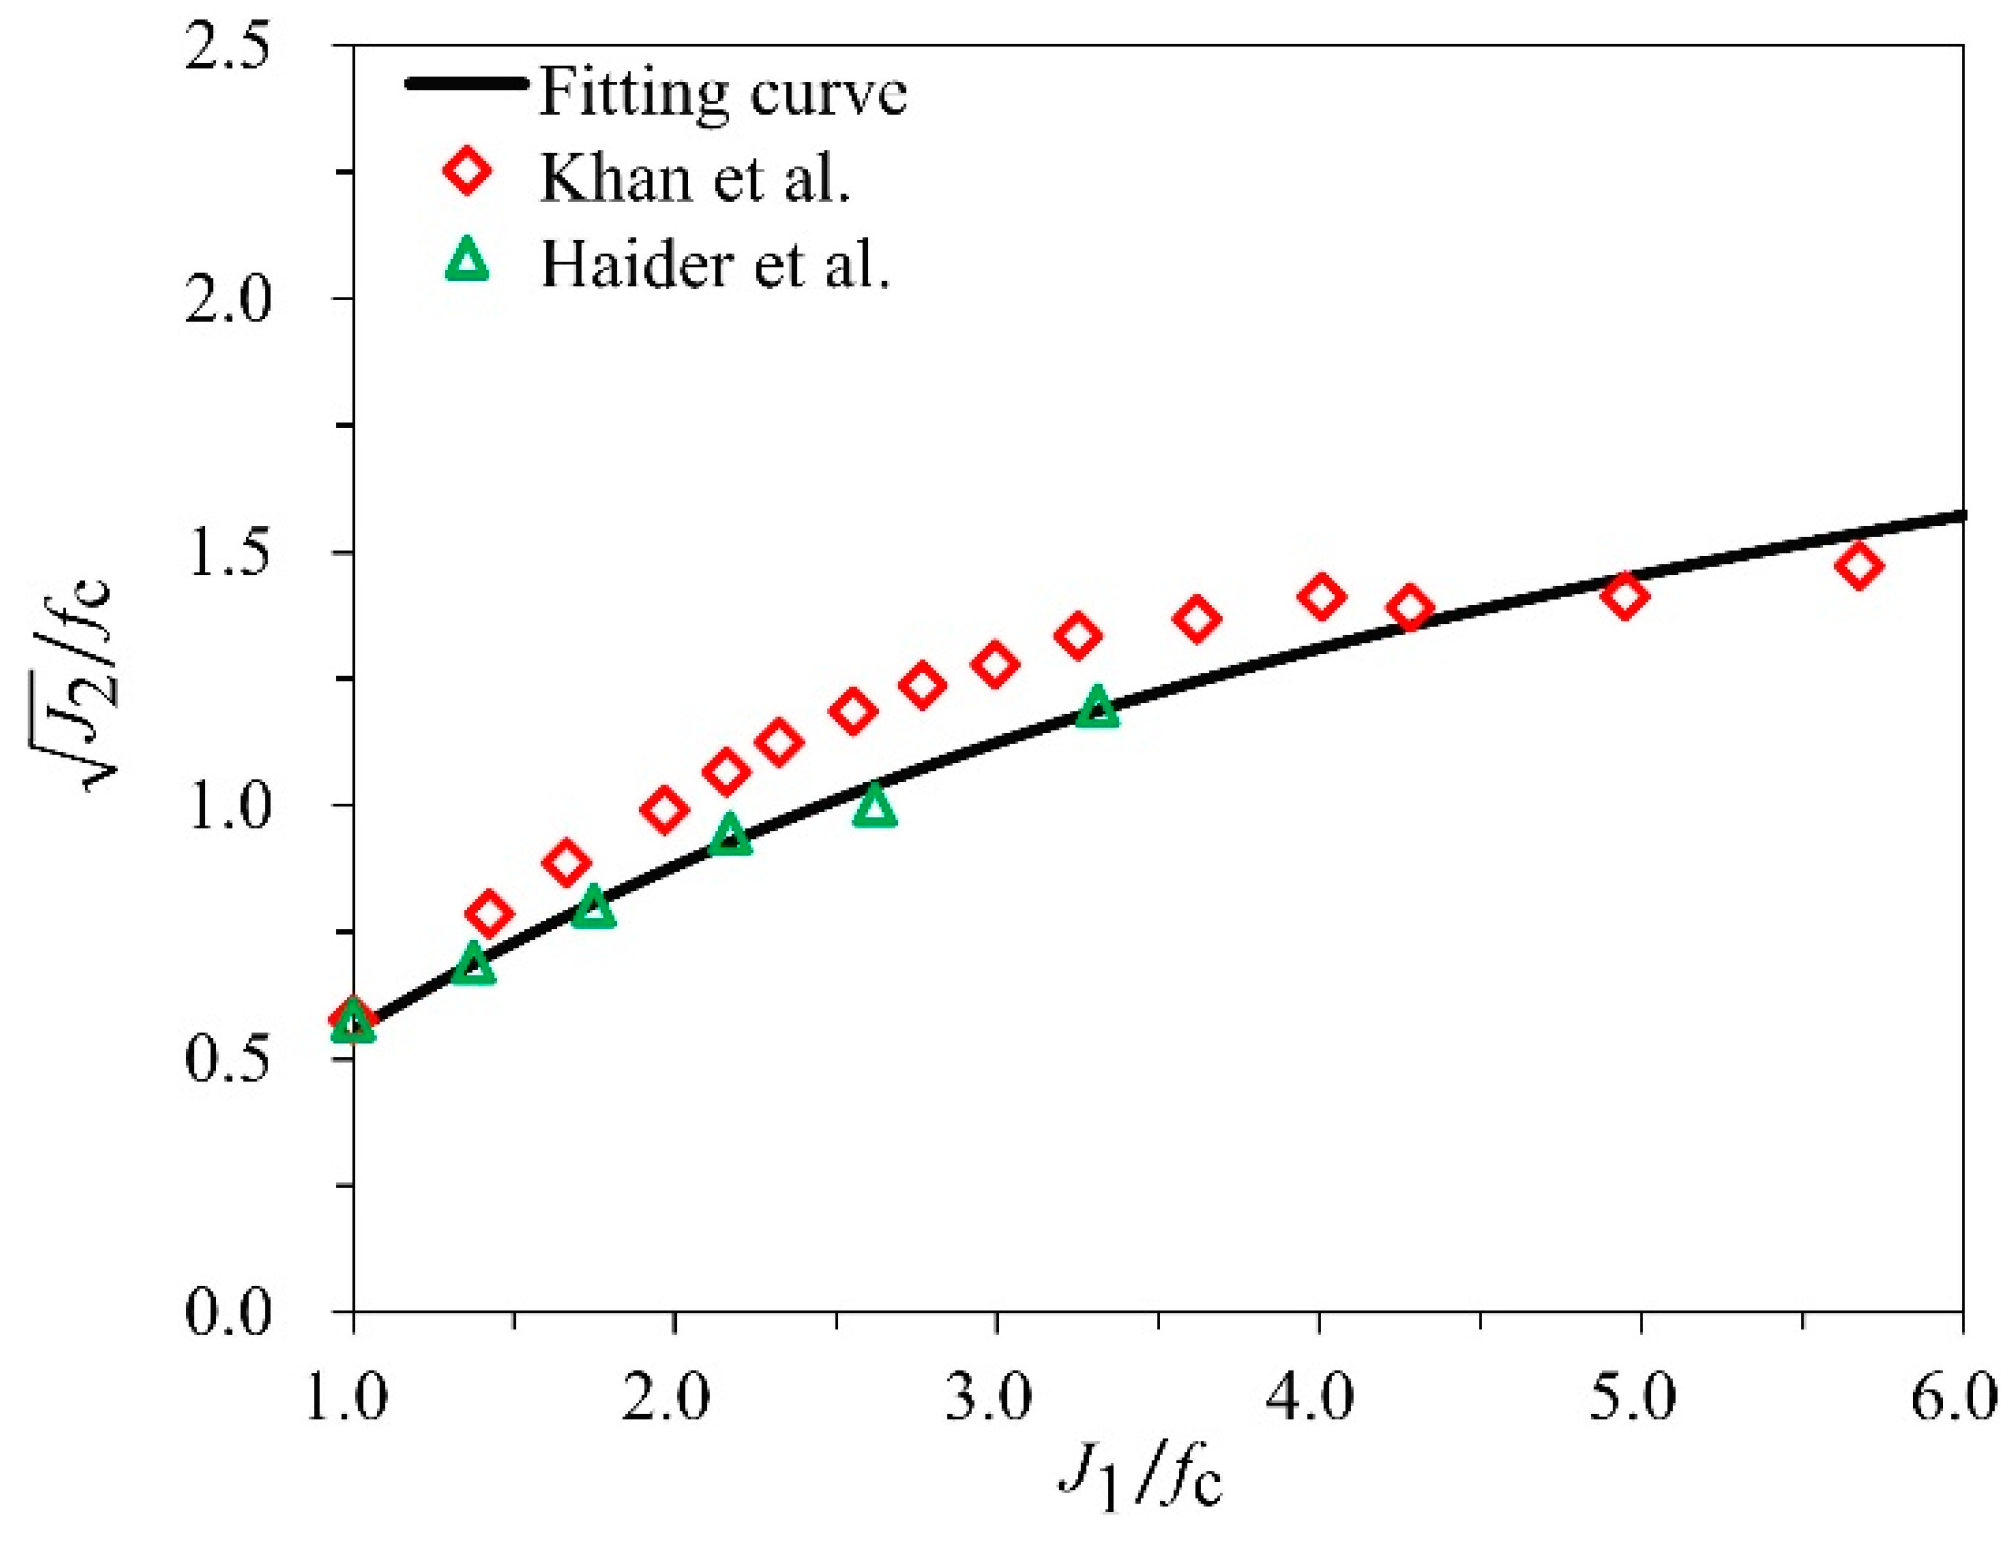
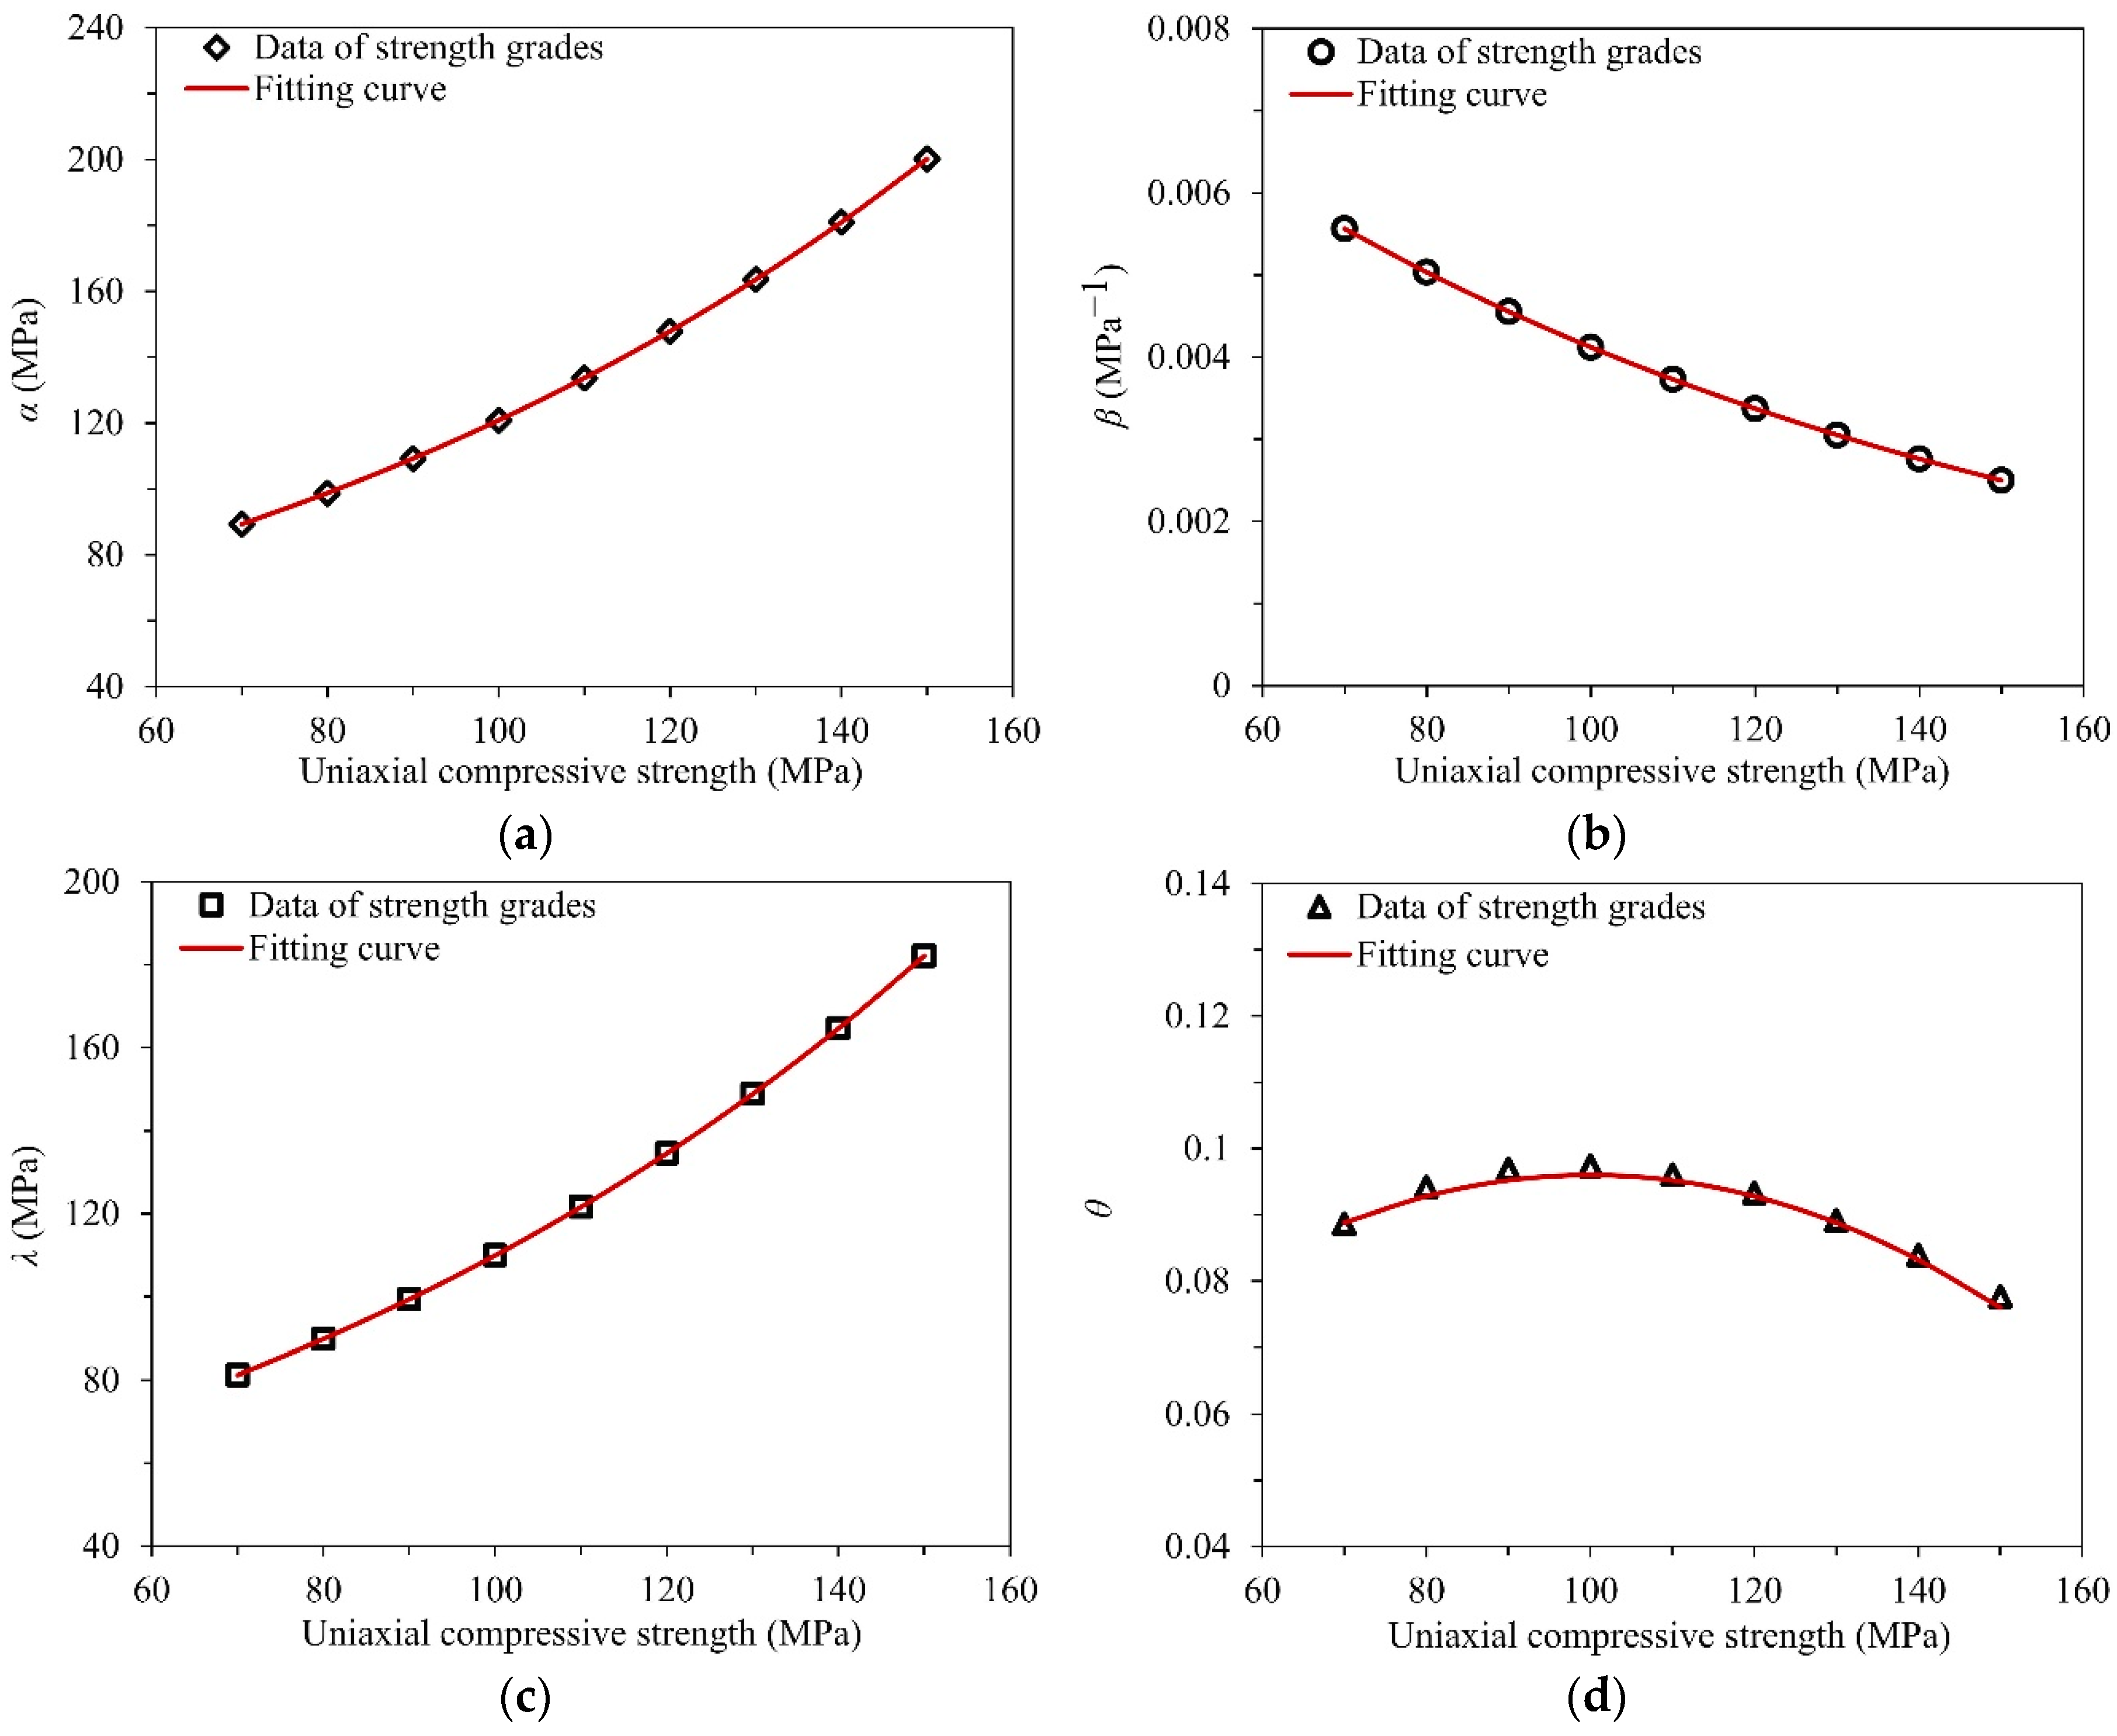
3.2. Triaxial Compression Surface

The TXC parameters were determined by fitting four types of stress states obtained from the triaxial compression tests. As shown in Figure 2a, the four stress states included A1: triaxial tensile state, B1: biaxial tensile state, C1: uniaxial compression state and D1: triaxial compressive state. The triaxial and biaxial tensile strengths of G-UHPC were set approximately equal to the uniaxial tensile strength [45]. To gain the triaxial compressive strength of G-UHPC at different confining pressure, Khan et al. [46] and Haider et al. [47] carried out the triaxial compression tests on geopolymer concrete with the uniaxial compressive strength up to 90 MPa. Through selecting the triaxial compression test data, as presented in Figure 3, the fitting formula is expressed as:
J 2 f c = 1.41     1.3 exp ( 0.36 J 1 f c ) + 0.072 J 1 f c
where J 2 = 3 τ 0 2 2 ;   J 1 = 3 P = 3 σ 0 ;   τ 0 = ( σ 1 σ 2 ) 2 + ( σ 1 σ 3 ) 2 + ( σ 2 σ 3 ) 2 3 ;   σ 0 = ( σ 1 + σ 2 + σ 3 ) 3 ; σ 1 , σ 2 and σ 3 are the principal stress.
In order to obtain the parameters in the compression meridian, a minimum of five stress states was suggested [48]. Apart from points C1 and D1 in Figure 2a, the other three stress states at various pressure levels (i.e., J 1   =   1.5 f c , 3 f c and 5 f c ) were selected for the triaxial compression states, which could be determined by Equation (17). Based on the aforementioned stress states, the parameters were determined via fitting to the compression failure surface at various strength levels using the least-square method [39]. Figure 4 shows the fitting results, wherein the corresponding parameters of α, β, λ and θ with respect to f c were determined by the following equations:
α   =   44 exp ( 0.0101 f c )
β   =   0.0112 exp ( 0.01 f c )
λ   =   40.041 exp ( 0.0101 f c )
θ   =   9   ×   10 6 f c 2   +   0.0018 f c   +   0.0062

3.3. TOR and TXE

The strength ratios for TOR and TXE were determined via Equations (3) and (4). The triaxial extensile surface includes four stress states [35], which are triaxial tensile (A1), uniaxial tensile (B2), biaxial compression (C2), and triaxial extension (D2), as shown in Figure 2b. The eight strength parameters ( α 1 , β 1 , λ 1 , θ 1 , α 2 , β 2 , λ 2 , θ 2 ) were adopted to fit the equation in light of the triaxial tension and triaxial torsion tests. As limited triaxial tension and triaxial torsion tests for G-UHPC can be found in the open literature, the constitutive theory for concrete was adopted to determine the eight key parameters. First, the function Q 1 ( J 1 ) was formed by Rubin’s proportional function, so Q 1 ( J 1 )     1.0 , i.e., ( α 1     λ 1 exp ( β 1 J 1 )   +   θ 1 J 1 )     1.0 . If θ 1 > 0 and J 1 →∞, Q 1 ( J 1 ) can be infinite. Therefore, θ 1 was set to 0. Second, when concrete was subjected to high confining compressive stress (i.e., when J 1 →∞, α 1   +   θ 1 J 1     1 ) , α 1 was set to be 1.0. Then, according to the original CSC model [35], Q 1 ( J 1   =   0 ) was taken as 0.5774 in order to produce a smooth transition between the tensile and compressive pressure regions of the concrete material, so the parameter λ 1 = 1 0.5774 = 0.4226 . β 1 was calculated to be 1.76 × 10⁻³ MPa−1 by Equation (3), according to the previous study by Guo et al. [37]. Adopting the same approach, the four key parameters ( α 2 , β 2 , λ 2 and θ 2 ) for TXE in Equation (4) can be determined as follows: α 2   =   1.0 , β 2   =   1.76   ×   10 3   MPa 1 , λ 2   =   0.5 and θ 2   =   0 .

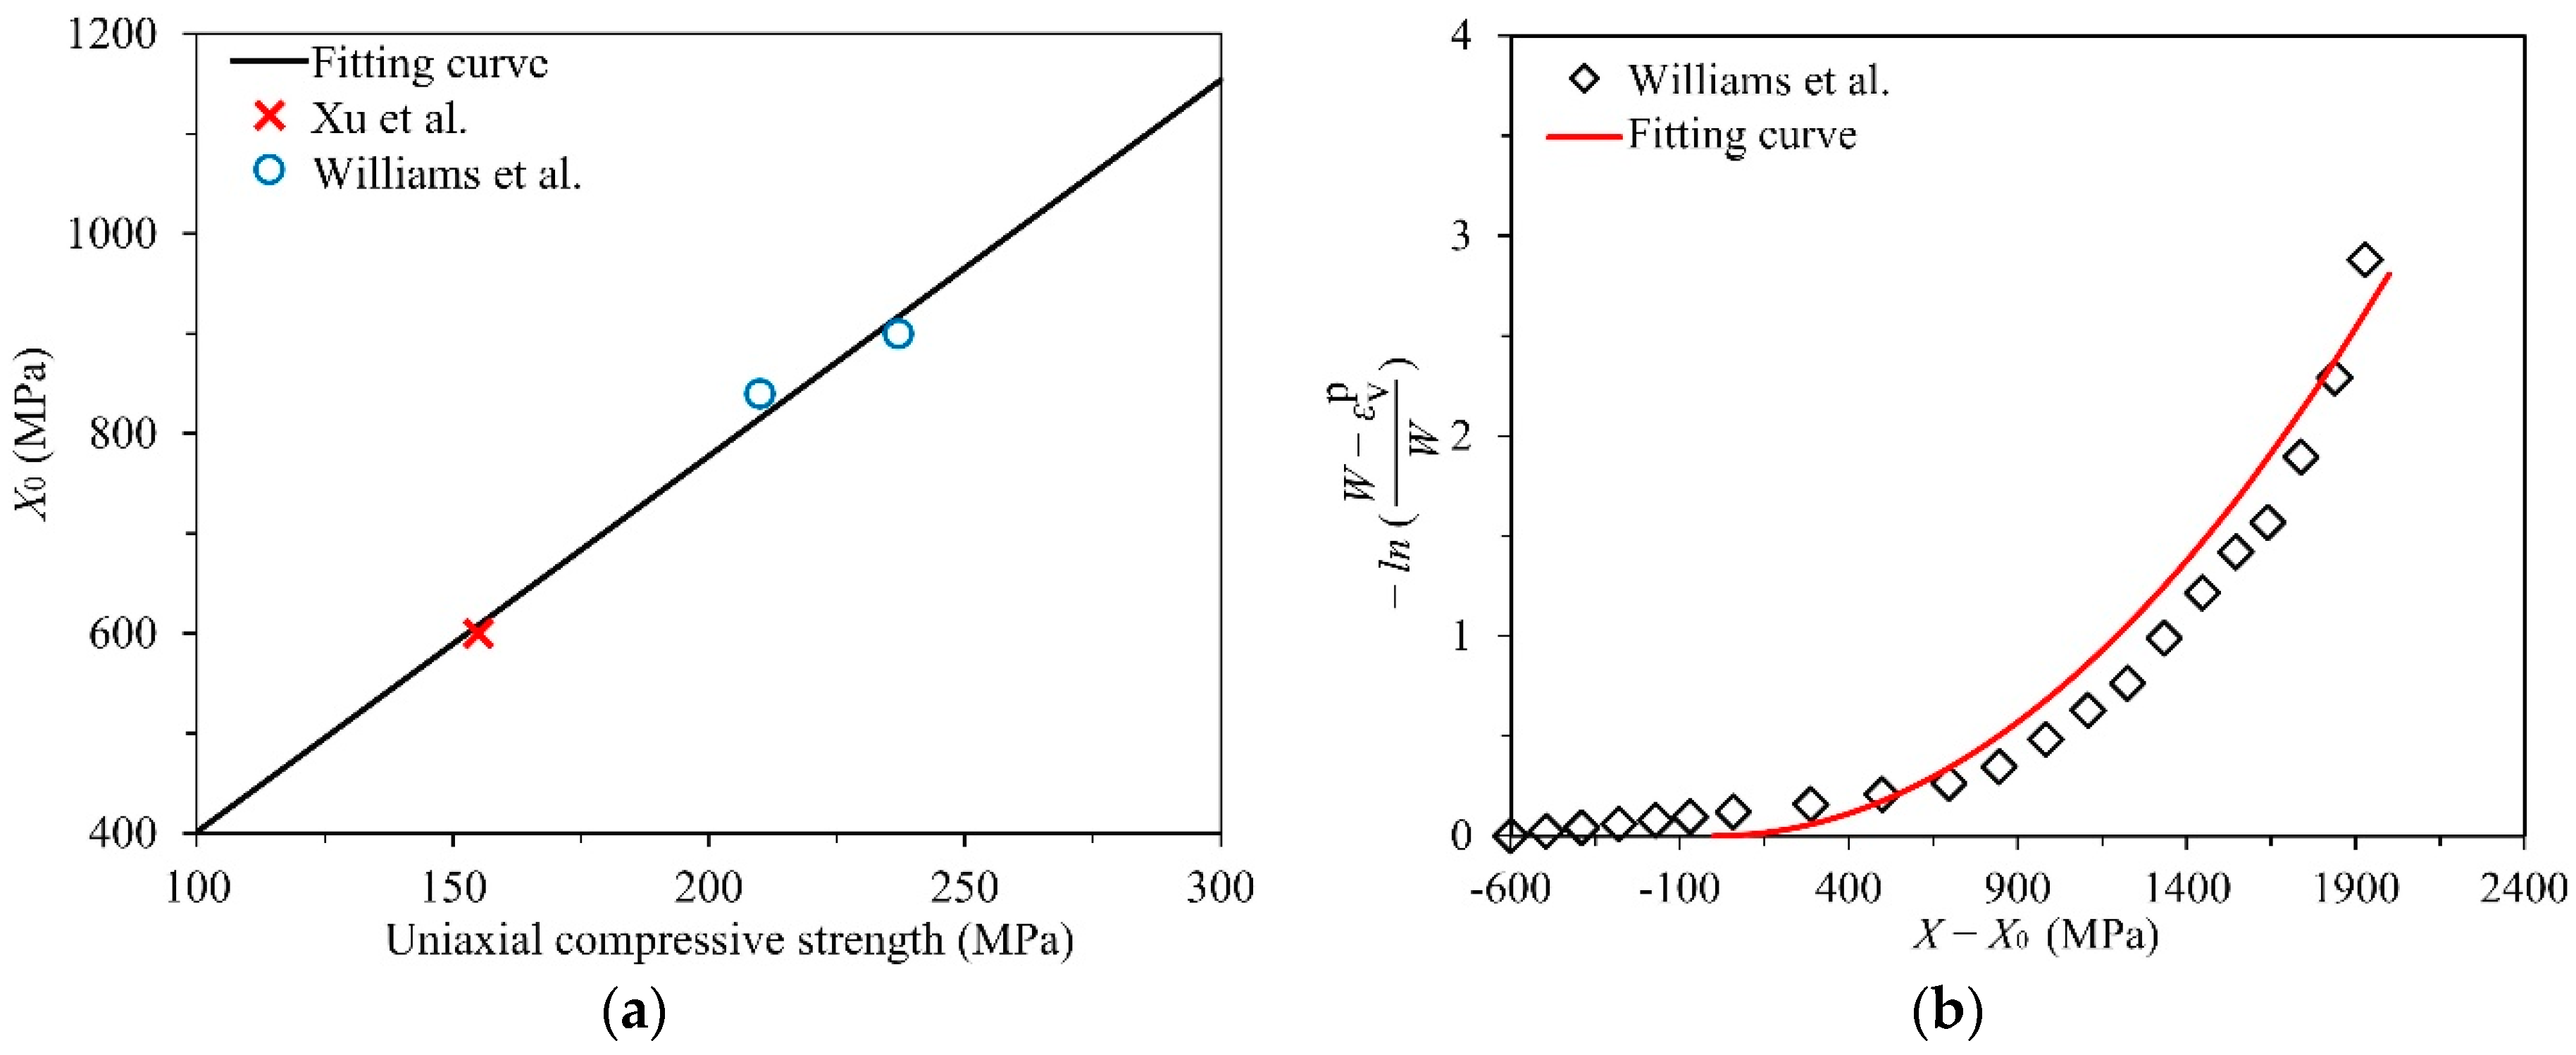
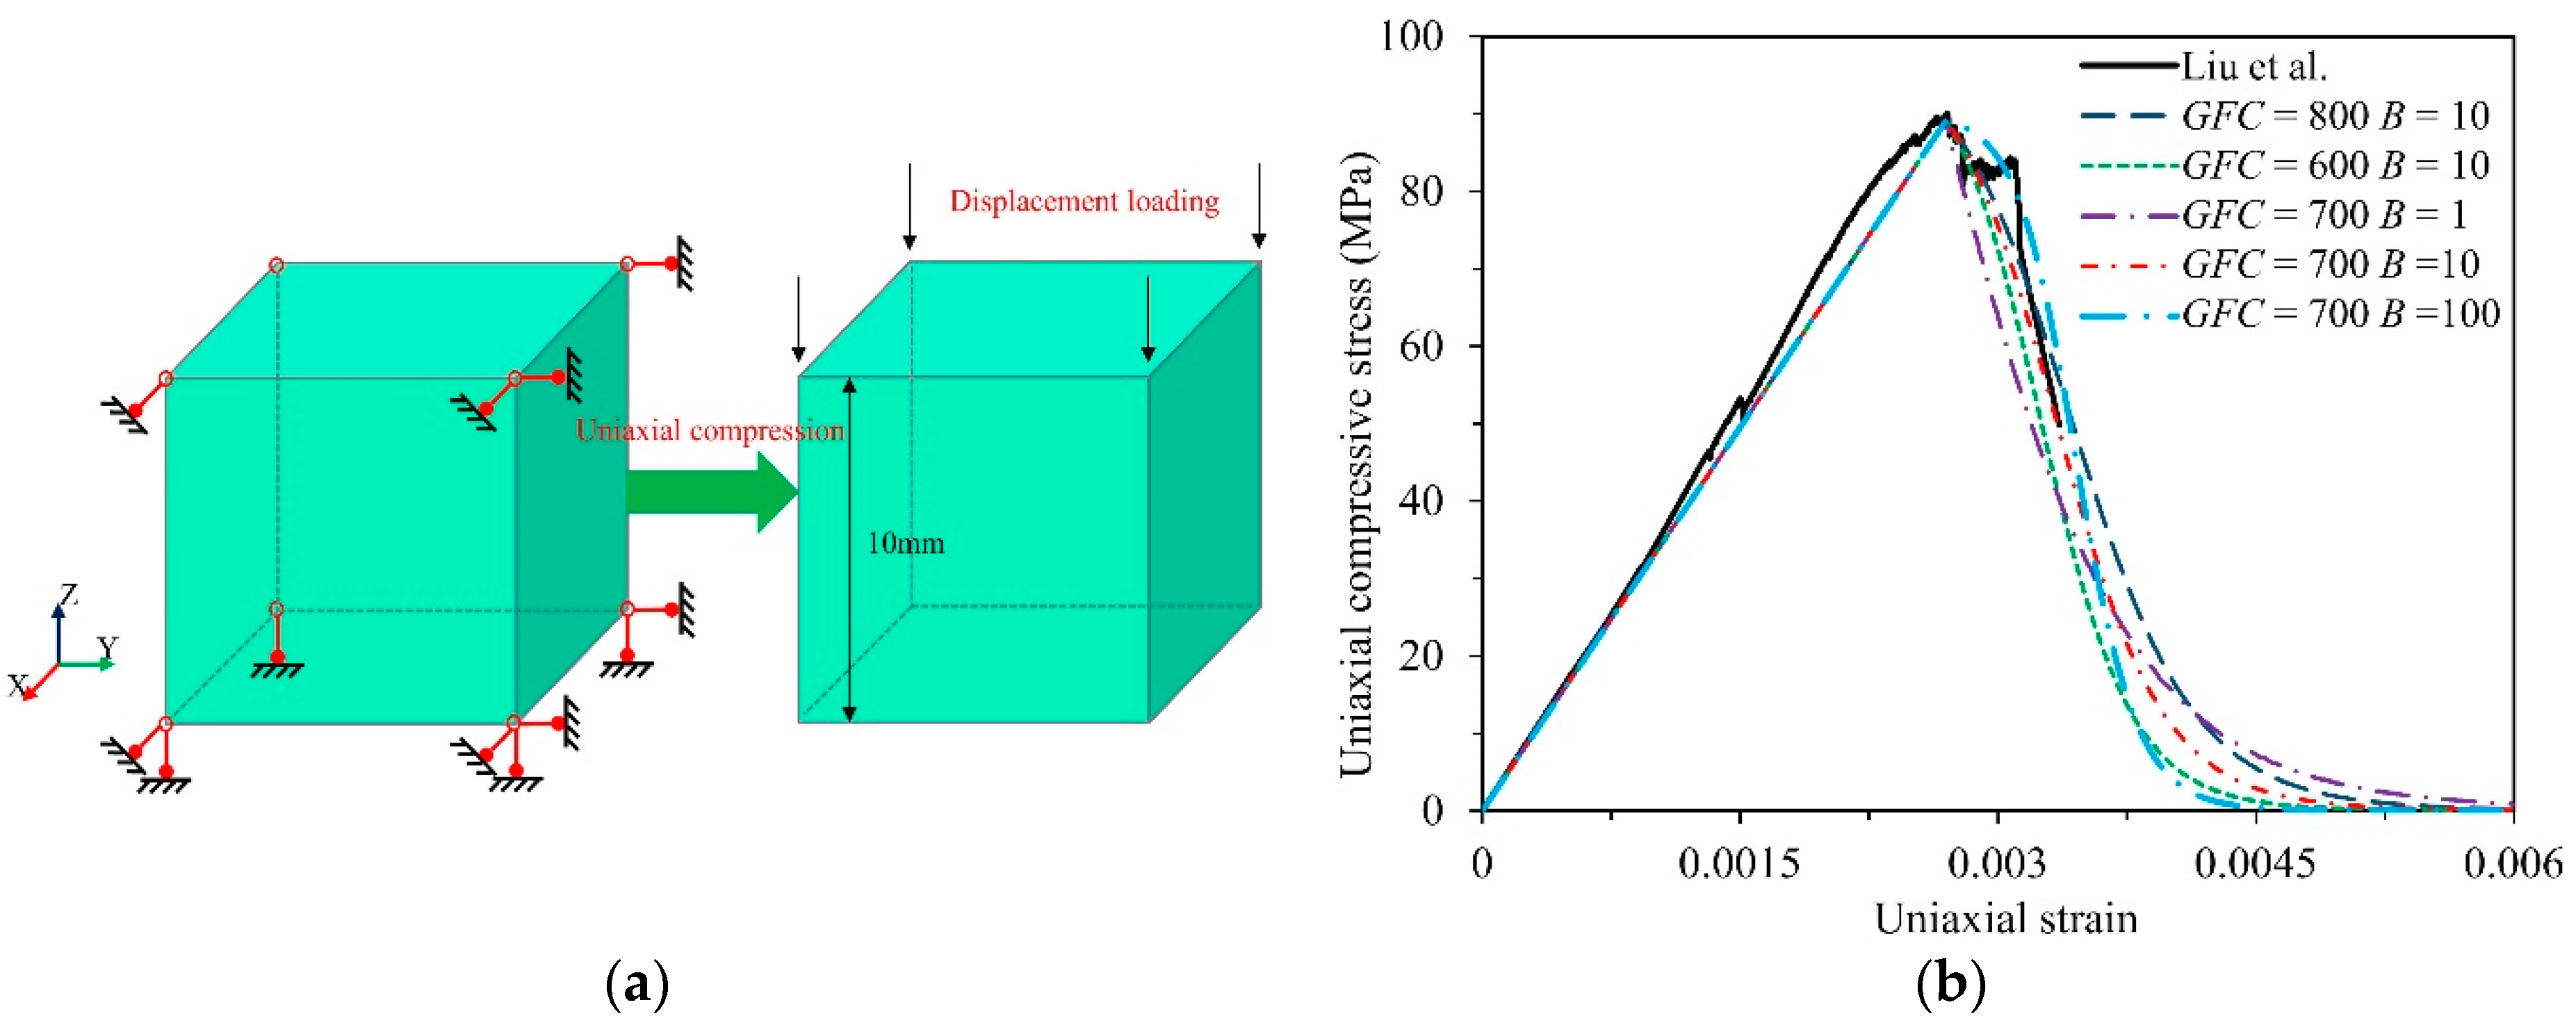
3.4. Cap Hardening Surface

The cap hardening surface parameters consist of initial cap position (X0), cap aspect ratio (R), maximum effective plastic volume strain (W), linear shape parameter (D1), and quadratic shape parameter (D2). The cap parameters could be determined based on the hydrostatic pressure-volumetric strain curve obtained from the hydrostatic compression tests. Since limited hydrostatic tests were conducted on G-UHPC, this study adopted the available test data on PC-UHPC to assume the cap parameters of the CSC model. This assumption was in view of the similarity between these two types of UHPC materials in terms of density, Poisson’s ratio, and porosity [49,50]. Based on hydrostatic compression data by Williams et al. [51] and Xu et al. [52], the relationship between X 0 and f c was fitted, which is shown in Figure 5a. The cap ellipticity R can be derived based on the previous study by Jiang et al. [41], the expressions of X 0 and R are as follows:
X 0   =   3.762 f c   +   25.05
R   =   43.40 / f c   +   4.784
The maximum effective plastic volume strain W was assumed to be the porosity of G-UHPC [38]. In the current study, the value of W was determined to be 0.0445 for G-UHPC in accordance with the proposed value by Williams et al. [51]. After fitting with the test data using Equation (8), as presented in Figure 5b, the values of D1 and D2 were determined to be 3.368 × 10⁻³ MPa−1 and 1.134 × 10⁻⁶ MPa−2, respectively. The default values of 1.0 and 0 were respectively taken for N H and C H as suggested in the original CSC model [35].

3.5. Damage

The model parameters governing the damage evolution mainly include the compressive fracture energy (GFC), tension fracture energy (GFT), shear fracture energy (GFS), ductile shape softening (B), brittle shape softening (D), shear-to-compression transition parameter (pwrc), shear-to-tension transition parameter (pwrt) and pressure softening parameter (pmod). As recommended in the original CSC model [35], the default values of 0, 1.0 and 5.0 were respectively set for pmod, pwrt and pwrc, and GFS was assumed to be equal to GFT. The damage parameters GFT and D govern the strain-softening behavior under tension. The damage parameters GFC and B govern the strain-softening behavior under compression. The fracture energy (GFT and GFC) in the CSC model is sensitive to the element size [38]. To determine GFC, B, GFS, and D, the single-element model under uniaxial compression and the full-scale model under four-point bending were built, as presented in Figure 6a and Figure 7a, respectively. The details about the single-element simulation setup could be found in the study by Guo et al. [37], and the four-point bending simulation setup, as well as the loading scheme, could be found in the study by Wei et al. [39]. The element size adopted in the models was 10 mm, which was consistent with that in the contact explosion simulations for the slabs. Figure 6b presents the influence of GFC and B on the uniaxial compressive stress–strain curve. The compressive strain hardening behavior of the CSC model increases with the increase in parameters GFC and B. After fitting with the test results as reported in Ref. [31], GFC and B were determined to be 700 Pa·m and 10, respectively. Figure 7b presents the effect of GFT and D on the force-displacement curve, and the tensile strain hardening behavior of the CSC model also increases with the increase in parameters GFT and D. After fitting with the test result as reported in Ref. [24], GFT and D were taken as 40 Pa·m and 5000, respectively.

3.6. Strain Rate Effect

Figure 8 shows a collection of DIF values for the compressive strength [53,54,55,56,57,58,59] and tensile strength [60,61,62,63] of geopolymer concrete under an extensive range of strain rates from open literature. Based on the existing test data, a series of empirical equations were derived to evaluate the DIF values of geopolymer concrete, which are given by:
For the compressive strength:
DIF c = { 1.0 for   ε ˙ < ε ˙ sc 1.0 + 0.01 ε ˙ 0.88 for   ε ˙     ε ˙ sc
where ε ˙ sc = 1.2 × 10 5   s 1 .
For the tensile strength:
DIF t = { 1.0 for   ε ˙ < ε ˙ st 1.0 + 0.64 ε ˙ 0.55 for   ε ˙     ε ˙ st
where ε ˙ st = 1.0 × 10 6   s 1 .
To prevent overprediction of the DIF values at high strain rates, the LS-DYNA user manual [32] suggests interposing a cut-off value for the DIF-strain rate curves. In the current study, referring to the recommendation from the LS-DYNA user manual [32], the cut-off values were set at a strain rate of 300 s−1 in both compression and tension. Then, the active input key parameters, including η oc , η ot , N c , N t , overc and overt (Equations (11)–(14)), were derived by fitting data on the proposed curve made based on Equations (24) and (25), which are given by:
η oc = 0.01 f c E c
η ot = 0.64 f t E c
N c = 0.12
N t = 0.55
In compression:
o v e r c = 0.01 f c ε ˙ 0.88
In tension:
o v e r t = 0.64 f t ε ˙ 0.55
srate and repow were taken as the default value of 1.0, as recommended in the original CSC model [35].

4. Validation of Numerical Models

To validate the numerical models, contact explosion tests were numerically simulated on the multi-layered SWM-reinforced G-UHPC slabs with the utilization of the calibrated CSC model. The following contents briefly introduce the contact explosion tests, finite element modeling, material models excluding concrete, and the comparison between the numerical and experimental results.

4.1. Contact Explosion Tests

In the contact explosion tests, as reported in Refs [31,64], two 200 mm × 1500 mm × 1500 mm G-UHPC slabs reinforced with multi-layered SWM were tested. The first slab was reinforced by 10-layer SWM reinforcement (labeled as G-UHPC-10SWM) and subjected to 0.4 kg of TNT explosive. The second slab was reinforced by 20-layer SWM reinforcement (labeled as G-UHPC-20SWM) and subjected to 1.0 kg of TNT explosive. Further, 1 mm diameter 304 stainless steel wires with a 10 mm interval for SWM. The SWM layers were designed to be evenly distributed, and the SWM layers next to each other were spaced the same. The concrete cover depth was 10 mm. The yield strength and elastic modulus of the reinforcement were 500 MPa and 200 GPa, respectively. The 28-day uniaxial compressive strength of G-UHPC without steel fibers was 90 MPa. Figure 9 presents the schematic diagram of the slab, TNT explosive, and SWM reinforcement. In the tests, the SWM-reinforced G-UHPC slabs were simply supported by the square steel frame with a side length of 1500 mm located upon four trapezoidal concrete piers [64]. The setup of the contact explosion tests can be seen in Figure 10.

4.2. Finite Element Modelling

Figure 11 shows the 3D finite element models of G-UHPC-10SWM and G-UHPC-20SWM subjected to TNT contact explosions through the multi-material ALE algorithm. The G-UHPC slab and steel frame were modeled utilizing a single-point integration algorithm and the eight-node hexahedron Lagrangian elements, wherein a 10 mm mesh size was chosen for the slab after a convergence test. The SWM was modeled by the Hughes-Liu beam elements with a mesh size of 10 mm and the cross-sectional integration algorithm. The TNT explosive and air were modeled by the Euler elements with a mesh size of 10 mm after a convergence test. CONTACT_AUTOMATIC_SURFACE_TO_SURFACE was adopted to define the contact between the concrete slab and steel frame, in which the static and dynamic frictional coefficients were both set to 0.5. The blast wave propagation, the interaction between the blast wave and the G-UHPC slab, as well as the full constraint between the slab and SWM reinforcement, were defined through CONSTRAINED_LAGRANGE_IN_SOLID. Non-reflecting boundary conditions were set on the surrounding sides of the air domain to avoid reflected stress waves.

4.3. Material Models

4.3.1. G-UHPC

In accordance with the calibration procedures as introduced in Section 3, the CSC model parameters were determined for G-UHPC, which are listed in Table 1. It was generally accepted that a key problem with Lagrangian elements under high-rate loading is the large distortion that causes computational overflow [65]. To solve this problem, an erosion algorithm activated by MAT_ADD_EROSION was adopted to remove large distortion elements once the erosion criterion was reached. In the current study, the maximum principal strain of 0.1 was ultimately used as the erosion criterion for G-UHPC via several trial simulations.

4.3.2. TNT Explosive and Air

The TNT explosive was modeled using MAT_HIGH_EXPLOSIVE_BURN. EOS_JWL was employed for the TNT explosive to simulate the detonation procedure. The pressure in EOS is defined as:
P = A ( 1 ω R 1 V ) e R 1 V + B 0 ( 1 ω R 2 V ) e R 2 V + ω E V
where V denotes the relative volume; E denotes the specific internal energy; ω, A, B0, R1 and R2 are the active input parameters. Table 2 lists the model and EOS parameters for the TNT explosive.
The air was modeled by MAT_NULL, along with EOS_LINEAR_POLYNOMIAL. The pressure P in EOS was defined by:
P = C 0 + C 1 μ + C 2 μ 2 + C 3 μ 3 + E 0 ( C 4 + C 5 μ + C 6 μ 2 )
where C0, C1, C2, C3, C4, C5 and C6 are user-defined constants; μ = 1/V − 1, in which V is the relative volume; E0 is the internal energy per initial volume. Table 2 lists the model and EOS parameters for the air.

4.3.3. SWM and Square Steel Frame

MAT_PIECEWISE_LINEAR_PLASTICITY was employed for SWM. The strain rate effect on SWM was considered via the incorporation of the curve of DIF and strain rate. The DIF values could be calculated via the equation as proposed by Malvar et al. [66], which is given by:
DIF = ( ε ˙ 10 4 ) α
where ε ˙ is the strain rate; α = 0.074     0.04 f y / 60 , in which f y is the yield strength of SWM. Due to the negligible deformation after the explosion, the square steel frame was treated as a rigid body. Thus MAT_RIGID was adopted to model the square steel frame. Table 3 lists the model parameters for SWM and square steel frame.

4.4. Comparison of Numerical and Test Results

Figure 12 and Figure 13 show the numerical results of the local damage for G-UHPC-10SWM subjected to 0.4 kg TNT contact explosion and G-UHPC-20SWM subjected to 1.0 kg TNT contact explosion, respectively, wherein the effective plastic strain ranging from 0.3 (no damage) to 1 (complete damage) represents the local damage to the slab. As observed from the results of physical tests, the front, rear, and side faces of the slab suffered evident damage along with cracks induced by the stress waves. The steel frame to support the slab also exacerbated the damage close to the edges, especially on the rear face of the slab, as shown in Figure 13. The numerical results were then compared with the test results concerning the crack distribution, crater, and scabbing damage, from which fair agreement between the numerical and test results was exhibited. Therefore, the material and numerical model used in this study are suitable for reproducing the local damage of G-UHPC slabs with SWM reinforcement under contact explosions.
Additionally, the energy evolutions of SWM under two blast scenarios, i.e., 0.4 kg and 1.0 kg, were obtained from the numerical simulations, which are shown in Figure 14. Achieved from the numerical results, the total energies induced by 0.4 kg and 1.0 kg TNT explosives were 1750 kJ and 4380 kJ, respectively. To quantitatively evaluate the effect of the SWM volumetric content on the energy absorption capacity under contact explosions, the internal energy absorption rate of SWM ( E r ) was defined, which is given by:
E r = E s E m
where E s and E m denote the internal energies absorbed by the SWM reinforcement and G-UHPC slab, respectively. As shown in Figure 15, the internal energy absorption rates of 10-layer SWM (0.8 vol-% reinforcement ratio) under 0.4 kg TNT contact explosion and 20-layer SWM (1.6 vol-% reinforcement ratio) under 1.0 kg TNT contact explosion reached 1.6% and 2.7%, respectively, which demonstrated that an increase in the volumetric content of the SWM reinforcement helped improve the energy absorption capacity of the G-UHPC slabs.

5. Parametric Study

To comprehensively understand the contribution of the SWM reinforcement on the contact explosion resistance of G-UHPC slabs, a parametric study was further performed by using the validated finite element models. Table 4 lists the parametric study matrix for SWM-reinforced G-UHPC slabs subjected to contact explosions, in which the SWM layer number (N), space between adjacent wires per layer (L), steel wire diameter (d), TNT equivalent (W) and slab thickness (T) were included for investigation. The yield strength of SWM and the uniaxial compressive strength of G-UHPC were kept as 500 MPa, and 90 MPa, respectively, and 125 test cases were performed for each case (W-T-N1-10-1.0, W-T-N2-L-1.0, and W-T-N2-10-d) listed in Table 4.
Table 5 lists the classifications of the local damage for the G-UHPC slabs after contact explosions [67], wherein three damage levels were included concerning the spall depth. Based on the damage classifications, the result on the local damage of SWM reinforced G-UHPC slabs obtained from the parametric study was normalized, which is defined as:
d   =   H 1   +   H 2   +   H 3 T
where H 1 is the crater depth on the front face; H 2 is the scabbing depth on the rear face; H 3 is the tunnel depth.
Figure 16 shows the influence of N, L, and d on the relationship between the normalized damage d* and T/W1/3. It can be observed that the increase in N and d can decrease the normalized damage of G-UHPC slabs subjected to contact explosions under the identical T/W1/3, but the increase in L will exacerbate the normalized damage. Based on the normalized results from the parametric study (as shown in Figure 17), a series of empirical equations concerning T, W, N, L, and d were proposed to evaluate the local damage ( D ) of SWM-reinforced G-UHPC slabs subjected to contact explosions, which are given by:
D   =   10   ×   T W 1 / 3   ×   N 0.2   ×   d 0.295 L 0.18
For   the   mild   damage   level :   D     1.70
For   the   moderate   damage   level :   1.08     D < 1.70
For   the   severe   damage   level :   D < 1.08
where the unit system is ‘m-kg’. What is also noted is that the empirical equations were valid for 0.10 m ≤ T ≤ 0.30 m and 0.2 kg ≤ W ≤ 2.4 kg.
The increase in N, L, and d can improve the volumetric content of SWM ( V s ) in the G-UHPC slab. Based on the numerical results from the parametric study, the relationship among E r , V s and T/W1/3 was obtained, which is shown in Figure 18. An empirical equation concerning V s and T/W1/3 was then proposed to predict E r under various contact explosion scenarios, which is given by:
E r   =   0.393 V s 0.561 exp [ 4 ( T / W 1 / 3 ) 2 ]

6. Conclusions

In this study, the dynamic response of G-UHPC slabs with SWM reinforcement against contact explosions was numerically performed. To reproduce the existing tests, the Continuous Surface Cap (CSC) model for G-UHPC and the structural model for contact explosion tests in nonlinear finite element software LS-DYNA have been validated. The results noted that structural models based on the developed CSC model reasonably capture the local damage of experimental specimens, which highlighted that the CSC model could be adopted to simulate G-UHPC with SWM reinforcement in contact explosion tests. With the validated finite element models, a parametric study was further carried out to explore the influence of SWM layer number, space between adjacent wires, wire diameter, TNT equivalent, and slab thickness on the local damage levels of G-UHPC slabs with SWM reinforcement under contact explosions. Parametric analysis results show the influence of SWM variables on local damage; based on the results from the parametric study, a series of empirical equations concerning the aforementioned variables were established. These empirical equations can be used to identify the damage mode of G-UHPC slabs with SWM reinforcement under contact explosion and predict the internal energy absorption rate of SWM. The proposed empirical equations could provide a general guideline for designing G-UHPC with SWM reinforcement against contact explosions.

Author Contributions

Conceptualization, C.L. and J.L.; Methodology, C.L., J.L., J.W., S.X. and Y.S.; Software, C.L.; Validation, J.L., J.W., S.X. and Y.S.; Formal analysis, C.L., J.L. and J.W.; Investigation, C.L. and J.W.; Resources, S.X.; Writing—original draft, C.L.; Writing—review & editing, C.L., J.L., J.W., S.X. and Y.S.; Supervision, J.L.; Project administration, J.L.; Funding acquisition, C.L. and J.L. All authors have read and agreed to the published version of the manuscript.

Funding

This research was funded by [the National Natural Science Foundation of China] grant number [51908148] and [the Foundation Innovation Fund of Guangzhou University] grant number [2021GDJC-M42].

Data Availability Statement

Not applicable.

Acknowledgments

The authors gratefully acknowledge the support of the National Natural Science Foundation of China under Grant 51908148, and the Foundation Innovation Fund of Guangzhou University under Grant No. 2021GDJC-M42.

Conflicts of Interest

The authors declare no conflict of interest.

References

  1. Cui, J.; Hao, H.; Shi, Y. Discussion on the suitability of concrete constitutive models for high-rate response predictions of RC structures. Int. J. Impact Eng. 2017, 106, 202–216. [Google Scholar] [CrossRef]
  2. Hu, Q.; Zhang, Q.; Yuan, M.; Qian, X.; Li, M.; Wu, H.; Shen, X.; Liang, Y. Traceability and failure consequences of natural gas explosion accidents based on key investigation technology. Eng. Fail. Anal. 2022, 139, 106448. [Google Scholar] [CrossRef]
  3. Liu, J.; Li, J.; Fang, J.; Su, Y.; Wu, C. Ultra-high performance concrete targets against high velocity projectile impact–a-state-of-the-art review. Int. J. Impact Eng. 2022, 160, 104080. [Google Scholar] [CrossRef]
  4. Wang, W.; Wei, G.; Yang, J.; Liu, F.; Gao, W. Study on antiexplosion performance of reinforced concrete slabs strengthened with POZD coated steel plate under contact explosion. Eng. Fail. Anal. 2022, 140, 106589. [Google Scholar] [CrossRef]
  5. Xu, Z.-D.; Liu, X.; Xu, W.; Sun, B.; Liu, X.; Xu, D. Analysis on the disaster chain evolution from gas leak to explosion in urban utility tunnels. Eng. Fail. Anal. 2022, 140, 106609. [Google Scholar] [CrossRef]
  6. Li, J.; Wu, C.; Hao, H. Investigation of ultra-high performance concrete slab and normal strength concrete slab under contact explosion. Eng. Struct. 2015, 102, 395–408. [Google Scholar] [CrossRef]
  7. Ning, J.; Yang, S.; Ma, T.; Xu, X. Fragment behavior of concrete slab subjected to blast loading. Eng. Fail. Anal. 2022, 138, 106370. [Google Scholar] [CrossRef]
  8. Shu, Y.; Wang, G.; Lu, W.; Chen, M.; Lv, L.; Chen, Y. Damage characteristics and failure modes of concrete gravity dams subjected to penetration and explosion. Eng. Fail. Anal. 2022, 134, 106030. [Google Scholar] [CrossRef]
  9. Chilvers, J.; Yang, L.; Lin, X.; Zhang, Y.X. Experimental and numerical investigations of hybrid-fibre engineered cementitious composite panels under contact explosions. Eng. Struct. 2022, 266, 114582. [Google Scholar] [CrossRef]
  10. Li, J.; Wu, C.; Hao, H. An experimental and numerical study of reinforced ultra-high performance concrete slabs under blast loads. Mater. Des. 2015, 82, 64–76. [Google Scholar] [CrossRef]
  11. Li, J.; Wu, C.; Hao, H.; Su, Y. Experimental and numerical study on steel wire mesh reinforced concrete slab under contact explosion. Mater. Des. 2017, 116, 77–91. [Google Scholar] [CrossRef]
  12. Yoo, D.-Y.; Banthia, N. Mechanical and structural behaviors of ultra-high-performance fiber-reinforced concrete subjected to impact and blast. Constr. Build. Mater. 2017, 149, 416–431. [Google Scholar] [CrossRef]
  13. Dadsetan, S.; Siad, H.; Lachemi, M.; Sahmaran, M. Construction and demolition waste in geopolymer concrete technology: A review. Mag. Concr. Res. 2019, 71, 1232–1252. [Google Scholar] [CrossRef]
  14. Duxson, P.; Fernández-Jiménez, A.; Provis, J.L.; Lukey, G.C.; Palomo, A.; van Deventer, J.S.J. Geopolymer technology: The current state of the art. J. Mater. Sci. 2007, 42, 2917–2933. [Google Scholar] [CrossRef]
  15. Krishna, R.S.; Mishra, J.; Zribi, M.; Adeniyi, F.; Saha, S.; Baklouti, S.; Shaikh, F.; Gökçe, H. A review on developments of environmentally friendly geopolymer technology. Materialia 2021, 20, 101212. [Google Scholar] [CrossRef]
  16. Amran, Y.H.M.; Alyousef, R.; Alabduljabbar, H.; El-Zeadani, M. Clean production and properties of geopolymer concrete; A review. J. Clean. Prod. 2020, 251, 119679. [Google Scholar] [CrossRef]
  17. Parathi, S.; Nagarajan, P.; Pallikkara, S.A. Ecofriendly geopolymer concrete: A comprehensive review. Clean Technol. Environ. Policy 2021, 23, 1701–1713. [Google Scholar] [CrossRef]
  18. Lao, J.-C.; Xu, L.-Y.; Huang, B.-T.; Dai, J.-G.; Shah, S.P. Strain-hardening ultra-high-performance geopolymer concrete (UHPGC): Matrix design and effect of steel fibers. Compos. Commun. 2022, 30, 101081. [Google Scholar] [CrossRef]
  19. Xu, S.; Yuan, P.; Liu, J.; Pan, Z.; Liu, Z.; Su, Y.; Li, J.; Wu, C. Development and preliminary mix design of ultra-high-performance concrete based on geopolymer. Constr. Build. Mater. 2021, 308, 125110. [Google Scholar] [CrossRef]
  20. Liu, Y.; Zhang, Z.; Shi, C.; Zhu, D.; Li, N.; Deng, Y. Development of ultra-high performance geopolymer concrete (UHPGC): Influence of steel fiber on mechanical properties. Cem. Concr. Compos. 2020, 112, 103670. [Google Scholar] [CrossRef]
  21. Liu, Y.; Shi, C.; Zhang, Z.; Li, N.; Shi, D. Mechanical and fracture properties of ultra-high performance geopolymer concrete: Effects of steel fiber and silica fume. Cem. Concr. Compos. 2020, 112, 103665. [Google Scholar] [CrossRef]
  22. Liu, J.; Peng, Y.; Xu, S.; Yuan, P.; Qu, K.; Yu, X.; Hu, F. Investigation of geopolymer-based ultra-high performance concrete slabs against contact explosions. Constr. Build. Mater. 2022, 315, 125727. [Google Scholar] [CrossRef]
  23. Qaidi, S.M.A.; Atrushi, D.S.; Mohammed, A.S.; Ahmed, H.U.; Faraj, R.H.; Emad, W.; Tayeh, B.; Najm, H. Ultra-high-performance geopolymer concrete: A review. Constr. Build. Mater. 2022, 346, 128495. [Google Scholar] [CrossRef]
  24. Liu, J.; Wu, C.; Li, J.; Liu, Z.; Xu, S.; Liu, K.; Su, Y.; Fang, J.; Chen, G. Projectile impact resistance of fibre-reinforced geopolymer-based ultra-high performance concrete (G-UHPC). Constr. Build. Mater. 2021, 290, 123189. [Google Scholar] [CrossRef]
  25. Li, J.; Wu, C.; Hao, H.; Su, Y.; Li, Z.-X. A study of concrete slabs with steel wire mesh reinforcement under close-in explosive loads. Int. J. Impact Eng. 2017, 110, 242–254. [Google Scholar] [CrossRef]
  26. Li, J.; Wu, C.; Hao, H.; Wang, Z.; Su, Y. Experimental investigation of ultra-high performance concrete slabs under contact explosions. Int. J. Impact Eng. 2016, 93, 62–75. [Google Scholar] [CrossRef] [Green Version]
  27. Li, J.; Wu, C.; Liu, Z.-X. Comparative evaluation of steel wire mesh, steel fibre and high performance polyethylene fibre reinforced concrete slabs in blast tests. Thin-Walled Struct. 2018, 126, 117–126. [Google Scholar] [CrossRef]
  28. Meng, Q.; Wu, C.; Su, Y.; Li, J.; Liu, J.; Pang, J. Experimental and numerical investigation of blast resistant capacity of high performance geopolymer concrete panels. Compos. Part B Eng. 2019, 171, 9–19. [Google Scholar] [CrossRef]
  29. Meng, Q.; Wu, C.; Su, Y.; Li, J.; Liu, J.; Pang, J. A study of steel wire mesh reinforced high performance geopolymer concrete slabs under blast loading. J. Clean. Prod. 2019, 210, 1150–1163. [Google Scholar] [CrossRef]
  30. Liu, J.; Wu, C.; Li, C.; Dong, W.; Su, Y.; Li, J.; Cui, N.; Zeng, F.; Dai, L. Blast testing of high performance geopolymer composite walls reinforced with steel wire mesh and aluminium foam. Constr. Build. Mater. 2019, 197, 533–547. [Google Scholar] [CrossRef]
  31. Liu, J.; Liu, C.; Xu, S.; Li, J.; Fang, J.; Su, Y.; Wu, C. G-UHPC slabs strengthened with high toughness and lightweight energy absorption materials under contact explosions. J. Build. Eng. 2022, 50, 104138. [Google Scholar] [CrossRef]
  32. Hallquist, J.O. LS-DYNA Keyword User’s Manual; Livermore Software Technology Corporation: Livermore, CA, USA, 2007; Volume 970, pp. 299–800. [Google Scholar]
  33. Malvar, L.J.; Crawford, J.E.; Wesevich, J.W.; Simons, D. A plasticity concrete material model for DYNA3D. Int. J. Impact Eng. 1997, 19, 847–873. [Google Scholar] [CrossRef]
  34. Liu, J.; Li, J.; Fang, J.; Liu, K.; Su, Y.; Wu, C. Investigation of ultra-high performance concrete slabs under contact explosions with a calibrated K&C model. Eng. Struct. 2022, 255, 113958. [Google Scholar]
  35. Murray, Y.D. Users Manual for LS-DYNA Concrete Material Model 159; Federal Highway Administration: Washington, DC, USA, 2007.
  36. Suaris, W.; Shah, S.P. Strain-rate effects in fibre-reinforced concrete subjected to impact and impulsive loading. Composites 1982, 13, 153–159. [Google Scholar] [CrossRef]
  37. Guo, W.; Fan, W.; Shao, X.; Shen, D.; Chen, B. Constitutive model of ultra-high-performance fiber-reinforced concrete for low-velocity impact simulations. Compos. Struct. 2018, 185, 307–326. [Google Scholar] [CrossRef]
  38. Saini, D.; Oppong, K.; Shafei, B. Investigation of concrete constitutive models for ultra-high performance fiber-reinforced concrete under low-velocity impact. Int. J. Impact Eng. 2021, 157, 103969. [Google Scholar] [CrossRef]
  39. Wei, J.; Li, J.; Wu, C. An experimental and numerical study of reinforced conventional concrete and ultra-high performance concrete columns under lateral impact loads. Eng. Struct. 2019, 201, 109822. [Google Scholar] [CrossRef]
  40. Rubin, M.B. Simple, convenient isotropic failure surface. J. Eng. Mech. 1991, 117, 348–369. [Google Scholar] [CrossRef]
  41. Jiang, H.; Zhao, J. Calibration of the continuous surface cap model for concrete. Finite Elem. Anal. Des. 2015, 97, 1–19. [Google Scholar] [CrossRef]
  42. Simo, J.C.; Ju, J. Strain-and stress-based continuum damage models—I. Formulation. Int. J. Solids Struct. 1987, 23, 821–840. [Google Scholar] [CrossRef]
  43. Simo, J.; Kennedy, J.; Govindjee, S. Non-smooth multisurface plasticity and viscoplasticity. Loading/unloading conditions and numerical algorithms. Int. J. Numer. Methods Eng. 1988, 26, 2161–2185. [Google Scholar] [CrossRef]
  44. Ranjbar, N.; Zhang, M. Fiber-reinforced geopolymer composites: A review. Cem. Concr. Compos. 2020, 107, 103498. [Google Scholar] [CrossRef]
  45. Chen, W.-F. Plasticity in Reinforced Concrete; J. Ross Publishing: Fort Lauderdale, FL, USA, 2007. [Google Scholar]
  46. Khan, M.Z.N.; Hao, Y.; Hao, H.; Shaikh, F.U.A.; Liu, K. Mechanical properties of ambient cured high-strength plain and hybrid fiber reinforced geopolymer composites from triaxial compressive tests. Constr. Build. Mater. 2018, 185, 338–353. [Google Scholar] [CrossRef]
  47. Haider, G.M.; Sanjayan, J.G.; Ranjith, P.G. Complete triaxial stress–strain curves for geopolymer. Constr. Build. Mater. 2014, 69, 196–202. [Google Scholar] [CrossRef]
  48. Lai, J.; Zhou, J.; Yin, X.; Zheng, X. Dynamic behavior of functional graded cementitious composite under the coupling of high speed penetration and explosion. Compos. Struct. 2021, 274, 114326. [Google Scholar] [CrossRef]
  49. Gebbeken, N.; Greulich, S.; Pietzsch, A. Hugoniot properties for concrete determined by full-scale detonation experiments and flyer-plate-impact tests. Int. J. Impact Eng. 2006, 32, 2017–2031. [Google Scholar] [CrossRef]
  50. Wetzel, A.; Middendorf, B. Influence of silica fume on properties of fresh and hardened ultra-high performance concrete based on alkali-activated slag. Cem. Concr. Compos. 2019, 100, 53–59. [Google Scholar] [CrossRef]
  51. Williams, E.M.; Graham, S.S.; Reed, P.A.; Rushing, T.S. Laboratory Characterization of Cor-Tuf Concrete with and without Steel Fibers; Defense Technical Information Center: Fort Belvoir, VA, USA, 2009.
  52. Xu, S.; Wu, P.; Liu, Z.; Wu, C. Calibration of CSCM model for numerical modeling of UHPCFTWST columns against monotonic lateral loading. Eng. Struct. 2021, 240, 112396. [Google Scholar] [CrossRef]
  53. Li, Z.; Chen, W.; Hao, H.; Khan, M.Z.N.; Pham, T.M. Dynamic compressive properties of novel lightweight ambient-cured EPS geopolymer composite. Constr. Build. Mater. 2021, 273, 122044. [Google Scholar] [CrossRef]
  54. Xiao, S.-H.; Liao, S.-J.; Zhong, G.-Q.; Guo, Y.-C.; Lin, J.-X.; Xie, Z.-H.; Song, Y. Dynamic properties of PVA short fiber reinforced low-calcium fly ash—Slag geopolymer under an SHPB impact load. J. Build. Eng. 2021, 44, 103220. [Google Scholar] [CrossRef]
  55. Ou, Z.; Feng, R.; Mao, T.; Li, N. Influence of mixture design parameters on the static and dynamic compressive properties of slag-based geopolymer concrete. J. Build. Eng. 2022, 53, 104564. [Google Scholar] [CrossRef]
  56. Luo, X.; Xu, J.-Y.; Bai, E.-L.; Li, W. Research on the dynamic compressive test of highly fluidized geopolymer concrete. Constr. Build. Mater. 2013, 48, 166–172. [Google Scholar] [CrossRef]
  57. Feng, K.N.; Ruan, D.; Pan, Z.; Collins, F.; Bai, Y.; Wang, C.M.; Duan, W. Mechanical behavior of geopolymer concrete subjected to high strain rate compressive loadings. Mater. Struct. 2015, 48, 671–681. [Google Scholar] [CrossRef]
  58. Wang, Y.; Zhong, H.; Zhang, M. Experimental study on static and dynamic properties of fly ash-slag based strain hardening geopolymer composites. Cem. Concr. Compos. 2022, 129, 104481. [Google Scholar] [CrossRef]
  59. Khan, M.Z.N.; Hao, Y.; Hao, H.; Shaikh, F.U.A. Experimental evaluation of quasi-static and dynamic compressive properties of ambient-cured high-strength plain and fiber reinforced geopolymer composites. Constr. Build. Mater. 2018, 166, 482–499. [Google Scholar] [CrossRef]
  60. Luo, X.; Xu, J. Dynamic splitting-tensile testing of highly fluidised geopolymer concrete. Mag. Concr. Res. 2013, 65, 837–843. [Google Scholar] [CrossRef]
  61. Khan, M.Z.N.; Hao, Y.; Hao, H.; Shaikh, F.u.A. Mechanical properties and behaviour of high-strength plain and hybrid-fiber reinforced geopolymer composites under dynamic splitting tension. Cem. Concr. Compos. 2019, 104, 103343. [Google Scholar] [CrossRef]
  62. Feng, K.N.; Ruan, D.; Pan, Z.; Collins, F.; Bai, Y.; Wang, C.M.; Duan, W. Effect of strain rate on splitting tensile strength of geopolymer concrete. Mag. Concr. Res. 2014, 66, 825–835. [Google Scholar] [CrossRef]
  63. Menna, C.; Asprone, D.; Forni, D.; Roviello, G.; Ricciotti, L.; Ferone, C.; Bozza, A.; Prota, A.; Cadoni, E. Tensile behaviour of geopolymer-based materials under medium and high strain rates. EPJ Web Conf. 2015, 94, 01034. [Google Scholar] [CrossRef] [Green Version]
  64. Xu, S.; Yuan, P.; Liu, J.; Yu, X.; Hao, Y.; Hu, F.; Su, Y. Experimental and numerical investigation of G-UHPC based novel multi-layer protective slabs under contact explosions. Eng. Fail. Anal. 2022, 142, 106830. [Google Scholar] [CrossRef]
  65. Hao, H.; Hao, Y.; Li, J.; Chen, W. Review of the current practices in blast-resistant analysis and design of concrete structures. Adv. Struct. Eng. 2016, 19, 1193–1223. [Google Scholar] [CrossRef]
  66. Malvar, L.; Crawford, J. Dynamic increase factors for steel reinforcing bars. In Proceedings of the 28th DDESB Seminar, Orlando, FL, USA, 18–20 August 1998. [Google Scholar]
  67. Peng, Y.; Wu, C.; Li, J.; Liu, J.; Liang, X. Mesoscale analysis on ultra-high performance steel fibre reinforced concrete slabs under contact explosions. Compos. Struct. 2019, 228, 111322. [Google Scholar] [CrossRef]
Figure 1. Schematic representation of shear and cap surfaces.
Buildings 12 02010 g001
Figure 2. Triaxial meridian lines (a) compression meridian (b) tension meridian.
Buildings 12 02010 g002
Figure 3. Triaxial compressive test data [46,47] and fitting curve.
Buildings 12 02010 g003
Figure 4. Determination of parameters in compression meridian (a) α (b) β (c) λ (d) θ.
Buildings 12 02010 g004
Figure 5. Determination of cap parameters (a) X0 [51,52] (b) D1 and D2 [52].
Buildings 12 02010 g005
Figure 6. (a) single element test under uniaxial compression (b) effect of GFC and B on the uniaxial compressive stress–strain curve [31].
Buildings 12 02010 g006
Figure 7. (a) four-point bending model (b) effect of GFT and D on the force-displacement curve [24].
Buildings 12 02010 g007
Figure 8. DIF versus strain rate (a) compressive strength [53,54,55,56,57,58,59] (b) tensile strength [60,61,62,63].
Buildings 12 02010 g008
Figure 9. Schematic diagram of slab, TNT explosives and SWM (a) G-UHPC-10SWM under 0.4 kg TNT contact explosion (b) G-UHPC-20SWM under 1.0 kg TNT contact explosion.
Buildings 12 02010 g009aBuildings 12 02010 g009b
Figure 10. Contact explosion test setup [31].
Buildings 12 02010 g010
Figure 11. Finite element models of SWM reinforced G-UHPC slabs under contact explosions (a) G-UHPC-10SWM under 0.4 kg TNT contact explosion (b) G-UHPC-20SWM under 1.0 kg TNT contact explosion.
Buildings 12 02010 g011
Figure 12. Comparison of numerical test results for G-UHPC-10SWM under 0.4 kg TNT contact explosion [64].
Buildings 12 02010 g012
Figure 13. Comparison of numerical and test results for G-UHPC-20SWM under 1.0 kg TNT contact explosion [31].
Buildings 12 02010 g013
Figure 14. Energy evolution of SWM (a) 10-layer SWM in G-UHPC-10SWM under 0.4 kg TNT contact explosion (b) 20-layer SWM in G-UHPC-20SWM under 1.0 kg TNT contact explosion.
Buildings 12 02010 g014
Figure 15. Effect of SWM layer number on the internal energy absorption rate under contact explosions.
Buildings 12 02010 g015
Figure 16. Effect of SWM variables and T/W1/3 on normalised damage d by numerical result (a) N (b) L (c) d.
Buildings 12 02010 g016aBuildings 12 02010 g016b
Figure 17. Effect of SWM variables and T/W1/3 on local damage D by empirical formula fitting (a) N (b) L (c) d.
Buildings 12 02010 g017
Figure 18. Nonlinear fitting plot of internal energy absorption rate for SWM.
Buildings 12 02010 g018
Table 1. The CSC model parameters for G-UHPC.
ParameterValueParameterValueParameterValueParameterValue
RO (kg/m3)2350NPLOT1INCRE0IRATE1
ERODE0RECOV1ITRETRC0G (MPa)1.47 × 10⁴
K (MPa)1.96 × 10⁴ α (MPa)109.2 θ 0.0953 λ (MPa)99.38
β (MPa−1)4.55 × 10⁻³NH1CH0 α 1 1
θ 1 (MPa−1)0 λ 1 0.4226β1 (MPa−1)1.76 × 10⁻³ α 2 1
θ 2 (MPa−1)0 λ 2 0.5β2 (MPa−1)1.76 × 10⁻³R5.266
X 0 (MPa)363.7W0.0445D1 (MPa−1)3.37 × 10⁻³D2 (MPa−2)1.13 × 10⁻⁶
B10GFC (Pa·m)700D5000GFT (Pa·m)40
GFS (Pa·m)40pwrc5pwrt1pmod0
ηoc2.78 × 10−5Nc0.12ηot1.17 × 10−4Nt0.55
overc (Pa)4.00 × 10⁸overt (Pa)1.22 × 10⁸srate1repow1
Table 2. Model and EOS parameters for TNT explosive and air.
MaterialMaterial ModelParameterValue
AirMAT_NULLRO (kg/m3)1.29
EOS_LINEAR_POLYNOMIALC40.4
C50.4
E0 (Pa)2.5 × 10⁵
V01
TNT explosiveMAT_HIGH_EXPLOSIVE_BURNRO (kg/m3)1600
D06900
PCJ2.1 × 1010
EOS_JWLA3.71 × 1011
B03.29 × 109
R14.15
R20.95
ω 0.3
E 7.0 × 10⁹
Table 3. Material model parameters for square steel frame and SWM.
MaterialMaterial ModelParameterValue
SWM MAT_PIECEWISE_LINEAR_PLASTICITYRO (kg/m3)7800
Ec (GPa)200
PR0.3
SIGY (MPa)500
ETAN (GPa)0.77
FAIL0.12
square steel frameMAT_RIGIDRO (kg/m3)7850
Ec (GPa)210
PR0.3
Table 4. Parametric study matrix for SWM reinforced G-UHPC slabs under contact explosions.
CaseW (kg)T (m)NL (mm)d (mm)
W-T-N1-10-1.0W (0.2, 0.4, 1.0, 1.6, 2.4)T (0.1, 0.15, 0.2, 0.25, 0.3)N1 (5, 10, 20, 30, 40)101.0
W-T-N2-L-1.0W (0.2, 0.4, 1.0, 1.6, 2.4)T (0.1, 0.15, 0.2, 0.25, 0.3)N2 (10, 15, 20, 25, 30)L (5, 7, 10, 20, 40)1.0
W-T-N2-10-dW (0.2, 0.4, 1.0, 1.6, 2.4)T (0.1, 0.15, 0.2, 0.25, 0.3)N2 (10, 15, 20, 25, 30)10d (0.5, 0.7, 1, 1.2, 1.4)
Table 5. Local damage classifications of concrete slabs after contact explosions [67].
Damage LevelDamage DescriptionDamage Scheme
MildA very shallow spalling to a third of the slab thickness and no change in the slab thickness to a few noticeable fissuresBuildings 12 02010 i001Buildings 12 02010 i002
Buildings 12 02010 i003Buildings 12 02010 i004
ModerateFrom more than a third to more than two thirds of the slab thickness spallingBuildings 12 02010 i005Buildings 12 02010 i006
SevereFrom just over two third of the slab thickness spall to breachBuildings 12 02010 i007Buildings 12 02010 i008
Publisher’s Note: MDPI stays neutral with regard to jurisdictional claims in published maps and institutional affiliations.

