Article

Experimental Investigation on the Cyclic In-Plane Behavior of GFRP-Reinforced Concrete Shear Walls

1
Department of Civil Engineering, Helwan University, Mataria, Cairo 11795, Egypt
2
Department of Conservation, Cairo University, Cairo 12613, Egypt
*
Author to whom correspondence should be addressed.
Buildings 2022, 12(11), 1948; https://doi.org/10.3390/buildings12111948
Submission received: 25 September 2022 / Revised: 2 November 2022 / Accepted: 5 November 2022 / Published: 10 November 2022
(This article belongs to the Special Issue Assessment and Retrofit of Buildings)

Abstract

:
The current study presents an experimental investigation performed on slender reinforced concrete shear walls, representing a common lateral-load resisting system of mid-rise buildings. The walls were reinforced with steel and glass fiber-reinforced polymer (GFRP) bars and tested up to failure under reversed quasi-static cyclic loading to investigate the capability of GFRP bars in reinforcing RC shear walls under seismic loads. Moreover, the effect of the GFRP reinforcement ratio on the structural response, deformation performance, and failure mode resulting in RC walls, compared with its behavior when reinforced with steel bars, is also investigated. Six full-scale shear walls with an aspect ratio of 3.25 were constructed. The reference wall was entirely reinforced with steel bars. Two specimens were reinforced by hybrid scheme of GFRP–steel bars. The remaining three shear walls were entirely reinforced with GFRP bars. The overall performance of each wall was characterized by investigating the lateral load capacity, hysteretic response, cracks propagation, ductility, and the behavior of energy dissipation. The experimental results showed that GFRP-reinforced concrete walls had an elastic behavior characterized by a stable hysteretic response with recoverable deformation of more than 80% of the ultimate load. However, sudden and brittle failure was attained for the wall with a high GFRP reinforcement ratio. GFRP decreases the displacement ductility of the shear walls by an average of 32.9%, depending on the reinforcement ratio, compared to that reinforced by steel bars. Moreover, lower energy dissipation through inelastic deformation was obtained for the walls reinforced with GFRP bars. Nonetheless, when GFRP bars are combined with steel bars, acceptable levels of dissipated energy are attained compared to the steel-reinforced wall.

1. Introduction

Reinforced concrete (RC) shear walls are one of the most common structural RC elements that provide an efficient lateral bracing and drift control system due to their high in-plane stiffness that offers substantial strength and sufficient deformation capacity. RC shear walls are typically used in the earthquake-resistant design of concrete structures, such as high-rise buildings and safety-related nuclear facilities, to provide cost-effective lateral resistance compared to other lateral resisting systems [1,2,3,4]. The behavior of RC shear walls is initially flexure-dominated up to yielding of steel reinforcement at the most moment-critical zone, by which a transition to brittle shear deformations is made. In flexural failure, plastic hinges are formed at the construction joint between the wall and its foundations. Further increasing of the developed flexural cracks occurs at plastic hinges and is then combined with diagonal cracks; eventually, shear sliding-flexural failure mode occurs [5]. Pinched hysteresis and very low damping ratios are indicators of the abrupt loss of strength and stiffness caused by these resulting stresses. [3,6]. To limit the expected damage during seismic excitations, a high level of strength and sufficient deformation capacity (ductility) of the shear walls are essentially required to ensure that adequate load capacity is maintained during the inelastic response [4,7,8].
One of the major factors that must be considered when designing RC shear walls is the selection of reinforcement. Although conventional steel reinforcement has long been the most common reinforcement for concrete structures, its vulnerability to corrosion is a severe problem resulting in decreased bar strength, increased potential cracking, and accelerated deterioration of concrete; consequently, this affects the overall performance and durability of concrete structures in aggressive environments [9,10,11,12,13,14]. Thus, the use of glass fiber-reinforced polymer (GFRP) bars as a replacement for conventional steel bars is a potential solution to steel corrosion-related problems in concrete. The interest in using alternative nonferromagnetic glass fiber-reinforced polymer (GFRP) bars lies in their corrosion resistance with the high tensile strength to weight ratio, long-term durability, and high fatigue resistance.
In recent decades, much research has focused on the durability of GFRP bars for reinforcing concrete constructions [10,15,16,17,18]. The tensile behavior of GFRP bars embedded in concrete structures was investigated by Chen et al. [16] to predict their long-term behavior. Based on the test results, the degradation of the tensile and bond strength of GFRP bars is stimulated by a raised temperature, increased moisture access to the bar, and alkalinity of the moisture. The bond behavior of GFRP bars was deeply investigated by Kotynia et al. [19]. The study indicated adequate bond behavior to concrete material mostly because of the ribs on the bar surface. The bond behavior is mainly governed by the bar’s nominal diameter and the concrete cover thickness, where the ultimate shear bond stress decreases with bar diameter increases. Additionally, the decrease in the concrete cover causes a decrease in the ultimate bond strength. Recently, Ferdous et al. [20] investigated the tensile fatigue behavior of polyester and vinyl ester-based GFRP laminates under cyclic loading. The results confirmed that the tensile fatigue life of GFRP laminates is mainly affected by various factors including the applied stress ratio, the employed resin type, and environmental conditions. Liu et al. [21] developed a novel technique to improve the compressive strength of GFRP bars by winding additional GFRP layers around the longitudinal fibers. The proposed technique showed promising improvement in the ductility and compressive strength of GFRP bars. The enhanced behavior of GFRP bars was mainly dependent on the winding angle of the applied scheme and the number of winding layers.
Many studies have focused on the use of GFRP bars in beams [22,23,24,25,26], columns [27,28,29], beam–column joints [30], slabs [31,32,33], and slab–column connections [34,35]; however, few studies have focused on their application in shear walls [3,5,36,37,38,39].
Among others, Mohamed et al. [36,40,41] investigated the applicability of GFRP bars in reinforced concrete shear walls with different aspect ratios to attain sufficient strength and drift requirements. The results demonstrated that flexural capabilities could be reached with almost no strength degradation by properly designed and detailed GFRP-reinforced walls. The authors reported that GFRP bars’ significant elastic deformations allowed the walls to sufficiently dissipate seismic energy, compensating for the lack of yield. Moreover, GFRP-reinforced walls’ structural performance is characterized by recoverable and self-centering behavior up to allowable drift limits before moderate damage occurs, which confirms the applicability of GFRP bars in reinforcing concrete lateral resisting systems with a drift ratio that meets the limitation of most building codes. Hassanein et al. [42] tested six full-scale GFRP-reinforced concrete shear walls with various configurations of GFRP stirrups at boundary elements under axial compression and quasi-static cyclic lateral loads. The authors confirmed that the failure of flexural-dominated tested shear walls was controlled mainly by the axial compression capacity of GFRP bars. The failure mechanism was characterized by longitudinal bars fracture on the compression side followed by rupture of the spiral stirrups in the tension side boundary accompanied by concrete crushing. The study also concluded that a greater dissipated amount of accumulated energy is attained by increasing the confinement level in the concrete core as the plastic deformation capacity increases.
More recently, Hosseini et al. [5] examined the effect of spiral transverse GFRP bars on the structural behavior of six full-scale shear walls with aspect ratios α s of 1.08 and 1.75. Two walls were reinforced with conventional steel and four walls with GFRP bars. All the walls were tested under constant precompression and reversed-cyclic lateral loading. The results confirmed that the tested walls’ enhanced shear and displacement capacity were due to transverse spiral bars. In comparison, the steel–RC wall experienced a diagonal tension failure due to alternate yielding of the flexural reinforcement. The GFRP-reinforced walls experienced compressive failure and diagonal tension followed by compression-flexural failure mode, while the failure mode of GFRP-reinforced walls with transverse spiral bars were characterized by the rupture of longitudinal bars followed by flexural tensile failure. The steel-reinforced shear wall showed higher energy dissipation than shear walls reinforced with GFRP bars. Moreover, GFRP bars decreased the displacement ductility of the tested walls compared to the steel-reinforced walls. Another study by Shabana et al. [3] investigated the effect of aspect ratios α s of 1.14 and 0.68 and web reinforcement amount on the lateral cyclic load behavior of six large-scale squat shear walls reinforced with GFRP bars and spirals (1400 mm length, 150 mm thickness, and either 1600 mm or 950 mm height). The findings revealed that the effectiveness of web reinforcements in resisting shear varies with the wall aspect ratio, as the higher aspect ratio and web reinforcement amount decrease the contribution of shear deformations. A substantial decrease in the formed shear crack widths was attained by increasing the horizontal and vertical web reinforcement amounts.
Unlike conventional steel reinforcement, the GFRP-reinforced concrete walls experienced linear elastic behavior with no ductile phase preceding their brittle rupture. Despite the preferable non-magnetic properties, high tensile strength, and excellent corrosion resistance of GFRP bars, their elastic-linear stress–strain behavior raises concern about their applicability as primary reinforcement in earthquake-resistant structures where inelastic deformation is required to dissipate seismic energy. Due to the elastic behavior of GFRP bars, ensuring significant plastic deformations becomes challenging. Such linear behavior increases the vulnerability of the concrete elements to sudden and brittle failure. Consequently, further experimental investigations are needed to understand their response aspects adequately. In the present research, the overall performance of GFRP-RC cantilever shear walls is examined under cyclic loading. Moreover, a hybrid steel–GFRP reinforcement scheme was proposed and tested to thoroughly investigate the capability of this system for enhancing the self-centering capacity of concrete shear walls while maintaining their ductility and energy dissipation capability. The main objectives are to:
  • Better understand the failure mechanisms of GFRP-RC shear walls by evaluating their behavior and response under in-plane cyclic loads.
  • Evaluate the viability of GFRP-reinforced walls to achieve reasonable strength, flexural/shear capacity, and deformability requirements of drift and energy dissipation that are substantially required in the concrete lateral resisting system.
  • Investigate the effect of using hybrid GFRP–steel reinforcement on the structural performance of shear walls compared to conventional steel-reinforced shear walls.

2. Research Significance

In this work, the behavior of RC shear walls reinforced by GFRP bars and hybrid GFRP–steel bars scheme is studied under in-plane lateral load. The study reports pseudo-static, reversed-cyclic load tests of six full-scale shear walls reinforced by steel and GFRP with an aspect ratio of 3.25, which is common in mid-rise buildings. The variables considered in this research are the type of reinforcement (conventional steel and GFRP bars) and the reinforcement ratio to assess the effect of vertical reinforcement distinct properties and ratio on the ductile capabilities of RC shear walls. The major objective of this study is to investigate the capability of GFRP bars in reinforcing lateral resisting concrete shear walls, either in combination with conventional steel bars or as a major reinforcement, thus eliminating the steel corrosion problem and consequently increasing the safety margins of RC structures and reducing their maintenance cost. The overall performance of the tested walls was characterized by investigating the lateral load capacity, cracking patterns, hysteretic response, and the behavior of energy dissipation.
Salient test results are presented and discussed to assess the validity of GFRP-reinforced walls to achieve the reasonable strength, flexural/shear capacity, and deformability requirements of drift and energy dissipation that are substantially required in the concrete lateral resisting system. An in-depth analysis of the effects of reinforcement ratio on the strength and drift capacity of the tested walls occurs through investigating specific parameters such as residual deformation, energy dissipation, stiffness degradation, and ductility indices. These obtained data provide essential information on the seismic performance of GFRP-RC shear walls to researchers, designers, and code committee members. The data are also vital for developing further reliable predictions of the structural performance under in-plane flexural and nonlinear shear effects, as well as supporting the preliminary design approaches in building codes for determining the ductility, drift capacity, and allowable strength of GFRP-RC shear walls to provide acceptable seismic performance in resisting seismic loads.

3. Experimental Program

The tested walls included one reference steel-reinforced specimen (SW1), two specimens reinforced by a combination of GFRP and steel bars (SGW1 and SGW2), and three specimens totally reinforced with GFRP bars with different reinforcement ratios (GW1, GW2, and GW3). The minimum thickness and reinforcement details were designed according to ECP 203 [43] and ACI 318 [44] for the steel-reinforced wall and ECP 208 and ACI 440 [12,14] for the GFRP-reinforced walls. The walls were adequately reinforced to ensure flexural domination and to prevent sliding shear and anchorage failures. The following sections highlight the cross-section and reinforcement details of the specimens, material properties, construction, and instrumentation.

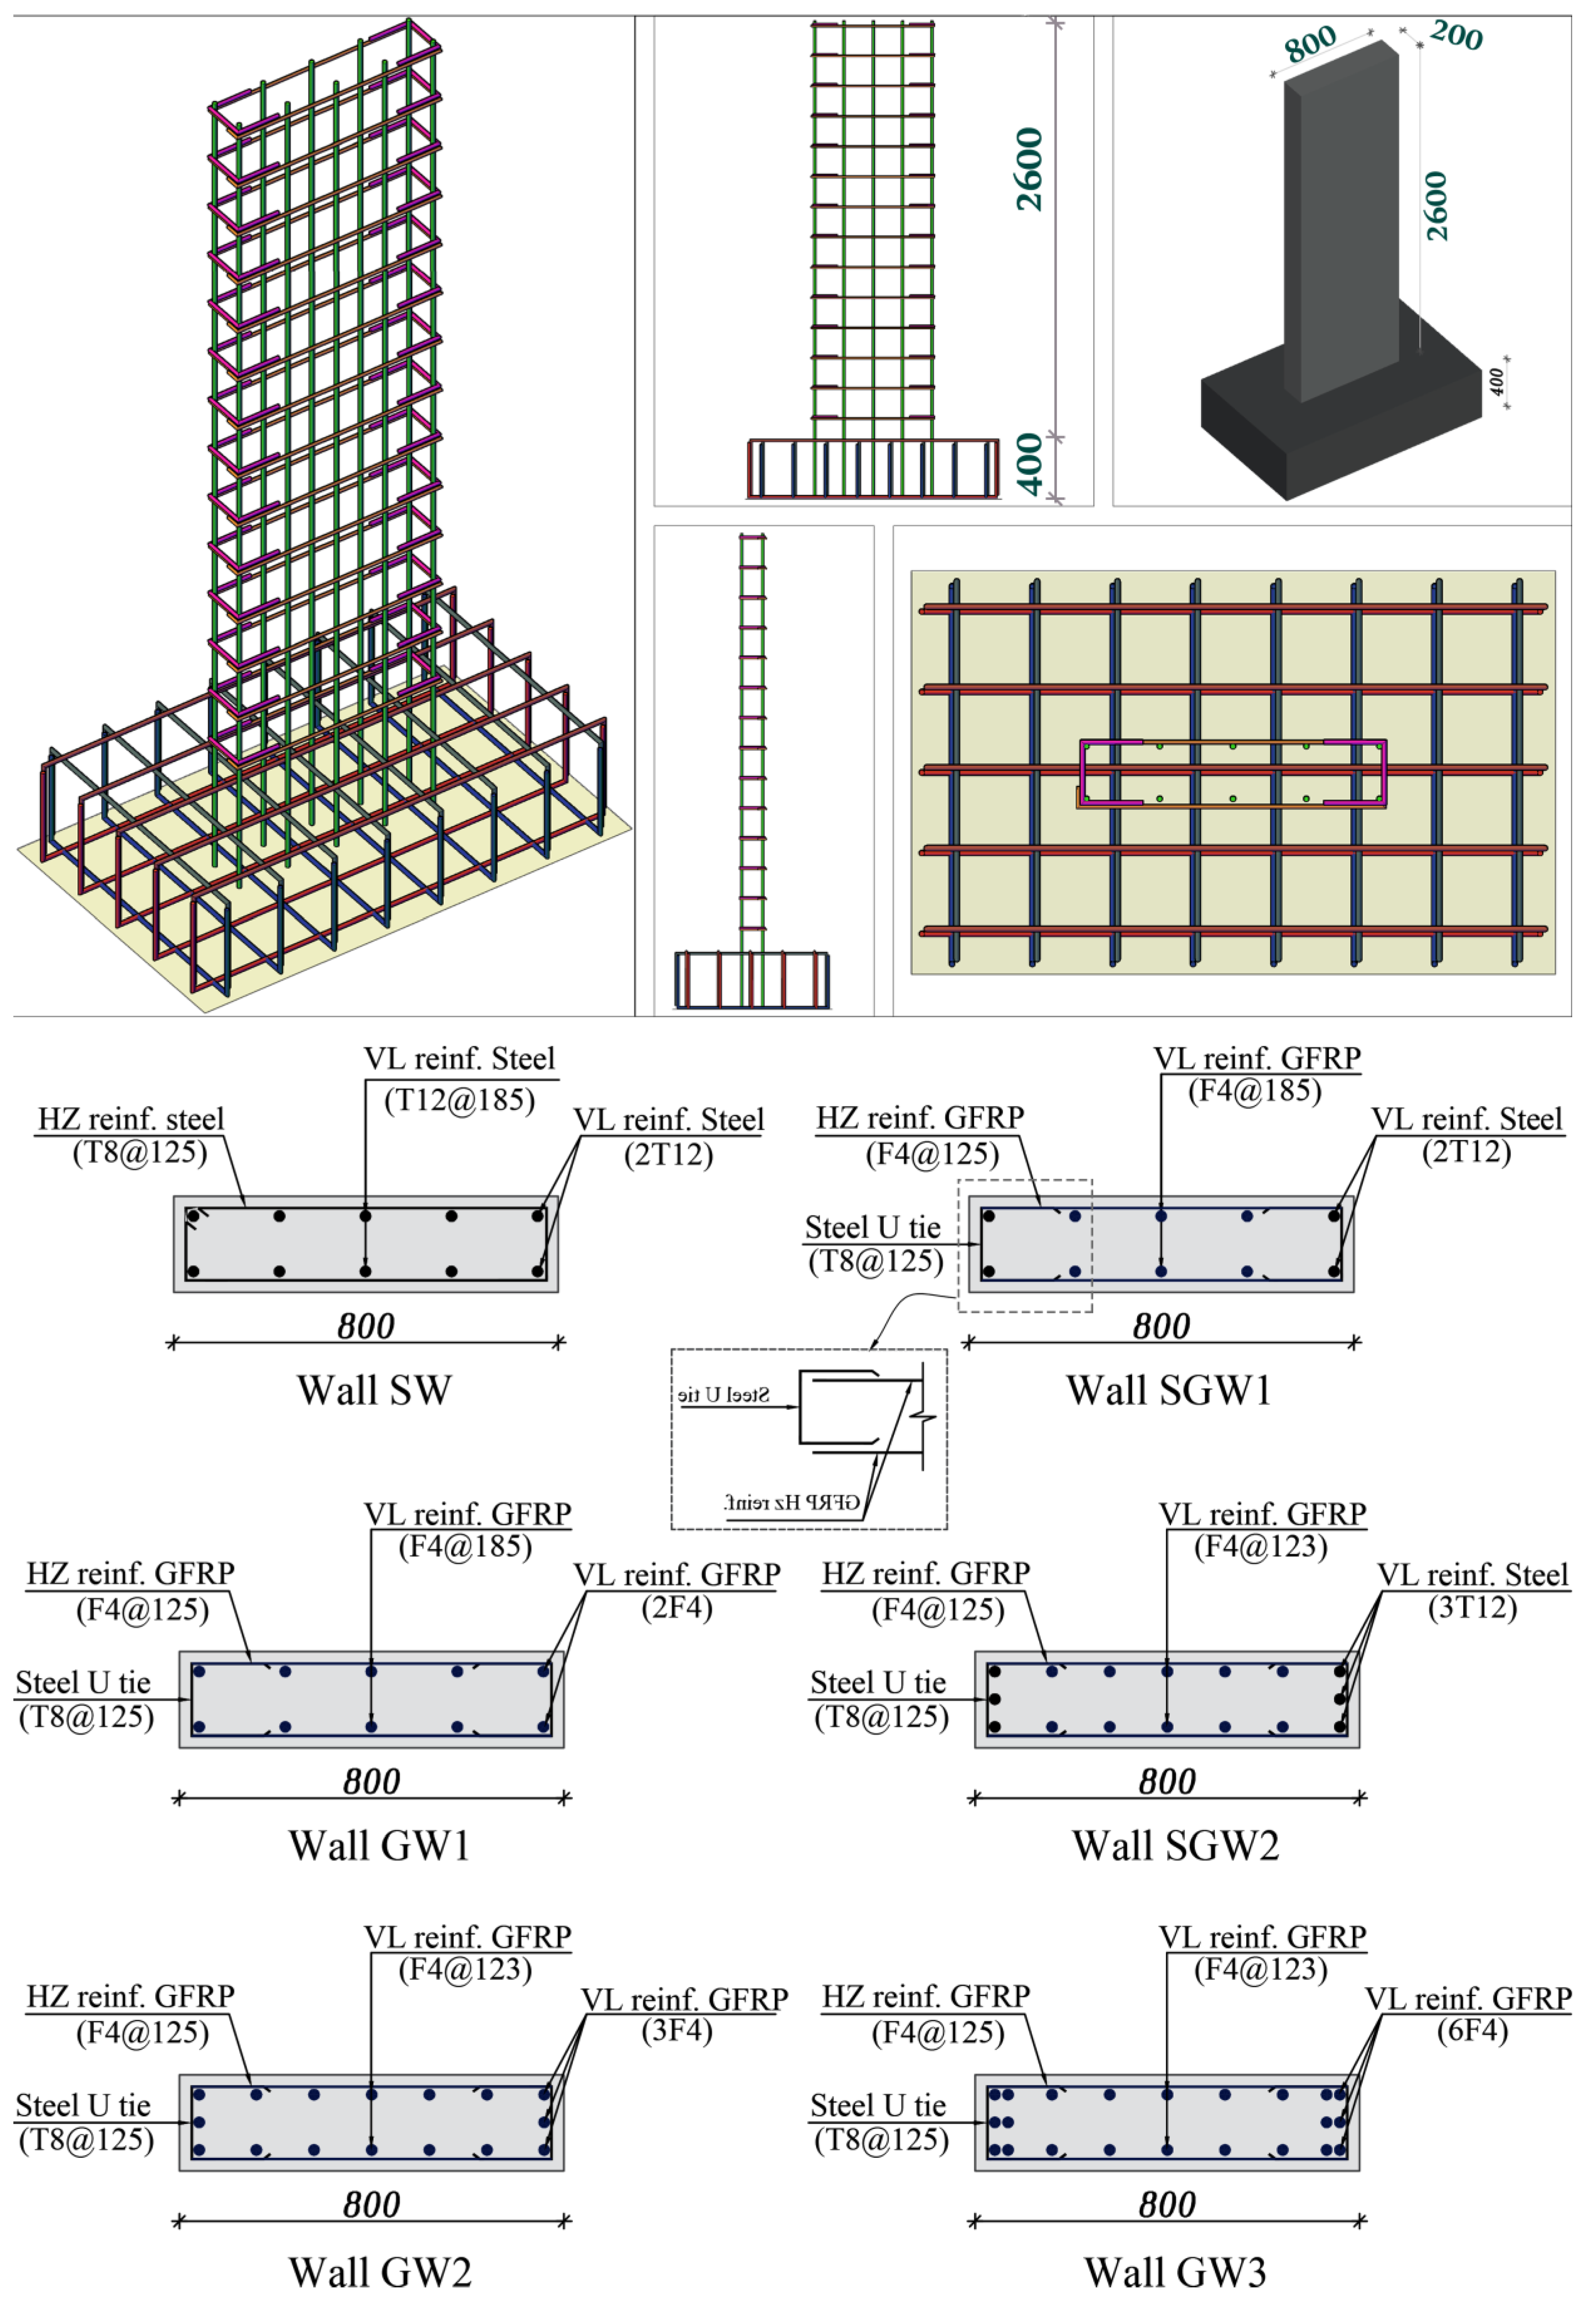
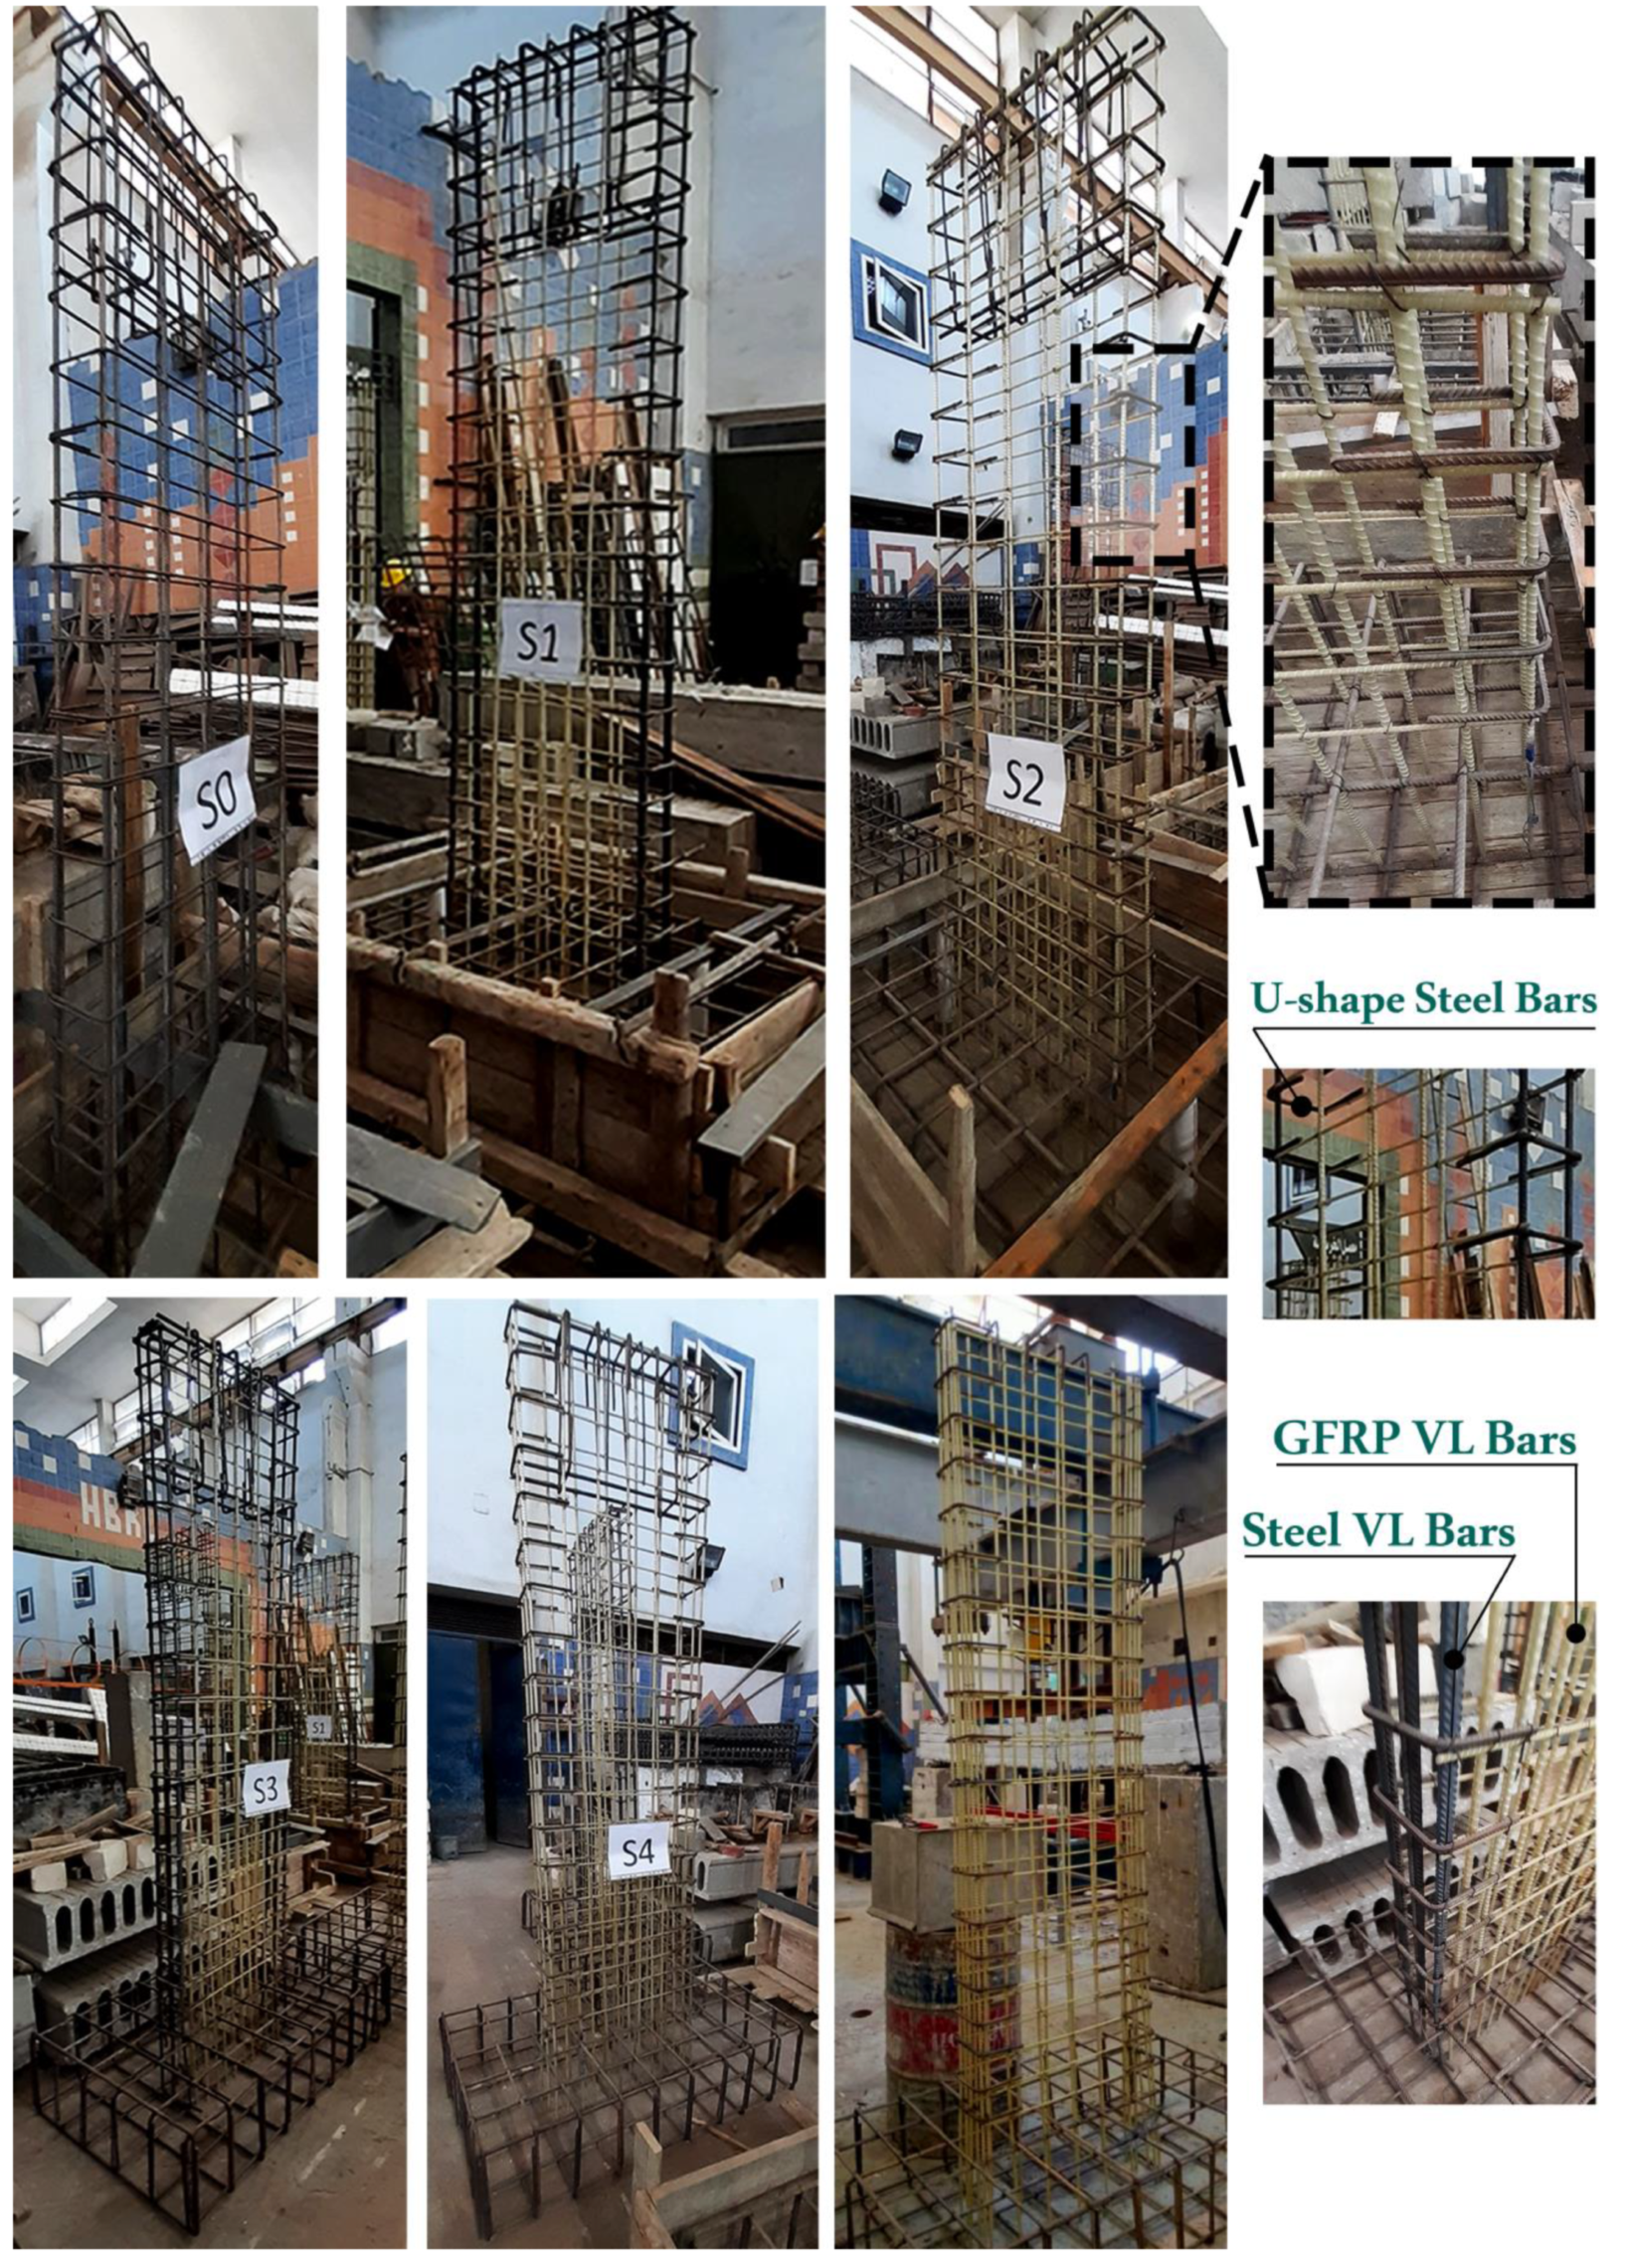
3.1. Details and Design of Specimens

The tested specimens, having an aspect ratio of 3.25, depict a single medium-rise shear wall model that meets the particular seismic requirements defined in [44] for the seismic-force resisting systems (SFRSs). The six full-scaled RC walls were constructed with the same dimensions of 2600 mm height h w , 200mm thickness b w , and 800mm length l w to allow for direct comparison of their displacement and ductility capabilities. Each wall was integrated with an RC foundation with a length of 1600 mm, a width of 1000 mm, and a depth of 400 mm, and was anchored to the laboratory rigid floor. The RC footing was considered to act as an anchoring length for the vertical bars of the wall, attaching the specimen to the rigid lab floor and simulating a rigid foundation case for the tested walls. To minimize any deformations in the base, prevent premature collapse, and avoid excessive cracking owing to base moments, the concrete footing was heavily reinforced with deformed steel bars of 22M Grade 60.
Two layers of vertical reinforcements were provided for all walls to limit the potential out-of-plane displacement and increase the walls’ stability when they were under inelastic strains [45,46]. Figure 1 shows the tested shear walls’ concrete dimensions and reinforcement details.
The walls were designed and reinforced according to the ECP [14,43] and ACI [12,44] provisions where sufficient horizontal reinforcement was provided to withstand the resulting shear force associated with developing the probable moment resistance of the tested walls [36]. As such, the horizontal steel reinforcement ratio ρ s , h z of the reference wall (SW1) was 0.4%, with two layers of horizontal reinforcement comprising 8mm steel bars A b = 50.3   mm 2 spaced at 125 mm. The corresponding horizontal GFRP reinforcement ratio for the remaining walls ρ f , h z was 1.01% and consisted of two layers of horizontal reinforcement of No. 4 GFRP bars d b = 12.7   mm   ,   A f = 126.7   mm 2 spaced at 125 mm, as listed in Table 1.
The reference wall (SW1) had a vertical steel reinforcement ratio ρ s , V l of 0.71%, with two layers of vertical and horizontal web reinforcement comprising 12mm steel bars A b = 113.1   mm 2 spaced at 185 mm. The vertical reinforcement of the wall was bent into the foundation and extended 250 mm from each side of the wall. With the anticipated increase in the load capacity of walls SGW1 and SGW2 due to the increased flexural reinforcement ratios, vertical steel reinforcement ratios were 0.28% and 0.42%, respectively, and the GFRP reinforcement ratios ρ f , V l were 0.48% and 0.79% for SGW1 and SGW2 walls, respectively. For the other three walls, the vertical GFRP reinforcement ratios were 0.79%, 1.27 %, and 1.74%, respectively. For controlling the shear crack widths, the reinforcement ratios exceeded the recommended 0.25% minimum ratio of ECP [43] and ACI [44].

3.2. Materials Characteristics

3.2.1. Reinforcement
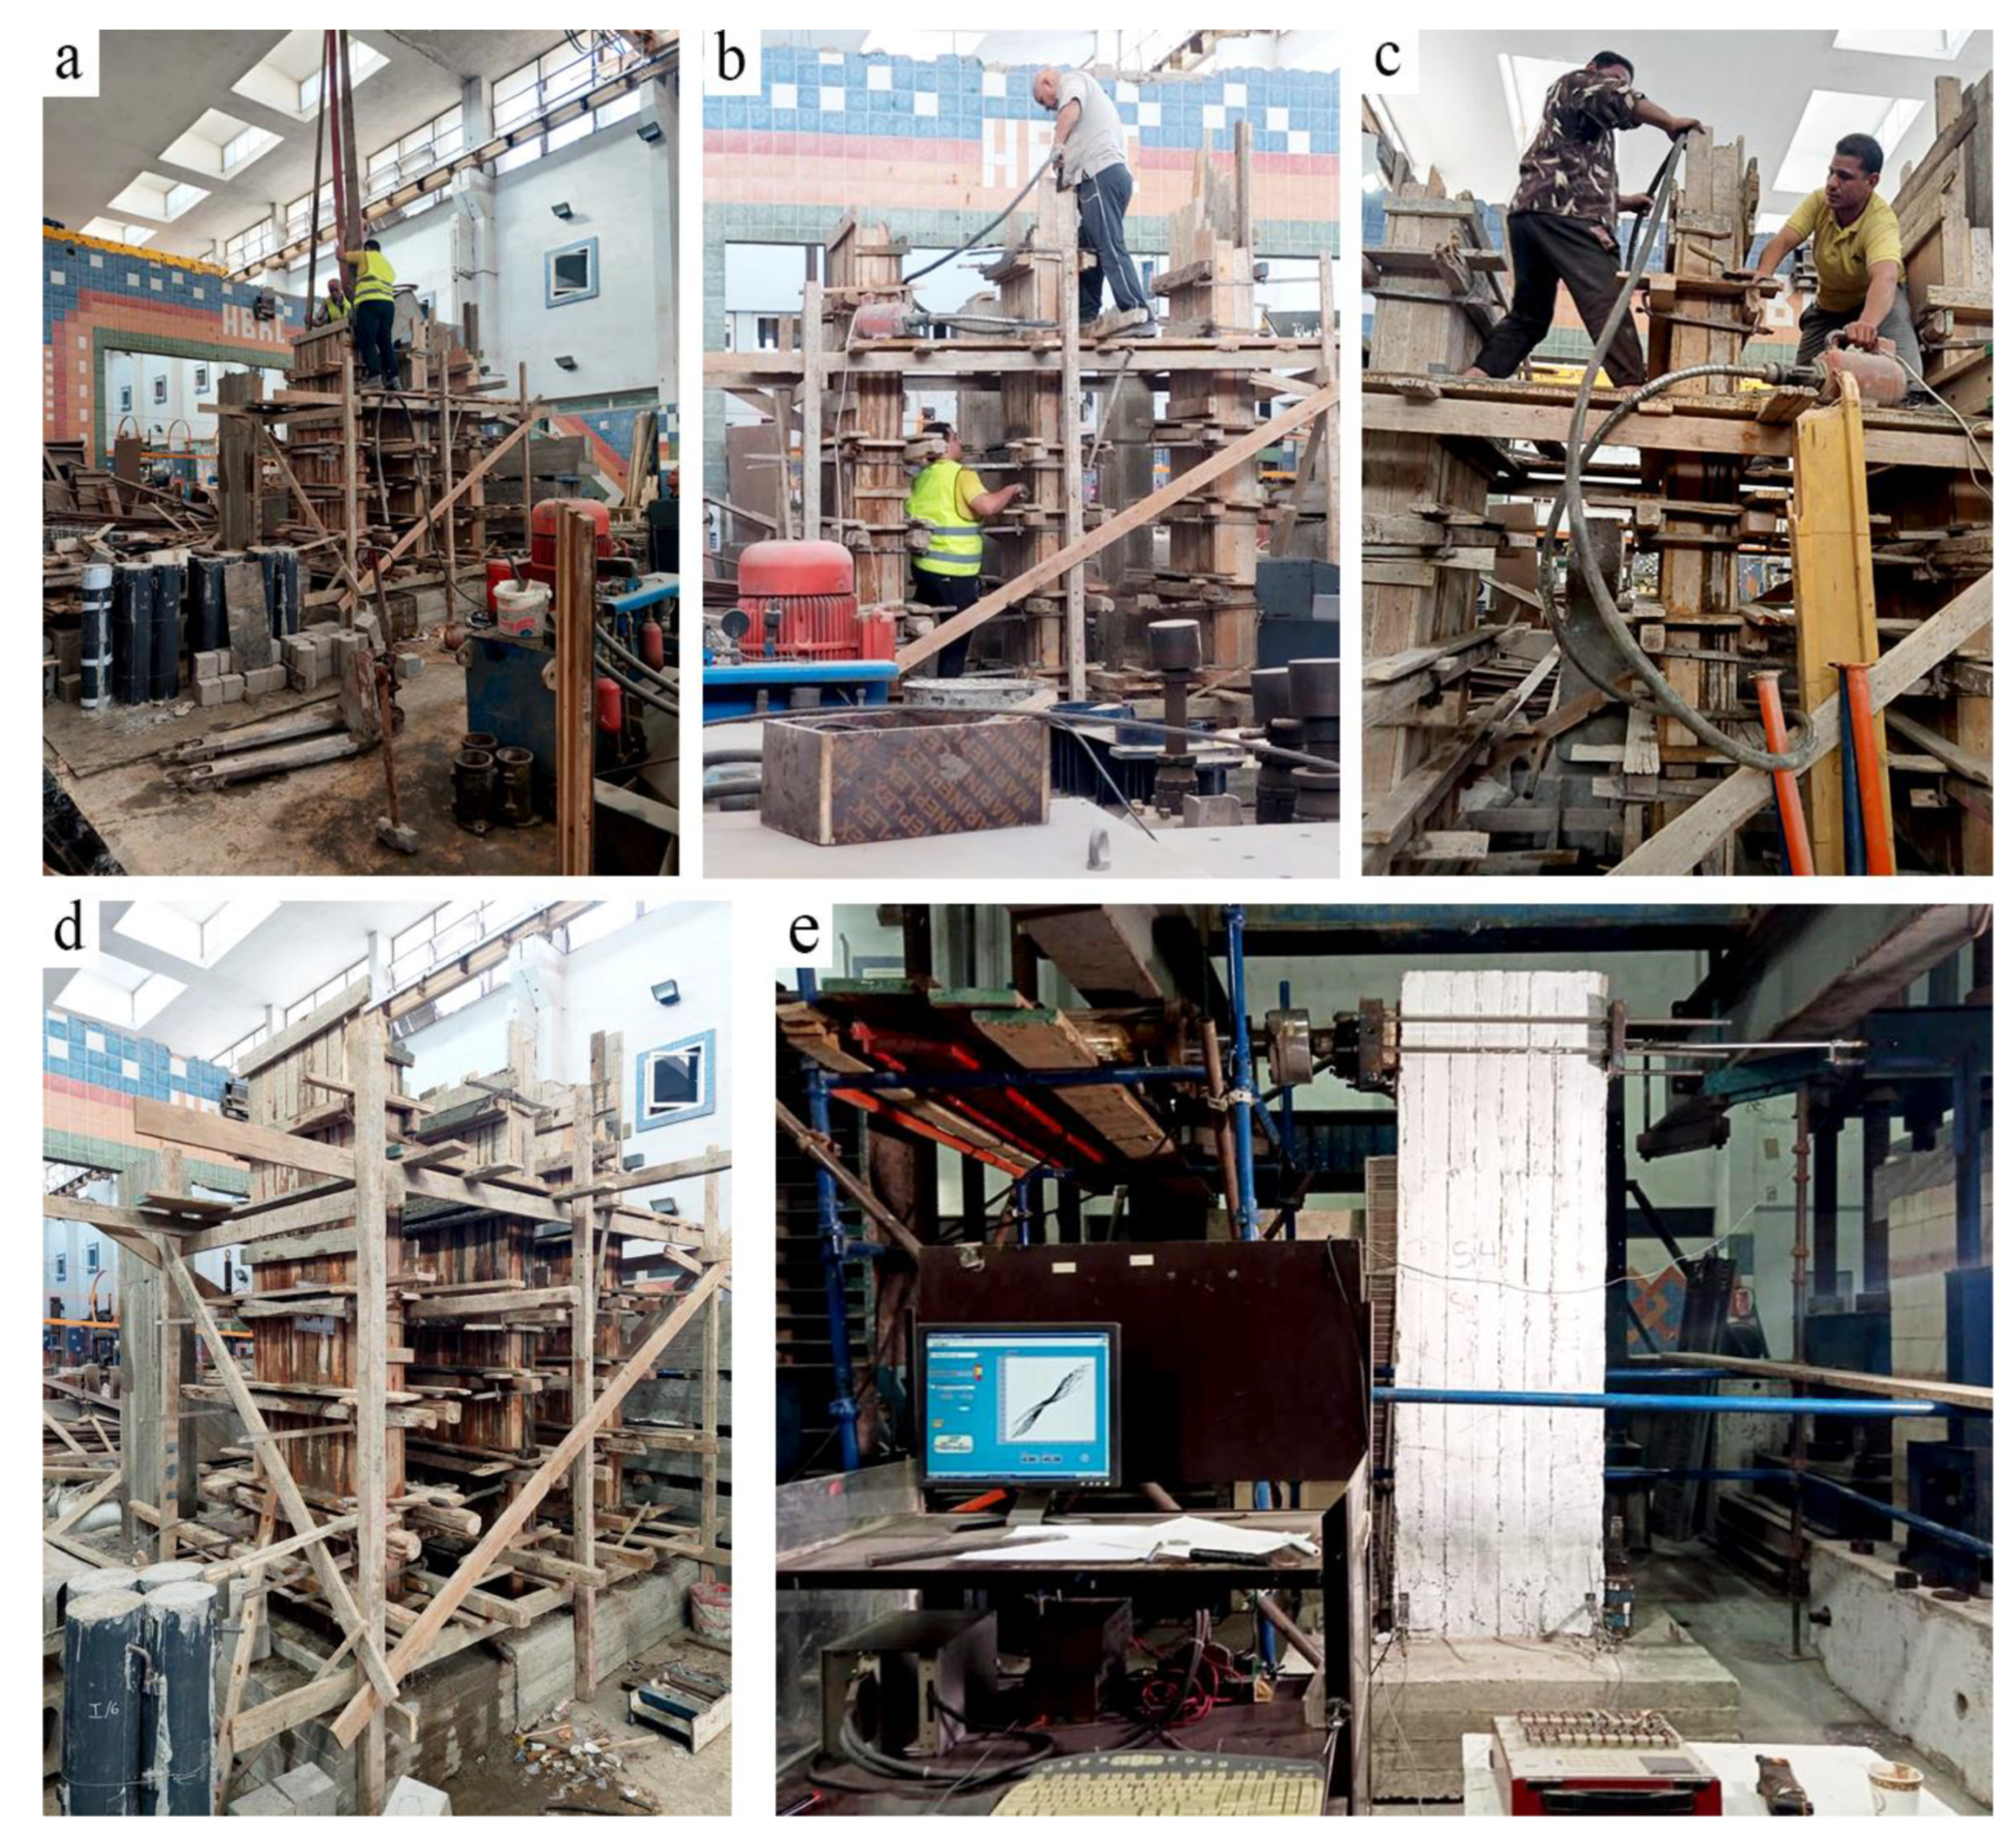
For vertical reinforcement, 12 mm Grade 600 steel bars ( f y = 400   MPa , f u = 600   MPa , E s = 200   GPa , A b = 113   mm 2 ) were used. Moreover, 8 mm Grade 350 steel bars were used for horizontal reinforcement ( f y = 240   MPa , f u = 3500   MPa , E s = 200   GPa , A b = 500   mm 2 ).
GFRP sand-coated straight reinforcing bars of high modulus were used to reinforce the shear wall specimens. The horizontal reinforcement of straight #4 GFRP bars f f u = 1392   MPa ,   E f = 69.6   GPa ,   ε f u = 2 % ,   A f = 126.7   mm 2 was spaced at 125 mm. U-shaped steel bars of 8mm diameter were used at both ends of the walls to avoid the bent proportion of GFRP bars (Figure 2). The longitudinal reinforcement in the web of #4 GFRP bars was spaced at 185 mm for walls SGW1 and GW1, and 123 mm for walls SGW2, GW2, and GW3. Figure 2 shows a photographic view of the steel and GFRP assembled cages of the tested walls. The mechanical properties of GFRP reinforcement are listed in Table 2. The mechanical properties of the used GFRP bars provided by the manufacturer were validated in accordance with the test method of ASTM-D7205 [47].

3.2.2. Concrete

The concrete used in all specimens was casted with normal-weight, ready-mixed concrete with a target 28-day nominal compressive strength of f c ' = 30 MPa. At least three concrete cylinders with 150 mm diameter and 300 mm height were prepared from each pour and tested under compression following [48]. Table 2 depicts the individual concrete strengths based on the mean values from the concrete cylinders tested one day before testing each shear wall.
An average concrete tensile strength of 0.6 f c u = 3.25   MPa and modulus of elasticity of 4400 f c u = 24 , 100   MPa were adopted in accordance with [43]. Using the same concrete grade for all tested walls was planned to facilitate comparing the obtained results from each wall.

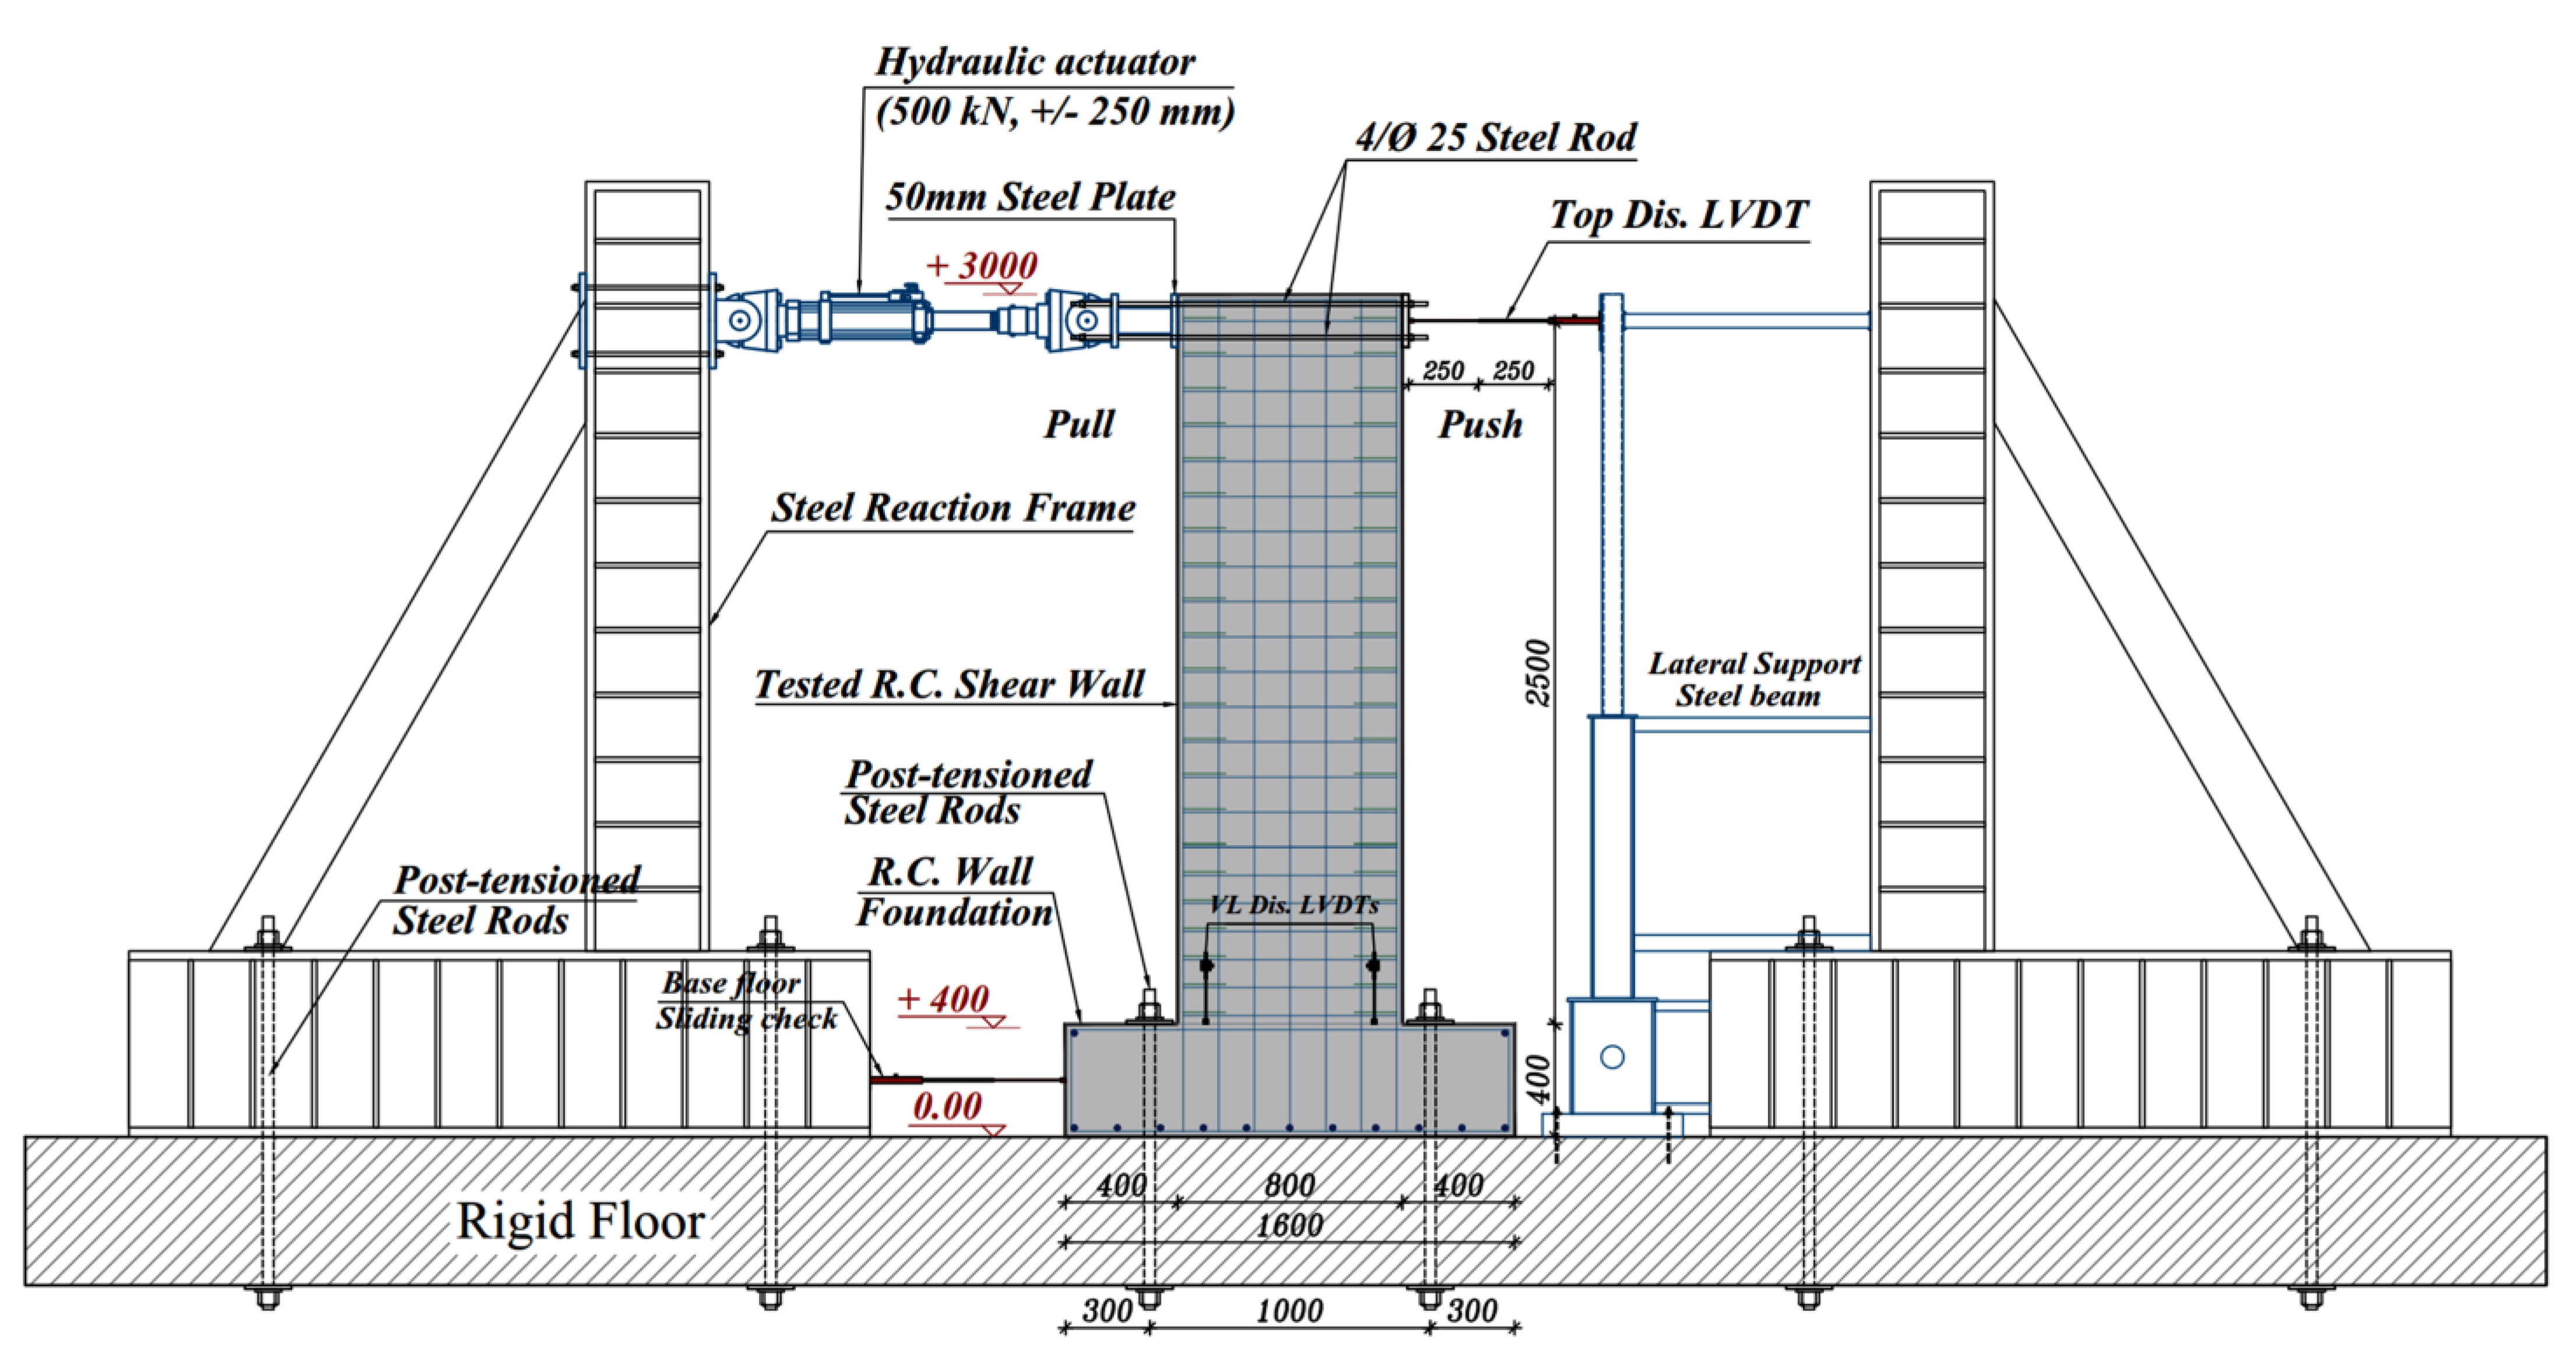
3.3. Test Setup and Procedure

The wall specimens were positioned between two strong reaction frames and tested in an upright position to reproduce real shear wall conditions. Lateral cyclic loading in two directions was applied using a displacement-controlled hydraulic actuator with a total stroke of ± 250   mm and a maximum capacity of ± 500   kN (pushing/pulling), and which was anchored to a strong reaction frame. Two steel plates 200 × 200 × 30   mm and four prestressed steel rods were connected to the top height of the wall and coincided with the hydraulic actuator to uniformly transfer the simulated lateral earthquake loading on the wall. Before applying loads, the RC base was rigidly mounted to the rigid laboratory floor by four 65 mm post-tensioned high-strength steel tiedown rods through four ducts in the corners of the footing to prevent uplifting and horizontal sliding during lateral load application. The wall construction and test setup designed to simulate the reversed cyclic loading are shown in Figure 3 and Figure 4.

3.3.1. Instrumentation

To record critical response quantities (loads, strains, displacement, and rotation) in each wall, different internal and external instrumentations were used. Linear variable differential transformers (LVDTs) were used for measuring top lateral displacements, axial deformations, concrete strain, and base sliding, as shown in Figure 3. The strain in the reinforcing bars was measured using electrical-resistance strain gauges attached to the surface of the four-corner outermost vertical reinforcement bars at 100 mm above the interface between the wall and the foundation. The top lateral displacement was measured with one LVDT horizontally mounted, coinciding with the hydraulic actuator, as shown in Figure 3. One LVDT was used to check the base sliding (if any).
Vertical displacements at the wall boundaries were measured with two LVDTs positioned at the base of each wall near the edges to determine the concrete strain and curvature at different load levels. In both loading directions, the crack formation was recorded and manually marked. Furthermore, an automatic data-acquisition system was used to record the obtained LVDTs and load-cell readings.

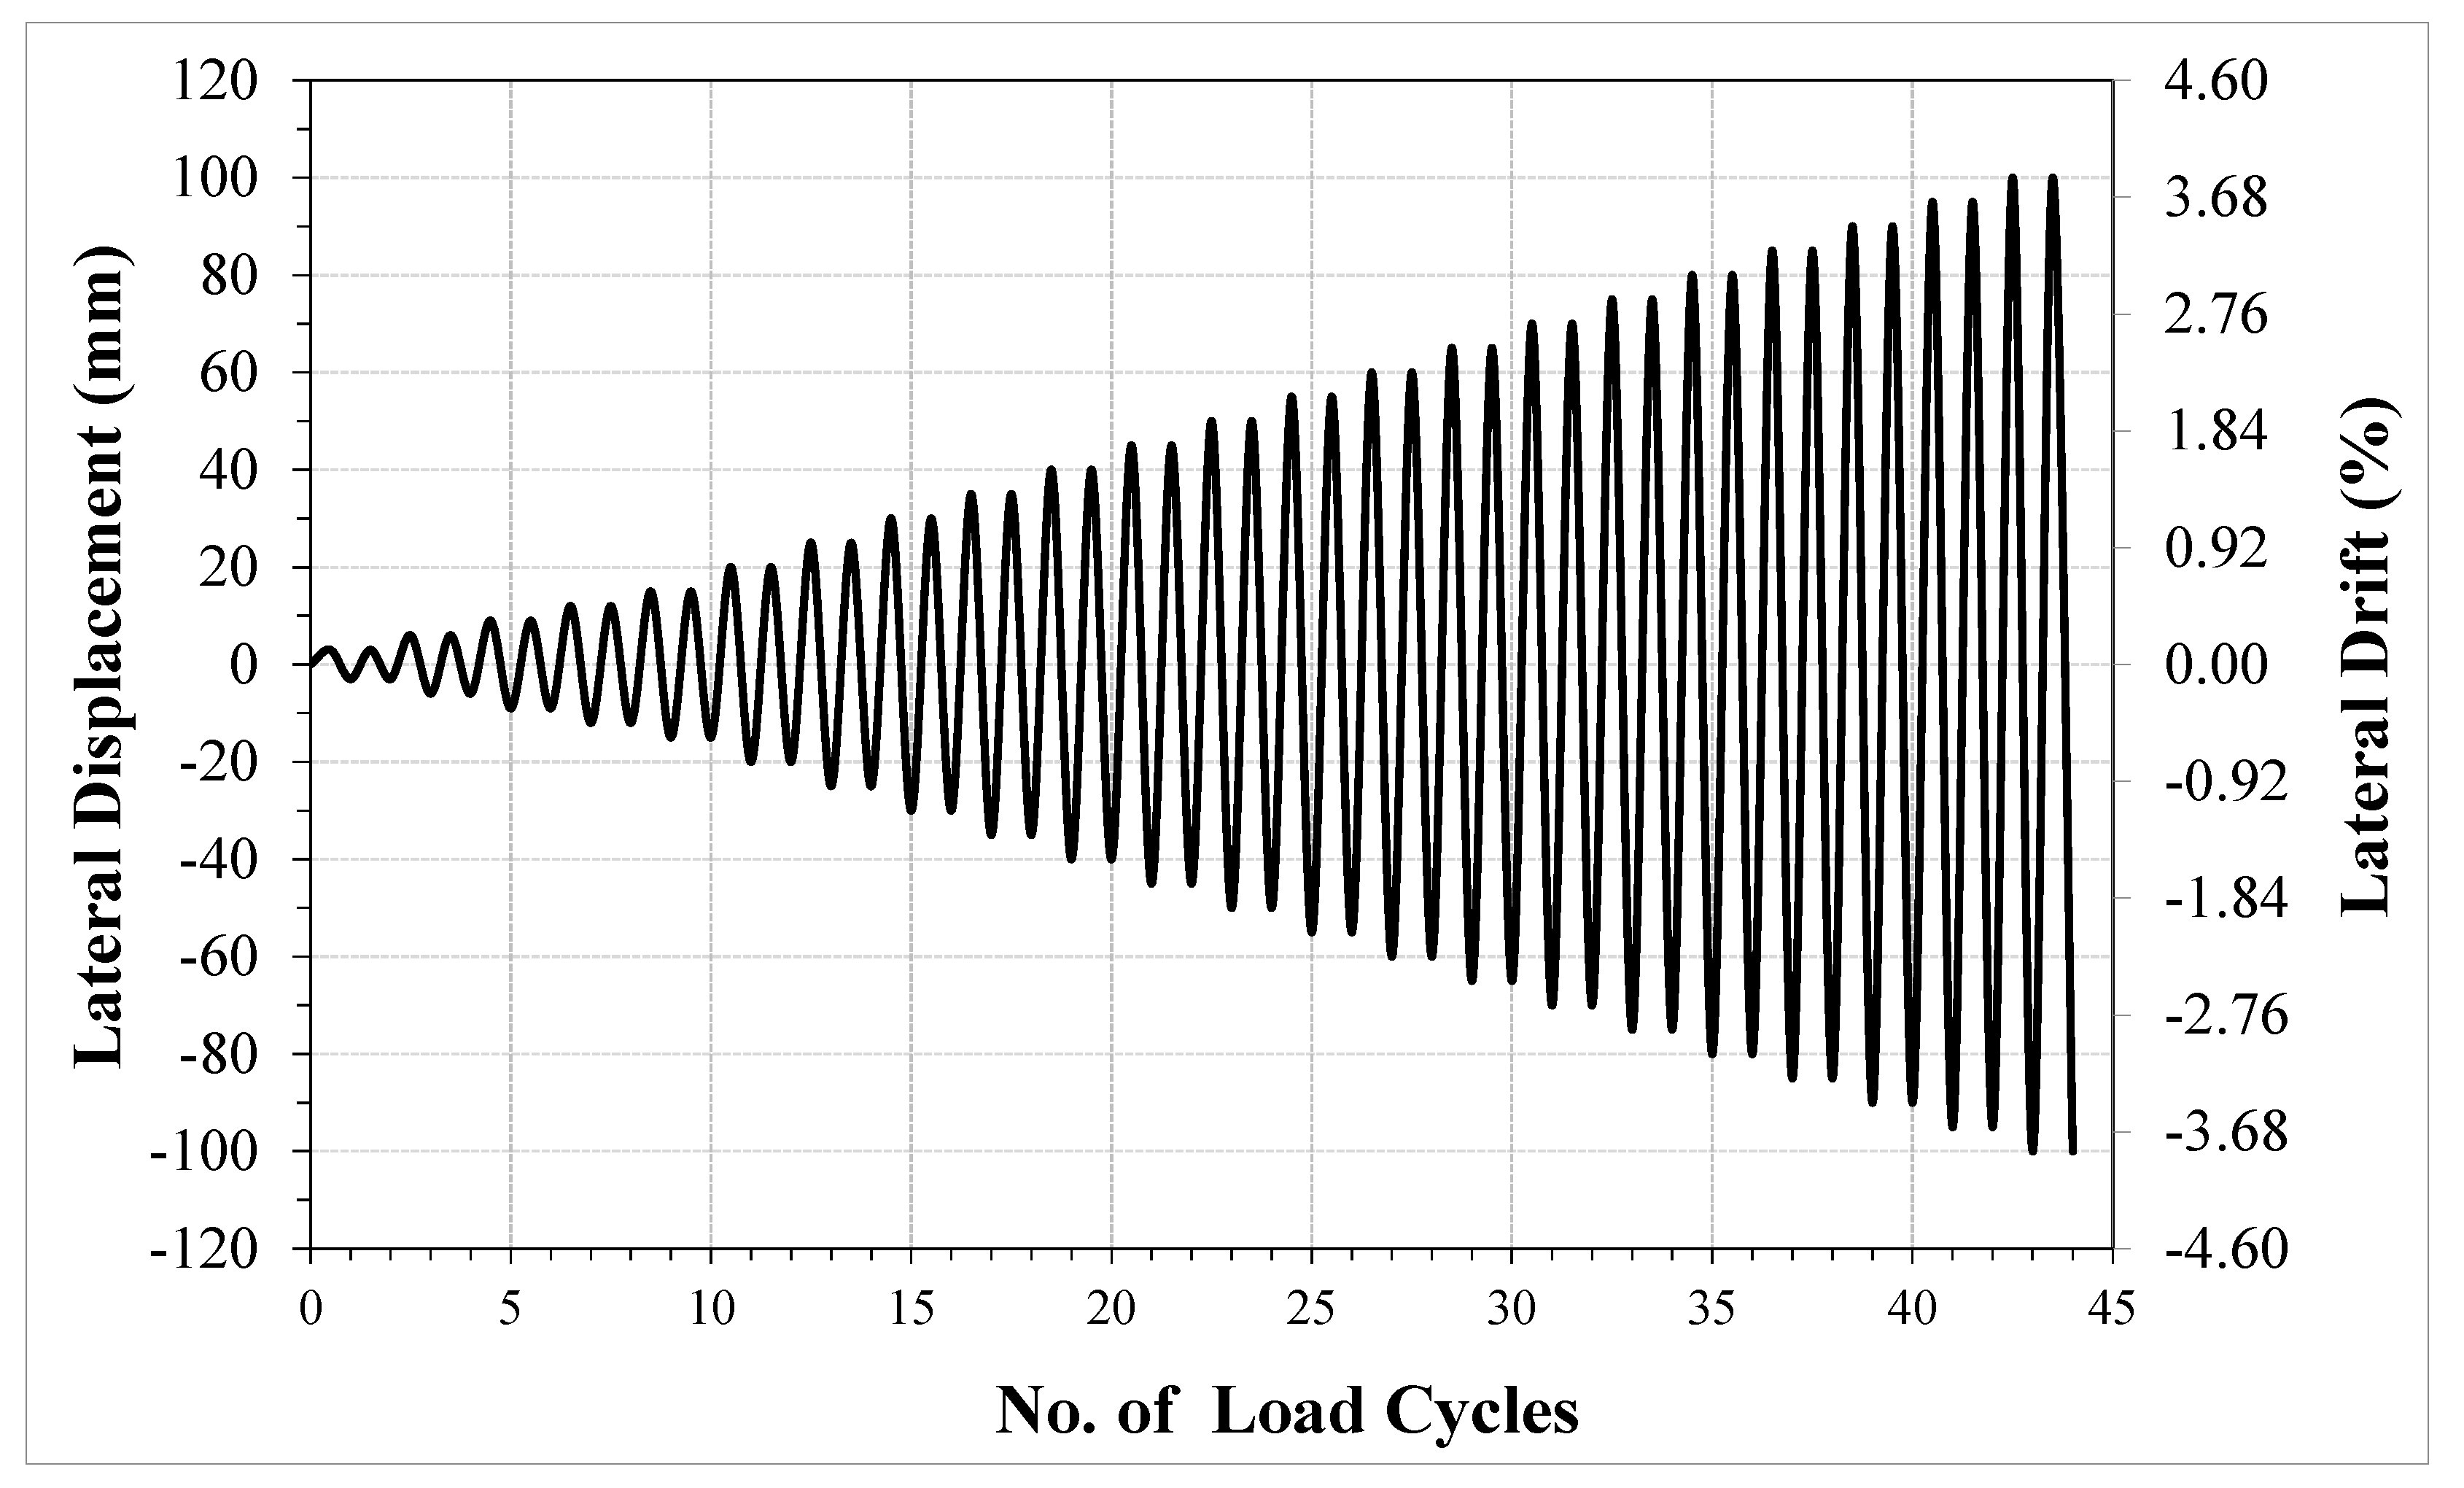
3.3.2. Loading Protocol

A typical procedure of reversed quasi-static lateral cyclic loading was applied to the tested walls until failure without externally applied axial load. As the loading protocol was not a test variable, all walls were tested under the same loading history. Figure 5 illustrates the sequence of the applied displacement protocol. The imposed lateral loading protocol comprised two fully reversed lateral drift cycles applied at gradually increasing drift levels, as per FEMA 461-07 [49]. The drift levels were initially increased with ± 0.05 % increments up to ± 0.15 % drift level, then with ± 0.2 % increments up to ± 1.95 % drift, and finally increments of ± 0.30 % were applied up to failure. The initial drift levels (up to 0.15%) were conservatively designated to be lower than the level demanded to induce cracking in the specimens.

3.4. Theoretical Prediction of Strength Capacity

Plane sectional analysis was employed for the prediction of the flexure strength Q f in accordance with [12,14,43,44] provisions, assuming the concrete compressive strain ε c u limit is equal to 0.003. Actual material properties, along with internal force equilibrium (Equations (1) and (2)) and strain compatibility relationship (Equation (3)), formed the bases for the utilized plane-sectional analysis [50]; consequently, the flexural strength of the RC wall was determined.
C c + 1 n A s i   f s i = P i
M i = C c c a 2 + 1 n A s i   f s i c X i + P i t 2 c
ε s i = ε c u c X i c
where C c is the compressive force due to concrete, A s i denotes the vertical reinforcement cross-sectional area, f s i represents the tensile or compressive stresses of the reinforcements, and   P i is the external applied axial load (herein, P i = 0 , consequently, C c + 1 n A s i   f s i = 0 ). M i is the sum of moments around the centroid, c is the distance from the compression toe to the neutral axis, a denotes the depth of the equivalent rectangular stress block, X i represents the distance from the vertical reinforcement at point n to the end of the compression toe, and ε s i is the reinforcement strain.
The theoretical shear capacity Q r was determined using sectional shear-analysis equations as the sum of the concrete shear strength and the horizontal web reinforcement shear strength, as shown in Equation (4).
Q r = Q c + Q f
According to [12], the values of Q c and Q f are obtained from Equation (5).
Q c = 2 5 f c ' b w k d
where f c ' is the specified compressive strength of concrete, b w denotes the thickness of the web of the wall, d is the distance from extreme compression to centroid of tension reinforcement, and   k is the ratio of depth of neutral axis to reinforcement depth, which can be calculated from Equation (6).
k = 2 ρ f n f + ρ f n f 2 ρ f n f
where n f indicates the ratio of modulus of elasticity of FRP bars to modulus of elasticity of concrete E f E c and ρ f is the FRP reinforcement ratio A f b w d . The shear contribution of FRP stirrups is obtained from Equation (7).
Q f = A f v f f v d s
where A f v denotes the amount of FRP shear reinforcement within spacing s , and f f v represents the tensile strength of FRP.
According to [14] the shear strength of the concrete q c u f and the FRP reinforcement q f u are obtained from Equations (8) and (9), respectively.
q c u f = 0.24 f c u γ c μ f E f μ s E s
q f u = A f q f f q γ f b · s
where f c u denotes the ultimate concrete compressive strength, γ c and γ f are material strength reduction factors, μ f represents the reinforcement ratio of FRP bars, μ s is the maximum reinforcement ratio of longitudinal bars, f f q represents the tensile strength of FRP, and E f and E s are the modulus of elasticity of FRP bars and steel bars, respectively. Table 3 lists the predicted values of the ultimate lateral load for tested walls.

4. Results and Discussions

4.1. Lateral Strength Capacity

Generally, until concrete crushing occurred at one end, all the tested walls exhibited a reasonably symmetric lateral load-top displacement relationship for loads in the + v e and v e directions. The GFRP-reinforced walls reached their designed lateral load capacity while maintaining a stable response without strength degradation. Table 3 lists the theoretically predicted and experimentally obtained yield strength, Q y , and ultimate strength, Q u , for all walls. The experimentally measured ultimate lateral strengths were in good agreement with the predicted values.
The first crack was recorded at an average drift level of 0.22% for all the tested walls. Almost a similar strength level corresponding to the crack initiation Q c r was attained as the first crack of the walls depends mainly on the concrete compressive strength. The first crack initiated for all the tested walls at an average drift level of 0.22%. The strength level corresponding to crack initiation Q c r was similar in almost all walls as it mainly depends on the concrete compressive strength. Likewise, the concrete-cover splitting at the wall edge was recorded at a similar strength level Q s p l i t for all tested walls. At this strength level, a drift level ranging between 0.7% and 0.83% was attained, with the concrete compressive strain exceeding 0.003; the concrete cover then started to split at wall edges under compression, refereeing to the initiation of inelastic deformations.
The lateral load capacities in the three specimens SW1, SGW1, and GW1 were almost similar, indicating that convergent load resistance and flexure strength can be obtained by either using steel bars, GFRP bars as the primary reinforcement, or in combination with conventional steel bars. The increased reinforcement ratio of walls SGW2, GW2, and GW3 achieved higher ultimate strength levels than the other specimens. Comparing load capacities of walls SGW1 and SGW2, an increase of 22.7% in the load resistance for wall SGW2 was attained by increasing the steel reinforcement ratio by 0.14% at the wall boundaries and increasing the GFRP reinforcement ratio by 0.31% at the web. Moreover, wall GW3 had a 15.48% higher lateral load capacity than wall GW2 due to an increase of 0.47% in the GFRP reinforcement.

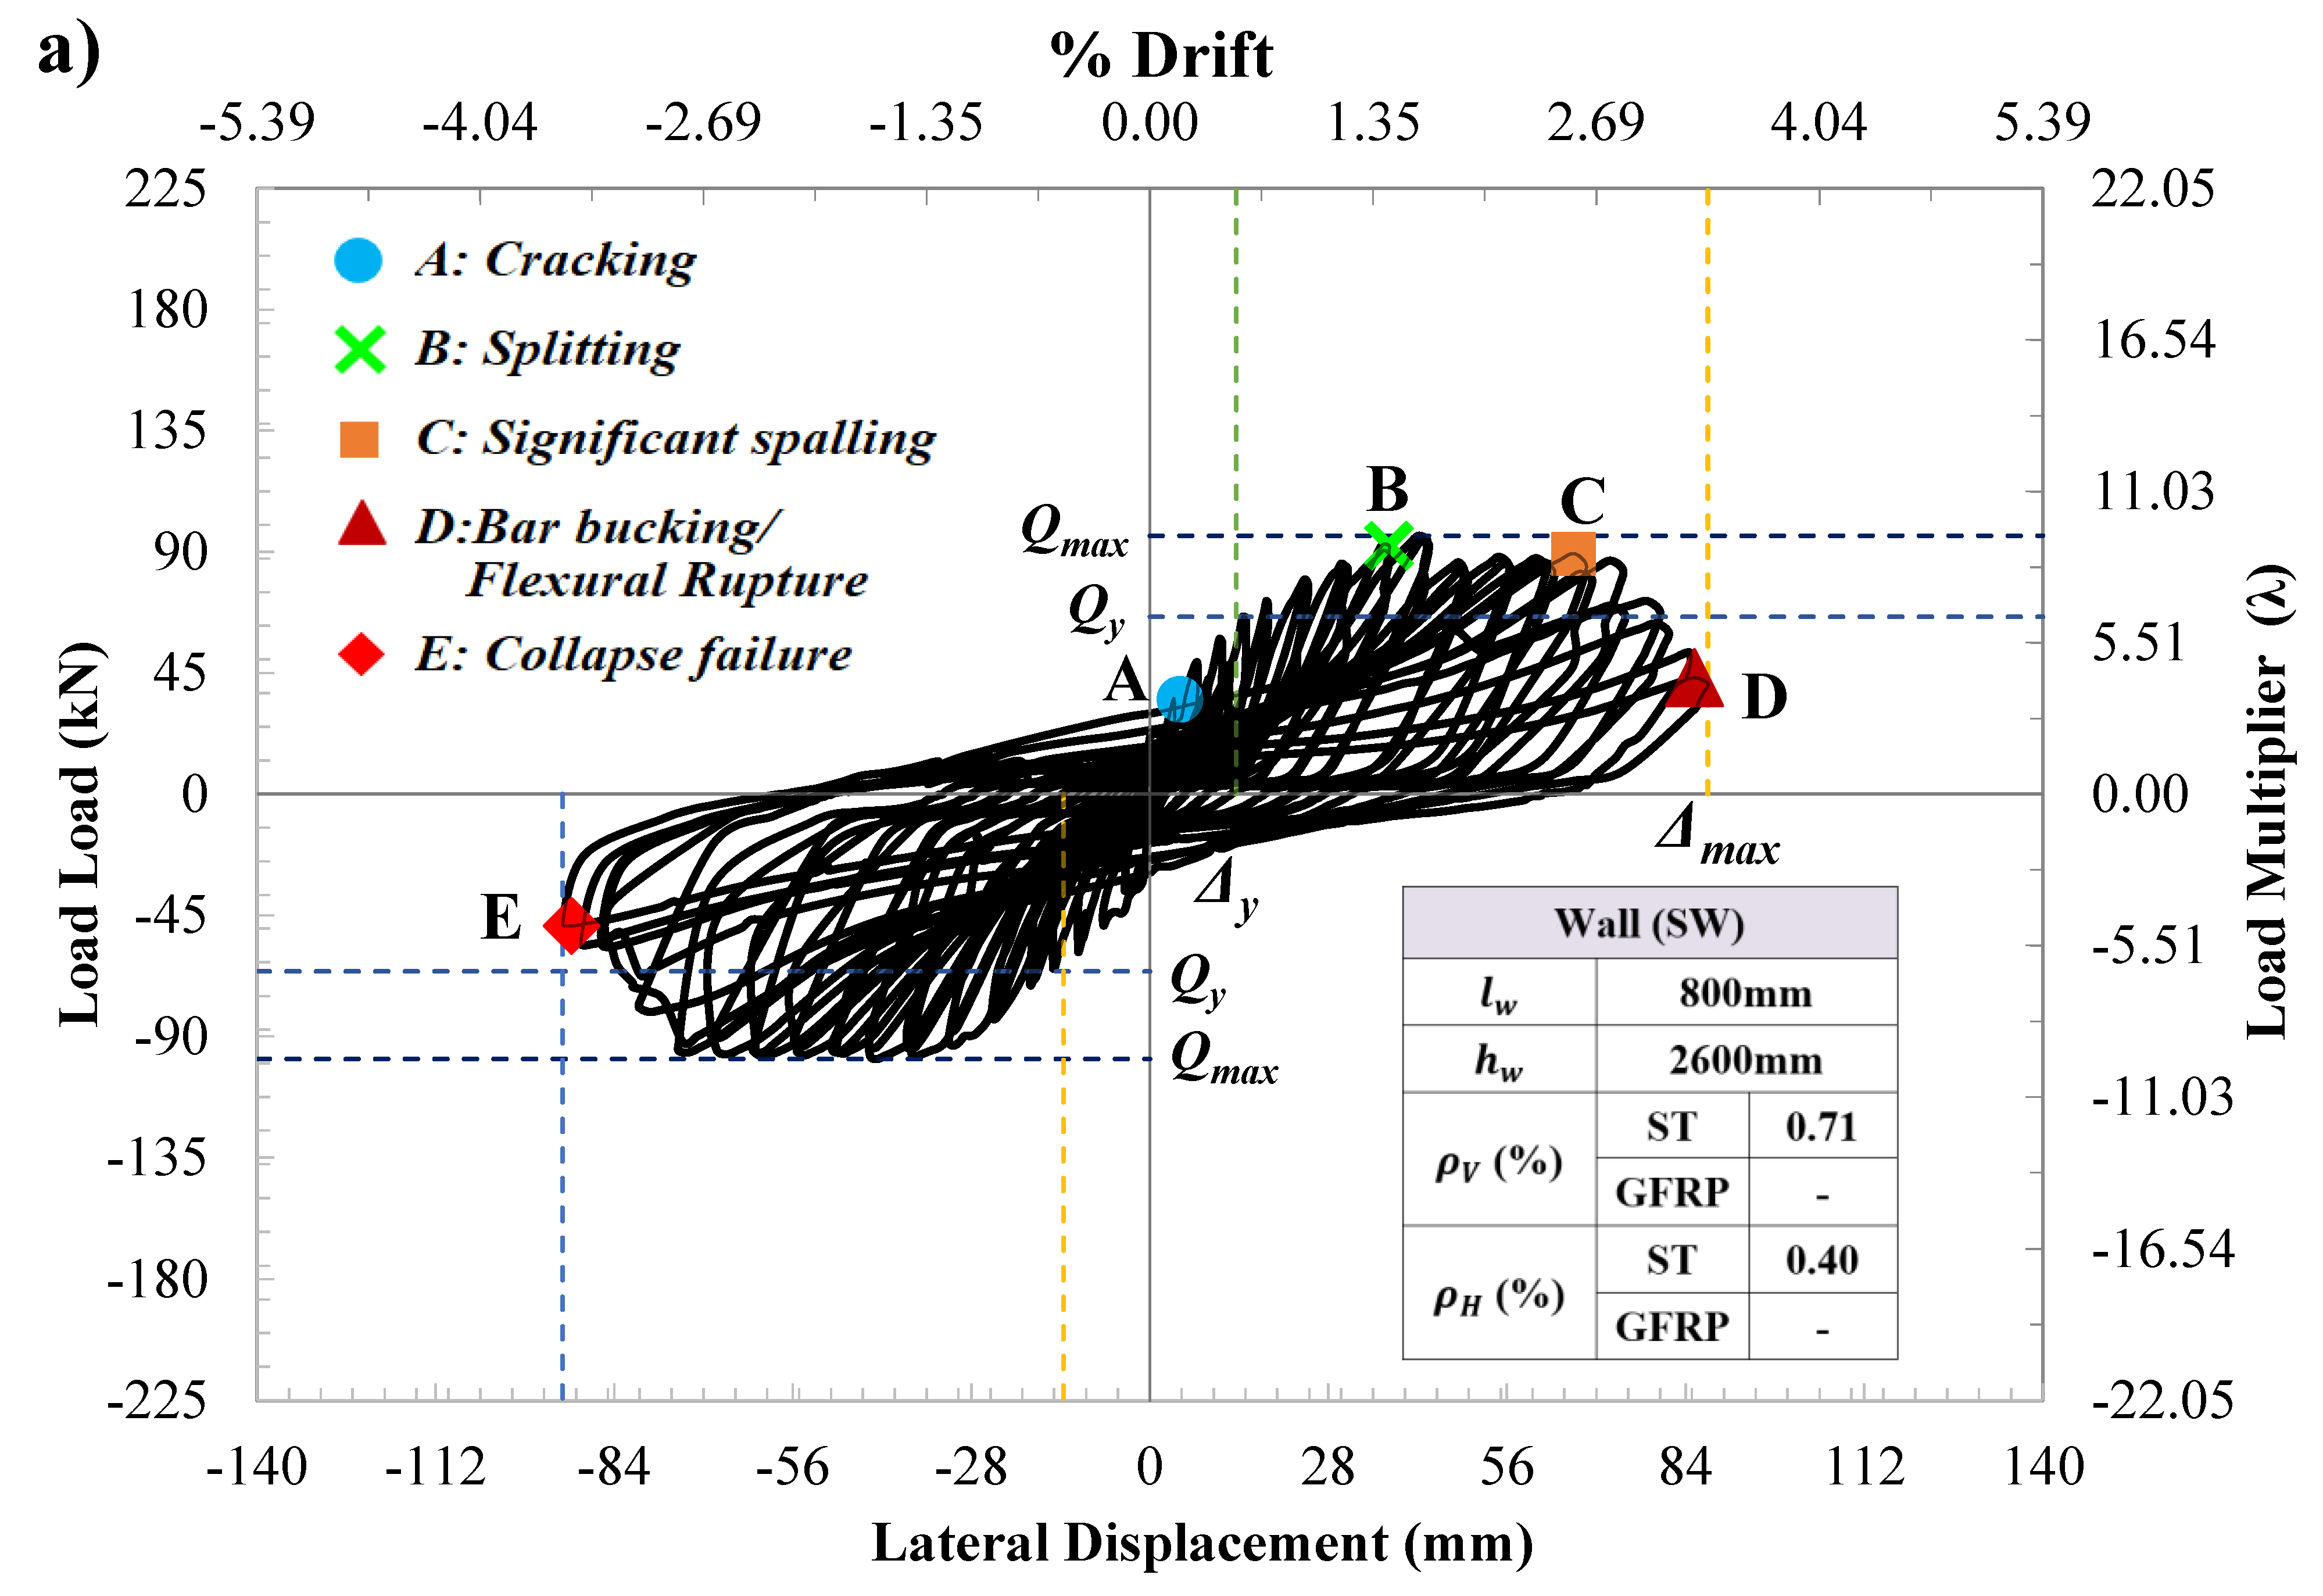
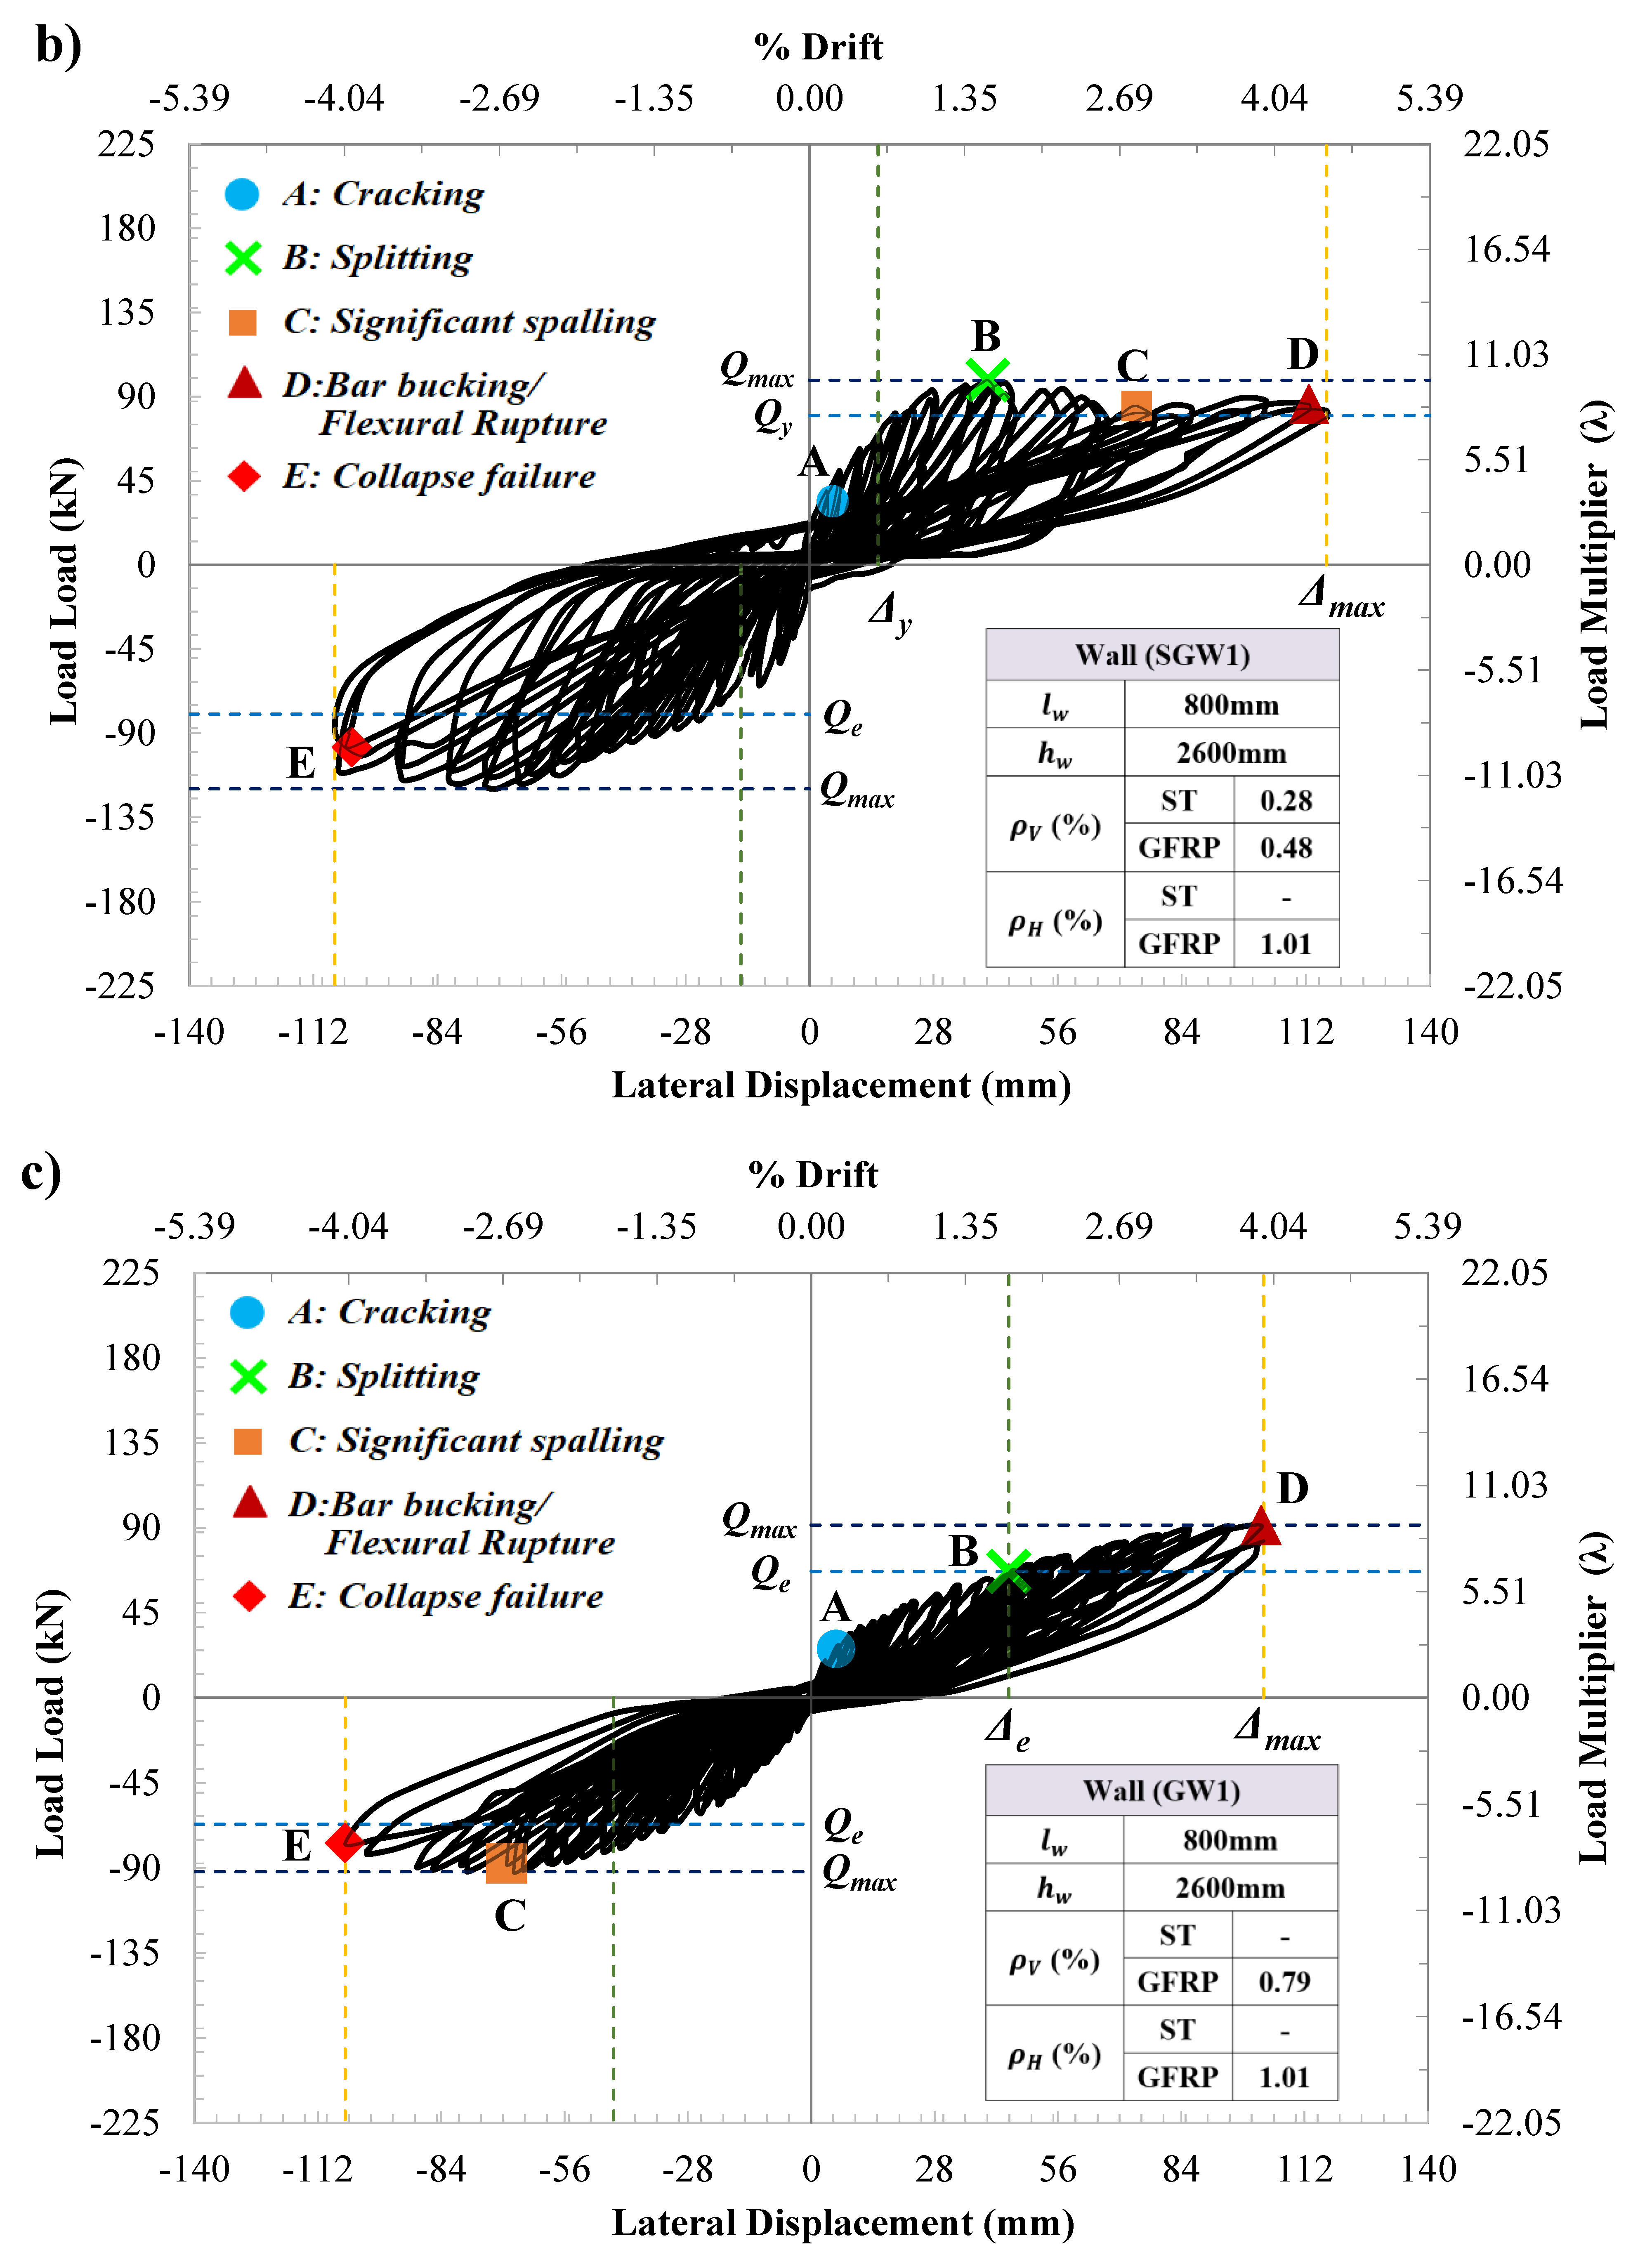
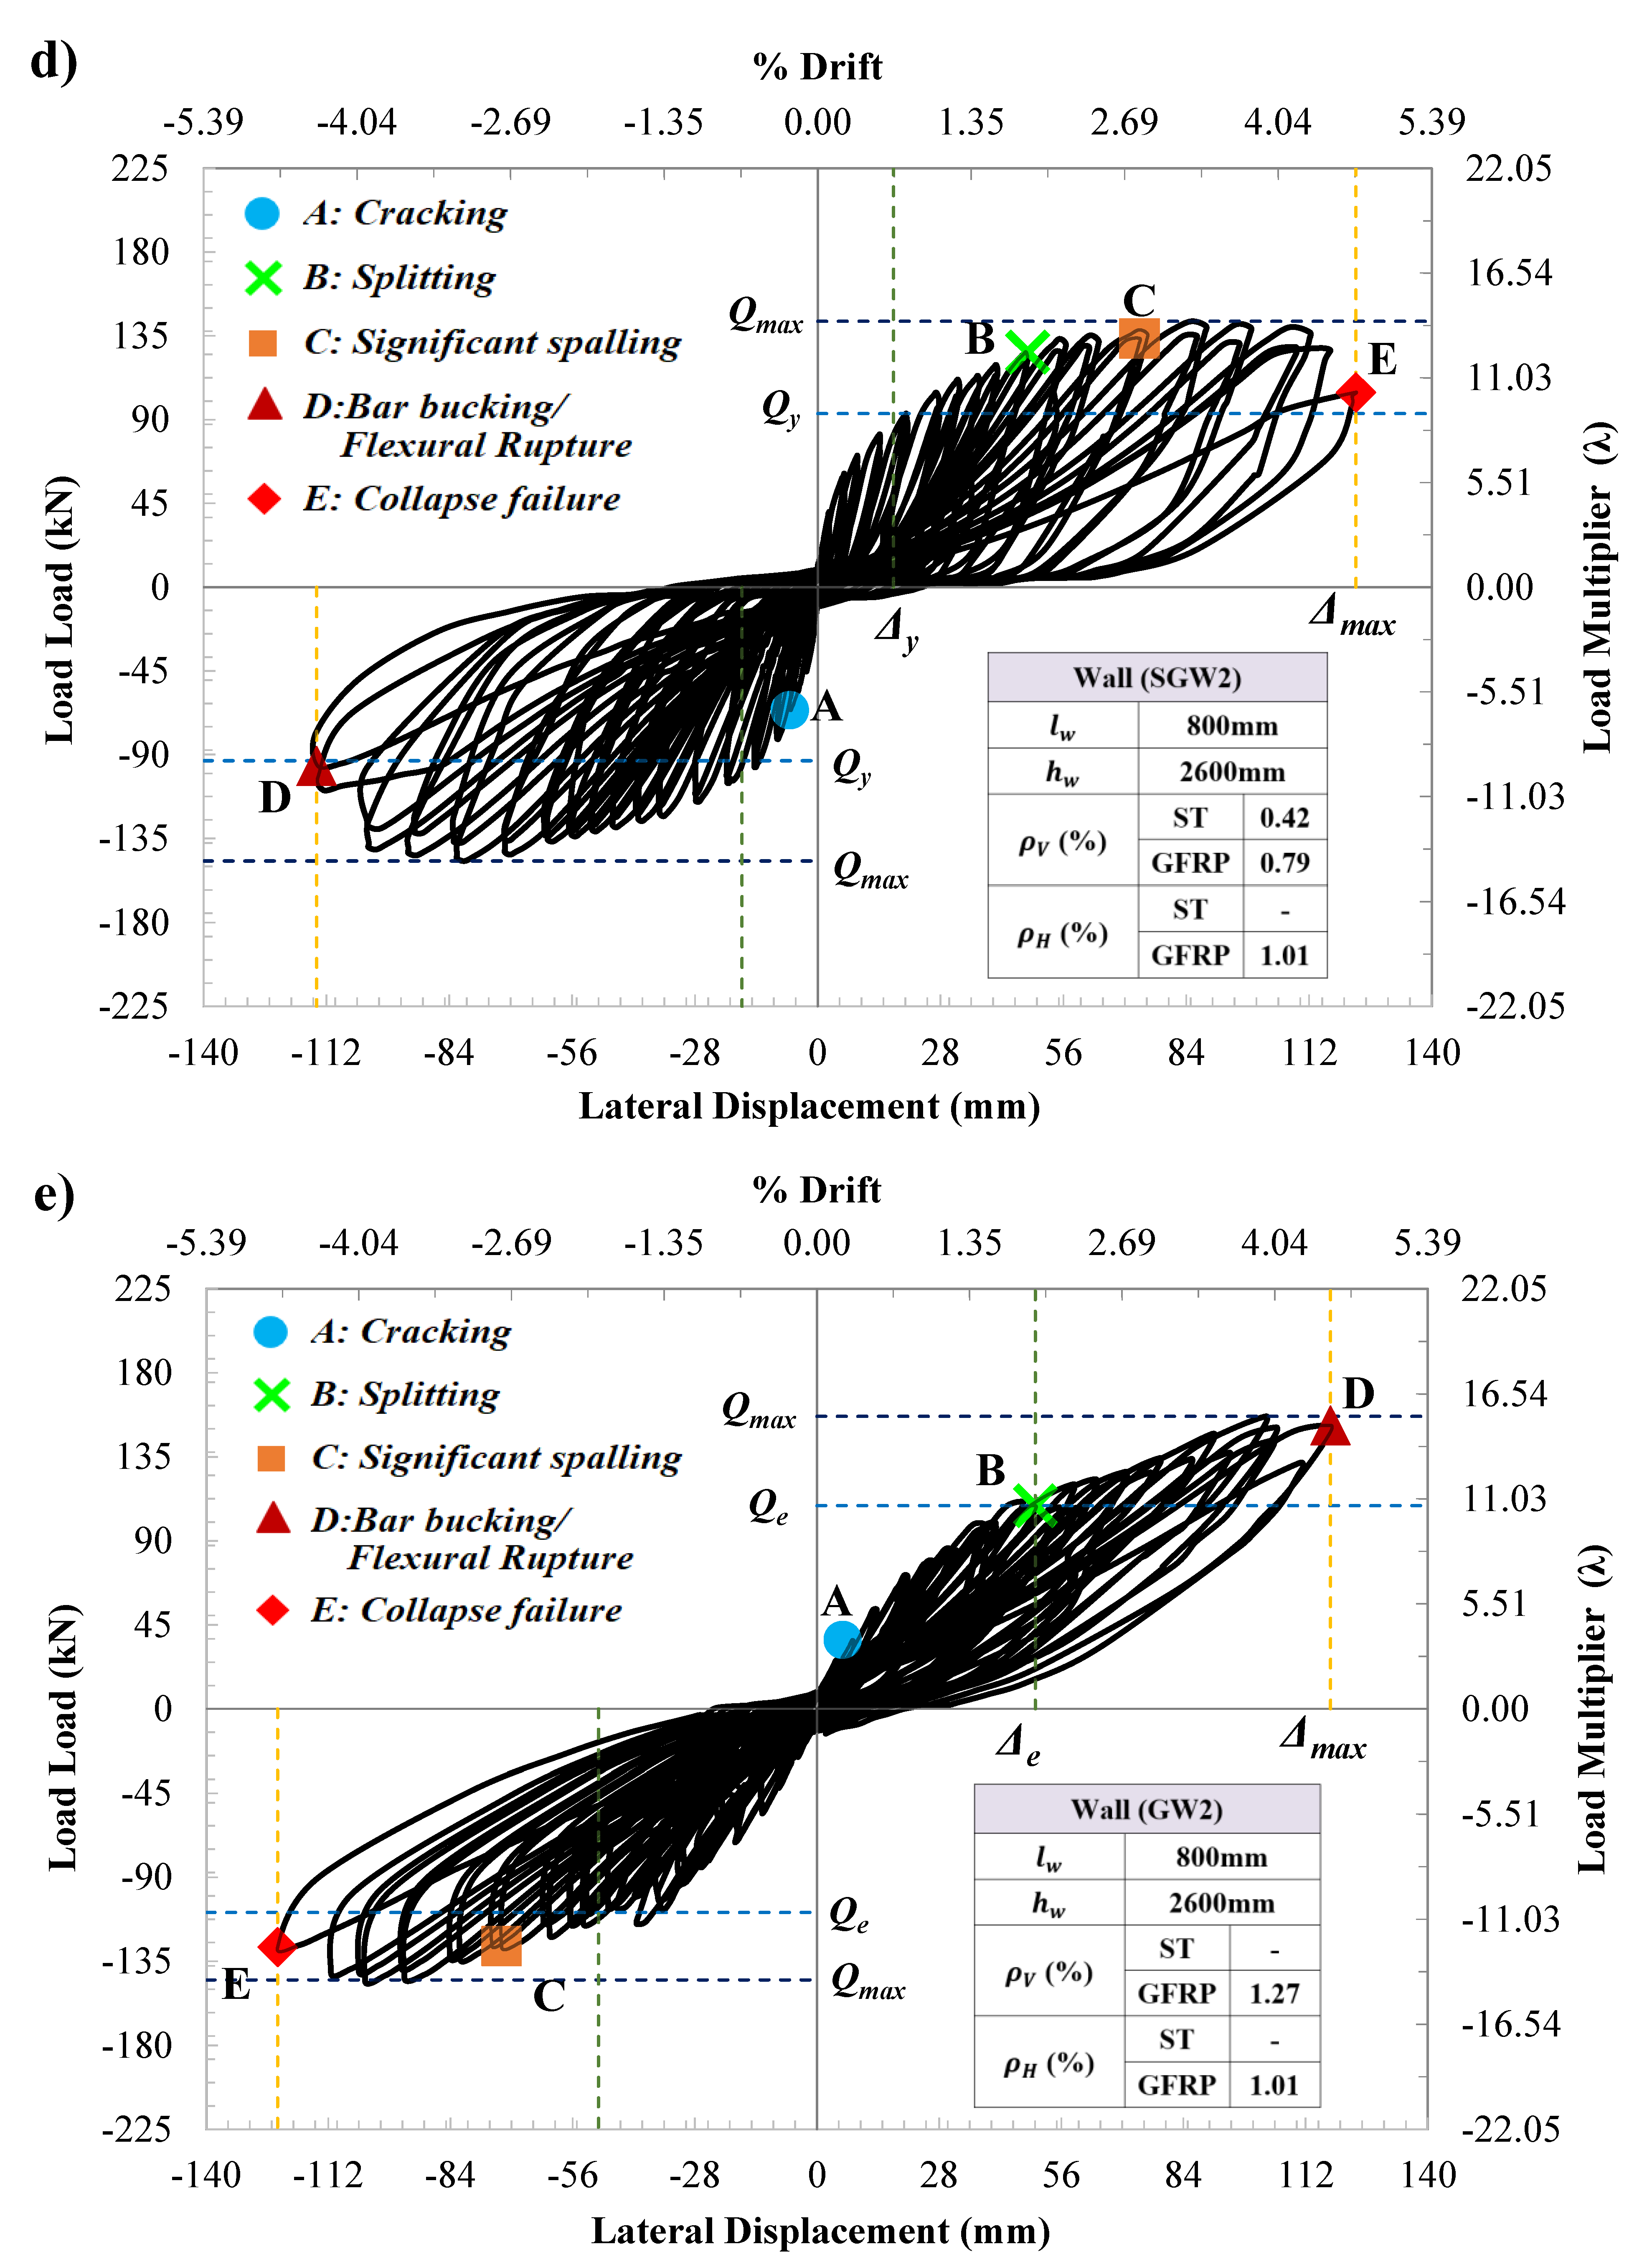
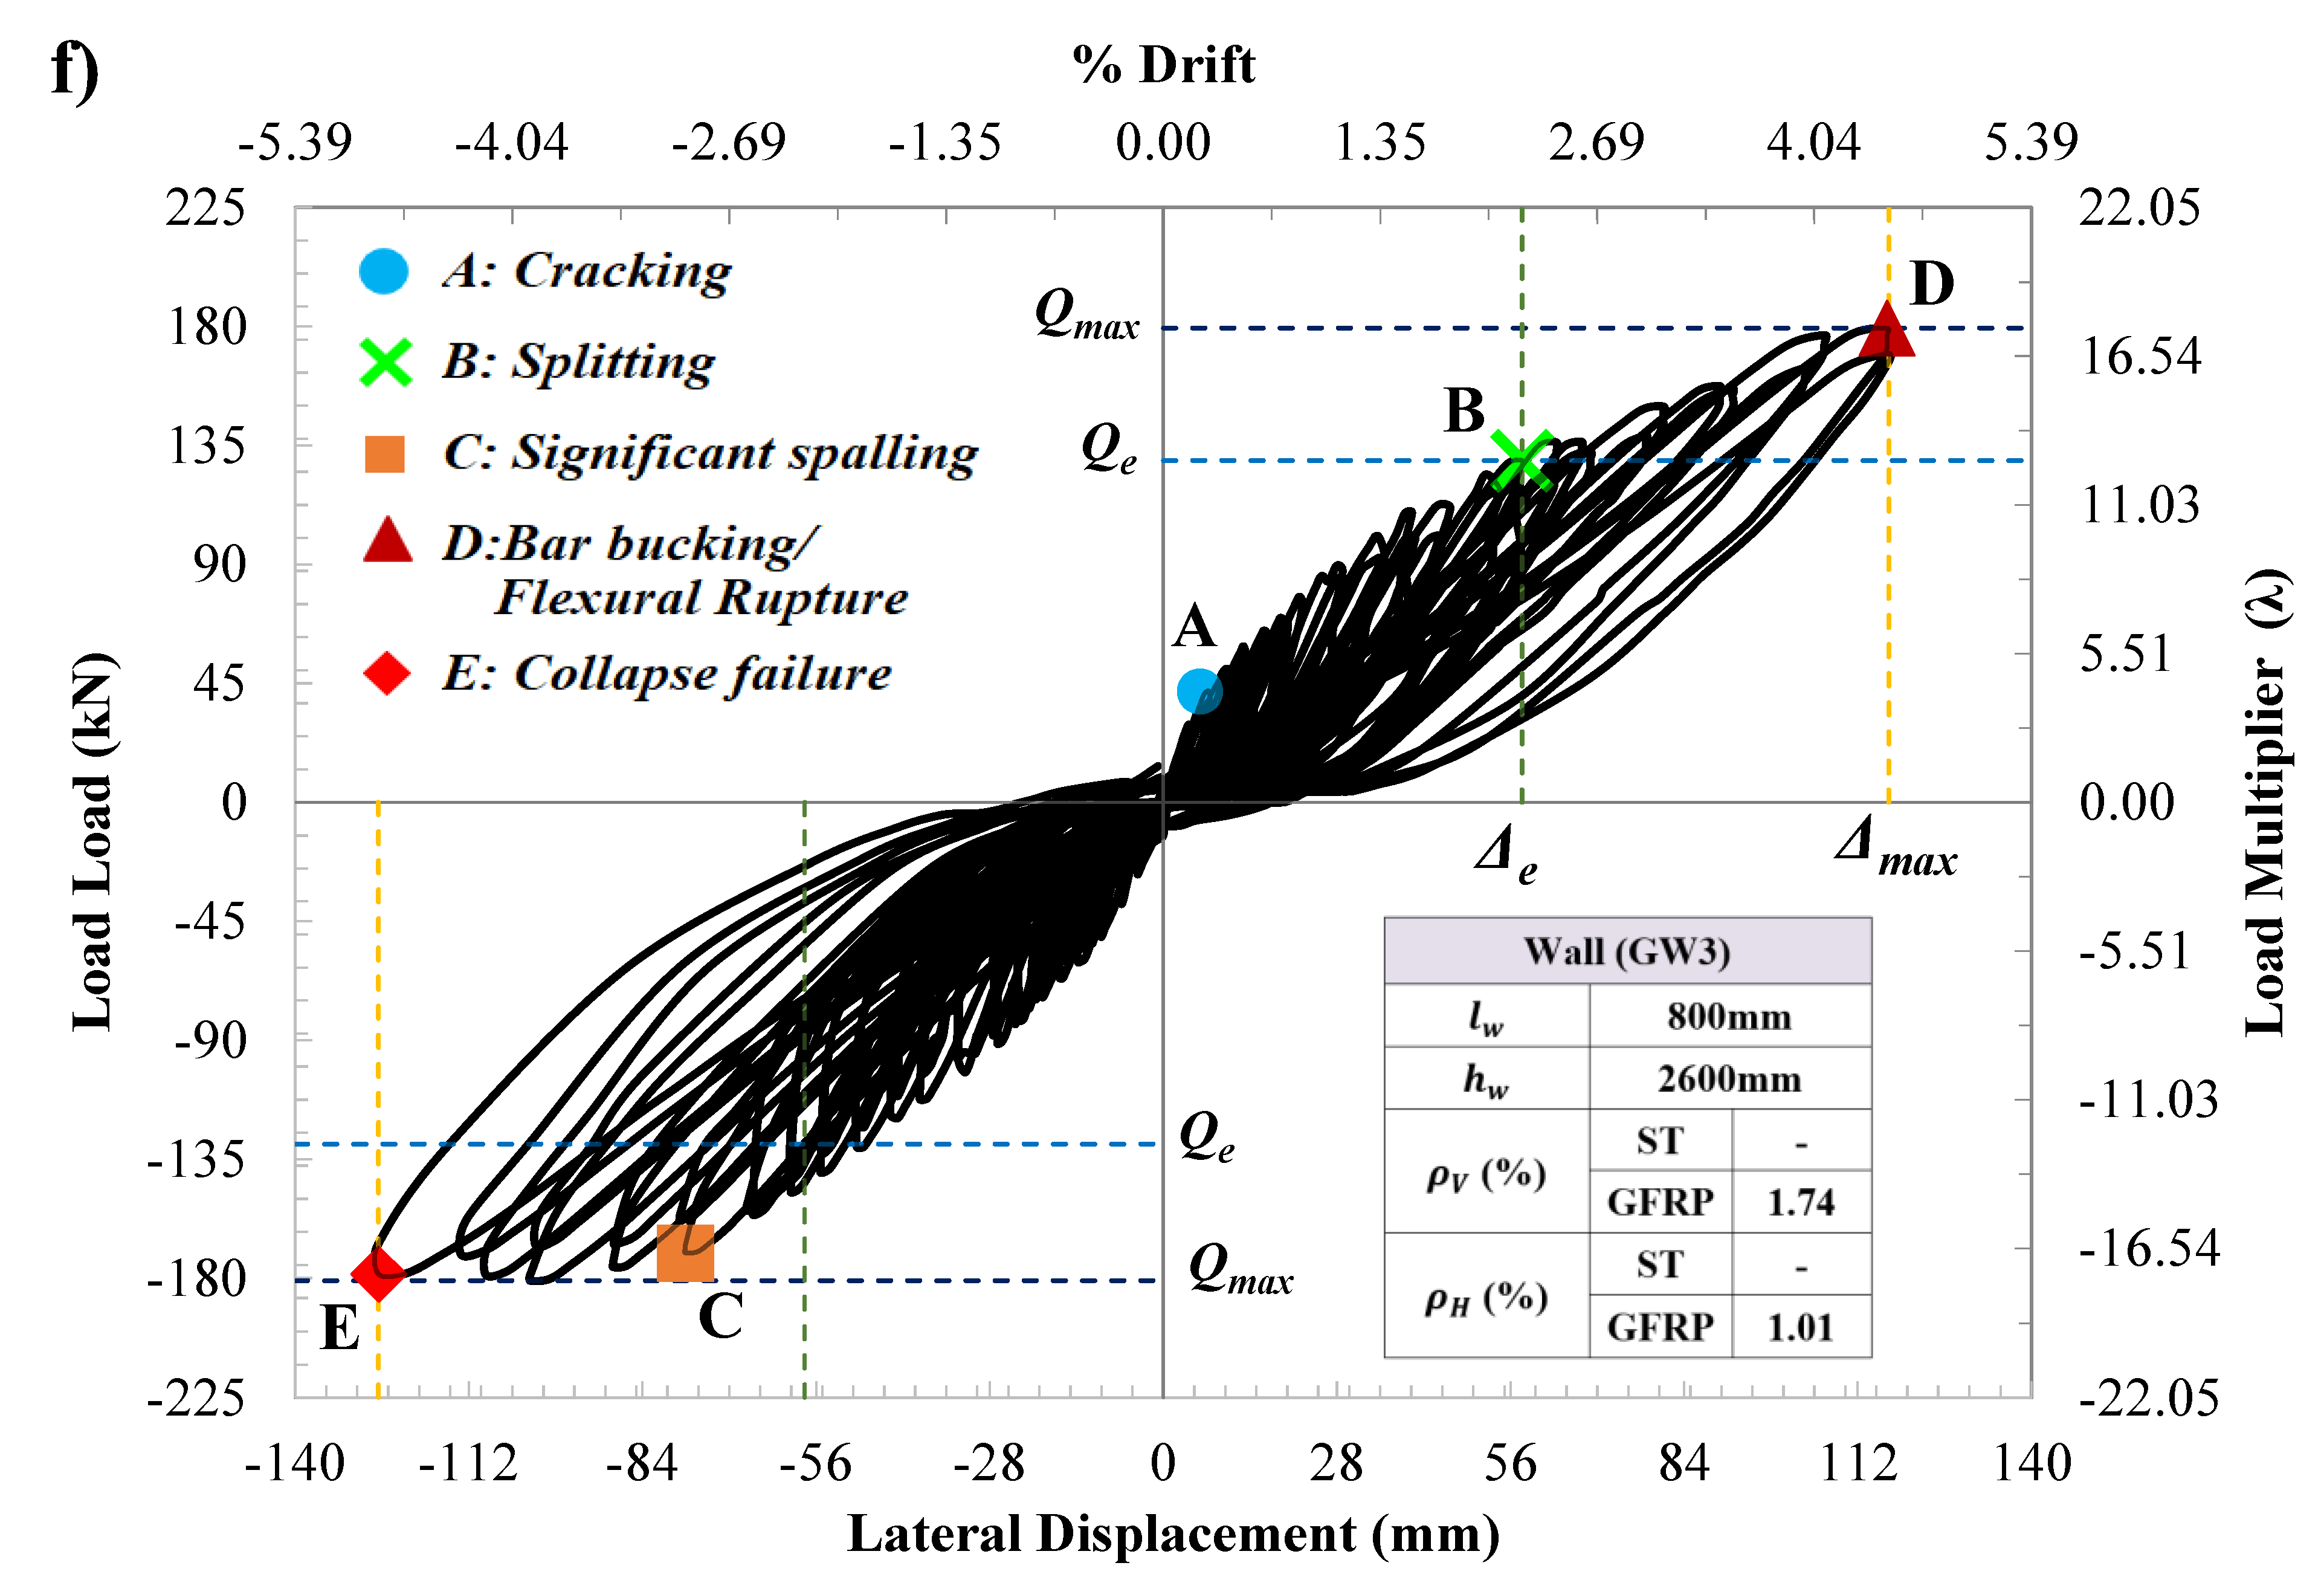
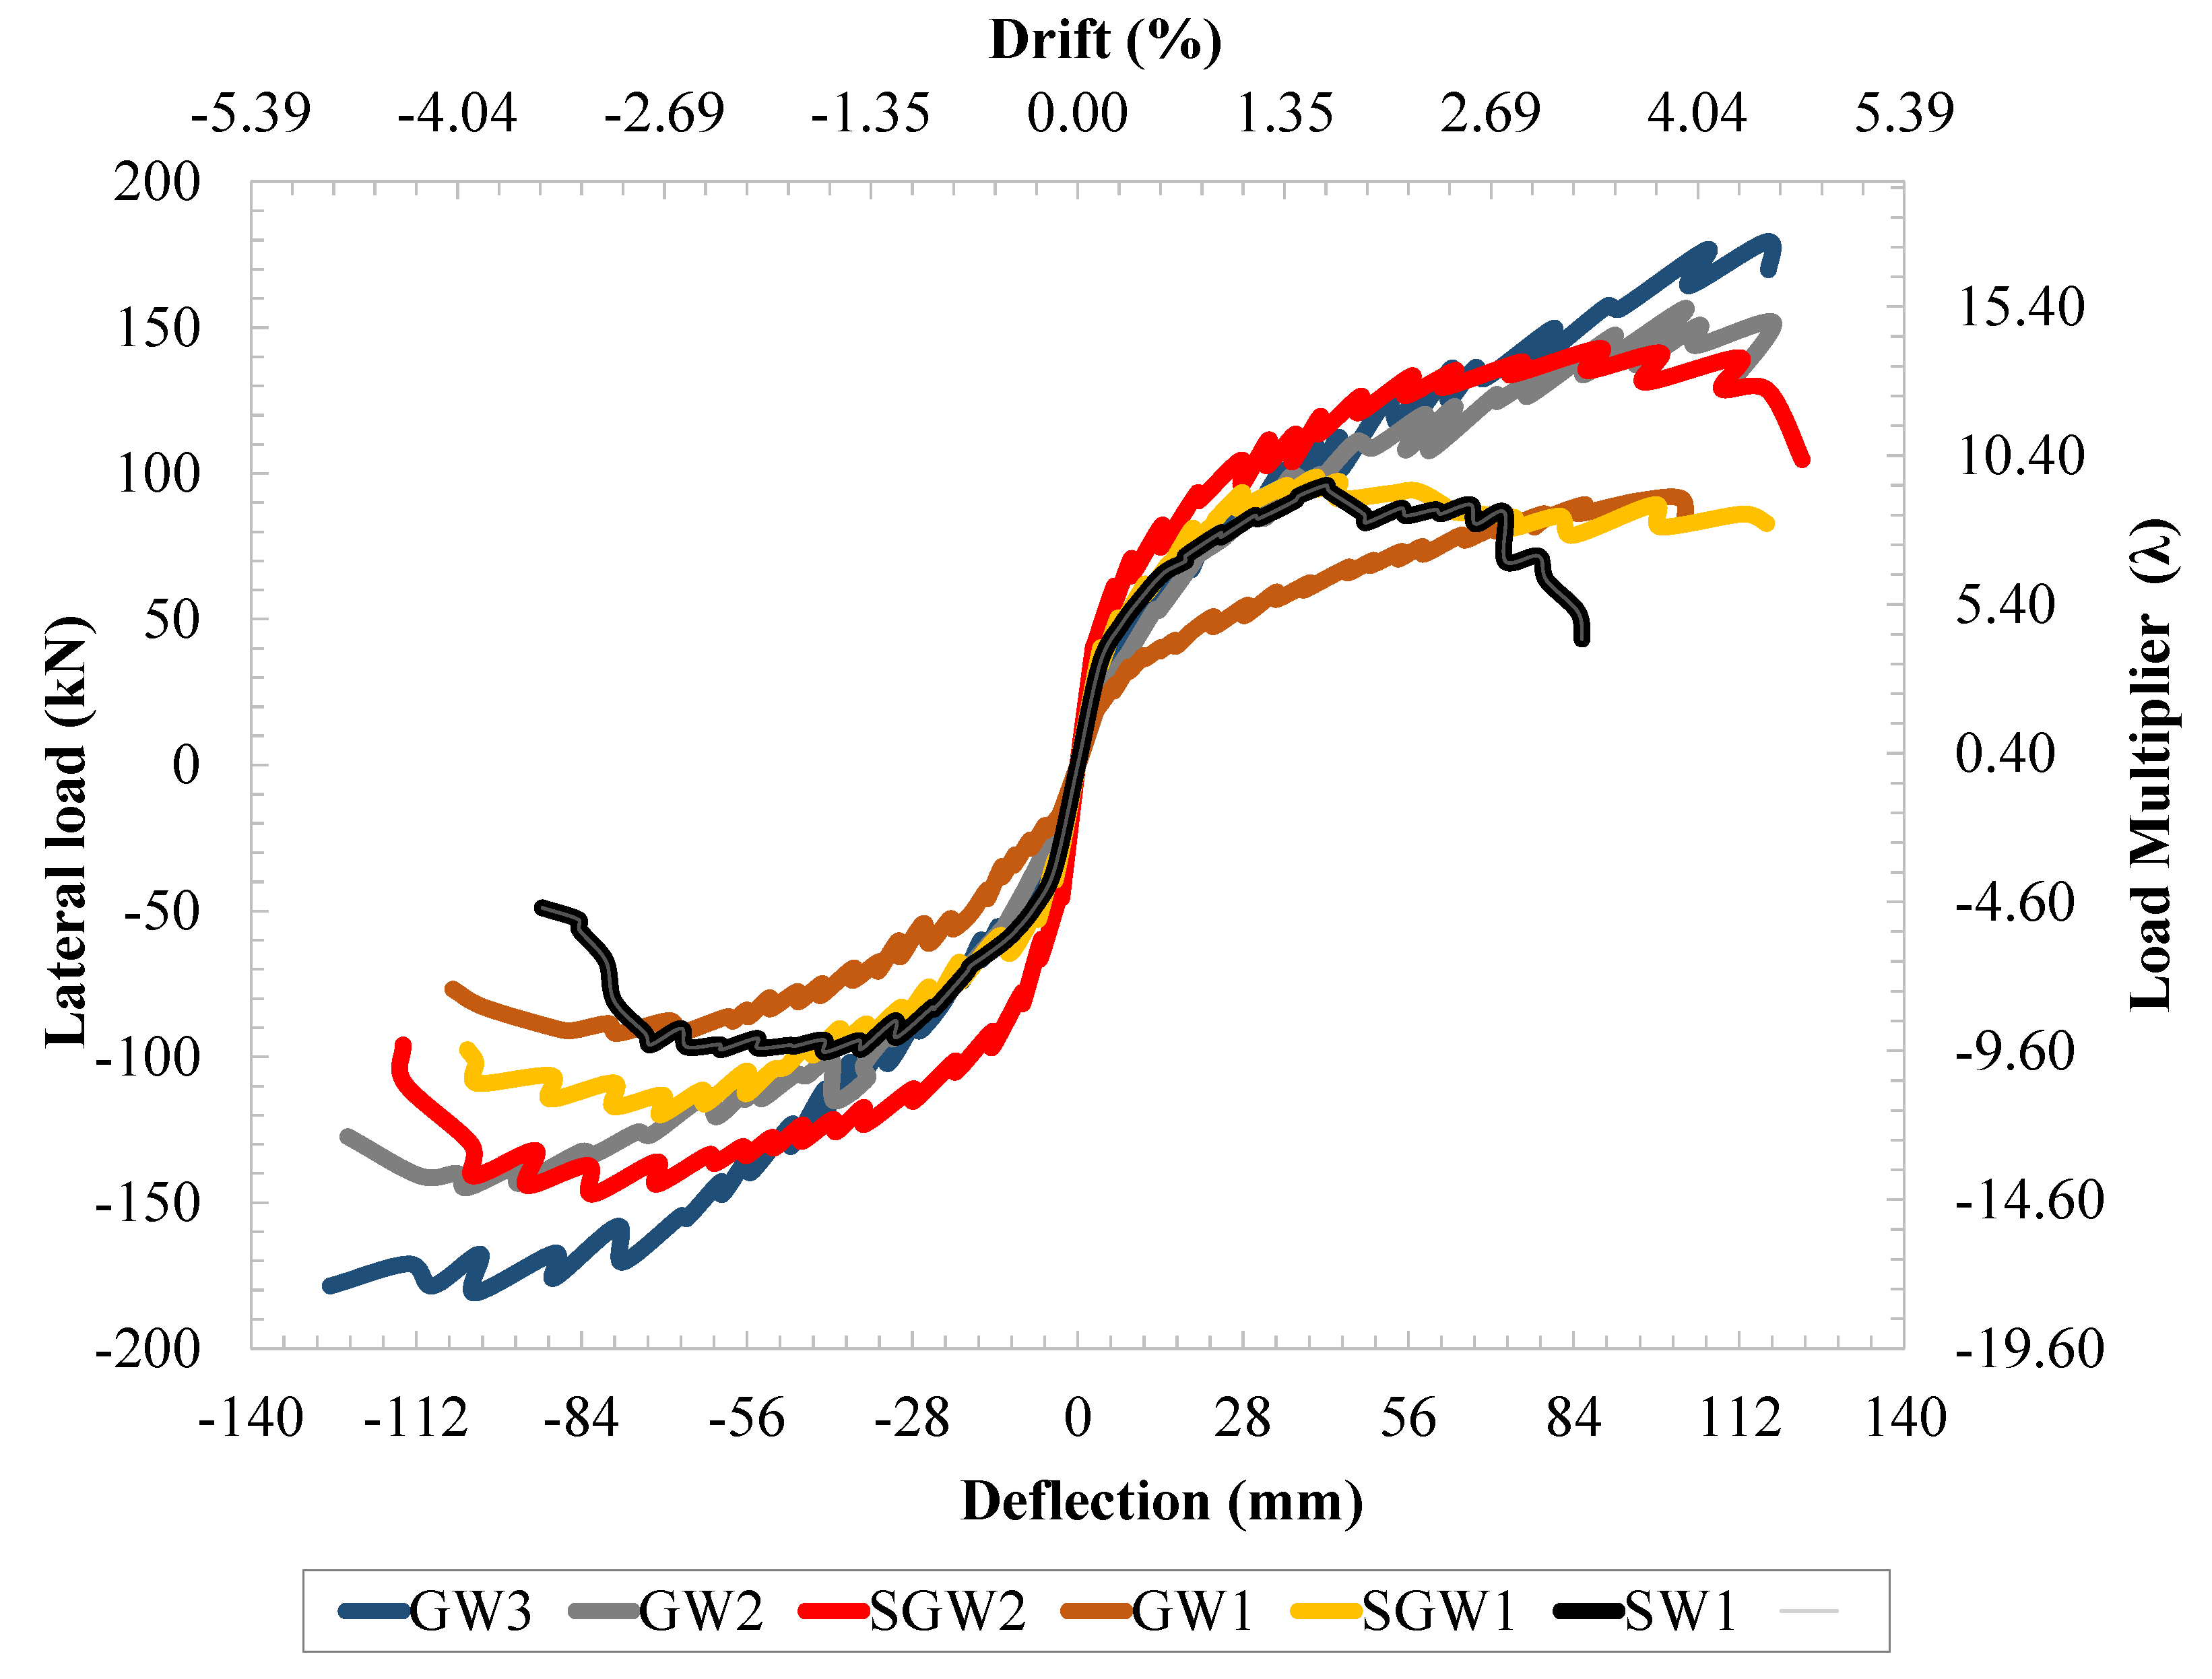
4.2. Hysteretic Behavior

Using the recorded data, the hysteresis relationships of the lateral load-top displacement for all test walls are presented in Figure 6 to evaluate their seismic performance. The yield load Q y and ultimate load Q u in the push and pull directions are shown on each hysteresis loop graph. In each graph, a table is inserted to show the key features of each wall, including the wall length, l w , height, h w , and vertical, ρ v , and horizontal, ρ h , reinforcement ratios. It should be noted that in the presented graphs, the positive displacement and load direction correlate to the applied pushing/pulling force to the wall, producing a compressive/tension reaction onto the reaction frames. The top right quadrant shows the load-displacement relationships in the push + direction where the east toe was under tension, the west toe was under compression, and vice versa for the bottom left quadrant. The primary axes of the hysteretic graphs plot the lateral force F acting on the wall, as measured by the load cell, versus top-displacement Δ , obtained as the recorded displacement from the top horizontal LVDT. The secondary axes of the presented graphs display the drift δ versus load multiplier λ . The drift and load multiplier are believed to be among the most significant factors in terms of the wall’s load resistance to seismic actions. The recorded drift is defined as δ = Δ h w , while the load multiplier (non-dimensional load format) is defined as the ratio of the wall’s lateral force resistance to its self-weight λ = Q W w .
In general, the hysteretic response of all walls seems to be self-centering, with no substantial load or displacement residuals over a considerable part of the test. Pinching was minimal in all the tested walls up to their corresponding peak capacities. Until concrete crushing occurred at one end, each wall exhibited a remarkably symmetric load-top displacement relationship for loads in the push and pull directions. Before cracking, the steel-reinforced walls (SW and SGW) exhibited initially stiff behavior with a linear–elastic response, with very thin loops indicating a lower level of damage with insignificant amounts of dissipated energy. Over the subsequent loading cycles, significant stiffness reduction was associated with the crack initiation displayed by gradual flattening of the hysteresis loops and the load-deformation response developed into relatively wider loops with higher energy dissipation. As the lateral load increased, further horizontal cracks propagated and yielding of the outermost longitudinal bars was evident, where the slopes of the loading portion of the hysteresis loops of each cycle showed progressive stiffness degradation. By concrete-cover spalling, further opening of the loops was evident, which would increase energy dissipation capabilities. The hysteresis response of walls SW1, SGW1, and SGW2 are shown in Figure 6a,b,d, respectively, indicating the steps of failure progression.
The GFRP-reinforced walls had narrower hysteresis loops than the corresponding steel-reinforced walls with no strength degradation, as shown in Figure 6c,e,f. The unloading/reloading curves evidenced linearity following the highly elastic behavior of GFRP bars. The response in both the push and pull directions was symmetric up until near failure, resulting in a pinched hysteresis response with almost no drop in overall strength. The reloading curve of a consecutive cycle exhibited a similar loading path but at slightly lower stiffness, leading to lower peak strength. With increased deformations, cracks initiated, causing stiffness degradation, and the lateral load-top displacement curve slope decreased in each cycle. The results confirmed that walls with higher reinforcement ratios achieved higher drift levels and increased the number of cycles until failure.

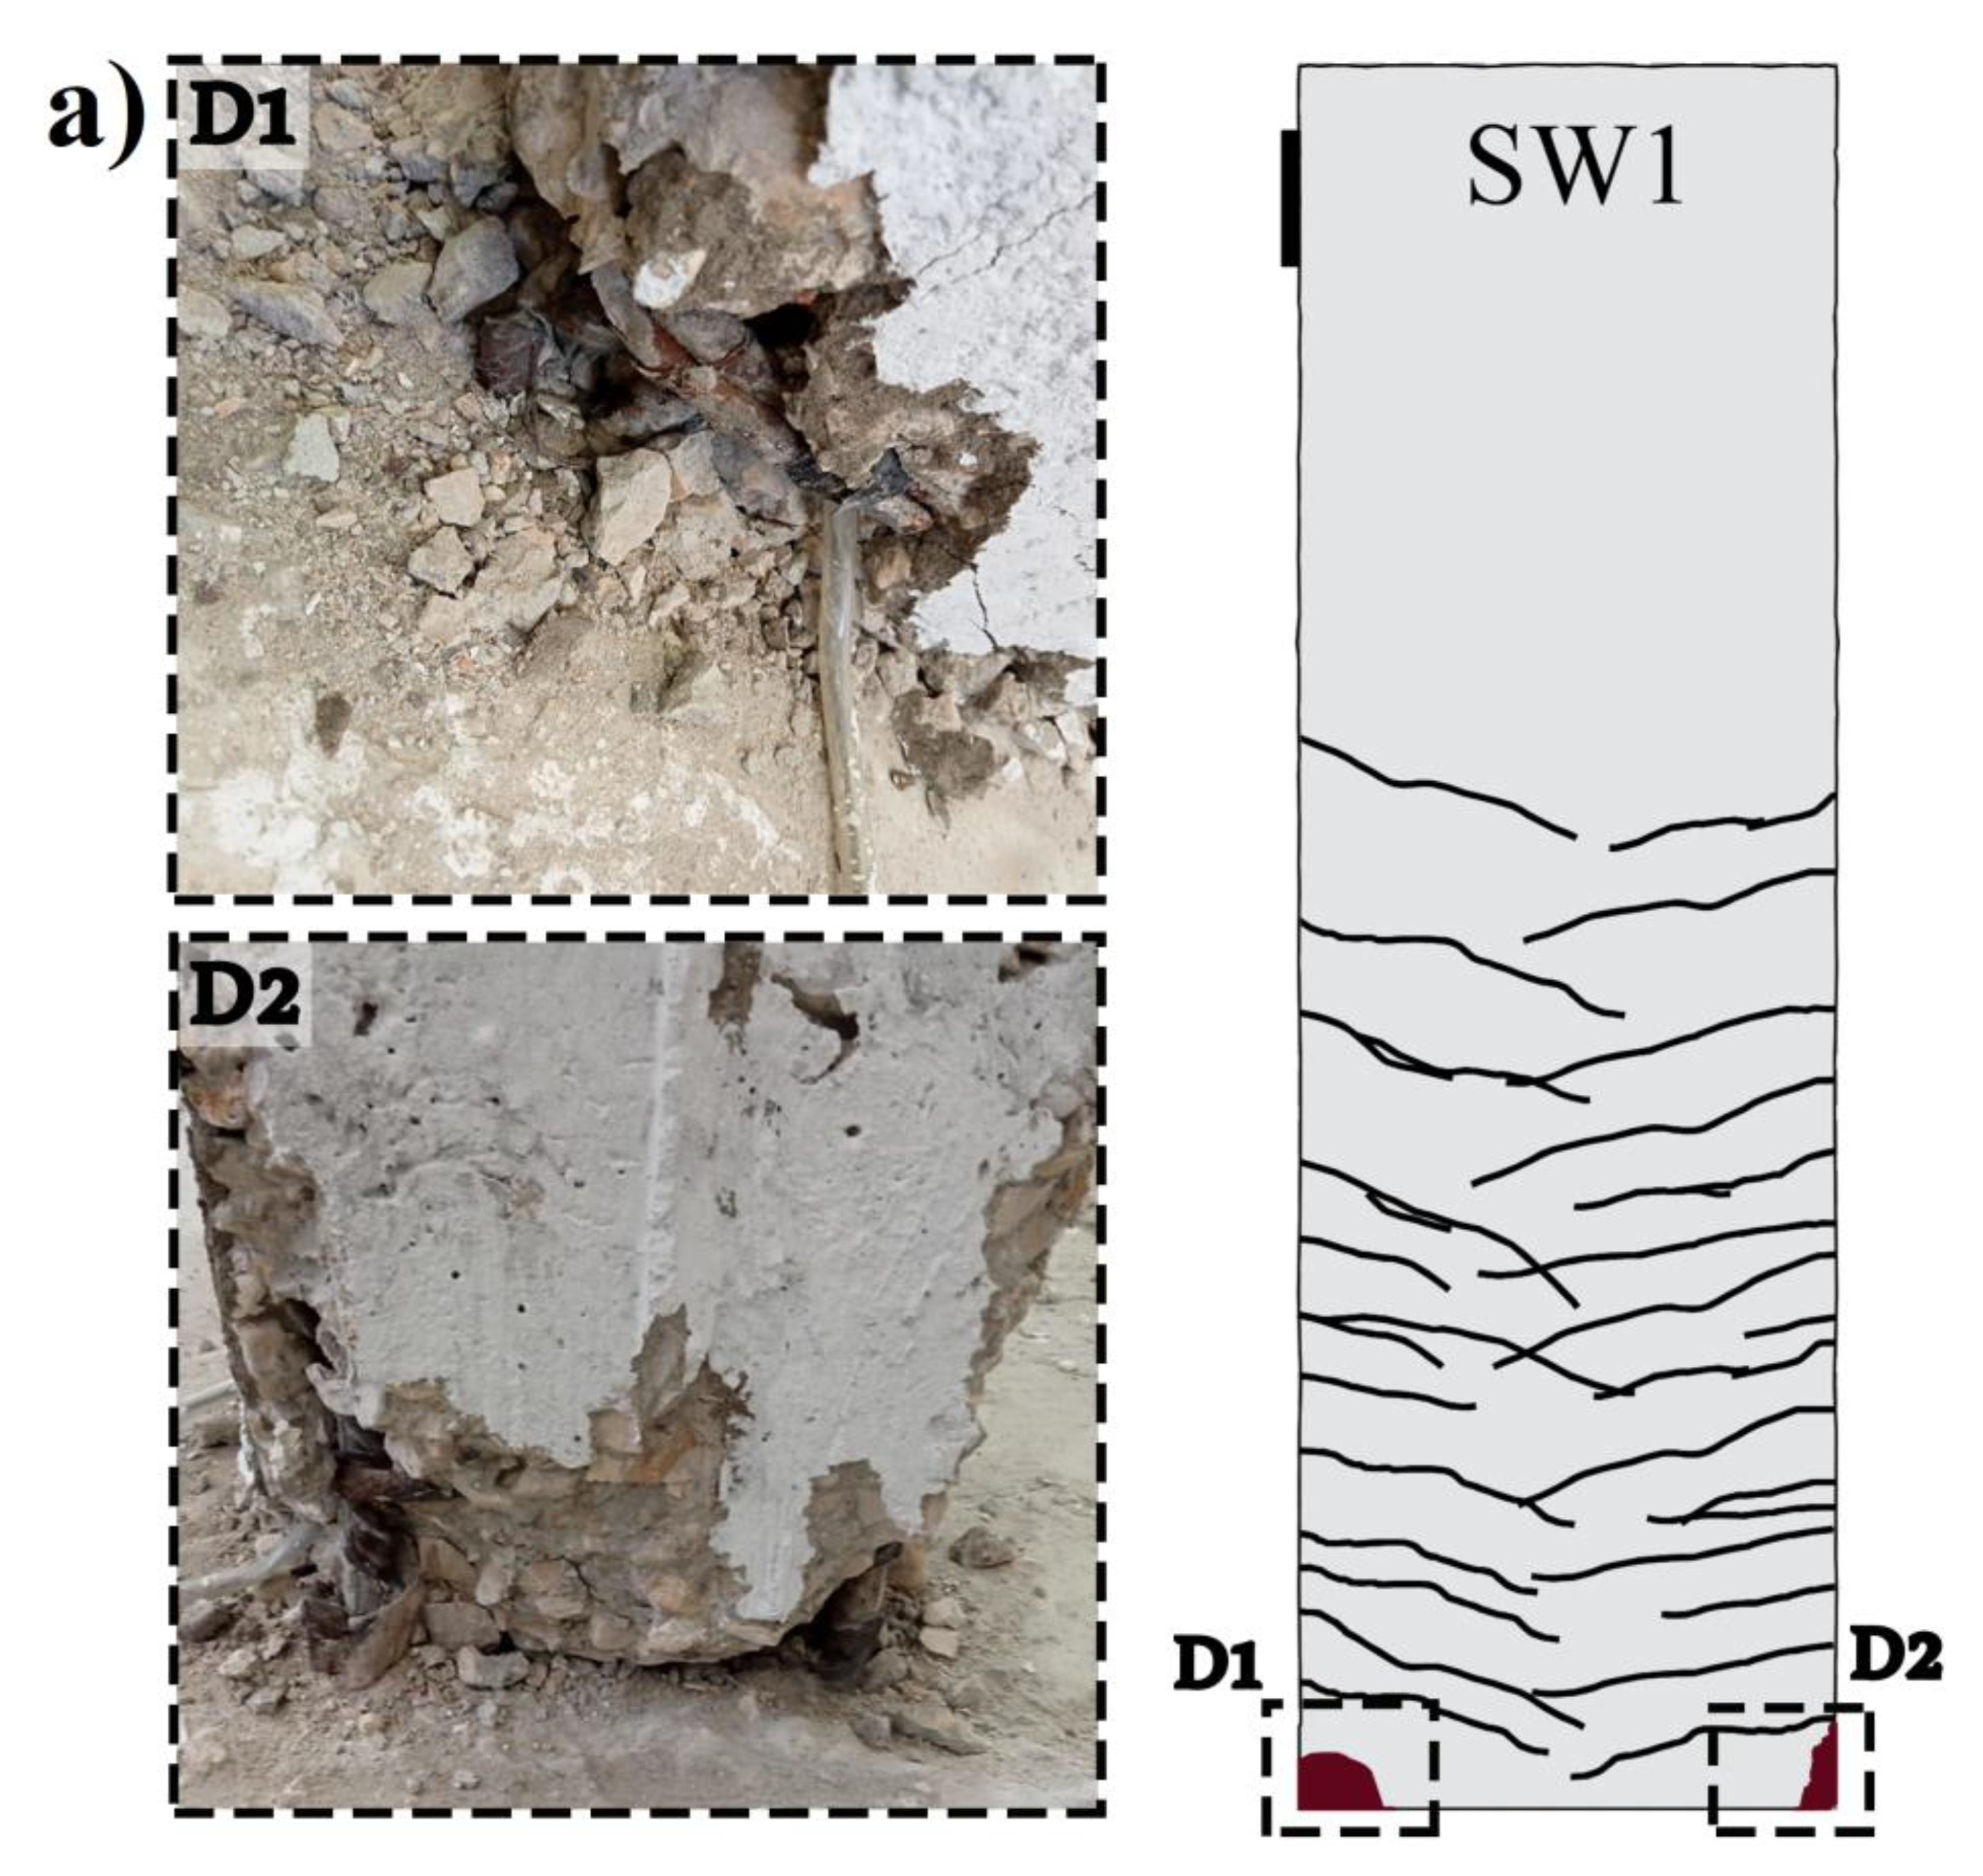
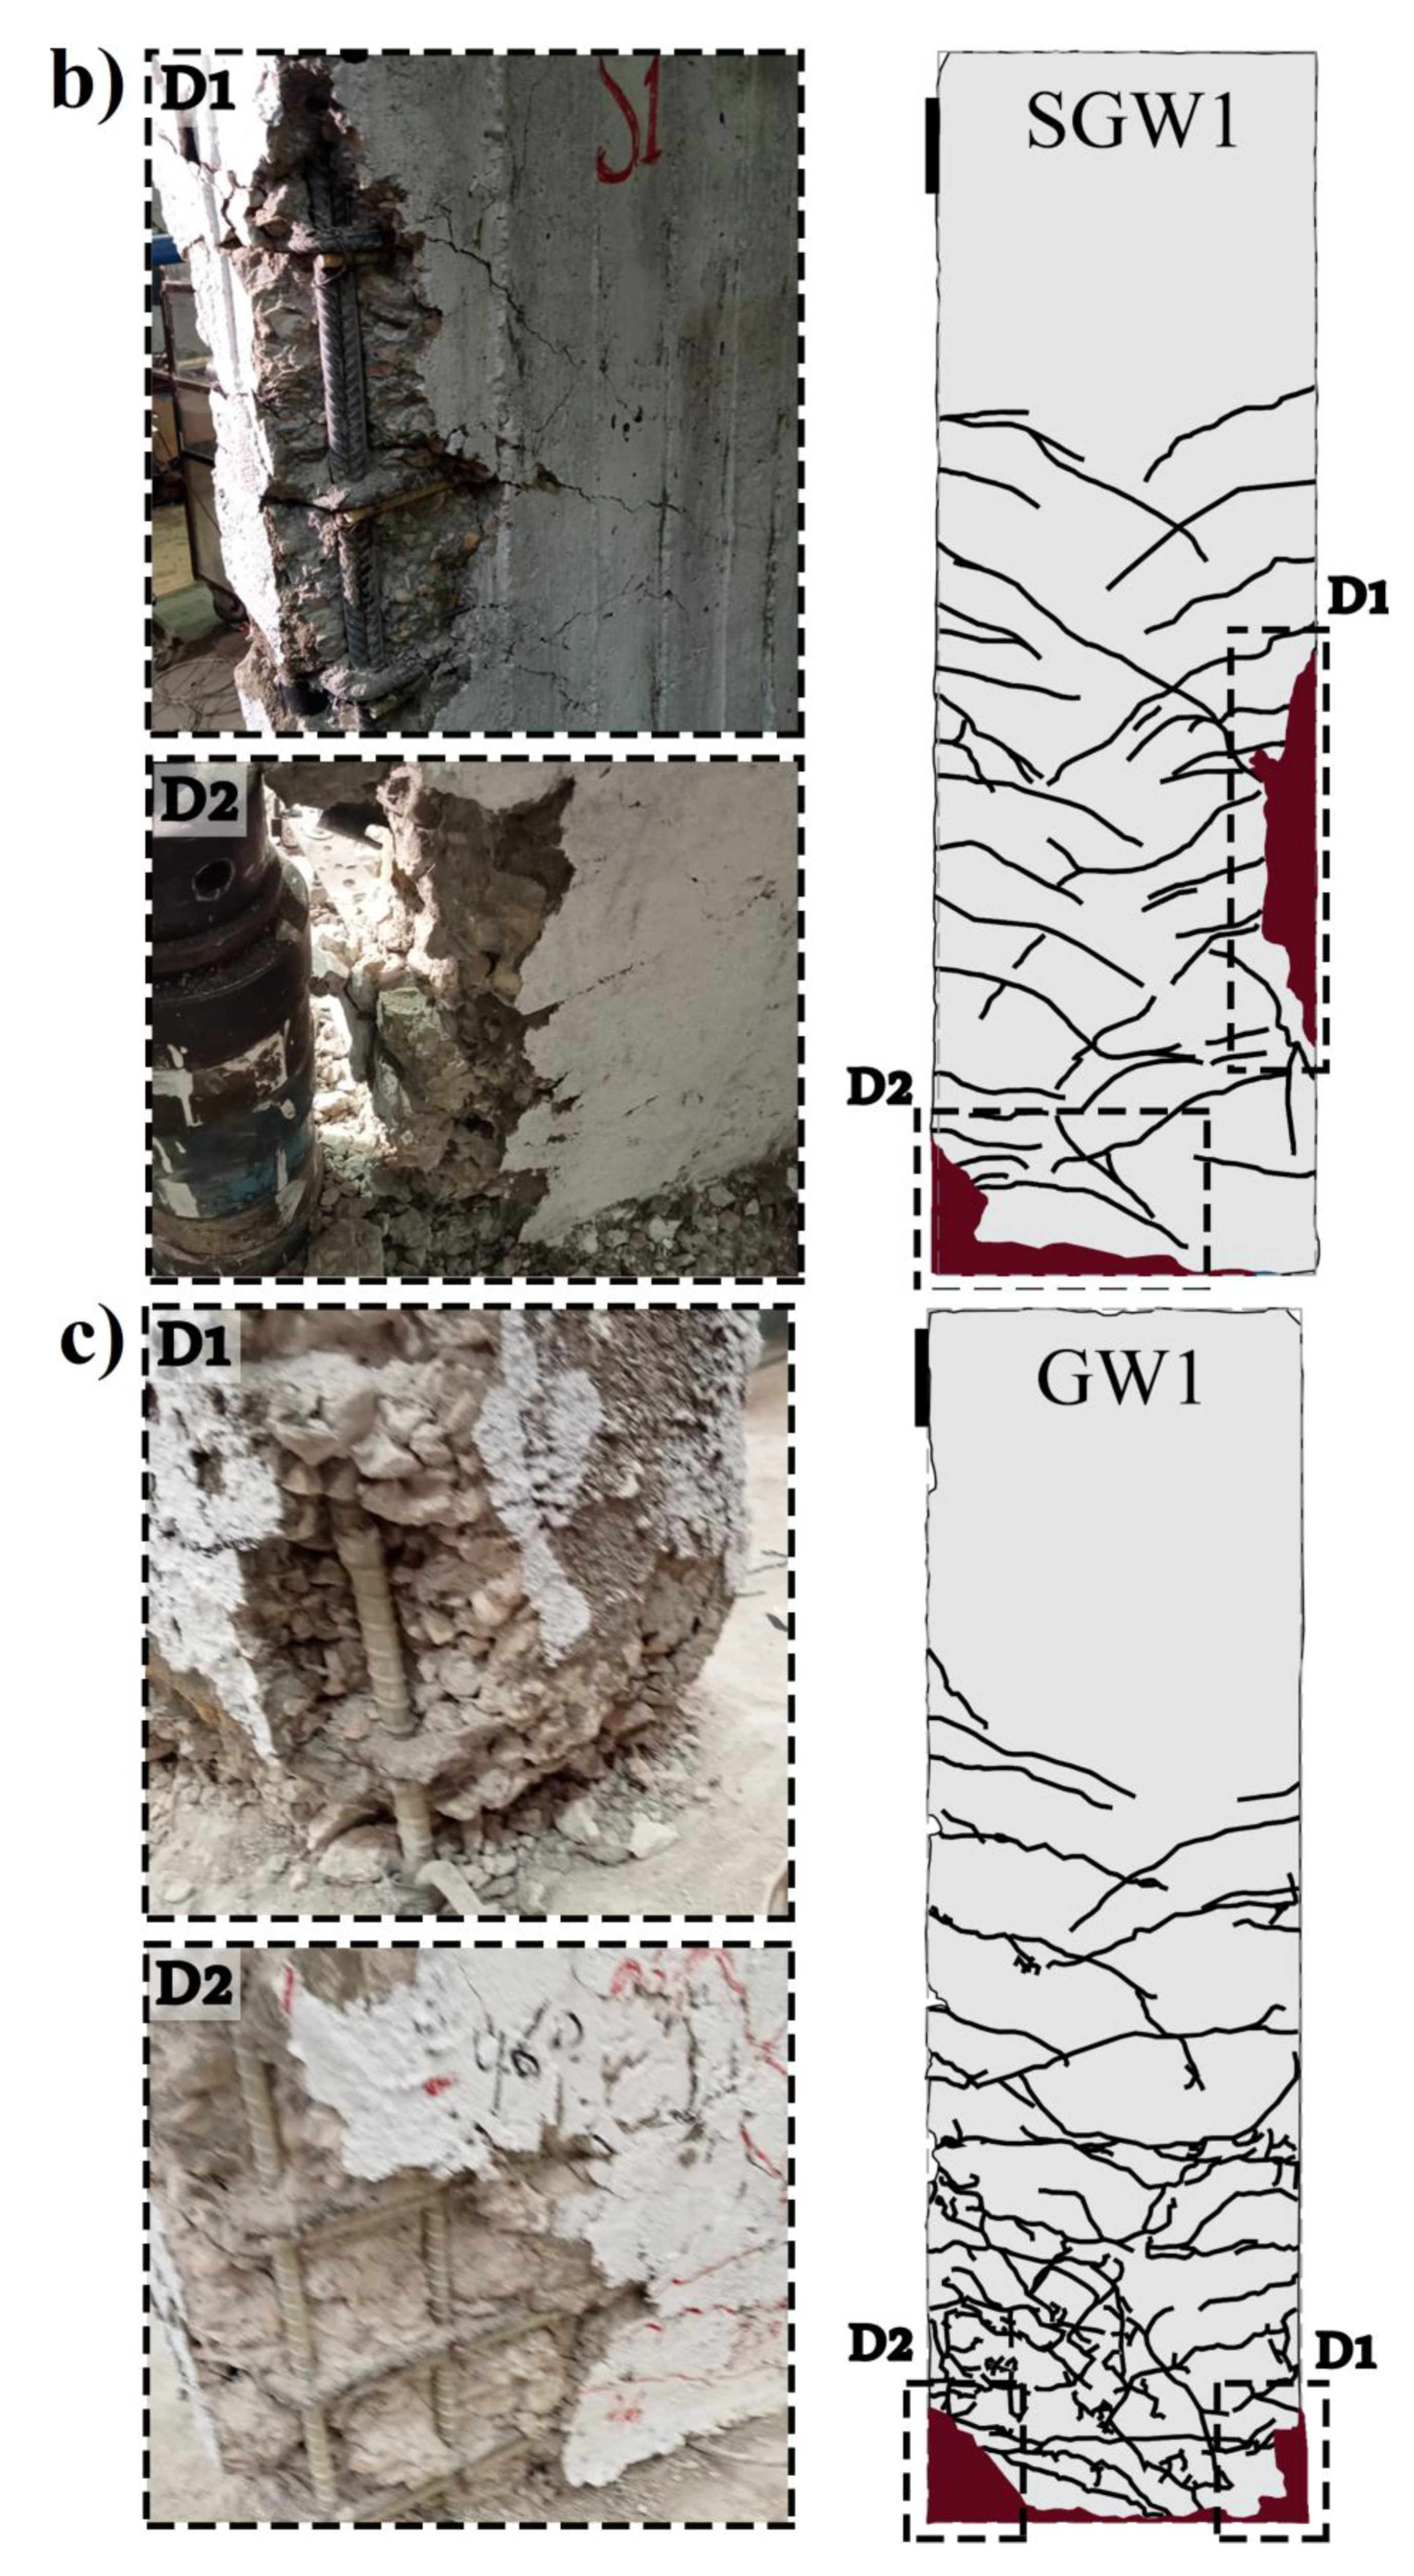
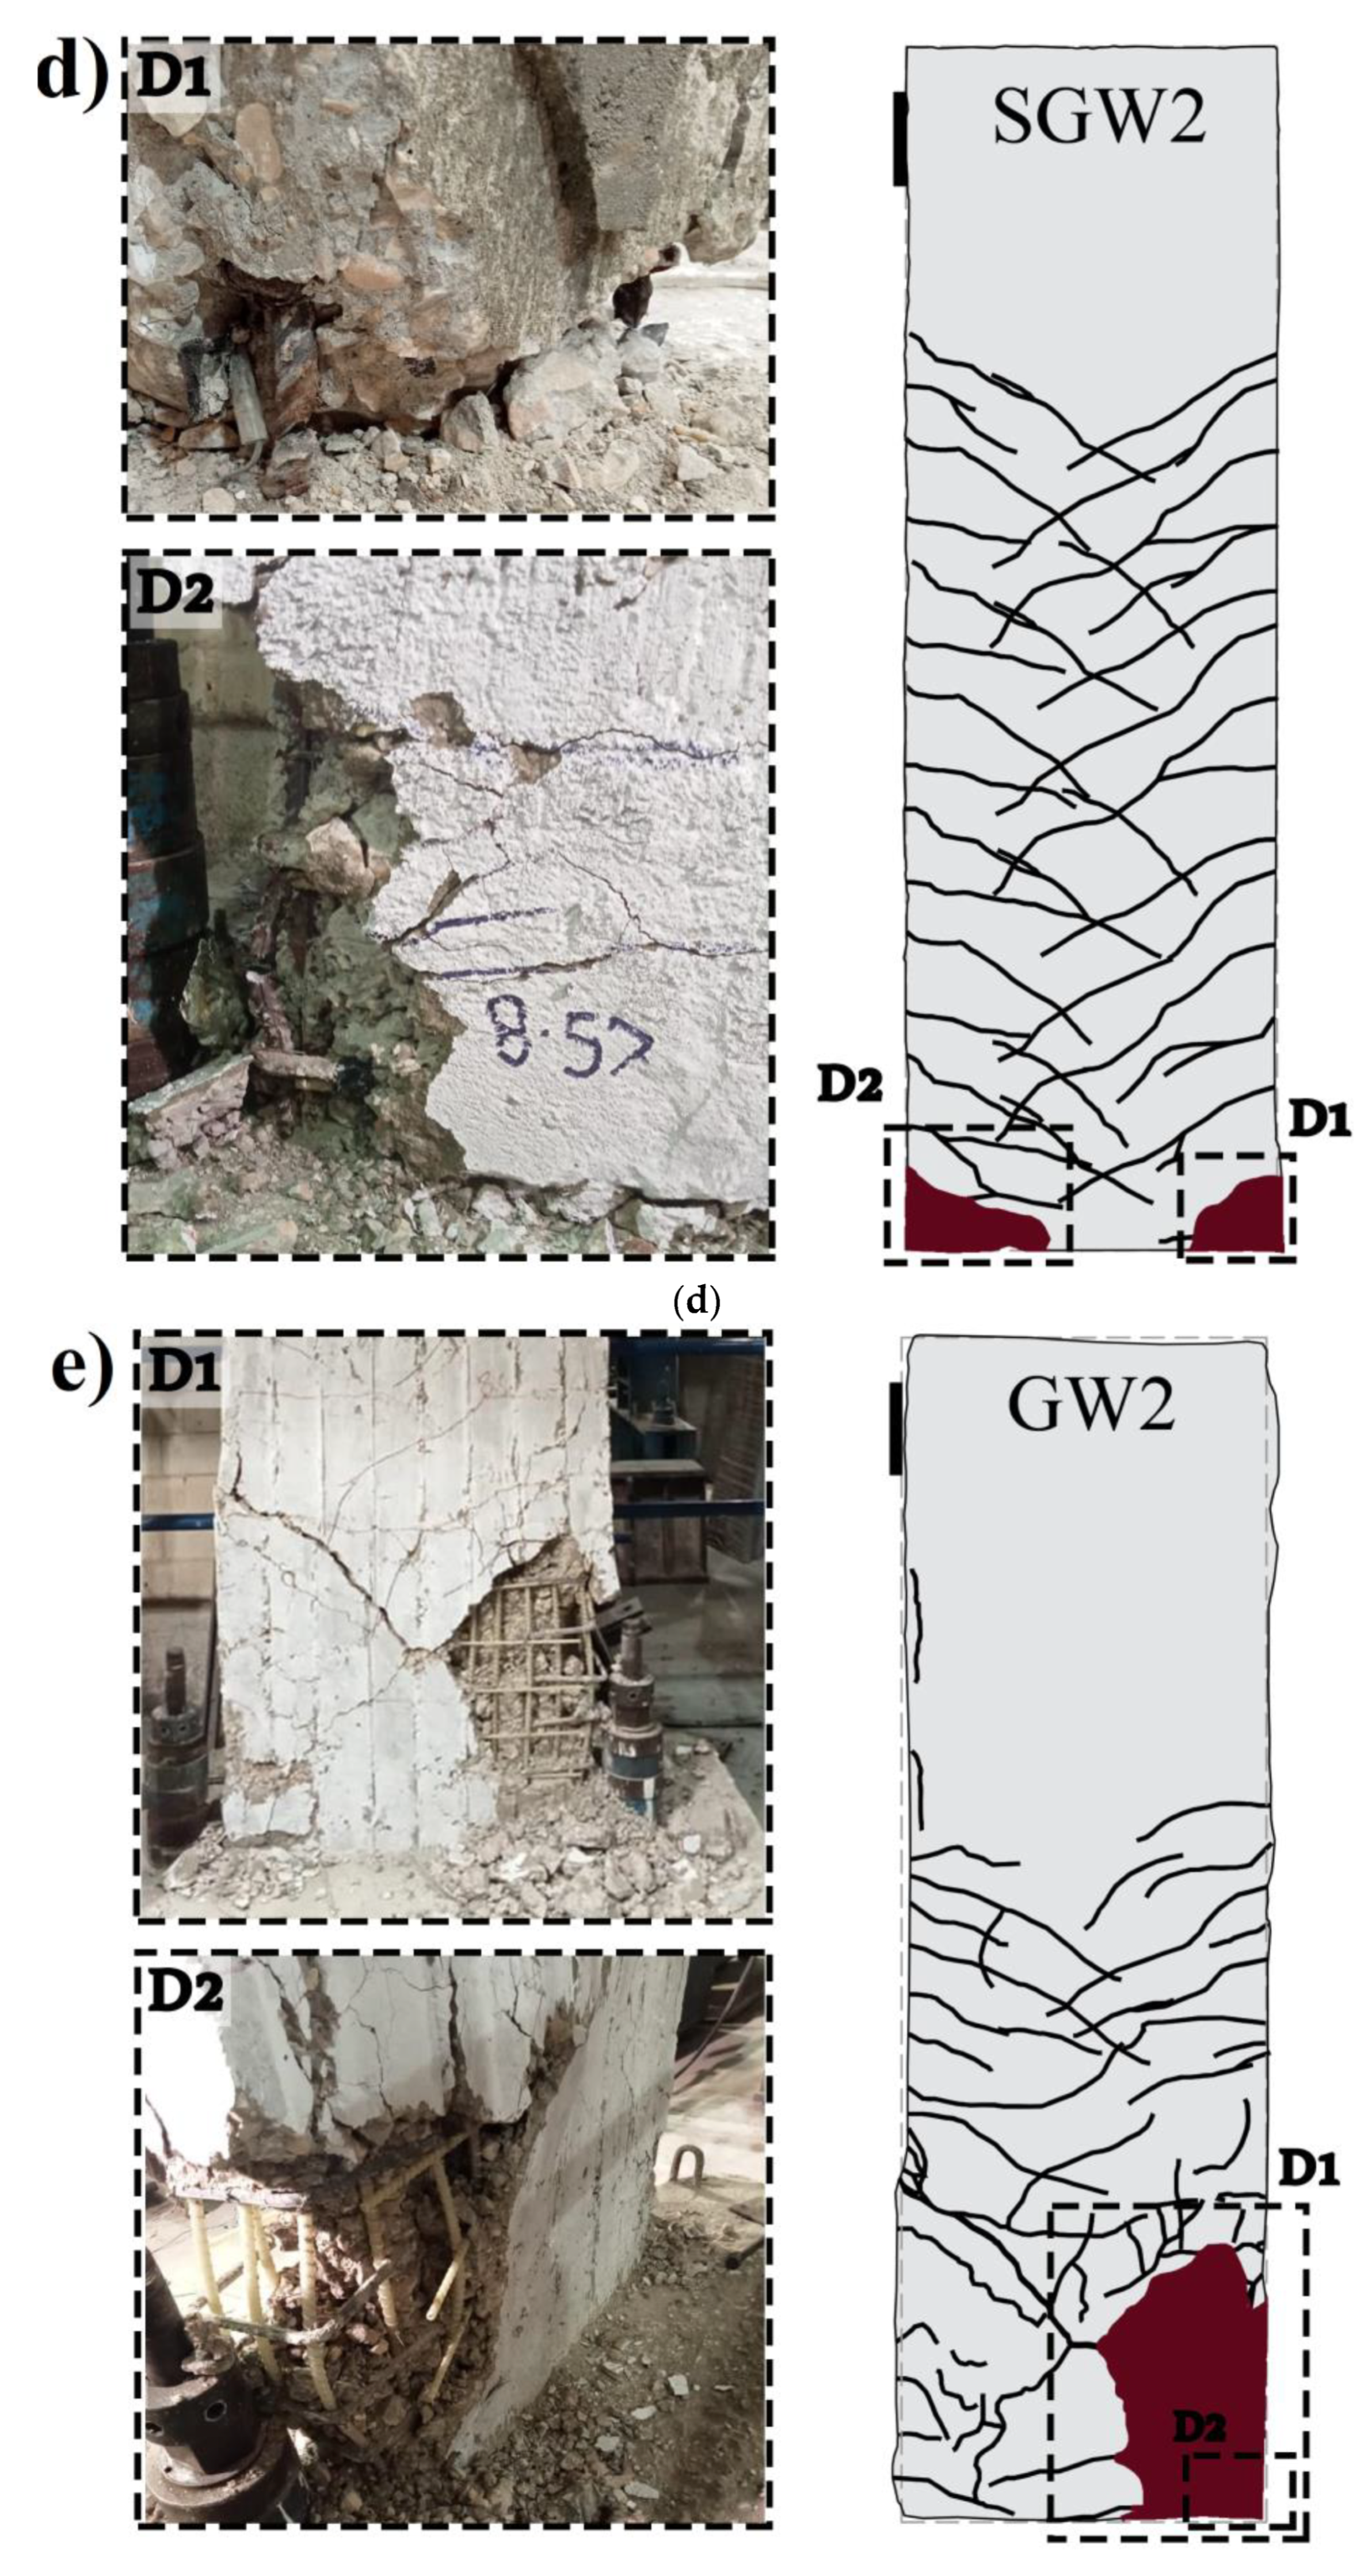
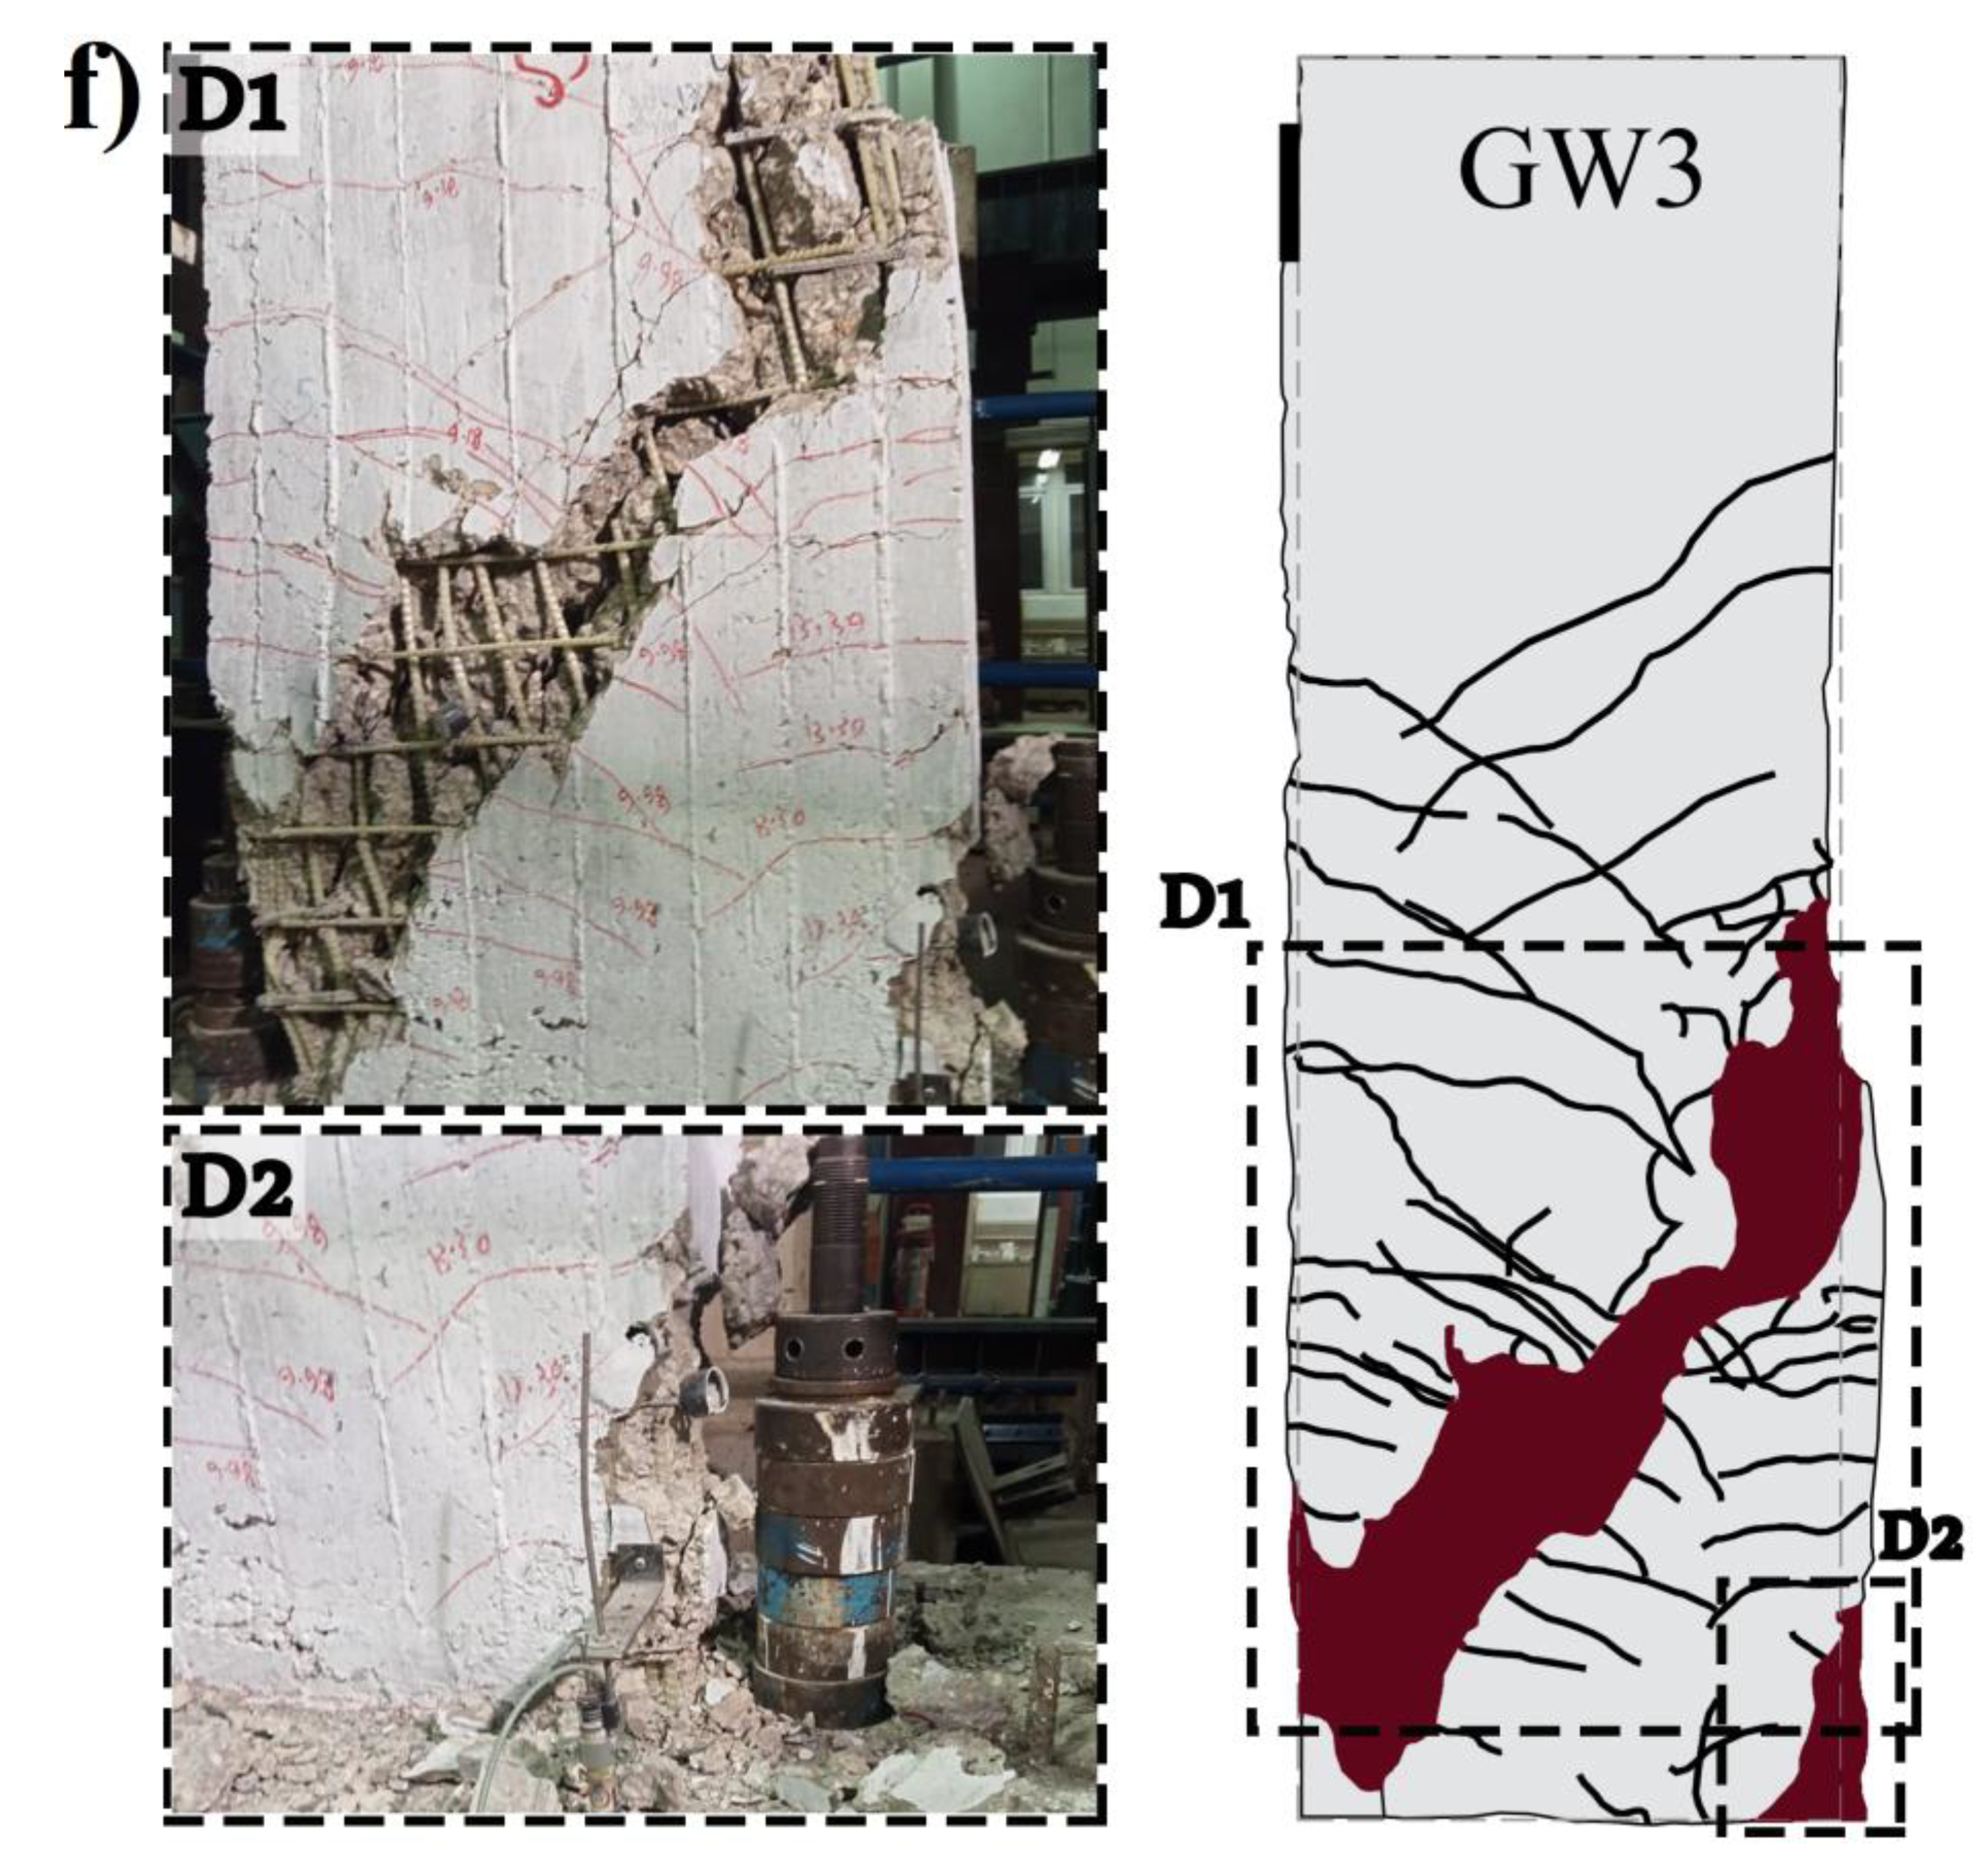
4.3. Crack Propagation and Failure Mode

In general, the behavior of all tested walls was dominated by a flexural response, as a typical number of horizontal cracks were formed up to a height of approximately 2 / 3 h w , and was accompanied by diagonal shear flexural cracking of the web without any premature shear or anchorage failure. The failure mode for all walls was characterized by horizontal cracking and concrete spalling, with flexural cracking then formed at the base cross-section due to the developing bending moment. As drift increased, spalling of the concrete cover became more significant on the compressed side of the wall, followed by buckling/rupture of the outermost vertical reinforcements bars and crushing of the concrete at the toes, as shown in Figure 7. The sliding shear failure mechanism was only observed in walls GW2 and GW3, where sliding shear deformations are developed after maximum strength due to the web’s diagonal cracking, as shown in Figure 7e,f.
An initial crack was observed for the steel-reinforced wall at 0.19% drift, as shown in the hysteresis loops for wall SW1 (Figure 6a). The initial yield at the outer steel bars was recorded at 65.86 kN, corresponding to 0.52% drift. The measured ultimate load ( Q u ) was 95.98 kN in the push and 98.39 kN in the pull loading direction, corresponding to a top displacement of 42.11 mm (1.61%) and 42.82 mm (1.64%), respectively. The wall achieved its maximum load at 3.1 Δ y during the push cycle, while in the pull loading direction, it reached its ultimate strength during the 3.16 Δ y loading cycle.
The wall’s strength then degraded rapidly in the push and pull cycles. Spalling of the concrete cover became more noticeable at the compression end of the wall attributed to longitudinal bar buckling as drift increased, and lateral resistance degradation became more pronounced. At 6.6 Δ y (3.43% top drift), vertical reinforcement bars fractured in the east end of the wall Figure 7a(D1). With additional loading, both concrete corners were heavily damaged at 6.7 Δ y (3.49% top drift), with the concrete crushed at both wall toes Figure 7b(D2).
For walls SGW1 and SGW2, the first crack occurred at 38.8% and 39.2% of the yield strength, Q y , respectively. The wall experimental yield loads were 79.87 kN and 93.25 kN corresponding to top displacements of 13.55 mm (0.52% top drift) and 17.15 mm (0.66% top drift) for walls SGW1 and SGW2, respectively. The ultimate strength of the wall SGW1 was recorded at 4.5 Δ y displacement level and was equal to 119.84 kN. At the same time, the ultimate strength of the wall SGW2 was recorded at 4.7 Δ y displacement level and was equal to 147.1 kN. At 6.5 Δ y (3.28% top drift), extensive concrete cover spalling was recorded near the mid-height of wall SGW1 in the east end of the wall, as shown in Figure 7b(D1). With further loading, lower concrete corners at the pull direction were heavily damaged, with the concrete crushing occurring at 7.62 Δ y (3.98% top drift), as shown in Figure 7b(D2). No fracture was observed for the steel bars of wall SGW1. However, as the wall approached 7.15 Δ y (4.72% top drift), the outermost vertical steel bars fractured in the tension side of wall SGW2, as shown in Figure 7d(D2), and concrete crushing occurred on both sides.
For GFRP-reinforced walls (GW1, GW2, and GW3), an average drift level of 0.23% was recorded for the crack initiation, slightly higher than that of wall SW1. Subsequently, concrete cover splitting was gradually initiated at the outmost heavily compressed wall toe at 1.73%, 1.93, and 2.23 drift for walls GW1, GW2, and GW3, respectively. At higher lateral drift of 2.66%, 2.78, and 2.97 for walls GW1, GW2, and GW3, respectively, concrete cover spalling occurred. As loading continued, the walls carried the load in each cycle with no degradation till concrete crushing and longitudinal GFRP bar fracture occurred, which caused wall brittle failure without a considerable decrease in the recorded walls’ strength. Figure 7c,e,f show the crack pattern and failure mode of the GFRP-reinforced walls, addressing that higher crack propagation and brittle failure was attained for higher GFRP-reinforcement ratios. Diagonal web shear cracking was clearly formed in wall GW2 and GW3 after reaching their maximum strength, followed by sliding shear deformations, and then sudden brittle failure occurred, as shown in Figure 7e(D1) and Figure 7f(D1). The maximum strength of wall GW1 was recorded at 0.73 Δ m a x displacement level and was equal to 92.02 kN, while the maximum strengths of walls GW2 and GW3 were recorded at 83.79 Δ m a x and 0.92 Δ m a x displacement levels and were equal to 156.67 kN and 180.93 kN, respectively. Table 4 provides a summary of the failure progression of the tested walls.

5. Analysis of Experimental Results

5.1. Envelope Curves

The envelope curves of load–drift and moment–rotation response are presented and compared for all tested walls in Figure 8. Prior to cracking, all walls exhibited almost the same initial curve slope. Due to the higher initial stiffness of steel bars, the slope of the steel-reinforced walls (SW1, SGW1, and SGW2) curves is greater than that of the GFRP-RC walls. With further displacement, steel-reinforced walls showed higher ductile capability and lower ultimate drift compared to the GFRP-RC walls. The increase in the drift ratios of the GFRP-RC walls was due to the linear elastic behavior of GFRP bars. The progressive cracking and damage resulted in the degradation of both strength and stiffness for all walls as deformation and the number of cycles imposed increased.
Steel-reinforced wall SW1 underwent first cracking and achieved its ultimate strength at relatively lower displacements. Wall SGW1 had almost the same lateral load resistance as wall SW1. However, a higher displacement level corresponding to the ultimate load capacity was attained in wall SW1 due to the linear elastic behavior of the presence of GFRP bars. Wall SGW2 had a higher yielding load level than wall SGW1 due to the higher reinforcement ratio. Additionally, by increasing the reinforcement ratio, higher lateral load capacity was obtained for wall SGW2 compared to SGW1.
A slight reduction of 6.4% was obtained in the ultimate lateral strength of GFRP-RC wall GW1 compared to wall SW1. However, a higher displacement level of wall GW1 was achieved at the ultimate recorded load as wall GW1 reached its maximum strength at 0.73 Δ m a x displacement level compared to 0.46 Δ m a x for wall SW1. Comparing walls GW2 and GW3 with wall GW1, it was confirmed that the lateral load capacity increases by increasing the GFRP reinforcement ratios, and higher displacement is obtained. A softened response of GFRP-reinforced walls was exhibited at a higher lateral load with the propagation of cracks that closed and realigned after each cycle. Even after severe cracking, each wall retained its lateral load capacity as displacement levels increased without strength decay, which also can be attributed to the linear elastic behavior of GFRP bars.

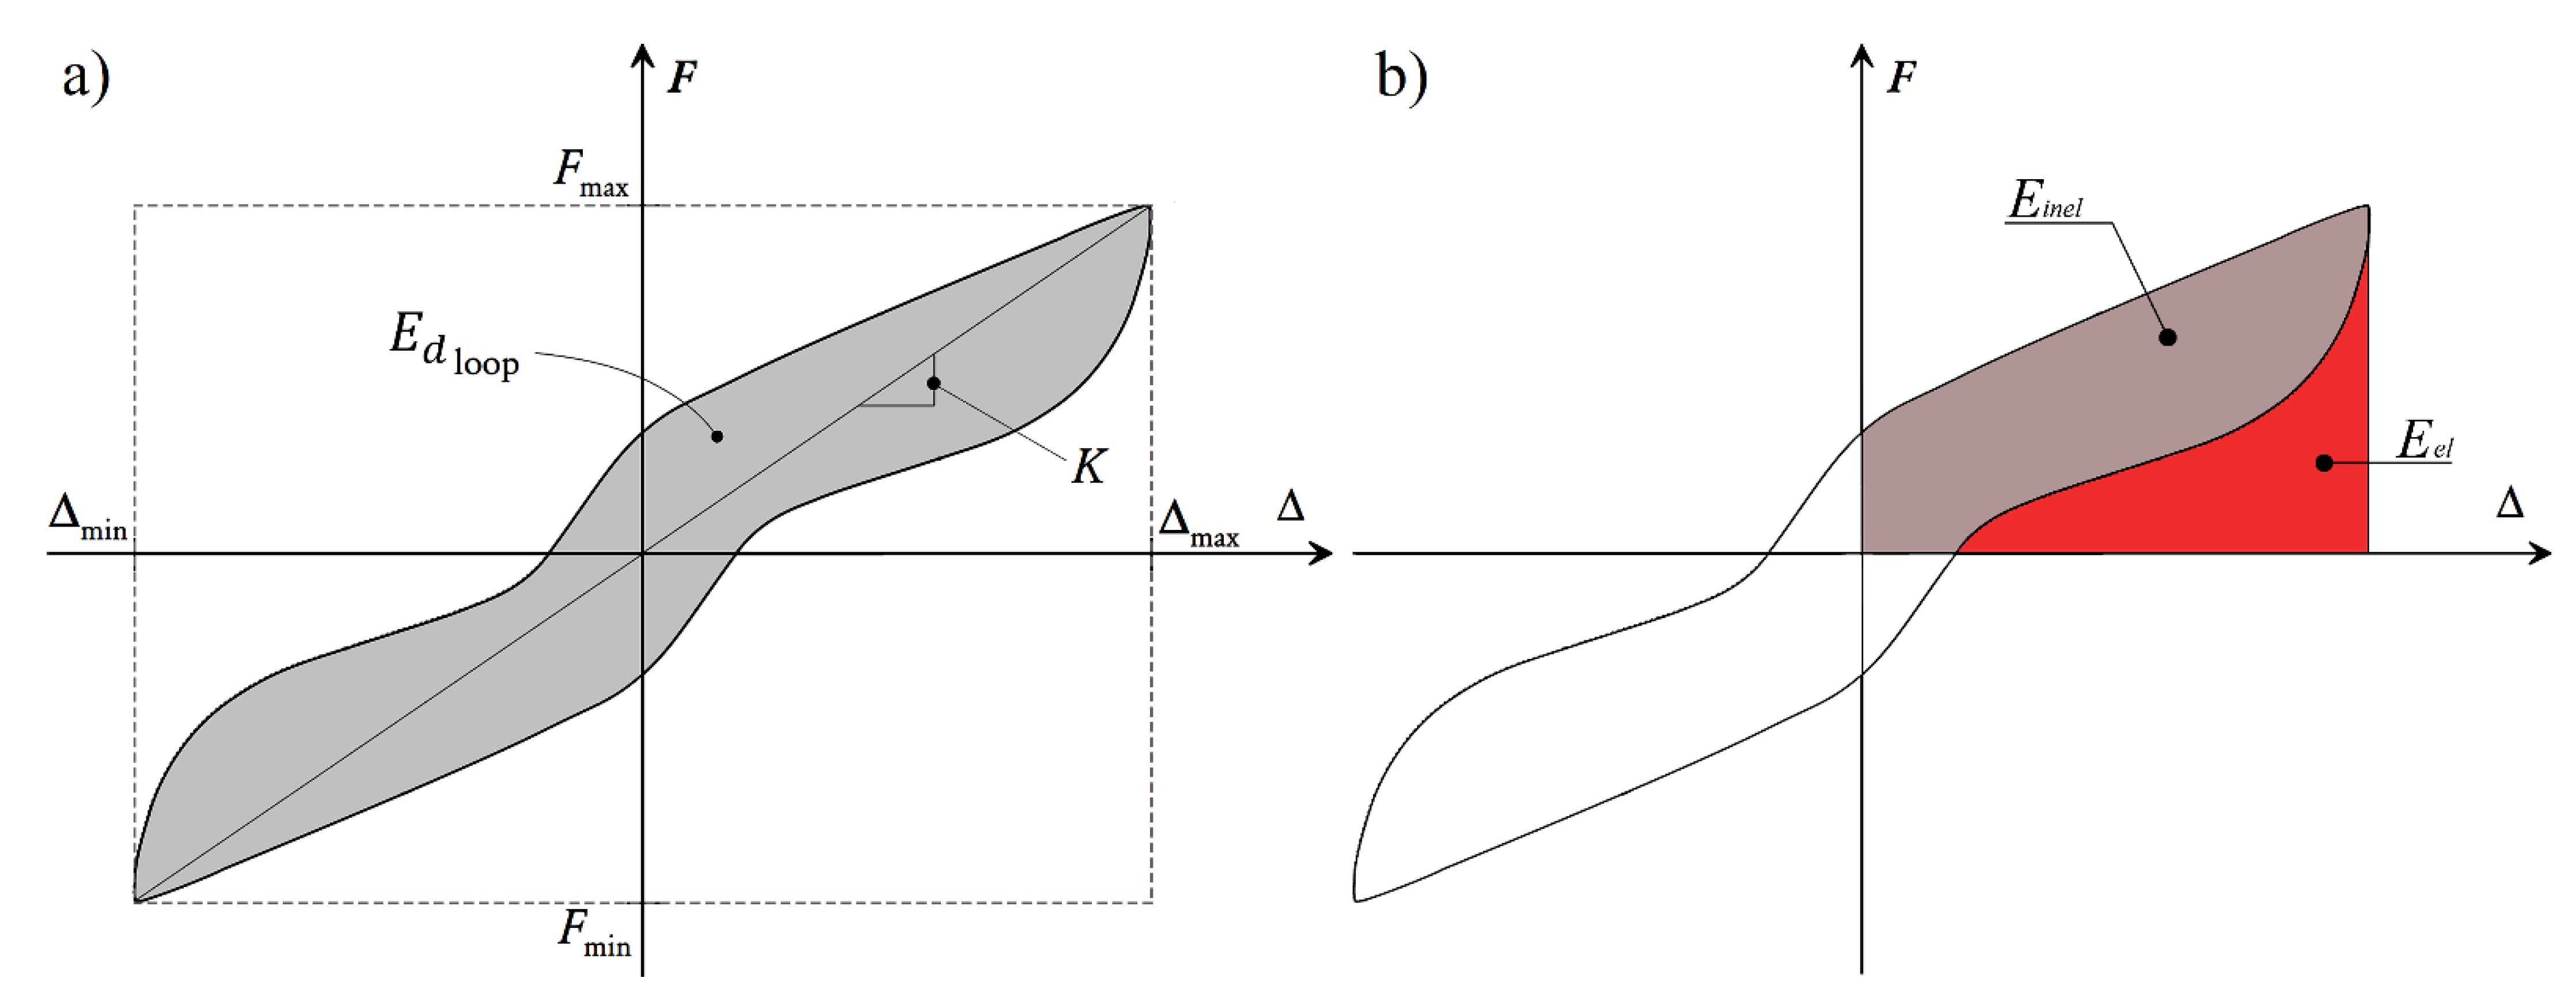
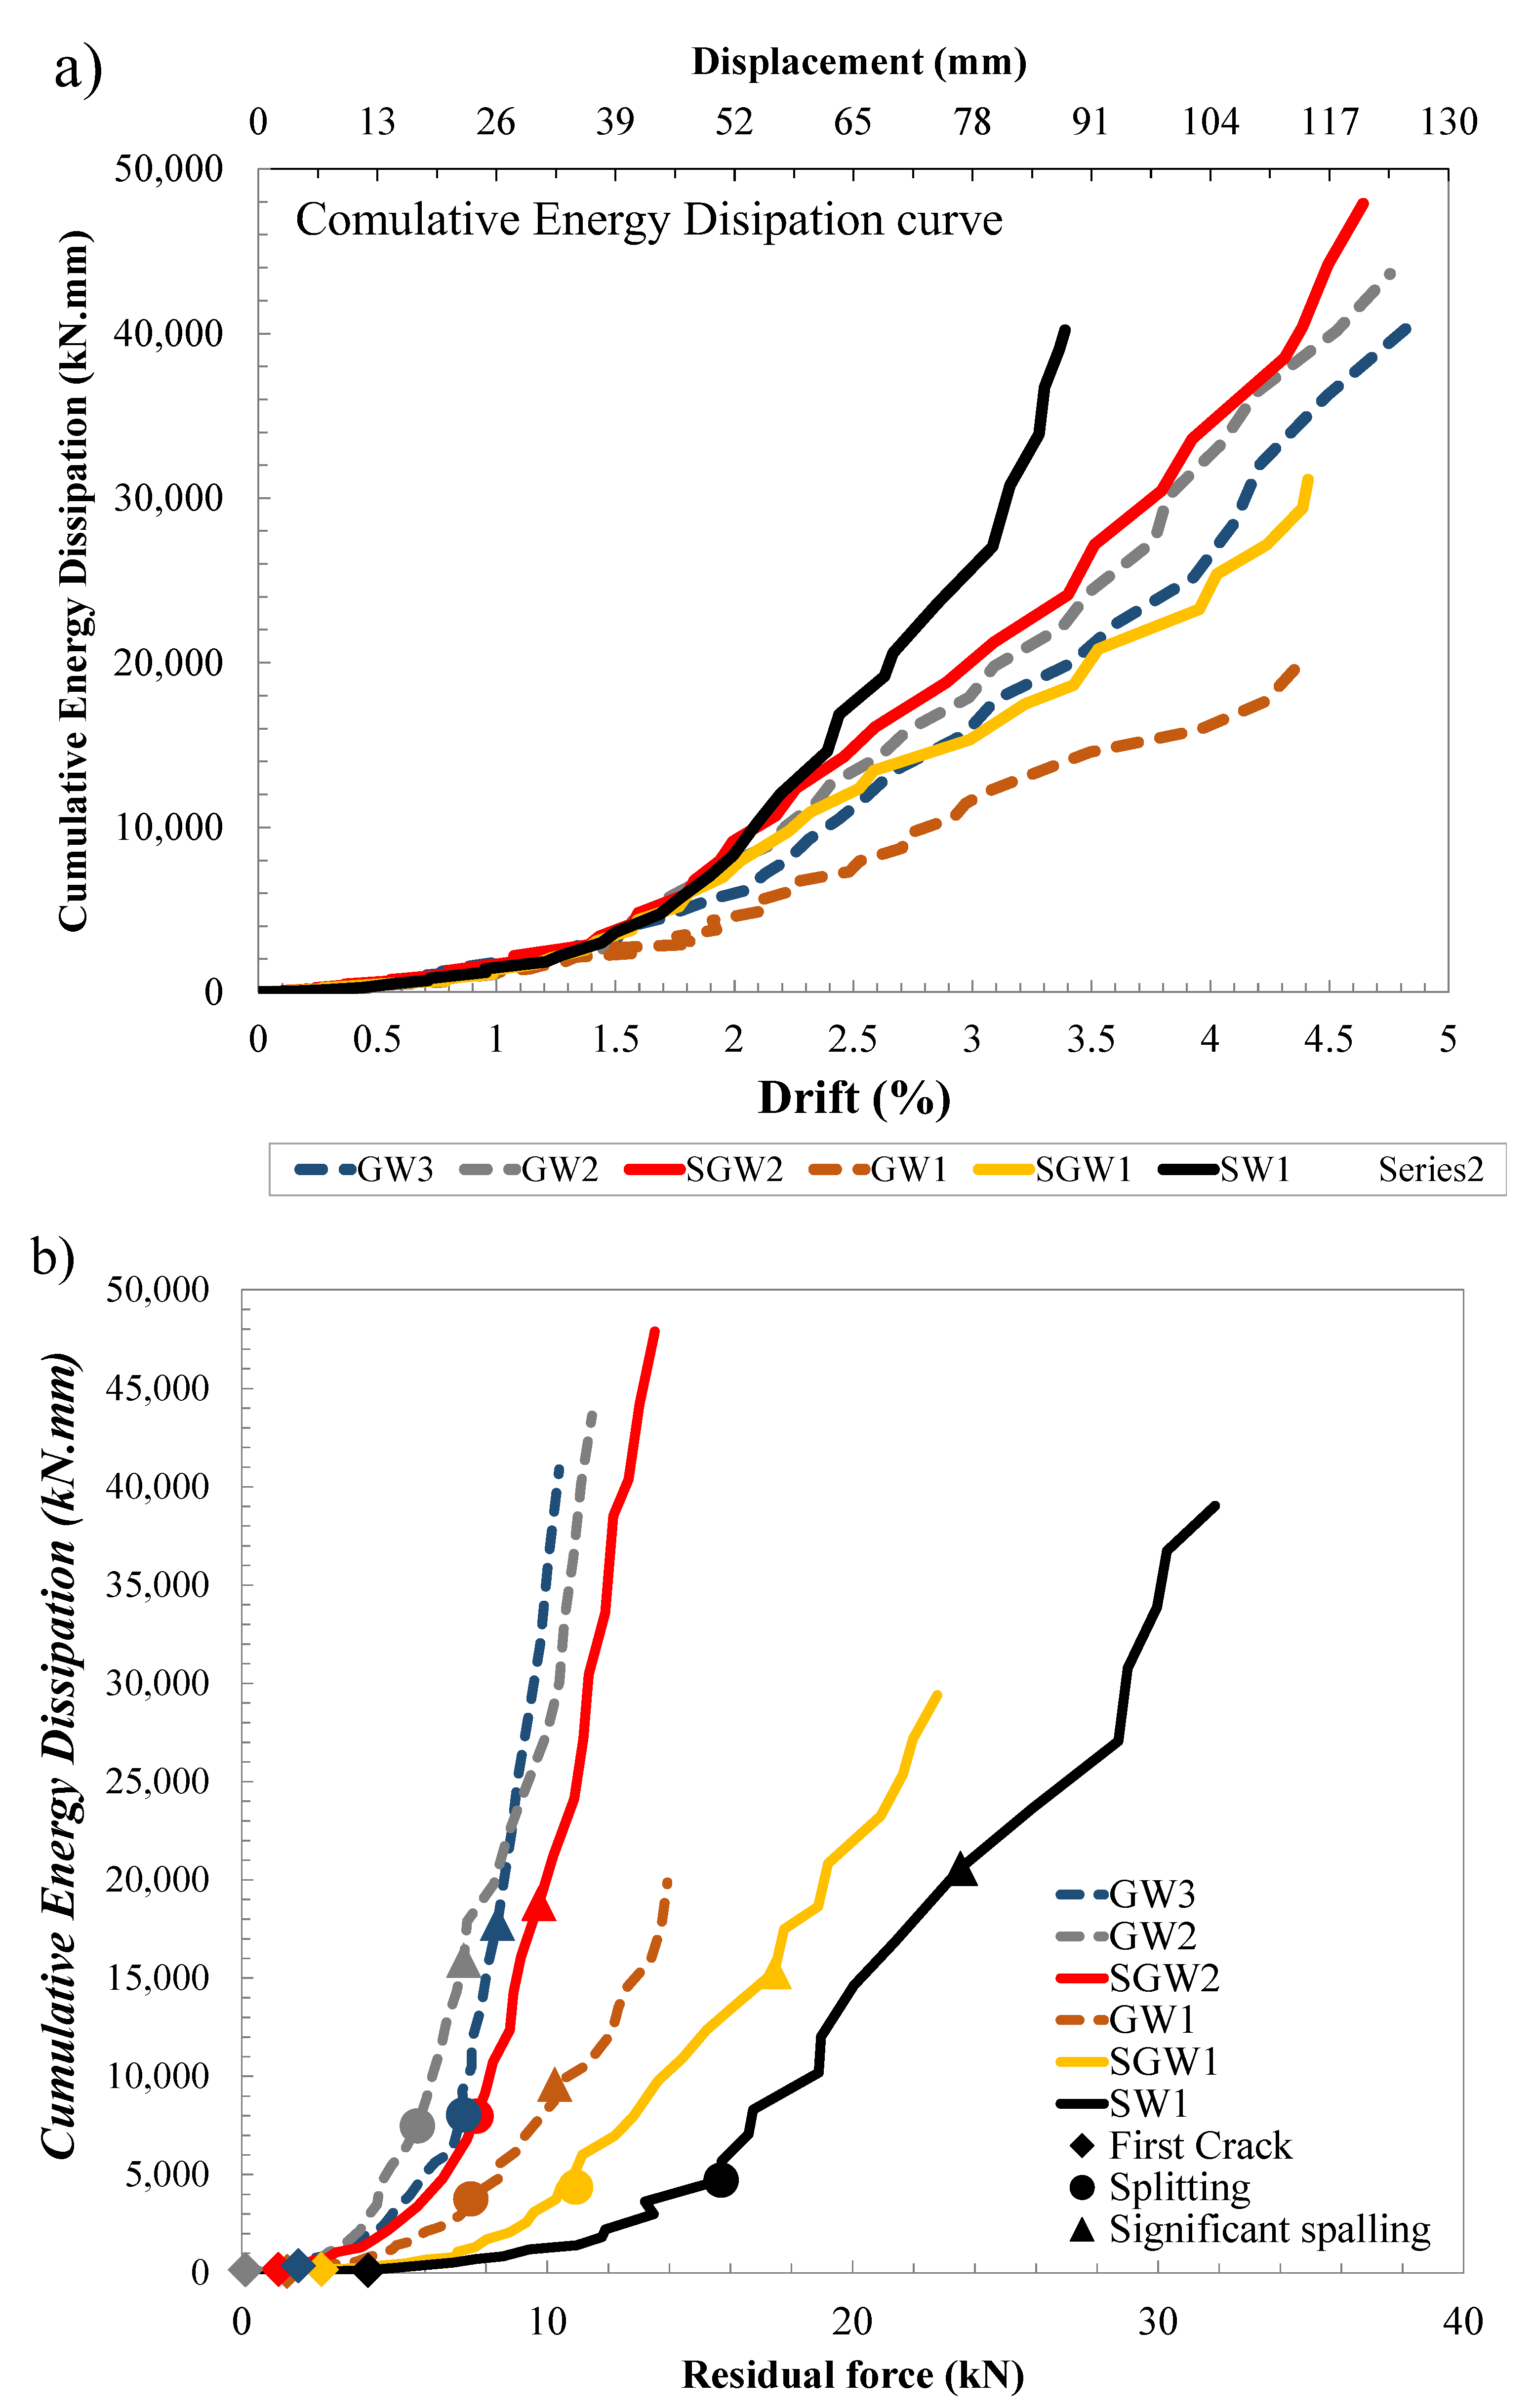
5.2. Energy Dissipations

The capability of energy dissipation through hysteretic damping is defined as the ability of a structural system to dissipate earthquake energy through the formation of inelastic deformations [50,51,52]. The energy dissipation capacity of the tested walls was evaluated using cumulative energy dissipation. In general terms, the dissipated energy E d during hysteresis is given by the integral E d = F d Δ . To obtain E d , this integral was evaluated from the measured F and Δ data vectors by the summation of the enclosed area by the hysteresis loop at each loading increment, as shown in Figure 9. In order to calculate the cumulative energy dissipation, the dissipated energy by each consecutive cycle was summed up to the dissipated energy by the previous cycles.
Figure 10 shows that lower energy dissipation is attained in the early cycles for drifts lower than 1.0% owing to the relatively low residual displacement of the walls to this drift level. As loading progressed, a further increase of the dissipated energy can be observed for all walls with respect to an increase in drift level. At moderate damage level, cumulative dissipated energy reached 4736 kN.mm (corresponding to 1.44% drift) for the steel-reinforced wall (SW1), 3779 kN.mm (corresponding to 1.73% drift) for the GFRP-reinforced wall (GW1), and 4378 kN.mm (corresponding to 1.55% drift) for wall SGW1 that was reinforced with steel and GFRP bars. For more significant drift levels, a higher increasing rate of energy dissipation for the steel-reinforced wall was evident due to the plastic deformation of deformed steel bars and extensive damage formed beyond drift levels corresponding to concrete cracking and yielding of steel bars.
Conversely, due to the elastic behavior of GFRP bars, a lower rate of energy dissipation is observed in GFRP-reinforced walls since the energy dissipated is controlled by the deformability of the concrete. Thus, it can be concluded that steel-reinforced shear walls had a higher energy dissipation capacity than GFRP-reinforced walls. At failure, the total dissipated energy of the GFRP-reinforced wall (GW1) was approximately 49.41% of that dissipated by the steel-reinforced bar (SW1), where 40,204, 31,119, and 19,865 kN.mm dissipated energies were achieved for walls SW1, SGW1, and GW1, respectively. By increasing the reinforcement ratios, an increase in cumulative dissipated energy was observed: 47,882, 43,621, and 40,893 kN.mm for walls SGW2, GW2, and GW3, respectively. This increase in energy dissipation capacity was dissipated through more cycles because of the higher achieved displacement levels and the higher load capacity gained, which particularly contributed to its extended energy dissipation capacity.
The residual forces at the end of each displacement cycle were also plotted against the cumulative energy dissipation (Figure 10b) for further assessment of the effectiveness of the energy dissipation of the GFRP-reinforced walls. At moderate damage level, corresponding to cover splitting, walls SW1, SGW1, and GW1 experienced relatively similar energy dissipation. At later drift levels, a lower increasing rate of residual force was attained for the GFRP-reinforced walls corresponding to their elastic behavior, besides their higher capability of self-centering behavior [36,50]. However, beyond the initiation of the plastic deformation of deformed steel bars, steel-reinforced walls experienced a higher increasing rate in residual force leading to the increase in energy dissipation. By comparing walls SGW1 and SGW2, as well as walls GW1, GW2, and GW3, the smaller residual force was clearly evident due to the higher GFRP reinforcement ratio.

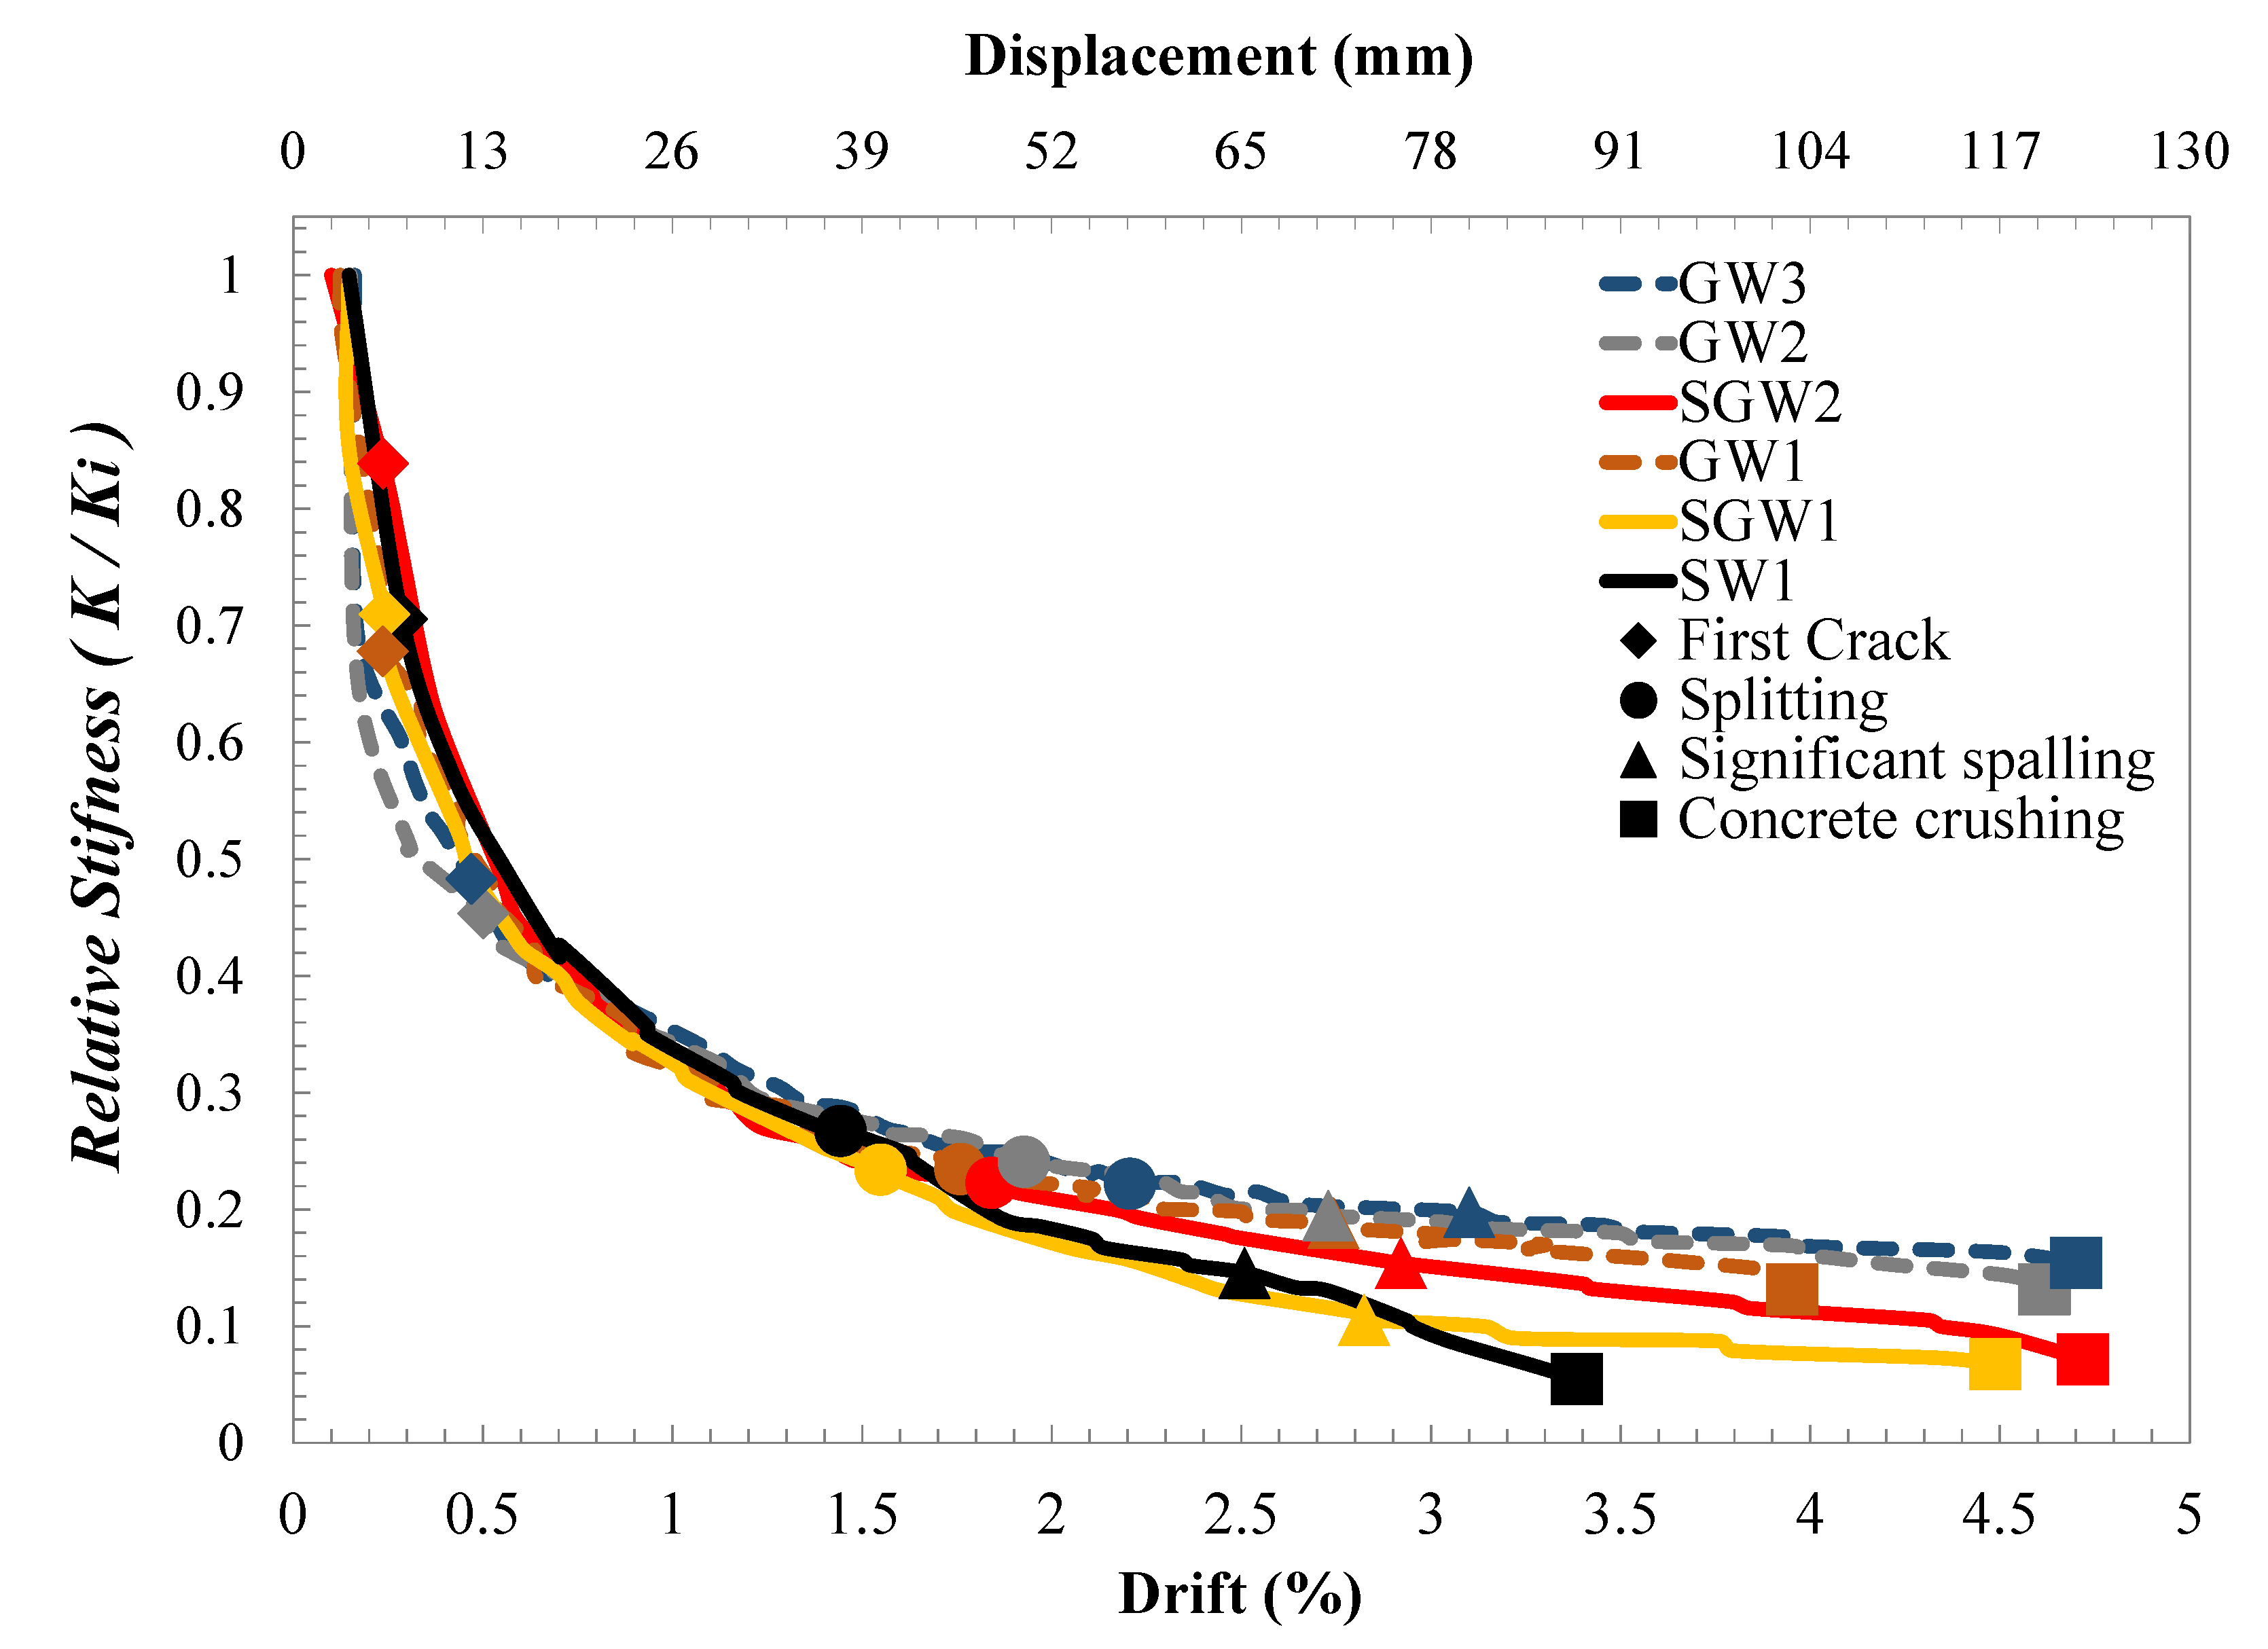
5.3. Stiffness Degradation

At each drift level, the effective secant stiffness was calculated and normalized to the initial uncracked stiffness, K i n i t , to assess the stiffness degradation over the consecutive loading cycles. The initial stiffness was calculated as secant for the first load step, while the effective secant stiffness of each following cycle, K s , i , was obtained (Equation (10)) by computing the slope of the straight line passing through the corner points of the bounding box of each loop, as shown in Figure 9.
K s , i = + F i + F i + Δ i + Δ i
where + F i and F i donate the maximum lateral loads of the i t h loading cycle in the push and pull directions, respectively, and + Δ i and Δ i are the corresponding displacements to + F i and F i , respectively.
The normalized stiffness was then plotted against the drift at different cycles in Figure 11. A similar stiffness degradation pattern in all specimens was observed for all walls where considerable stiffness degradation eventuated as higher deformations were imposed, but at higher rates in the GFRP-reinforced walls than those of the steel-reinforced. Upon first cracking of steel-reinforced walls, on average, 29.5%, 31%, and 36.3% reductions of K i n i t were attained for SW1, SGW2, and SGW3 walls, respectively, while the secant stiffness of the GFRP-reinforced walls rapidly degraded reaching, on average, 33.5%, 34.8%, and 34.9% for GW1, GW2, and GW3 walls, respectively. At drift level corresponding to the splitting of concrete cover, which is considered moderate damage level, steel-reinforced wall (SW1), GFRP-reinforced wall (GW1), and wall SGW1 that had been reinforced by a combination of steel and GFRP bars had almost similar stiffness ratios of 24%, 22.8%, and 22.5%, respectively. As loading progressed, further degradation occurred to remain at relatively low values of approximately 5%, 7%, and 13% of K i for walls SW1, SGW1, and SGW2, respectively. Moreover, the stiffness ratios kept decreasing, but at lower rates, for walls GW1, GW2, and GW3, reaching 9%, 14%, and 17%, respectively.
The higher stiffness degradation rate of steel-reinforced walls was due to the severe damage that occurred after yielding, affecting the walls’ ability to sustain the much-imposed load. However, the GFRP-reinforced walls exhibited a softener response with severe concrete damage as a result of the low modulus of elasticity of GFRP bars, allowing the walls to sustain higher deformation, at advanced loading levels, till failure.

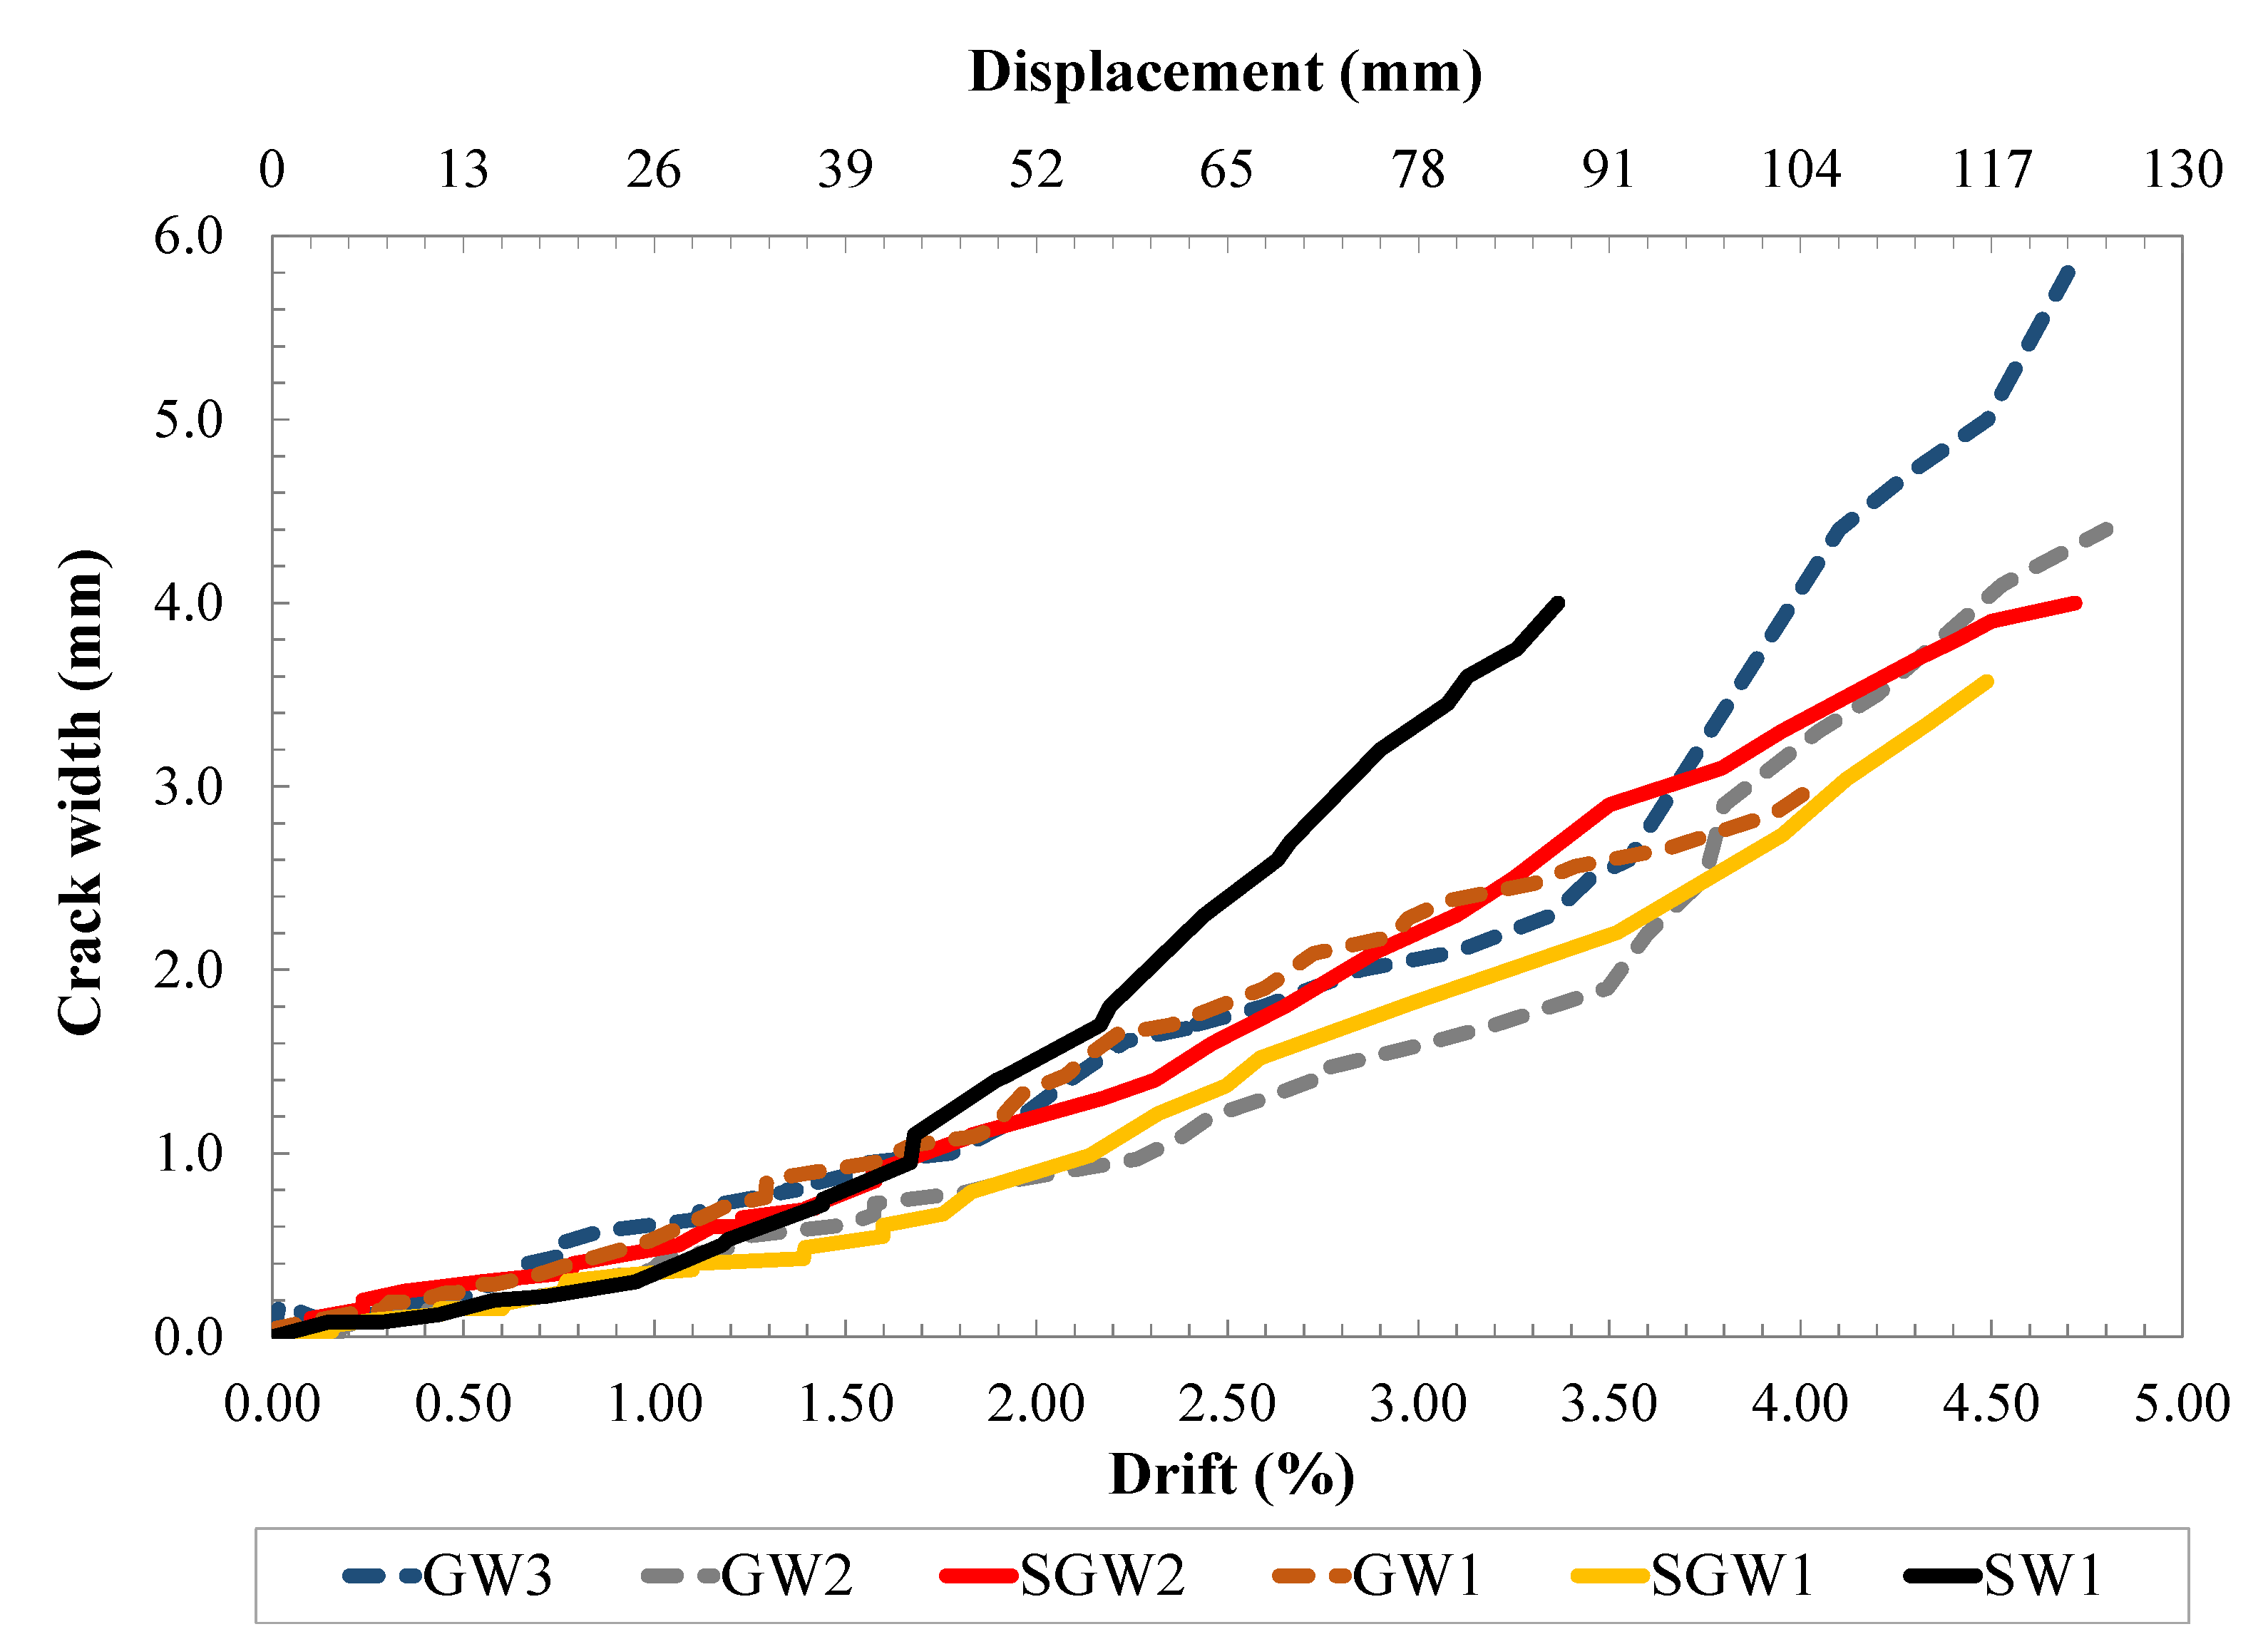
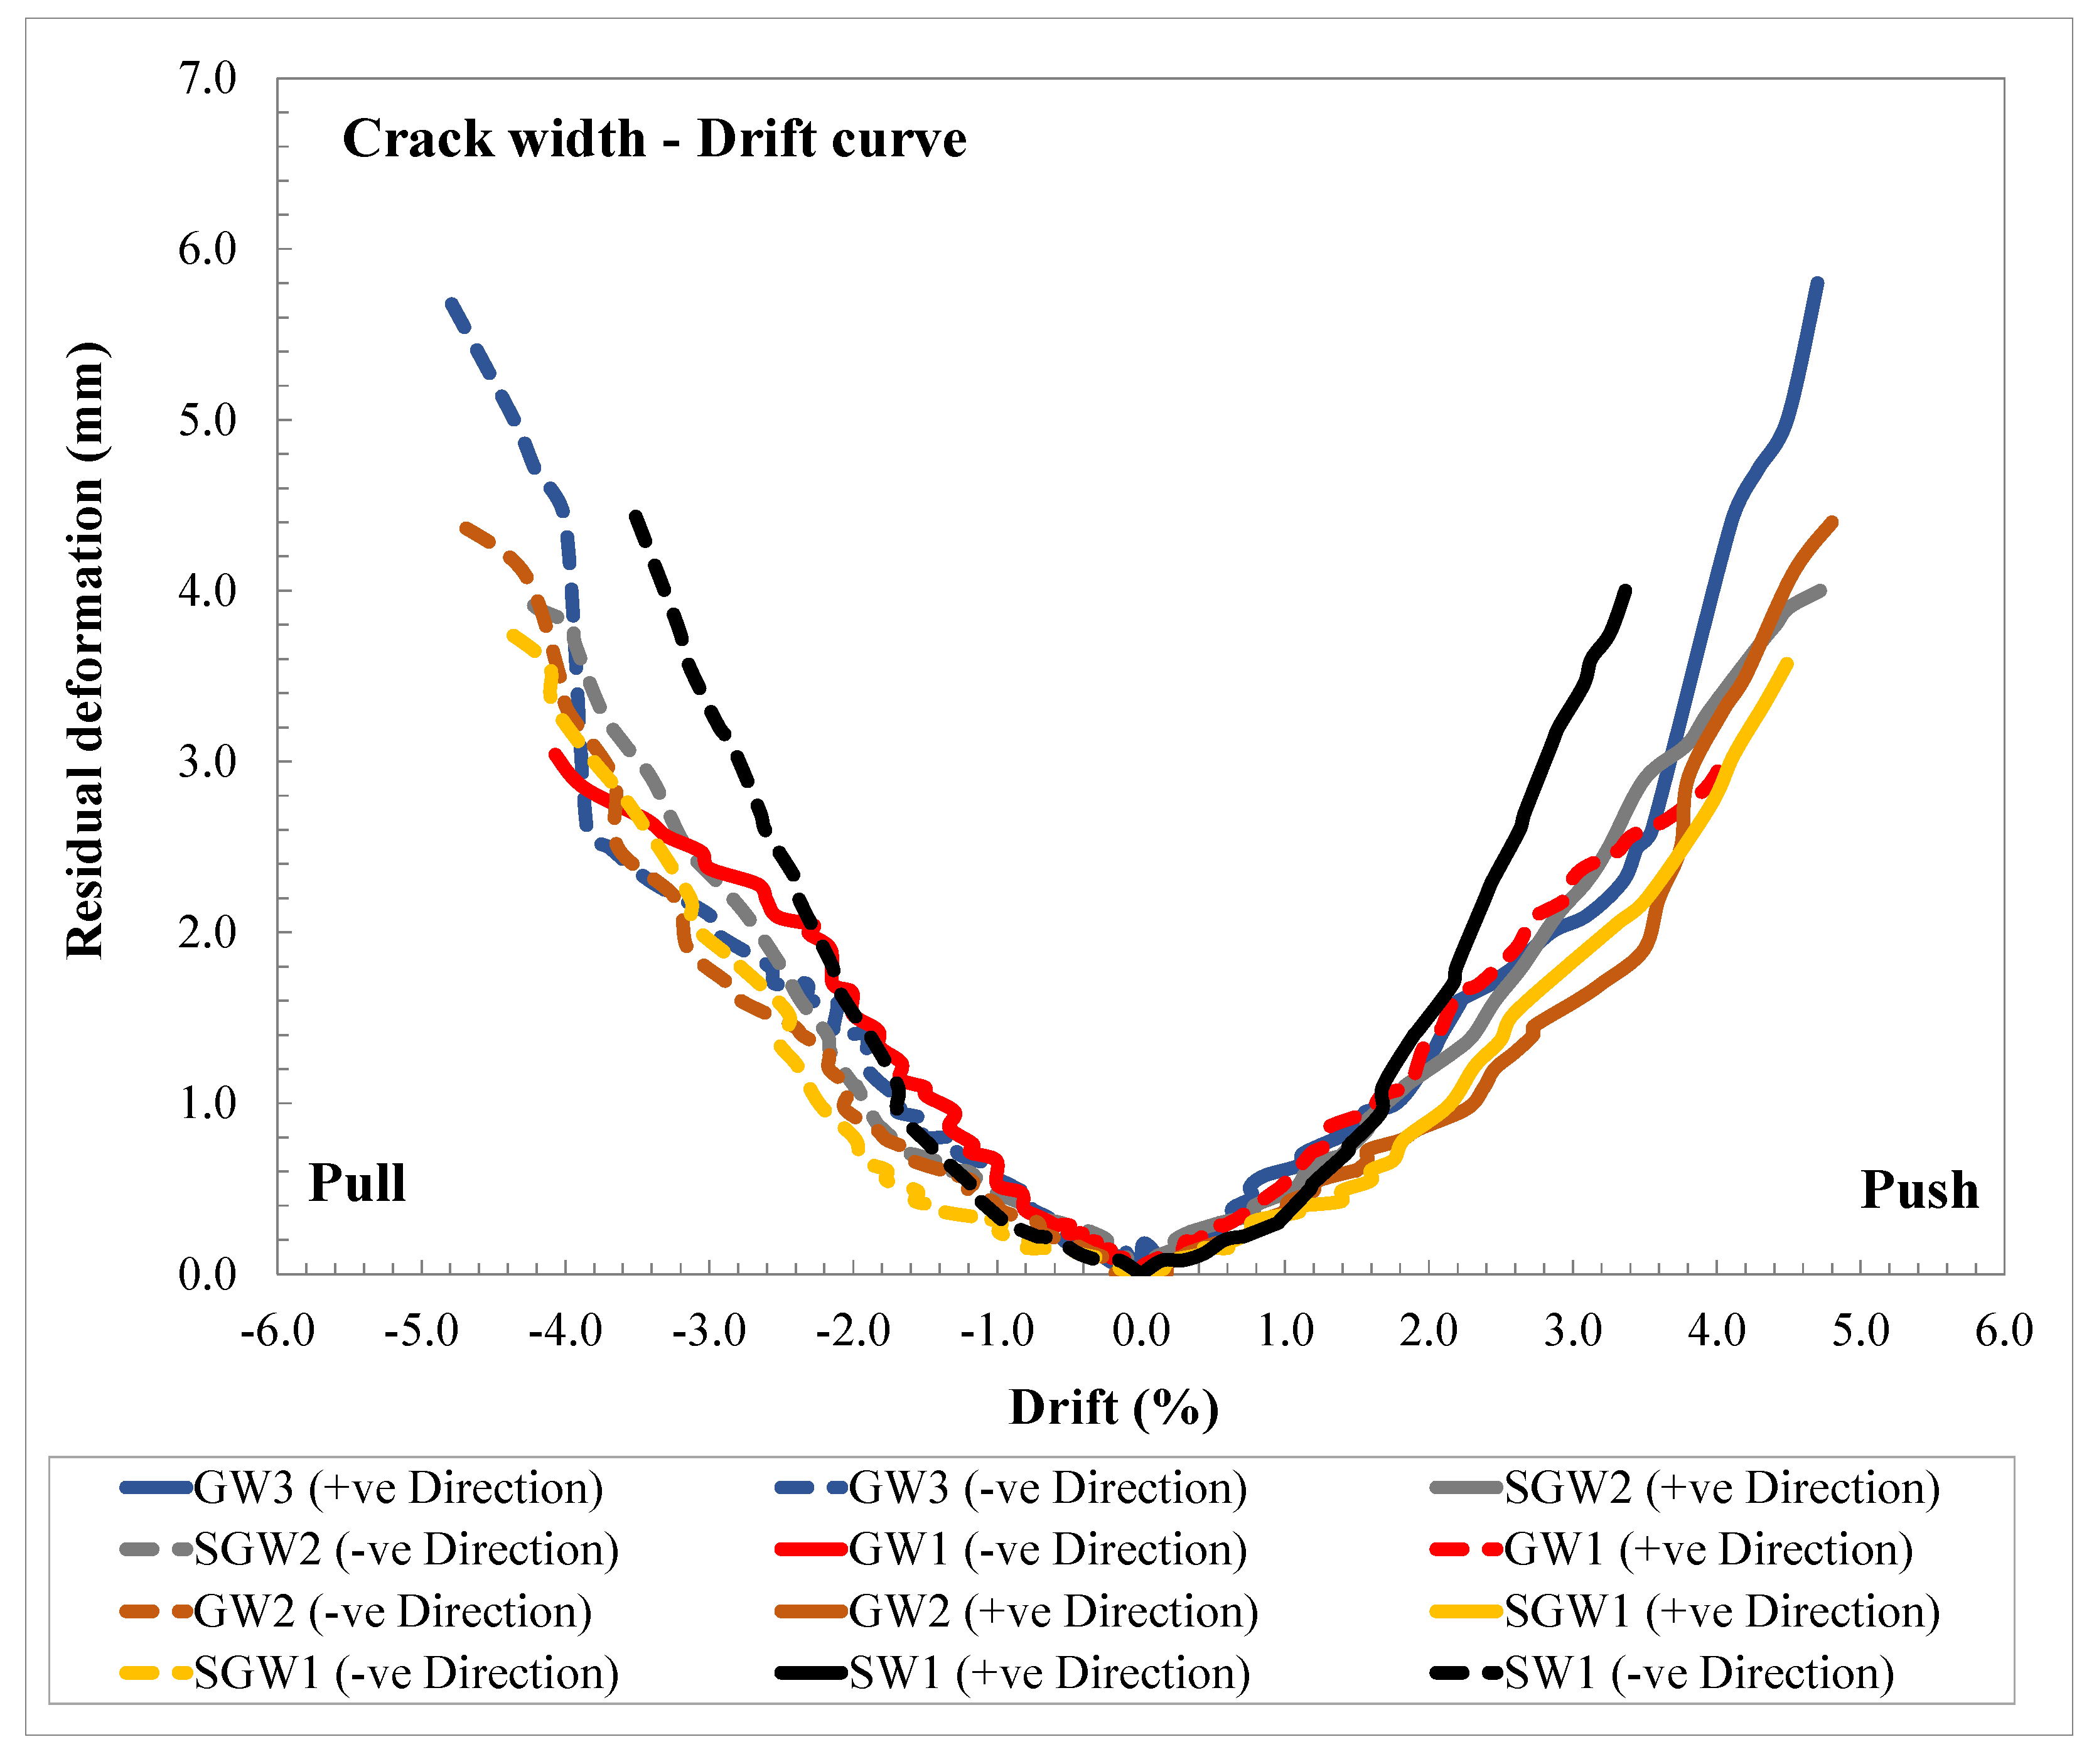
5.4. Crack Width and Residual Deformation

The envelope of measured crack widths w c r for all tested walls is illustrated in Figure 12. The steel-reinforced wall experienced a lower damage rate due to its initially stiff behavior with an elastic response and, consequently, lower crack widths were measured before yielding drift level. A 0.1 mm initial crack width was observed for wall SW1 at 0.19% drift. Moreover, walls SGW1 and SGW2 also had similar initial behavior to wall SW1, where lower crack widths were measured at an early loading stage. Initial crack widths of 0.12 mm and 0.16 mm, corresponding to 38.8% and 39.2% of the yield strength, were monitored for walls SGW1 and SGW2, respectively. In comparison, GFRP-reinforced walls had slightly higher widths for the initial cracks, with an almost linear increase of crack widths up to spalling of concrete at advanced loading levels due to the elastic behavior of GFRP bars. The first cracks observed for walls GW1, GW2, and GW3 were 0.14, 0.18, and 0.19 mm wide, respectively. A significant increase in crack width was attained for wall SW1 as the lateral load increased, associated with the yielding of outermost longitudinal steel bars and spalling of the concrete cover at the compression end of the wall. However, walls SGW1 and SGW2 experienced a lower rate of increased crack width due to the presence of GFRP bars. As loading progressed upon the severe damage level corresponding to the buckling of steel bars and spalling of concrete cover, crack widths of 3.1, 1.9, and 2.1 mm (corresponding to 2.91, 3.05, and 3.1% drift) were measured for walls SW1, SGW1, and SGW2, respectively. Although walls with GFRP bars as primary reinforcement had lower crack widths, distributed at the height of the wall, at concrete spalling damage level compared with steel-reinforced walls, GW2 and GW3 walls experienced a sudden increase of crack widths at failure due to the induced brittle failure and formed diagonal web shear cracking.
The variation of residual displacement at increased loading of each cycle was also plotted against the drift in Figure 13 to assess the displacement recovery capacity versus imposed lateral drift of the tested walls. Steel-reinforced wall (SW1) exhibited significantly increased residual displacement attributed to the high plastic deformation of steel bars. Conversely, the GFRP-reinforced bars exhibited significantly reduced residual displacement relative to the reference wall, SW1. For instance, the residual deformation of the reference wall (SW1) at drift level corresponding to concrete spalling (2.62% drift) is 26.94 mm, which is reduced by 46.8%, 75.6%, and 76.3% in specimens GW1, GW2, and GW3, respectively. Moreover, walls SGW1 and SGW2 showed lower residual deformation of 12.32% and 27.5%, respectively, compared to wall SW1 due to the GFRP bars distributed at the walls’ web. This reduction in residual deformation shows that GFRP reinforcement effectively controls the permanent deformation of shear walls, thus enhancing the seismic resilience of the walls.

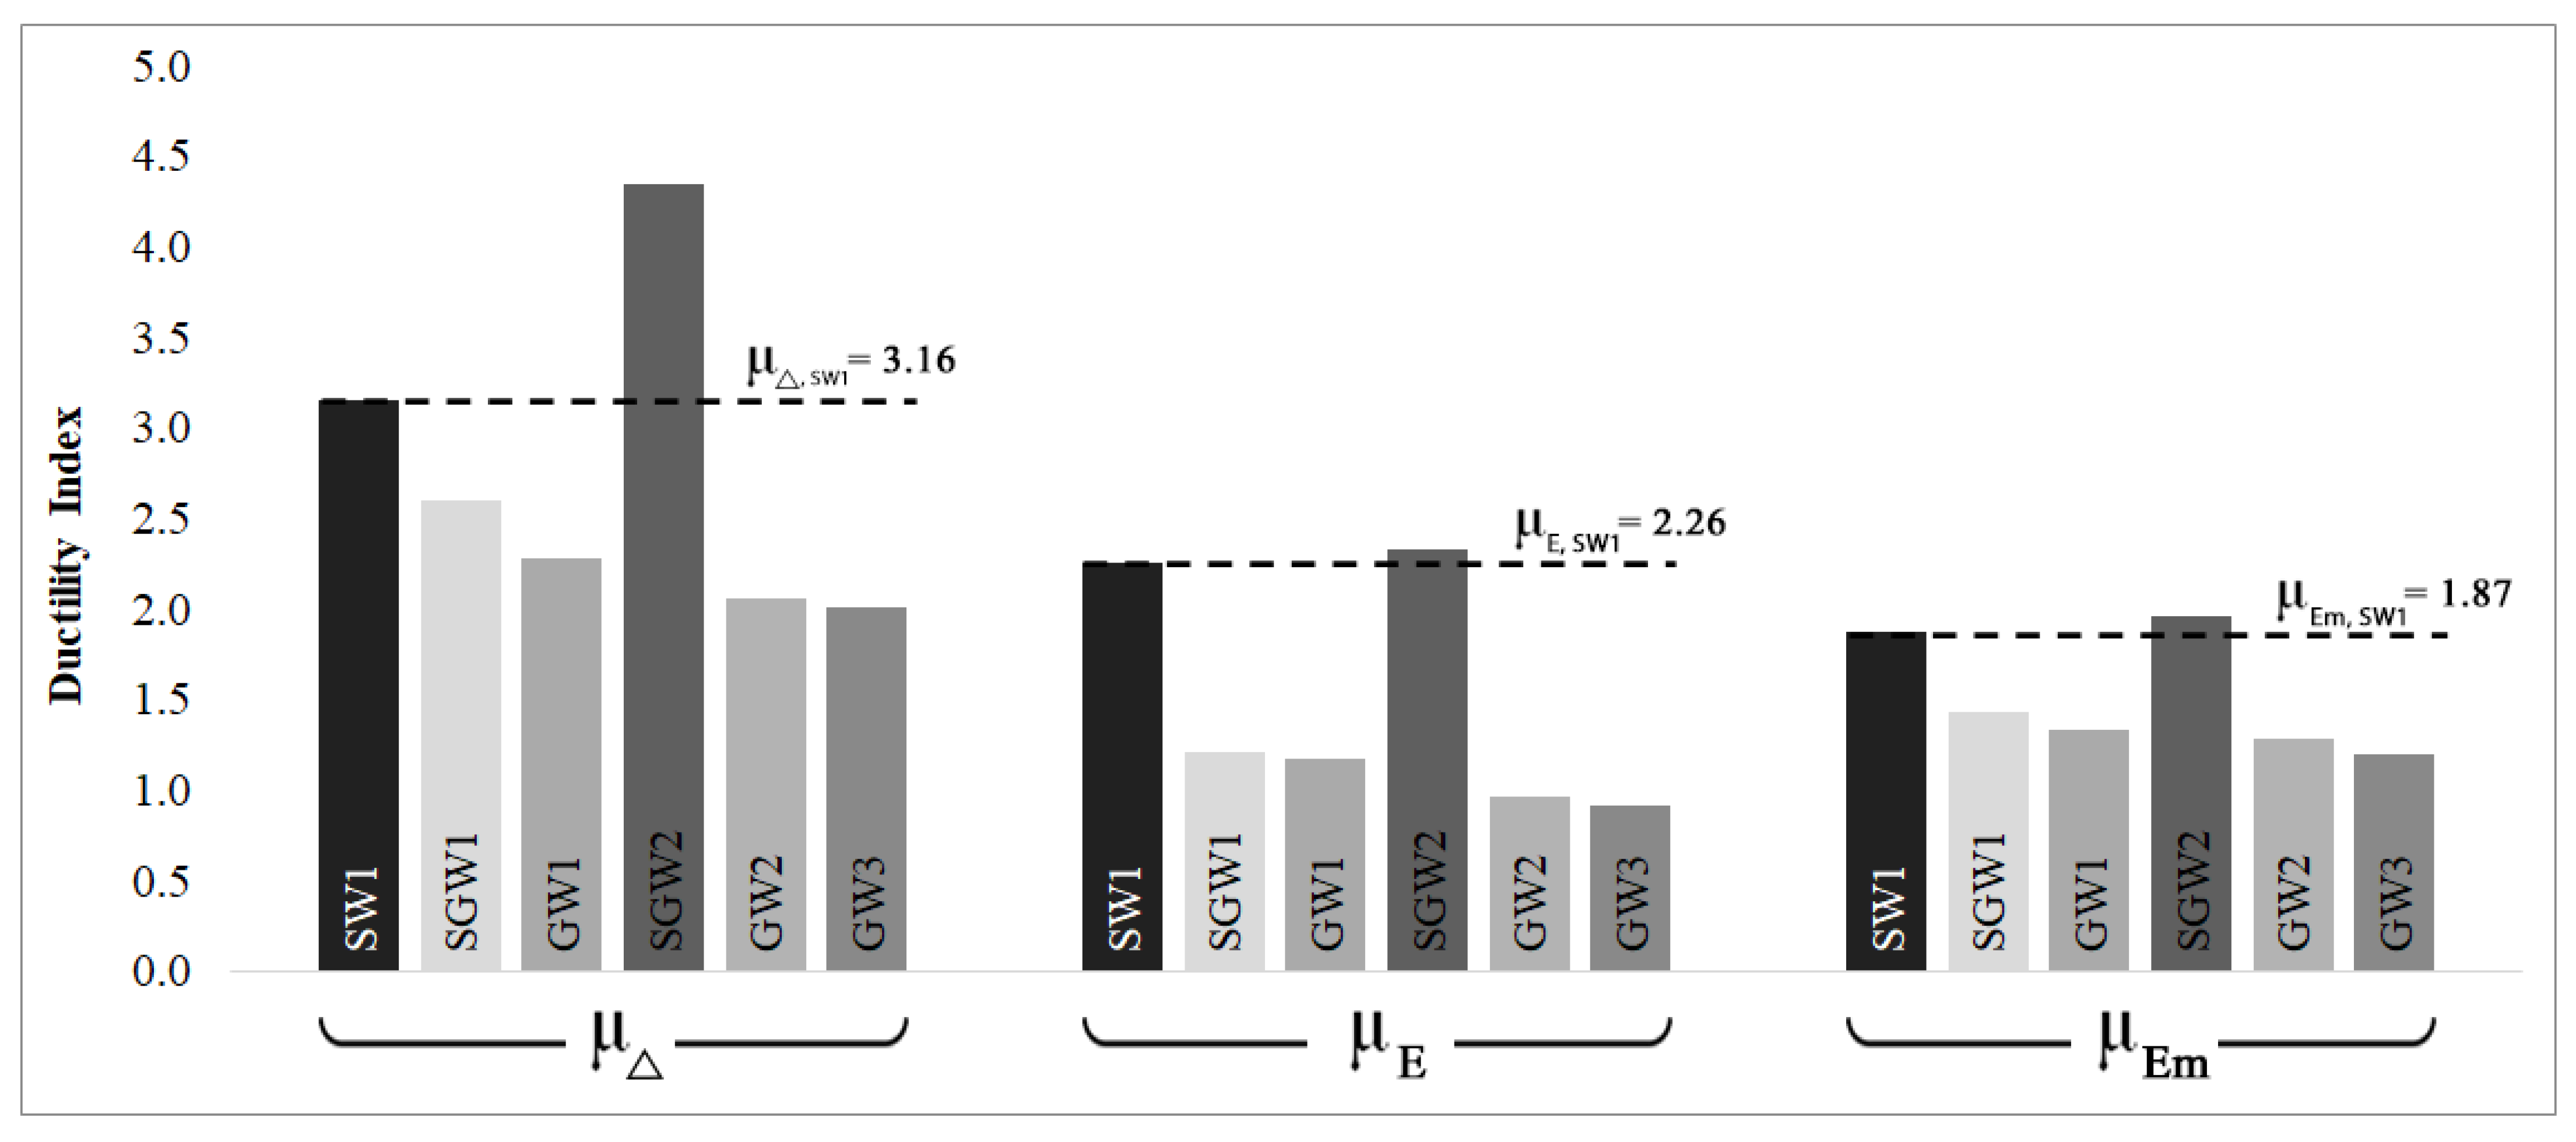
5.5. Ductility Capacity

In steel-reinforced concrete structures, the conventional displacement ductility μ Δ is defined as the ratio of the displacement at the ultimate limit state Δ u to the deformation at the first plastic behaviour Δ y , as follows in Equation (11) [41].
μ Δ = Δ u Δ y
Since GFRP bars do not experience yielding phenomena, the definition of yield displacement in GFRP-reinforced walls is replaced by the elastic displacement Δ e , which corresponds to the displacement value at which the concrete enters the plastic phase and substantial concrete damage occurs (at ε c ranges between 0.003 to 0.0035). For GFRP-reinforced walls, the displacement ductility ratio μ Δ is calculated according to Equation (12) [41,53].
μ Δ = Δ u Δ e
Based on Equations (11) and (12), μ Δ was calculated for all tested walls. The steel-reinforced walls had higher displacement ductility compared to GFRP-reinforced walls. Displacement ductility values of 3.16, 2.6, and 4.35 were attained for walls SW1, SGW1, and SGW2, respectively. However, walls GW1, GW2, and GW3 had lower displacement ductility values of 2.28, 2.06, and 2.02, respectively. Wall SGW2 had 37.6% higher ductility than wall SW1 due to the increased steel-reinforcement ratios. The higher ductility of steel-reinforced walls is mainly due to steel bars’ high plastic deformation capacity. Conversely, the lower ductility of GFRP-reinforced walls is mainly attributed to the linear elastic behavior of GFRP bars, resulting in a large percentage of Δ e in GFRP compared with Δ y in the steel concerning the maximum allowable displacement Δ u . Comparing the calculated displacement ductility for walls GW1, GW2, and GW3 with respect to the reference wall (SW1), a reduction of 27.8%, 34.8%, and 36.1%, respectively, was evidenced. Figure 14 shows a comparison between the calculated μ Δ for all the walls.
The elastic energy-based method can also be used to calculate the ductility index μ E of RC walls [54], which is expressed as follows:
μ E = 1 2 E t o t E e l + 1
where E t o t indicates the total energy calculated as the area under the lateral load-top displacement and E e l denotes the elastic energy obtained as the area of the triangle bounded at failure load by a line with the weighted average slope of the two initial straight lines of the load-displacement curve [41,54]. Moreover, Mohamed et al. [41] proposed refining the elastic energy E e l as the area of the triangle formed under the real unloading path of the loading cycle before failure, as shown in Figure 9b. The energy ductility index μ E and the refined energy ductility index μ E m were calculated according to Equation (13) for all tested walls, as shown in Figure 14. The energy ductility indices μ E for steel-reinforced walls SW1, SGW1, and SGW2 were 2.26, 1.21, and 2.33, respectively, while the μ E indices for GFRP-reinforced walls GW1, GW2, and GW3 were 1.18, 0.96, and 0.92, respectively.
The same conclusion was drawn by comparing the obtained values of μ E , where the steel-reinforced walls had higher energy ductility than GFRP-reinforced walls. Moreover, the refined energy ductility indices μ E m were recalculated for all walls and were found to be 1.87, 1.43, 1.96, 1.03, 0.84, and 0.80 for walls SW1, SGW1, SGW2, GW1, GW2, and GW3, respectively. Although lower values were obtained for μ E m , μ E had almost the same ratio, comparing the values for GFRP-reinforced walls with the reference wall SW1. This conclusion is in agreement with the results found in [41].

6. Conclusions

This study investigated the in-plane cyclic behavior of RC shear walls. The tested walls included a reference wall reinforced with steel bars, two walls reinforced with a combination of steel and GFRP bars, and three walls reinforced with GFRP bars with different reinforcement ratios. The walls were tested under pseudo-static, reversed-cyclic lateral load. The extensive experimental investigation presented herein was oriented to assess the validity and capability of using GFRP bars, as an alternative main reinforcement, in reinforcing shear walls to resist lateral loads. The tested walls had an aspect ratio representing an actual model of RC shear walls in medium-rise RC buildings. The crack pattern, propagated damage, and failure mechanisms of the tested walls were described and analyzed, while the characteristic behavior of GFRP-reinforced shear walls was investigated in detail. According to the obtained results, observations and conclusions include the following:
  • The hysteretic behavior of GFRP and steel-reinforced walls exhibited a substantially symmetric lateral load-top displacement relationship upon moderate damage level where concrete crushing occurred.
  • The steel-reinforced walls lost their self-centering behavior after yielding of the longitudinal bar. In contrast, the elastic behavior of a GFRP-RC shear wall ends when it loses its self-centering behavior and at the start of the plasticity of the concrete, where permanent deformation occurred.
  • The elastic behavior of GFRP bars and the lack of yielding resulted in an increased gain of lateral strength until failure in a stable response and without strength degradation within a realistic range of deformations, indicating the acceptable behavior of GFRP-reinforced shear walls.
  • The use of GFRP bars as a web reinforcement, combined with the conventional steel bars at the utmost ends of the wall, was confirmed to have an acceptable level of lateral strength, drift capacity, stiffness degradation, and energy dissipation compared to the reference steel-reinforced wall. This result confirms the capability of hybrid reinforcement by GFRP and steel bars in reinforcing the seismic-force resisting systems.
  • Compared to steel–RC walls, concrete splitting and spalling occurred at higher drift levels in GFRP-reinforced walls, where the GFRP-RC walls respond elastically with recoverable deformation and realigned cracks of more than 80% of the ultimate lateral load. This characteristic of GFRP-RC walls leads to improvement of the durability of structures.
  • Significant stiffness degradation was associated with structural deficiencies and crack propagation in the tested walls. The steel-reinforced walls had considerably lower rate of stiffness degradation up to moderate damage level resulting in higher stiffness ratios than GFRP-reinforced walls. Upon yielding, the steel-reinforced walls could not sustain much load due to the resulting severe damage; consequently, a higher stiffness degradation rate is attained at higher drift levels compared to GFRP-reinforced walls.
  • Up to moderate damage levels, GFRP-reinforced walls exhibit a softener response with extensive concrete cracking due to the linear elastic behavior of GFRP bars.
  • Higher efficiency of energy dissipation is attained for steel-reinforced walls compared to GFRP walls. The inelastic deformations of steel-reinforced walls increase the seismic-induced energy dissipation, causing softening behavior of the structure and elongation in its structural period. Conversely, lower energy is dissipated by the GFRP-reinforced walls owing to the elastic behavior of GFRP bars. However, considering the lower residual force of GFRP-RC walls, acceptable levels of energy dissipation were achieved compared to the steel-reinforced, which was characterized by higher residual force due to its increased permeant deformation.
  • The severity and rate of stiffness degradation are effectively reduced by increasing the longitudinal reinforcement ratio in both steel- and GFRP-reinforced walls.
  • Increasing the GFRP-reinforcement ratio enhances the ultimate load capacity and considerably restrains crack width at a moderate damage level, thus significantly improving structures’ durability. However, the degree of improvement reduces as the reinforcement ratio increases. The higher GFRP-reinforcement ratio significantly decreases the ductility and increases the walls’ brittle behavior, resulting in sudden failure.

7. Limitation

The current study focused on testing the shear walls under in-plane cyclic loading only without applying axial vertical load. Therefore, the effect of different levels of axial load are recommended for future work. Moreover, this study investigated the behavior of slender RC walls; further investigations for walls with different aspect ratios, especially squat walls, have to be conducted. Numerical analyses may also be conducted in further studies for additional research investigations on the parameters that affect the global behavior of concrete shear wall reinforced by hybrid scheme of GFRP–steel bars.

Author Contributions

Conceptualization, H.E.-K. and O.A.; methodology, O.A.; software, O.A.; validation, H.E.-K., A.H.A., and H.H.; formal analysis, O.A.; investigation, H.E.-K.; data curation, H.E.-K.; writing—original draft preparation, O.A.; writing—review and editing, A.H.A. and H.E.-K.; visualization, O.A.; supervision, H.H.; project administration, A.H.A. All authors have read and agreed to the published version of the manuscript.

Funding

This research received no external funding.

Data Availability Statement

The data presented in this study are available on request from the corresponding author.

Acknowledgments

The authors acknowledge the staff of the Concrete Laboratory at the Housing and Building National Research Center (HBRC) for their support during the experimental campaign.

Conflicts of Interest

The authors declare no conflict of interest.

References

  1. Lefas, I.D.; Kotsovos, M.D.; Ambraseys, N.N. Behavior of Reinforced Concrete Structural Walls: Strength, Deformation Characteristics, and Failure Mechanism. ACI Struct. J. 1990, 87, 23–31. [Google Scholar]
  2. Luna, B.N.; Whittaker, A.S. Peak Strength of Shear-Critical Reinforced Concrete Walls. ACI Struct. J. 2019, 116, 257–266. [Google Scholar] [CrossRef]
  3. Shabana, I.; Farghaly, A.S.; Benmokrane, B. Earthquake response of GFRP-reinforced concrete squat walls with aspect ratios of 1.14 and 0.68. Eng. Struct. 2022, 252, 113556. [Google Scholar] [CrossRef]
  4. Cardenas, A.E.; Hanson, J.M.; Corley, W.G.; Hognestad, E. Design Provisions for Shear Walls. ACI J. Proc. 1973, 70, 221–230. [Google Scholar]
  5. Hosseini, S.M.; Yekrangnia, M.; Oskouei, A.V. Effect of spiral transverse bars on structural behavior of concrete shear walls reinforced with GFRP bars. J. Build. Eng. 2022, 55, 104706. [Google Scholar] [CrossRef]
  6. Penelis, G.G.; Kappos, A.J. Earthquake Resistant Concrete Structures; CRC Press: London, UK, 2019. [Google Scholar]
  7. Fintel, M. Performance of Buildings with Shear Walls in Earthquakes of the Last Thirty Years. Pci J. 1995, 40, 62–80. [Google Scholar] [CrossRef] [Green Version]
  8. Mohamed, N.; Farghaly, A.S.; Benmokrane, B.; Neale, K.W. Flexure and Shear Deformation of GFRP-Reinforced Shear Walls. J. Compos. Constr. 2014, 18, 04013044. [Google Scholar] [CrossRef]
  9. Husain, S.; Shariq, M.; Masood, A. GFRP bars for RC structures—A Review. In Proceedings of the International Conference on Advances in Construction Materials and Structures (ACMS), IIT Roorkee, Roorkee, India, 7–8 March 2018. [Google Scholar]
  10. Benmokrane, H.M.B. Use of Fibre-Reinforced Polymer (FRP) Rebars for Building Durable Concrete Infrastructure. Insights and Innovations in Structural Engineering, Mechanics and Computation. In Proceedings of the Sixth International Conference on Structural Engineering, Mechanics and Computation, Cape Town, South Africa, 5–7 September 2016. [Google Scholar]
  11. Mukherjee, A.; Arwikar, S.J. Performance of glass fiber-reinforced polymer reinforcing bars in tropical environments—Part II: Microstructural tests. ACI Struct. J. 2005, 102, 816–822. [Google Scholar]
  12. ACI 440.1R; Guide for the Design and Construction of Structural Concrete Reinforced with FRP Bars. American Concrete Institute: Farmington Hills, MI, USA, 2015.
  13. CSA S806; Design and Construction of Building Components with Fibre-Reinforced Polymers (CAN/CSA S806-12). Canadial Standards Association: Mississauga, ON, Canada, 2012.
  14. ECP 208; The Egyptian Code of Practice on the Use of Fibre Reinforced Polymers in the Construction Fields. Ministry of Housing, Utilities and Urban Development-Housing and Building National Research Center: Cairo, Egypt, 2005.
  15. Zhang, X.; Deng, Z. Durability of GFRP bars in the simulated marine environment and concrete environment under sustained compressive stress. Constr. Build. Mater. 2019, 223, 299–309. [Google Scholar] [CrossRef]
  16. Chen, Y.; Davalos, J.F.; Ray, I. Durability Prediction for GFRP Reinforcing Bars Using Short-Term Data of Accelerated Aging Tests. J. Compos. Constr. 2006, 10, 279–286. [Google Scholar] [CrossRef]
  17. Robert, M.; Cousin, P.; Benmokrane, B. Durability of GFRP Reinforcing Bars Embedded in Moist Concrete. J. Compos. Constr. 2009, 13, 66–73. [Google Scholar] [CrossRef] [Green Version]
  18. Bakis, C.E. Durability of GFRP Reinforcement Bars. In Advances in FRP Composites in Civil Engineering; Ye, L., Feng, P., Yue, Q., Eds.; Springer: Berlin/Heidelberg, Germany, 2011; pp. 33–36. [Google Scholar]
  19. Kotynia, R.; Szczech, D.; Kaszubska, M. Bond Behavior of GRFP Bars to Concrete in Beam Test. Procedia Eng. 2017, 193, 401–408. [Google Scholar] [CrossRef]
  20. Ferdous, W.; Manalo, A.; Yu, P.; Salih, C.; Abousnina, R.; Heyer, T.; Schubel, P. Tensile Fatigue Behavior of Polyester and Vinyl Ester Based GFRP Laminates—A Comparative Evaluation. Polymers 2021, 13, 386. [Google Scholar] [CrossRef]
  21. Liu, Y.; Zhang, H.-T.; Tafsirojjaman, T.; Dogar, A.U.R.; AlAjarmeh, O.; Yue, Q.-R.; Manalo, A. A novel technique to improve the compressive strength and ductility of glass fiber reinforced polymer (GFRP) composite bars. Constr. Build. Mater. 2022, 326, 126782. [Google Scholar] [CrossRef]
  22. Hassan, H.F.; Medhlom, M.K.; Ahmed, A.S.; Al-Dahlaki, M.H. Flexural performance of concrete beams reinforced by gfrp bars and strengthened by cfrp sheets. Case Stud. Constr. Mater. 2020, 13, e00417. [Google Scholar]
  23. Saleh, Z.; Goldston, M.; Remennikov, A.M.; NeazSheikh, M. Flexural design of GFRP bar reinforced concrete beams: An appraisal of code recommendations. J. Build. Eng. 2019, 25, 100794. [Google Scholar] [CrossRef]
  24. Kalpana, V.G.; Subramanian, K. Behavior of concrete beams reinforced with GFRP BARS. J. Reinf. Plast. Compos. 2011, 30, 1915–1922. [Google Scholar] [CrossRef]
  25. Pecce, M.; Manfredi, G.; Cosenza, E. Experimental Response and Code Modelsof GFRP RC Beams in Bending. J. Compos. Constr. 2000, 4, 182–190. [Google Scholar] [CrossRef]
  26. Arafa, A.; Farghaly, A.S.; Benmokrane, B. Nonlinear Finite-Element Analysis for Predicting the Behavior of Concrete Squat Walls Reinforced with GFRP Bars. J. Struct. Eng. 2019, 145, 04019107–1-18. [Google Scholar] [CrossRef]
  27. Ali, M.A.; El-Salakawy, E. Seismic Performance of GFRP-Reinforced Concrete Rectangular Columns. J. Compos. Constr. 2016, 20, 04015074. [Google Scholar] [CrossRef]
  28. Bruun, E. GFRP Bars in Structural Design: Determining the Compressive Strength versus Unbraced Length Interaction Curve. Can. Young Sci. J. 2014, 4, 22–29. [Google Scholar] [CrossRef] [Green Version]
  29. Almasabha, G.; Tarawneh, A.; Saleh, E.; Alajarmeh, O. Data-Driven Flexural Stiffness Model of FRP-Reinforced Concrete Slender Columns. J. Compos. Constr. 2022, 26, 04022024. [Google Scholar] [CrossRef]
  30. Ghomi, S.K.; El-Salakawy, E. Effect of joint shear stress on seismic behaviour of interior GFRP-RC beam-column joints. Eng. Struct. 2019, 191, 583–597. [Google Scholar] [CrossRef]
  31. El-Salakawy, E.; Benmokrane, B.; El-Ragaby, A.; Nadeau, D. Field Investigation on the First Bridge Deck Slab Reinforced with Glass FRP Bars Constructed in Canada. J. Compos. Constr. 2005, 9, 470–479. [Google Scholar] [CrossRef]
  32. Al-Rubaye, M.; Manalo, A.; Alajarmeh, O.; Ferdous, W.; Lokuge, W.; Benmokrane, B.; Edoo, A. Flexural behaviour of concrete slabs reinforced with GFRP bars and hollow composite reinforcing systems. Compos. Struct. 2020, 236, 111836. [Google Scholar] [CrossRef] [Green Version]
  33. Chang, K.; Seo, D. Behavior of One-Way Concrete Slabs Reinforced. J. Asian Archit. Build. Eng. 2012, 11, 351–358. [Google Scholar] [CrossRef] [Green Version]
  34. El-Gendy, M.; El-Salakawy, E. Effect of flexural reinforcement type and ratio on the punching behavior of RC slab-column edge connections subjected to reversed-cyclic lateral loads. Eng. Struct. 2019, 200, 109703. [Google Scholar] [CrossRef]
  35. Eladawy, M.; Hassan, M.; Benmokrane, B.; Ferrier, E. Lateral cyclic behavior of interior two-way concrete slab–column connections reinforced with GFRP bars. Eng. Struct. 2020, 209, 109978. [Google Scholar] [CrossRef]
  36. Mohamed, N.; Farghaly, A.S.; Benmokrane, B.; Neale, K.W. Experimental Investigation of Concrete Shear Walls Reinforced with Glass Fiber–Reinforced Bars under Lateral Cyclic Loading. J. Compos. Constr. 2014, 18, A4014001. [Google Scholar] [CrossRef]
  37. Arafa, A.; Farghaly, A.S.; Benmokrane, B. Effect of web reinforcement on the seismic response of concrete squat walls reinforced with glass-FRP bars. Eng. Struct. 2018, 174, 712–723. [Google Scholar] [CrossRef]
  38. Arafa, A.; Farghaly, A.S.; Benmokrane, B. Evaluation of Flexural and Shear Stiffness of Concrete Squat Walls Reinforced with Glass Fiber-Reinforced Polymer Bars. ACI Struct. J. 2018, 115, 211–221. [Google Scholar] [CrossRef]
  39. Arafa, A.; Farghaly, A.S.; Benmokrane, B. Experimental Behavior of GFRP-Reinforced Concrete Squat Walls Subjected to Simulated Earthquake Load. J. Compos. Constr. 2018, 22, 04018003. [Google Scholar] [CrossRef]
  40. Mohamed, N.; Farghaly, A.S.; Benmokrane, B.; Neale, K.W. Drift Capacity Design of Shear Walls Reinforced with Glass Fiber-Reinforced Polymer Bars. ACI Struct. J. 2014, 111, 1397–1406. [Google Scholar] [CrossRef]
  41. Mohamed, N.; Farghaly, A.S.; Benmokrane, B. Aspects of Deformability of Concrete Shear Walls Reinforced with Glass Fiber–Reinforced Bars. J. Compos. Constr. 2015, 19, 06014001. [Google Scholar] [CrossRef]
  42. Hassanein, A.; Mohamed, N.; Farghaly, A.S.; Benmokrane, B. Deformability and Stiffness Characteristics of Concrete Shear Walls Reinforced with Glass Fiber-Reinforced Polymer Reinforcing Bars. ACI Struct. J. 2020, 117, 183–196. [Google Scholar] [CrossRef]
  43. ECP 203; Egyptian Code for Design and Construction of Reinforced Concrete Structures. Ministry of Housing, Utilities and Urban Development-Housing and Building National Research Center: Cairo, Egypt, 2021.
  44. ACI 318; Building Code Requirements for Structural Concrete and Commentary (ACI 318-19). American Concrete Institute: Farmington Hills, MI, USA, 2019.
  45. Paulay, T.; Priestley, M.J.N. Seismic Design of Reinforced Concrete and Masonry Buildings; John Wiley and Sons Inc.: New York, NY, USA, 1995. [Google Scholar]
  46. El-Azizy, O.A.; Shedid, M.T.; El-Dakhakhni, W.W.; Drysdale, R.G. Experimental evaluation of the seismic performance of reinforced concrete structural walls with different end configurations. Eng. Struct. 2015, 101, 246–263. [Google Scholar] [CrossRef]
  47. ASTM D7205/D7205M-06; Standard Test Method for Tensile Properties of Fiber Reinforced Polymer Matrix Composite Bars. ASTM: West Conshohocken, PA, USA, 2011.
  48. ASTM C39/C39M; Standard Test Method for Compressive Strength of Cylindrical Concrete Specimens. American Society for Testing and Materials: West Conshohocken, PA, USA, 2021.
  49. FEMA 461; Interim Testing Protocols for Determining the Seismic Performance Characteristics of Structural and Nonstructural Components. Federal Emergency Management Agency: Redwood, CA, USA, 2007.
  50. Hassanein, A.; Mohamed, N.; Farghaly, A.S.; Benmokrane, B. Effect of boundary element confinement configuration on the performance of GFRP-Reinforced concrete shear walls. Eng. Struct. 2020, 225, 111262. [Google Scholar] [CrossRef]
  51. Chopra, A.K. Dynamics of Structures: Theory and Applications to Earthquake Engineering; Prentice-Hall, Inc.: Englewood Cliffs, NJ, USA, 2000. [Google Scholar]
  52. Xu, W.; Yang, X.; Wang, F.; Chi, B. Experimental and numerical study on the seismic performance of prefabricated reinforced masonry shear walls. Appl. Sci. 2018, 8, 1856. [Google Scholar] [CrossRef] [Green Version]
  53. Priestley, M.J.N.; Kowalsky, M.J. Aspects of drift and ductility capacity of rectangular cantilever structural walls. Bull. New Zealand Soc. Earthq. Eng. 1998, 31, 73–85. [Google Scholar] [CrossRef]
  54. Naaman, A.; Jeong, S. Structural ductility of concrete beams prestressed with FRP tendons. In Proceedings of the Second International RILEM Symposium on Non-Metallic (FRP) Reinforcement for Concrete Structures (FRPRCS-2), London, UK, 23–25 August 1995. [Google Scholar]
Figure 1. Concrete dimensions and details of reinforcement configuration. All dimensions in mm.
Buildings 12 01948 g001
Figure 2. Typical steel and GFRP reinforcement configuration.
Buildings 12 01948 g002
Figure 3. Layout of the test setup and used LVDTs. All dimensions in mm.
Buildings 12 01948 g003
Figure 4. Tested walls: (a,b) pouring concrete stage, (c) concrete compaction stage, (d) curing stage, and (e) physical wall testing setup.
Buildings 12 01948 g004
Figure 5. Applied displacement-controlled loading history.
Buildings 12 01948 g005
Figure 6. Hysteretic load-displacement response: steel-reinforced wall (a) SW1; walls reinforced by a combination of steel and GFRP bars (b) SGW1 and (d) SGW2”; GFRP-reinforced walls (c) GW1, (e) GW2, and (f) GW3.
Buildings 12 01948 g006aBuildings 12 01948 g006bBuildings 12 01948 g006cBuildings 12 01948 g006d
Figure 7. Crack patterns and damage at failure-tested walls.
Buildings 12 01948 g007aBuildings 12 01948 g007bBuildings 12 01948 g007cBuildings 12 01948 g007d
Figure 8. Envelope load-displacement curve.
Buildings 12 01948 g008
Figure 9. Calculation of (a) energy dissipation and (b) energy-based ductility index based on Mohamed et al. [41].
Buildings 12 01948 g009
Figure 10. Cumulative energy dissipation against (a) drift and (b) residual force at the end of each cycle.
Buildings 12 01948 g010
Figure 11. Degradation of normalized secant stiffness with the lateral drift.
Buildings 12 01948 g011
Figure 12. Envelopes of measured crack width against drift.
Buildings 12 01948 g012
Figure 13. Envelopes of measured residual deformation.
Buildings 12 01948 g013
Figure 14. Comparison of different ductility indices of all specimens.
Buildings 12 01948 g014
Table 1. Details of the wall specimens.
SpecimensVertical Reinforcement (%)Horizontal Reinforcement
No. and Size ρ s , V l ρ f , V l   ρ V , t   No. and Size ρ s , h z ρ f , h z
SW—Control10 T12 a0.71-0.71T8 b@ 125 mm0.40-
SGW14 T12 + 6F4 c0.280.480.76F3@ 125 mm-1.01
GW110F4-0.790.79F3@ 125 mm-1.01
SGW26 T12 + 10F40.420.791.22F3@ 125 mm-1.01
GW216F4-1.271.27F3@ 125 mm-1.01
GW322F4-1.741.74F3@ 125 mm-1.01
a Steel bars d b = 12   mm ; b Steel bars d b = 8   mm ; c GFRP bars No. 4. ρ V , t is the total vertical reinforcement ratio.
Table 2. Material properties of adopted concrete and reinforcements.
Concrete (C30) W / C   % C e m e n t   Kg / m 3 E c GPa f c ' MPa C.O.V. (%)
0.440024.132.45.5
Steel bars d b mm A s mm 2 E s GPa f y MPa ε y %
850.32004000.2
12113
GFRP bars No. 4 d b mm A f mm 2 E f GPa f f u MPa ε f u %
12.7126.769.613922.0
Table 3. Summary of predicted and experimental results.
WallsPredicted Capacity (kN) Measured   Capacity   Q u
Q f ECPASCIPushPull
Q r Q r Q f Q r Q r Q f (kN) λ (kN) λ
SW186.00155.511.81166.331.9395.989.4198.399.64
SGW197.64174.751.79173.951.7898.789.68119.8411.75
GW193.171.881.8791.378.9692.029.02
SGW2133.831.311.30142.8314.00147.1114.42
GW2140.851.241.23156.6715.36144.9714.21
GW3179.920.970.97179.3817.58180.9317.73
Table 4. Summary of experimental damage progression.
Characteristic Damage StageWall Q Q u % Δ Δ Δ m a x % δ % T T 0
First crackSW135.704.815.220.191.18
SGW128.245.264.510.201.19
GW127.955.695.370.221.19
SGW244.96−6.084.960.231.12
GW223.595.884.760.231.22
GW323.115.954.700.231.28
YieldingSW166.9413.557.010.521.38
SGW166.6515.496.710.601.52
GW1-----
SGW263.3917.157.450.661.49
GW2-----
GW3-----
Concrete splittingSW193.9137.4940.701.442.08
SGW182.4340.2434.491.552.06
GW172.6644.8742.401.732.03
SGW285.9247.4738.701.832.01
GW269.4750.0640.491.932.03
GW371.4557.8645.702.232.01
Concrete spallingSW190.7966.4972.202.562.62
SGW170.8973.8863.332.843.07
GW195.18−69.1865.382.662.30
SGW290.8873.3359.782.822.54
GW280.92−72.3158.492.782.26
GW394.16−77.1160.912.972.24
Concrete crushingSW1−90.6649.7198.443.494.26
SGW1−103.3681.3888.603.983.83
GW1−105.8283.48100.004.072.75
SGW2122.6771.17100.004.723.72
GW2−123.6381.32100.004.762.75
GW3−126.6098.65100.004.872.54
Publisher’s Note: MDPI stays neutral with regard to jurisdictional claims in published maps and institutional affiliations.

