
Seismic Risk Mitigation and Management for Critical Infrastructures Using an RMIR Indicator

Abstract
:1. Introduction
2. Methodology
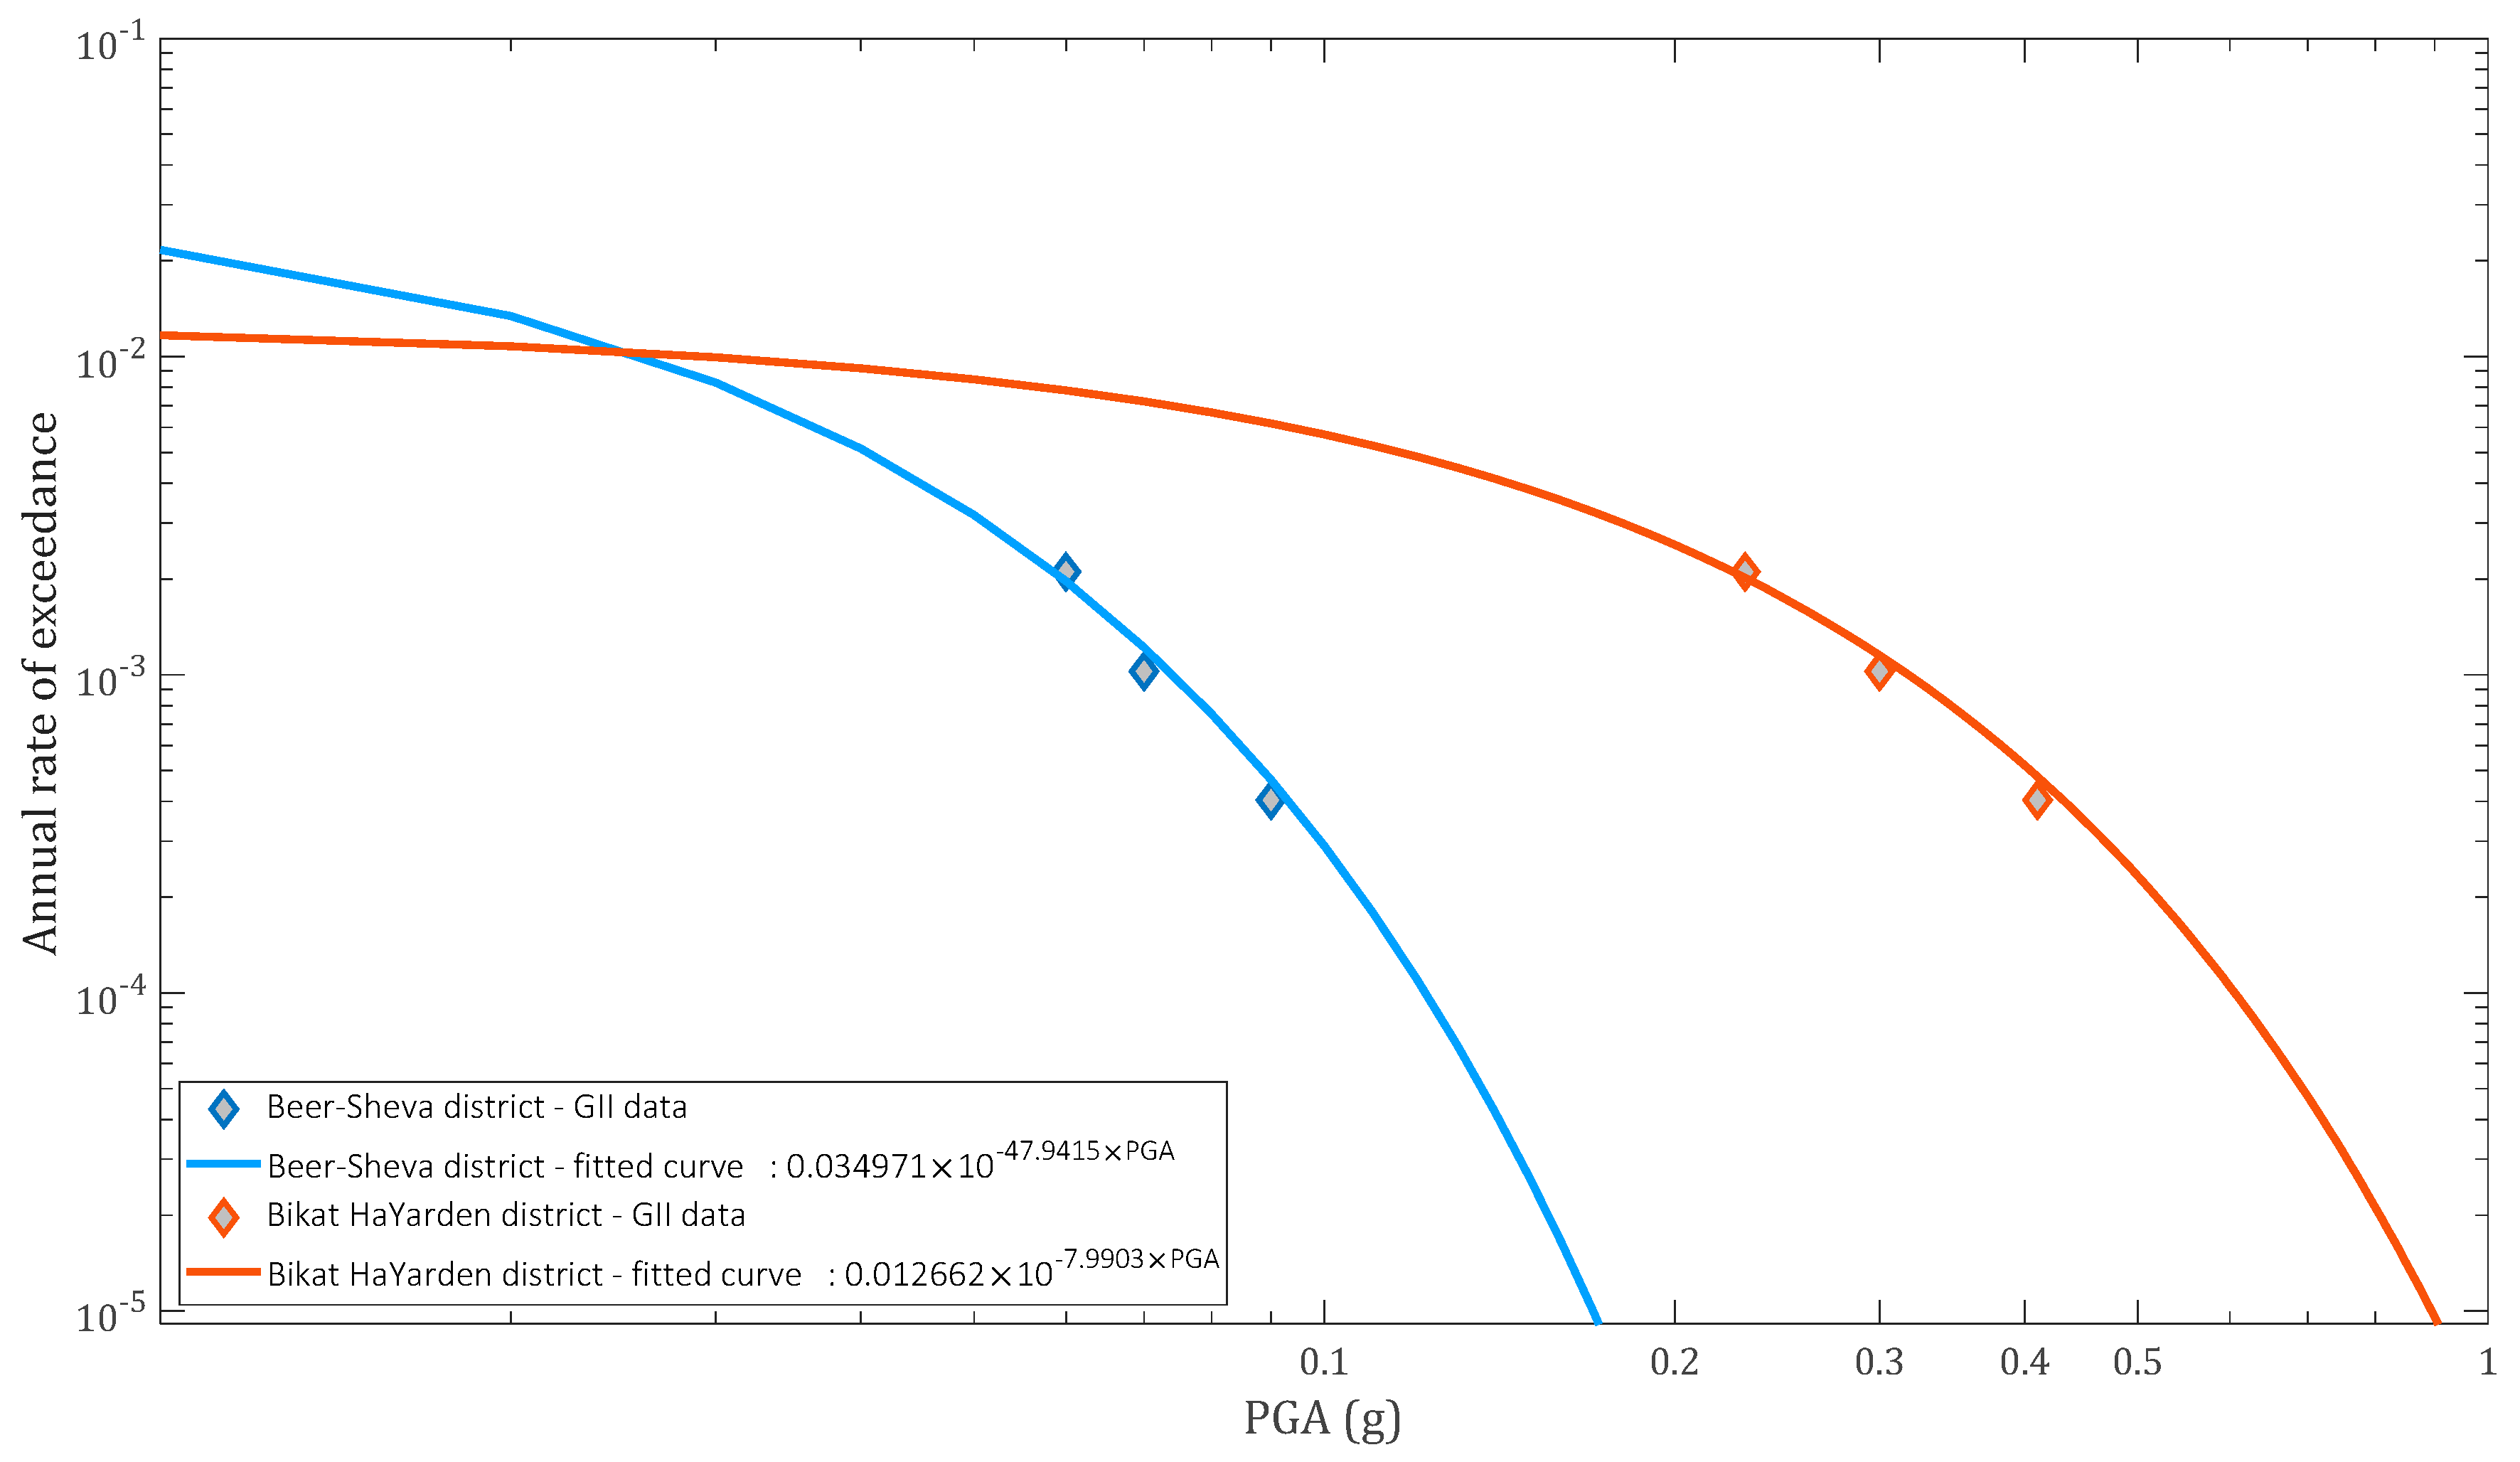
2.1. Determination of the Seismic Scenarios
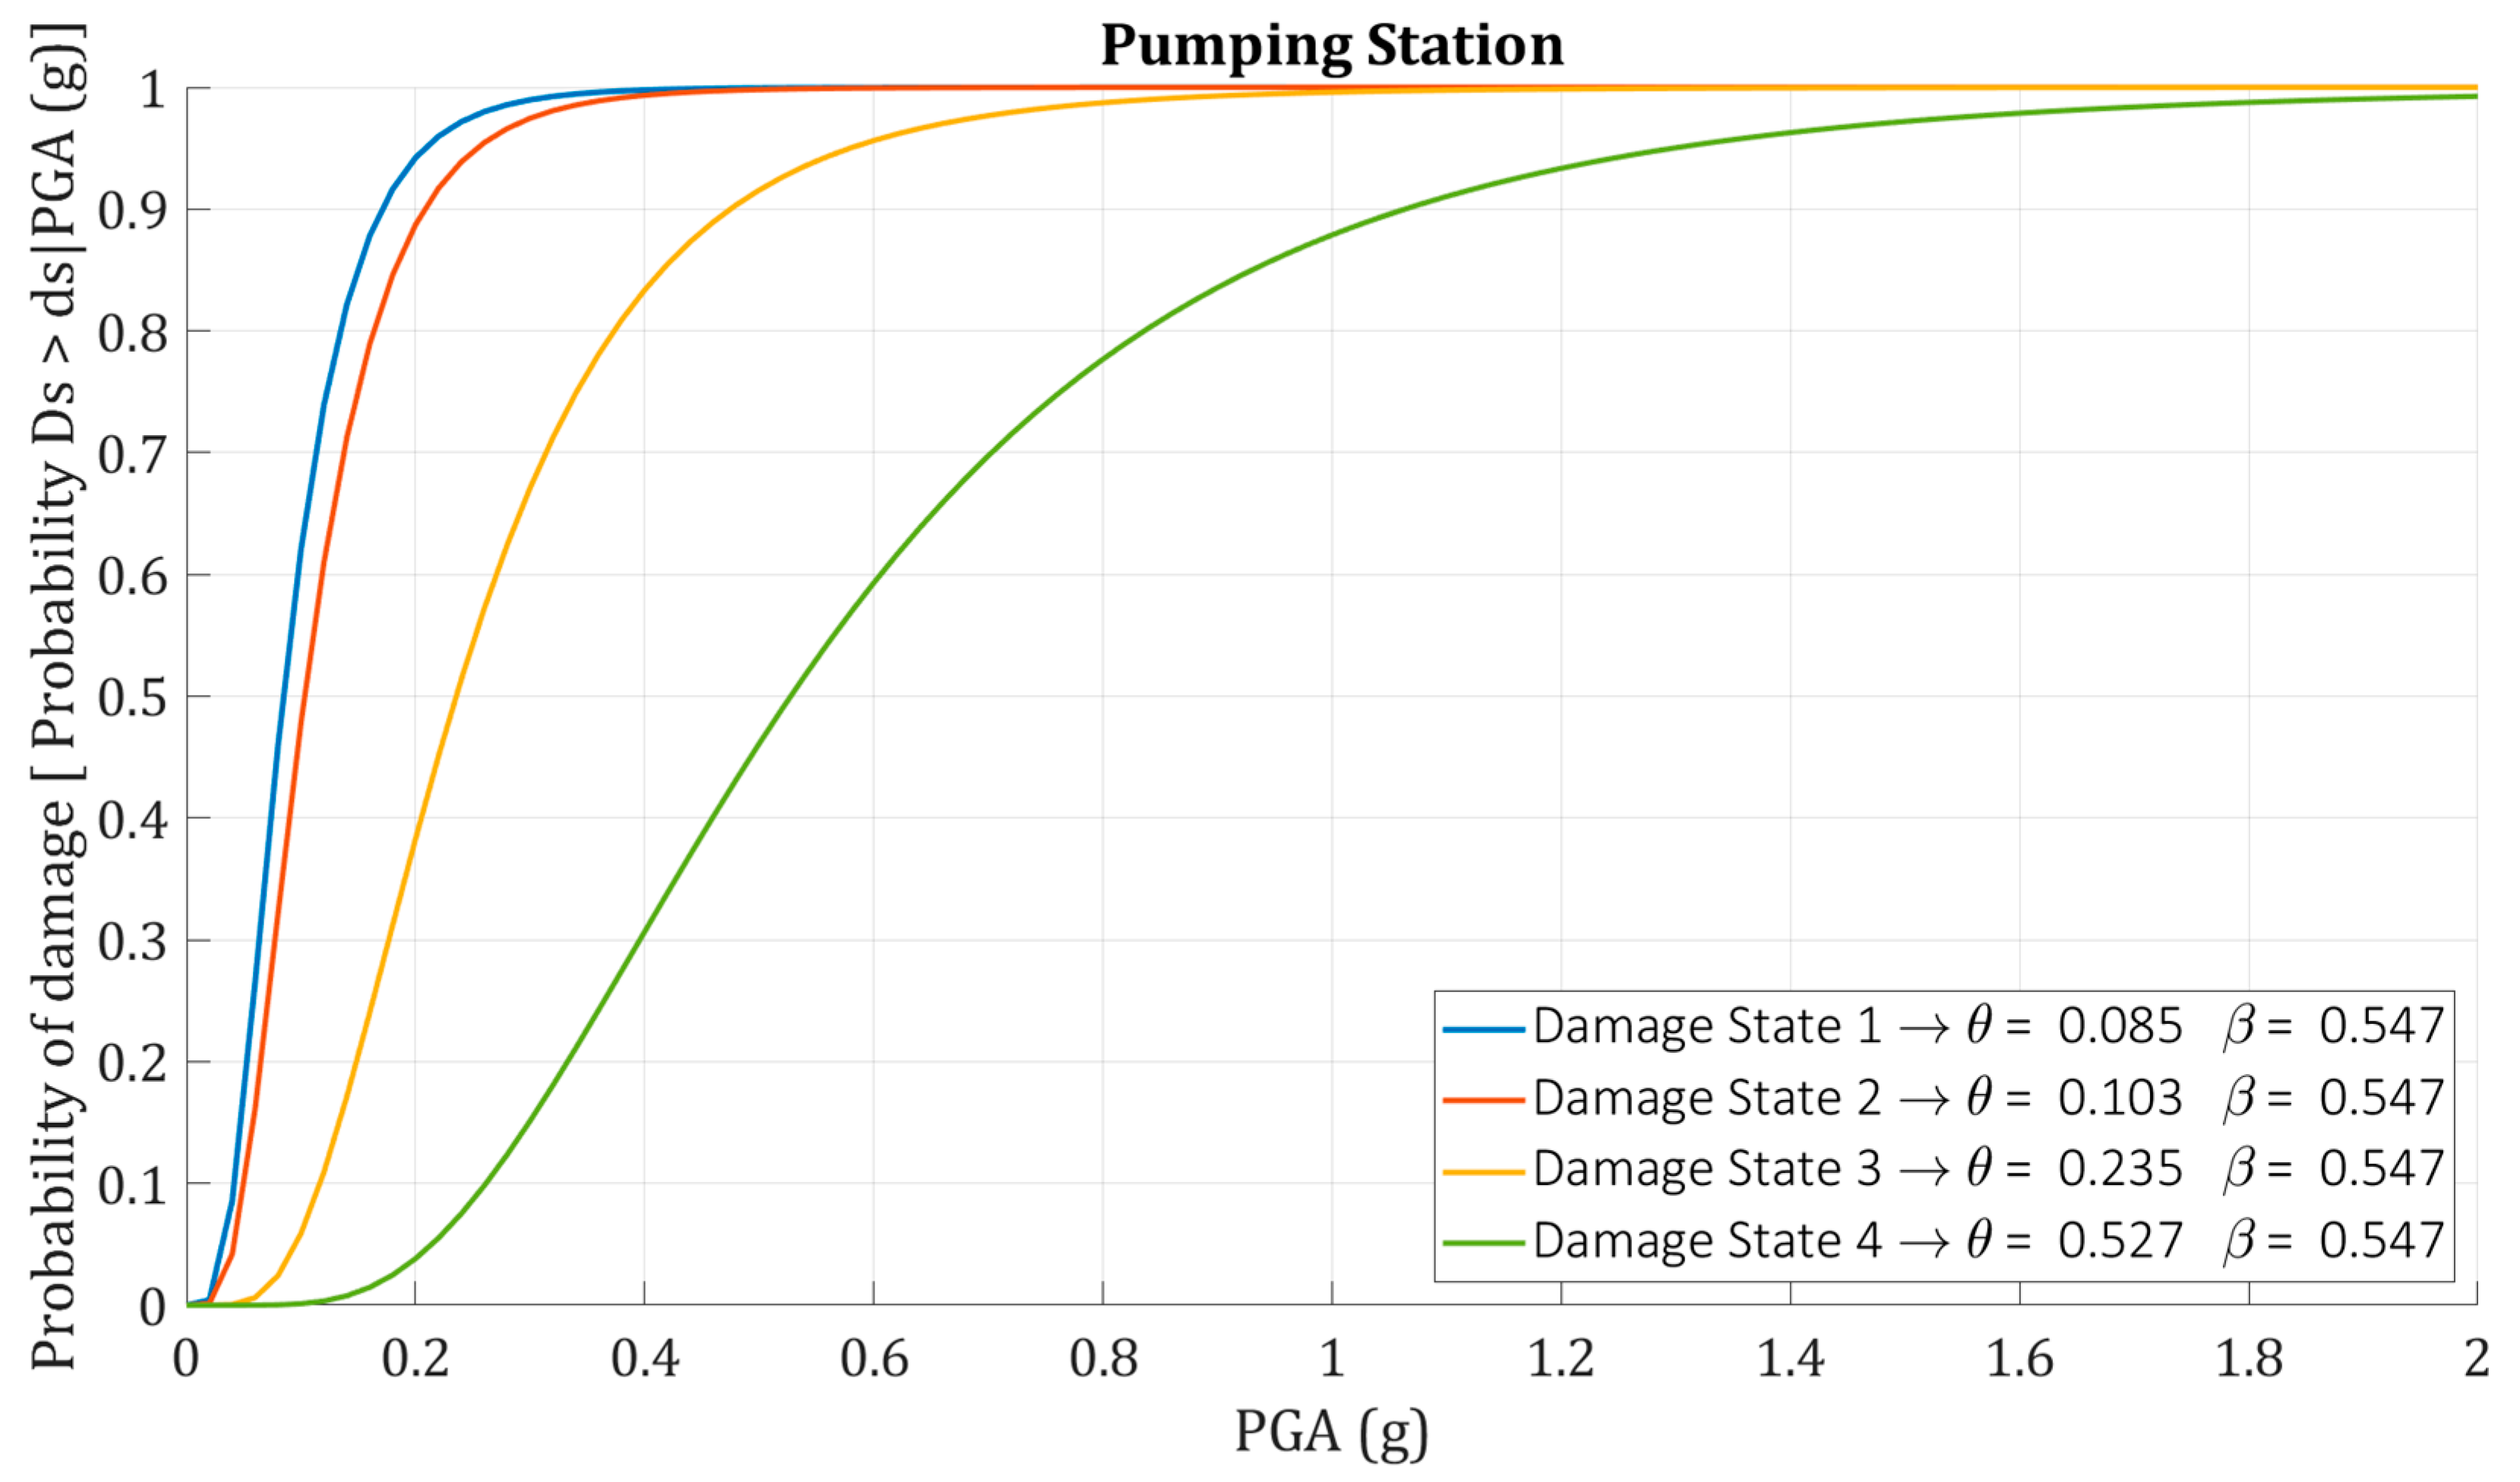
2.2. Definition of System Seismic Vulnerability
- —Damage state of a particular component {0, 1,... NDS}.
- —A particular value of DS.
- —Number of possible damage states.
- —Uncertain excitation, the ground motion intensity measure (i.e., PGA, PGD, or PGV).
- —A particular value of IM.
- Φ—Standard cumulative normal distribution function.
- —The median capacity of the component to resist damage state DS measured in terms of IM.
- —The logarithmic standard deviation of the uncertain capacity of the component to resist damage state DS.
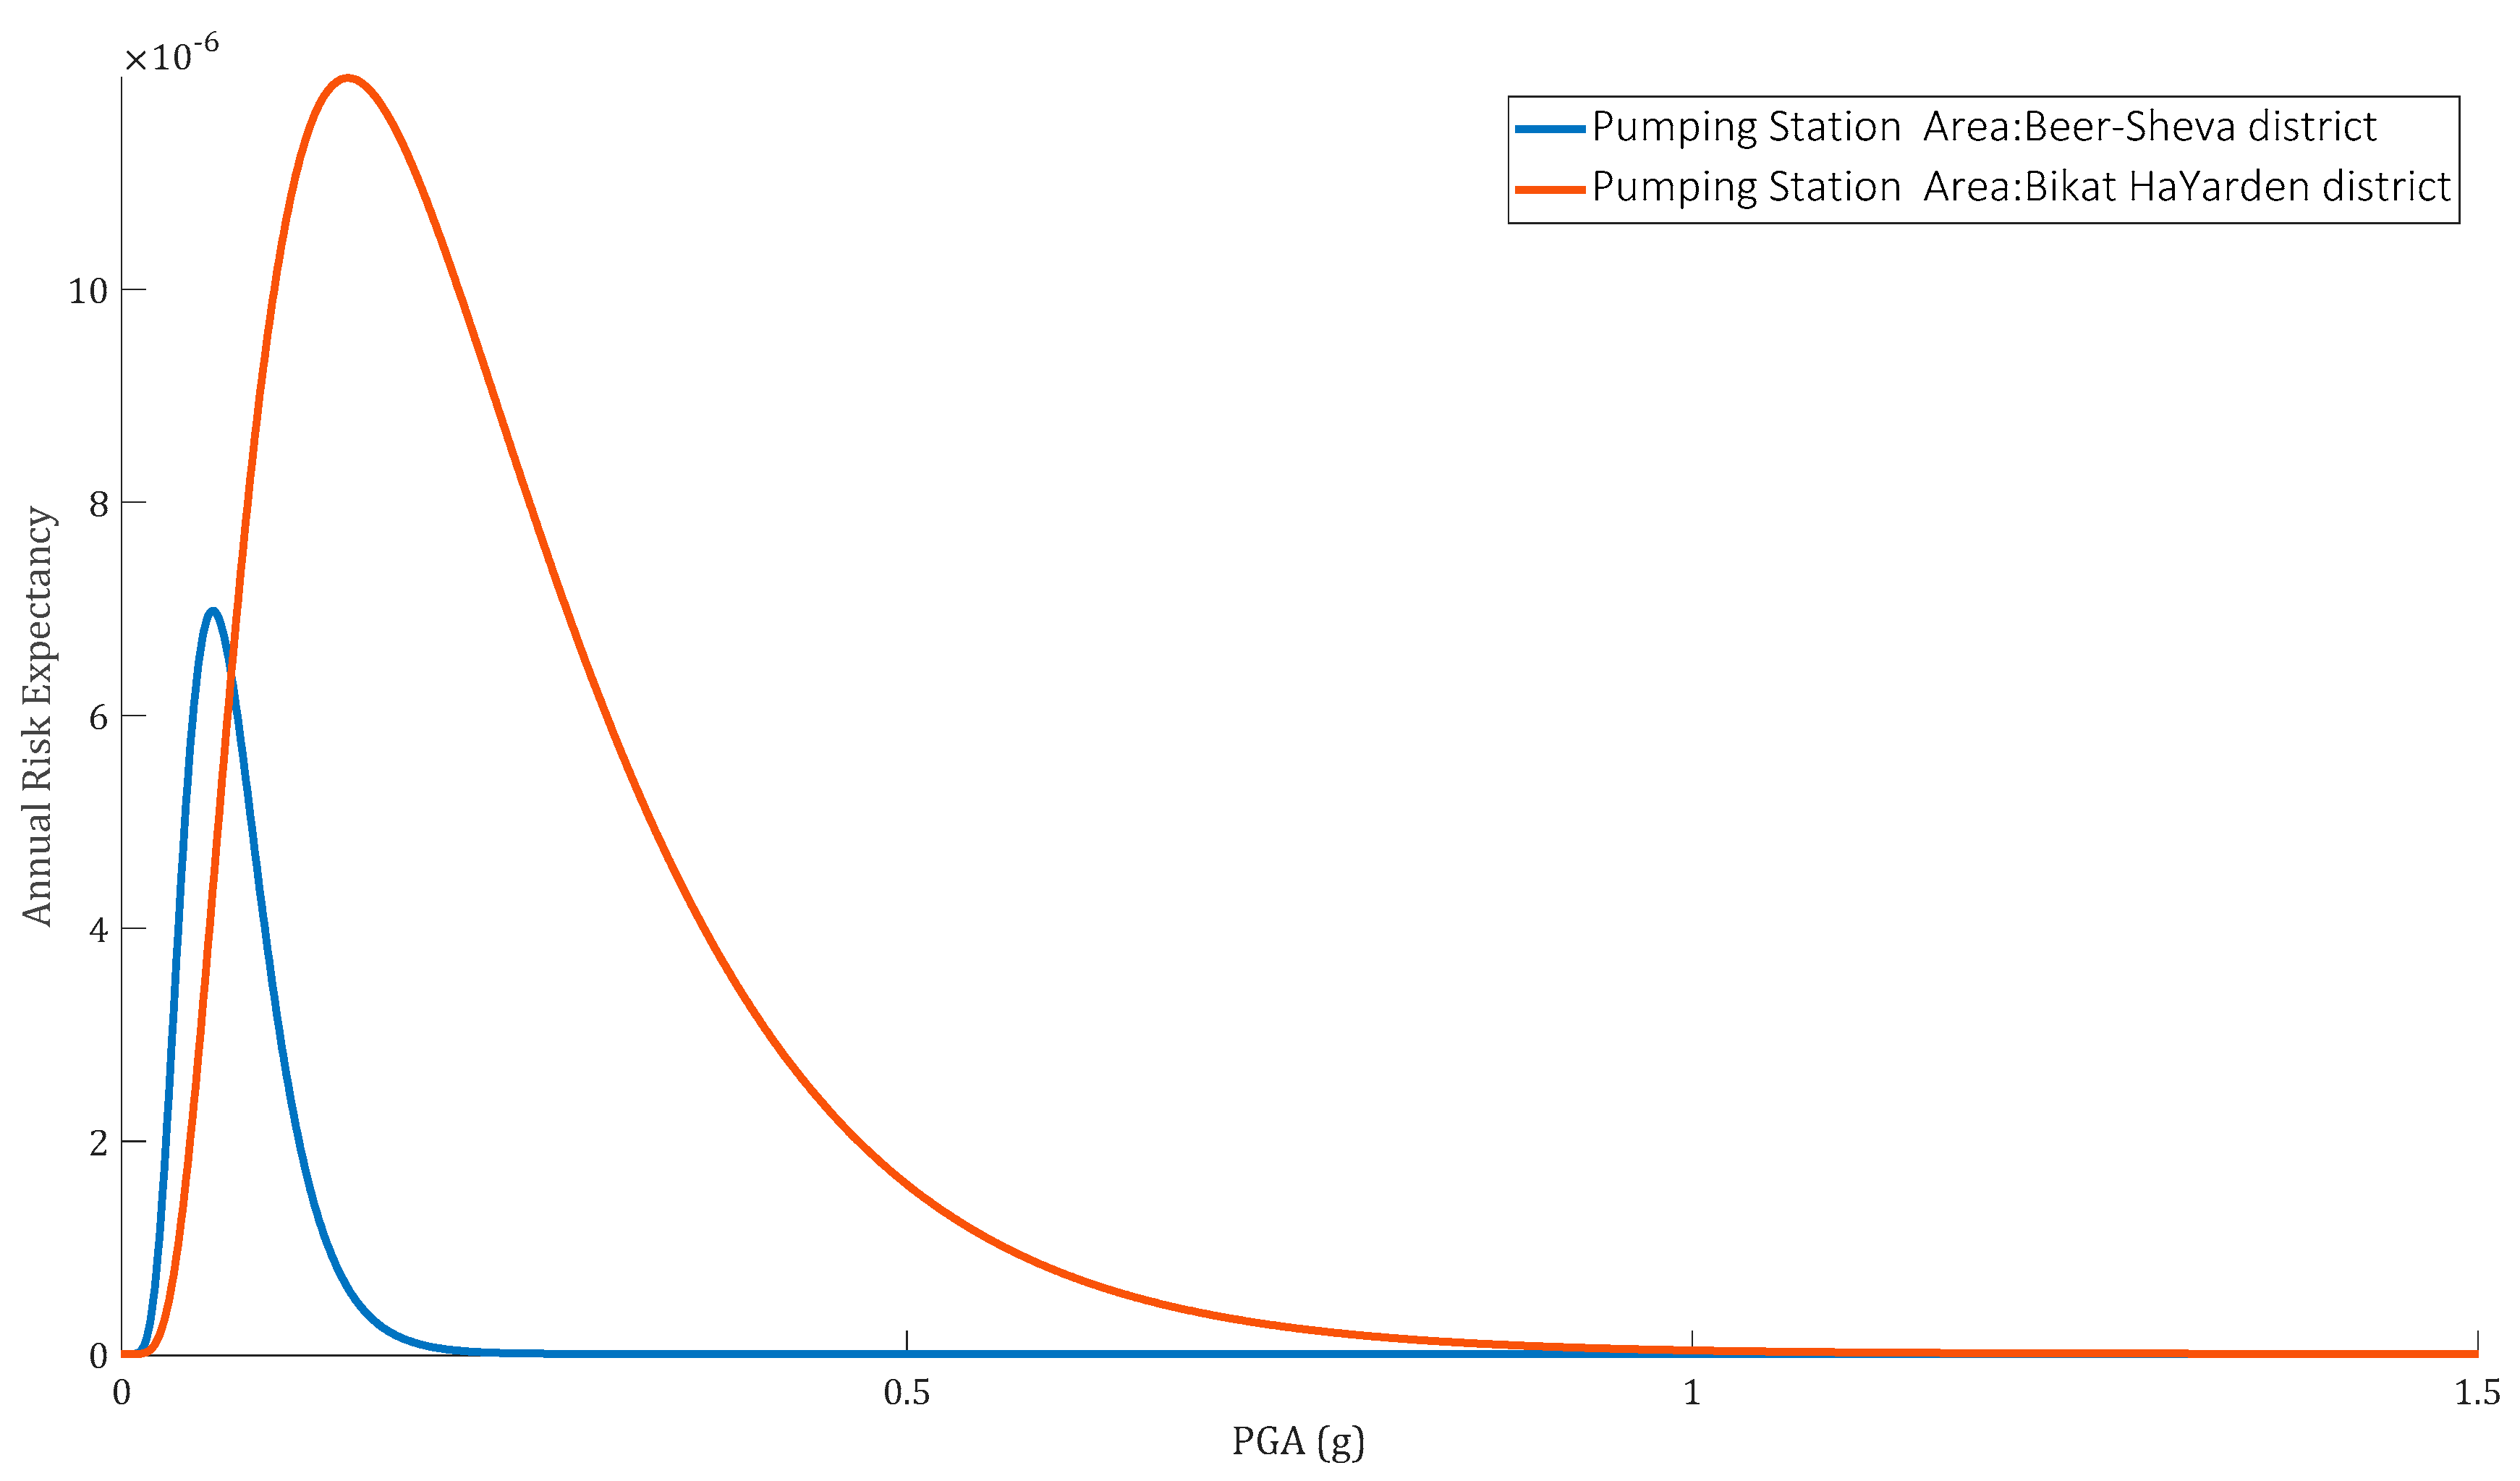
2.3. Quantitative Assessment of Risk
- —Repair cost (USD).
- —Direct loss (USD).
- —Indirect loss coefficient.
- —Overall consequences (USD).
- —Total risk expectancy for T years.
- —Damage rate of damage state i.
- —Conditional probability of being in a certain damage state for a given .
- —Design life cycle.
- —Annual rate of exceedance of a given .
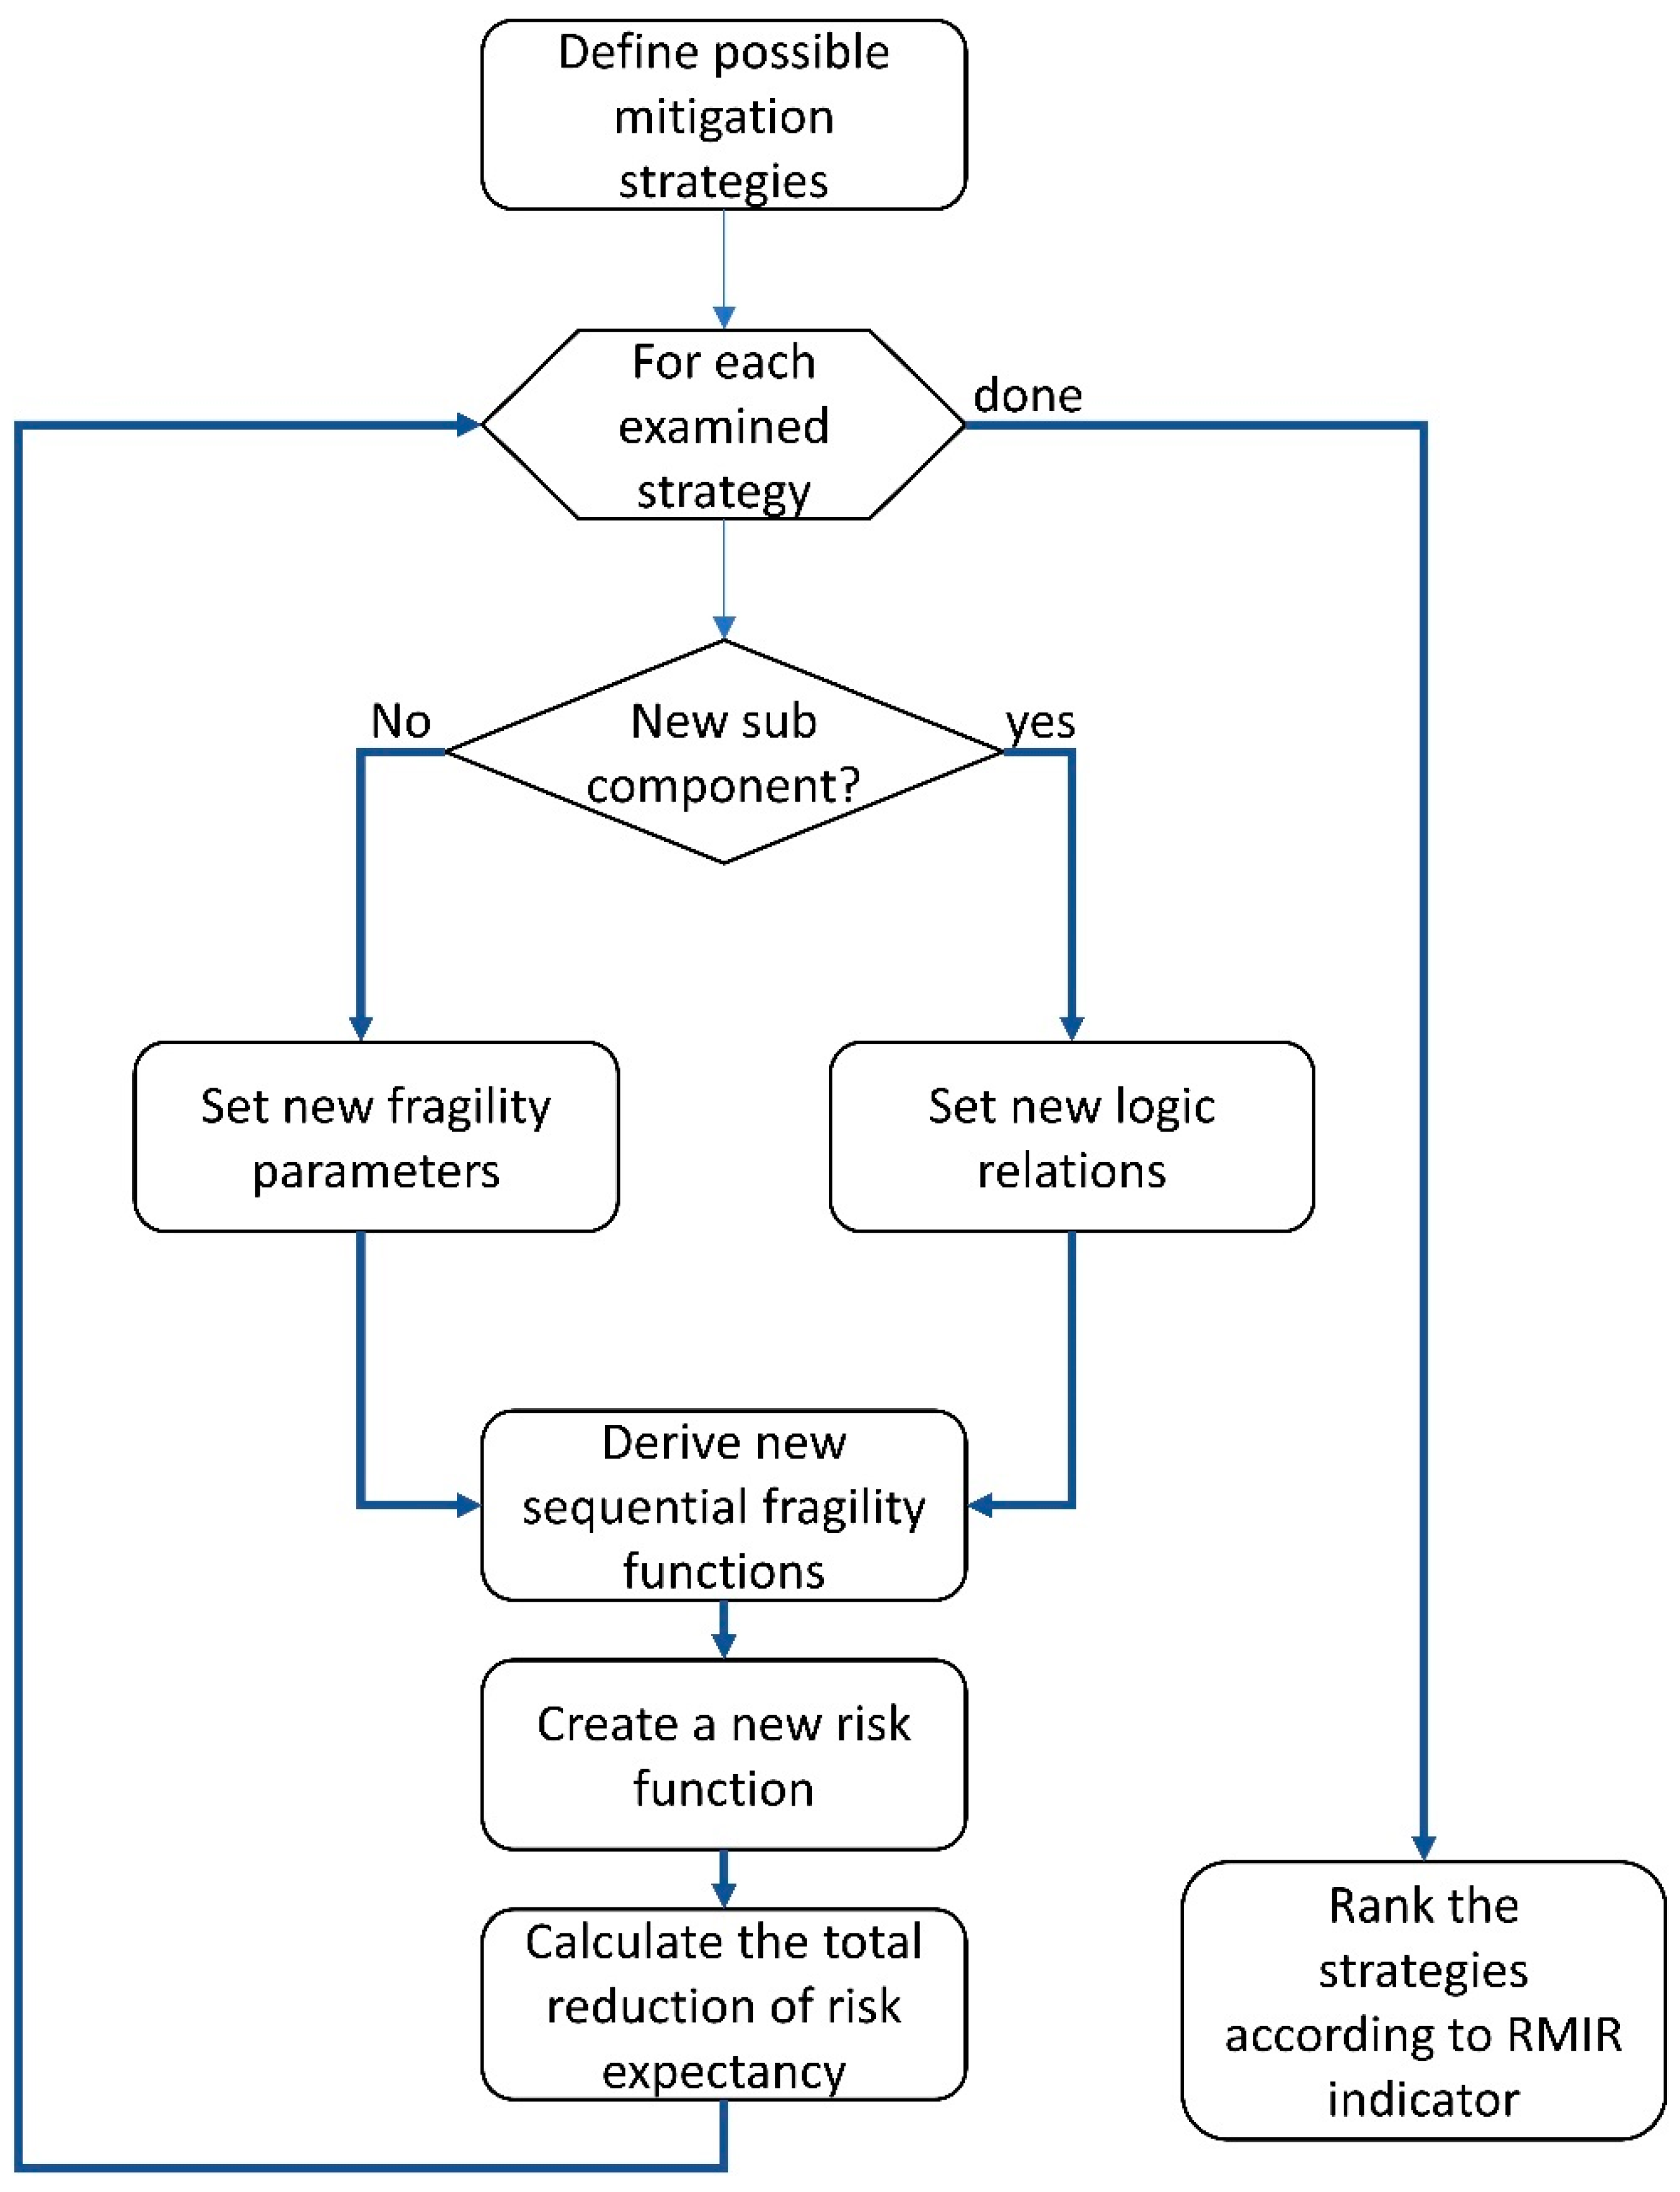
2.4. Implementation of Risk-Mitigation Alternatives and Prioritization of the Risk-Mitigation Alternatives
- —Risk mitigation to investment ratio.
- —Expected risk mitigation along T years of service life.
- —Estimated mitigation cost for the alternative.
3. Case Study
3.1. Introduction
3.2. Risk Appraisal
3.3. Examination of Possible Mitigation Alternatives
3.4. Results and Discussion
4. Conclusions
Author Contributions
Funding
Conflicts of Interest
References
- Urlainis, A.; Ornai, D.; Levy, R.; Vilnay, O.; Shohet, I.M. Loss and Damage Assessment in Critical Infrastructures Due to Extreme Events. Saf. Sci. 2022, 147, 105587. [Google Scholar] [CrossRef]
- Urlainis, A.; Shohet, I.M.; Levy, R.; Ornai, D.; Vilnay, O. Damage in Critical Infrastructures Due to Natural and Man-Made Extreme Events—A Critical Review. Procedia Eng. 2014, 85, 529–535. [Google Scholar] [CrossRef] [Green Version]
- Yu, J.; Cruz, A.M.; Piatyszek, E.; Lesbats, M.; Tardy, A.; Hokugo, A.; Tatano, H. A Survey of Impact on Industrial Parks Caused by the 2011 Great East Japan Earthquake and Tsunami. J. Loss Prev. Process Ind. 2017, 50, 317–324. [Google Scholar] [CrossRef]
- Moteff, J.; Parfomak, P. Critical Infrastructure and Key Assets: Definition and Identification; Library of Congress: Washington, DC, USA, 2004. [Google Scholar]
- Mendonça, D.; Lee, E.E., II; Wallace, W.A. Impact of the 2001 World Trade Center Attack on Critical Interdependent Infrastructures. In Proceedings of the 2004 IEEE International Conference on Systems, Man and Cybernetics, SMC 2004, The Hague, The Netherlands, 10–13 October 2004; Volume 5, pp. 4053–4058. [Google Scholar]
- Mendonça, D.; Wallace, W.A. Impacts of the 2001 World Trade Center Attack on New York City Critical Infrastructures. J. Infrastruct. Syst. 2006, 12, 260–270. [Google Scholar] [CrossRef] [Green Version]
- Johansson, J.; Hassel, H. An Approach for Modelling Interdependent Infrastructures in the Context of Vulnerability Analysis. Reliab. Eng. Syst. Saf. 2010, 95, 1335–1344. [Google Scholar] [CrossRef]
- Poljanšek, K.; Bono, F.; Gutiérrez, E. Seismic Risk Assessment of Interdependent Critical Infrastructure Systems: The Case of European Gas and Electricity Networks. Earthq. Eng. Struct. Dyn. 2012, 41, 61–79. [Google Scholar] [CrossRef]
- Ornai, D.; Elkabets, S.M.; Kivity, Y.; Ben-Dor, G.; Chadad, L.; Gal, E.; Tavron, B.; Gilad, E.; Levy, R.; Shohet, I.M. A Methodology of Risk Assessment, Management, and Coping Actions for Nuclear Power Plant (NPP) Hit by High-Explosive Warheads. Adv. Eng. Inform. 2020, 46, 101192. [Google Scholar] [CrossRef]
- Yao, X.; Wei, H.H.; Shohet, I.M.; Skibniewski, M.J. Assessment of Terrorism Risk to Critical Infrastructures: The Case of a Power-Supply Substation. Appl. Sci. 2020, 10, 7162. [Google Scholar] [CrossRef]
- Urlainis, A.; Shohet, I.M. Probabilistic Risk Appraisal and Mitigation of Critical Infrastructures for Seismic Extreme Events. In Proceedings of the Creative Construction Conference (CCC2018), Ljubljana, Slovenia, 30 June–3 July 2018. [Google Scholar]
- Lam, C.Y.; Shimizu, T. A Network Analytical Framework to Analyze Infrastructure Damage Based on Earthquake Cascades: A Study of Earthquake Cases in Japan. Int. J. Disaster Risk Reduct. 2021, 54, 102025. [Google Scholar] [CrossRef]
- Rinaldi, S.M.; Peerenboom, J.P.; Kelly, T.K. Identifying, Understanding, and Analyzing Critical Infrastructure Interdependencies. IEEE Control Syst. Mag. 2001, 21, 11–25. [Google Scholar] [CrossRef]
- Pescaroli, G.; Alexander, D. Critical Infrastructure, Panarchies and the Vulnerability Paths of Cascading Disasters. Nat. Hazards 2016, 82, 175–192. [Google Scholar] [CrossRef] [Green Version]
- Cutter, S.L. Compound, Cascading, or Complex Disasters: What’s in a Name? Environment 2018, 60, 16–25. [Google Scholar] [CrossRef]
- Shamseldin, A.; Lowrance, W.W. Of Acceptable Risk: Science and the Determination of Safety. J. Am. Stat. Assoc. 1978, 73, 686. [Google Scholar] [CrossRef] [Green Version]
- Haimes, Y.Y. Risk Modeling, Assessment, and Management, 3rd ed.; John Wiley & Sons: Hoboken, NJ, USA, 2008; ISBN 978-0-470-28237-3. [Google Scholar]
- Bozorgnia, Y.; Campbell, K.W. Chapter 5: Engineering Characterization of Ground Motion. In Earthquake Engineering: From Engineering Seismology to Performance-Based Engineering; CRC Press: Boca Raton, FL, USA, 2004; Volume 1, pp. 1–976. ISBN 9780429204968. [Google Scholar]
- Robinson, T.R.; Rosser, N.J.; Densmore, A.L.; Oven, K.J.; Shrestha, S.N.; Guragain, R. Use of Scenario Ensembles for Deriving Seismic Risk. Proc. Natl. Acad. Sci. USA 2018, 115, E9532–E9541. [Google Scholar] [CrossRef] [Green Version]
- Starita, S.; Scaparra, M.P. Optimizing Dynamic Investment Decisions for Railway Systems Protection. Eur. J. Oper. Res. 2016, 248, 543–557. [Google Scholar] [CrossRef] [Green Version]
- Rusydy, I.; Idris, Y.; Mulkal; Muksin, U.; Cummins, P.; Akram, M.N. Syamsidik Shallow Crustal Earthquake Models, Damage, and Loss Predictions in Banda Aceh, Indonesia. Geoenviron. Disasters 2020, 7, 8. [Google Scholar] [CrossRef]
- Oakes, B.D.; Mattsson, L.G.; Näsman, P.; Glazunov, A.A. A Systems-Based Risk Assessment Framework for Intentional Electromagnetic Interference (IEMI) on Critical Infrastructures. Risk Anal. 2018, 38, 1279–1305. [Google Scholar] [CrossRef]
- Cao, X.; Lam, J.S.L. Simulation-Based Catastrophe-Induced Port Loss Estimation. Reliab. Eng. Syst. Saf. 2018, 175, 1–12. [Google Scholar] [CrossRef]
- McDonald, M.; Mahadevan, S.; Ambrosiano, J.; Powell, D. Risk-Based Policy Optimization for Critical Infrastructure Resilience against a Pandemic Influenza Outbreak. ASCE ASME J. Risk Uncertain. Eng. Syst. A Civ. Eng. 2018, 4, 04018007. [Google Scholar] [CrossRef]
- Sucuoglu, H.; Akkar, S. Basic Earthquake Engineering: From Seismology to Analysis and Design, 2014th ed.; Springer: Cham, Switzerland, 2014; Volume 1, ISBN 9783319010250. [Google Scholar]
- Baker, J.W. Efficient Analytical Fragility Function Fitting Using Dynamic Structural Analysis. Earthq. Spectra 2015, 31, 579–599. [Google Scholar] [CrossRef]
- Abrahamson, N.A.; Kuehn, N.M.; Walling, M.; Landwehr, N. Probabilistic Seismic Hazard Analysis in California Using Nonergodic Ground-Motion Models. Bull. Seismol. Soc. Am. 2019, 109, 1235–1249. [Google Scholar] [CrossRef]
- Giardini, D.; Danciu, L.; Erdik, M.; Şeşetyan, K.; Demircioğlu Tümsa, M.B.; Akkar, S.; Gülen, L.; Zare, M. Seismic Hazard Map of the Middle East. Bull. Earthq. Eng. 2018, 16, 3567–3570. [Google Scholar] [CrossRef]
- Akkar, S.; Kale, Ö.; Yakut, A.; Çeken, U. Ground-Motion Characterization for the Probabilistic Seismic Hazard Assessment in Turkey. Bull. Earthq. Eng. 2018, 16, 3439–3463. [Google Scholar] [CrossRef]
- Peñarubia, H.C.; Johnson, K.L.; Styron, R.H.; Bacolcol, T.C.; Sevilla, W.I.G.; Perez, J.S.; Bonita, J.D.; Narag, I.C.; Solidum, R.U.; Pagani, M.M.; et al. Probabilistic Seismic Hazard Analysis Model for the Philippines. Earthq. Spectra 2020, 36 (Suppl. 1), 44–68. [Google Scholar] [CrossRef]
- Mulargia, F.; Stark, P.B.; Geller, R.J. Why Is Probabilistic Seismic Hazard Analysis (PSHA) Still Used? Phys. Earth Planet. Inter. 2017, 264, 63–75. [Google Scholar] [CrossRef]
- Vona, M.; Flora, A.; Carlucci, E.; Foscolo, E.; Aprile, A.; Monti, G. Seismic Retrofitting Resilience-Based for Strategic RC Buildings. Buildings 2021, 11, 111. [Google Scholar] [CrossRef]
- Menna, C.; Felicioni, L.; Negro, P.; Lupíšek, A.; Romano, E.; Prota, A.; Hájek, P. Review of Methods for the Combined Assessment of Seismic Resilience and Energy Efficiency towards Sustainable Retrofitting of Existing European Buildings. Sustain. Cities Soc. 2022, 77, 103556. [Google Scholar] [CrossRef]
- Tena-Colunga, A.; Godínez-Domínguez, E.A.; Hernández-Ramírez, H. Seismic Retrofit and Strengthening of Buildings. Observations from the 2017 Puebla-Morelos Earthquake in Mexico City. J. Build. Eng. 2022, 47, 103916. [Google Scholar] [CrossRef]
- Crespi, P.; Zucca, M.; Valente, M.; Longarini, N. Influence of Corrosion Effects on the Seismic Capacity of Existing RC Bridges. Eng. Fail. Anal. 2022, 140, 106546. [Google Scholar] [CrossRef]
- Afrouz, S.G.; Farzampour, A.; Hejazi, Z.; Mojarab, M. Evaluation of Seismic Vulnerability of Hospitals in the Tehran Metropolitan Area. Buildings 2021, 11, 54. [Google Scholar] [CrossRef]
- Dolce, M.; Prota, A.; Borzi, B.; da Porto, F.; Lagomarsino, S.; Magenes, G.; Moroni, C.; Penna, A.; Polese, M.; Speranza, E.; et al. Seismic Risk Assessment of Residential Buildings in Italy. Bull. Earthq. Eng. 2021, 19, 2999–3032. [Google Scholar] [CrossRef]
- Flenga, M.G.; Favvata, M.J. Fragility Curves and Probabilistic Seismic Demand Models on the Seismic Assessment of RC Frames Subjected to Structural Pounding. Appl. Sci. 2021, 11, 8253. [Google Scholar] [CrossRef]
- O’Rourke, M.J.; So, P. Seismic Fragility Curves for On-Grade Steel Tanks. Earthq. Spectra 2000, 16, 801–815. [Google Scholar] [CrossRef]
- Razzaghi, M.S.; Eshghi, S. Probabilistic Seismic Safety Evaluation of Precode Cylindrical Oil Tanks. J. Perform. Constr. Facil. 2015, 29. [Google Scholar] [CrossRef]
- Rosti, A.; del Gaudio, C.; Rota, M.; Ricci, P.; di Ludovico, M.; Penna, A.; Verderame, G.M. Empirical Fragility Curves for Italian Residential RC Buildings. Bull. Earthq. Eng. 2021, 19, 3165–3183. [Google Scholar] [CrossRef]
- Rosti, A.; Rota, M.; Penna, A. Empirical Fragility Curves for Italian URM Buildings. Bull. Earthq. Eng. 2021, 19, 1–20. [Google Scholar] [CrossRef]
- Rahmani, A.Y.; Bourahla, N.; Bento, R.; Badaoui, M. An Improved Upper-Bound Pushover Procedure for Seismic Assessment of High-Rise Moment Resisting Steel Frames. Bull. Earthq. Eng. 2018, 16, 315–339. [Google Scholar] [CrossRef]
- Amin, J.; Gondaliya, K.; Mulchandani, C. Assessment of Seismic Collapse Probability of RC Shaft Supported Tank. Structures 2021, 33, 2639–2658. [Google Scholar] [CrossRef]
- Belejo, A.; Bento, R. Improved Modal Pushover Analysis in Seismic Assessment of Asymmetric Plan Buildings under the Influence of One and Two Horizontal Components of Ground Motions. Soil Dyn. Earthq. Eng. 2016, 87, 1–15. [Google Scholar] [CrossRef]
- Porter, K.; Hamburger, R.; Kennedy, R. Practical Development and Application of Fragility Functions. In Proceedings of the Research Frontiers at Structures Congress 2007, Long Beach, CA, USA, 20 June 2007. [Google Scholar]
- Gehl, P.; Desramaut, N.; Réveillère, A.; Modaressi, H. Fragility Functions of Gas and Oil Networks. In SYNER-G: Typology Definition and Fragility Functions for Physical Elements at Seismic Risk; Springer: Dordrecht, The Netherlands, 2014; Volume 1, ISBN 9789400778719. [Google Scholar]
- ALA. ALA Seismic Fragility Formulations For Water Systems. In Alliance American Lifelines (ALA); ASCE-FEMA: Reston, VA, USA, 2001; p. 104. [Google Scholar]
- NIBS. HAZUS-MH: Users’s Manual and Technical Manuals. Report Prepared for the Federal Emergency Management Agency; National Institute of Building Sciences, Federal Emergency Management Agency (FEMA): Washington, DC, USA, 2004. [Google Scholar]
- Rossetto, T.; D’Ayala, D.; Ioannou, I.; Meslem, A. Evaluation of Existing Fragility Curves. In SYNER-G: Typology Definition and Fragility Functions for Physical Elements at Seismic Risk; Pitilakis, K., Crowley, H., Kaynia, A., Eds.; Springer: Dordrecht, The Netherlands, 2014. [Google Scholar] [CrossRef]
- Urlainis, A.; Shohet, I.M. Development of Exclusive Seismic Fragility Curves for Critical Infrastruc-Ture: An Oil Pumping Station Case Study. Buildings 2022, 12, 842. [Google Scholar] [CrossRef]
- Carreño, M.L.; Cardona, O.D.; Barbat, A.H. A Disaster Risk Management Performance Index. Nat. Hazards 2007, 41, 1–20. [Google Scholar] [CrossRef]
- Carreño, M.L.; Cardona, O.D.; Barbat, A.H. New Methodology for Urban Seismic Risk Assessment from a Holistic Perspective. Bull. Earthq. Eng. 2012, 10, 547–565. [Google Scholar] [CrossRef]
- Lantada, N.; Carreño, M.L.; Jaramillo, N. Disaster Risk Reduction: A Decision-Making Support Tool Based on the Morphological Analysis. Int. J. Disaster Risk Reduct. 2020, 42, 101342. [Google Scholar] [CrossRef]
- Zhang, Y.; Weng, W.G.; Huang, Z.L. A Scenario-Based Model for Earthquake Emergency Management Effectiveness Evaluation. Technol. Soc. Chang. 2018, 128, 197–207. [Google Scholar] [CrossRef]
- Nuzzo, I.; Caterino, N.; Novellino, A.; Occhiuzzi, A.; Ditommaso, R.; di Cesare, A.; Shohet, I.M.; Asteris, P.G. Computer-Aided Decision Making for Regional Seismic Risk Mitigation Accounting for Limited Economic Resources. Appl. Sci. 2021, 11, 5539. [Google Scholar] [CrossRef]
- Baker, J.; Bradley, B.; Stafford, P. Seismic Hazard and Risk Analysis; Cambridge University Press: Cambridge, UK, 2021; ISBN 978-1-108-42505-6. [Google Scholar]
- Klar, A.; Meirova, T.; Zaslavsky, Y.; Shapira, A. Spectral Acceleration Maps for Use in SI 413 Amendment No.5; The Geophysical Institute of Israel: Jerusalem, Israel, 2011. [Google Scholar]
- Yum, S.-G.G.; Kim, J.-M.M.; Wei, H.H. Development of Vulnerability Curves of Buildings to Windstorms Using Insurance Data: An Empirical Study in South Korea. J. Build. Eng. 2020, 34, 101932. [Google Scholar] [CrossRef]
- Shmerling, A.; Gerdts, M. Optimization of Inelastic Multistory Structures under Seismic Vibrations Using Shape-Memory-Alloy Material. Sci. Rep. 2022, 12, 16844. [Google Scholar] [CrossRef]
- Abbaszadeh, A.; Chaallal, O. Enhancing Resilience and Self-Centering of Existing RC Coupled and Single Shear Walls Using EB-FRP: State-of-the-Art Review and Research Needs. J. Compos. Sci. 2022, 6, 301. [Google Scholar] [CrossRef]


| Alternative No. | Building | Pump | Power Supply | Estimated Cost (USD) |
|---|---|---|---|---|
| 1 | C1L | Single pump | Only Grid | - |
| 2 | C1L | Single pump | Grid + Generator w/o | 70,000 |
| 3 | C1L | Single pump | Grid + Gen with Isolation | 80,500 |
| 4 | C1L | Two pumps | Only Grid | 250,000 |
| 5 | C1L | Two pumps | Grid + Generator w/o | 320,000 |
| 6 | C1L | Two pumps | Grid + Gen with Isolation | 330,500 |
| 7 | C2L | Single pump | Only Grid | 100,000 |
| 8 | C2L | Single pump | Grid + Generator w/o | 170,000 |
| 9 | C2L | Single pump | Grid + Gen with Isolation | 180,500 |
| 10 | C2L | Two pumps | Only Grid | 350,000 |
| 11 | C2L | Two pumps | Grid + Generator w/o | 420,000 |
| 12 | C2L | Two pumps | Grid + Gen with Isolation | 430,500 |
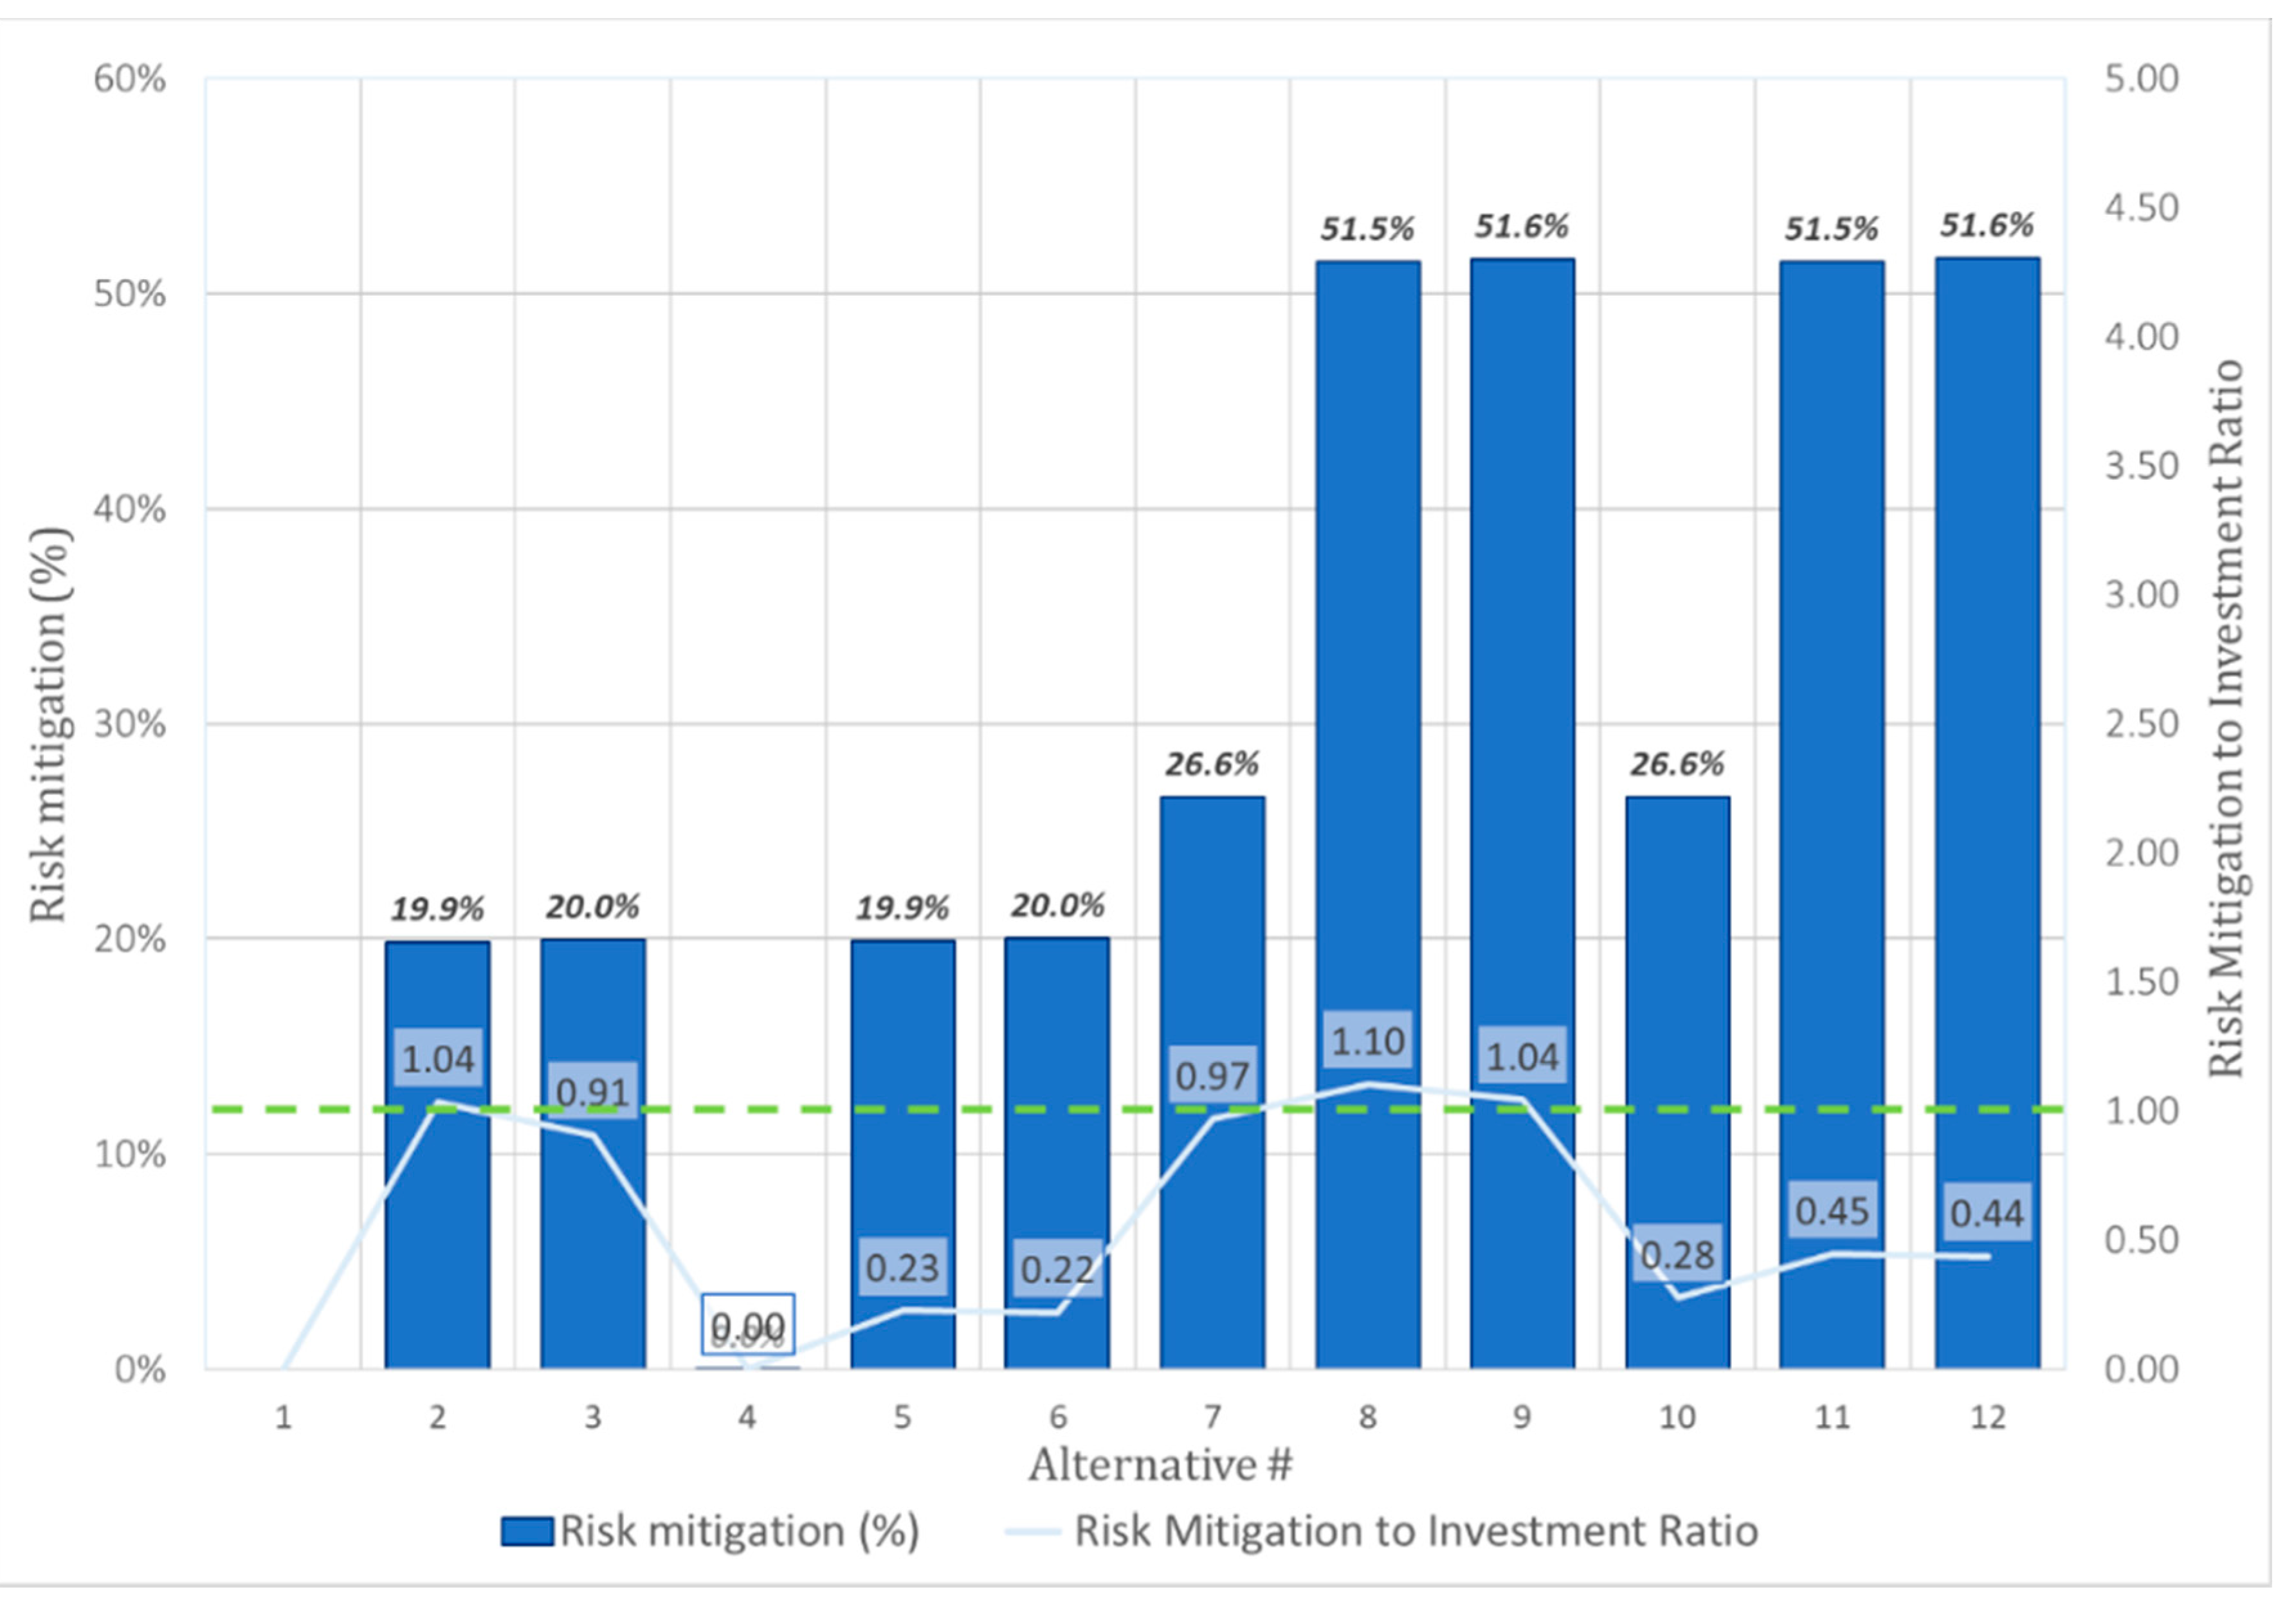
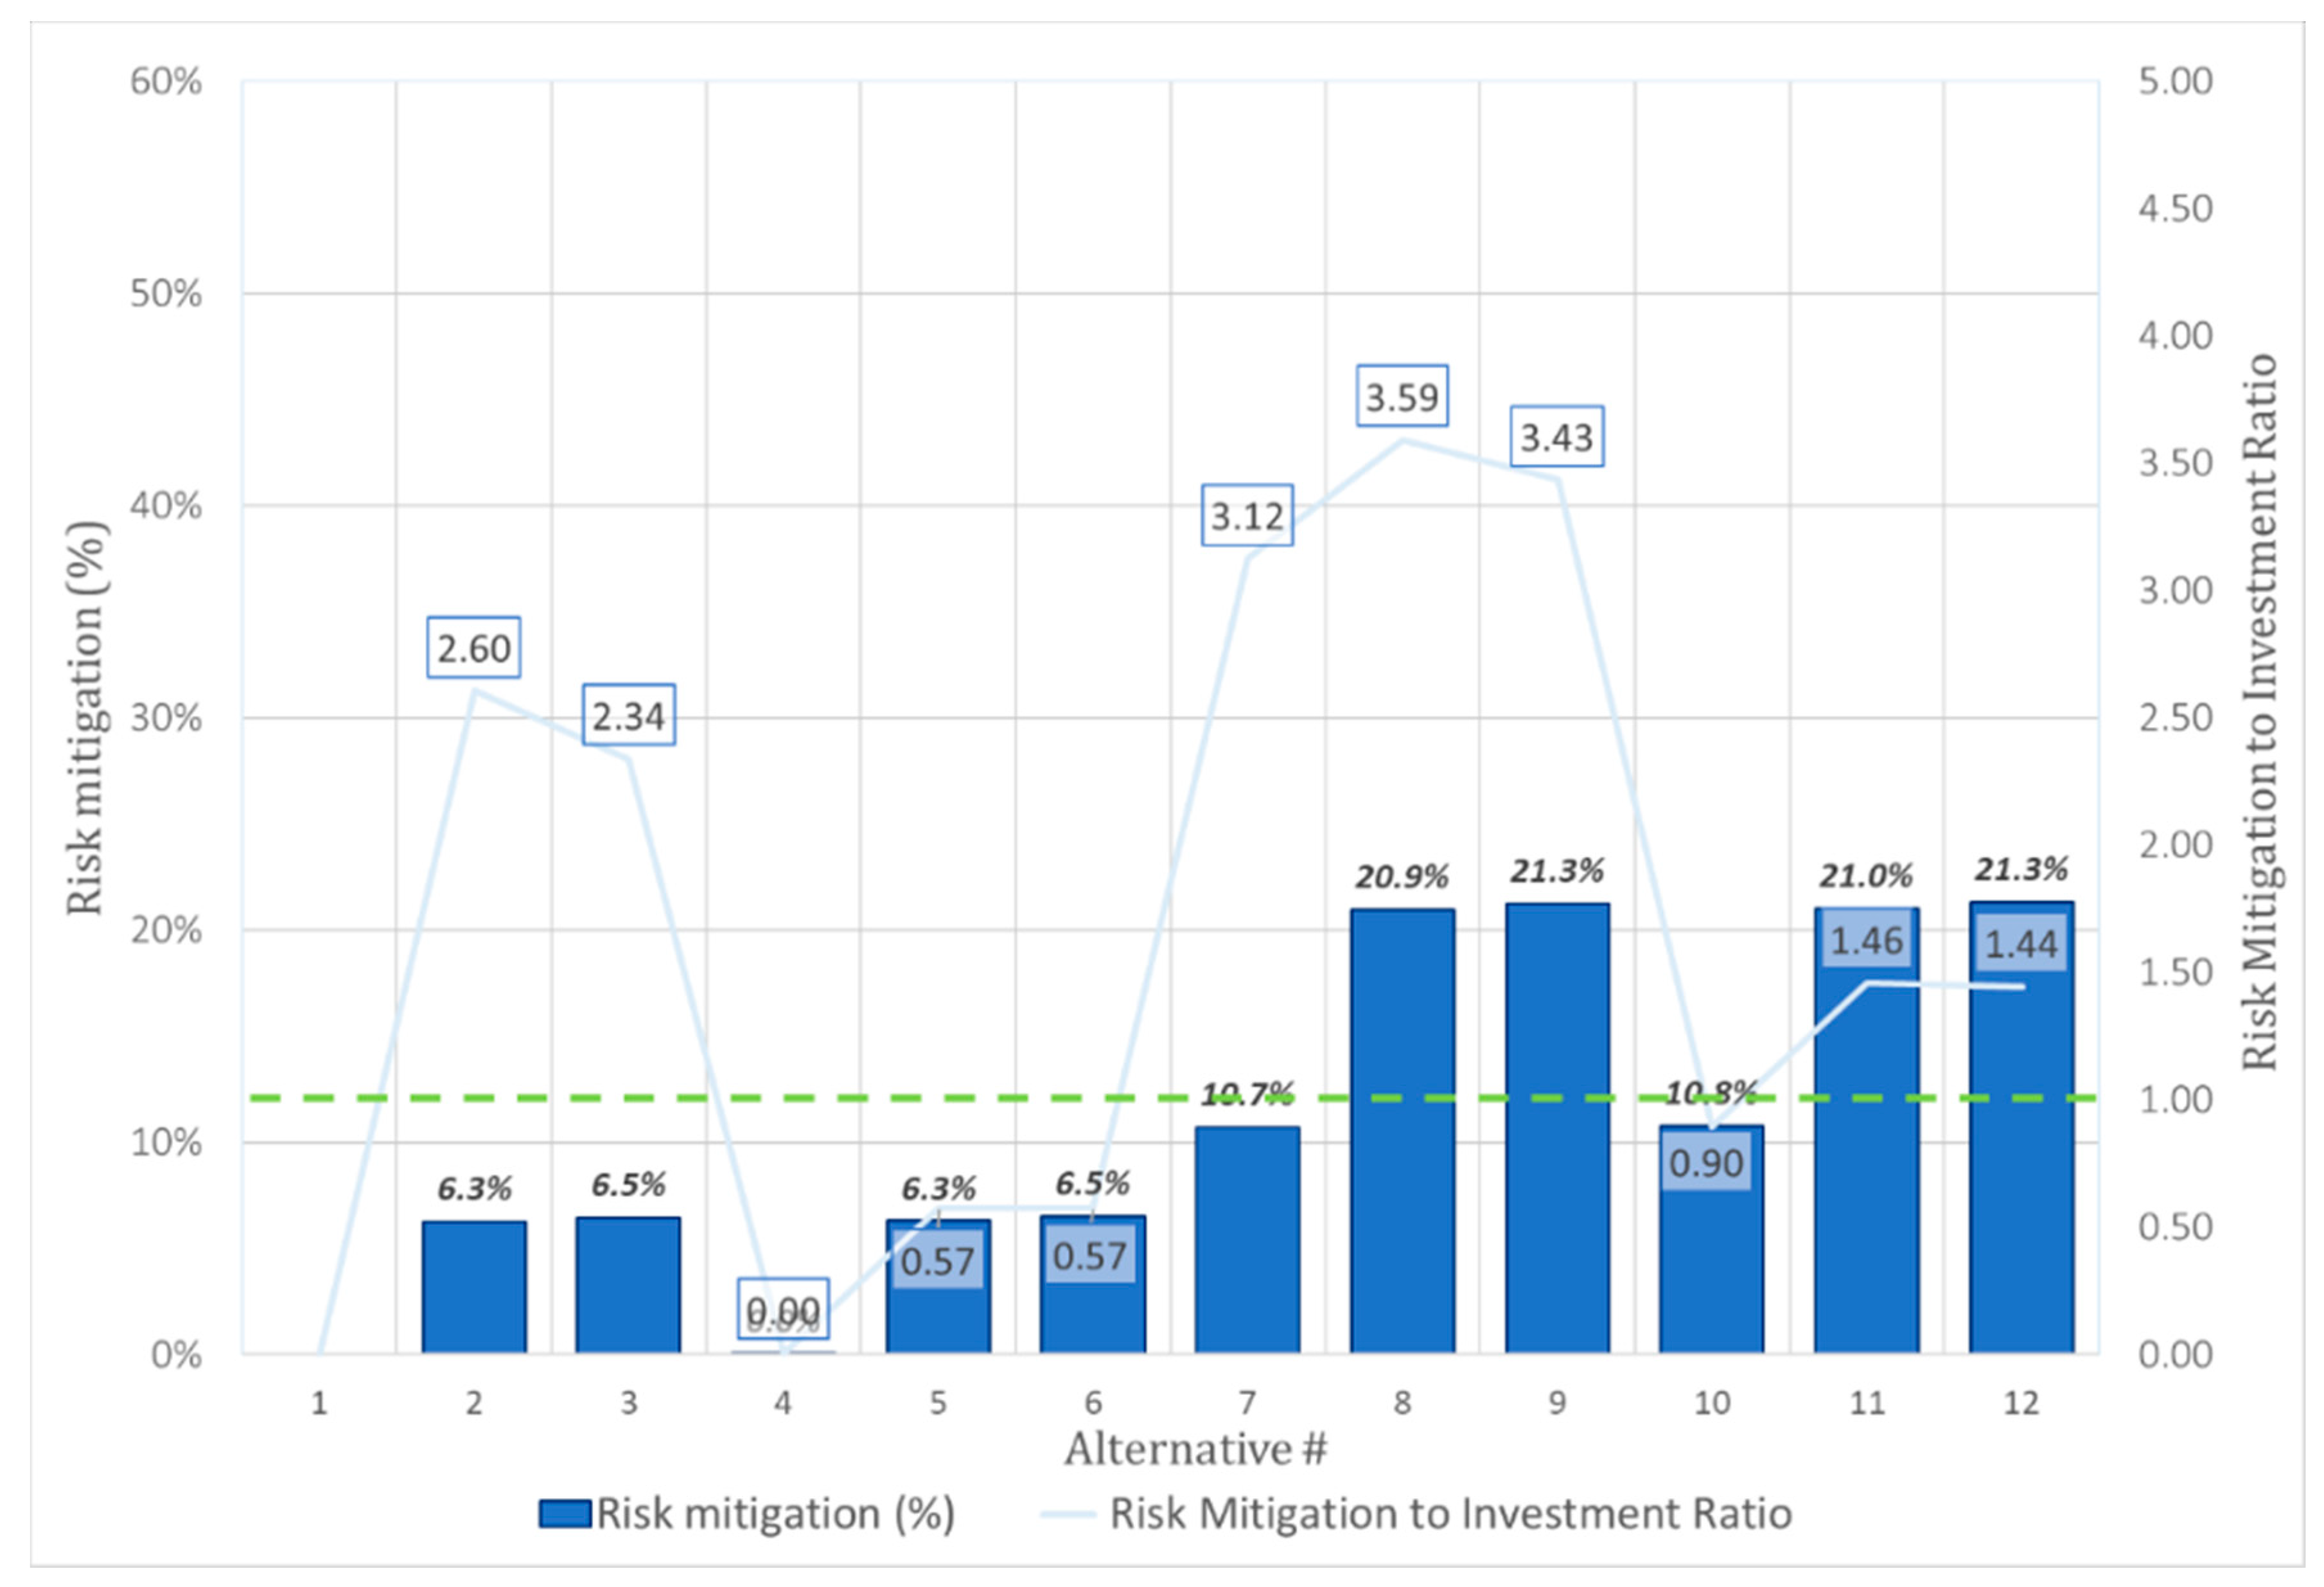
| Mitigation Alternative | Be’er Sheva Region | Bik’at HaYarden Region | |||||
|---|---|---|---|---|---|---|---|
| # | Estimated Mitigation Cost (USD) | ||||||
| 1 | - | 364,721 | 0% (USD 0) | - | 2,913,852 | 0% (USD 0) | - |
| 2 | 70,000 | 292,256 | 19.9% (USD 72,465) | 1.035 | 2,731,600 | 6.3% (USD 182,252) | 2.604 |
| 3 | 80,500 | 291,842 | 20% (USD 72,879) | 0.905 | 2,725,695 | 6.5% (USD 188,156) | 2.337 |
| 4 | 250,000 | 364,692 | 0% (USD 30) | 0 | 2,913,062 | 0% (USD 789) | 0.003 |
| 5 | 320,000 | 292,208 | 19.9% (USD 72,514) | 0.227 | 2,730,594 | 6.3% (USD 183,257) | 0.573 |
| 6 | 330,500 | 291,772 | 20% (USD 72,949) | 0.221 | 2,724,603 | 6.5% (USD 189,249) | 0.573 |
| 7 | 100,000 | 267,820 | 26.6% (USD 96,901) | 0.969 | 2,601,564 | 10.7% (USD 312,288) | 3.123 |
| 8 | 170,000 | 177,057 | 51.5% (USD 187,665) | 1.104 | 2,303,721 | 20.9% (USD 610,131) | 3.589 |
| 9 | 180,500 | 176,453 | 51.6% (USD 188,268) | 1.043 | 2,294,304 | 21.3% (USD 619,548) | 3.432 |
| 10 | 350,000 | 267,810 | 26.6% (USD 96,911) | 0.277 | 2,600,415 | 10.8% (USD 313,437) | 0.896 |
| 11 | 420,000 | 176,955 | 51.5% (USD 187,766) | 0.447 | 2,301,969 | 21% (USD 611,882) | 1.457 |
| 12 | 430,500 | 176,380 | 51.6% (USD 188,341) | 0.437 | 2,292,495 | 21.3% (USD 621,356) | 1.443 |
Publisher’s Note: MDPI stays neutral with regard to jurisdictional claims in published maps and institutional affiliations. |
© 2022 by the authors. Licensee MDPI, Basel, Switzerland. This article is an open access article distributed under the terms and conditions of the Creative Commons Attribution (CC BY) license (https://creativecommons.org/licenses/by/4.0/).
Share and Cite
Urlainis, A.; Shohet, I.M. Seismic Risk Mitigation and Management for Critical Infrastructures Using an RMIR Indicator. Buildings 2022, 12, 1748. https://doi.org/10.3390/buildings12101748
Urlainis A, Shohet IM. Seismic Risk Mitigation and Management for Critical Infrastructures Using an RMIR Indicator. Buildings. 2022; 12(10):1748. https://doi.org/10.3390/buildings12101748
Chicago/Turabian StyleUrlainis, Alon, and Igal M. Shohet. 2022. "Seismic Risk Mitigation and Management for Critical Infrastructures Using an RMIR Indicator" Buildings 12, no. 10: 1748. https://doi.org/10.3390/buildings12101748