Article

Efficiency of an Improved Grouted Corrugated Duct (GCD) Connection Design for Precast Concrete Bridge Pier: Numerical and Parametric Study

Department of Bridge Engineering, Tongji University, 1239 Siping Road, Shanghai 200092, China
*
Author to whom correspondence should be addressed.
Buildings 2023, 13(1), 227; https://doi.org/10.3390/buildings13010227
Submission received: 14 December 2022 / Revised: 9 January 2023 / Accepted: 11 January 2023 / Published: 13 January 2023
(This article belongs to the Special Issue Seismic Risk Analysis and Management of Structure Systems)

Abstract

:
In this study, finite element analysis (FEA) has been conducted for an improved grouted corrugated duct (GCD) connection design with a reserved recess in bridge footing. This study aims to understand the damage progression mechanism and to evaluate the contribution of each component in the improved GCD connection design. Numerical model based on the experimental results are first created, validated and calibrated. It is found that the confining effect (support and friction force) provided by recess sidewall keeps the connection in good integrity. It also prevents early deformation and early development of transverse cracks along the connection interface, which further avoids the damage concentration at connection joint, transfers the plastic hinge region. Parametric study is then carried out by considering different recess depths, cushion thicknesses, recess diameters, and mortar strengths. The effect of recess details on mechanical behavior is thus studied. Recess depth can be designed as 6–20% of the column section size to ensure a higher upper limit of overall strength and ductility, and it also influences the stress distribution area of the joint local. The stiffness and strength of recess control the local damage, while has limited impact on the overall performance. In addition, preliminary suggestions on the GCD design of recess depth, thickness of mortar cushion, recess diameter, the strength of mortar are proposed.

1. Introduction

With the development of prefabrication technology, grouted corrugated duct (GCD) connection has attracted wide attention in several practical engineering application, such as HfL projects in Iowa [1] and Washington [2], as well as S6, S7 and G320 Highways in Shanghai [3]. There are mainly three types of GCDs, including plastic duct, galvanized metal duct, and improved cold formed duct [4]. GCD connection takes advantage of anchoring force of high strength mortar and transfers the force from inserted rebar to the duct. The anchorage of GCDs has been studied in various cases: with large-diameter rebar [5], with additional stainless energy dissipation bars [6], with bundled bars [7], under low temperature [8], or under cycling loading [9]. Formulas on anchorage length and several anchoring measures were also proposed, to prevent pull-out failures. Quasistatic tests [3,10,11,12,13] and shaking table tests [14] further confirmed the reliability of GCD connection.
For a precast bridge pier, the GCDs can be placed in cap beam or footing, accommodating the protruding rebars of pier column. Under earthquake input, the GCDs need to make sure internal force can be effectively transferred along the designed path, and failure of connection do not occur prior to the appearance of plastic hinge, which is emulative of cast-in-place (CIP). Experimental studies found the precast pier with GCD connections had more concentrated plastic hinge region than CIP pier. Pang et al. pointed out a remarkable difference between the precast and CIP columns from deformation distribution [10]. The plastic length of GCD was found to be approximately equal to half the column section depth and that for CIP was approximately equal to section depth [3,11,13]. In addition, an improved GCD connection design with shallow recess in the footing was developed for better integrity [4], and the spalling height was approximately equal to column section depth, which coincided with precast pier hinge length with socket connection [12,15] and CIP hinge length. While this showed that such design improved the overall seismic performance and durability, it is difficult to probe the mechanism from the experimental results alone.
Finite element analysis (FEA) can capture certain characteristics of some hard-to-observe parameters from the test. FEA was carried out for the quasistatic test of conventional reinforced concrete piers and reinforced concrete column with shape steel, respectively [16,17]. Li et al. studied the shear resistance of precast piers with different connection joint under quasistatic loading by FEA [18]. More studies utilized FEA to understand the performance of posttensioned segmental piers. Zhong et al. studied the seismic resilience of precast composite link beam connected to bridge piers (Seismic fragility and resilience assessment of bridge columns with dual-replaceable composite link beam under near-fault GMs) [19]. Ou et al. studied the seismic performance of segmental precast unbonded posttensioned concrete bridge columns, considering the joint contact, geometric nonlinearity, and confine effect on concrete by a discrete reinforcement model [20]. Finite element models were used for comparison and calibration of the proposed simplified analysis model. Dawood et al. conducted a pushover analysis on segmental unbonded posttensioned pier, using a confined concrete stress–strain model [21]. It was found that the numerical analysis could simulate the early damage development and the general behavior, but postyield strength was not well tracked. Nikbakh et al. modeled the segmental posttensioned pier, compared with CIP model, and studied the energy absorption effect by shape memory alloy or mild steel through the segment interface [22,23]. Leitner and Hao numerically analyzed the performance of fiber-reinforced-polymer wrapped rocking pier [24]. Zhong et al. simulated the hysteretic behavior, damage states and seismic demands of aging bridge piers [25]. The strength degradation behavior, energy dissipation capacity and residual displacement were well simulated by FEA, but the strength and stiffness could not be simulated simultaneously. Compared to the simplified or fiber models, the three-dimensional (3D) solid finite element model is able to represent the failure mechanism more accurately and to simulate the nonlinear shear effects more effectively [26].
The methodology of FEA simulating the experimental results followed by further parameter sensibility analysis was adopted by some studies, including the previously mentioned studies [21,23,24]. Moon et al. conducted FEA of the cast-in-steel-shell pile to reinforced concrete pier connection [27]. A monolithic pushover loading was performed. Compared with cycling test results, the stiffness and peak strength of model were similar. The parametric study analyzed five parameters from 40 models, and the weight and dispersion of the influence of each parameter were compared. Design suggestion was proposed following the comparison with existing design code.
Many studies have been developed for the rocking pier, while the simulation of precast piers that are emulative performance of CIP columns with plastic damage under earthquakes are scarce. To the authors’ knowledge, the analysis on the effect of the recess design details on overall performance of precast pier with GCD connection has never been performed. FEA is thus needed to better quantify the improved design via parametric analysis. Therefore, this paper presents 3D finite element models of the improved GCD connection design, based on physical experimental data. Section 2 briefly introduced the experiment. The models are first calibrated and validated based on the results of experimental investigations in Section 3, to explain the mechanism that improved design had a better performance found in the experiment. The effects of recess depth and diameter, mortar cushion thickness, and mortar strength are then parametrically investigated in Section 4, to provide better references for such new design.

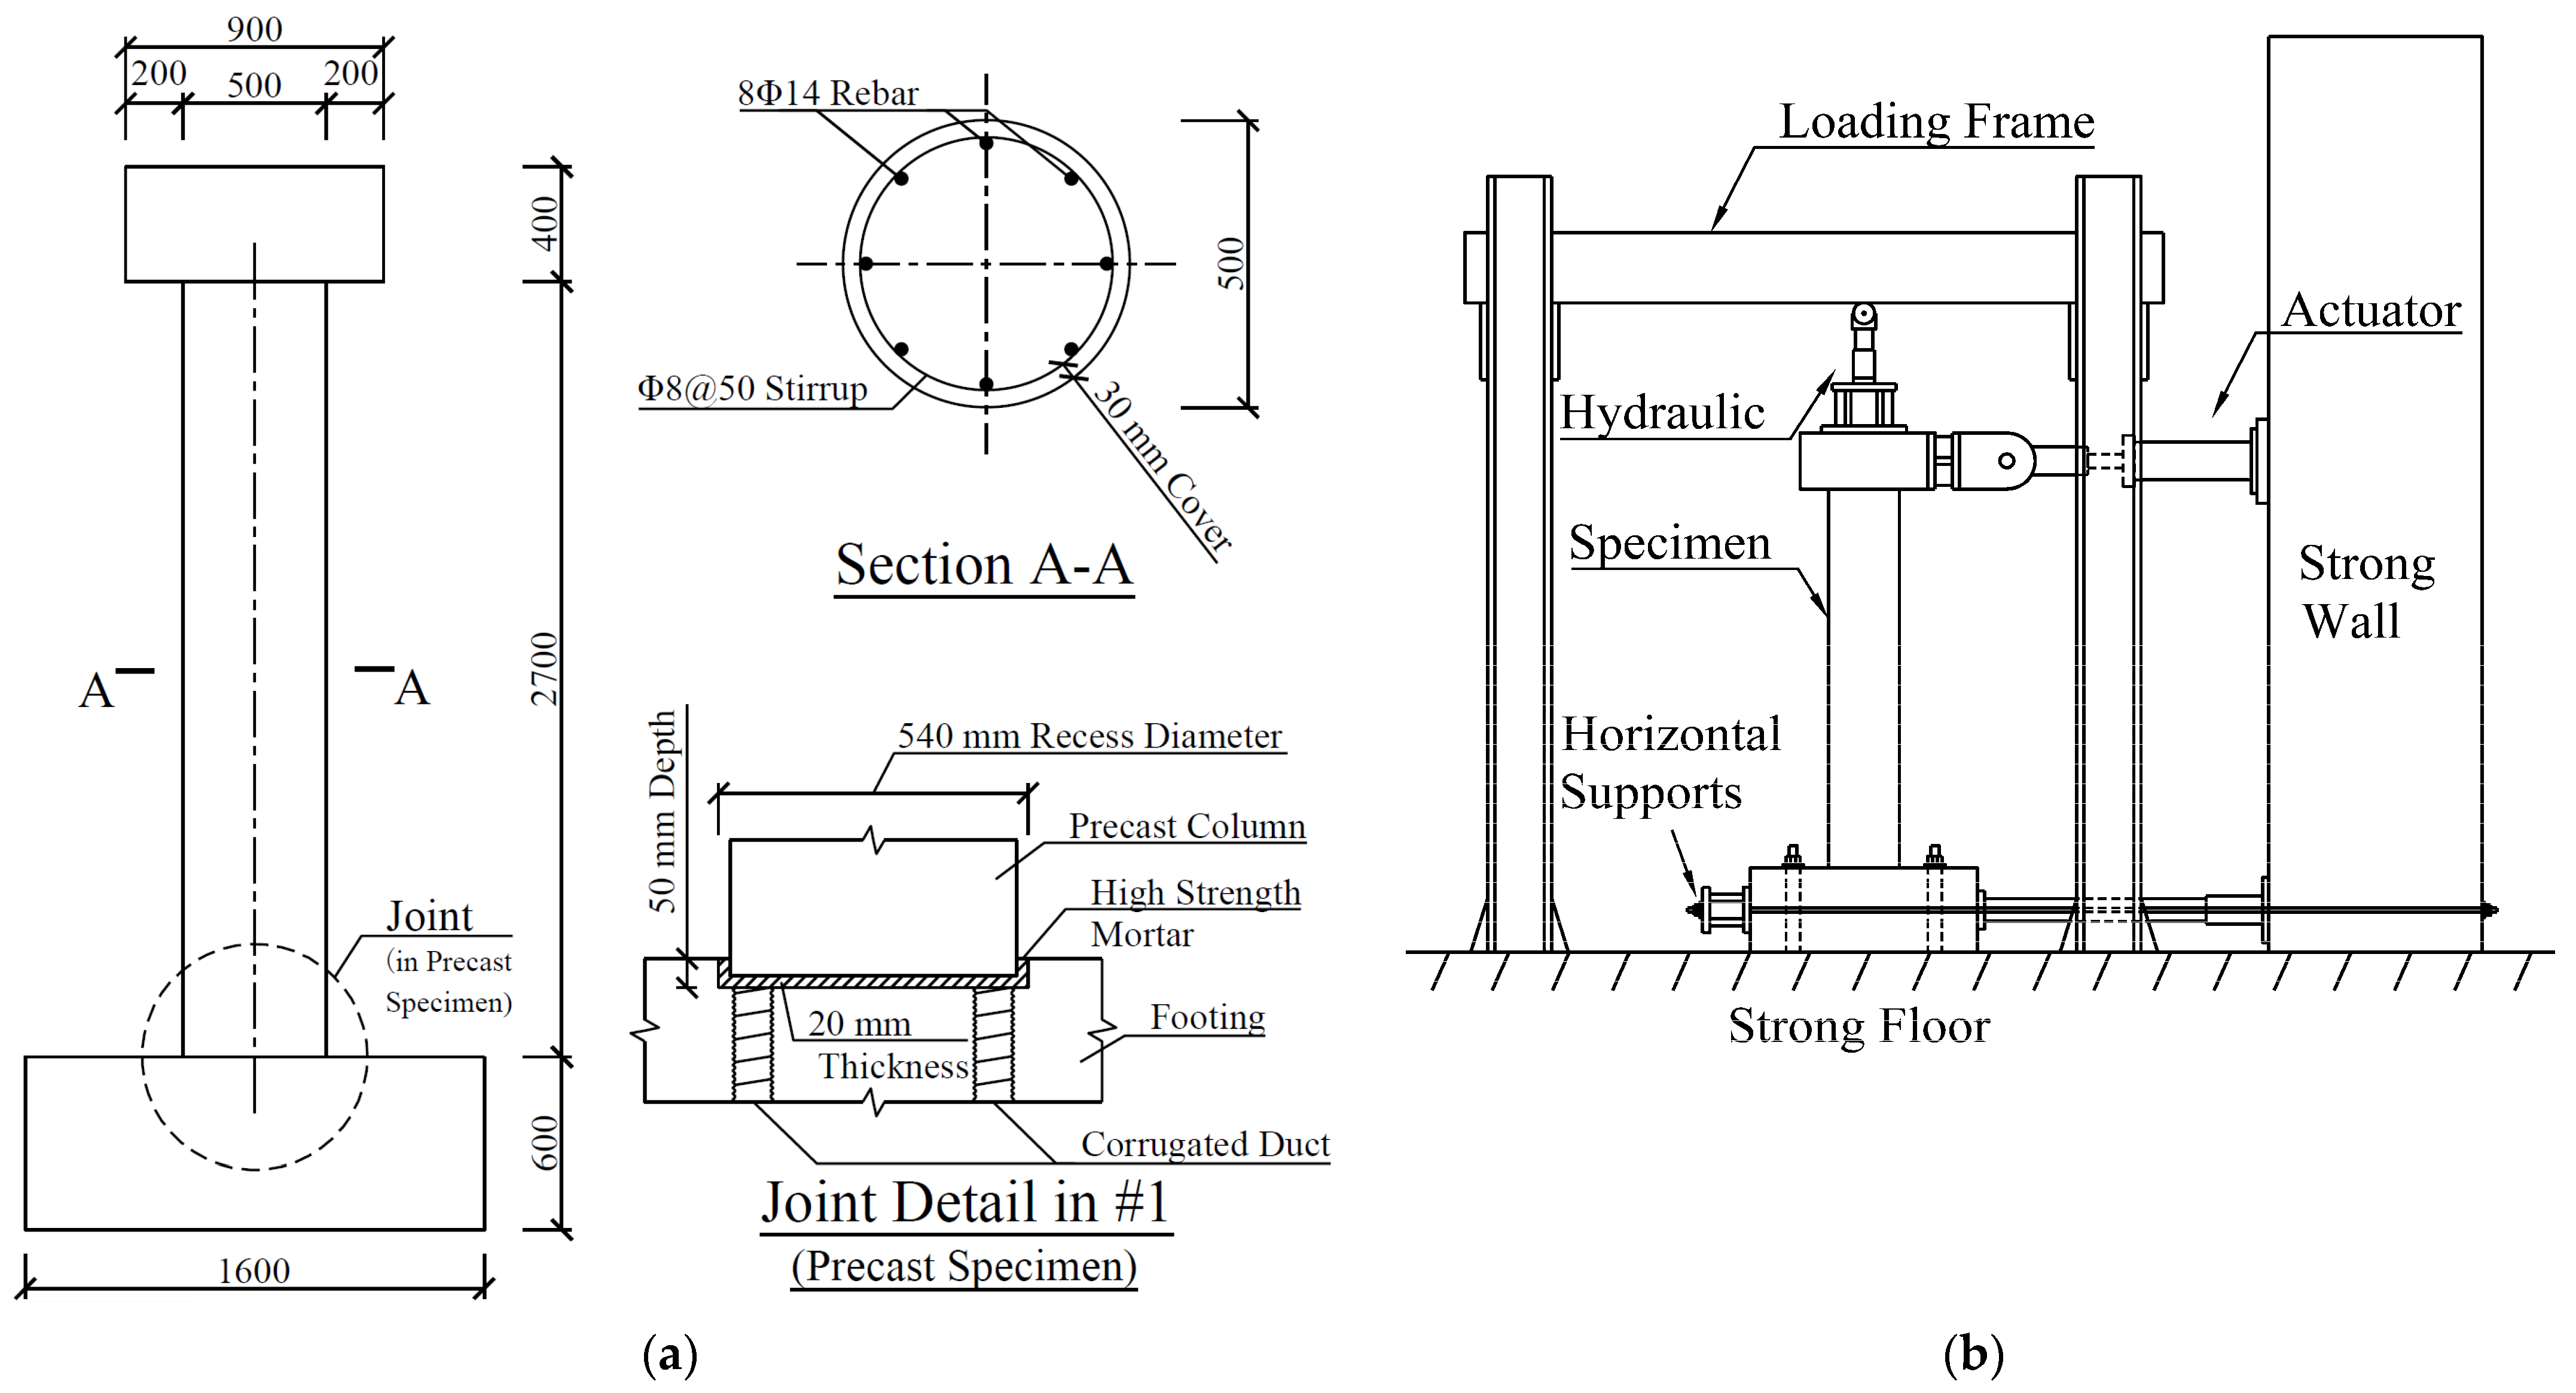
2. Experimental Investigation

In this section, the experimental investigation (Wang et al., 2020 [4]) is briefly introduced. The test consists of two 1/2.8-scale bridge columns: one with the improved GCD connection design (#1) and its CIP reference #0. The two column specimens are with the same segment design in terms of dimension and reinforcement arrangement, as shown in Figure 1. The pier segment is 500 mm in diameter and 2700 mm in height. The total height from the applied lateral loading is 2900 above the column-to-footing interface, yielding the aspect ratio of 5.8. The longitudinal reinforcements are 12 mm-diameter hot-rolled ribbed bars with nominal yield strength of 400 MPa (HRB400), and the hoops are 8 mm-diameter hot-rolled plain bars with nominal yield strength of 300 MPa (HPB300). Compressive strength of concrete is averaged to be 42.2 MPa, and that of high-strength mortar is 66 MPa. Joint detail is also given in Figure 1, and there is a 50 mm deep recess added to the connection, along with the new GCD connecters. The new GCD connector design is given in Figure 2, which improves the material strength and the effectiveness of grouting.
In terms of test setup, the footing of specimens is fixed to the strong floor. Vertical load of 370 kN was applied with a 50-ton hydraulic jack to simulate superstructure mass. Lateral load was applied with the MTS 793 actuator. The specimens were test by a predefined load protocol under displacement control. The displacement level is designed as 2 mm, 5 mm, 10 mm, 15 mm, 20 mm, 25 mm, 30 mm, 40 mm and then 60 mm, 80 mm, etc. with the increment of 20 mm until the specimen felled. Each displacement level consisted of two cycles of current loading displacement and a cycle of previous displacement.
Based on the comparison of drift ratios, ductility values and residual displacements of the two column specimens, it is found that the deformation mechanism, energy dissipation potential and self-centering capability are similar between the precast and CIP specimens. This concludes that the new connection design forms an effective confinement to the column segment, and the precast column with such design is as good as, if not better than, the CIP reference.

3. Numerical Simulation

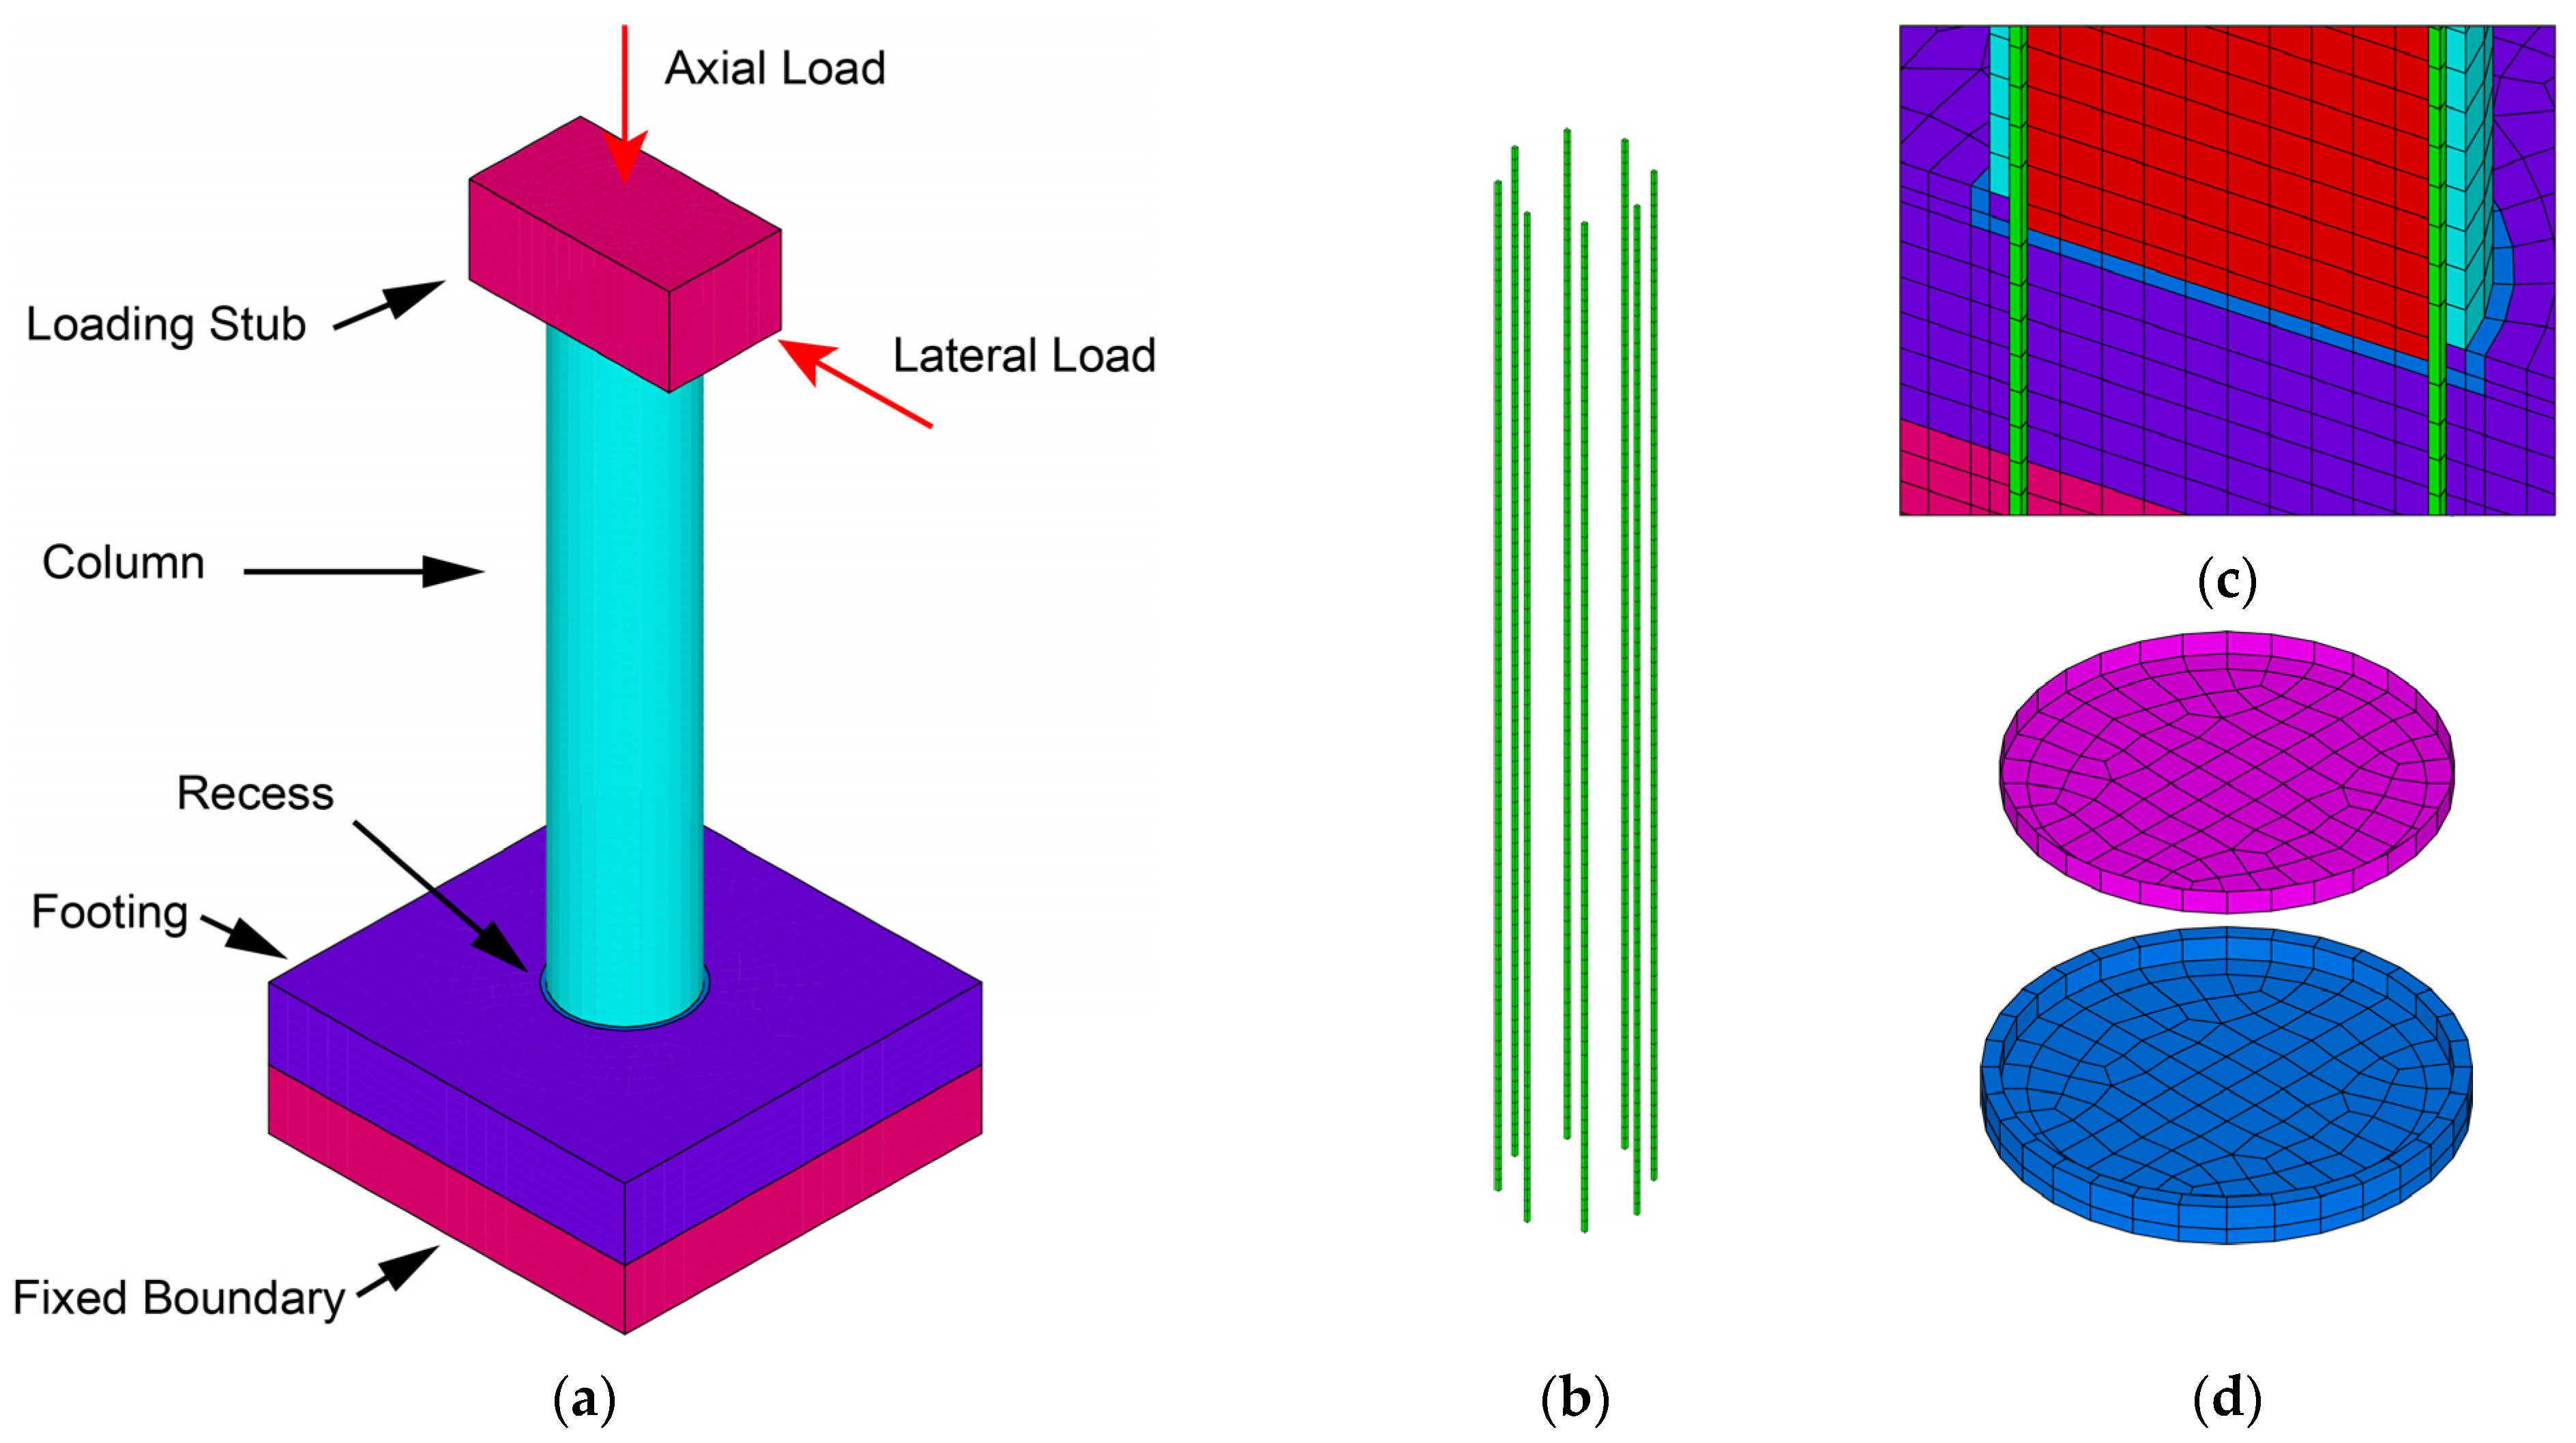
3.1. Finite Element Model

3D solid finite element models are created using ANSYS to ensure the effectiveness of simulating the (1) crushing and cracking behavior of concrete and (2) mechanical behavior of the recess. The models are based on the experimental results conducted by Wang et al. [4]. Here, monotonic pushover loading is applied to the finite element model instead of cyclic loading, due to the reason that solid finite element models can hardly converge under cyclic loading in this case (especially with crushing and cracking simulation), and therefore monotonic pushover is currently the only choice to conduct the following parametric study to balance computational feasibility and analytical accuracy. The major focus of seismic behavior in practical engineering is the pushover curve, which would not lose necessary information if satisfactorily simulated for design references.
To be specific, Solid65 element is used for the concrete and mortar of pier column and upper layer (close to the recess) of footing, for crushing and cracking simulation. Solid45 element is used for cap beam and lower layer of footing. Link180 element, which can transmit uniaxial tension and compression, is used for the stimulation of longitudinal rebars. Conta173 and Target170 elements can be used to define pair-based contact, presenting the state of contact or sliding between surfaces. The interface of column and footing is thus stimulated by Conta173 and Target170.
The material property of concrete is defined according to Mander’s concrete stress–strain model (Mander et al., 1988) as shown in Figure 3a, with key parameters obtained from sample tests. In addition, multilinear kinematic hardening (KINH) material model with the associated von Mises yield criterion is adopted, and Willam and Warnke’s criterion for failure is used to account for cracking and crushing. Mander’s model is also utilized for high-strength mortar simulation, due to similar stress–strain relation. Sliding and opening at the joint interface have been observed from the tests, and therefore detailed approach needs to be taken for simulating the joint behavior. Pair-based contact is used to simulate the axial and friction forces at the interface, where Conta173 is for the concrete column surface and Targe170 belongs to the upper surface of mortar. The Mohr–Coulomb model is used for regulating the contact behavior, and coefficient of the isotropic friction (MU) is 0.6. Maximum friction stress (TUMAX) is equal to the concrete shear strength of σ y / 3   =   24 MPa, and the cohesion (COHE) is set to 0 as default.
The obtained axial yield and ultimate strength of longitudinal bars are 550.5 MPa and 684.4 MPa, respectively. Longitudinal rebars are subjected to cycling loading during the test, with plastic development (Bauschinger effect) and buckling. However, only monotonic loading is applied to the finite element model due to the consideration of computational efficiency and convergence. Rebars need to be simulated with possible causes of specimen softening. Low cycle fatigue leads to plastic accumulation of the local and plastic capacity reduction of rebar, which is represented by shorter plastic plateau and earlier descending strength. Buckling of the reinforcement and the softening of the concrete under cyclic loading further complicate the degradation of the specimen capacity. The relation is modified based on ideal elastoplastic model, as shown in Figure 3b. It is determined by iterative adjustment under two conditions: (1) the numerical force–displacement monotonic loading curve agrees with backbone curve of the test result, especially the same slope of descending region; (2) at the ultimate displacement of 160 mm, the stress of the outmost tensional longitudinal rebar reduces to zero (fracture). Such definition of the constitutive model agrees with the low-cycle fatigue of longitudinal rebars reflected in the test.
There are two specimens tested in the experiment, and they are CIP reference #0 and precast specimen #1 with the same design. The precast specimen #1 is with the improved GCD connection between precast column and footing. There exists a 20 mm thick mortar as bonding material. The finite element model created based on specimen #1 is shown in Figure 4. Mesh size in the model is 50 mm, while the thickness of the grouted duct is 2 mm.

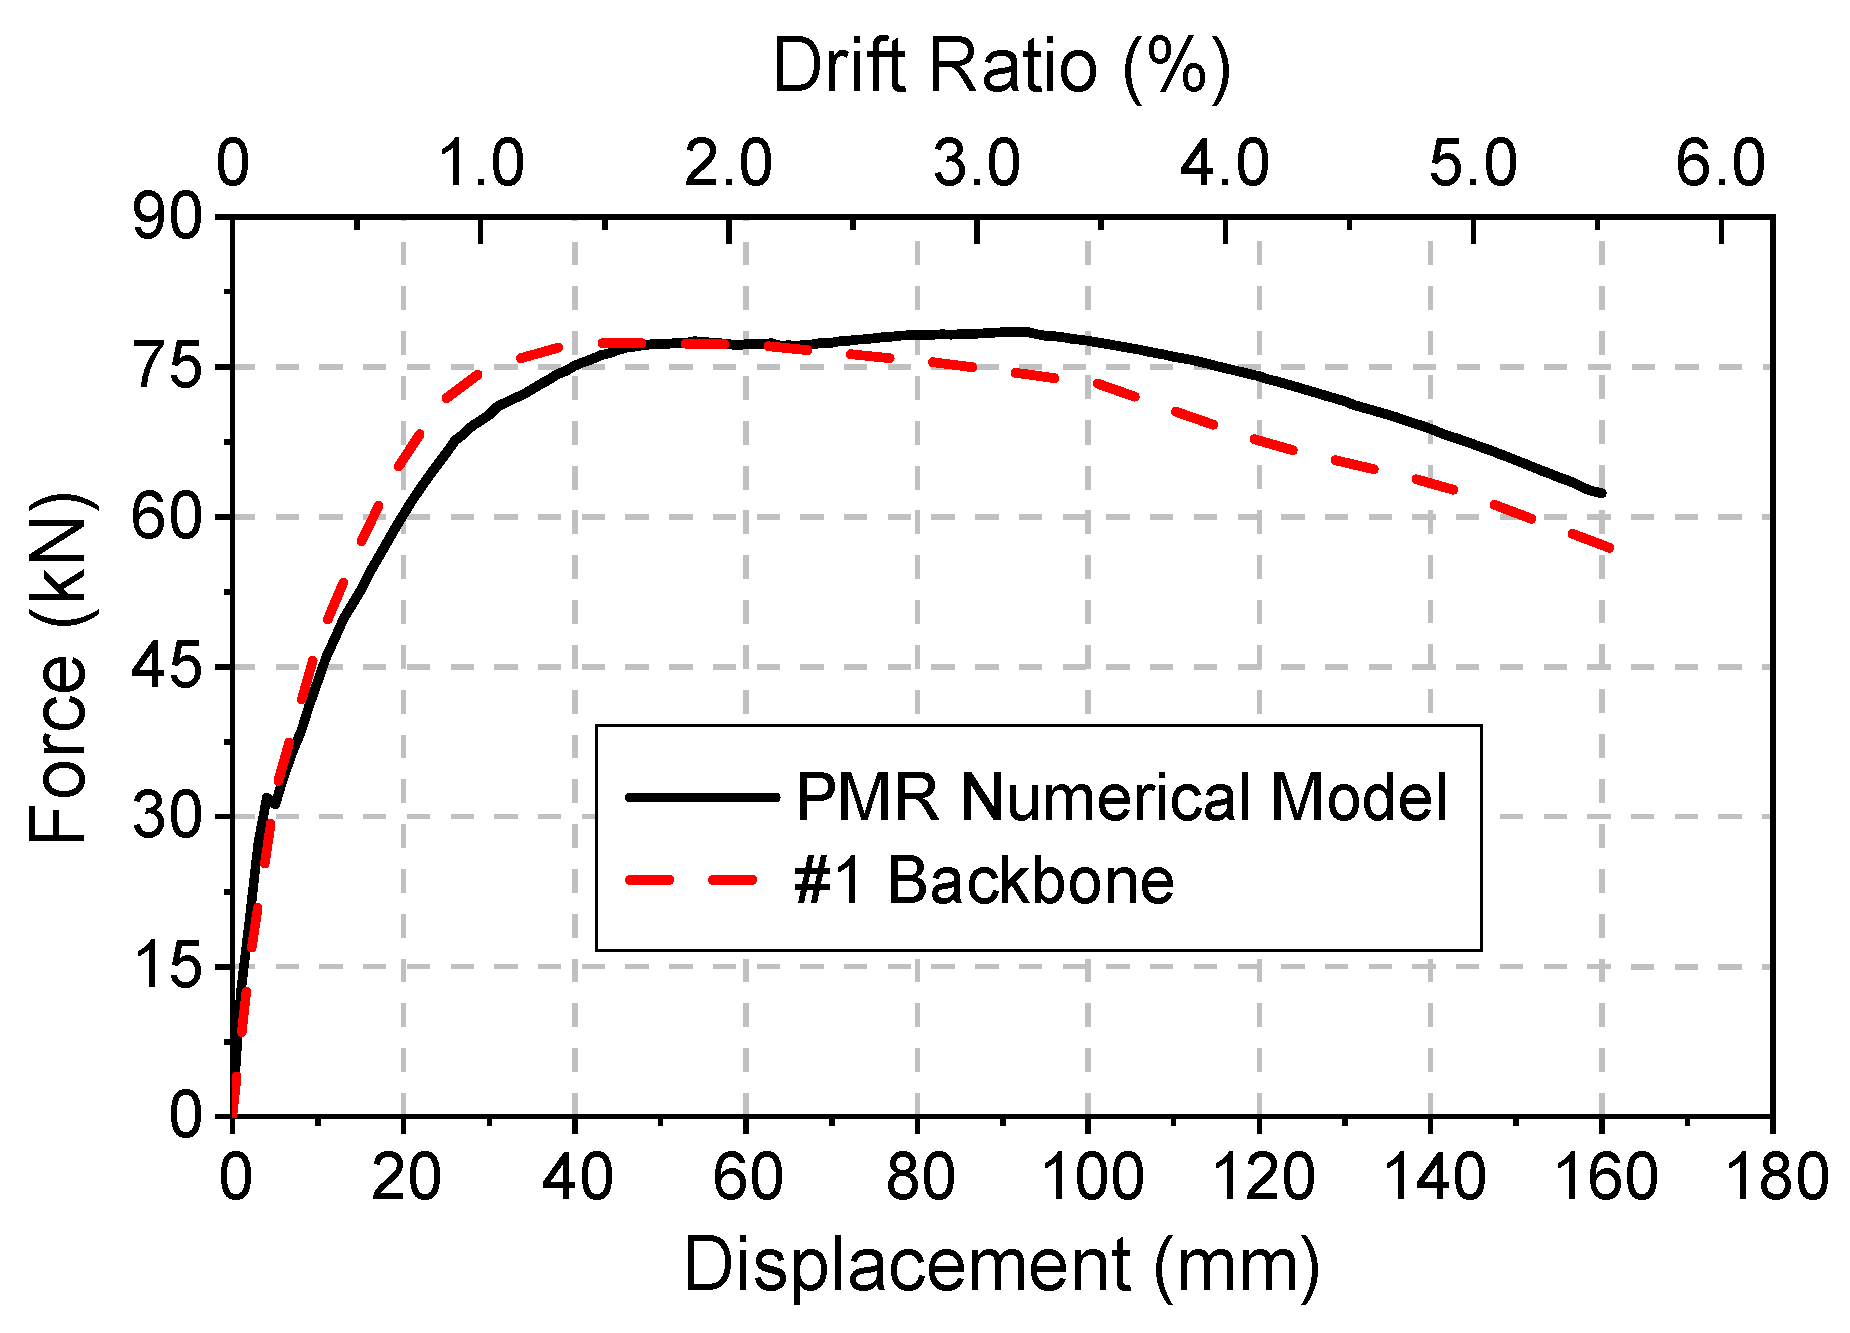
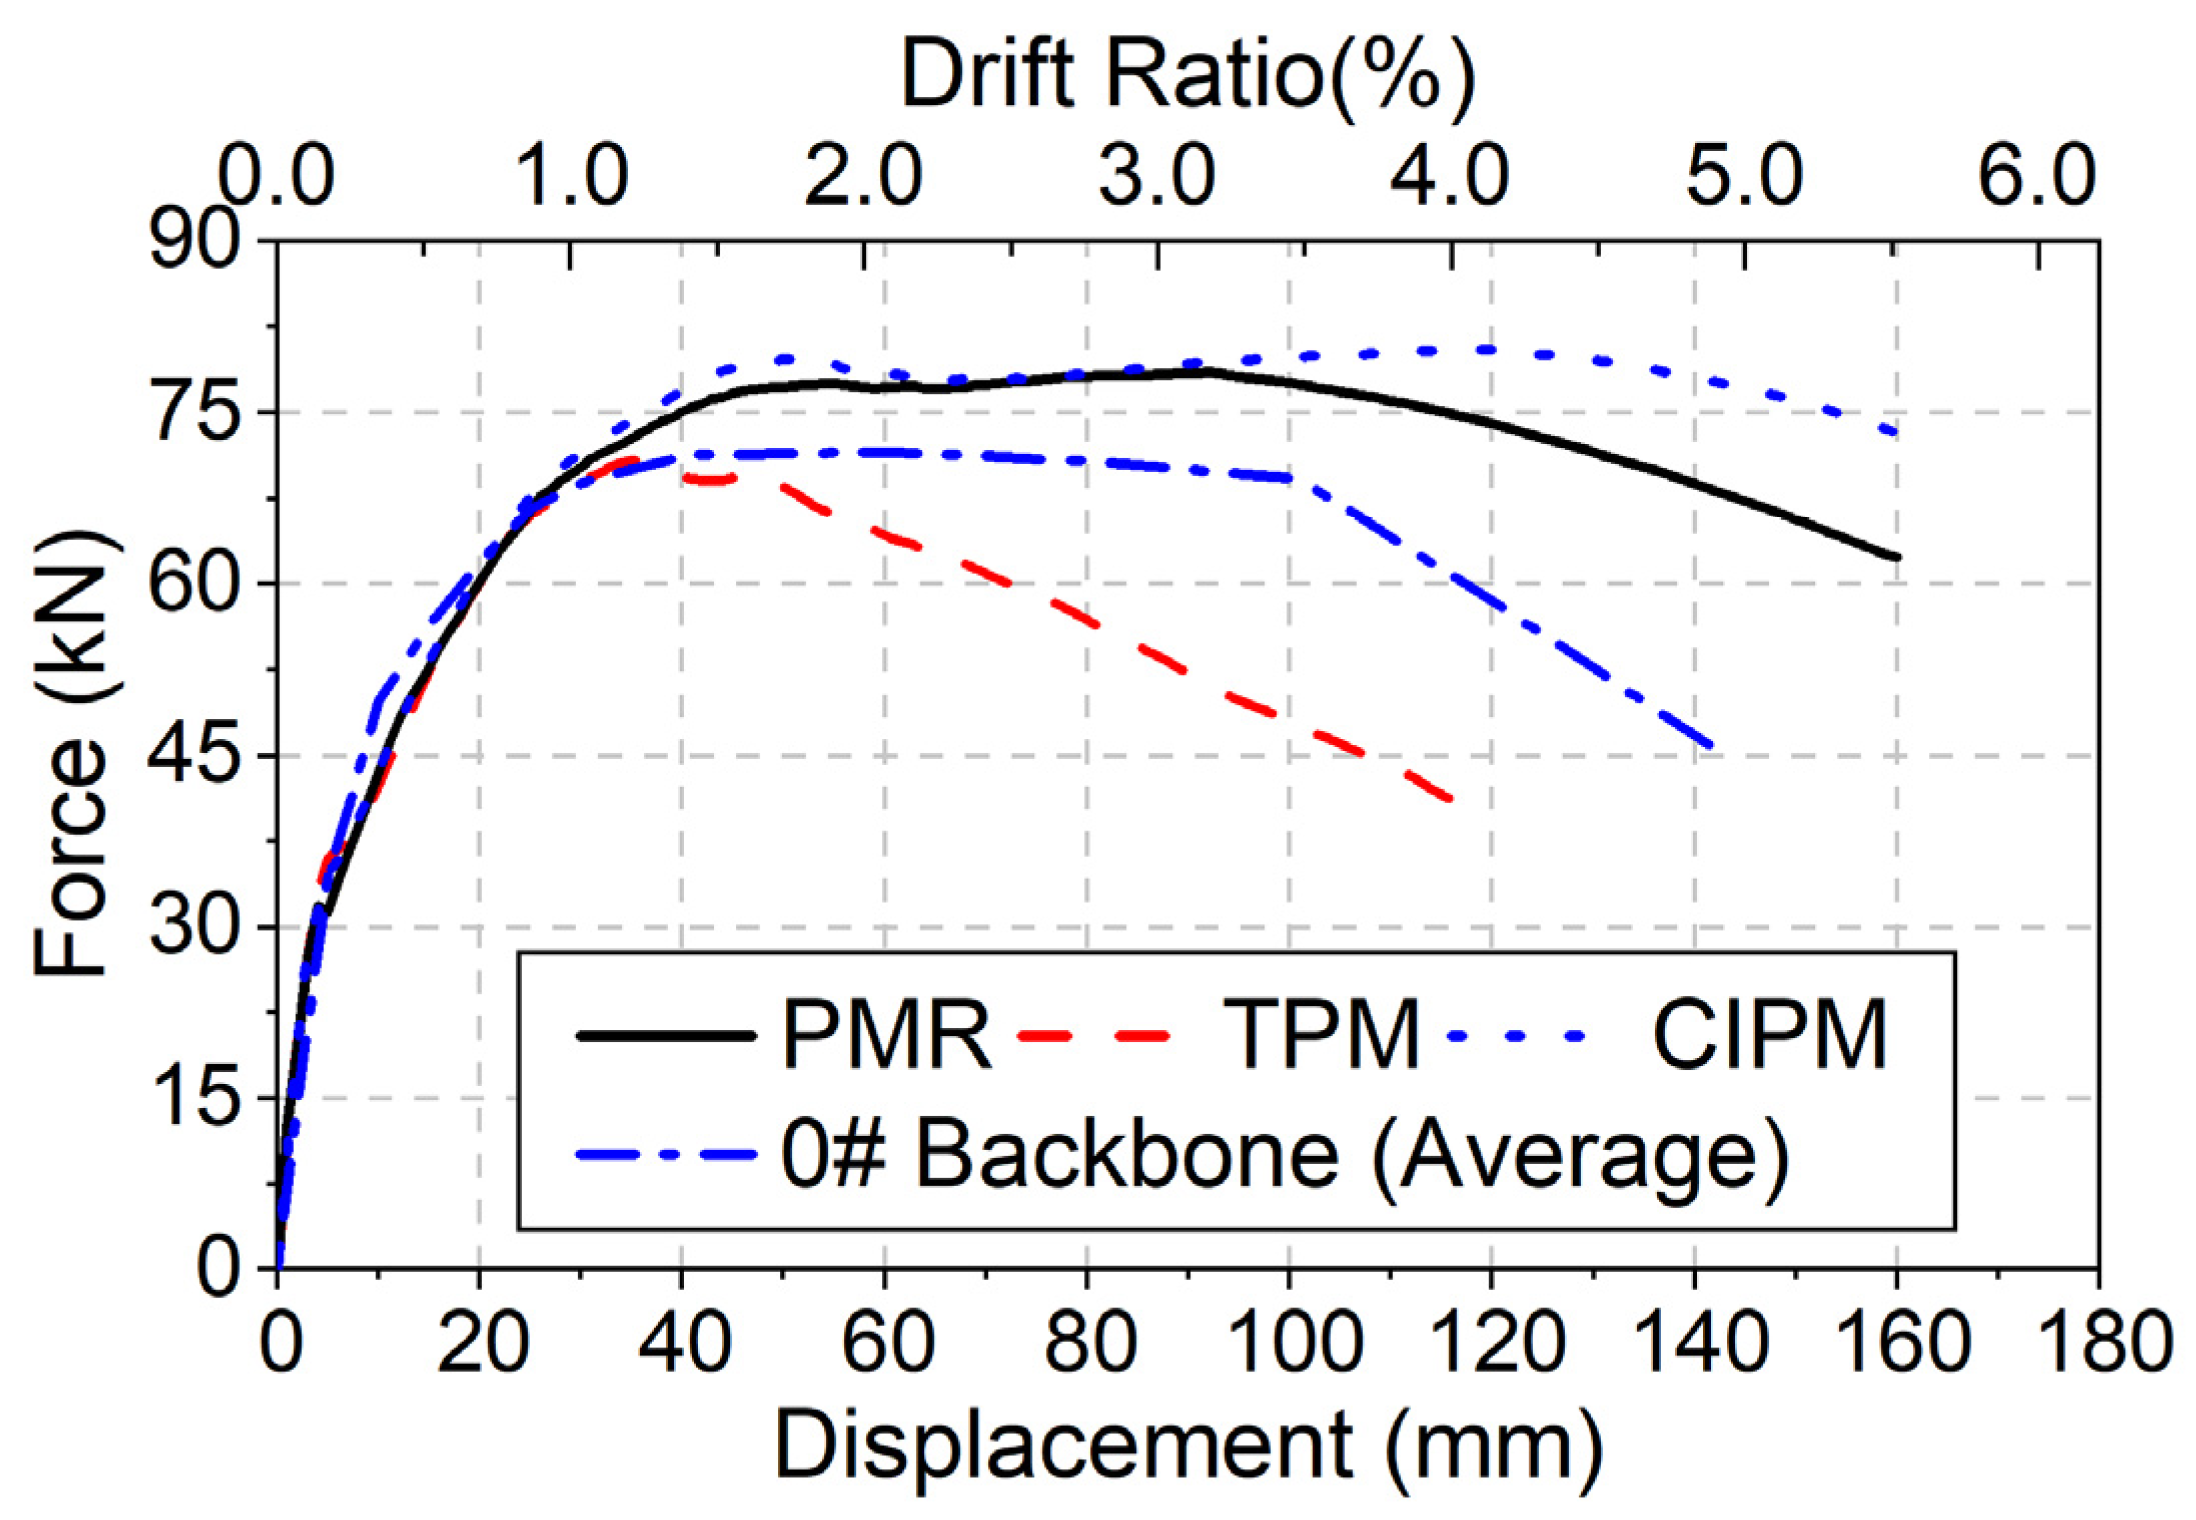
3.2. Validation with Test Results

Numerical model (precast model with recess, PMR) of precast specimen #1 is established following the details given in Section 2, and force–displacement curves are compared in Figure 5. Prior to yielding, the numerical model is with slightly lower stiffness, and maximum difference of strength is 8.69% at 20 mm. The specimen reaches the peak load of 77.4 kN, while the numerical model is 78.5 kN, which is off by 1.4%. At 65 mm, a minor hardening appears in the model curve, which is contributed by that the concrete material cannot perfectly express the triaxial behavior.
The contour plots of principal compressive stress and concrete cracking and crushing are shown in Figure 6. The compressive region is mainly concentrated at longitudinal reinforcement and the recess from far side of applied load. The cracks are developed along the height of 1.8 m above the footing. This is similar to the visible cracks in test specimen #1 (1.6 m), as given in Figure 6c. The crushing region covers the height of 60 cm above footing, which is higher than the test result (40 cm). As shown in Figure 7, a series of outermost rebar stress diagrams indicates that the maximum strain of longitudinal rebar is at 175 mm above the footing. It is consistent with the test results that the most severe spalling is 160 mm above the footing (Figure 6c).

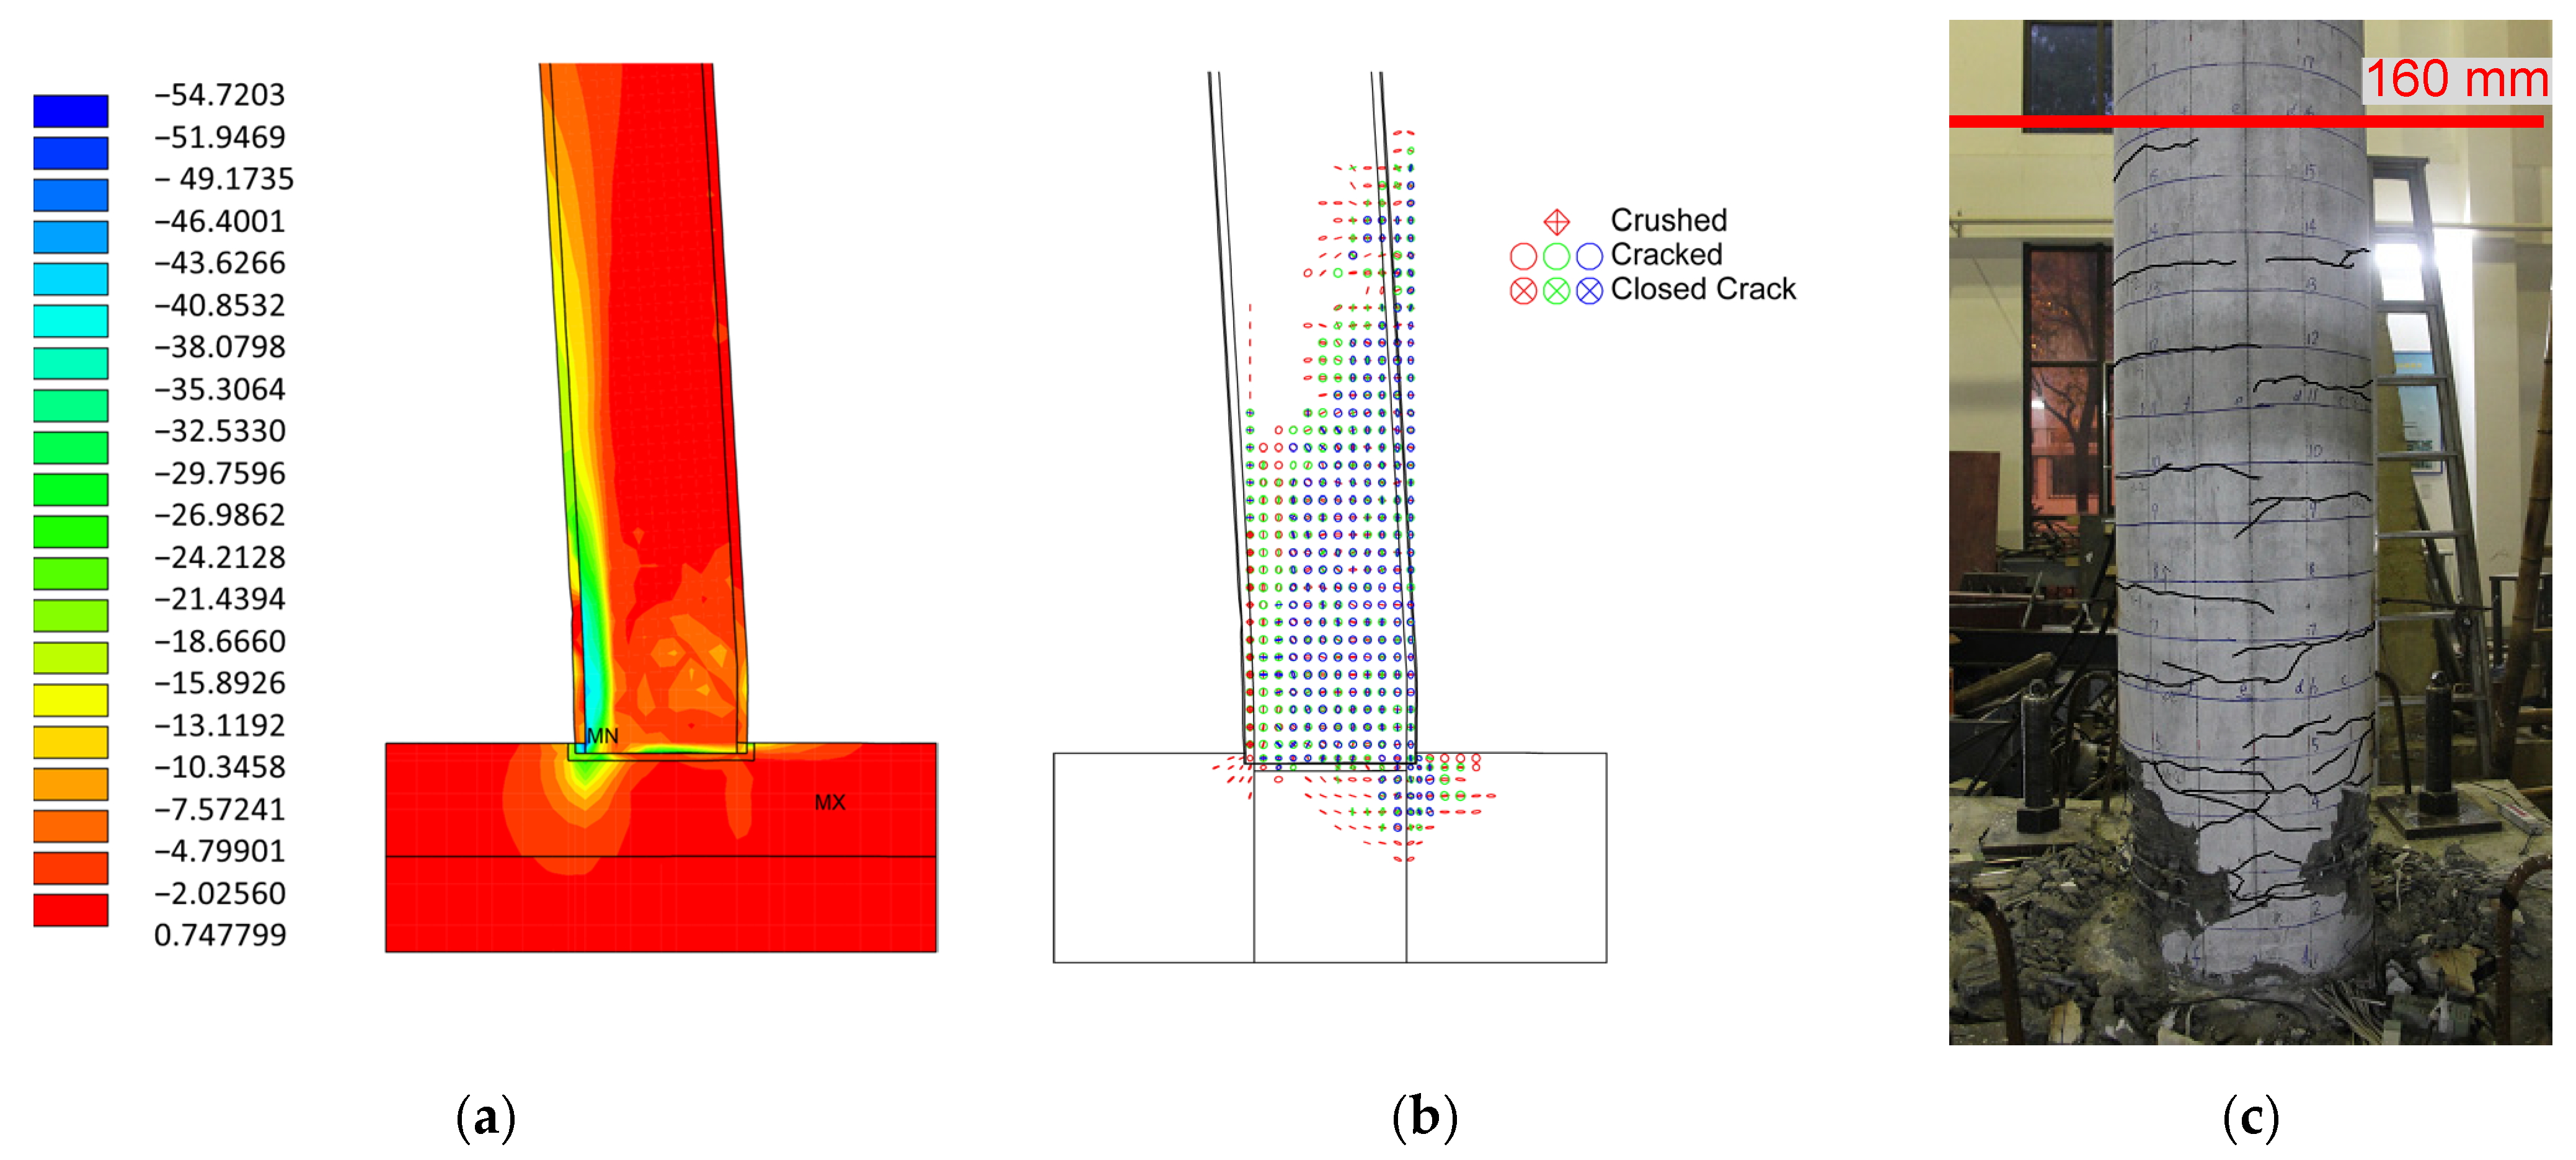
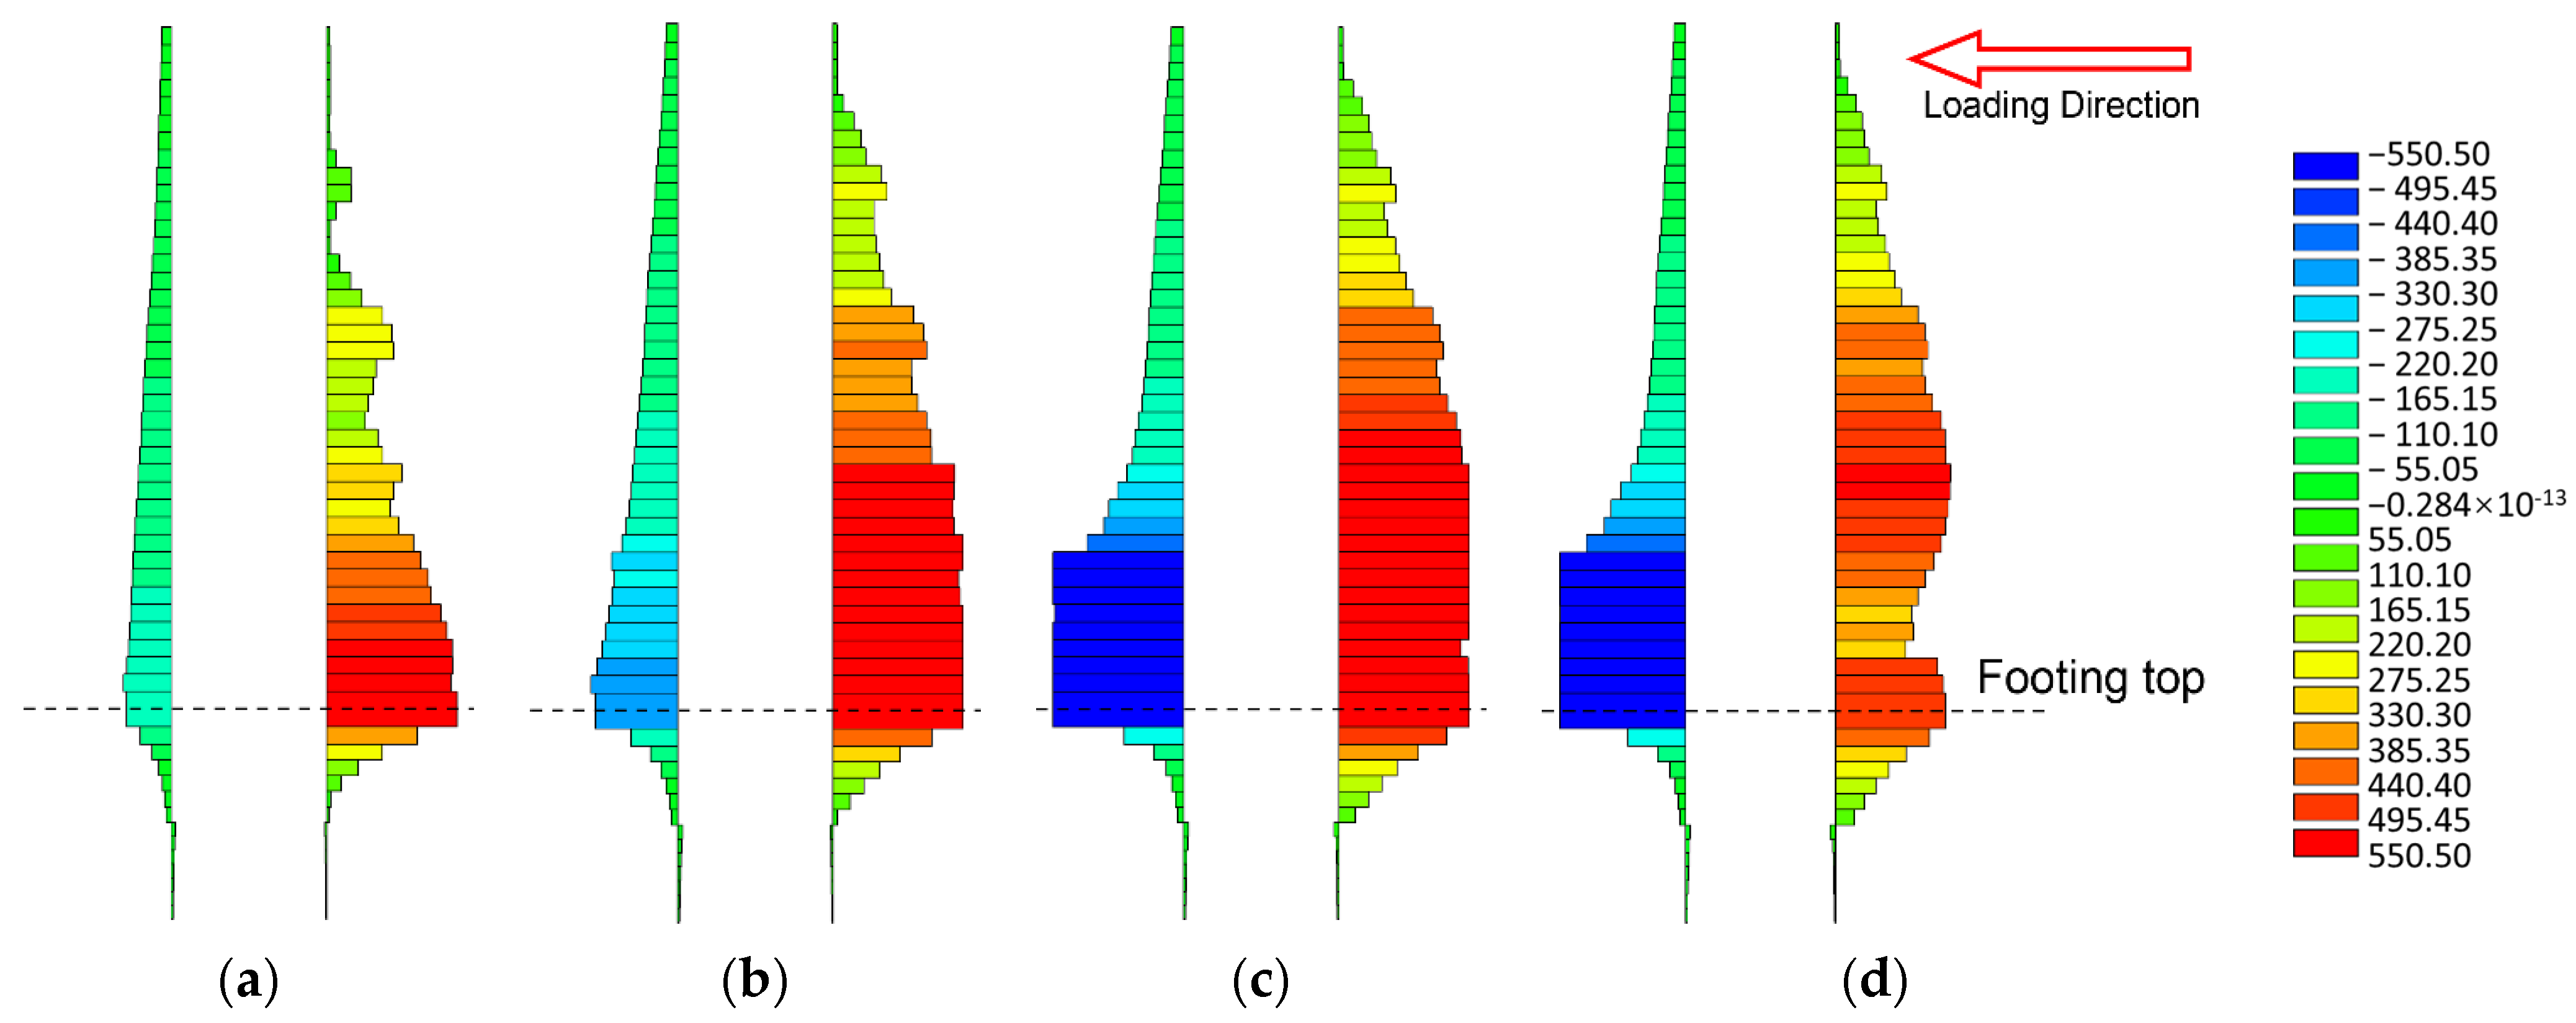
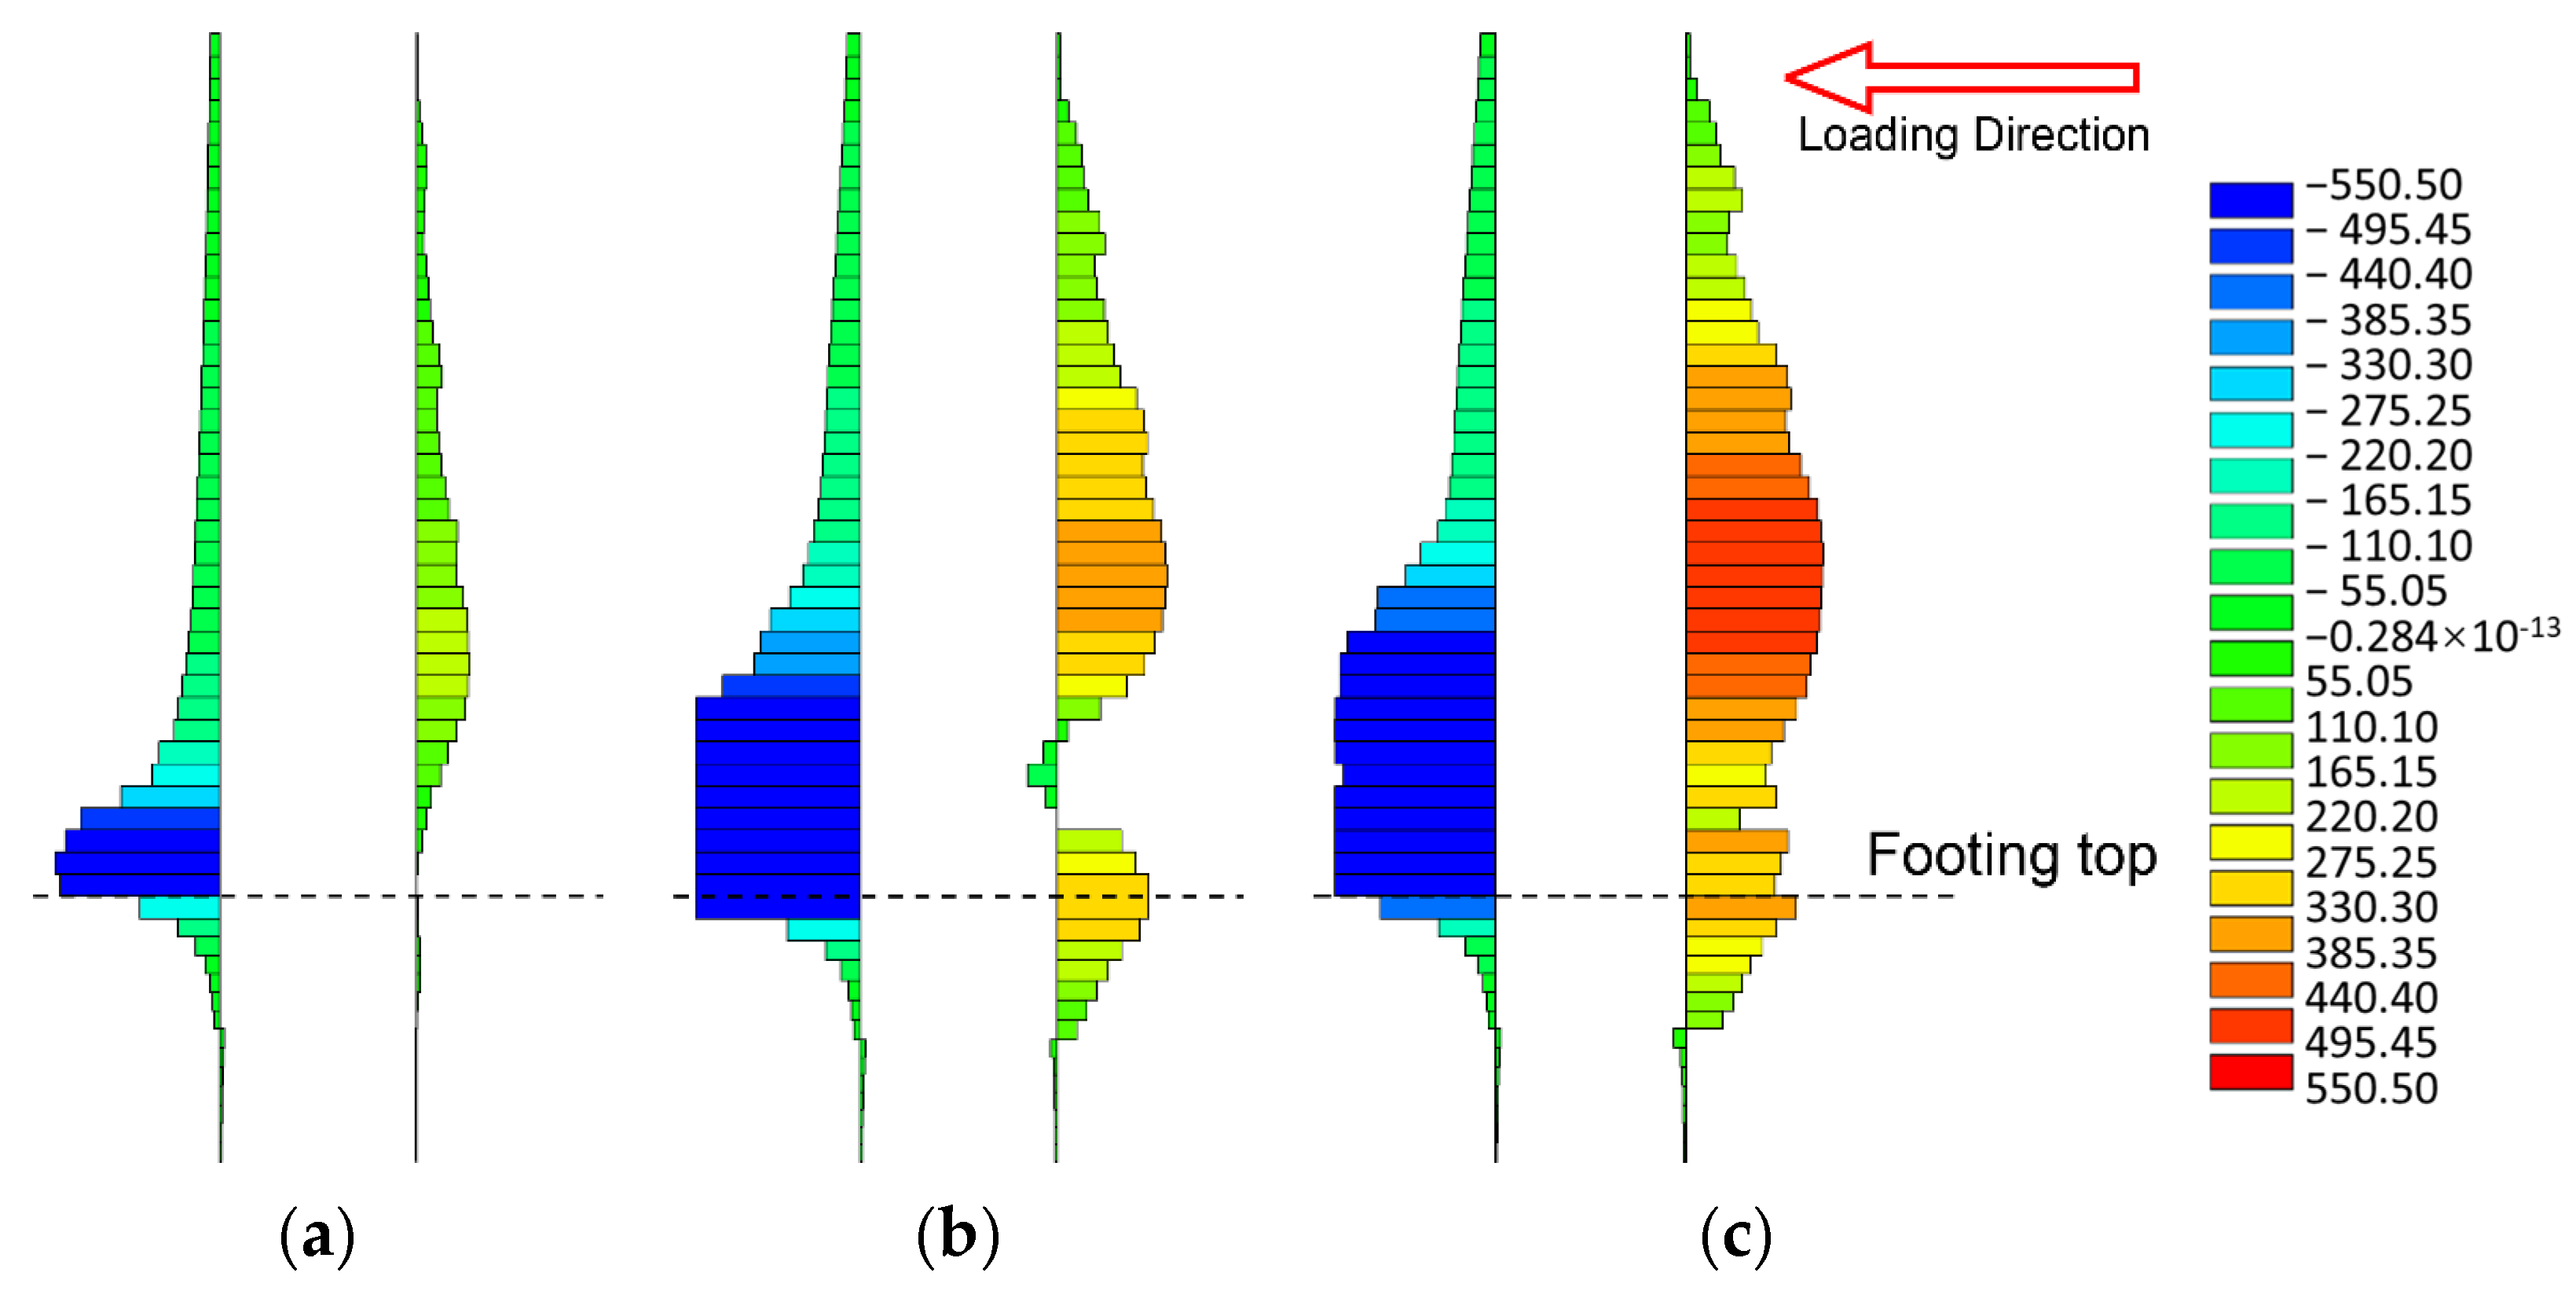
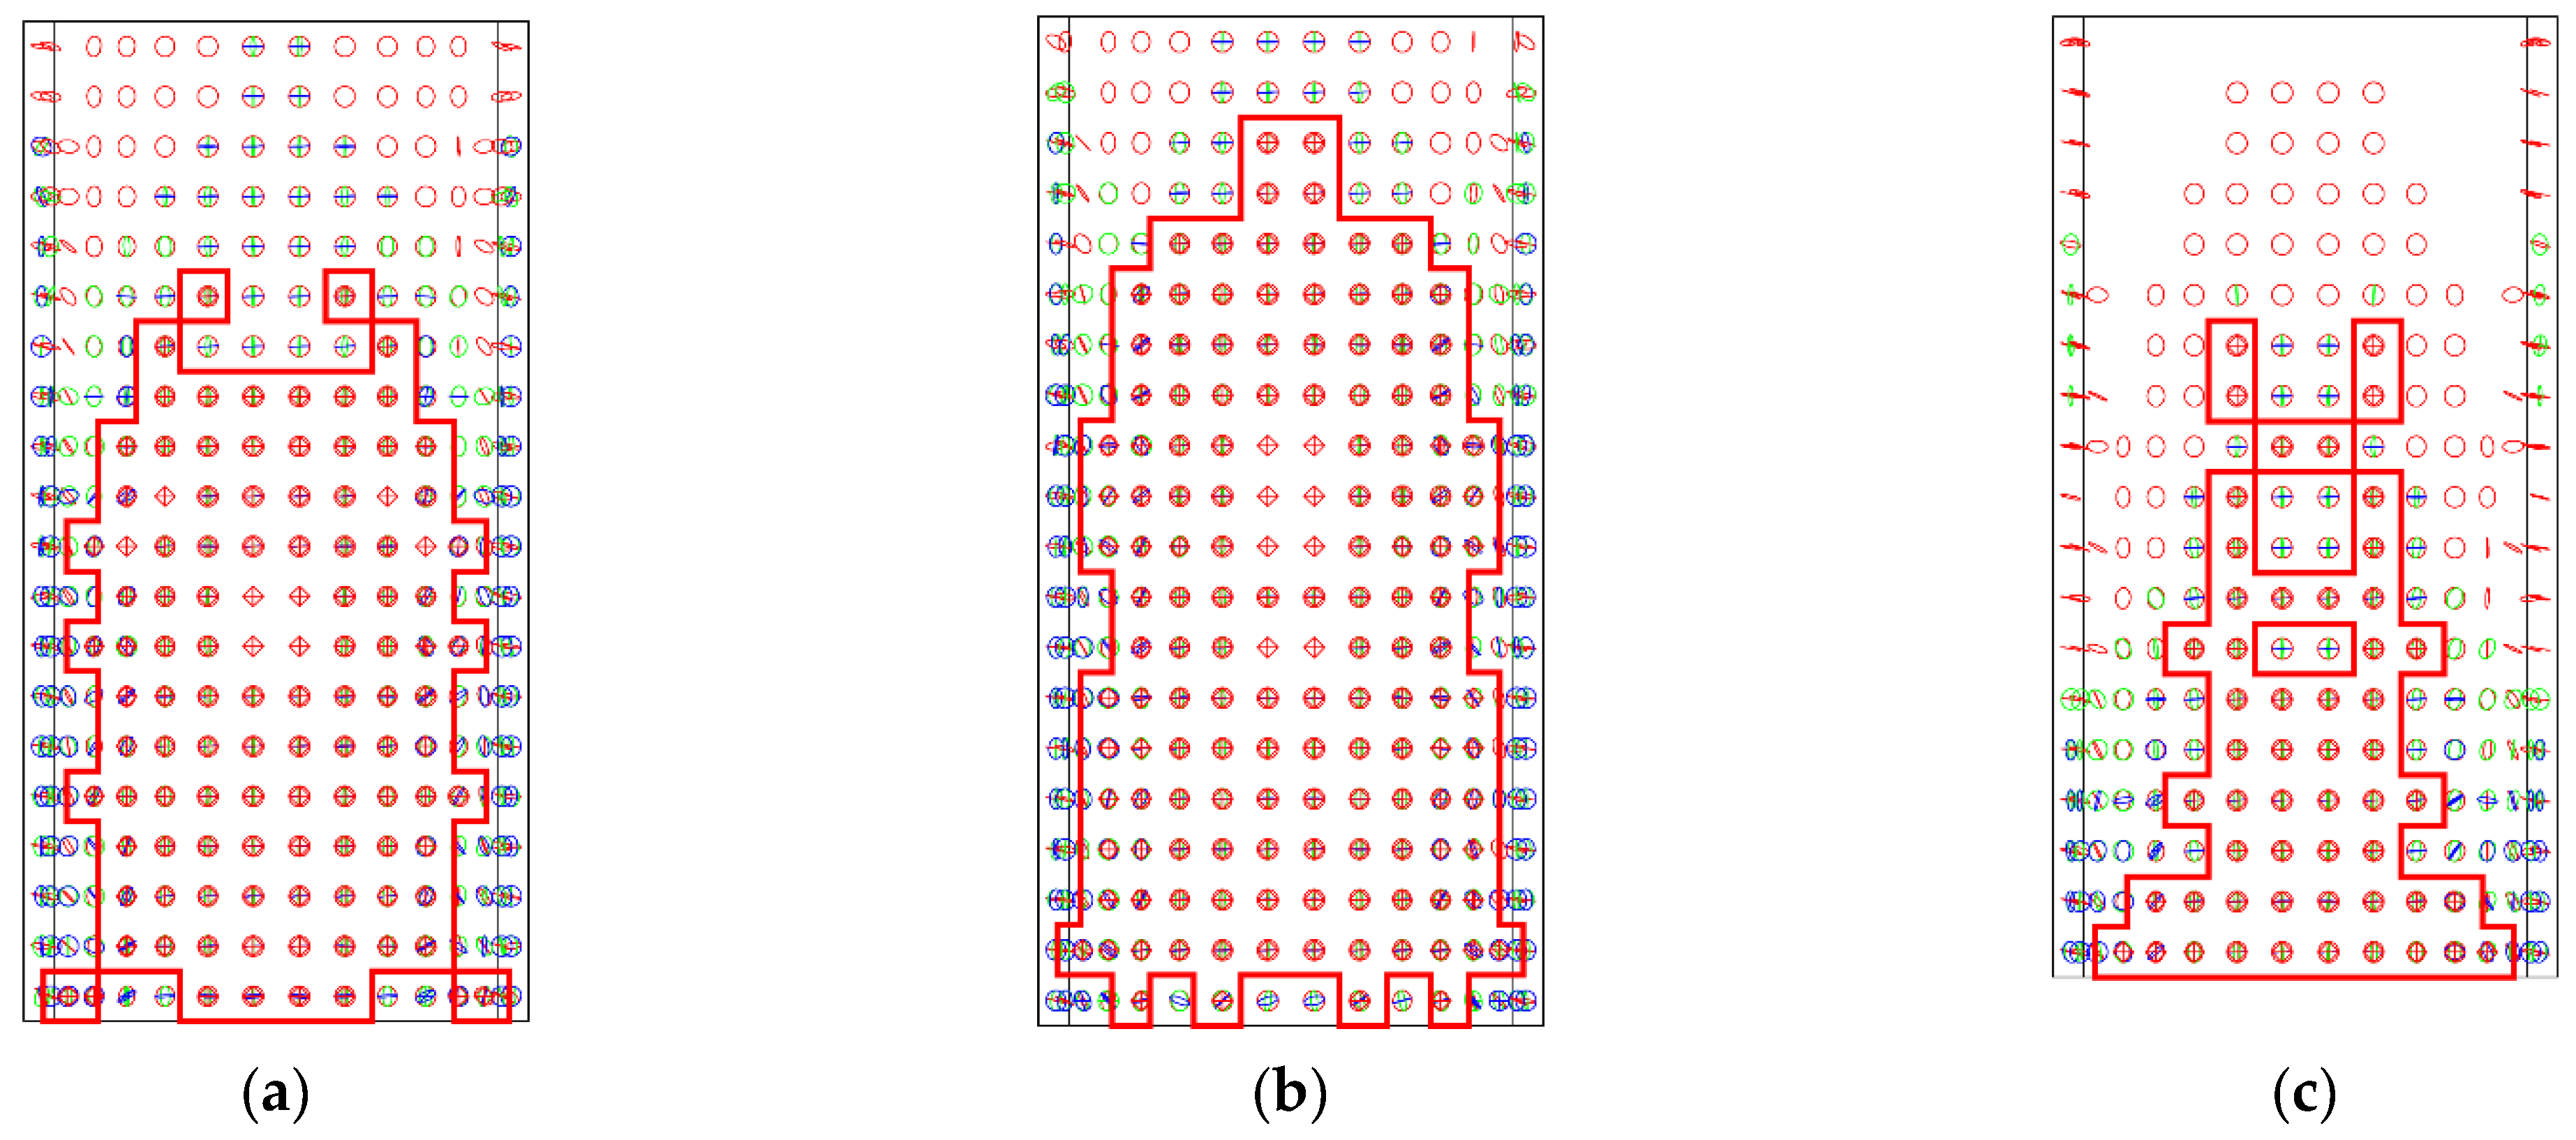
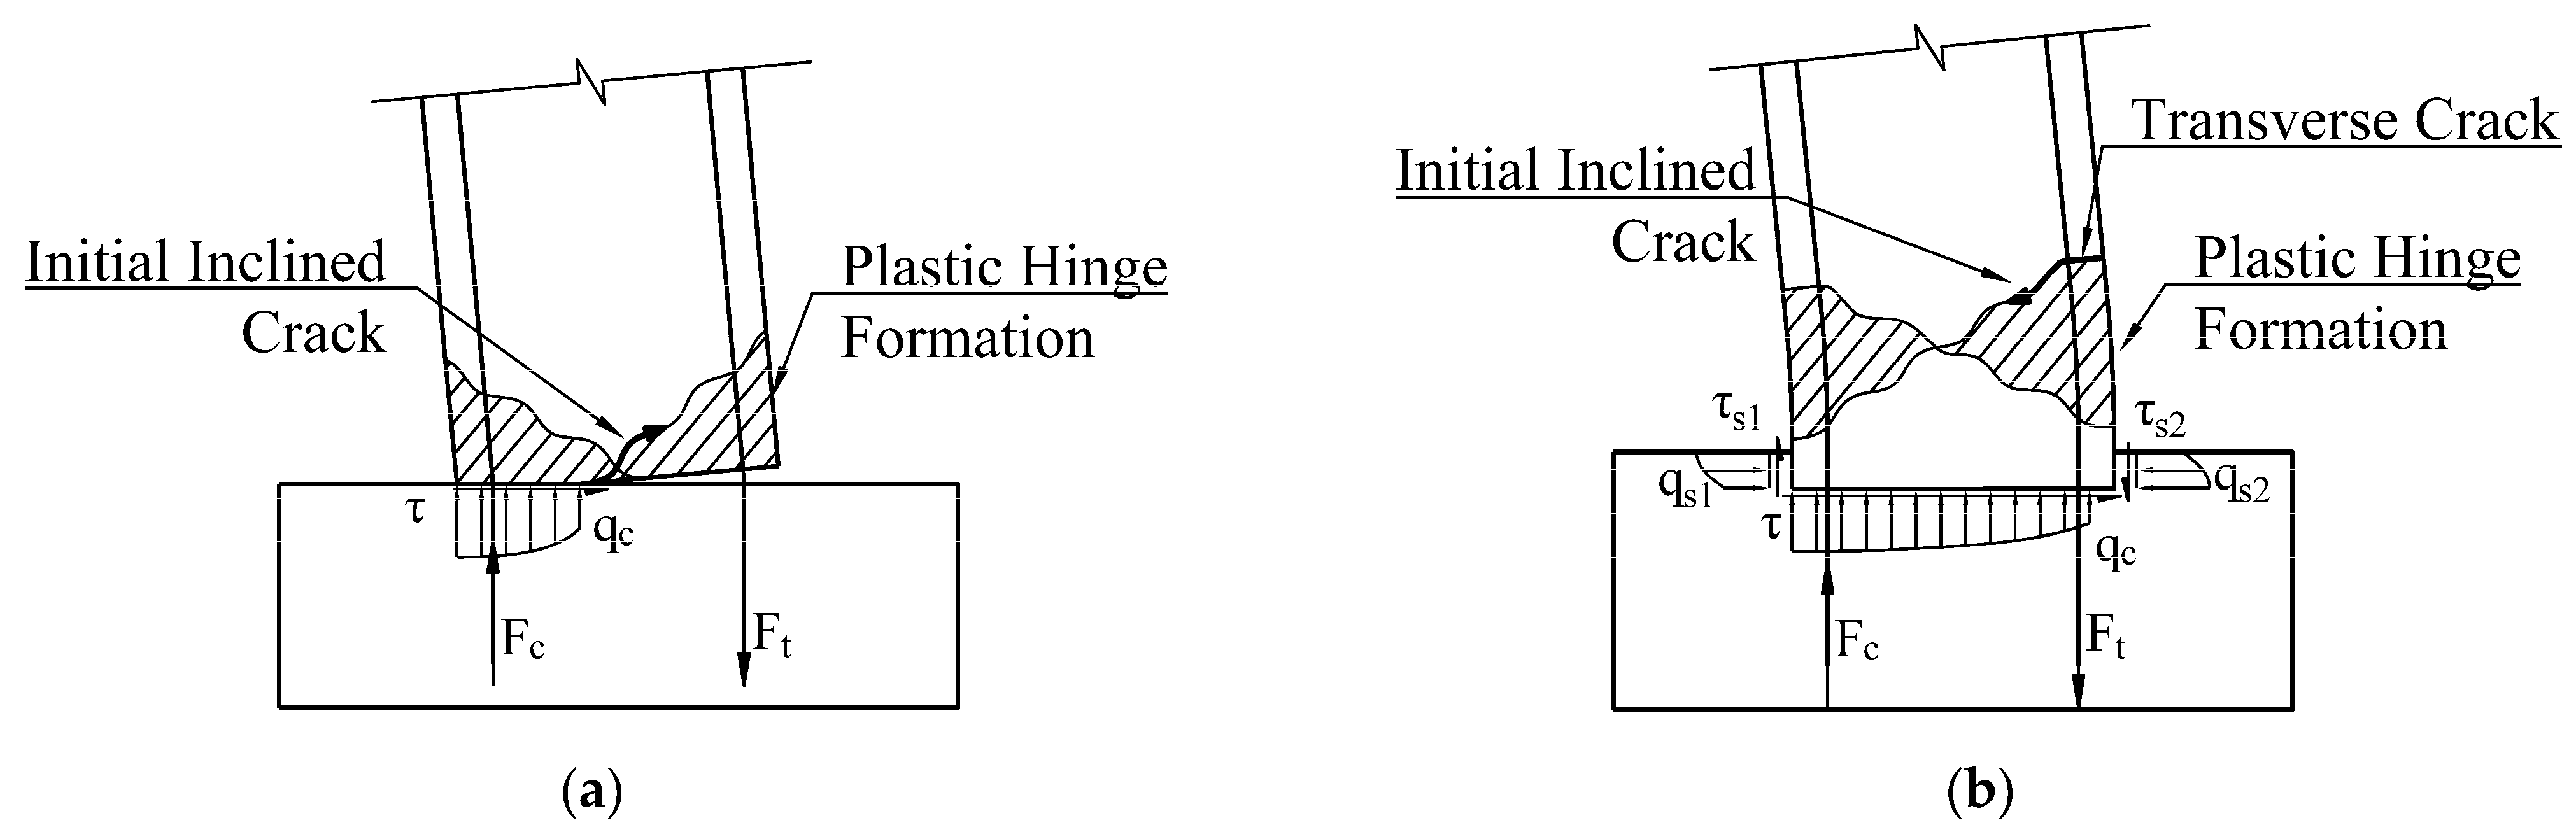
3.3. Plastic Hinge Development

Typical precast model (TPM) without the recess design and cast-in-place model (CIPM) are also created with the same necessary elements and material as PMR, and corresponding force–displacement relations are given in Figure 8. The peak load of TPM is 70.8 kN, while those of PMR and CIPM are 78.5 kN and 80.5 kN. Postyielding capacity of TPM decreases earlier and faster than PMR, and rebar of TPM also fractures at early stage (120 mm). The yielding load values of CIPM and specimen #0 (around 50 mm) are differed by 11.4% (79.71 kN and 71.58 kN), which is larger than 8.5% of difference in concrete strength (43.9 MPa and 40.5 MPa). A more rapid decrease of force in specimen #0 is found around 100 mm.
Stress distribution of longitudinal rebar in three models are shown in Figure 9. Stress distribution in TPM is more concentrated at the column-to-footing interface, which leads to more rapid increase of strain, resulting in earlier failure than others. The maximum strain of rebar in PMR is located 175 mm above the footing, which is the same as CIPM.
As given in Figure 10, crushing regions of PMR and CIPM form a rectangular shape with wider distribution area, while the that of TPM is concentrated at pier bottom with triangular regions, indicating that joint of TPM is more susceptible to failure. As illustrated in Figure 11, the inclined cracks start to be formed at the neutral axis, then extended to both sides. Inclined cracks and transverse cracks together define the plastic hinge region, while vertical cracks lead to spalling. A right triangle shaped plastic hinge is formed for TPM, while the bottommost transverse cracks of PMR and CIPM extend more slowly, and still hold shear transferring capacity. The inclined cracks of PMR and CIPM are more likely to start from the end of horizontal cracks at a certain height above the column bottom instead of bottommost, which ensures more uniform development of transverse cracks along the pier column and plastic deformation to appear at the later stage.

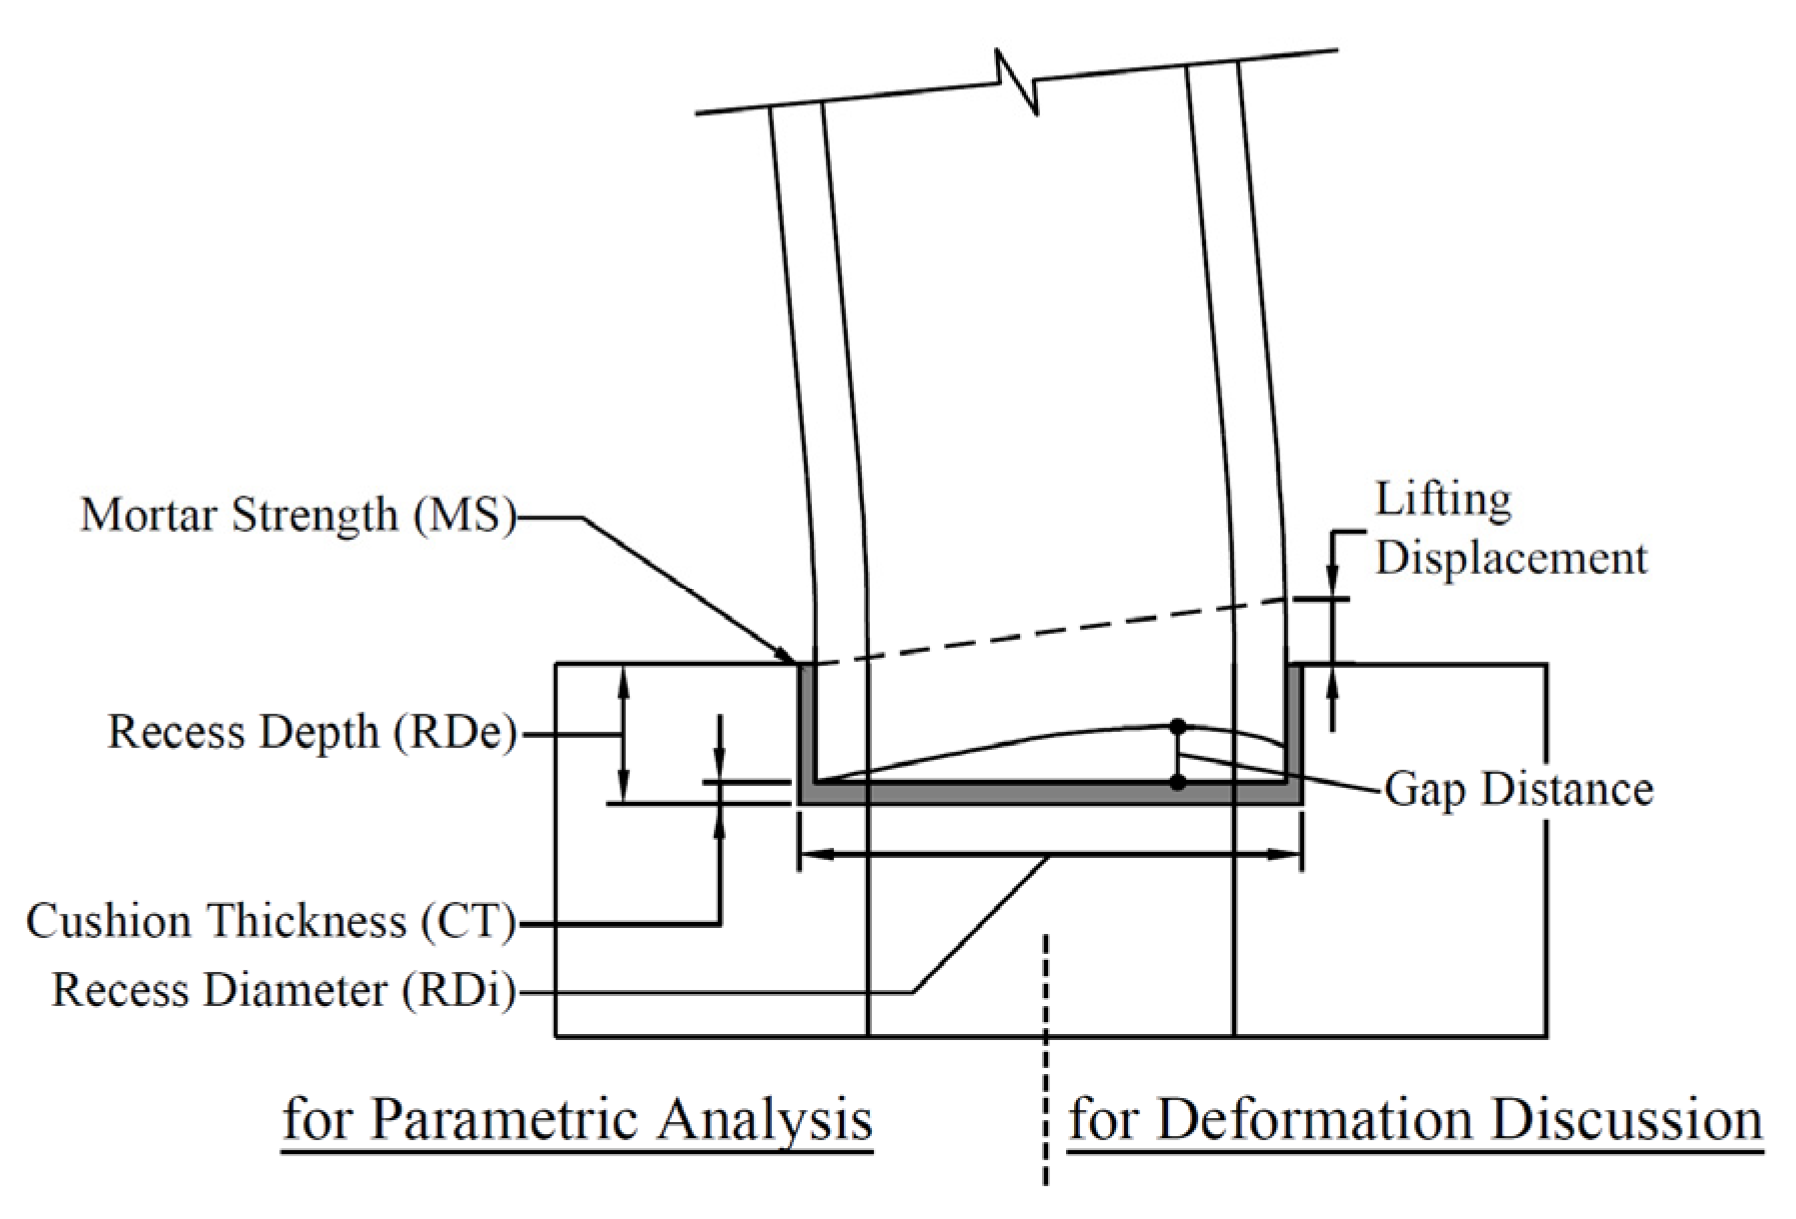
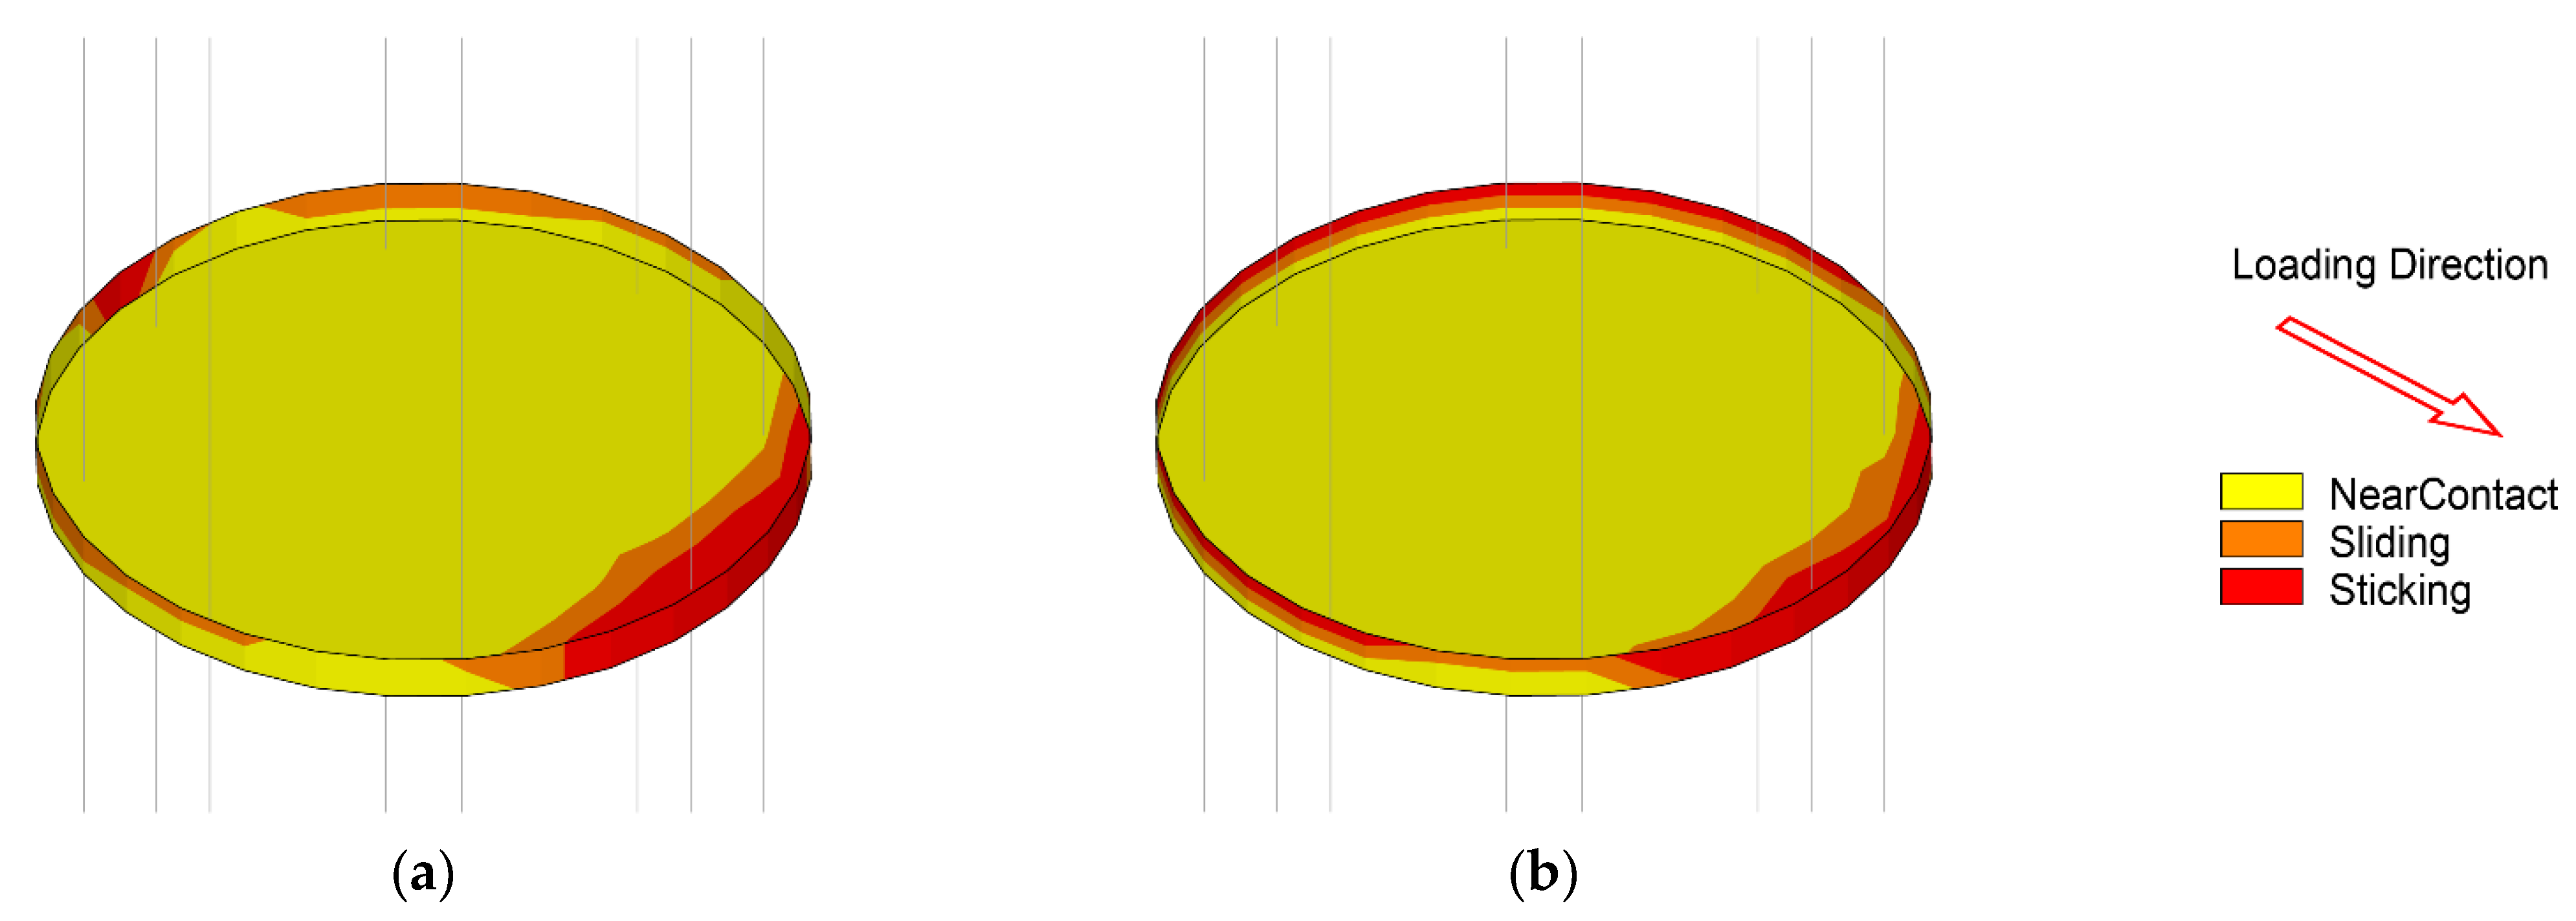
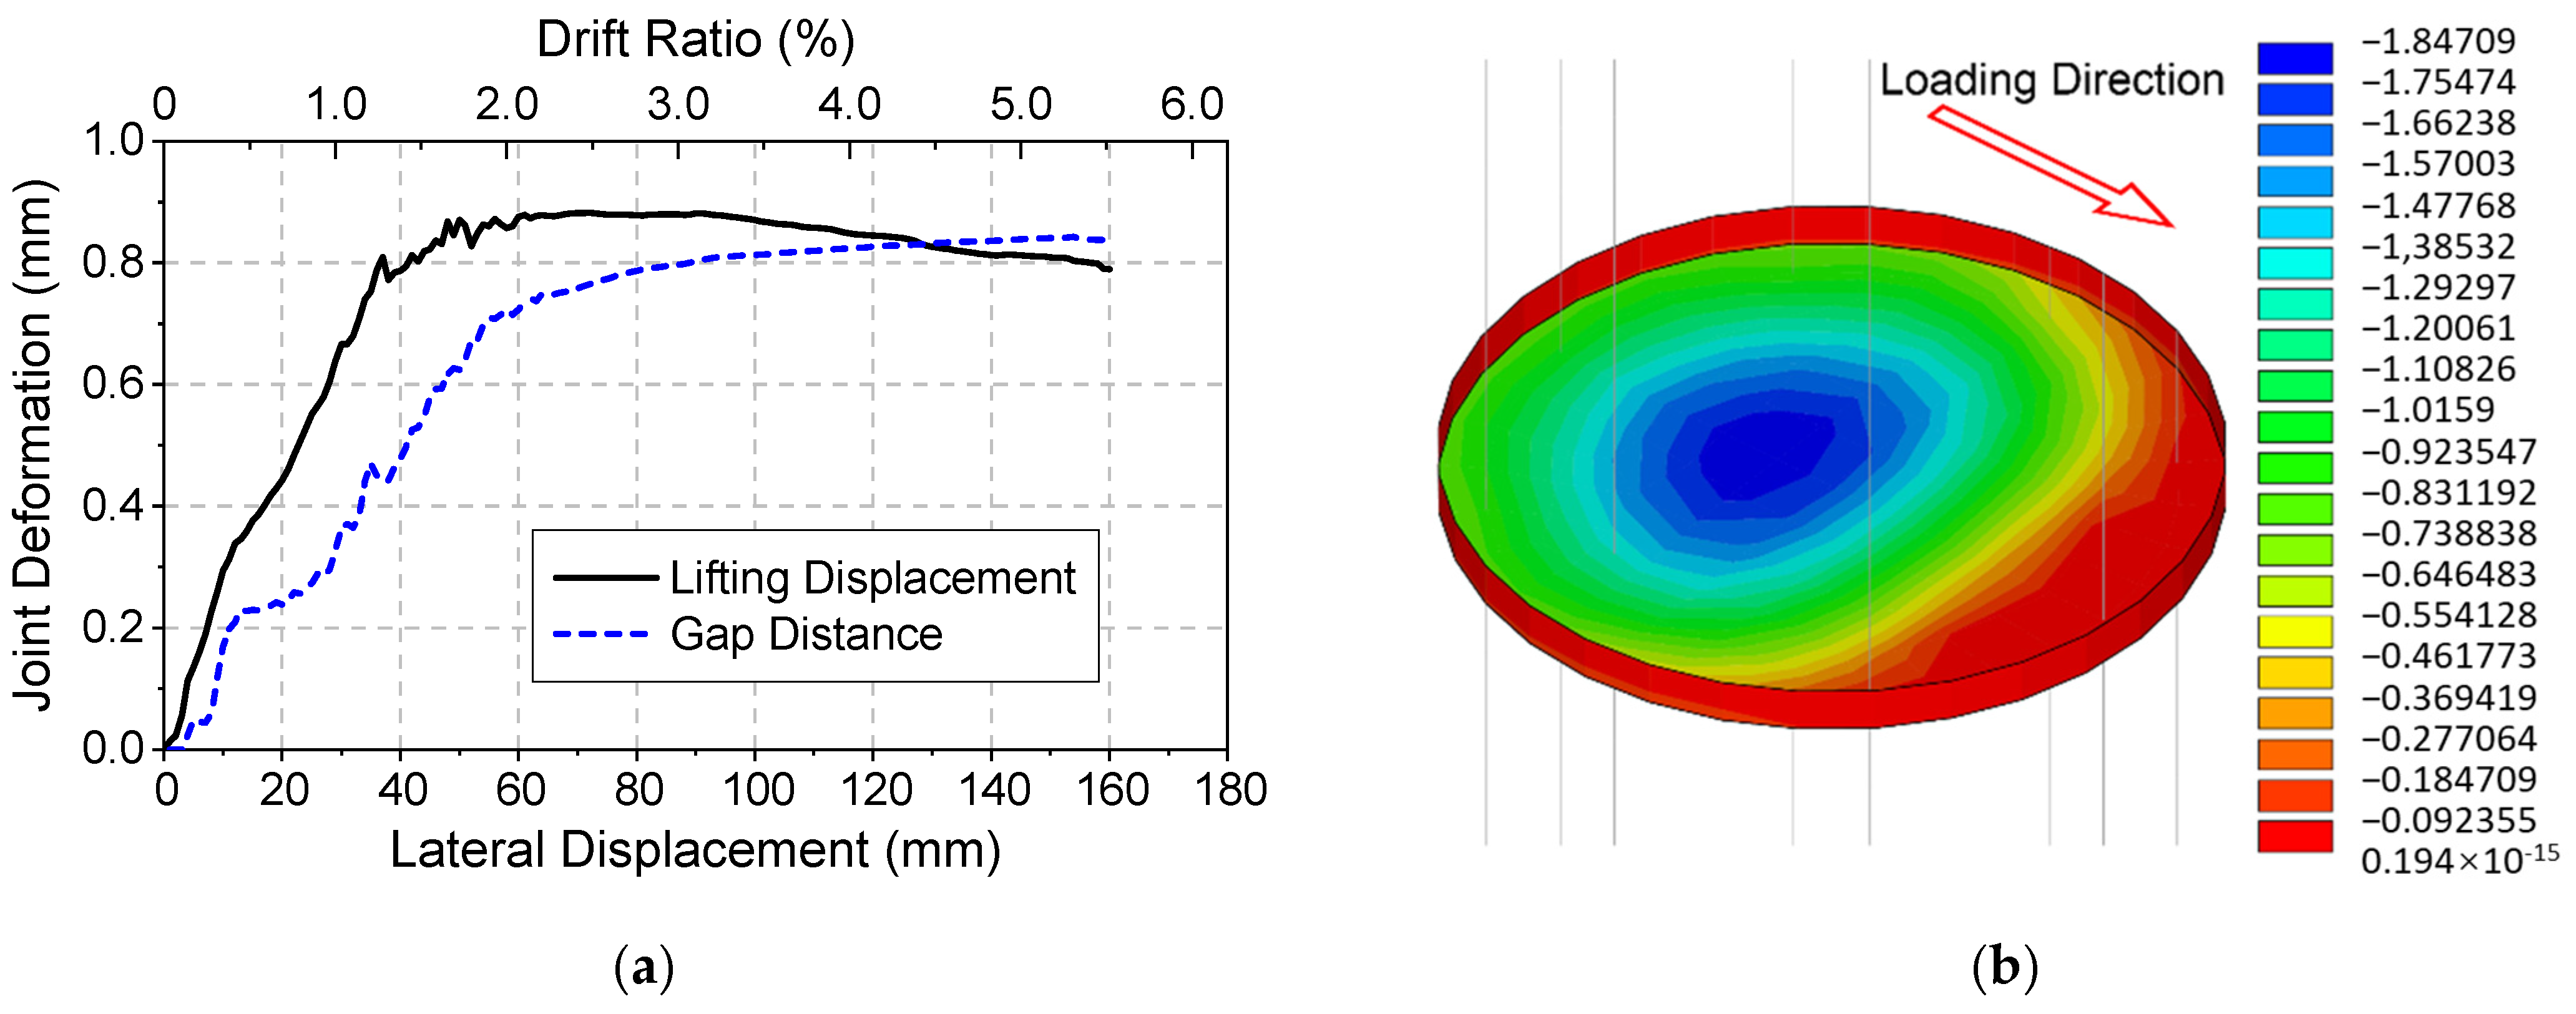
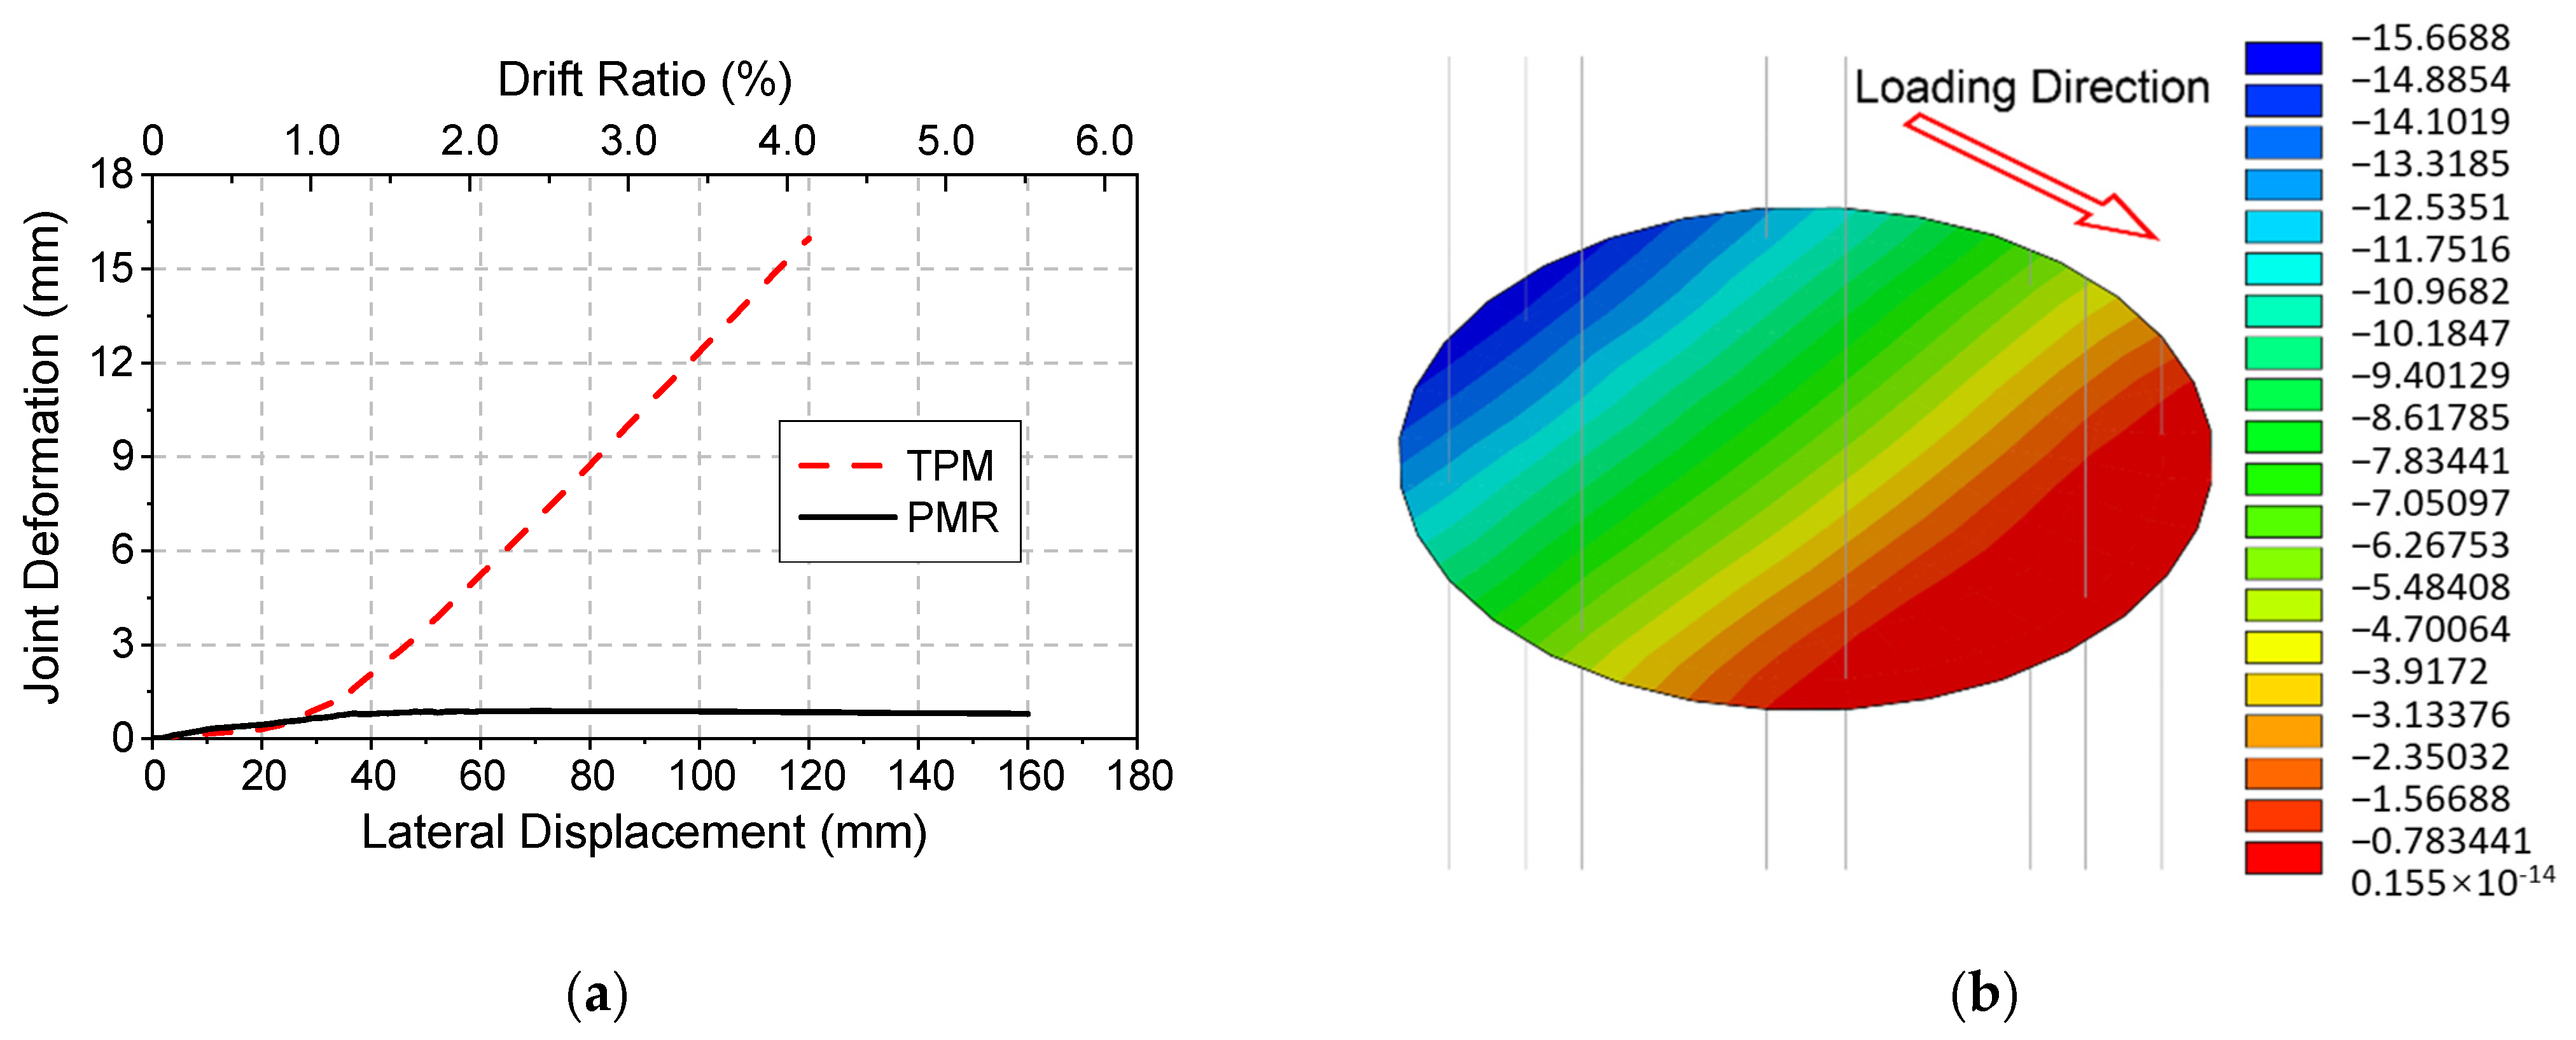
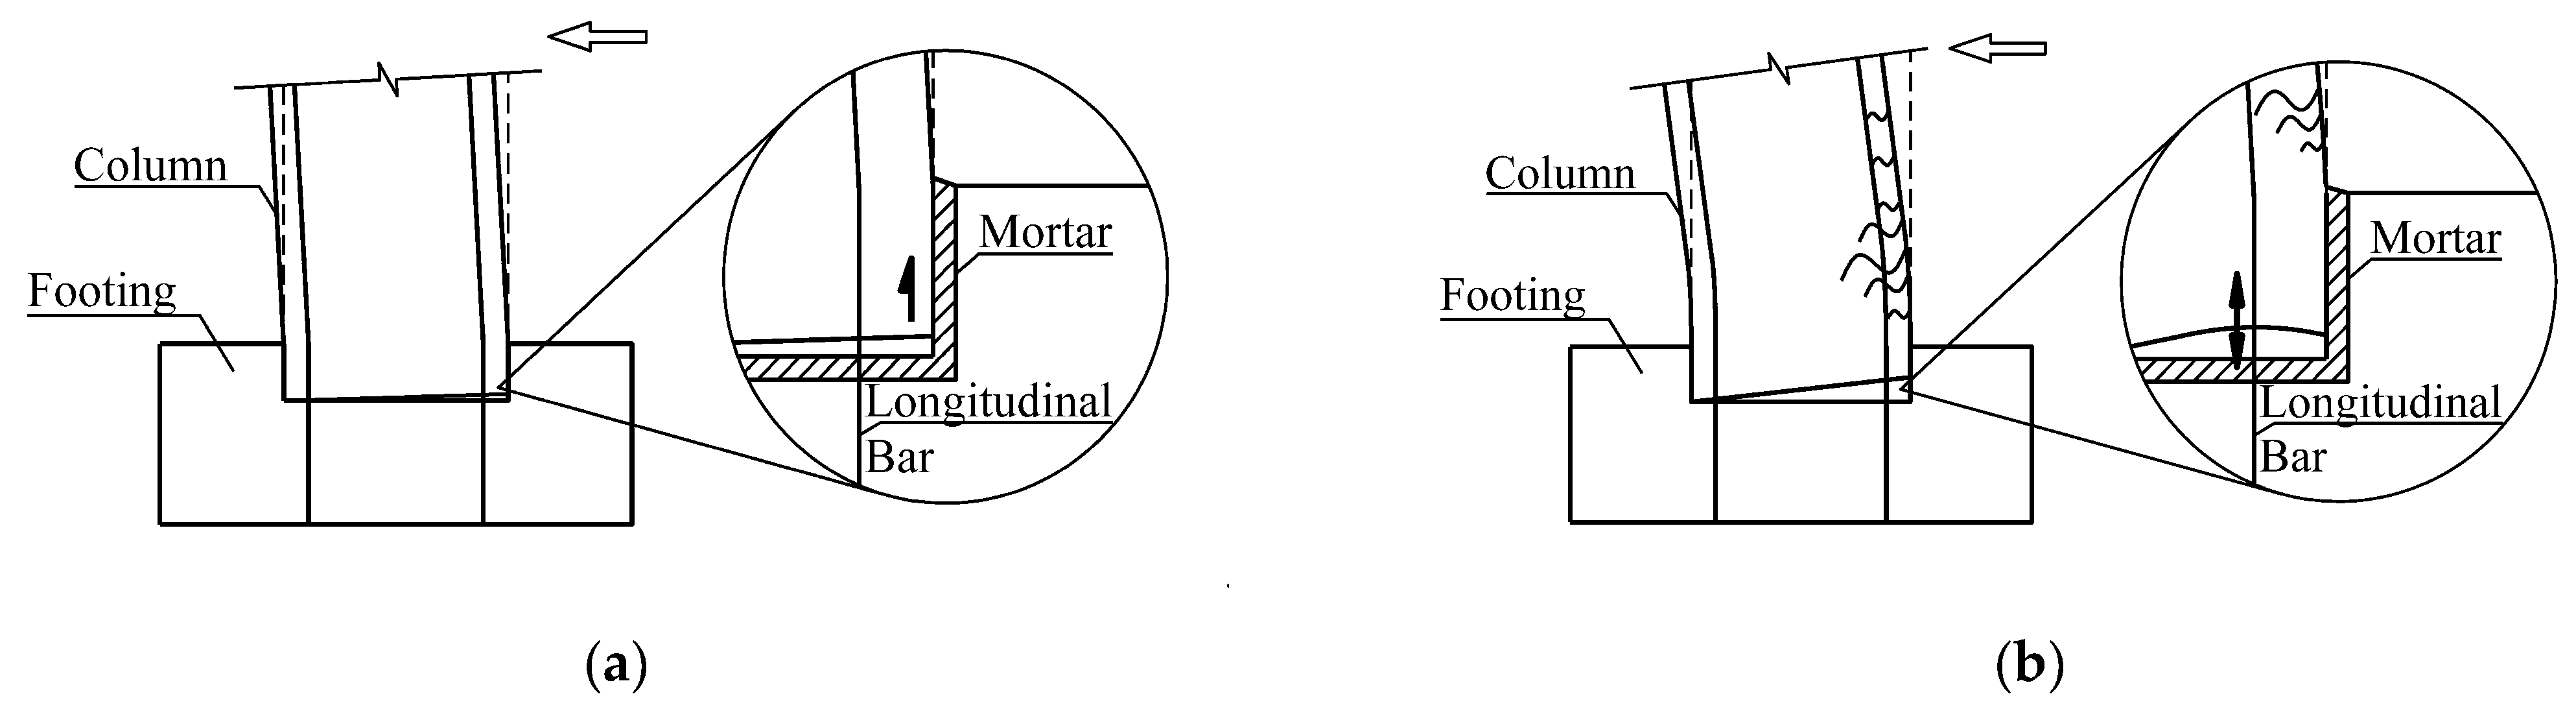
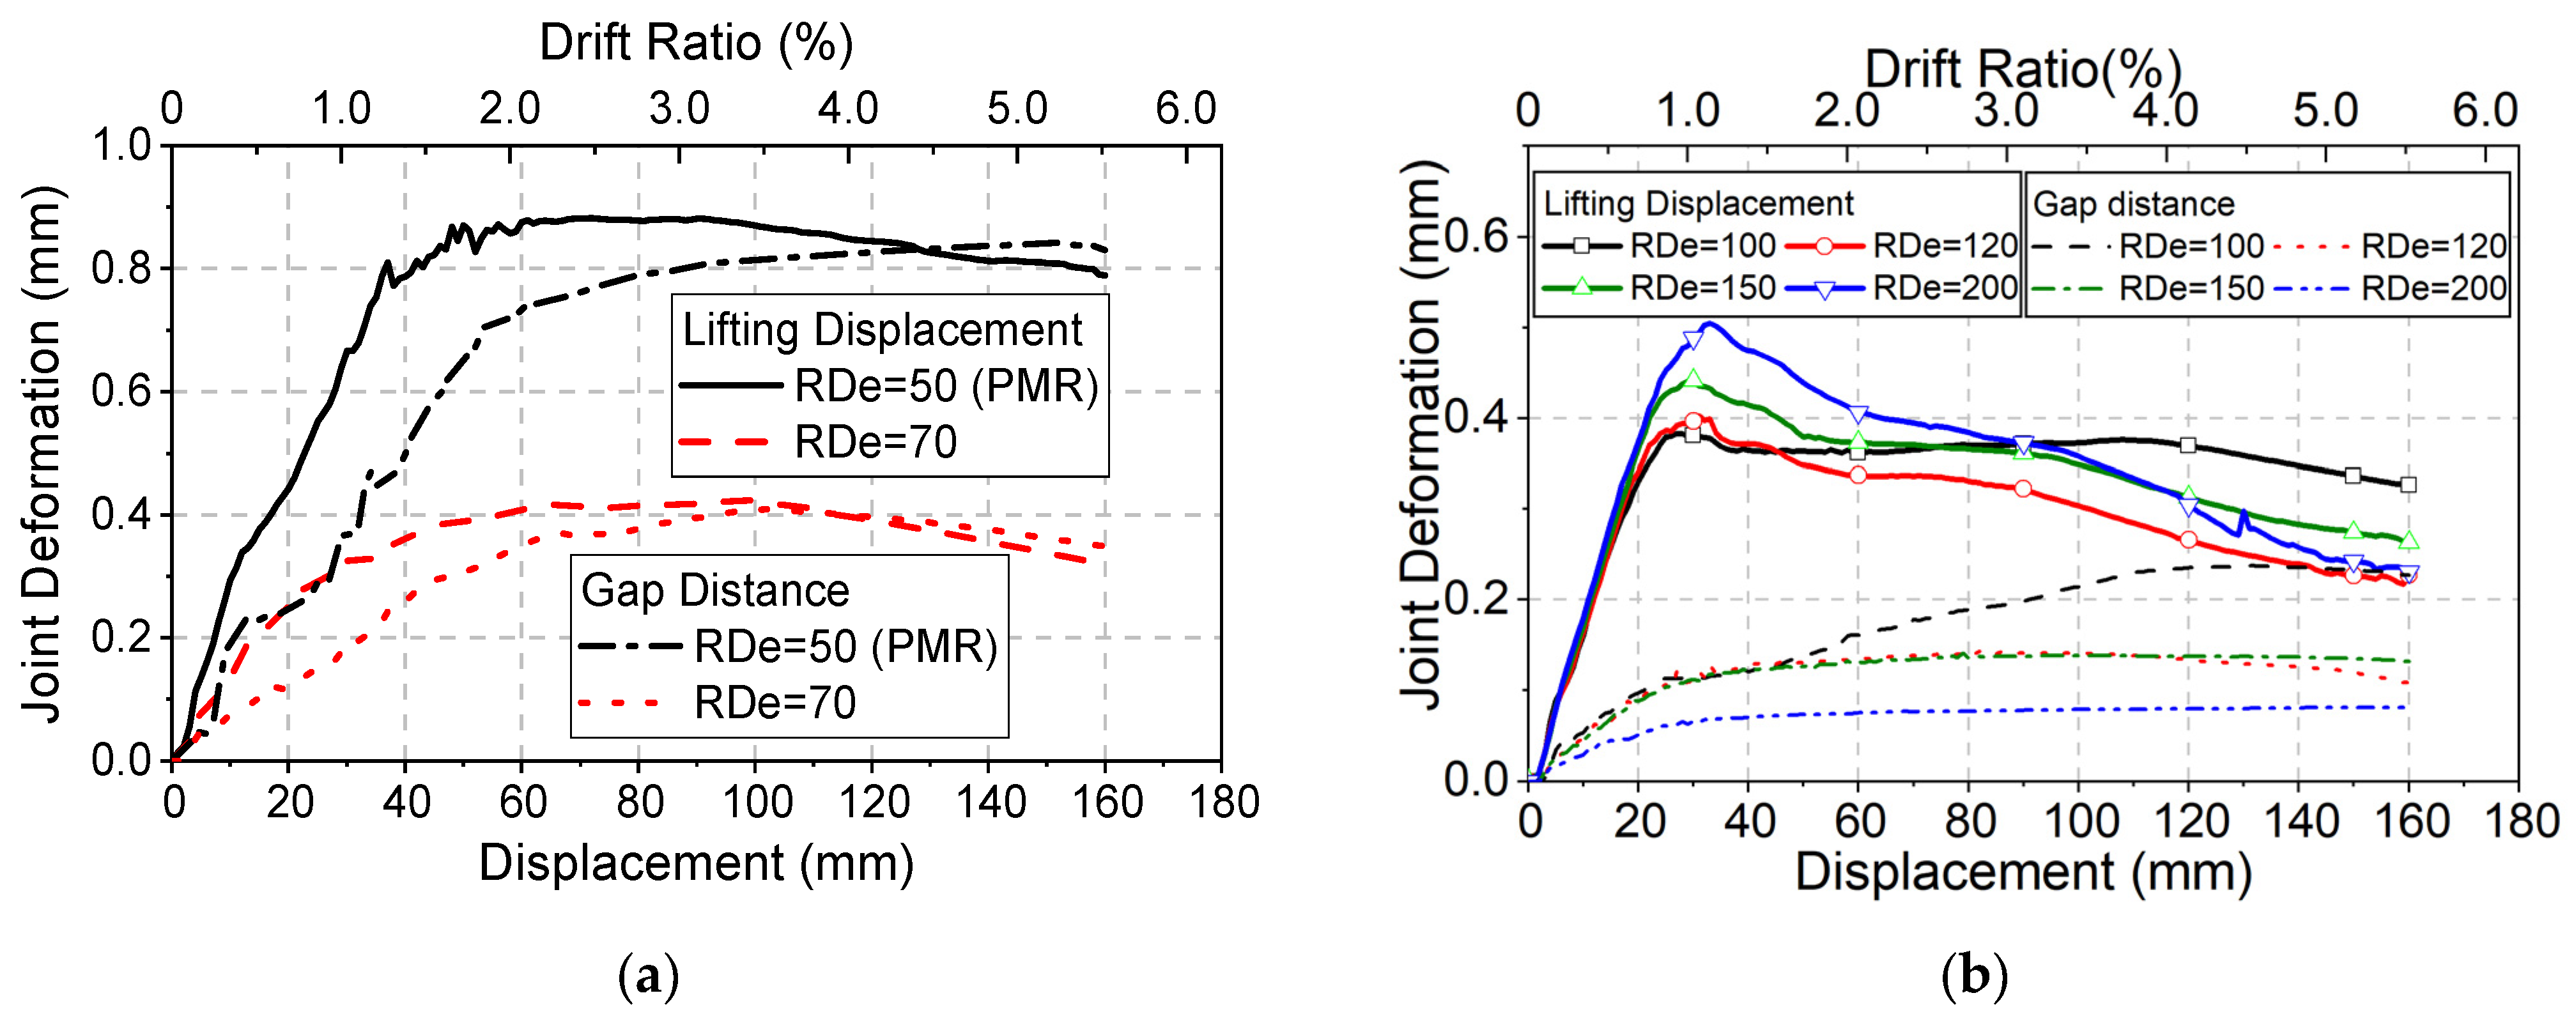
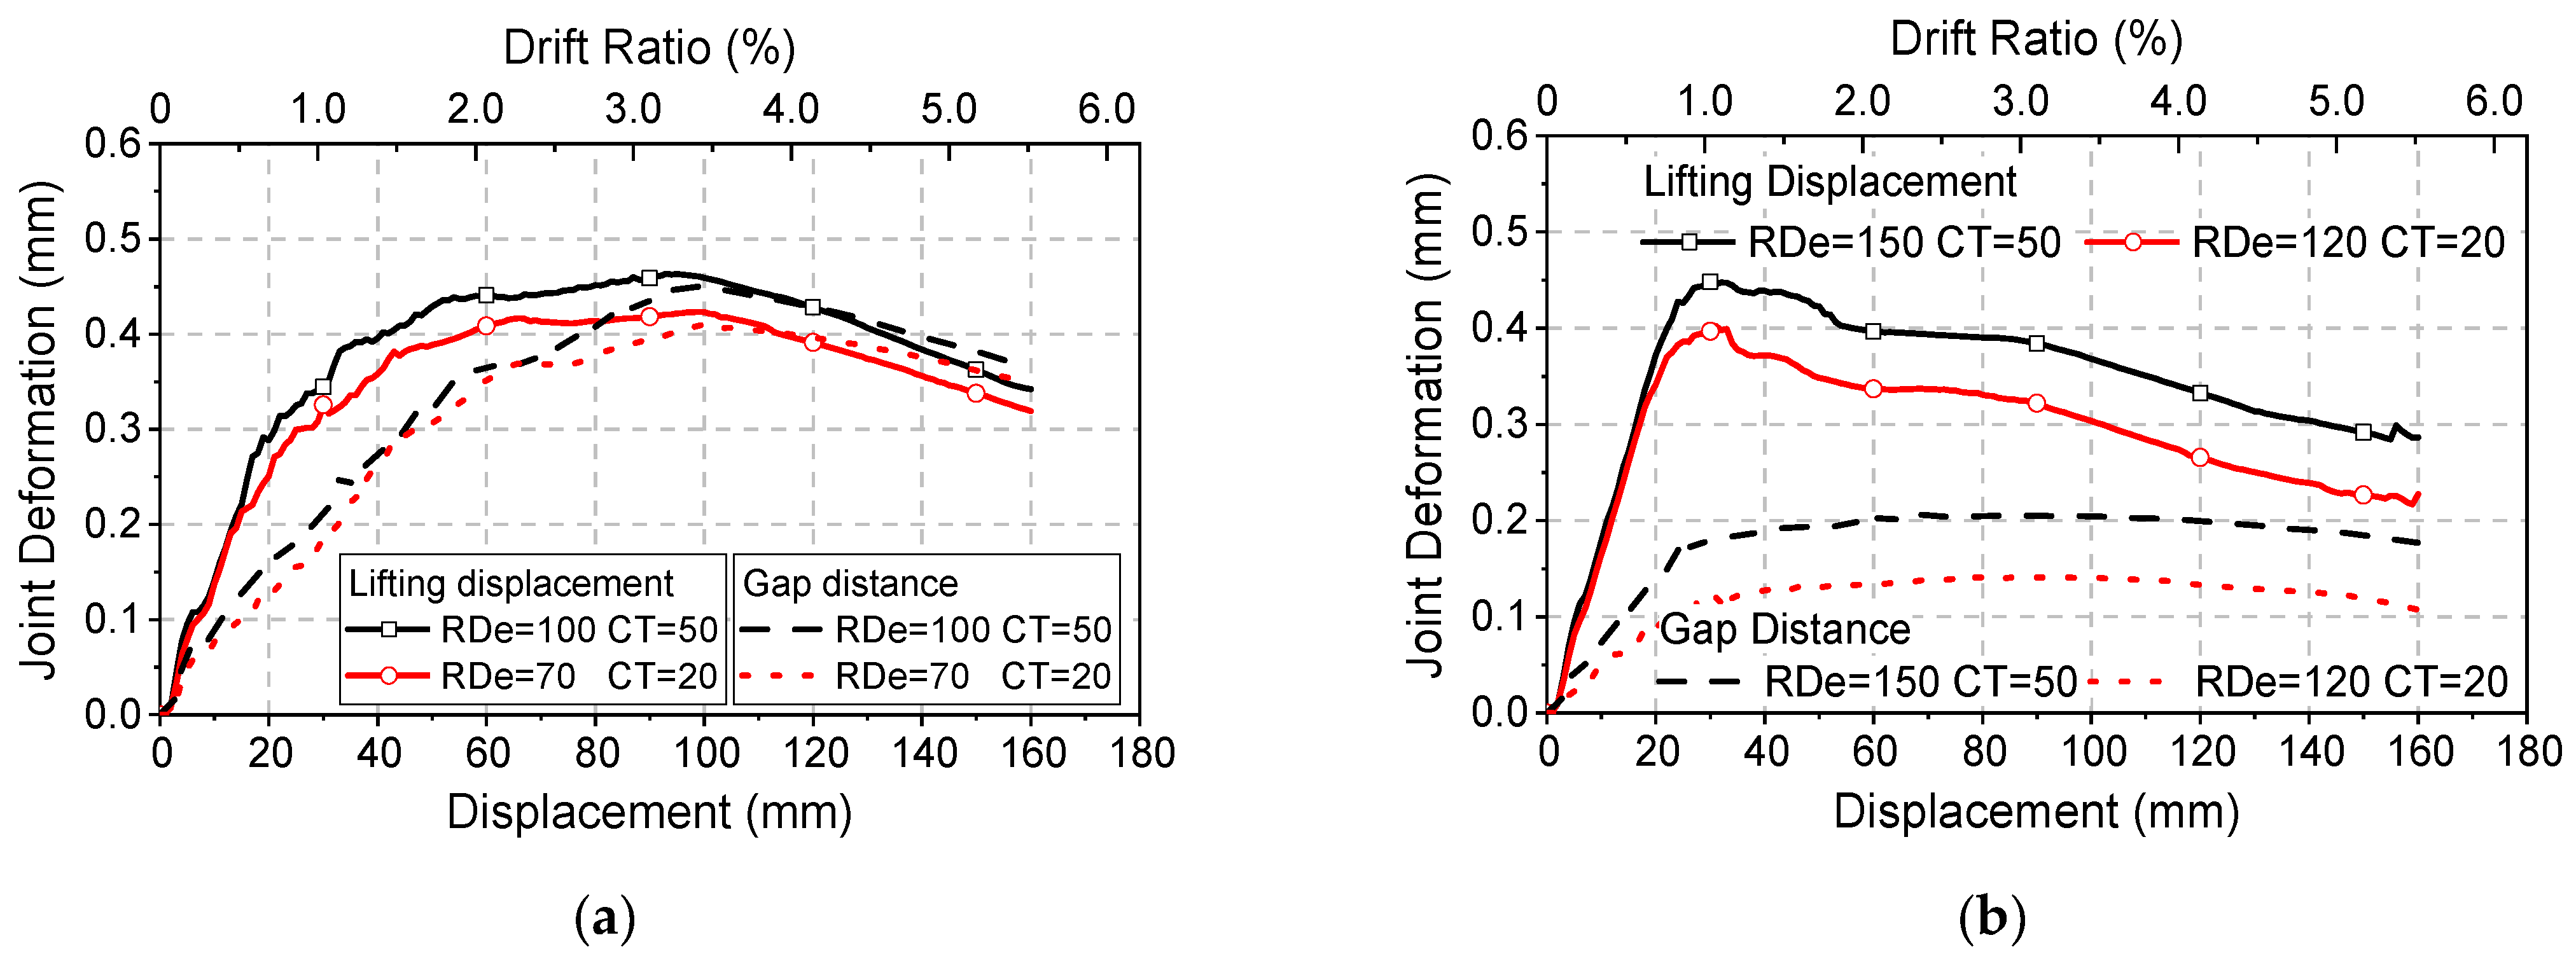
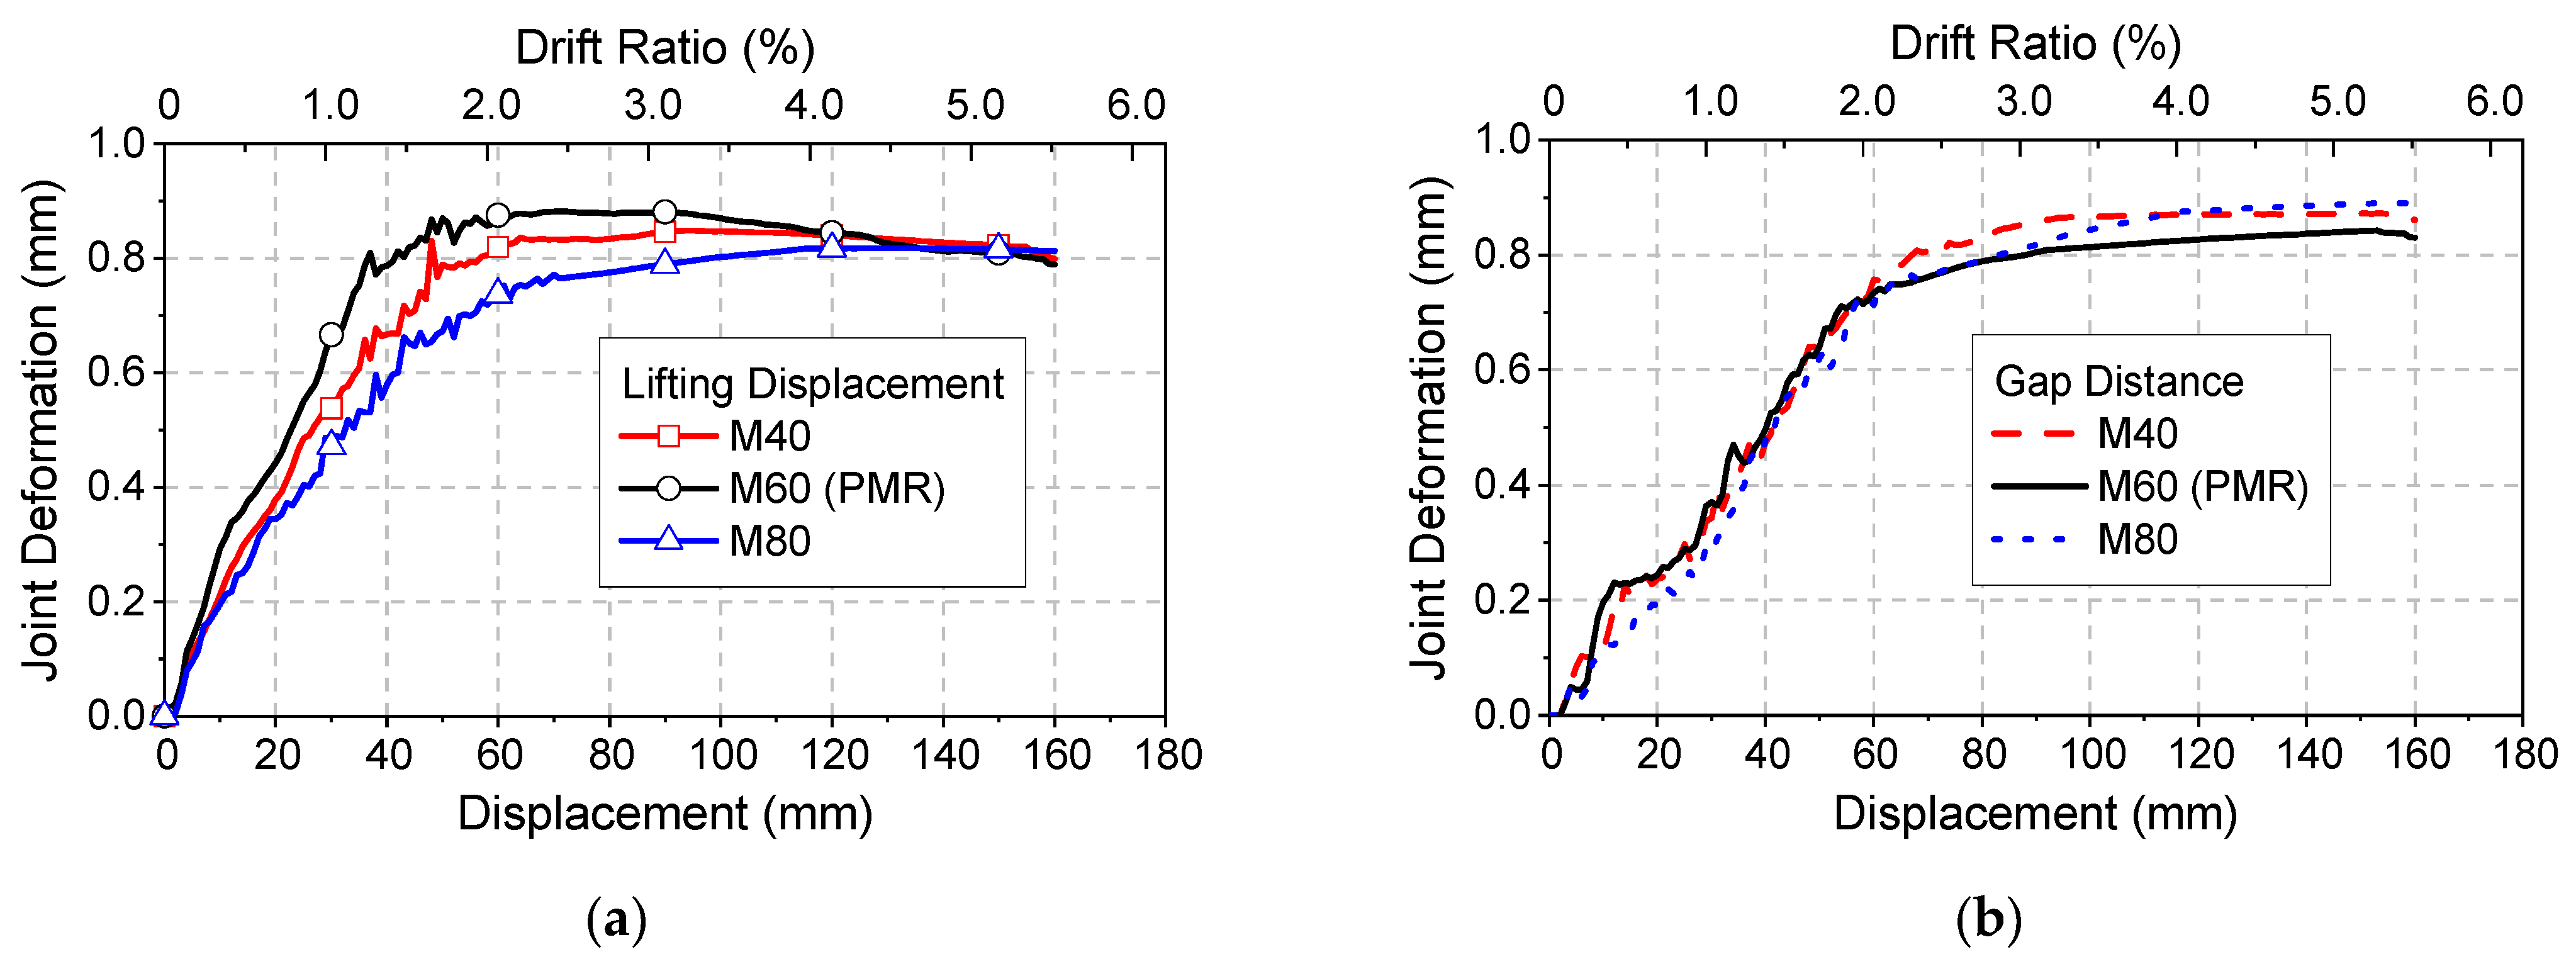
3.4. Local Deformation Development at Recess Joint

For the convenience of discussion, several terms are defined in Figure 12. Lifting displacement is the relative vertical displacement between the outermost node on the surface of the column tension side. Gap distance means the maximum gap distance of the contact elements at the bottom of the recess.
Contact statuses of PMR at 50 mm and 160 mm are shown in Figure 13. Confinement effect provided by the recess keeps some elements in contact even at the displacement level of 160 mm. For the rim surface, some elements that are already in NearContact at 50 mm state return to Sticking state at 160 mm, where the upper movement of column segment makes column tip stuck to the rim surface at the near side of loading.
Figure 14a shows the lifting displacement and gap distance about lateral displacement of PMR. The lifting displacement decreases with lateral resistant force at 100 mm, while gap distance keeps increasing from 0.367 mm below lifting displacement to 0.041 mm above. This indicates that the joint gap distance is mainly related to the elongation of the longitudinal rebar after crack initiation. Figure 14b shows PMR’s gap distance distribution at the displacement of 160 mm, and the maximum value is 1.84 mm, where friction from the recess rim restricts the local deformation. TPM’s maximum gap distance of 15.6 mm is much larger than PMR, as shown in Figure 15a. Different from PMR, and the joint opening of TPM varies almost linearly along the loading direction, due to the lack of constraints (Figure 15b).
In general, the deformation development of pier with recess can be divided into two stages (Figure 16). At the first stage, initial deformation is developed by small opening of joint and the shear deformation of recess rim, where column remains elastic. After column cracking (the second stage), tension force is transferred from concrete and mortar in the recess to longitudinal reinforcement. Shear force and corresponding deformation on recess rim start to decrease, while strain of longitudinal reinforcement and gap distance continue to increase until rebars yield.

4. Parametric Analysis

To fully understand the recess design, numerical models with different recess depths, diameters, cushion thicknesses, and mortar strengths are investigated for parametric analysis (illustrated in Figure 12). All the unstated dimensions and materials of the following models remain the same as PMR.

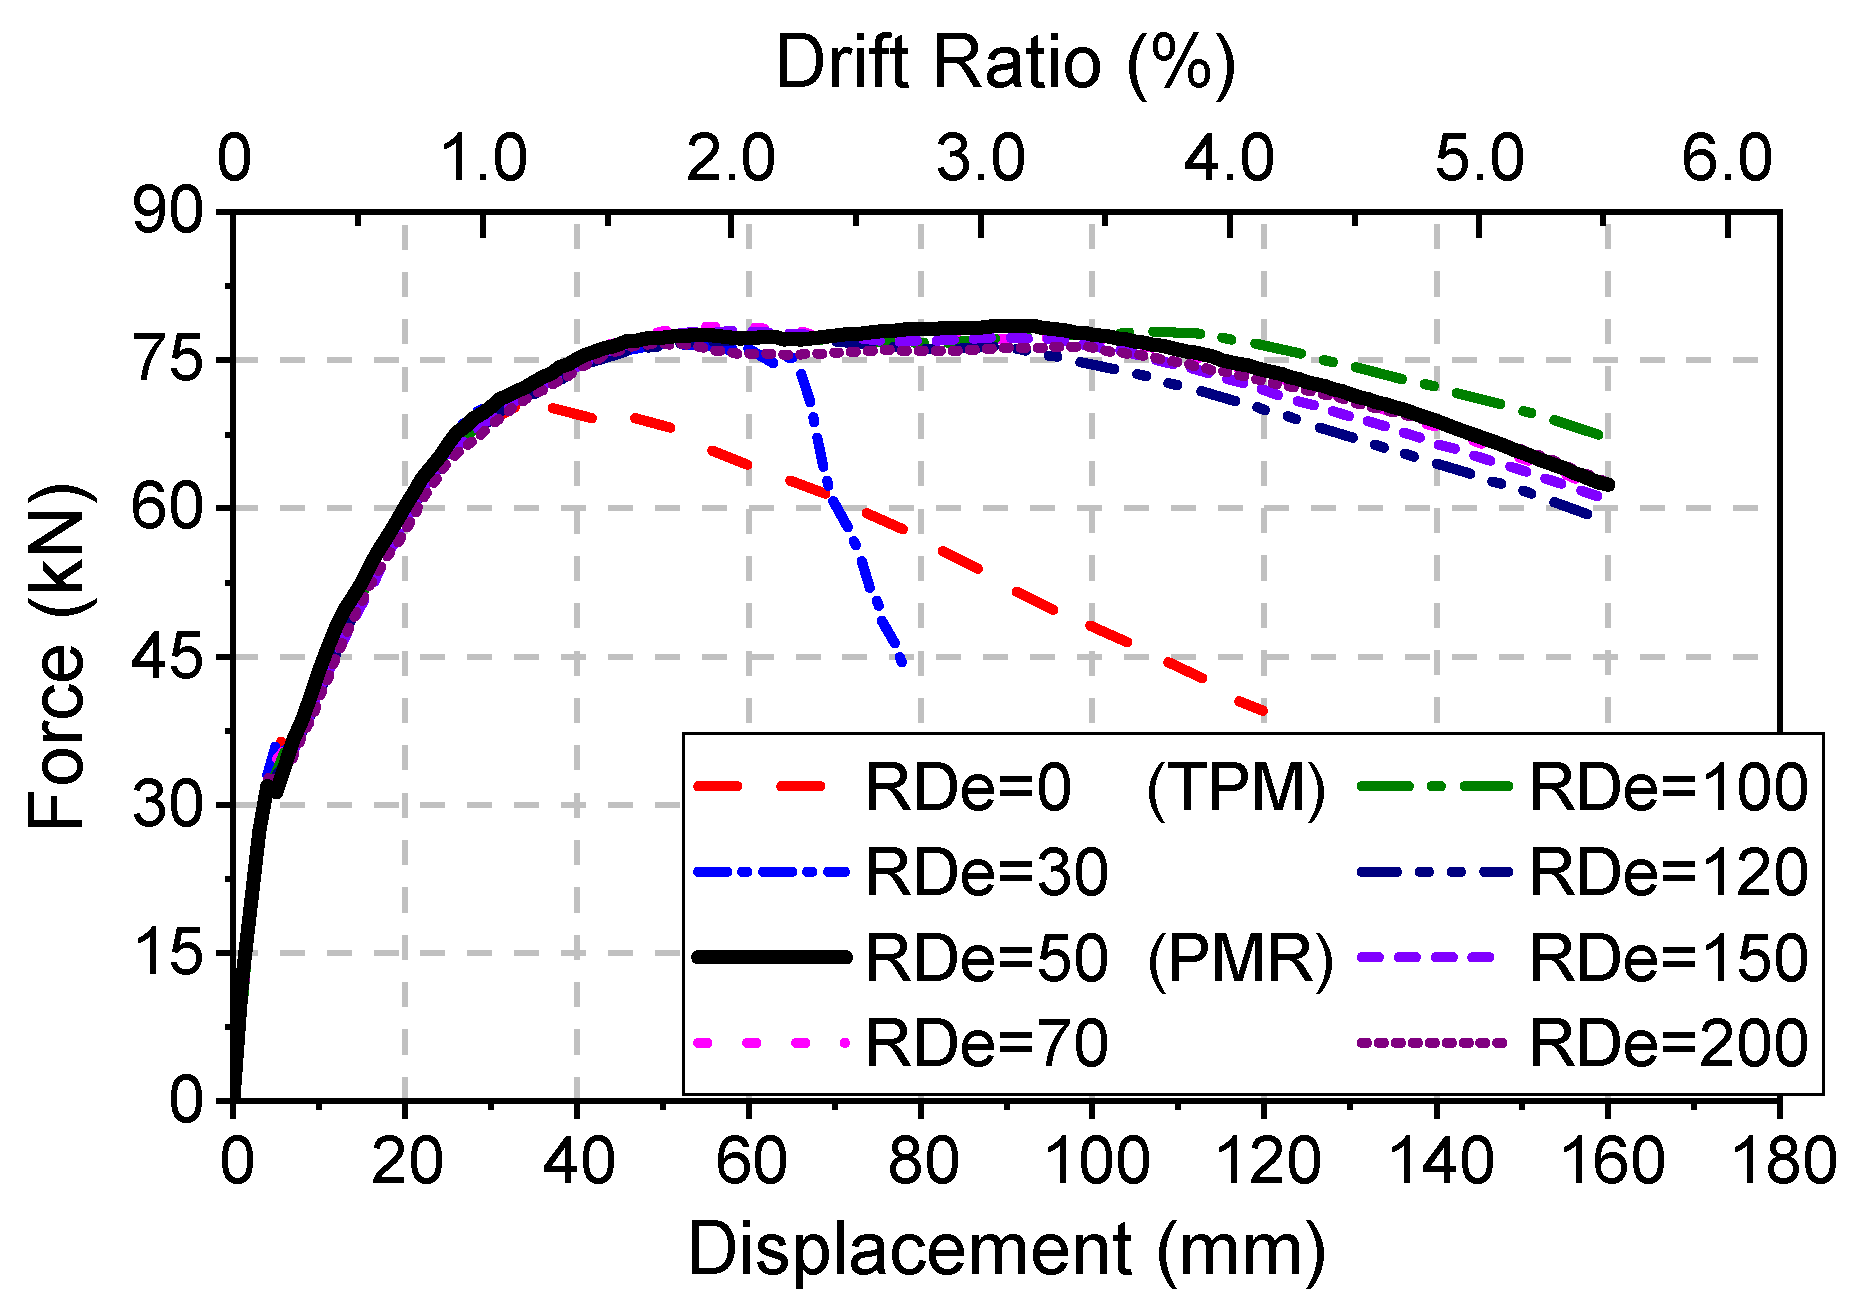
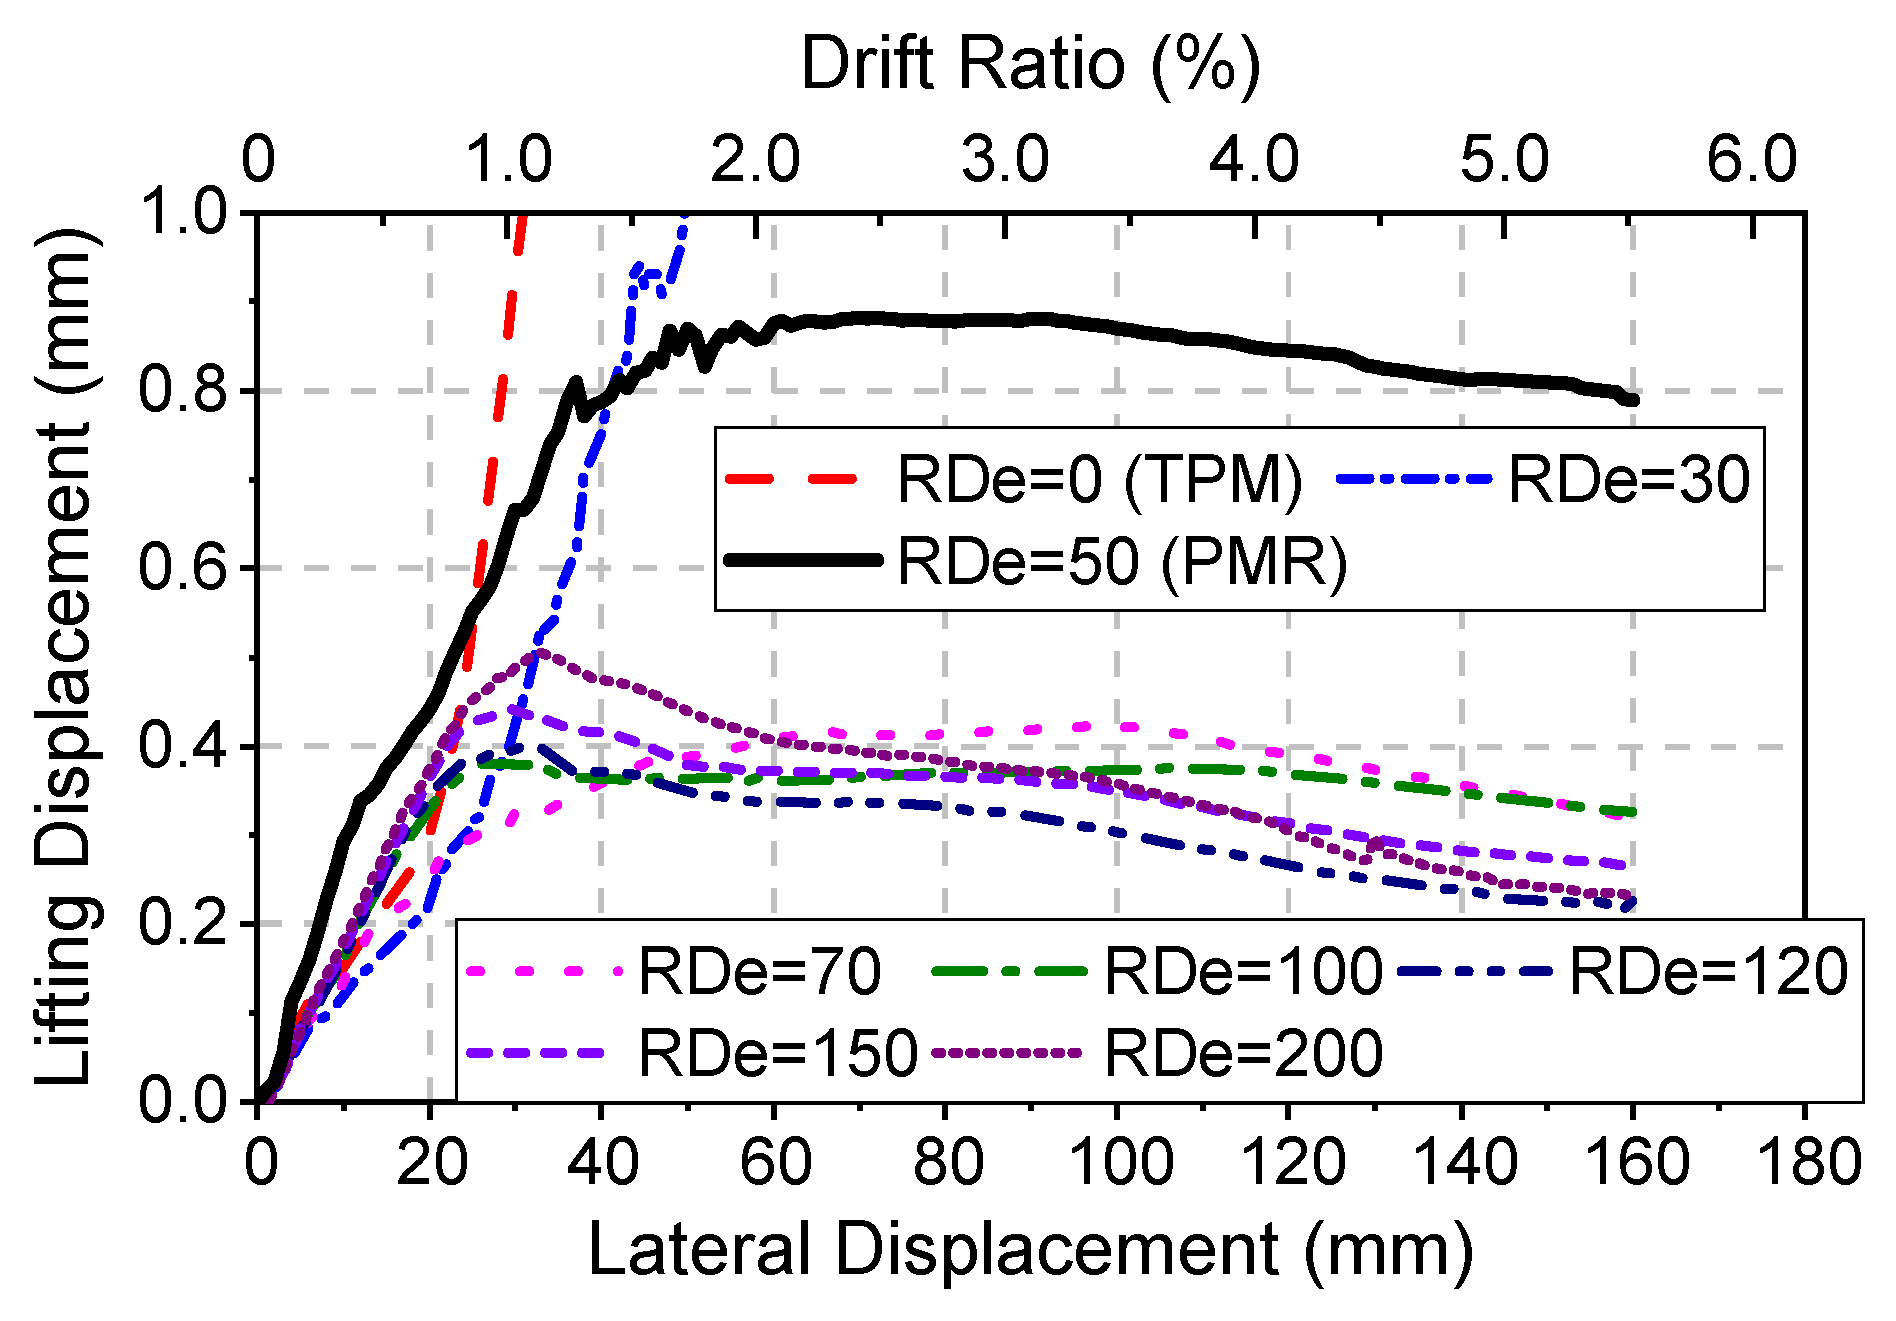
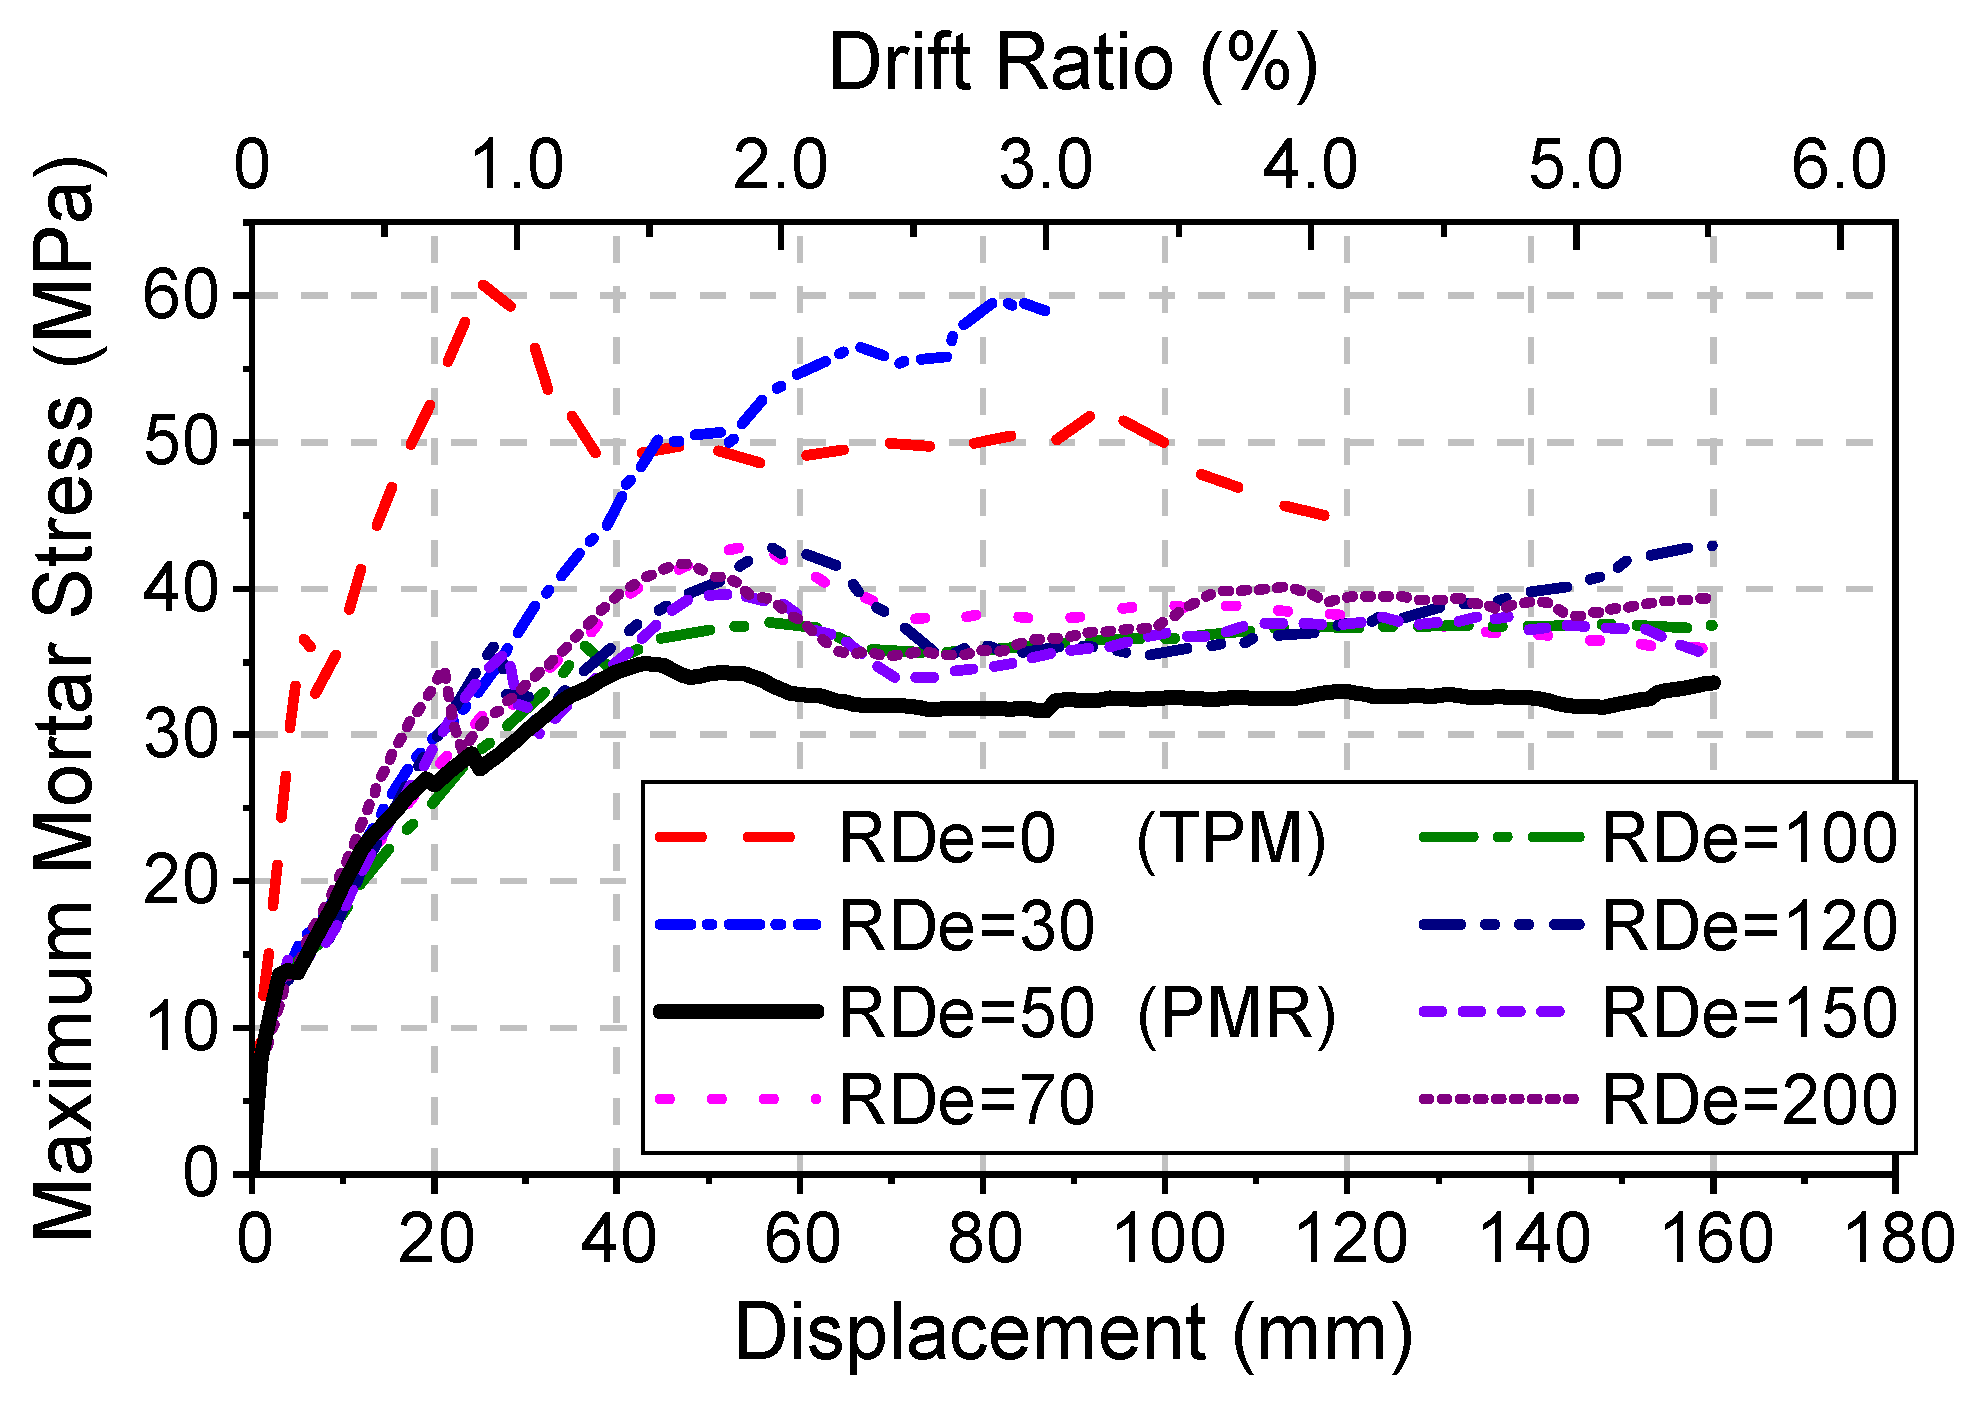
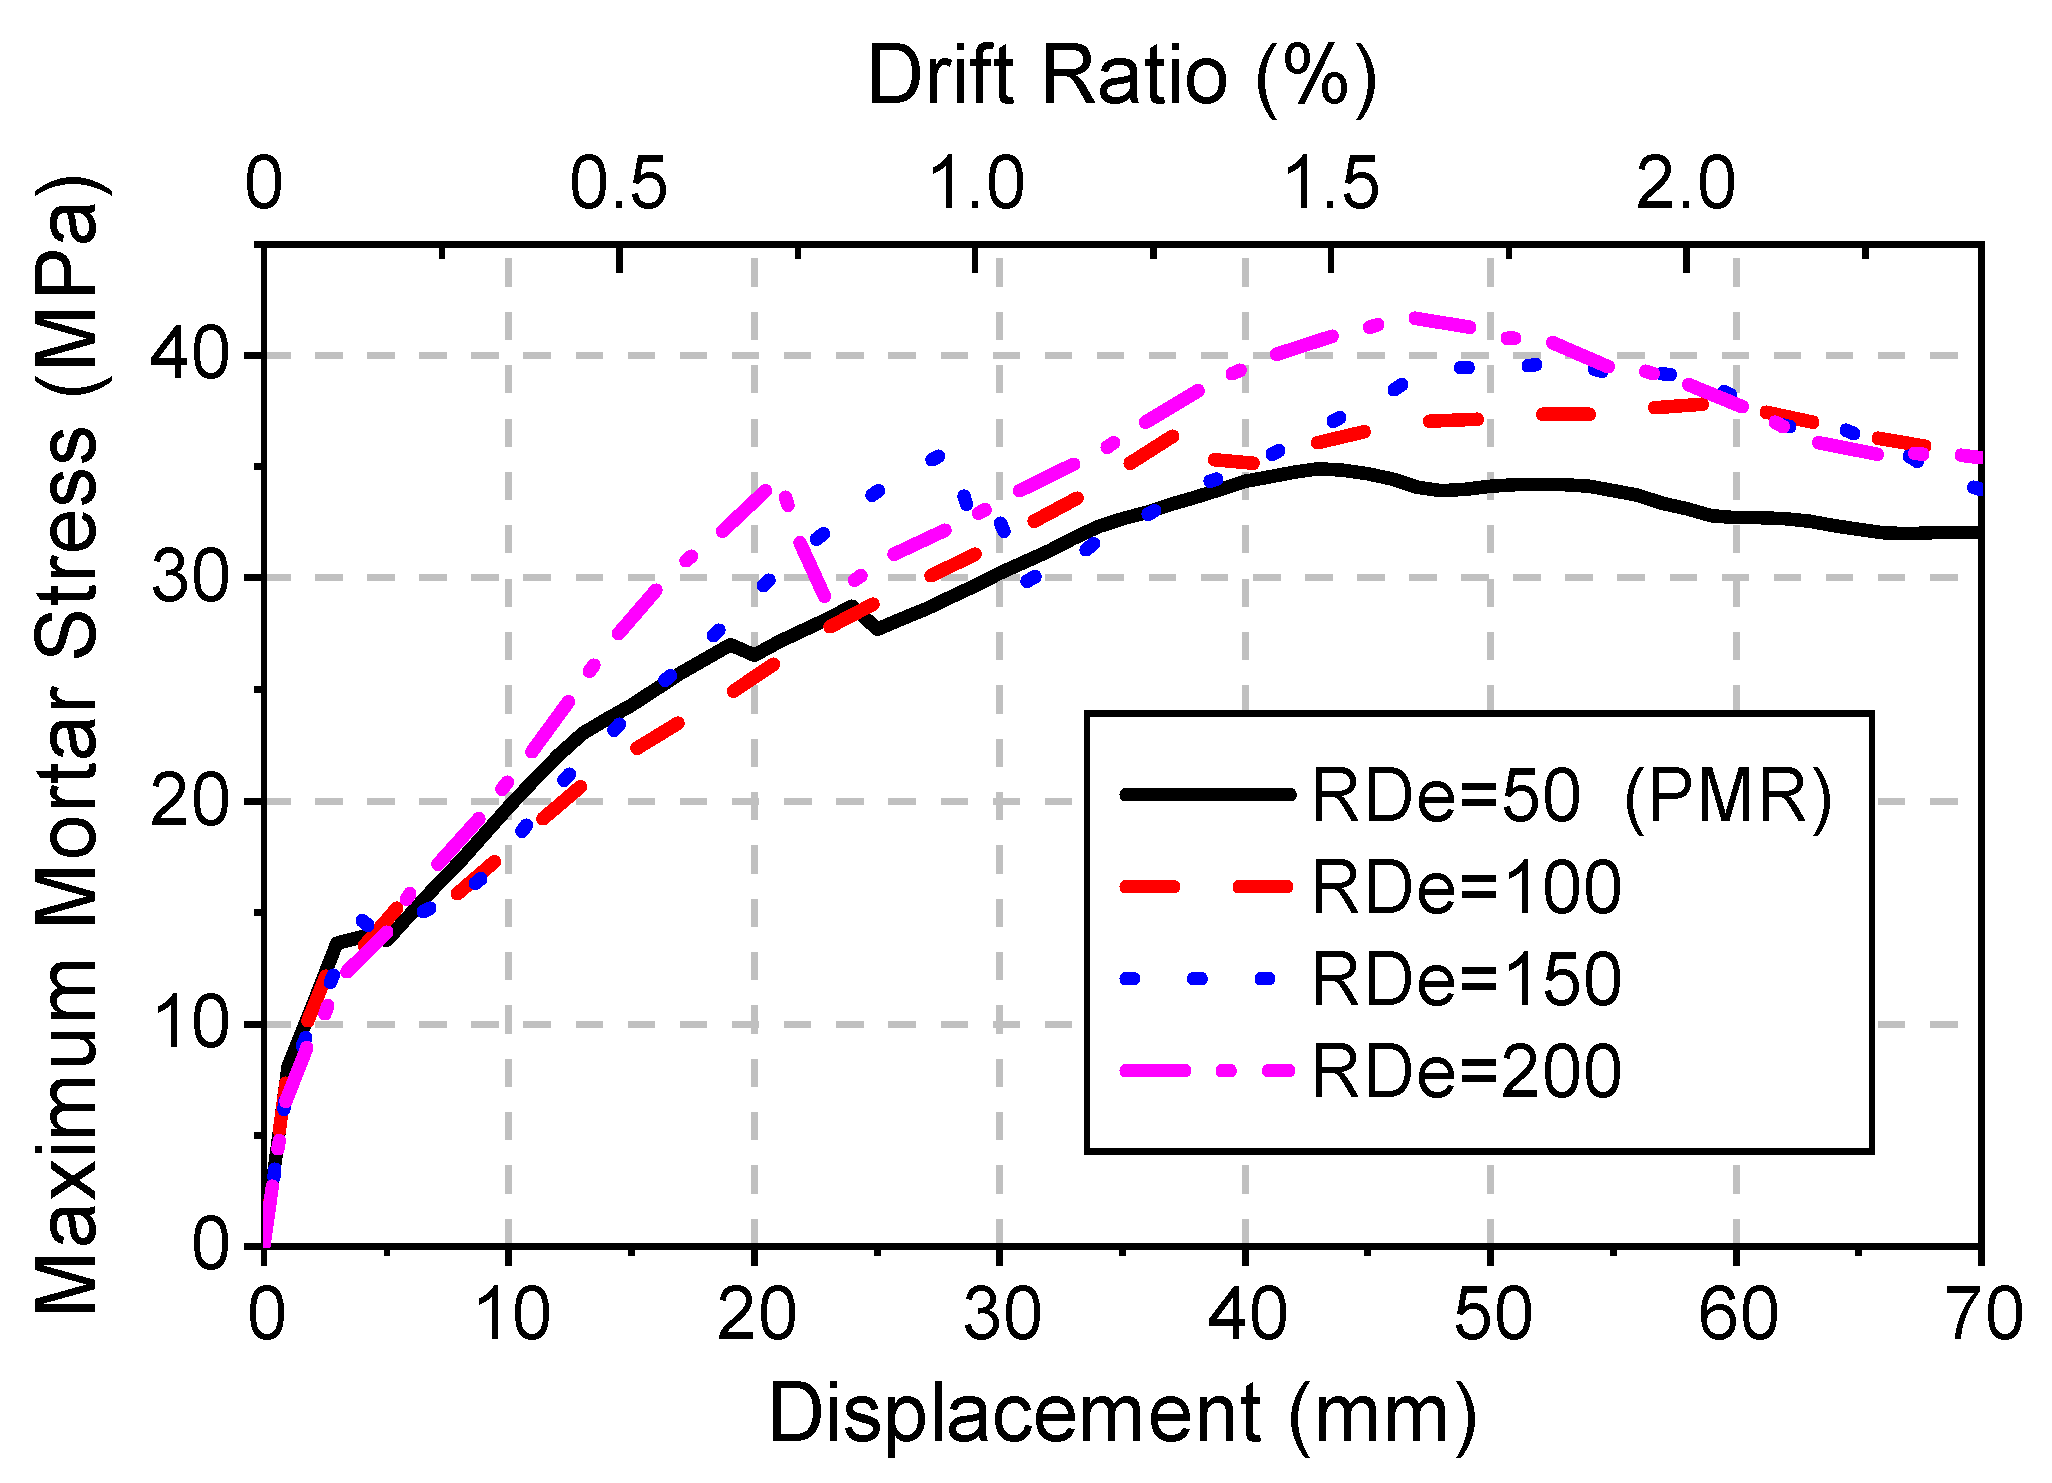
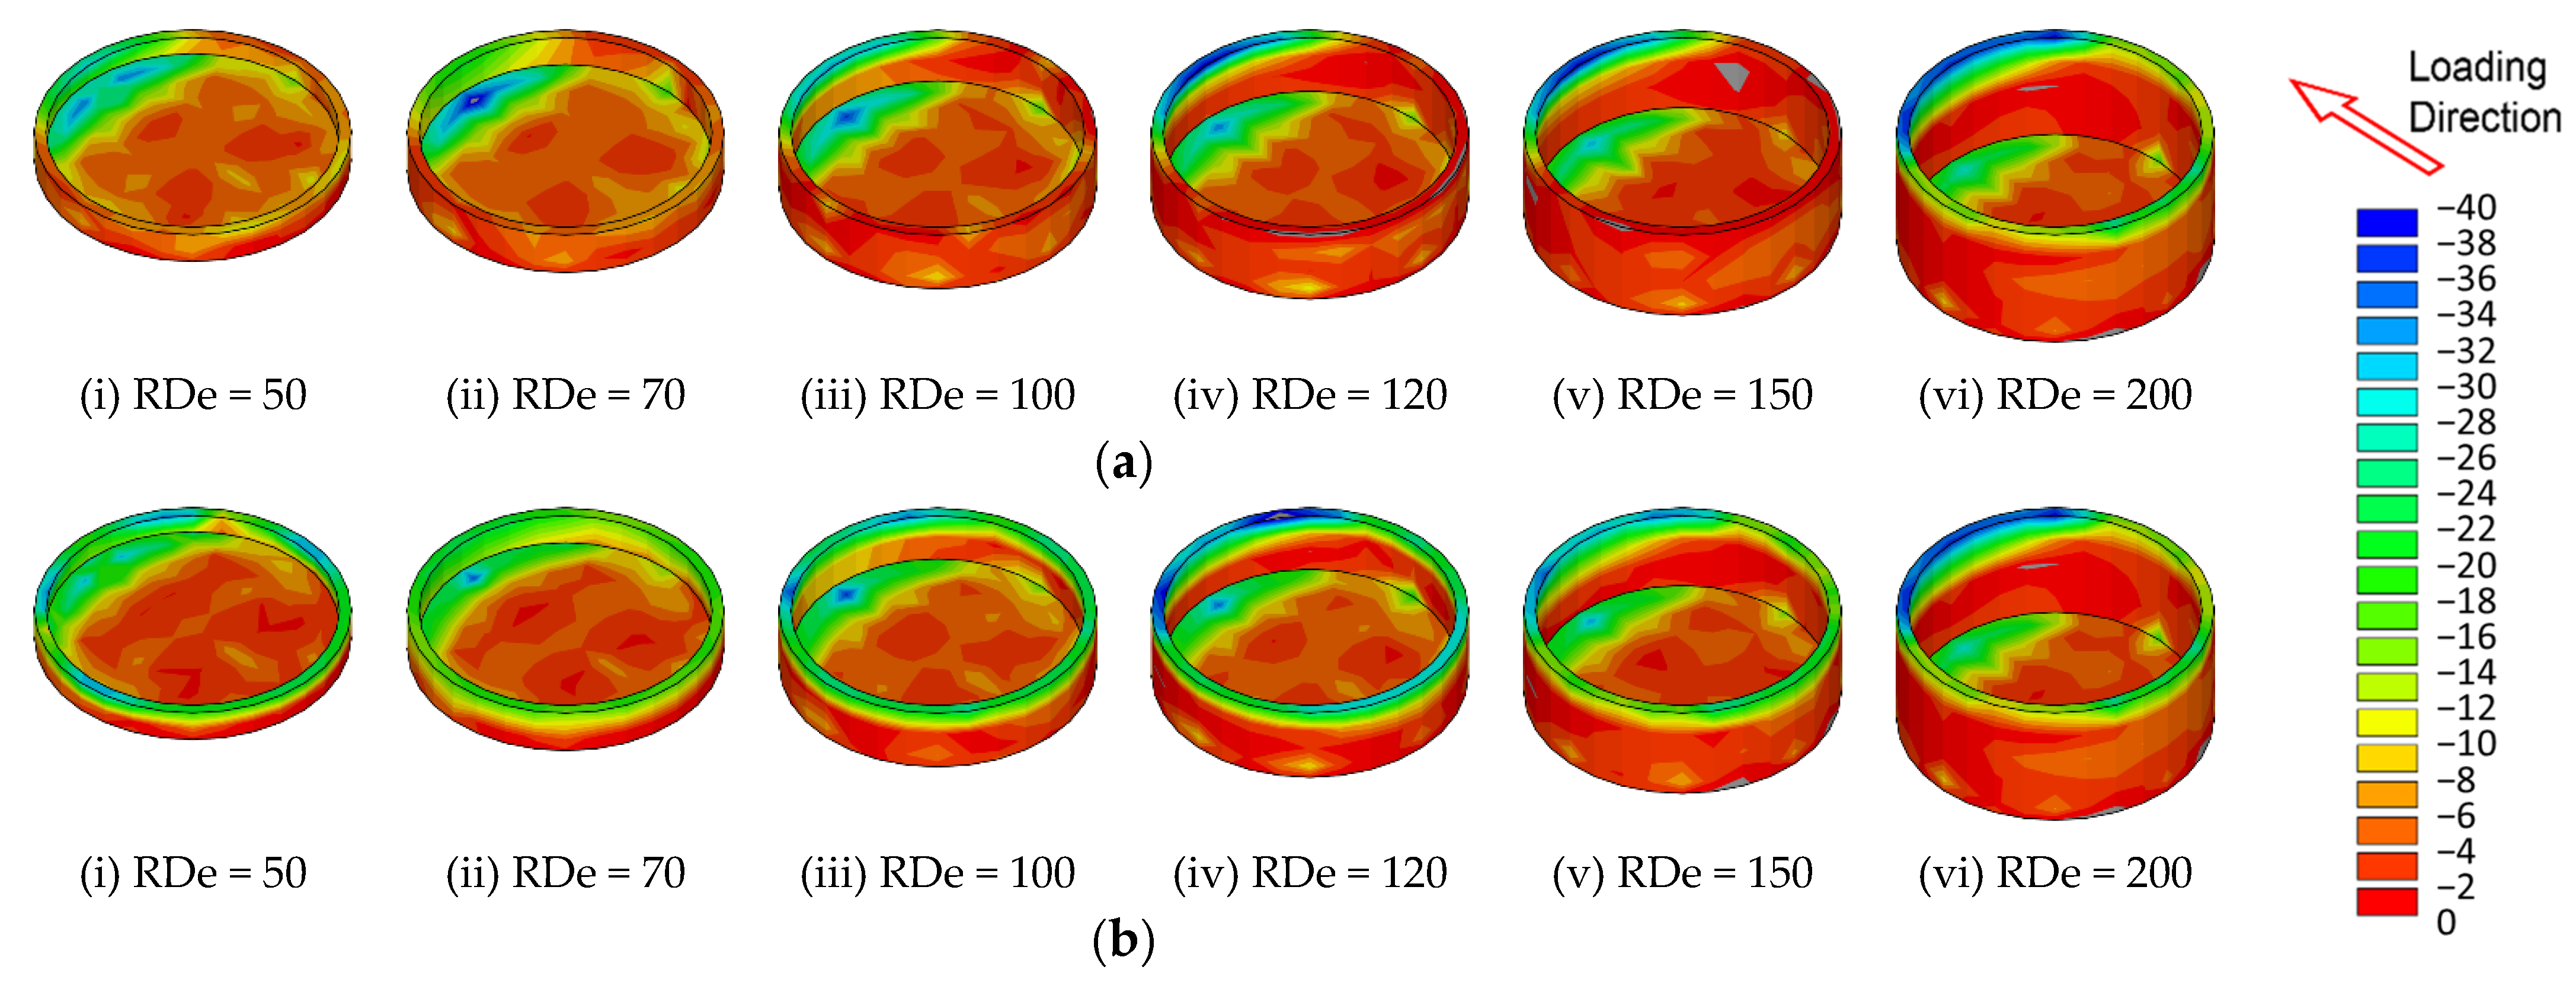
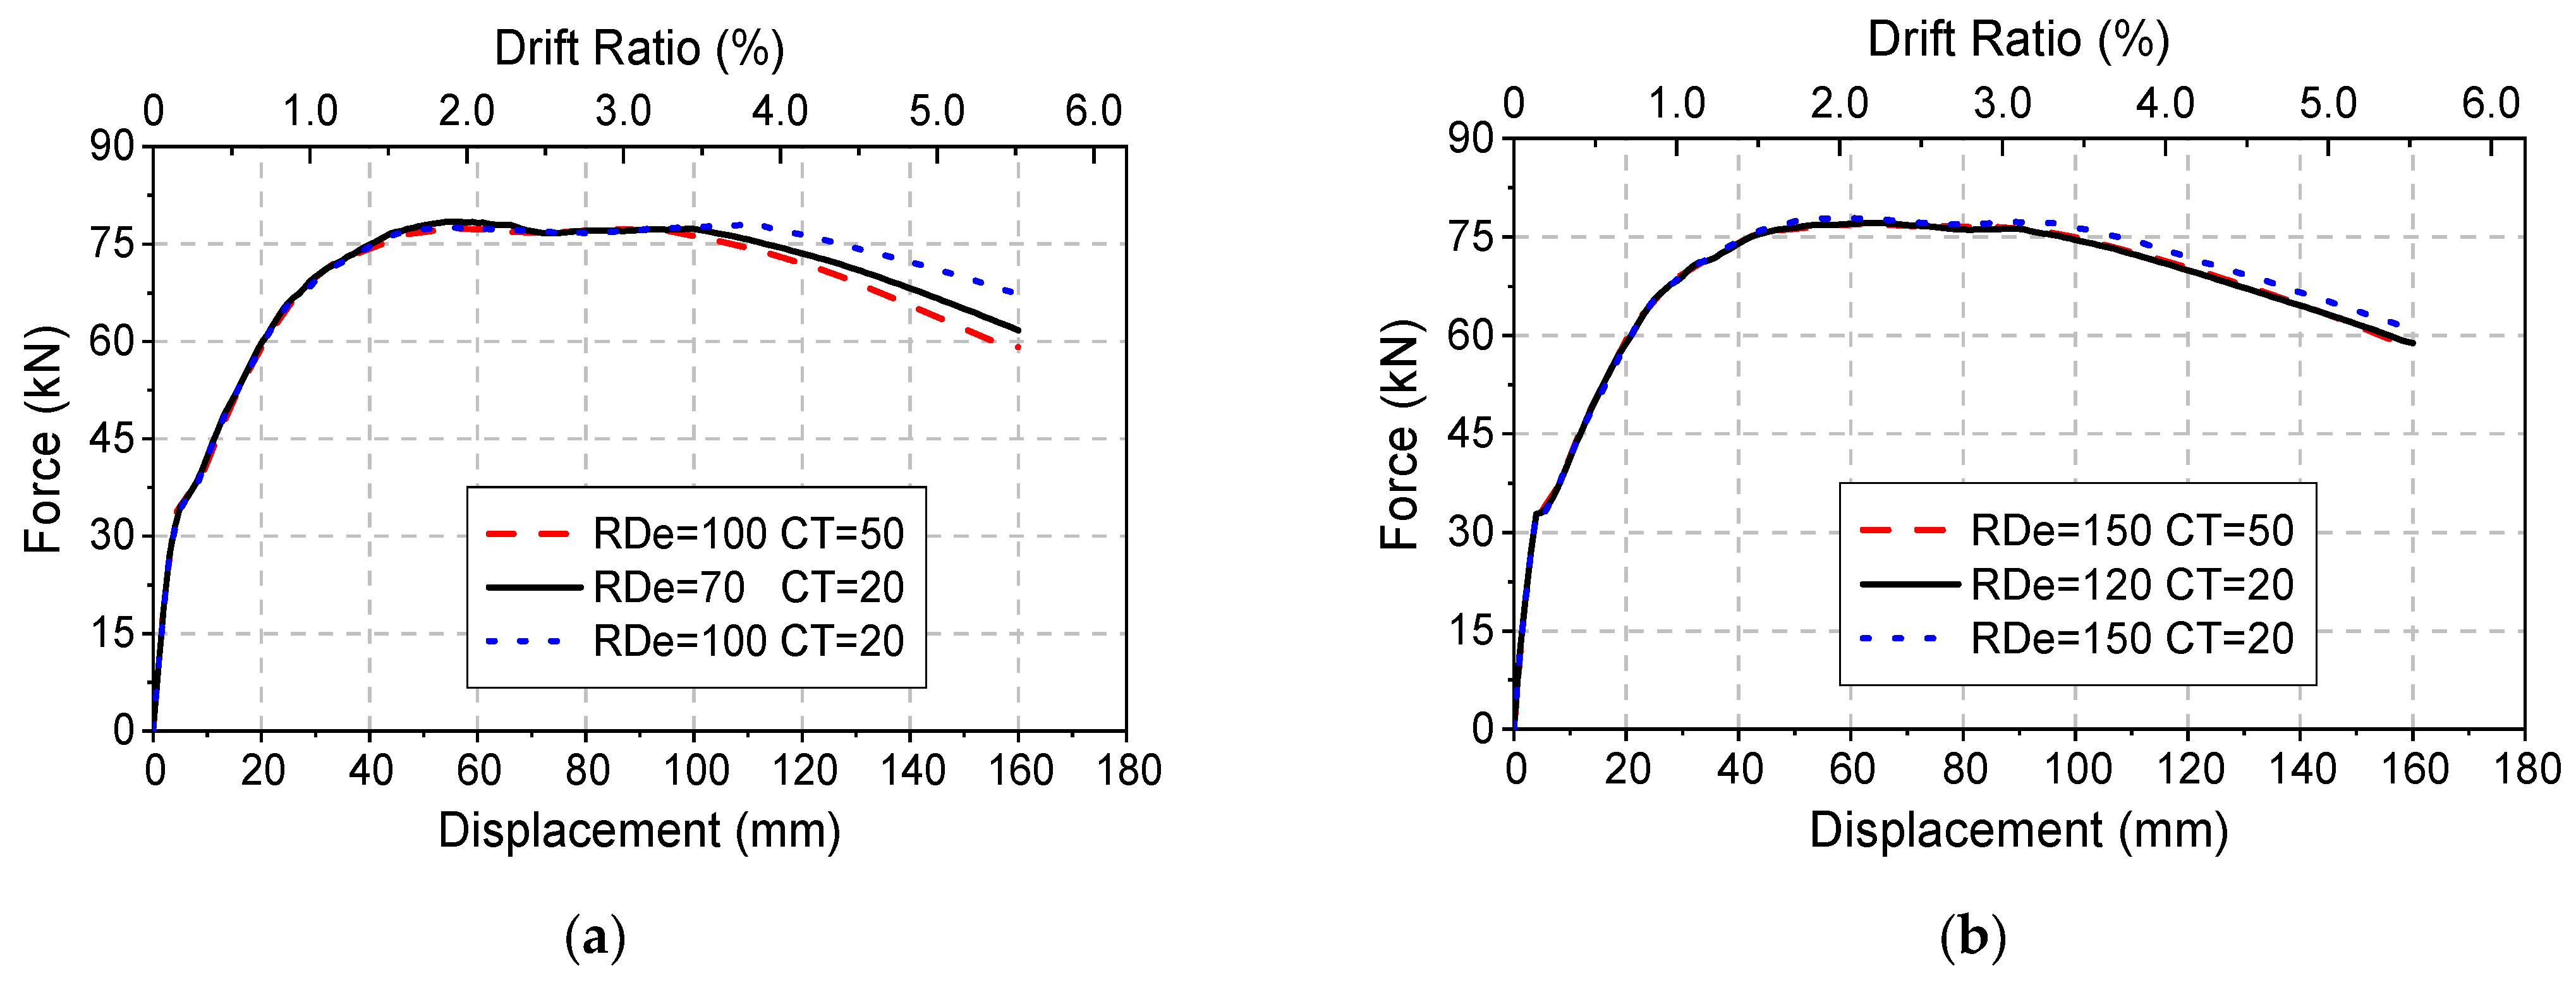
4.1. Effect of Recess Depth (RDe)

Six precast models with RDe values s of 30, 70, 100, 120, 150 and 200 mm are created and compared, along with PMR (RDe = 50 mm) and TPM (RDe = 0 mm). Force–displacement curves are compared in Figure 17along with the models of TPM and PMR. Most performance indices (e.g., initial stiffness, stiffness after cracking, yielding stiffness and yielding load) are within 10% in difference beyond RDe of 50 mm, representing enough confinement. The other two models (RDe = 0, 30 mm) are with lower peak load and shorter yield plateau, along with sudden drop of resisting force caused by excessive local stress.
Ultimate displacements (the displacement when loading capacity decreases to 85% of its maximum value) of all models are listed in Table 1. Ultimate displacement of models with RDe values over 50 mm is approximately twice of models with 0 mm and 30 mm depth. Generally, the ultimate displacements of the models increase with recess depth, gradually approaching CIPM’s value. Table 1 also gives the comparison of resisting forces. The lateral strength of pier keeps rising with the recess depth until 50 mm. Compared with CIPM, strengths of the models with RDe values over 50 mm are only off by 5%.
The lifting displacement of pier at 160 mm becomes smaller when recess depth gets larger, as shown in Figure 18. Recess depth has greater influence on the lifting displacement within 70 mm, where more significant drop is found. RDe of 100 mm divide the models into two categories of joint deformations (RDe < 70 mm and RDe≥ 100 mm) (Figure 19). For RDe < 70, lifting displacement is with more gradual initial increase and subsequent decrease, and gap distance has greater impact on the lifting displacement. For RDe ≥ 100, sharp linear increase of lifting displacement is found, with more significant postpeak drop, indicating the presence of plastic hinge. No decrease of gap distance is observed in this category, and therefore the decrease of lifting displacement is more closely related to sidewall shear deformation in deeper recess.
The mortar stress can tell the local failure of pier column or footing. The relation of maximum principal compressive stress of mortar to loading displacement of each model is shown in Figure 20. The mortar stresses of all models are less than their ultimate strengths, and the stress level of models with over 50 mm recess depth is approximately 30% lower than that of TPM. The curves of models with RDe = 50, 100, 150, 200 mm are selected to analyze the influence of different recess depth to initial stress, as shown in Figure 21. The mortar stresses of deeper recess (RDe = 150, 200 mm) increase faster. When the mortar stresses of these two curves increase to 35 MPa, the concrete is damaged, resulting in decrease of mortar stress. In the models with shallow recess (RDe = 50, 100 mm), the mortar stresses increase more slowly with less fluctuation.
Figure 22 shows the stress distribution of the recess with various depths. In general, the stress variations of cushion mortar and sidewall mortar with the increase of recess depth are opposite, where maximum stress is at mortar cushion in shallow recess or at sidewall in deep recess. As the depth of the recess increases, the area with high stress transfers to sidewall mortar from cushion mortar. For RDe = 50 mm (PMR), the stress of mortar stays relatively small. For RDe = 70 mm, the stress of mortar cushion increases much faster, and the cushion is damaged first, following the decrease of mortar stress and supporting force. For RDe = 100 mm, the effect of cushion becomes less significant as deeper recess, so the constraint provided by sidewall is not as good as shallower recess. For RDe = 150 and 200 mm, the high stress regions are mainly at the sidewall, and the overall performances become a common socket connection.
From the above analysis, the performance of recess is contributed by two parts: the cushion and the sidewall. When the recess is shallow, the cushion and the rebars provide the major supporting and anchoring forces to column. In deep recess cases, the column is constrained by the sidewall, and therefore the cushion is unable to fully perform its function. When the recess depth is larger than 50 mm, the overall performance of model experiences substantial improvement, and such performance becomes stable afterward.

4.2. Effect of Cushion Thickness (CT)

To investigate the effect of mortar CT on pier performance, thickness is set to 20 mm and 50 mm. Figure 23 shows two groups of force–displacement curves with different RDe levels (RDe ≤ 100 mm and RDe > 100 mm). The models with the same effective RDe (RDe minus CT) exhibit similar overall performance, while shallow recess is more sensitive to cushion thickness.
Figure 24 shows the joint deformation development with various CTs but the same effective RDe. Thicker mortar cushion yields less strain penetration of rebar. Rebar deformation is concentrated above the cushion, resulting in larger gap distance. For shallower recess, the maximum differences between the two models for lifting displacement and gap distance are 0.058 mm and 0.049 mm at the displacement of 33 mm. For the deeper recess, maximum difference of gap distance is increased to 0.072 mm at 33 mm, while that of lifting displacement reaches 0.074 mm at the displacement of 53 mm. This indicates that cushion deformation in deeper recess is more difficult to occur.
Development of maximum mortar stress is given in Figure 25. For shallower recess, maximum mortar stress is decreased from 42.89 MPa to 32.57 MPa by 24%, when the thickness of cushion is increased by 30 mm. Larger CT provides more uniform distribution of stress. In addition, the two models with deeper recess become stable with limited differences in stress, as mortar cushion in deep recess is of little contribution to the distribution of mortar stress.
The cushion acts as the medium that transfers the stress from column to footing. Though thicker cushion may slightly cause larger joint deformation and lower ductility, it is more beneficial for thicker cushion in the shallow recess in terms of local stress, to improve the robustness of joint. Considering size effect, effective RDe is more suitable than absolute depth for the design of the improved GCD connection in actual full-scale bridge. Based on the simulation results in this section, the ratio of effective RDe to the maximum column size is recommended to be within 0.06 and 0.2.

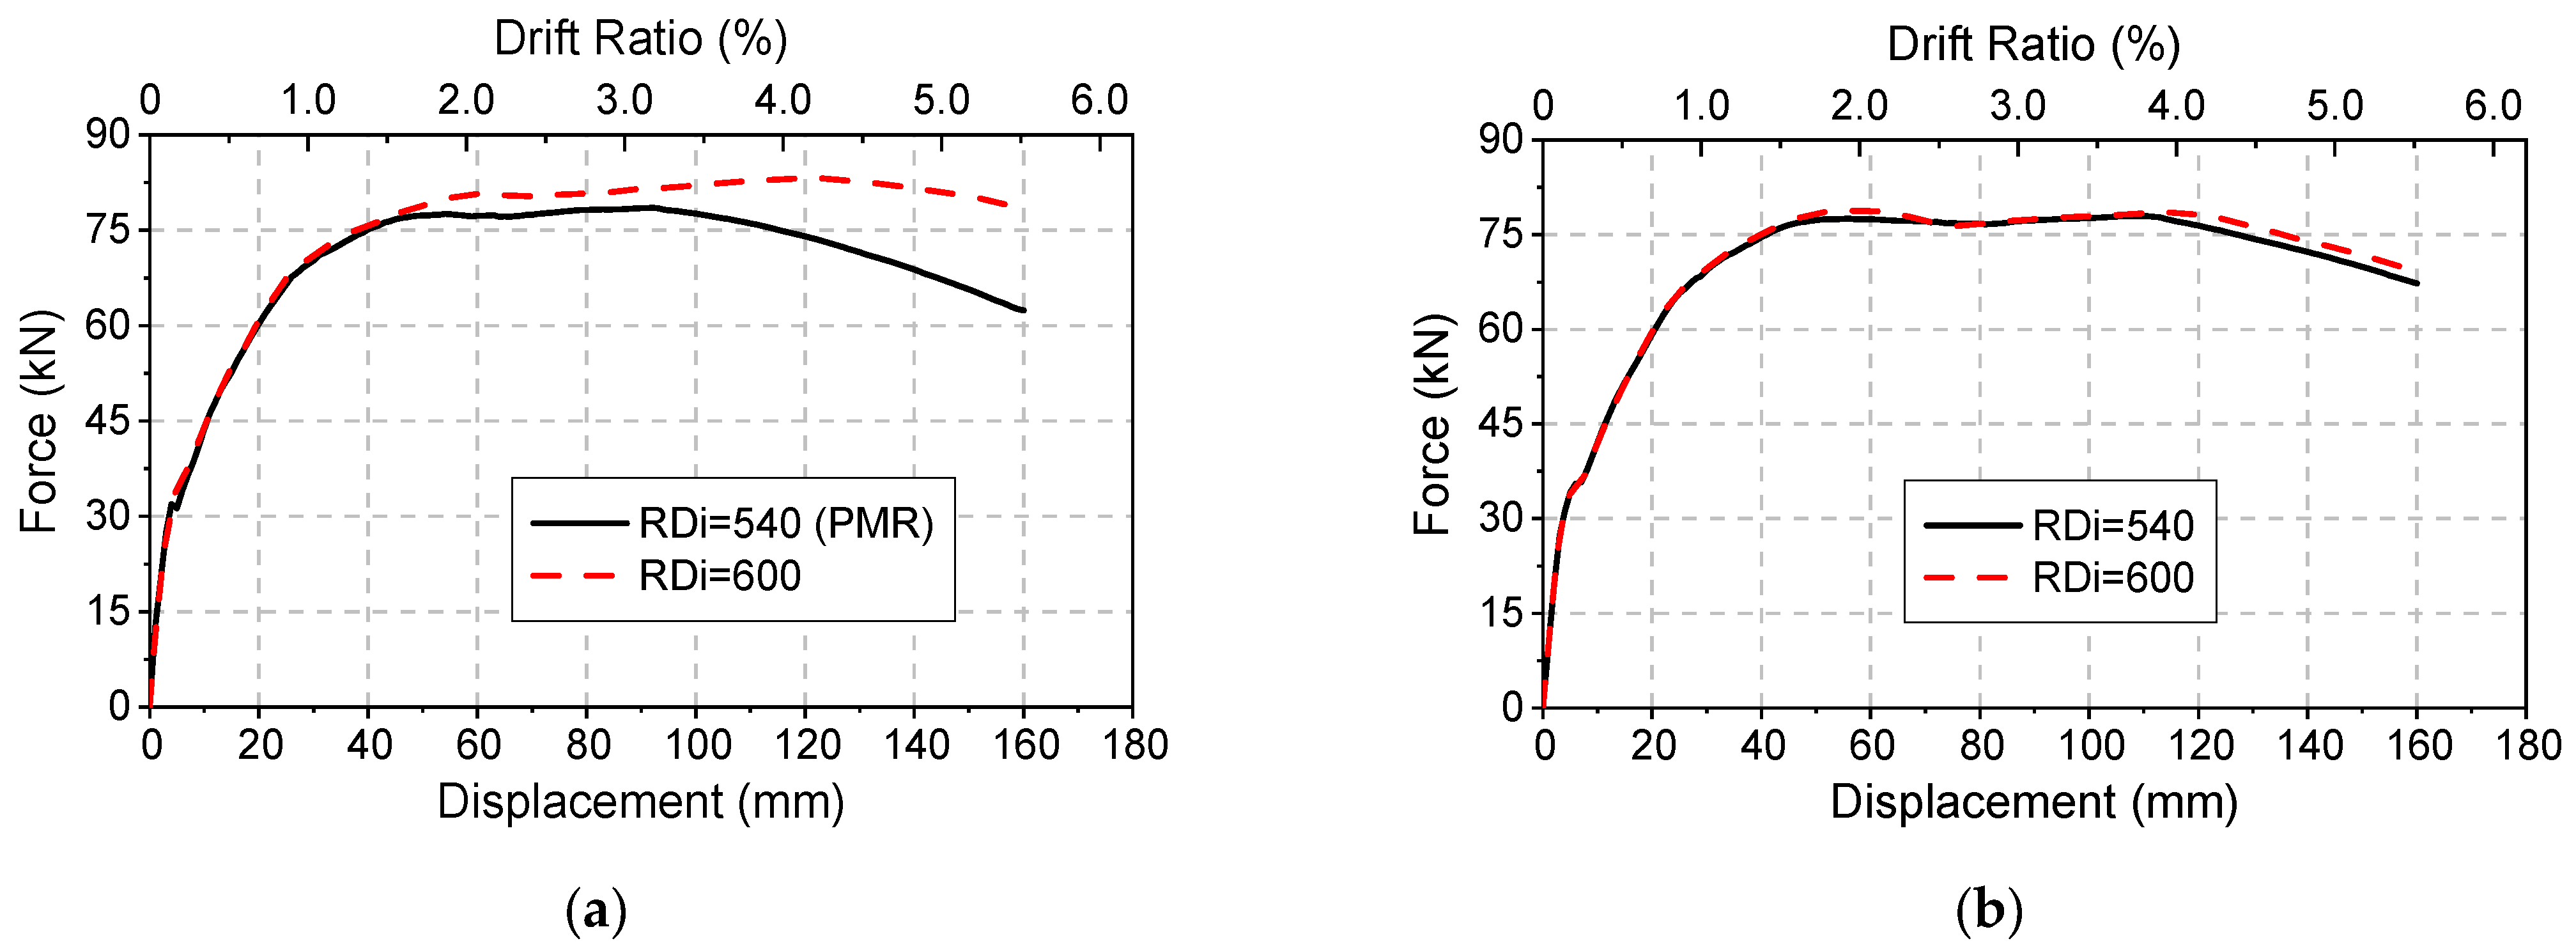
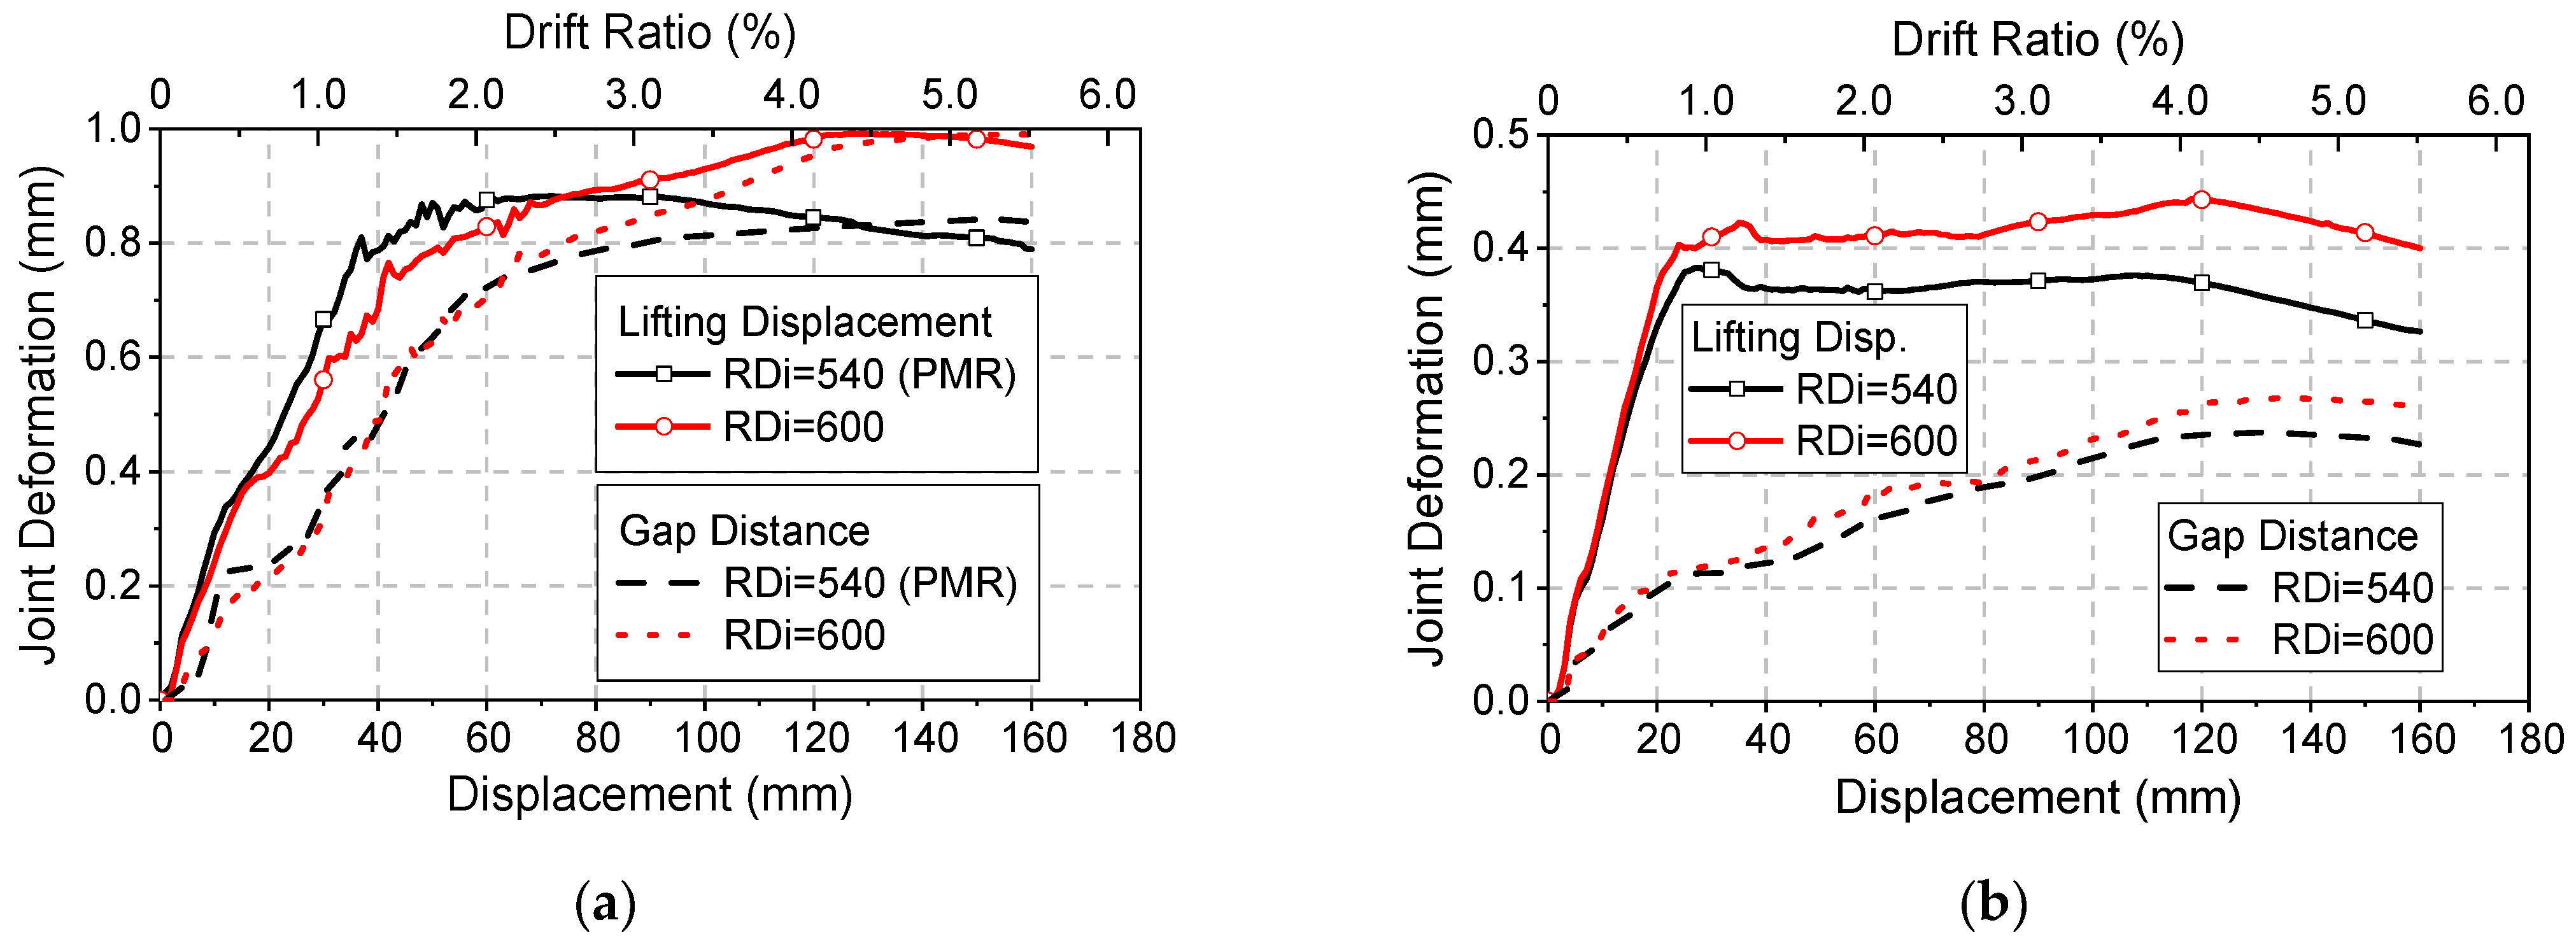
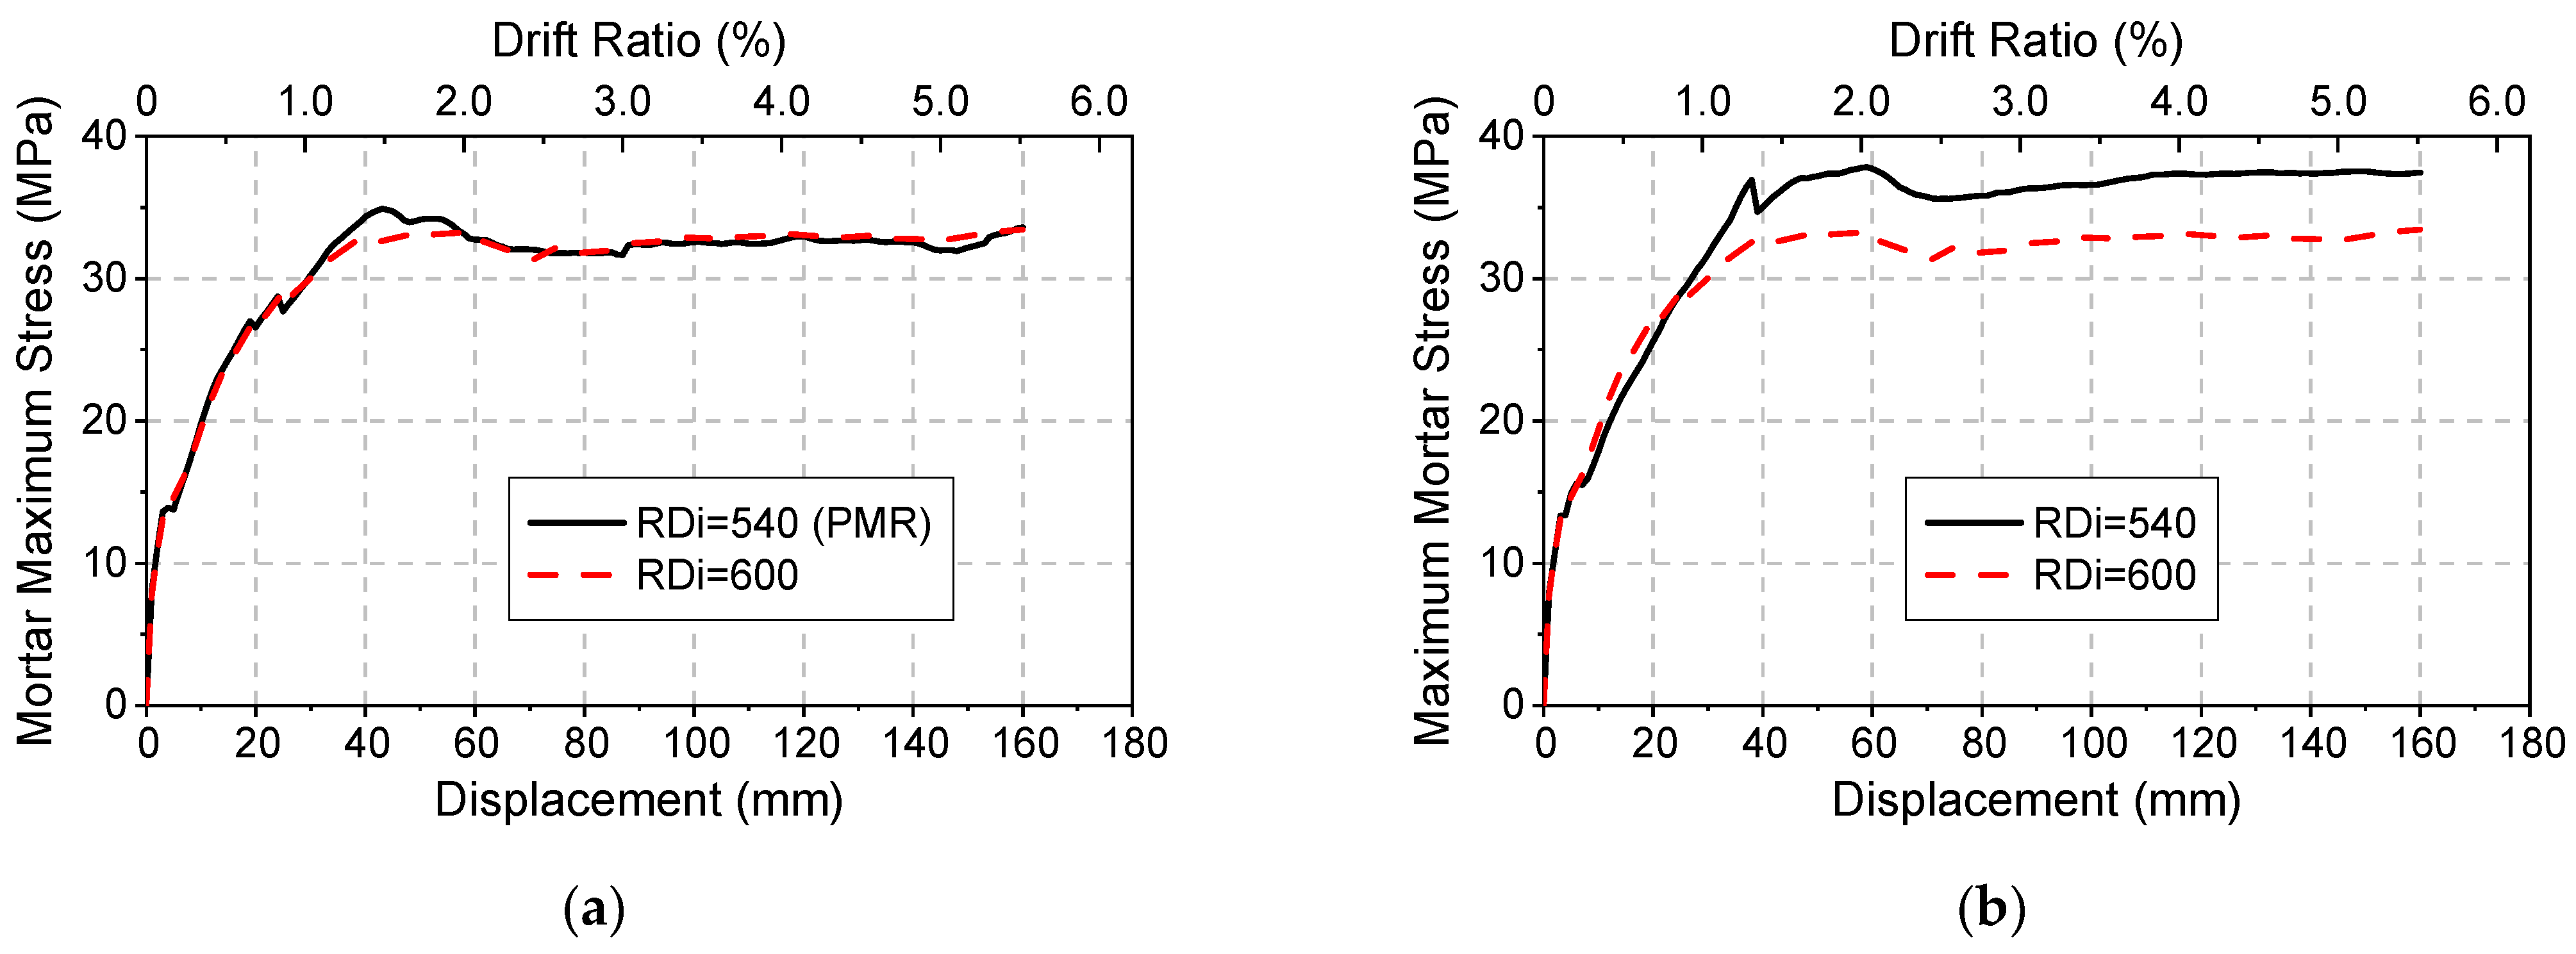
4.3. Effect of Recess Diameter (RDi)

Larger RDi brings better convenience tolerance in segment assembly, but structural integrity of precast column can be affected if it is too large. RDi in PMR is 540 mm, including a 20 mm wide gap between column and footing. Models with 600 mm RDi (gap of 50 mm) are also created for comparison. The models analyzed in this section are also divided into two groups based on recess depth (Figure 26). For depth of 50 mm, larger RDi improves the strength and ductility, where the maximum resisting force is increased from 78.53 kN to 83.20 kN. For depth of 100 mm, RDi has limited impact on the structural performance.
Larger recess diameter means longer horizontal distance between nodes and higher relative displacement under the same shear angle, and joint deformation with different RDi values are shown in Figure 27. Joint deformation of the models with shallower recess is more sensitive to RDi variation. For deeper recess, gap distance changes little with RDi increase, while lifting displacement of the model with larger RDi is higher than that with smaller RDi due to geometry change.
Variations of maximum mortar stress are shown in Figure 28. Little change is found with diameter increase for shallow recess, and concrete of the footing exceeds its ultimate strength at peak stress of mortar. However, stress level is reduced for deep recess by 11% for the two different RDi values in the case of deep recess, and no local compressive damage at footing concrete is found. As the strength of mortar is higher than concrete, stress is more uniformly transferred from thicker mortar, preventing concrete from local failure. The maximum stress values at displacement level of 160 mm are close (33.60 MPa and 33.44 MPa, respectively) in the case of shallow recess. Larger RDi moves compressive stress of the rim closer to the near side, giving better column support and pry-out restriction. Therefore, stiffer and higher strength boundary around the column bottom is recommended.

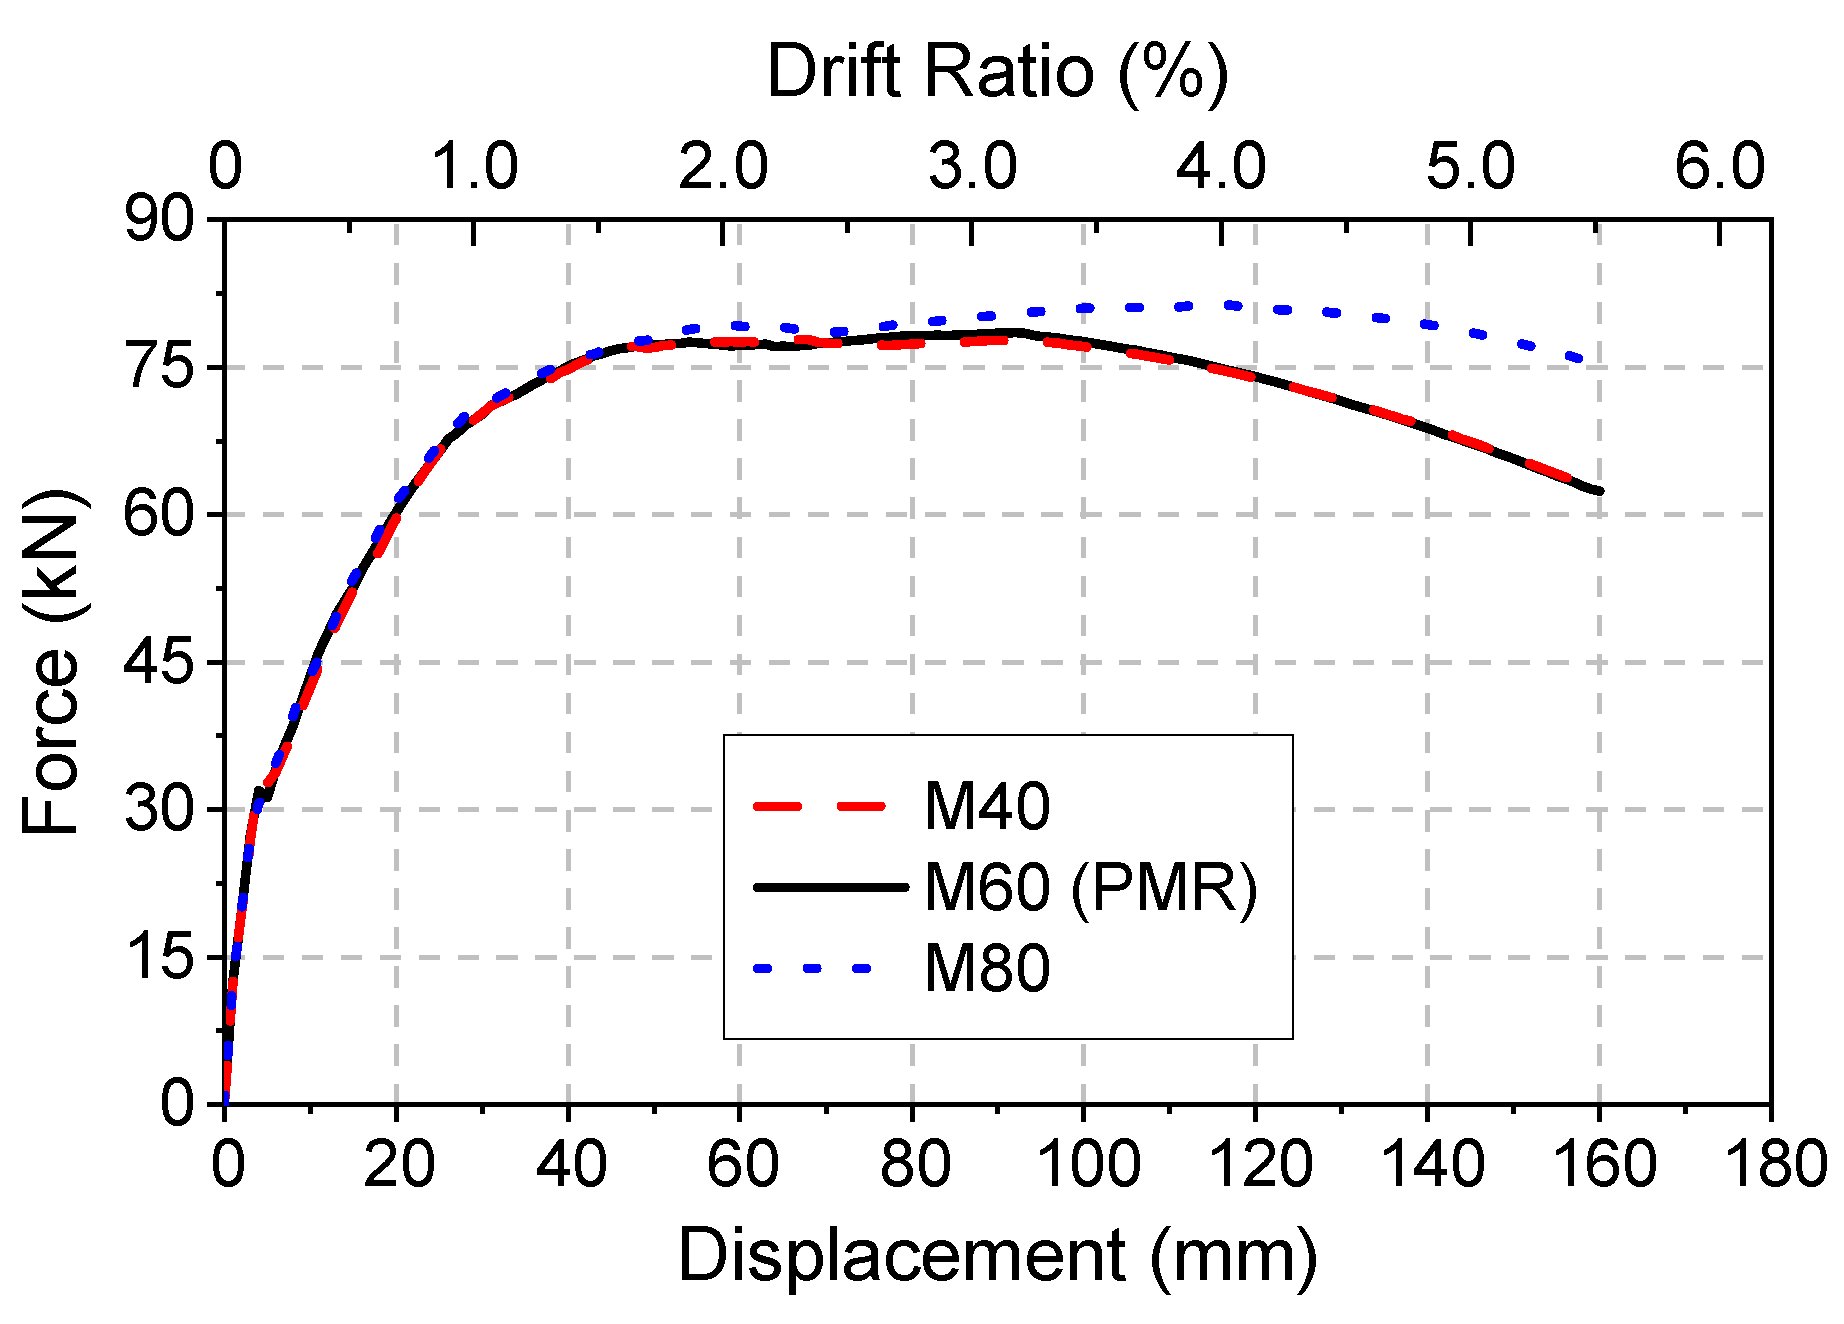
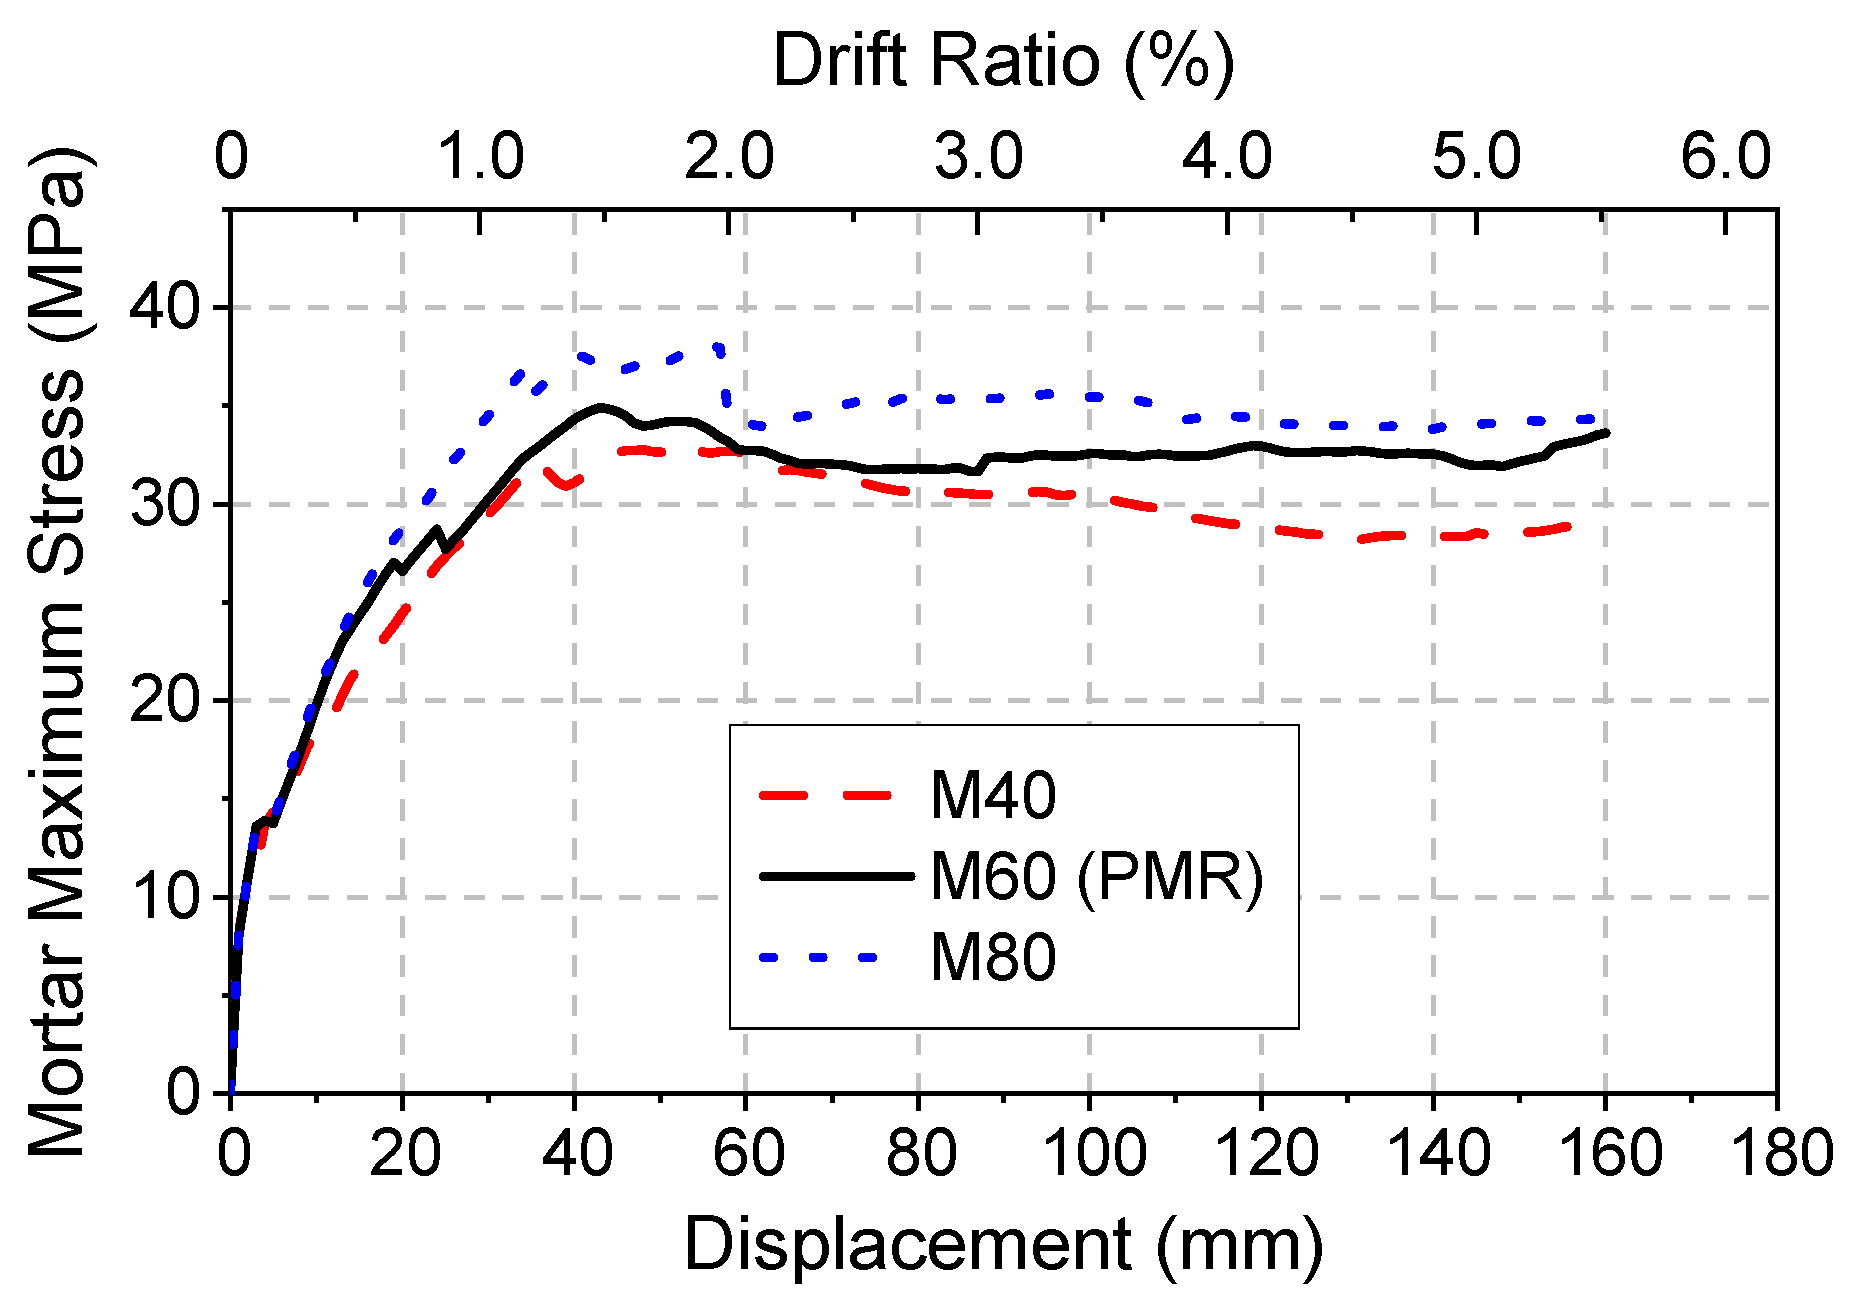
4.4. Effect of Mortar Strength (MS)

Two models with different MSs are established and compared with PMR. PMR’s mortar compressive strength is 68.71 MPa (M60). The mortar strengths of the other two models are obtained by scaling to 45.8 MPa (M40) and 91.6 MPa (M80). As shown in Figure 29, higher strength and ductility are only observed in the model with M80, while the other two models are with close variation. Figure 30 shows maximum stress variation of different mortar grades. The maximum stress values are 32.83 MPa for M40, 34.90 MPa for M60, and 38.06 MPa for M80. The larger the mortar strength, the higher stress of mortar is, while corresponding ultimate strengths are not reached in all cases. In addition, the maximum stress values are also close to each other in the three models (32.9 MP, 33.60 MPa and 34.40 MPa, respectively). Figure 31 also shows that MS has limited influence on the joint deformation, gap distance, and lifting displacement. In general, the stiffness of mortar alters the stress distribution in shallow recess, and higher stiffness improves structural integrity.

5. Discussion

It is highly time-consuming and difficult to converge to simulate FE model with the state of high nonlinearity. In the existing articles [21,23,24], 3D solid FE analysis mainly simulates the rising region of force–displacement backbone. In this study, monotonic loading is selected, same as [18,27], to balance computational efficiency and convergence, and it may be a better option to modify the damage state by user defined material. However, the material simulation in this study is only a rough adjustment, the constitutive relationship of reinforcement needs to be further studied along with concrete material.
The FE model of test specimens with circular cross-section is mainly discussed in this study. It is worth noting that the findings can be extended to the situation with square cross-section, full scaled pier or the pier with pile foundation.
In the parametric analysis, the influence of the recess sidewall stiffness (mortar strength and sidewall thickness) on the column confinement is qualitative, and the relationship between recess stiffness and the size or material properties of column, cushion and footing is not given, so further research is needed.

6. Conclusions

Calibrated and validated by test results, finite element models are established to compare the performance differences among precast pier with recess design, typical precast pier and cast-in-place pier, thus clarifying the mechanism of this improved design’s efficiency. The parameter sensibility of recess to the pier performance is analyzed, so that the contribution and design method are discussed. Based on the study, the following conclusions can be drawn:
  • The precast pier with recess (grouted ducts in the footing) can reach an equivalent seismic performance to cast-in-place pier, due to the constraint of joint deformation by the extra support and friction force from the rim. The shear resistance of connection joint does not decrease rapidly with loading, reducing the inclined cracks at column bottom. This ensures a well-distributed transverse and inclined cracks development at the plastic hinge region.
  • Recess depth has the most significant influence on the performance of the pier. Above a certain depth (50 mm) of recess, enough confinement is formed, and the strength and ductility of pier can reach a value close to the cast-in-place pier. With the increase of recess depth, the lifting displacement of pier bottom gradually decreases, the components of lifting displacement redistribute, joint gap distance decreases, and sidewall shear deformation becomes more significant.
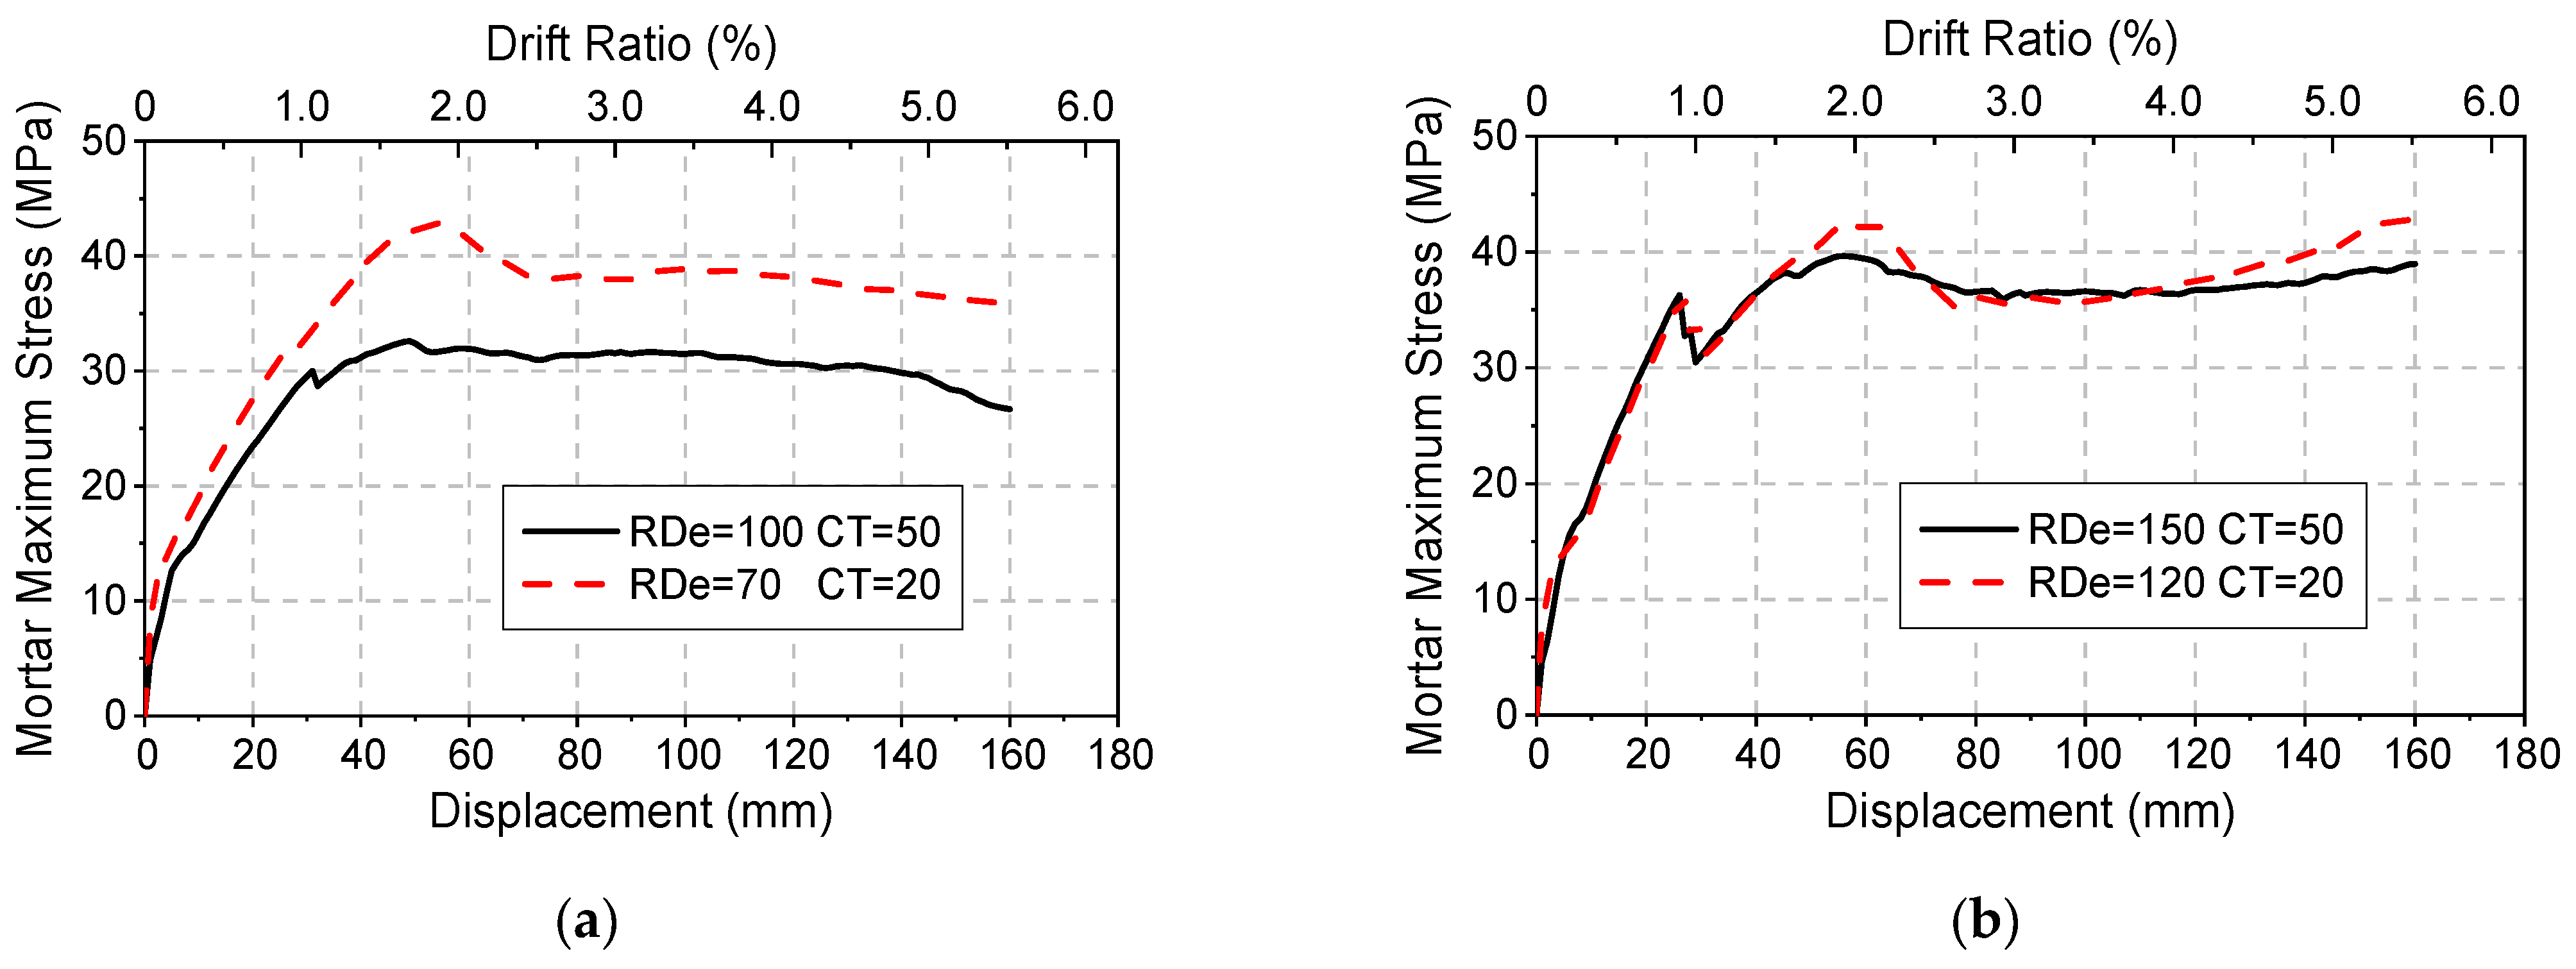
  • The cushion for shallow recess and the rim for deep recess are the major part that stress is concentrated on, and the corresponding mortar should be appropriately thickened to distribute the stress. Too shallow (less than 30 mm) or too deep (greater than 100 mm) recess may produce local failure of footing. Appropriate recess depth (between 50 and 100 mm) and adequate stiffness of recess will ensure full support and confinement to the column.
  • According to the study, the precast pier with recess can be designed for general case by existing code, ensuring no pullout failure of grouted duct. The detailed design for prevention of pry-up failure is achieved by the following rules:
    (1)
    Recess depth is suggested to be taken 6–20% of the column diameter for circular section.
    (2)
    Mortar is suggested to select 20 MPa higher than adjacent concrete.
    (3)
    Local enhancement of footing reinforcement is needed.
    (4)
    The recess also retains the potential to avoid the effect of cold joints of cast-in-place piers.
  • The improved GCD connection design is worth studying in the condition with different section shapes or foundation constraints, and further design codes are needed for quantification with mathematical formulation.

Author Contributions

Conceptualization, Z.W. and C.W.; methodology, C.W.; validation, H.Q.; formal analysis, C.W..; investigation, W.X.; resources, Z.W.; data curation, W.X; writing—original draft preparation, C.W.; writing—review and editing, H.Q.; visualization, W.X.; supervision, H.Q.; project administration, Z.W.; funding acquisition, Z.W. All authors have read and agreed to the published version of the manuscript.

Funding

This research was funded by National Natural Science Foundation of China, grant number 51978511, 51778470 and 52008316; Natural Science Foundation of Science and Technology Commission of Shanghai Municipality, grant number No. 20ZR1461400.

Institutional Review Board Statement

Not applicable.

Informed Consent Statement

Not applicable.

Data Availability Statement

Data available on request.

Conflicts of Interest

The authors declare no conflict of interest.

References

  1. Littleton, P.; Mallela, J. Iowa demonstration project: Accelerated bridge construction on US 6 over keg creek. 2013. Available online: https://rosap.ntl.bts.gov/view/dot/54259 (accessed on 9 September 2022).
  2. Khaleghi, B.; Schultz, E.; Seguirant, S.; Marsh, L.; Haraldsson, O.; Eberhard, M.; Stanton, J. Accelerated bridge construction in Washington State: From research to practice. PCI J. 2012, 57, 34–49. [Google Scholar] [CrossRef]
  3. Wang, Z.; Qu, H.; Li, T.; Wei, H.; Wang, H.; Duan, H.; Jiang, H. Quasi-static cyclic tests of precast bridge columns with different connection details for high seismic zones. Eng. Struct. 2018, 158, 13–27. [Google Scholar] [CrossRef]
  4. Wang, Z.; Wu, C.; Li, T.; Xiao, W.; Wei, H.; Qu, H. Experimental Study on the Seismic Performance of Improved Grouted Corrugated Duct Connection (GCDC) Design for Precast Concrete Bridge Column. J. Earthq. Eng. 2020, 26, 2469–2490. [Google Scholar] [CrossRef]
  5. Steuck, K.P.; Eberhard, M.O.; Stanton, J.F. Anchorage of Large-Diameter Reinforcing Bars in Ducts. ACI Struct. J. 2009, 106, 506. [Google Scholar] [CrossRef]
  6. Zhou, Y.; Ou, Y.-C.; Lee, G.C. Bond-slip responses of stainless reinforcing bars in grouted ducts. Eng. Struct. 2017, 141, 651–665. [Google Scholar] [CrossRef]
  7. Galvis, F.A.; Correal, J.F. Anchorage of Bundled Bars Grouted in Ducts. ACI Struct. J. 2018, 115, 415–424. [Google Scholar] [CrossRef]
  8. Provost-Smith, D.; Elsayed, M.; Nehdi, M. Effect of early-age subfreezing temperature on grouted dowel precast concrete wall connections. Constr. Build. Mater. 2017, 140, 385–394. [Google Scholar] [CrossRef]
  9. Elsayed, M.; Ghrib, F.; Nehdi, M. Experimental and analytical study on precast concrete dowel connections under quasi-static loading. Constr. Build. Mater. 2018, 168, 692–704. [Google Scholar] [CrossRef]
  10. Pang, J.B.K.; Eberhard, M.O.; Stanton, J.F. Large-Bar Connection for Precast Bridge Bents in Seismic Regions. J. Bridg. Eng. 2010, 15, 231–239. [Google Scholar] [CrossRef]
  11. Tazarv, M.; Saiidi, M.S. UHPC-filled duct connections for accelerated bridge construction of RC columns in high seismic zones. Eng. Struct. 2015, 99, 413–422. [Google Scholar] [CrossRef]
  12. Mashal, M.; White, S.; Palermo, A. Quasi-static cyclic testing of emulative cast-in-place connections for Accelerated Bridge Construction in seismic regions. Bull. New Zealand Soc. Earthq. Eng. 2016, 49, 267–282. [Google Scholar] [CrossRef]
  13. Mashal, M.; Palermo, A. Emulative seismic resistant technology for Accelerated Bridge Construction. Soil Dyn. Earthq. Eng. 2019, 124, 197–211. [Google Scholar] [CrossRef]
  14. Shoushtari, E.; Saiidi, M.S.; Itani, A.; Moustafa, M.A. Design, Construction, and Shake Table Testing of a Steel Girder Bridge System with ABC Connections. J. Bridg. Eng. 2019, 24, 04019088. [Google Scholar] [CrossRef]
  15. Haraldsson, O.S.; Janes, T.M.; Eberhard, M.O.; Stanton, J.F. Seismic Resistance of Socket Connection between Footing and Precast Column. J. Bridg. Eng. 2013, 18, 910–919. [Google Scholar] [CrossRef]
  16. Si, B.; Sun, Z.; Ren, X.; Wang, D.; Wang, Q. Finite element analysis of the hysteretic behavior of RC bridge piers. J. Harbin Inst. Technol. 2009, 41, 105–109. (In Chinese) [Google Scholar]
  17. Chen, Y.; Zeng, L.; Xiao, Y.; Chen, J.; Wang, B.; Gong, Q. Numerical analysis of the seismic performance of steel-reinforced con-crete columns with a t-shaped steel cross-section. China Earthq. Eng. J. 2017, 39, 196–204. (In Chinese) [Google Scholar] [CrossRef]
  18. Li, T.; Qu, H.; Wang, Z.; Wei, H.; Jiang, S. Seismic performance of precast concrete bridge columns with quasi-static cyclic shear test for high seismic zones. Eng. Struct. 2018, 166, 441–453. [Google Scholar] [CrossRef] [Green Version]
  19. Zhong, J.; Mao, Y.; Yuan, X. Lifetime seismic risk assessment of bridges with construction and aging considerations. Structures 2023, 47, 2259–2272. [Google Scholar] [CrossRef]
  20. Ou, Y.-C.; Chiewanichakorn, M.; Aref, A.J.; Lee, G.C. Seismic Performance of Segmental Precast Unbonded Posttensioned Concrete Bridge Columns. Eng. Struct. 2007, 133, 1636–1647. [Google Scholar] [CrossRef]
  21. Dawood, H.; ElGawady, M.; Hewes, J. Behavior of Segmental Precast Posttensioned Bridge Piers under Lateral Loads. J. Bridg. Eng. 2012, 17, 735–746. [Google Scholar] [CrossRef]
  22. Nikbakht, E.; Rashid, K.; Hejazi, F.; Osman, S.A. A numerical study on seismic response of self-centring precast segmental columns at different post-tensioning forces. Lat. Am. J. Solids Struct. 2014, 11, 864–883. [Google Scholar] [CrossRef]
  23. Nikbakht, E.; Rashid, K.; Hejazi, F.; Osman, S.A. Application of shape memory alloy bars in self-centring precast segmental columns as seismic resistance. Struct. Infrastruct. Eng. 2014, 11, 297–309. [Google Scholar] [CrossRef]
  24. Leitner, E.J.; Hao, H. Three-dimensional finite element modelling of rocking bridge piers under cyclic loading and exploration of options for increased energy dissipation. Eng. Struct. 2016, 118, 74–88. [Google Scholar] [CrossRef]
  25. Zhong, J.; Zheng, X.; Wu, Q.; Jiang, L.; He, M.; Dang, X. Seismic fragility and resilience assessment of bridge columns with dual-replaceable composite link beam under near-fault GMs. Structures 2023, 47, 412–424. [Google Scholar] [CrossRef]
  26. Delgado, R.; Delgado, P.; Pouca, N.V.; Arêde, A.; Rocha, P.; Costa, A. Shear effects on hollow section piers under seismic actions: Experimental and numerical analysis. Bull. Earthq. Eng. 2008, 7, 377–389. [Google Scholar] [CrossRef]
  27. Moon, J.; Lehman, D.E.; Roeder, C.W.; Lee, H.-E.; Lee, T.-H. Analytical Evaluation of Reinforced Concrete Pier and Cast-in-Steel-Shell Pile Connection Behavior considering Steel-Concrete Interface. Adv. Mater. Sci. Eng. 2016, 2016, 4159619. [Google Scholar] [CrossRef]
Figure 1. Test (a) specimen design (unit: mm); (b) setup.
Buildings 13 00227 g001
Figure 2. The new GCD connection design.
Buildings 13 00227 g002
Figure 3. Stress–strain relation used in the FE model: (a) concrete and mortar; (b) rebar.
Buildings 13 00227 g003
Figure 4. Numerical model of test specimen #1: (a) overall view; (b) longitudinal rebars; (c) recess and the mesh of profile; (d) contact and the mortar element.
Buildings 13 00227 g004
Figure 5. Force–displacement curve of PMR and the backbone curve in the test.
Buildings 13 00227 g005
Figure 6. PMR’s simulation diagram, at the final stage: (a) PMR’s principal compressive stress (unit: MPa); (b) PMR’s crack and crushing; (c) Post-test damage of #1 for comparison (cracks are intentionally marked).
Buildings 13 00227 g006
Figure 7. PMR’s outmost rebar stress diagrams at the displacement of (unit: MPa): (a) 20 mm; (b) 40 mm; (c) 90 mm; (d) 120 mm.
Buildings 13 00227 g007
Figure 8. Force–displacement curves of TPM, CIPM and PMR.
Buildings 13 00227 g008
Figure 9. Rebar stress diagrams at each final state of (unit: MPa): (a) TPM (120 mm); (b) PMR (160 mm); (c) CIPM (160 mm).
Buildings 13 00227 g009
Figure 10. Crushing diagram of the cover concrete (a) PMR; (b) CIPM; (c) TPM.
Buildings 13 00227 g010
Figure 11. Schematic diagram about force transferring and hinge formation in the pier (a) with initial horizontal defect; (b) without initial horizontal defect.
Buildings 13 00227 g011
Figure 12. Illustration about joint deformation discussion (Section 3.3) and key parameter of recess. (Section 4).
Buildings 13 00227 g012
Figure 13. PMR’s contact status diagrams at the displacement of (a) 50 mm and (b) 160 mm.
Buildings 13 00227 g013
Figure 14. PMR’s (a) joint deformation curves; (b) gap distance at the displacement of 160 mm. (unit: mm).
Buildings 13 00227 g014
Figure 15. TPM’s (a) joint deformation curves; (b) gap distance of at the displacement of 120 mm. (unit: mm).
Buildings 13 00227 g015
Figure 16. Schematic diagram about deformation in the precast pier with recess: (a) Initial state; (b) Severely cracked.
Buildings 13 00227 g016
Figure 17. Force–displacement relation with different recess depths.
Buildings 13 00227 g017
Figure 18. Lifting displacement with different recess depths.
Buildings 13 00227 g018
Figure 19. Joint deformation with different recess depths: (a) RDe ≤ 70 mm; (b) RDe ≥ 100 mm.
Buildings 13 00227 g019
Figure 20. Mortar maximum stress with different recess depths.
Buildings 13 00227 g020
Figure 21. Mortar maximum stress with different recess depths before the displacement of 70 mm.
Buildings 13 00227 g021
Figure 22. Mortar compressional stress with different recess depths (unit: MPa): (a) at the lateral displacement of 50 mm; (b) at the lateral displacement of 160 mm.
Buildings 13 00227 g022
Figure 23. Force–displacement relation of different cushion thicknesses: (a) shallow recess; (b) deep recess.
Buildings 13 00227 g023
Figure 24. Joint deformation curves of different cushion thicknesses: (a) shallow recess (effective RDe = 50 mm); (b) deep recess (effective RDe = 100 mm).
Buildings 13 00227 g024
Figure 25. Maximum mortar stress of different cushion thicknesses: (a) shallow recess; (b) deep recess.
Buildings 13 00227 g025
Figure 26. Force–displacement relation of different recess diameters: (a) shallow recess (RDe = 50 mm, CT = 20 mm); (b) deep recess (RDe = 100 mm, CT = 20 mm).
Buildings 13 00227 g026
Figure 27. Joint deformation with different recess diameters: (a) shallow recess (RDe = 50 mm, CT = 20 mm); (b) deep recess (RDe = 100 mm, CT = 20 mm).
Buildings 13 00227 g027
Figure 28. Maximum mortar stress curves with different recess diameters: (a) shallow recess (RDe = 50 mm, CT = 20 mm); (b) deep recess (RDe = 100 mm, CT = 20 mm).
Buildings 13 00227 g028
Figure 29. Force–displacement relation with different mortar grades.
Buildings 13 00227 g029
Figure 30. Maximum mortar stress with different mortar grades.
Buildings 13 00227 g030
Figure 31. Joint deformation curves with different mortar grades: (a) Lifting displacement; (b) Gap distance.
Buildings 13 00227 g031
Table 1. Ultimate displacements and forces of the models with different recess depths.
Recess Depth/mmUltimate Displacement/mmDifferenceMaximum Lateral Loading/kNDifference
CIPMPMRCIPMPMR
0 (TPM)71.79−55.13%−51.05%70.86−12.04%−9.77%
3068.39−57.26%−53.37%76.62−4.89%−2.43%
50 (PMR)146.66−8.34%\78.53−2.52%\
70144.91−9.43%−1.19%78.43−2.64%−0.13%
100160 *0.00% *+9.10% *77.93−3.26%−0.76%
120136.11−14.93%−7.19%77.18−4.20%−1.72%
150141.16−11.78%−3.75%77.93−3.26%−0.76%
200152.39−4.76%+3.91%76.68−4.82%−2.36%
CIPM160 *\+9.10%*80.56\+2.58%
* the strength of model has not decreased to 85% of ultimate strength yet at the displacement of 160 mm.
Disclaimer/Publisher’s Note: The statements, opinions and data contained in all publications are solely those of the individual author(s) and contributor(s) and not of MDPI and/or the editor(s). MDPI and/or the editor(s) disclaim responsibility for any injury to people or property resulting from any ideas, methods, instructions or products referred to in the content.

