

Developing an Evaluation Model to Measure the Intelligence Level of Smart Industrial Parks

Abstract
:1. Introduction
2. Literature Review
2.1. Smart Industrial Parks
2.2. Smart Industrial Parks Evaluation
3. Research Methodology
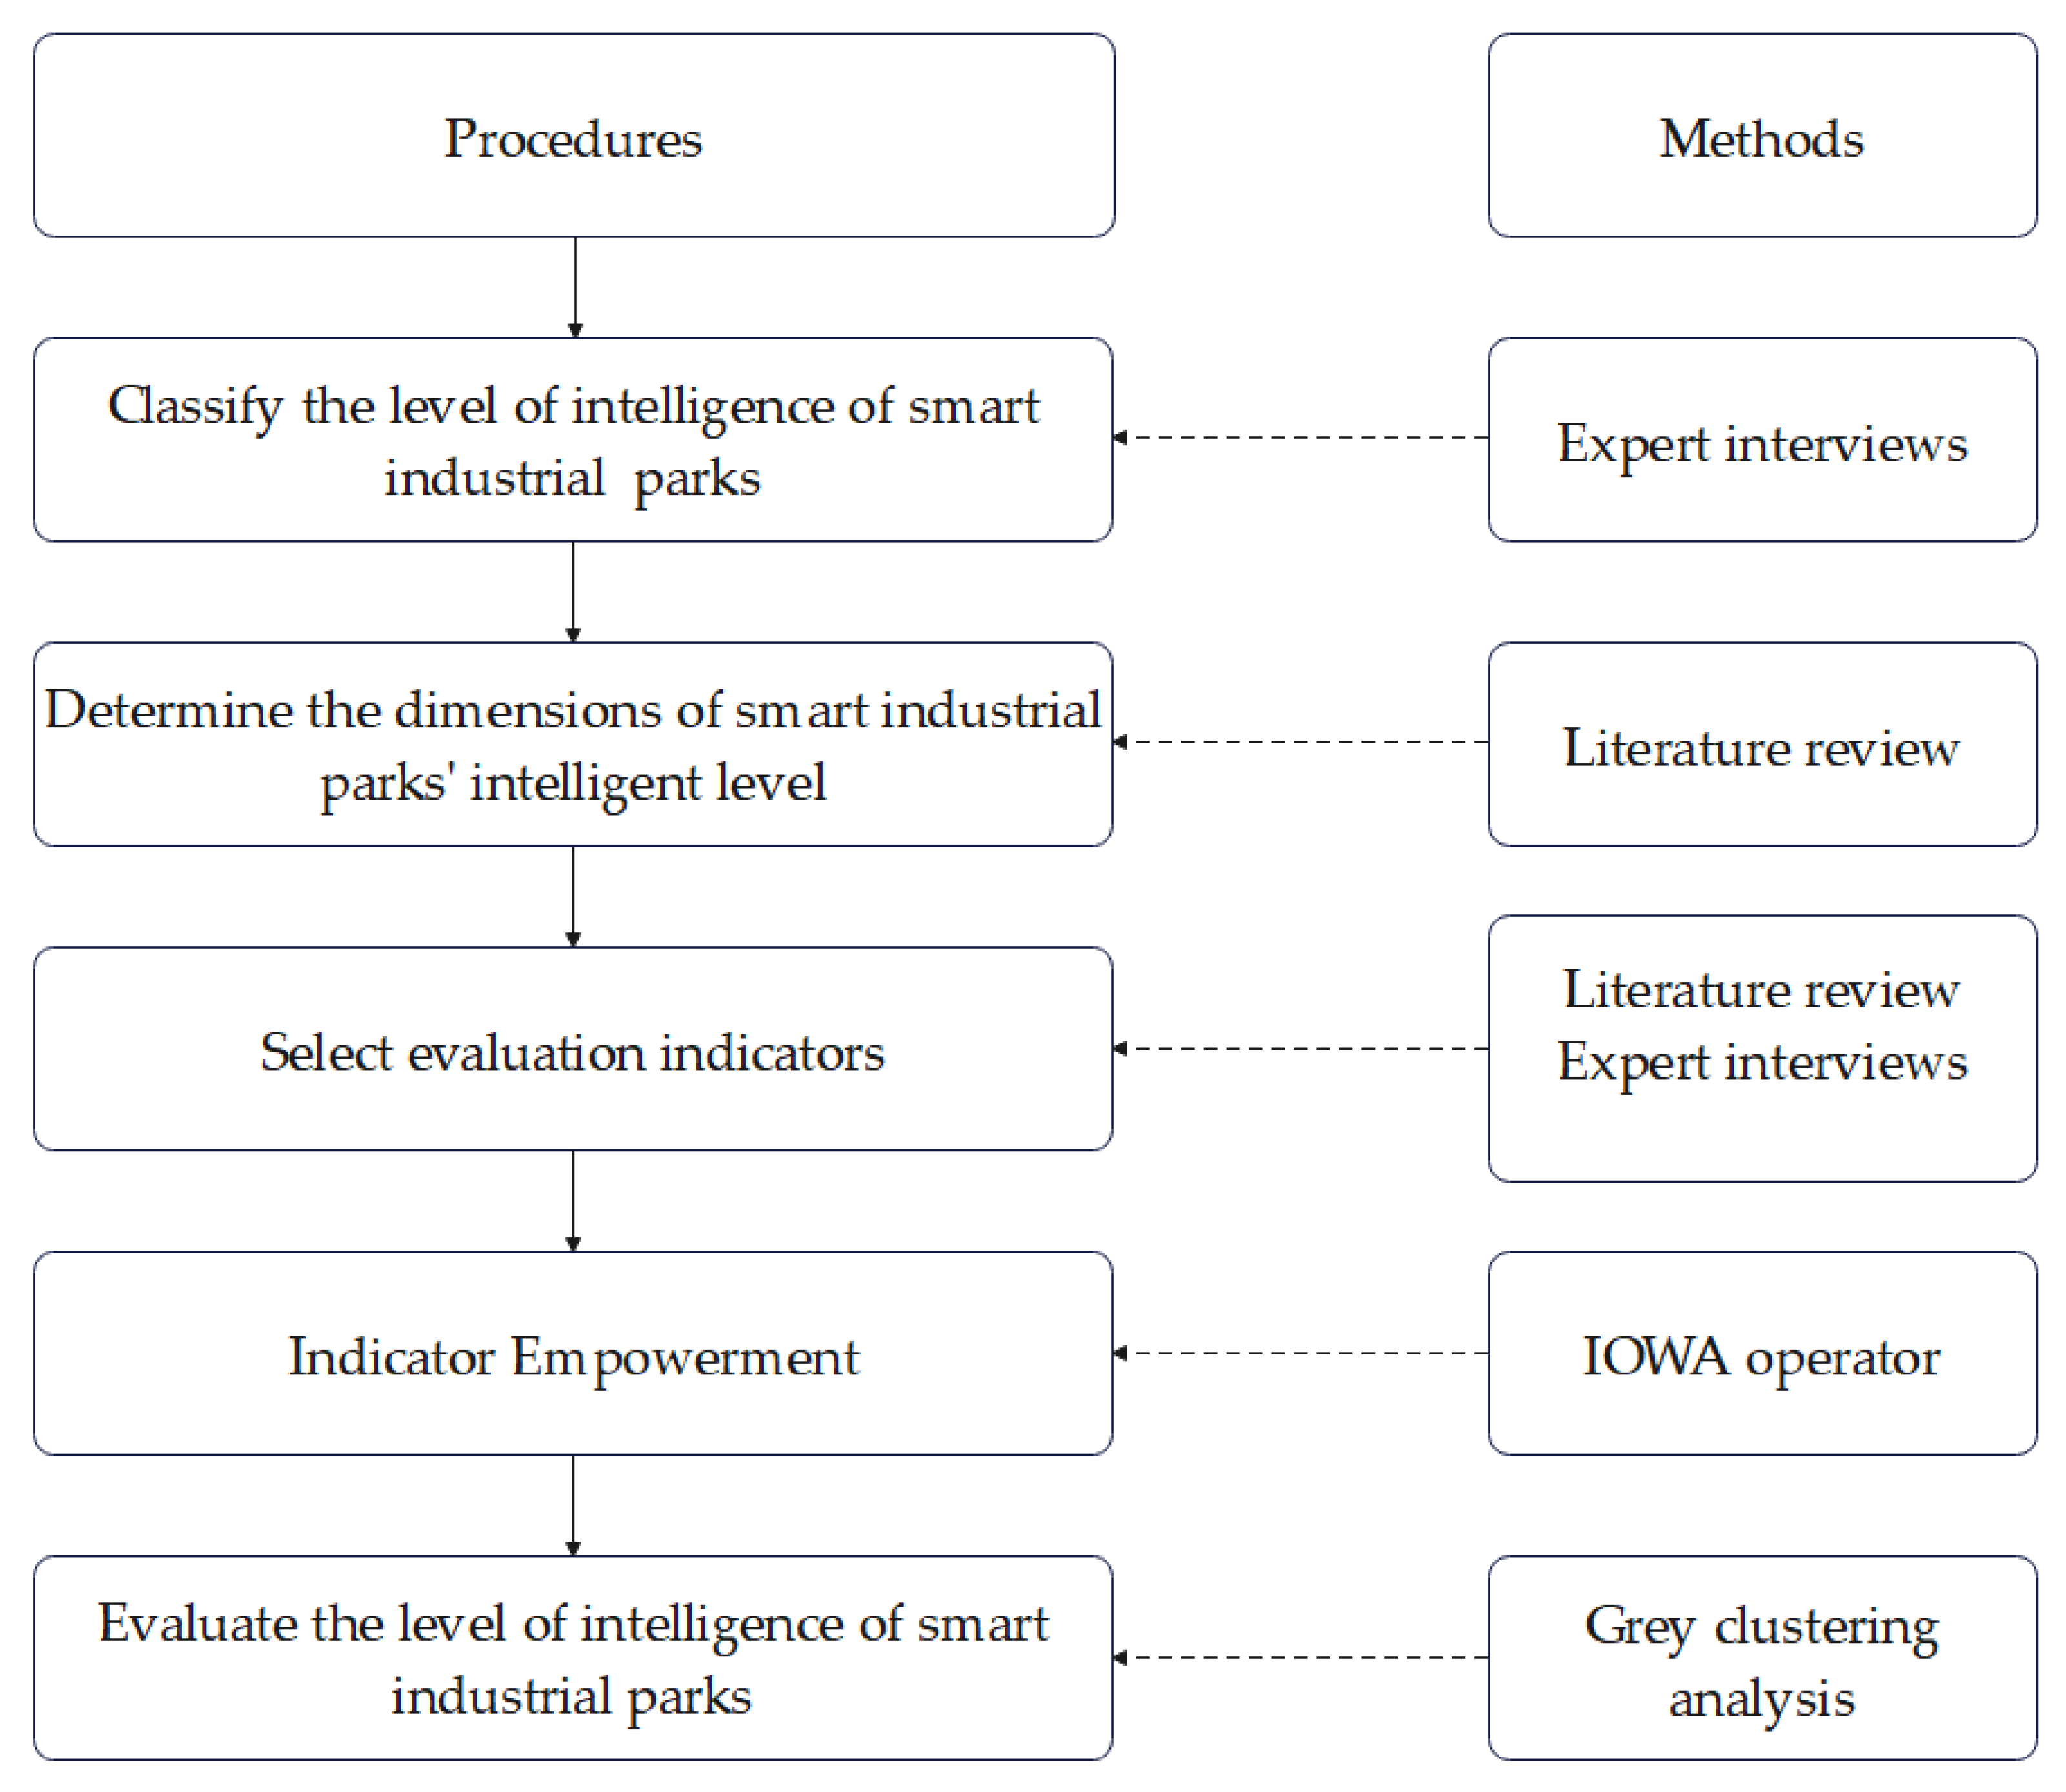
3.1. Overviews
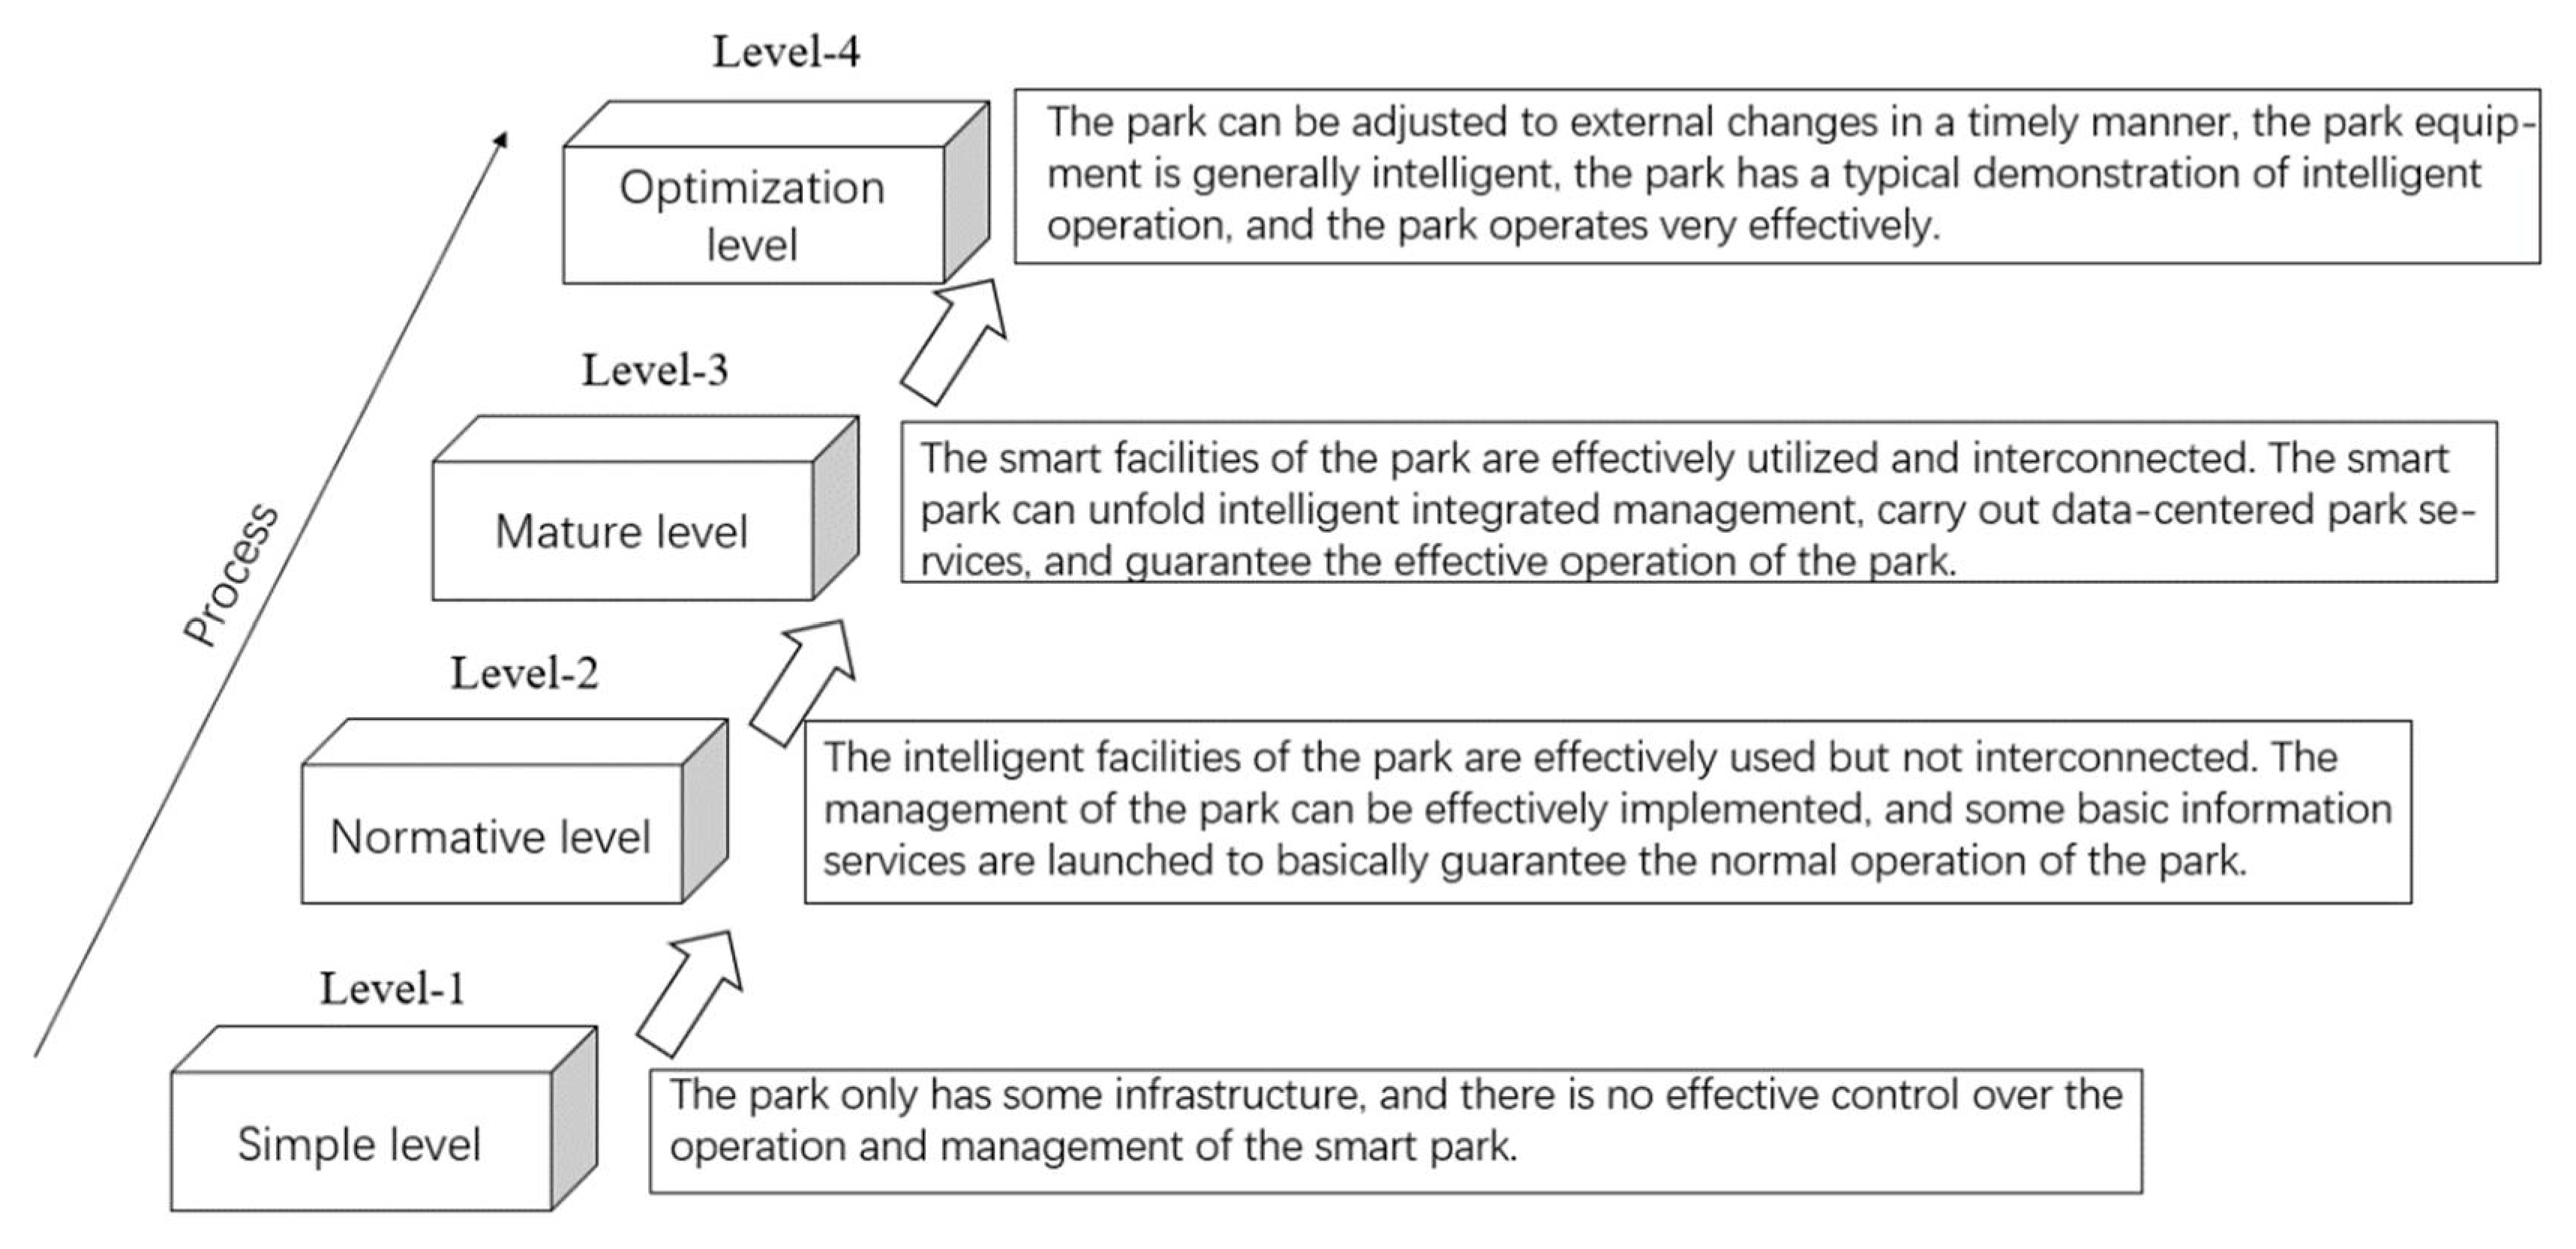
3.2. Defination of Smart Industrial Parks Intelligence Level
3.3. Establishment of the Evaluation Indicator System
3.3.1. Smart Industrial Parks Intelligence Level Dimension Division
3.3.2. Selection of the Evaluation Indicators
3.4. Determination of Index Weights Based on Correlation and Induced Ordered Weighted Operator
3.4.1. Correlation-Based Measure of Variability of Weighted Information
3.4.2. Determination of Weights Based on the IOWA Operator
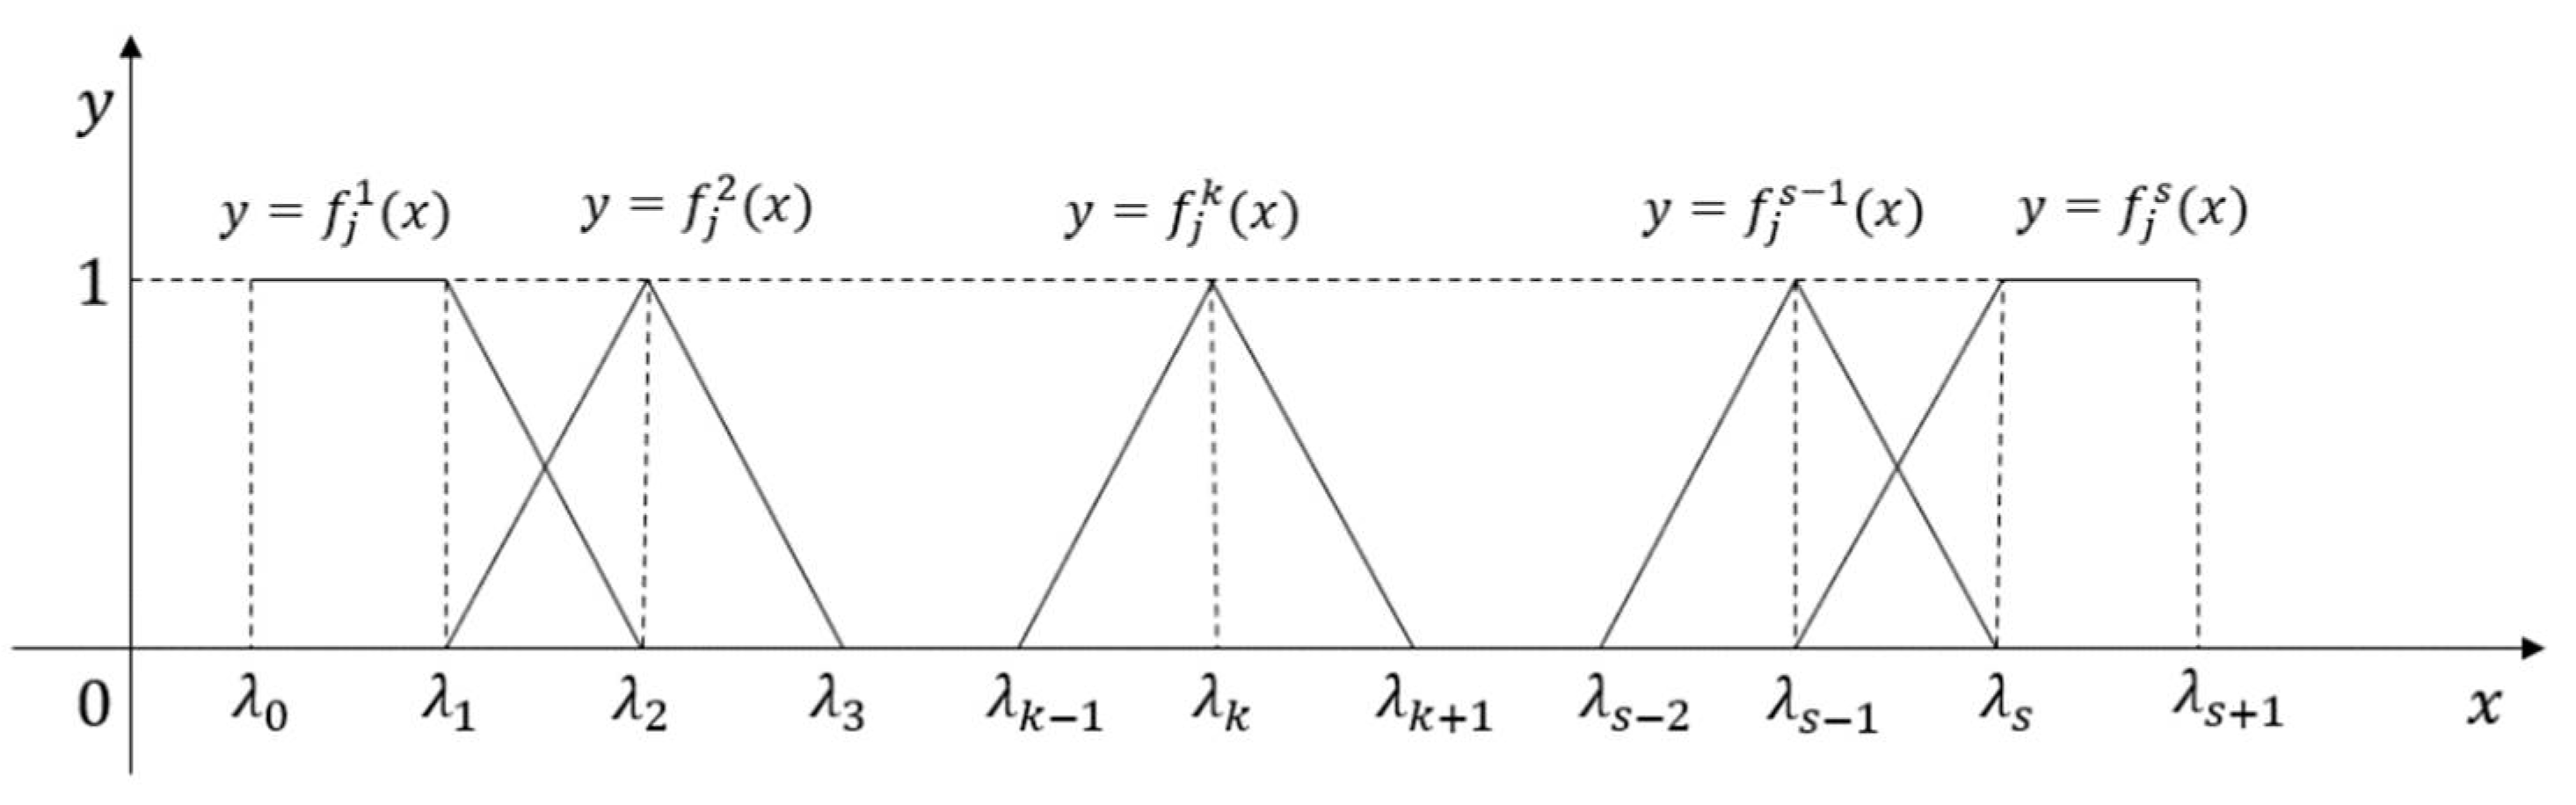
3.5. Calculation of Performance Score Based on Grey Clustering Analysis
4. Empirical Analysis Results
4.1. Case Background
4.2. Weights of Indexes
4.3. Grey Clustering Analysis Results
5. Discussion
5.1. Main Findings of the Case Study
5.2. The Effectiveness of the Proposed Method
6. Conclusions
Author Contributions
Funding
Acknowledgments
Conflicts of Interest
References
- Zhao, H.; Wang, Y.; Liu, X. The Evaluation of Smart City Construction Readiness in China Using CRITIC-G1 Method and the Bonferroni Operator. IEEE Access 2021, 9, 70024–70038. [Google Scholar] [CrossRef]
- Caragliu, A.; Del Bo, C.; Nijkamp, P. Smart Cities in Europe. J. Urban Technol. 2011, 18, 65–82. [Google Scholar] [CrossRef]
- Batty, M.; Axhausen, K.W.; Giannotti, F.; Pozdnoukhov, A.; Bazzani, A.; Wachowicz, M.; Ouzounis, G.; Portugali, Y. Smart cities of the future. Eur. Phys. J.-Spec. Top. 2012, 214, 481–518. [Google Scholar] [CrossRef]
- Wang, Y.P.; Ren, H.; Dong, L.; Park, H.S.; Zhang, Y.P.; Xu, Y.W. Smart solutions shape for sustainable low-carbon future: A review on smart cities and industrial parks in China. Technol. Forecast. Soc. Chang. 2019, 144, 103–117. [Google Scholar] [CrossRef]
- Yu, C.; Dijkema, G.P.J.; De Jong, M.; Shi, H. From an eco-industrial park towards an eco-city: A case study in Suzhou, China. J. Clean. Prod. 2015, 102, 264–274. [Google Scholar] [CrossRef]
- Boix, M.; Montastruc, L.; Azzaro-Pantel, C.; Domenech, S. Optimization methods applied to the design of eco-industrial parks: A literature review. J. Clean. Prod. 2015, 87, 303–317. [Google Scholar] [CrossRef]
- Jiao, W.; Boons, F. Toward a research agenda for policy intervention and facilitation to enhance industrial symbiosis based on a comprehensive literature review. J. Clean. Prod. 2014, 67, 14–25. [Google Scholar] [CrossRef]
- Pan, M.; Sikorski, J.; Kastner, C.A.; Akroyd, J.; Mosbach, S.; Lau, R.; Kraft, M. Applying Industry 4.0 to the Jurong Island Eco-industrial Park. In Proceedings of the 7th International Conference on Applied Energy (ICAE), Abu Dhabi, United Arab Emirates, 28–31 March 2015; pp. 1536–1541. [Google Scholar]
- Zhao, S.D.; Zhang, P.; Li, W.W. A Study on Evaluation of Influencing Factors for Sustainable Development of Smart Construction Enterprises: Case Study from China. Buildings 2021, 11, 221. [Google Scholar] [CrossRef]
- Huawei Technologies Company Limited. Future Smart Parks White Paper. Available online: https://e.huawei.com/cn/material/industry/smartcampus/20b8e6583ecb4f3ab0fc2f91379ef4fb (accessed on 19 May 2022).
- National Technical Committee for the Standardization of Intelligent Building and Living Area Digitization. China Smart Park Standardization White Paper. Available online: https://e.huawei.com/cn/material/industry/smartcampus/4b3a8069d18c4af48b60591c25674c1a (accessed on 20 March 2022).
- Zhou, X.C. Discussion on smartization construction of electroplating park. Electroplat. Finish. 2019, 38, 822–825. [Google Scholar] [CrossRef]
- Lu, L. On construction of smart park evaluation system based on CMM and COBIT Frame. J. Southwest China Norm. Univ. Nat. Sci. Ed. 2017, 42, 128–135. [Google Scholar] [CrossRef]
- China High-Tech Industry Herald. Smart Park Operation Industry Analysis. Available online: https://baijiahao.baidu.com/s?id=1705054045691520112&wfr=spider&for=pc (accessed on 5 March 2022).
- Zhiyang, Z.; Xianxun, Z.; Xiong, W.; Xu, W.; Jiancun, Z. Application of workflow technology in the integrated management platform of smart park. In Proceedings of the 2021 IEEE 4th Advanced Information Management, Communicates, Electronic and Automation Control Conference, Chongqing, China, 18–20 June 2021; pp. 1433–1437. [Google Scholar]
- Wang, J.; Ding, S.; Song, M.; Fan, W.; Yang, S. Smart community evaluation for sustainable development using a combined analytical framework. J. Clean. Prod. 2018, 193, 158–168. [Google Scholar] [CrossRef]
- Dean, C.A.; Fath, B.D.; Chen, B. Indicators for an expanded business operations model to evaluate eco-smart corporate communities. Ecol. Indic. 2014, 47, 137–148. [Google Scholar] [CrossRef]
- Wang, C.; Pang, L.; Xu, M. Research on Information Cooperative Operation of Smart Logistics Park. IOP Conf. Ser. Earth Environ. Sci. 2019, 242. [Google Scholar] [CrossRef]
- Yuan, Y.; Li, Y. Research on Spatial Agglomeration Characteristics of Aerospace Cultural and Creative Industries in Smart City under Multidata Fusion. Secur. Commun. Netw. 2022, 2022, 2328673. [Google Scholar] [CrossRef]
- Chen, C. Urban Design and Detailed Planning; John Wiley & Sons: Hoboken, NJ, USA, 2020; pp. 119–120. [Google Scholar]
- Han, C.D.; Liu, A.Q.; Zhang, B.C.; Liu, H.; Li, X.; Bian, S.; Chen, J. Design and Application of a Smart Park Based on Internet of Things Platforms. Microelectronics 2021, 51, 146–150. [Google Scholar] [CrossRef]
- Zang, S. The Planning and Design of Intelligent System of Smart Zone. Mod. Urban Res. 2017, 24, 130–132. [Google Scholar]
- Du, M. Research on Smart Park Information System Design Based on Wireless Internet of Things. Int. J. Online Eng. 2017, 13, 134–145. [Google Scholar] [CrossRef]
- Huang, D.; Jiang, G.D.; Sun, B.H.; Feng, R.Q.; Wu, J.P. Smart park integrated management cloud platform architecture based on microservice governance framework. In Proceedings of the 4th International Conference on New Energy and Future Energy System (NEFES), Macao, China, 21–24 July 2019. [Google Scholar]
- Guerreiro, B.V.; Lins, R.G.; Sun, J.N.; Schmitt, R. Definition of Smart Retrofitting: First Steps for a Company to Deploy Aspects of Industry 4.0. In Proceedings of the 5th International Scientific-Technical Conference (MANUFACTURING), Poznan, Poland, 24–26 October 2017; pp. 161–170. [Google Scholar]
- Makhdoom, I.; Lipman, J.; Abolhasan, M.; Challen, D. Science and Technology Parks: A Futuristic Approach. IEEE Access 2022, 10, 31981–32021. [Google Scholar] [CrossRef]
- Yali, W.; Zhiguo, S.; Xiaoli, W.; Chenxue, Y. Scheme design of Smart Platform for the Agricultural Science and Technology Park. J. Phys. Conf. Ser. 2020, 1673, 012062. [Google Scholar] [CrossRef]
- Hvolby, H.H.; Steger-Jensen, K. Technical and industrial issues of Advanced Planning and Scheduling (APS) systems. Comput. Ind. 2010, 61, 845–851. [Google Scholar] [CrossRef]
- Pang, L.Y.; Li, Z.; Huang, G.Q.; Zhong, R.Y.; Pan, Y.; Qu, T. Reconfigurable Auto-ID Enabled Software as a Service (SaaS) Shell for Real-Time Fleet Management in Industrial Parks. J. Comput. Civ. Eng. 2015, 29, 04014032. [Google Scholar] [CrossRef]
- Zhou, X.; Lu, J.; Xie, X.; Bu, C.; Wan, L.; Xue, F. Communication Bandwidth Prediction Technology for Smart Power Distribution Business in Smart Parks. Electronics 2021, 10, 3143. [Google Scholar] [CrossRef]
- Xi, Y.Y.; Yang, Y.F. The Use of Distributed Energy Storage System in Smart Power Distribution and Utilization Park. Adv. Mater. Res. 2012, 614–615, 1766–1770. [Google Scholar] [CrossRef]
- Song, N.X.; Wan, D.M.; Sun, Q.; Yue, J.F. Data Mining-based Smart Industrial Park Energy Efficiency Management System. In Proceedings of the 3rd International Conference on Green Power, Materials and Manufacturing Technology and Applications, Wuhan, China, 27–30 December 2013; pp. 585–588. [Google Scholar]
- Hernandez-Callejo, L.; Garcia-Pedrero, A.; Gomez, V.A. A New Model for Short-Term Load Forecasting in an Industrial Park. In Proceedings of the 1st Ibero-American Congress of Smart Cities (ICSC-CITIES), Soria, Spain, 26–27 September 2018; pp. 29–37. [Google Scholar]
- Hernandez, L.; Baladron, C.; Aguiar, J.M.; Carro, B.; Sanchez-Esguevillas, A. Classification and Clustering of Electricity Demand Patterns in Industrial Parks. Energies 2012, 5, 5215–5228. [Google Scholar] [CrossRef]
- Butturi, M.A.; Lolli, F.; Sellitto, M.A.; Balugani, E.; Gamberini, R.; Rimini, B. Renewable energy in eco-industrial parks and urban-industrial symbiosis: A literature review and a conceptual synthesis. Appl. Energy 2019, 255, 113825. [Google Scholar] [CrossRef]
- Wang, Q.; Li, S.Q. Comprehensive evaluation of smart parks based on hierarchical analysis. In Proceedings of the 4rd Annual Power Industry Informatization Conference, Tianjin, China, 24–25 September 2016; pp. 242–246. [Google Scholar]
- Guo, H.; Wang, W.X.; Li, X.M.; Tang, S.J.; Deng, Y.Y. The smart park evaluation method that takes into account common ground and individual characteristics. J. Geo-Inf. Sci. 2022, 24, 1061–1072. [Google Scholar]
- Guo, B.; Geng, Y.; Sterr, T.; Dong, L.; Liu, Y. Evaluation of promoting industrial symbiosis in a chemical industrial park: A case of Midong. J. Clean. Prod. 2016, 135, 995–1008. [Google Scholar] [CrossRef]
- Yang, J.; Chen, B.; Qi, J.; Zhou, S.; Jiang, M. Life-Cycle-Based Multicriteria Sustainability Evaluation of Industrial Parks: A Case Study in China. Sci. World J. 2012, 2012, 917830. [Google Scholar] [CrossRef]
- Zhao, H.; Guo, S.; Zhao, H. Comprehensive benefit evaluation of eco-industrial parks by employing the best-worst method based on circular economy and sustainability. Environ. Dev. Sustain. 2017, 20, 1229–1253. [Google Scholar] [CrossRef]
- Liu, W.; Tian, J.; Chen, L.; Lu, W.; Gao, Y. Environmental Performance Analysis of Eco-Industrial Parks in China: A Data Envelopment Analysis Approach. J. Ind. Ecol. 2015, 19, 1070–1081. [Google Scholar] [CrossRef]
- Chongqing Municipal Economic and Information Commission. Evaluation Criteria of Chongqing Smart Park (Provisional). Available online: https://jjxxw.cq.gov.cn/zwgk_213/zcwj/qtwj/202003/t20200321_5932145.html (accessed on 13 April 2022).
- General Specifications for the Construction and Management of Smart Parks. Available online: https://dbba.sacinfo.org.cn/stdDetail/cfe4049fa165733e72a17fe4c5f35fc6 (accessed on 3 April 2022).
- China Engineering Construction Standardization Association. Green Intelligent Industrial Park Evaluation Criteria. Available online: https://www.gongbiaoku.com/search?query=%E7%BB%BF%E8%89%B2%E6%99%BA%E6%85%A7%E4%BA%A7%E4%B8%9A%E5%9B%AD%E5%8C%BA%E8%AF%84%E4%BB%B7%E6%A0%87%E5%87%86%20T/CECS%20774-2020 (accessed on 2 April 2022).
- De Filippi, F.; Coscia, C.; Guido, R. From Smart-Cities to Smart-Communities. Int. J. E-Plan. Res. 2019, 8, 24–44. [Google Scholar] [CrossRef]
- Valenzuela-Venegas, G.; Salgado, J.C.; Díaz-Alvarado, F.A. Sustainability indicators for the assessment of eco-industrial parks: Classification and criteria for selection. J. Clean. Prod. 2016, 133, 99–116. [Google Scholar] [CrossRef]
- Wang, J.J.; Li, Q.F.; Yang, Y.W. Comprehensive Evaluation of Nearly Zero Carbon Emission Parks Based on Variable Weight Theory. Sci. Technol. Eng. 2021, 21, 334–340. [Google Scholar]
- Tobey, M.B.; Binder, R.B.; Chang, S.; Yoshida, T.; Yamagata, Y.; Yang, P.P.J. Urban Systems Design: A Conceptual Framework for Planning Smart Communities. Smart Cities 2019, 2, 522–537. [Google Scholar] [CrossRef]
- Wei, J.; Chen, H.; Long, R.; Zhao, F. Application of the capability maturity model to evaluating the carbon capability maturity of urban residents in 10 Eastern provinces of China. Resour. Conserv. Recycl. 2019, 148, 11–22. [Google Scholar] [CrossRef]
- Khatibi, H.; Wilkinson, S.; Eriwata, G.; Sweya, L.N.; Baghersad, M.; Dianat, H.; Ghaedi, K.; Javanmardi, A. An integrated framework for assessment of smart city resilience. Environ. Plan. B-Urban Anal. City Sci. 2022, 49, 1556–1577. [Google Scholar] [CrossRef]
- Schiavone, F.; Paolone, F.; Mancini, D. Business model innovation for urban smartization. Technol. Forecast. Soc. Chang. 2019, 142, 210–219. [Google Scholar] [CrossRef]
- Serey, J.; Quezada, L.; Alfaro, M.; Fuertes, G.; Ternero, R.; Gatica, G.; Gutierrez, S.; Vargas, M. Methodological Proposals for the Development of Services in a Smart City: A Literature Review. Sustainability 2020, 12, 249. [Google Scholar] [CrossRef]
- Zheng, X.; Deng, Y. Dependence assessment in human reliability analysis based on evidence credibility decay model and IOWA operator. Ann. Nucl. Energy 2018, 112, 673–684. [Google Scholar] [CrossRef]
- Hsieh, M.Y. Grey-Clustering Macroeconomic Assessment Model to Detect the Fluctuation in the Ten Economies. J. Grey Syst. 2012, 24, 67–80. [Google Scholar]
- Wang, K.C.P.; Li, Q. Gray Clustering-Based Pavement Performance Evaluation. J. Transp. Eng. 2010, 136, 38–44. [Google Scholar] [CrossRef]
- Zhao, J.X.; Wang, M.M.; Wu, D.D. Evaluation of Metro Construction Emergency Management Capacity based on COWA Operator and Grey Clustering. In Proceedings of the 3rd International Forum on Energy, Environment Science and Materials (IFEESM), Shenzhen, China, 25–26 November 2017; pp. 26–31. [Google Scholar]
- Zong, J.; Chen, L.; Li, Q.; Liu, Z. The construction and management of industrial park digitalization and its application services. IOP Conf. Ser. Earth Environ. Sci. 2018, 153, 032019. [Google Scholar] [CrossRef]
- Chen, M. Evaluation Standard for Eco-intelligent Park Construction of a Science and Technology Park in the Zhongguancun National Innovation Demonstration Zone. Build. Energy Effic. 2018, 46, 112–116. [Google Scholar]
- Zheng, T.; Ardolino, M.; Bacchetti, A.; Perona, M. The applications of Industry 4.0 technologies in manufacturing context: A systematic literature review. Int. J. Prod. Res. 2020, 59, 1922–1954. [Google Scholar] [CrossRef]
- Tang, X. Research on Smart Logistics Model Based on Internet of Things Technology. IEEE Access 2020, 8, 151150–151159. [Google Scholar] [CrossRef]
- Li, Z.P.; Zhang, Z.W.; Ding, M.H. Application of combined model based on approach degree and induced ordered weighted averaging operator on subgrade settlement. Sci. Surv. Mapp. 2017, 42, 95–99. [Google Scholar] [CrossRef]
- Nie, X.T.; Fan, T.Y.; Dong, H.; Wang, B. IOWA-Cloud model-based study on risk assessment of operation safety of long distance water transfer project. Water Resour. Hydropower Eng. 2019, 50, 151–160. [Google Scholar] [CrossRef]
- Yang, X.Q.; Li, W.J.; Yue, Y. A Method for Ascertaining Comprehensive Evaluation Index Weight. J. Armored Forces 2015, 29, 101–105. [Google Scholar]
- Deng, J.L. Grey System Theory Tutorial; Huazhong Institute of Technology Press: Wuhan, China, 1990. [Google Scholar]
- Wang, A.; Su, M.; Sun, S.; Zhao, Y. A model of BIM application capability evaluation for Chinese construction enterprises based on interval grey clustering analysis. J. Asian Archit. Build. Eng. 2020, 20, 210–221. [Google Scholar] [CrossRef]
- Lyu, H.M.; Zhou, W.H.; Shen, S.L.; Zhou, A.N. Inundation risk assessment of metro system using AHP and TFN-AHP in Shenzhen. Sustain. Cities Soc. 2020, 56, 102103. [Google Scholar] [CrossRef]
- Rabbani, M.; Foroozesh, N.; Mousavi, S.M.; Farrokhi-Asl, H. Sustainable supplier selection by a new decision model based on interval-valued fuzzy sets and possibilistic statistical reference point systems under uncertainty. Int. J. Syst. Sci. Oper. Logist. 2019, 6, 162–178. [Google Scholar] [CrossRef]
- Mahmoudi, M.R.; Heydari, M.H.; Qasem, S.N.; Mosavi, A.; Band, S.S. Principal component analysis to study the relations between the spread rates of COVID-19 in high risks countries. Alex. Eng. J. 2021, 60, 457–464. [Google Scholar] [CrossRef]
- Deng, J.L. Control-problems of grey systems. Syst. Control Lett. 1982, 1, 288–294. [Google Scholar] [CrossRef]
- Temino-Boes, R.; Romero-Lopez, R.; Ibarra-Zavaleta, S.P.; Romero, I. Using grey clustering to evaluate nitrogen pollution in estuaries with limited data. Sci. Total Environ. 2020, 722, 137964. [Google Scholar] [CrossRef] [PubMed]
- Chai, N.J.; Zhou, W.L. The DPSIRM-Grey cloud clustering method for evaluating the water environment carrying capacity of Yangtze River economic Belt. Ecol. Indic. 2022, 136, 108722. [Google Scholar] [CrossRef]
- Liu, S.F.; Fang, Z.G.; Yang, Y.J. Two stages decision model with grey synthetic measure and a betterment of triangular whitenization weight function. Control Decis. 2014, 29, 1232–1238. [Google Scholar] [CrossRef]
- Yu, X.; Liang, Z.; Fan, J.; Zhang, J.; Luo, Y.; Zhu, X. Spatial decomposition of city-level CO2 emission changes in Beijing-Tianjin-Hebei. J. Clean. Prod. 2021, 296, 126613. [Google Scholar] [CrossRef]
- Huang, R.; Zhang, S.; Wang, P. Key areas and pathways for carbon emissions reduction in Beijing for the “Dual Carbon” targets. Energy Policy 2022, 164, 112873. [Google Scholar] [CrossRef]
- Zhang, N.; Zhao, X.; He, X. Understanding the relationships between information architectures and business models: An empirical study on the success configurations of smart communities. Gov. Inf. Q. 2020, 37, 101439. [Google Scholar] [CrossRef]
- Yang, Y.-C.; Ying, H.; Jin, Y.; Cheng, H.K.; Liang, T.-P. Special Issue Editorial: Information Systems Research in the Age of Smart Services. J. Assoc. Inf. Syst. 2021, 22, 579–590. [Google Scholar] [CrossRef]
- Yoon, S.; Um, J.; Suh, S.-H.; Stroud, I.; Yoon, J.-S. Smart Factory Information Service Bus (SIBUS) for manufacturing application: Requirement, architecture and implementation. J. Intell. Manuf. 2019, 30, 363–382. [Google Scholar] [CrossRef]
- Gunatilaka, R.N.; Abdeen, F.N.; Sepasgozar, S.M.E. Developing a Scoring System to Evaluate the Level of Smartness in Commercial Buildings: A Case of Sri Lanka. Buildings 2021, 11, 644. [Google Scholar] [CrossRef]
- Qi, L.; Guo, J. Development of smart city community service integrated management platform. Int. J. Distrib. Sens. Netw. 2019, 15, 1550147719851975. [Google Scholar] [CrossRef]
- Mital, M.; Pani, A.K.; Damodaran, S.; Ramesh, R. Cloud based management and control system for smart communities: A practical case study. Comput. Ind. 2015, 74, 162–172. [Google Scholar] [CrossRef]
- Suciu, G.; Urelu, T.U.; Jimenez, C.; Power, I.; Energy, S. Smart energy tools for buildings energy management. In Proceedings of the IEEE PES Innovative Smart Grid Technologies Europe (IEEE ISGT-Europe), Bucharest, Romania, 29 September–2 October 2019. [Google Scholar]


| Research Work | Evaluation Methodology | Analysis |
|---|---|---|
| [37] | AHP | The hierarchical analysis method is to break down the research objectives into levels such as guidelines and programs, on the basis of which qualitative and quantitative analyses are conducted, but this method is more subjective. |
| [38] | Benefit Analysis | Benefit analysis can quantitatively assess the benefits of SIPs, but, due to the pursuit of quantification, the selected index system is not comprehensive enough. |
| [40] | BWM | Tentative application of BWM to multi-criteria decision problems. However, there is ambiguity and uncertainty because of the qualitative human judgment involved. |
| [41] | DEA | Although DEA can reduce human-induced errors, it relies on the overall score for evaluation. |
| Experts | Position | Years | Additional Information |
|---|---|---|---|
| Expert A | Professor | 8 | One of the first scholars to conduct research on the SIP framework. |
| Expert B | Professor | 6 | Organized several digital construction related subjects for SIPs. |
| Expert C | Senior Engineer | 5 | Participated in many SIP construction projects, familiar with the actual situation of the SIPs. |
| Expert D | Senior Engineer | 5 | SIP developers who understand the needs of SIPs. |
| Expert E | Senior Management | 6 | Has been engaged in the operation and management of SIPs and smart communities. |
| Dimensions | Definition | Reference | |||||||
|---|---|---|---|---|---|---|---|---|---|
| [17] | [45] | [46] | [48] | [16] | [42] | [43] | [44] | ||
| Environment | SIPs should control the environment in the parks to ensure a green and low-carbon development. | √ | √ | √ | √ | ||||
| Facilities | SIPs should be equipped with a variety of information infrastructure and have multiple intelligent devices. | √ | √ | √ | √ | ||||
| Industry | The construction of SIPs should drive the development of industries in the parks. | √ | √ | ||||||
| Management | SIPs manage the environment and information of the parks through several subsystems. | √ | √ | √ | √ | √ | |||
| Security | SIPs should ensure the security of the park and realize security mechanisms such as entrance management and system security response. | √ | √ | ||||||
| Transportation | SIPs should have an intelligent transportation system to ensure green and convenient travel in the parks. | √ | |||||||
| Living | SIPs should provide a suitable environment to improve the comfort of the people in the parks. | √ | √ | ||||||
| Economy | The construction of SIPs should drive economic development. | √ | √ | √ | |||||
| Social | The construction of SIPs should contribute to society in terms of human, economic, and environmental impact. | √ | √ | ||||||
| Services | SIPs should provide various intelligent services using the intelligent systems owned by the parks. | √ | √ | √ | |||||
| Smart Applications | SIPs integrate the resources of the parks through high technology, thus launching a variety of intelligent applications. | √ | √ | ||||||
| Indices | Indices Interpretation and Explanation | Literature Sources of Indices | |
|---|---|---|---|
| Green and Low-carbon C1 | Renewable Energy Use C11 | The status of the use of renewable energy sources such as solar energy in SIPs. | [46,47,57,58] |
| Carbon emissions per unit of energy consumption C12 | Examine whether the SIP is a low-carbon development. | [46,47,57] | |
| Proportion of green buildings C13 | The percentage of green buildings included in the SIP. Green buildings are evaluated according to the national standard Green Building Evaluation Standard. | [36,46,58] | |
| Proportion of green trips C14 | SIPs should provide more green travel tools to reduce environmental pollution. | [46,47] | |
| Pollutant-free treatment C15 | The level of harmless treatment of waste, sewage, and other pollutants in SIPs. | [36,46,47,57] | |
| Water Reuse Rate C16 | Reuse of water as a percentage of water consumption. | [46,47] | |
| Green space ratio C17 | Increasing the green space ratio can improve the air quality of the park. | [46,47] | |
| Energy consumption monitoring platform construction C18 | The testing platform can monitor and supervise the energy consumption in real time so as to achieve the energy saving target. | [16,42,47,57,58,59] | |
| Intelligent Facilities C2 | Fixed Communication Network C21 | Meet the immediate and long-term communication needs of the campus. | [16,36,42,58] |
| Wireless LAN C22 | It should be designed for the users’ needs and with the requirement to improve the quality of campus services. | [16,36,42,58] | |
| Mobile Communication Network C23 | Ensure full coverage of communication signals. | [16,36,42,58] | |
| Park One Card C24 | One IC card should meet a variety of functions to make life in the park more convenient. | [16,36,57] | |
| Intelligent Lighting System C25 | Intelligent control of lighting systems using technologies such as the Internet of Things. | [36,42,57] | |
| Smart industrial park Security C26 | Ensure the security of the parks through intelligent analysis. | [16,42,57,58,60] | |
| Intelligent Fire Fighting C27 | Integrating GIS and other technologies to protect people’s lives and property. | [42] | |
| Intelligent Traffic Management C28 | Solving traffic problems in the park using technologies such as the Internet of Things. | [42,47,57,60] | |
| park services C3 | Enterprise Information Service C31 | Create various databases to facilitate information mining for companies. | [42,57,58,59] |
| E-Commerce Services C32 | Services provided for e-commerce applications to facilitate business operations. | [57,58,60] | |
| E-logistics Services C33 | Use of electronic means to achieve logistics informatization. | [57,58,59,60] | |
| Public Information Services C34 | Provide public information services such as industry dynamic information and related policies to enterprises. | [16,42,46,57,60] | |
| Merchandising Services C35 | Provide investment services such as occupancy application and policy consultation to enterprises. | [42,57,58] | |
| E-Government Services C36 | The SIP should be docked to the online government function. | [16,42,57,60] | |
| Business Incubation Services C37 | The SIP should achieve precise incubation. | [42,57,58] | |
| Operational Benefits C4 | Total output value of the park C41 | The total output value of the SIP refers to the total industrial output value of the park. | [36,46] |
| Park net labor income C42 | The net income of the park examines the level of profitability of the park’s projects. | [36,46] | |
| Industry Aggregation C43 | Evaluate the work of the park in promoting industrial agglomeration. | [46] | |
| New jobs C44 | Examining the benefits the park brings to society. | [36,46] | |
| Optimization Level | Mature Level | Normative Level | Simple Level |
|---|---|---|---|
| [9,10) | [6,9) | [3,6) | [0,3) |
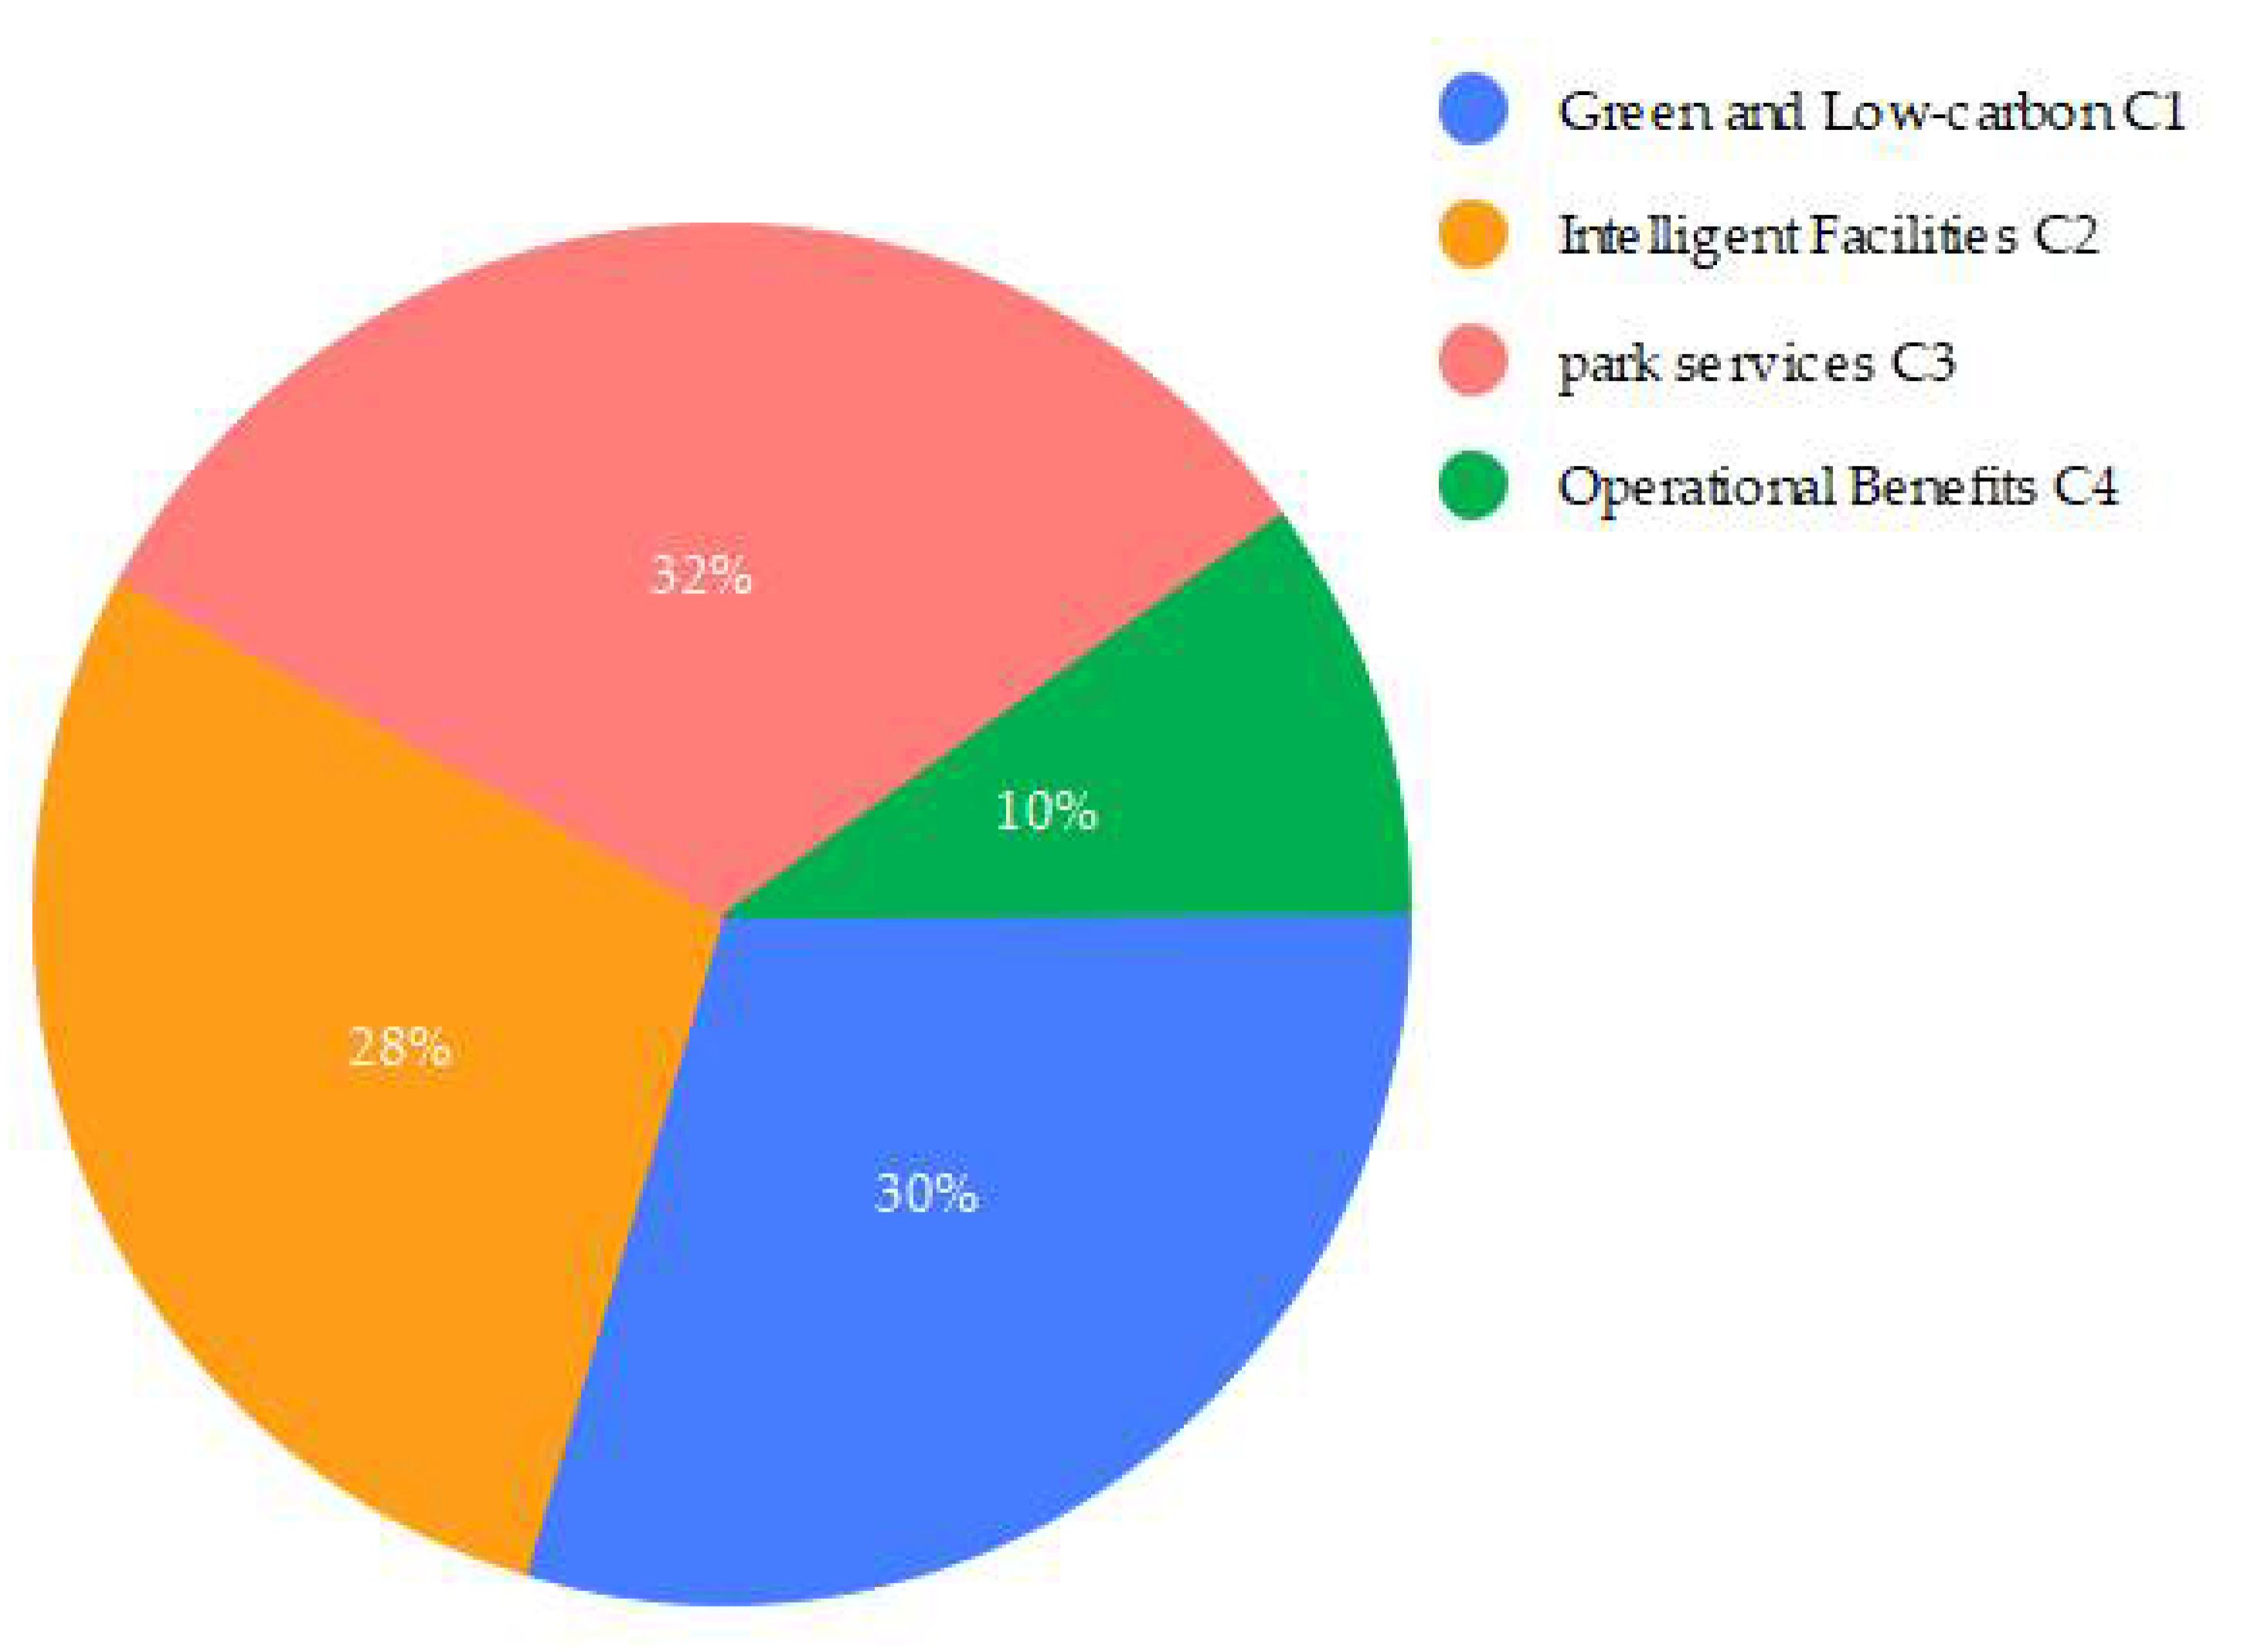
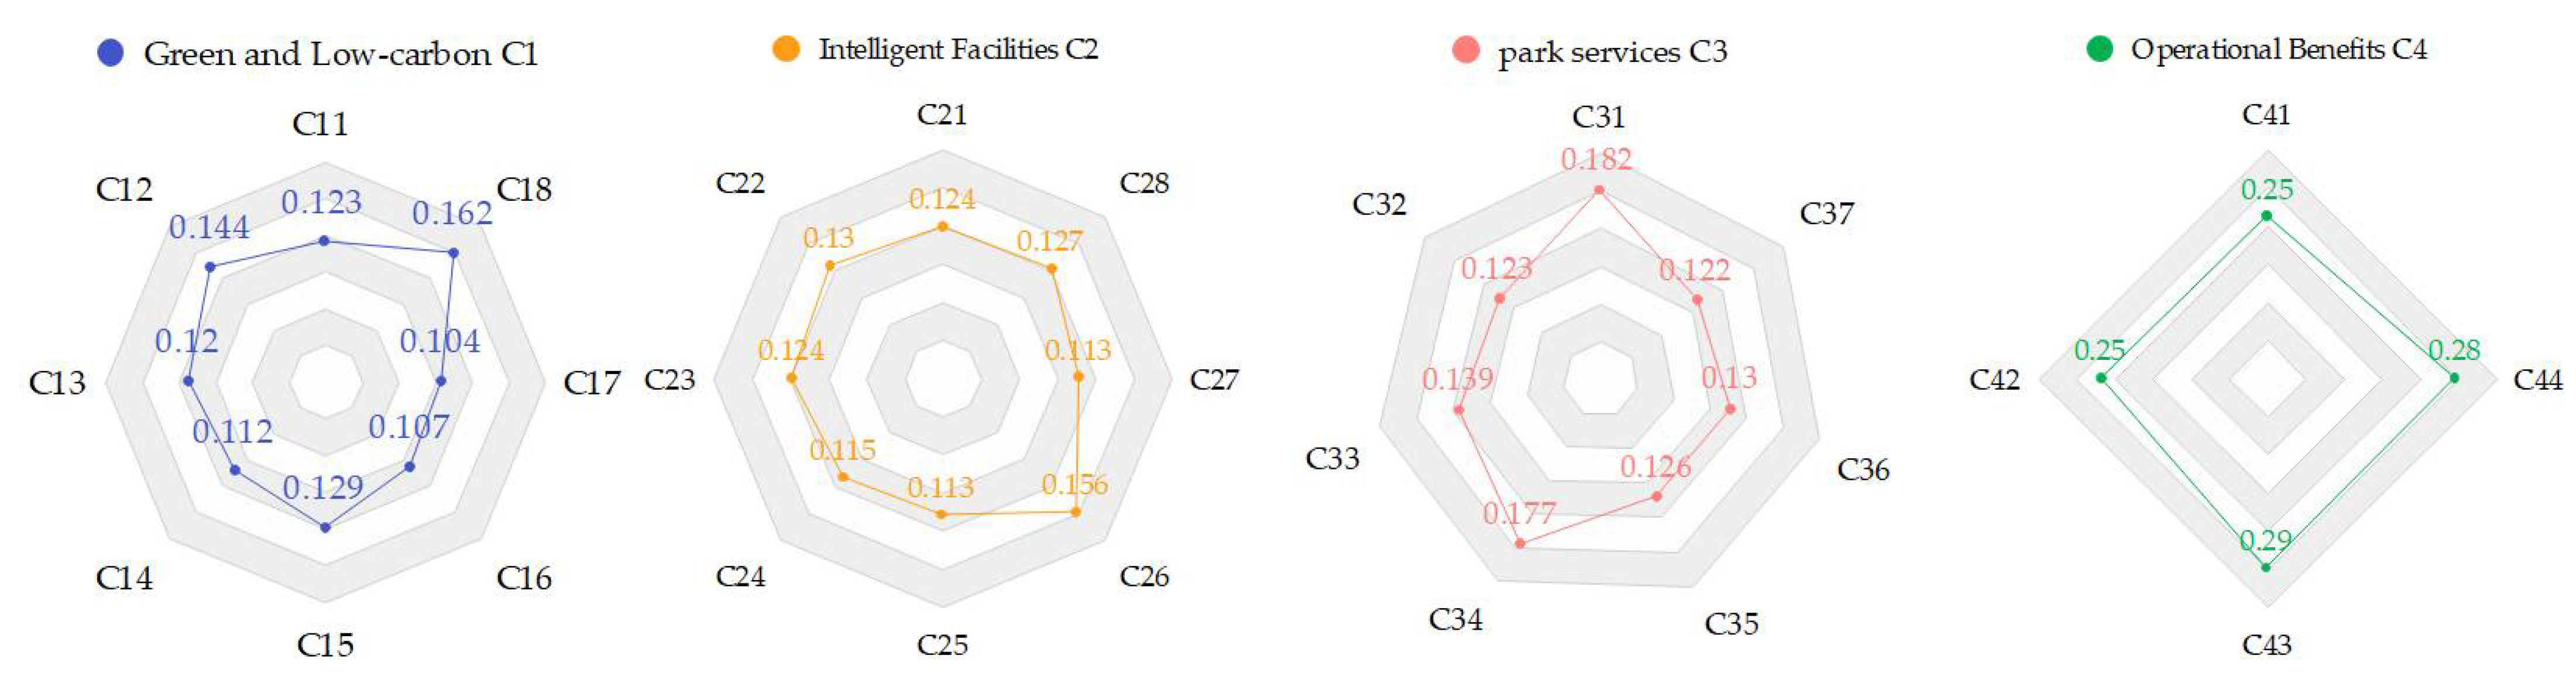
| Dimension | Weight of Dimension | Index | Weight of an Index in Dimension | Comprehensive Weight of an Index |
|---|---|---|---|---|
| C1 | 0.2965 | C11 | 0.1234 | 0.0366 |
| C12 | 0.1436 | 0.0426 | ||
| C13 | 0.1204 | 0.0357 | ||
| C14 | 0.1118 | 0.0331 | ||
| C15 | 0.1286 | 0.0381 | ||
| C16 | 0.1067 | 0.0316 | ||
| C17 | 0.1038 | 0.0308 | ||
| C18 | 0.1617 | 0.0480 | ||
| C2 | 0.2839 | C21 | 0.1238 | 0.0367 |
| C22 | 0.1295 | 0.0384 | ||
| C23 | 0.1238 | 0.0367 | ||
| C24 | 0.1148 | 0.0340 | ||
| C25 | 0.1125 | 0.0334 | ||
| C26 | 0.1560 | 0.0463 | ||
| C27 | 0.1125 | 0.0334 | ||
| C28 | 0.1272 | 0.0377 | ||
| C3 | 0.3214 | C31 | 0.1821 | 0.0585 |
| C32 | 0.1235 | 0.0397 | ||
| C33 | 0.1389 | 0.0446 | ||
| C34 | 0.1774 | 0.0570 | ||
| C35 | 0.1264 | 0.0406 | ||
| C36 | 0.1299 | 0.0418 | ||
| C37 | 0.1218 | 0.0391 | ||
| C4 | 0.0982 | C41 | 0.2458 | 0.0241 |
| C42 | 0.2514 | 0.0247 | ||
| C43 | 0.2891 | 0.0284 | ||
| C44 | 0.2849 | 0.0280 |
| Indices | Indices | |||||||||
|---|---|---|---|---|---|---|---|---|---|---|
| Grey Class 1 | Grey Class 2 | Grey Class 3 | Grey Class 4 | |||||||
| C11 | 6.6 | 0.0000 | 0.3000 | 0.7000 | 0.0000 | |||||
| C12 | 6.6 | 0.0000 | 0.3000 | 0.7000 | 0.0000 | |||||
| C13 | 7.5 | 0.0000 | 0.0000 | 1.0000 | 0.0000 | 0.0000 | 0.2102 | 0.7897 | 0.0000 | |
| C1 | C14 | 7.2 | 0.0000 | 0.1000 | 0.9000 | 0.0000 | ||||
| C15 | 7.1 | 0.0000 | 0.1333 | 0.8667 | 0.0000 | |||||
| C16 | 6.0 | 0.0000 | 0.5000 | 0.5000 | 0.0000 | |||||
| C17 | 6.1 | 0.0000 | 0.4667 | 0.5333 | 0.0000 | |||||
| C18 | 7.5 | 0.0000 | 0.0000 | 1.0000 | 0.0000 | |||||
| C21 | 6.1 | 0.0000 | 0.4667 | 0.5333 | 0.0000 | |||||
| C22 | 6.4 | 0.0000 | 0.3667 | 0.6333 | 0.0000 | |||||
| C23 | 6.6 | 0.0000 | 0.3000 | 0.7000 | 0.0000 | |||||
| C2 | C24 | 7.2 | 0.0000 | 0.1000 | 0.9000 | 0.0000 | 0.0000 | 0.2708 | 0.6981 | 0.0312 |
| C25 | 6.9 | 0.0000 | 0.2000 | 0.8000 | 0.0000 | |||||
| C26 | 7.9 | 0.0000 | 0.0000 | 0.8000 | 0.2000 | |||||
| C27 | 6.0 | 0.0000 | 0.5000 | 0.5000 | 0.0000 | |||||
| C28 | 6.6 | 0.0000 | 0.3000 | 0.7000 | 0.0000 | |||||
| C31 | 7.5 | 0.0000 | 0.0000 | 1.0000 | 0.0000 | |||||
| C32 | 6.1 | 0.0000 | 0.4667 | 0.5333 | 0.0000 | |||||
| C3 | C33 | 6.9 | 0.0000 | 0.2000 | 0.8000 | 0.0000 | ||||
| C34 | 8.1 | 0.0000 | 0.0000 | 0.7000 | 0.3000 | 0.0000 | 0.1621 | 0.7847 | 0.0532 | |
| C35 | 7.1 | 0.0000 | 0.1333 | 0.8667 | 0.0000 | |||||
| C36 | 6.4 | 0.0000 | 0.3667 | 0.6333 | 0.0000 | |||||
| C37 | 7.2 | 0.0000 | 0.1000 | 0.9000 | 0.0000 | |||||
| C41 | 7.9 | 0.0000 | 0.0000 | 0.8000 | 0.2000 | |||||
| C42 | 7.6 | 0.0000 | 0.0000 | 0.9500 | 0.0500 | 0.0000 | 0.0285 | 0.9810 | 0.0617 | |
| C4 | C43 | 7.5 | 0.0000 | 0.0000 | 1.0000 | 0.0000 | ||||
| C44 | 7.2 | 0.0000 | 0.1000 | 0.9000 | 0.0000 | |||||
| 0.0000 | 0.1941 | 0.7739 | 0.0320 | |||||||
Publisher’s Note: MDPI stays neutral with regard to jurisdictional claims in published maps and institutional affiliations. |
© 2022 by the authors. Licensee MDPI, Basel, Switzerland. This article is an open access article distributed under the terms and conditions of the Creative Commons Attribution (CC BY) license (https://creativecommons.org/licenses/by/4.0/).
Share and Cite
Wang, A.; Yang, Y.; Sun, S.; Zuo, Y.; Wang, Z.; Sun, H. Developing an Evaluation Model to Measure the Intelligence Level of Smart Industrial Parks. Buildings 2022, 12, 1533. https://doi.org/10.3390/buildings12101533
Wang A, Yang Y, Sun S, Zuo Y, Wang Z, Sun H. Developing an Evaluation Model to Measure the Intelligence Level of Smart Industrial Parks. Buildings. 2022; 12(10):1533. https://doi.org/10.3390/buildings12101533
Chicago/Turabian StyleWang, Ailing, Yixin Yang, Shaonan Sun, Yiming Zuo, Zhihui Wang, and Haili Sun. 2022. "Developing an Evaluation Model to Measure the Intelligence Level of Smart Industrial Parks" Buildings 12, no. 10: 1533. https://doi.org/10.3390/buildings12101533