1. Introduction
In recent years, earthquakes have caused a lot of damage to structures and buildings in the country. There are different ways to deal with this problem, and in the last few decades, paying attention to the design of structures based on performance as one of the newest approaches has been welcomed by the scientific engineering community [
1,
2,
3,
4].
In 2021, Marco Zucca et al. presented a proposed framework to optimise the tuned mass damper (TMD) design. First, linear time-history analyses were carried out to determine the structural improvements in top displacement, base shear, and bending moment. In the second phase, masonry’s nonlinear behaviour was considered, and a fibre model of the chimney was implemented. Finally, pushover analyses were performed to obtain the structure’s capacity curve and evaluate the TMD’s performance. The linear and nonlinear analysis results revealed the effectiveness of the proposed TMD design procedure for slender masonry structures [
4].
Different ways can be mentioned to control these forces, for example, increasing the strength and stiffness of the structure or increasing the flexibility. In addition, it prevents inelastic deformations that occur in structures. One of the essential principles proposed in design based on performance at present is using structural fuses in controlling seismic forces [
5]. During the design and execution of the structure, a part of it should be designed so that most of the seismic forces enter this part and the desired member provides both the necessary plasticity for the structure and the forces to depreciate the system. One of the newest methods for using these members is yielding dampers [
6,
7,
8]. These dampers are steel devices that can dissipate energy in an earthquake due to the effects of non-elastic changes in steel. These dampers are released during loading, and as a result, they consume a large amount of energy input to the structure. Different types of these dampers were made and tested, each of which has its advantages and disadvantages [
9,
10].
The influence of partial composite action between the concrete slab and steel beam and of partial-strength connections on the seismic response of composite frames is essential. In 2009, experimental tests were carried out at the National Technical University of Athens Laboratory. The specimens, one-story one-bay moment-resisting structures with steel–concrete composite beams, were tested under base acceleration on the shaking table. Experimental results demonstrated that for different degrees of partial interaction between the slab and the beam, the response of the specimens varied significantly. Samples with intermediate and low shear connection degrees showed the most favourable performance regarding ductile behaviour and energy dissipation. The slip between the slab and the beam interface contributed to the energy dissipated by the system, and the ductility demands decreased on other parts, such as the beam ends and the joints. Numerical results confirmed the experimental conclusions and revealed that using intermediate and low shear connection degrees with partial-strength joints results in a practical seismic design [
11,
12,
13].
In 2020, Hamid Ghorbani et al. investigated a novel double slip loads friction damper to control the seismic response of structures. This study investigated the performance of a proposed friction damper with two slip loads in controlling the seismic response of steel moment-resisting building structures under moderate and intense earthquake excitations.
The results demonstrate the efficiency of the proposed DSL dampers in effectively reducing the seismic response of the structures in terms of story drifts, residual drifts, absolute floor accelerations, and base shear forces compared to the conventional single slip load friction dampers [
14,
15].
In 2020, NM Mirzai et ell; investigated the behaviour of steel dampers under cyclic loads. In this research, as compared to many other dampers, this new damper is of low cost, and its assembling requires a simple technology. In order to evaluate the performance of the damper, four different cases were considered. Furthermore, the effect of each component was investigated in each case, and a finite element analysis was performed under cyclic loading using the ABAQUS platform. The ultimate capacity of a friction damper is 500 KN; however, in the shear steel polyurethane friction damper, it is only about 300 KN [
16].
One of the latest types of yielding dampers is box dampers, which, due to their simple shape, can be used very effectively in buildings equipped with bracing systems. These dampers perform well during seismic loading, primarily when combined with eccentrical or chevron braces. Since the weakness of bracing systems is their poor performance during cyclic loads, if the energy caused by loading can be transferred from the braces to these dampers during operation, we can expect a much better performance.
This research proposes a box damper as a suitable solution for seismic control of structures. This damper, which is an improved example of the shear panel damper, can provide proper usability and proper performance at the same time. This damper consists of one or more square steel flat plates that are placed inside a steel box section. By placing the panel inside this part, due to the simple geometry of the square box, it is possible to easily connect this member to the structure through welding or screws. Furthermore, preliminary research on the seismic performance of this system has shown its stable and suitable conditions in connection with the structure. For this purpose, this tool was chosen as a convenient tool for seismic control of the structure.
In the bracing system, the braces buckle and yield after a severe earthquake; therefore, the bracing system does not work as a lateral earthquake system after buckling. Thus, the existence of a system that can properly direct the absorption of energy in an earthquake is felt. Incorporating an energy-dissipater element in the braces is one of the novel approaches to increasing the ductility of the braces. This study aimed to assess the influence of design parameters related to the energy absorption device on the seismic response of EBFs.
2. Verification
The sample studied in validation was selected from experimental works (Deng et al., 2014) [
17]. It is a yielding steel damper proposed by researchers for use in the foundations of bridges. This damper is placed in the place of the support that can consume a large amount of input energy in the condition of structure vibration as an earthquake. The particular shape of this damper, which is a hollow tube filled with an internal diaphragm, is called a box damper. This damper is an improved form of shear panel damper in which buckling is prevented to a large extent through provisions.
Steel with a yield stress of 225 MPa was used to make the steel diaphragm, where the primary deformation of the damper is concentrated and is responsible for energy absorption. This steel can withstand high tensile strains compared to ordinary steel so that it can withstand a more stable ring in cyclic loading on the damper. Moreover, due to the lower yield stress, it quickly enters the nonlinear stage and can play the role of a ductile member in the structure.
Based on the experimental results, steel materials were defined in the Abaqus software in the first step.
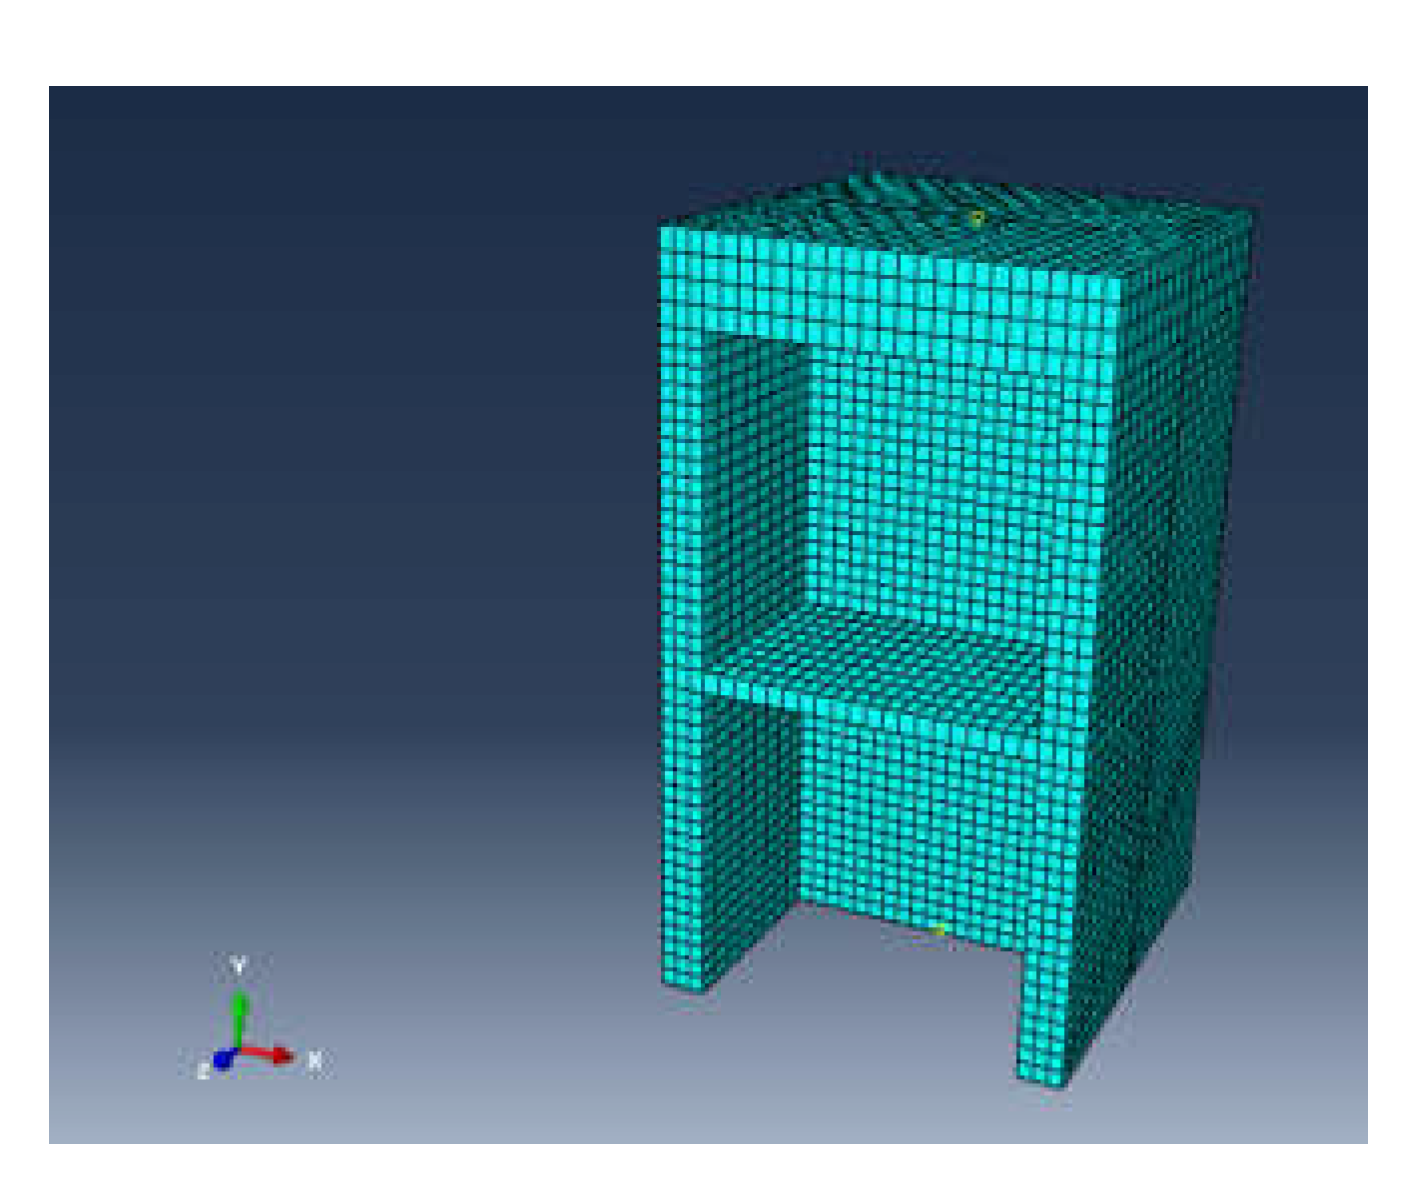
Figure 1 shows the meshed state of the damper in 3D mode. The box damper and connection plates merged, and simulation of the weld was neglected in the current study assuming that failure does not occur in the welds. A fixed boundary condition was applied to one end of the model, while an axial force was applied to the other end to investigate the model’s behaviour. Boundary conditions restrain all degrees of freedom. Three cm mesh size was utilised in the finite element simulation.
In the second step, the diaphragm was surrounded by a steel box. It is possible to provide the boundary conditions around the diaphragm plate to a large extent, significantly reducing the possibility of plate buckling. The bigger the dimensions of this box, the more it can hold and provide better conditions.
In this paper, this dimension was chosen after modelling a box damper with different sizes, and the best time history curve was investigated:
The thickness of the top plate of the diaphragm is 40 mm;
The thickness of the plate under the diaphragm is 20 mm;
The thickness of the side plates of the diaphragm is 20 mm;
A middle stiffener was used in the middle of the diaphragm and on both sides, and its thickness is 10 mm;
The width of the steel box containing the diaphragm is 200 mm;
The diaphragm plate is 150 mm wide and 300 mm high, and its thickness is 6 mm;
2.1. Loading
The cyclic loading protocol was applied according to the ATC-24 code [
18,
19] to examine the box damper’s performance under cyclic loads. In addition, a displacement-controlled loading calculated based on the yielding displacement of the model was used in the current study.
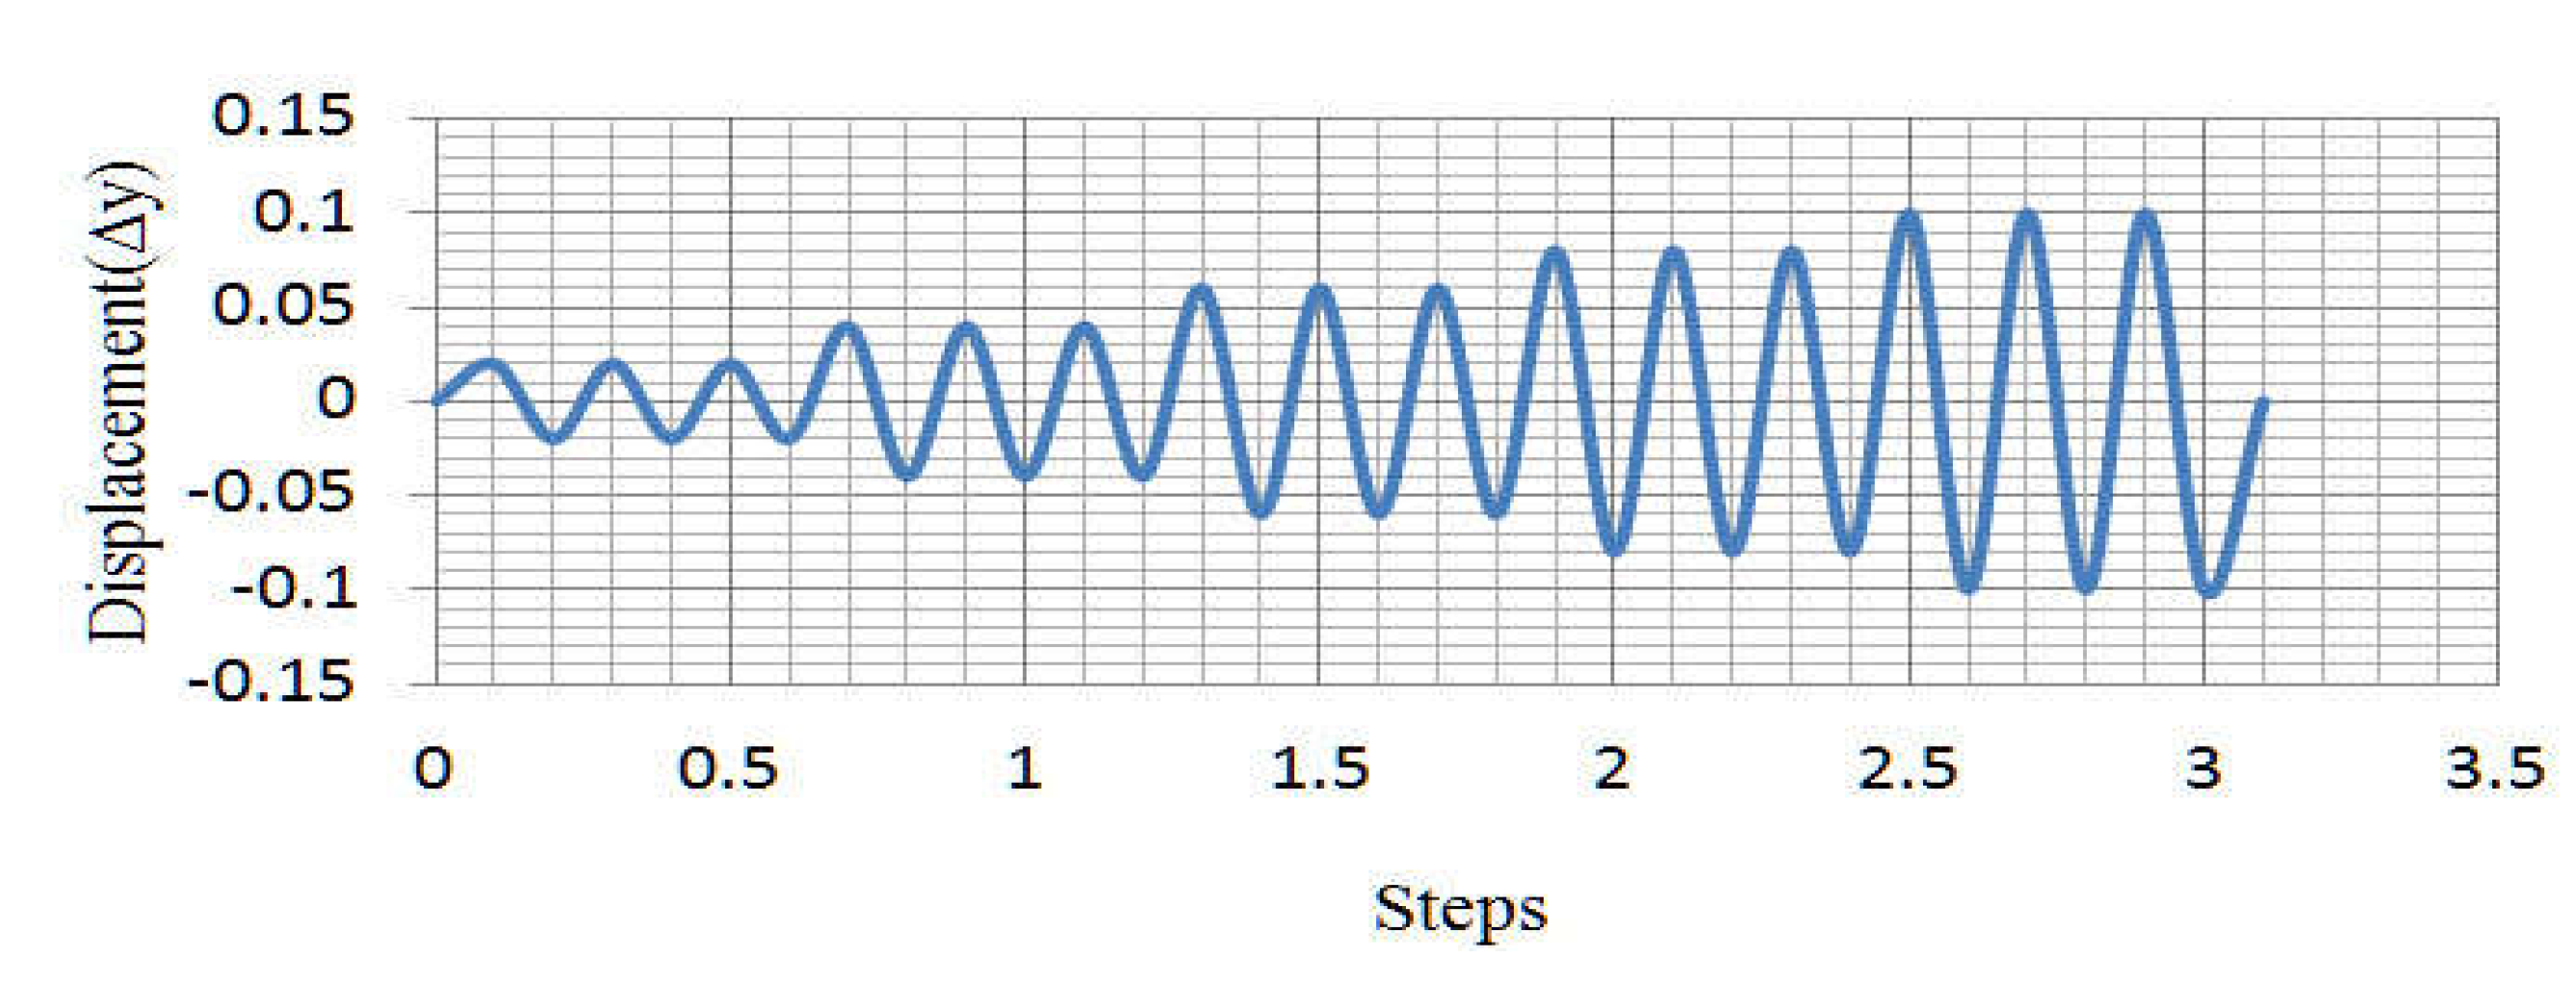
Figure 2 presents the loading sequence applied to the model, where δi is the maximum displacement at its cycle of loading history and ni is the number of cycles with the peak of δi and ∆ yielding displacement of the energy absorbing device [
20,
21].
2.2. Verification Result
After the completion of the analysis performed on the desired sample, the results were examined.
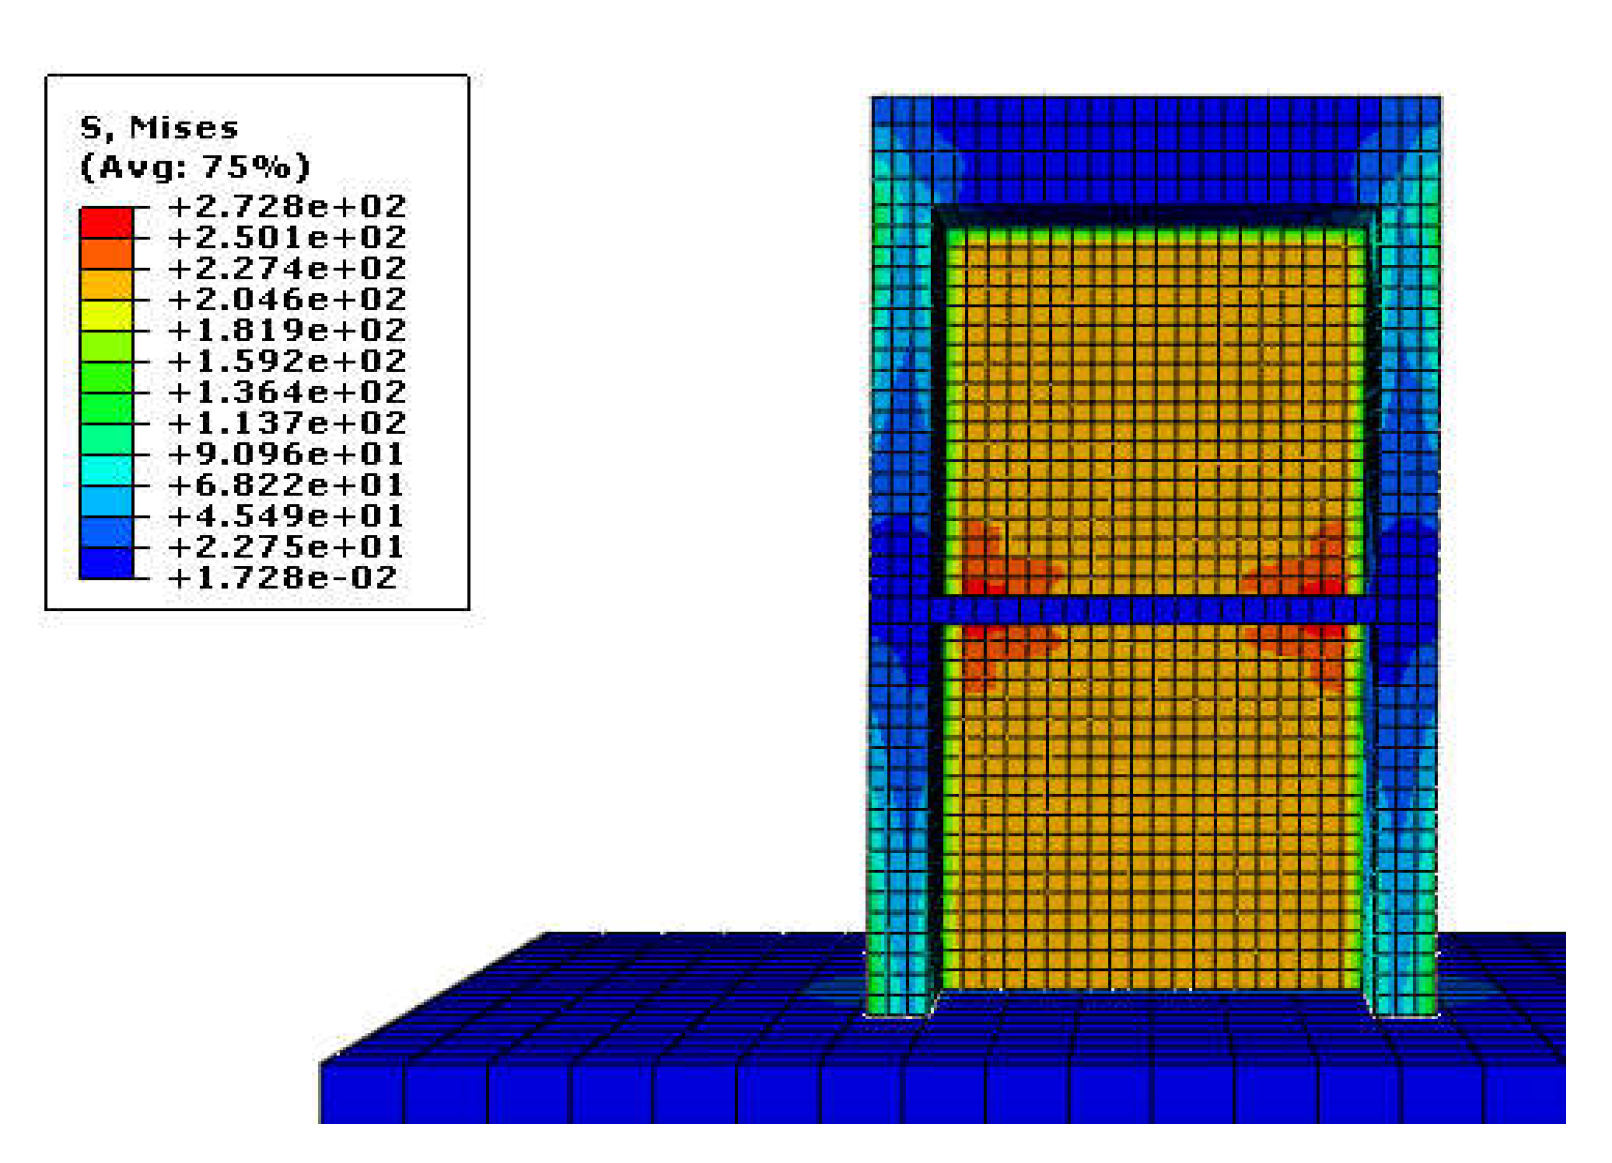
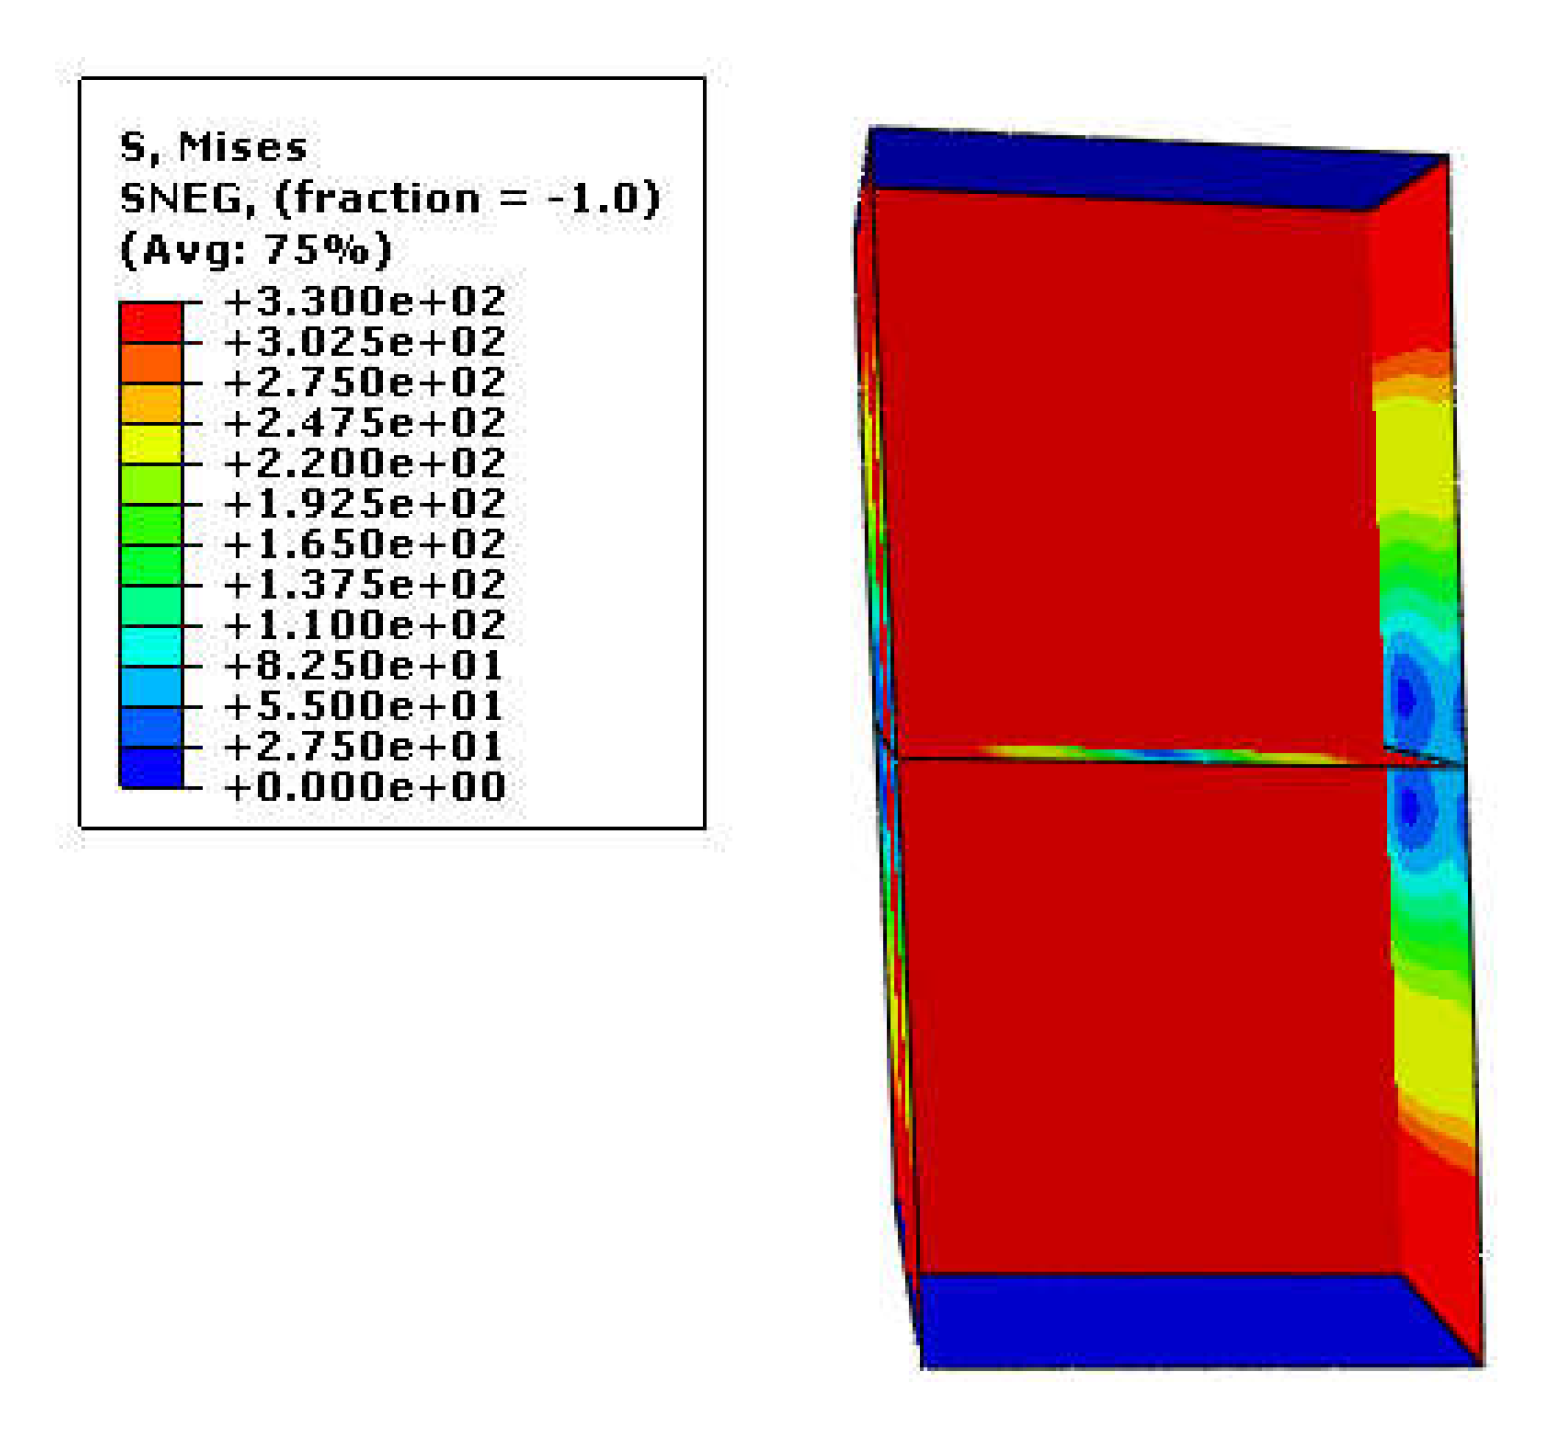
Figure 3 shows the tension created in the damper in the ratio between the experimental sample and the analytical model.
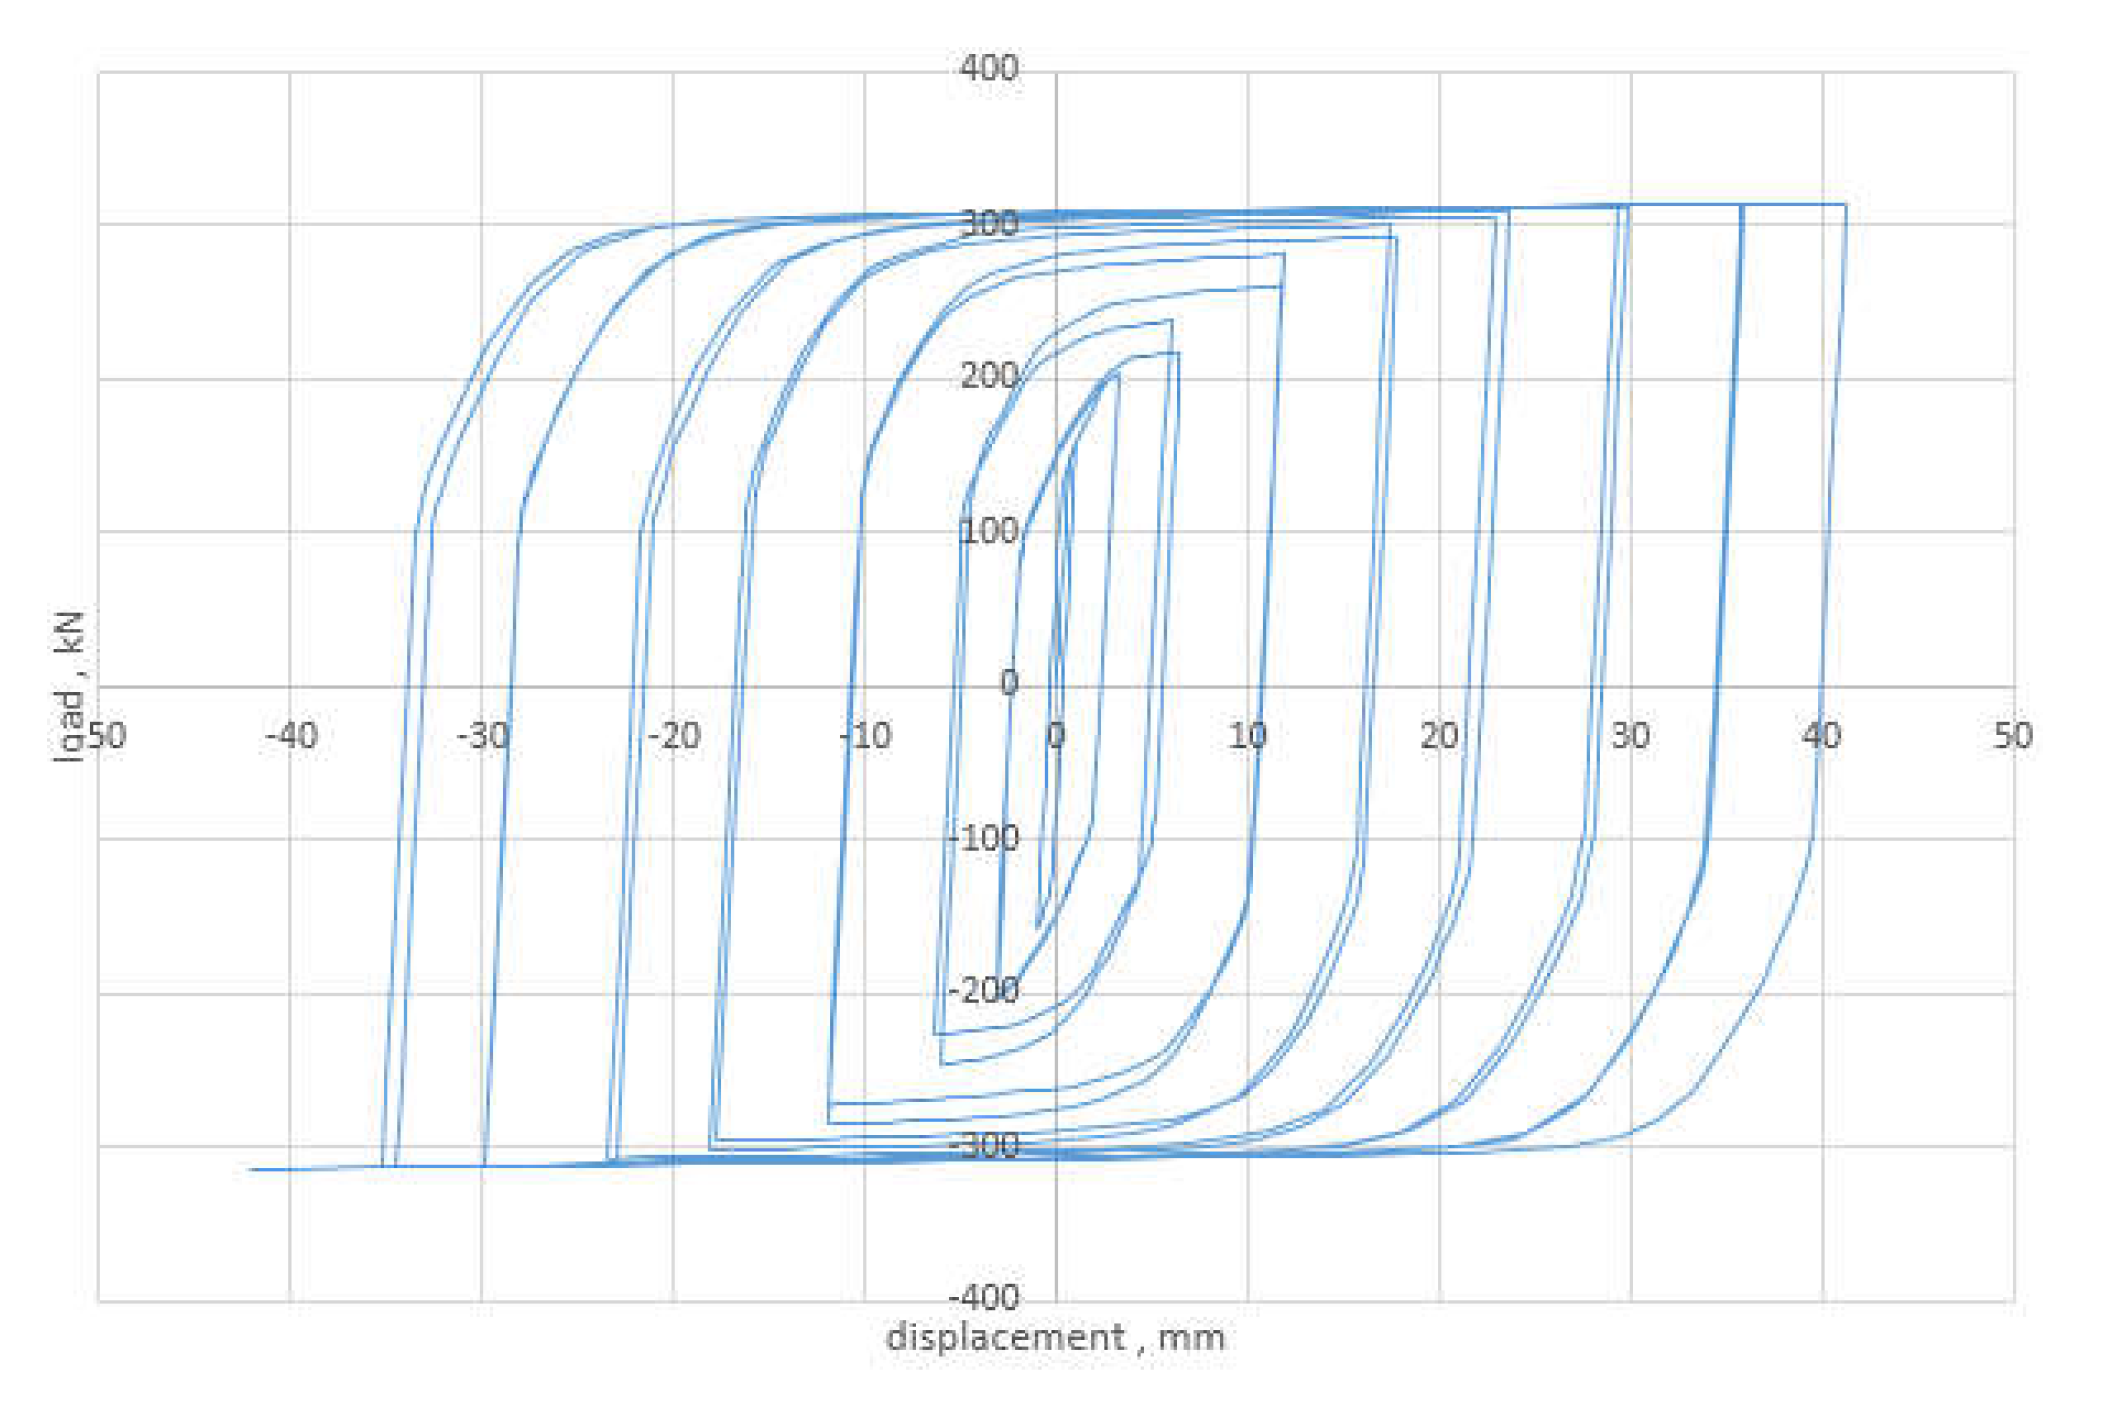
The load–displacement in finite element analysis is shown in
Figure 4. The model was pushed until the peak strain in the model reached the ultimate strain. As a result, the system’s maximum displacement and corresponding displacement at the end of the tensile elastic limit are 40.16 mm and 2.89 mm, respectively. On the other hand, the parameters mentioned above under the compression force were 35.93 mm and 3.09 mm, respectively. Moreover, the maximum tension and compression force sustained by the model were 305.74 kN and 314.99 kN, respectively. Therefore, the ductility of the model in tension and compression can be calculated. These values are expressed for simulation,
is represented the maximum of displacement and
represent the yield displacement of box damper that it’s shown in
Figure 4, such that:
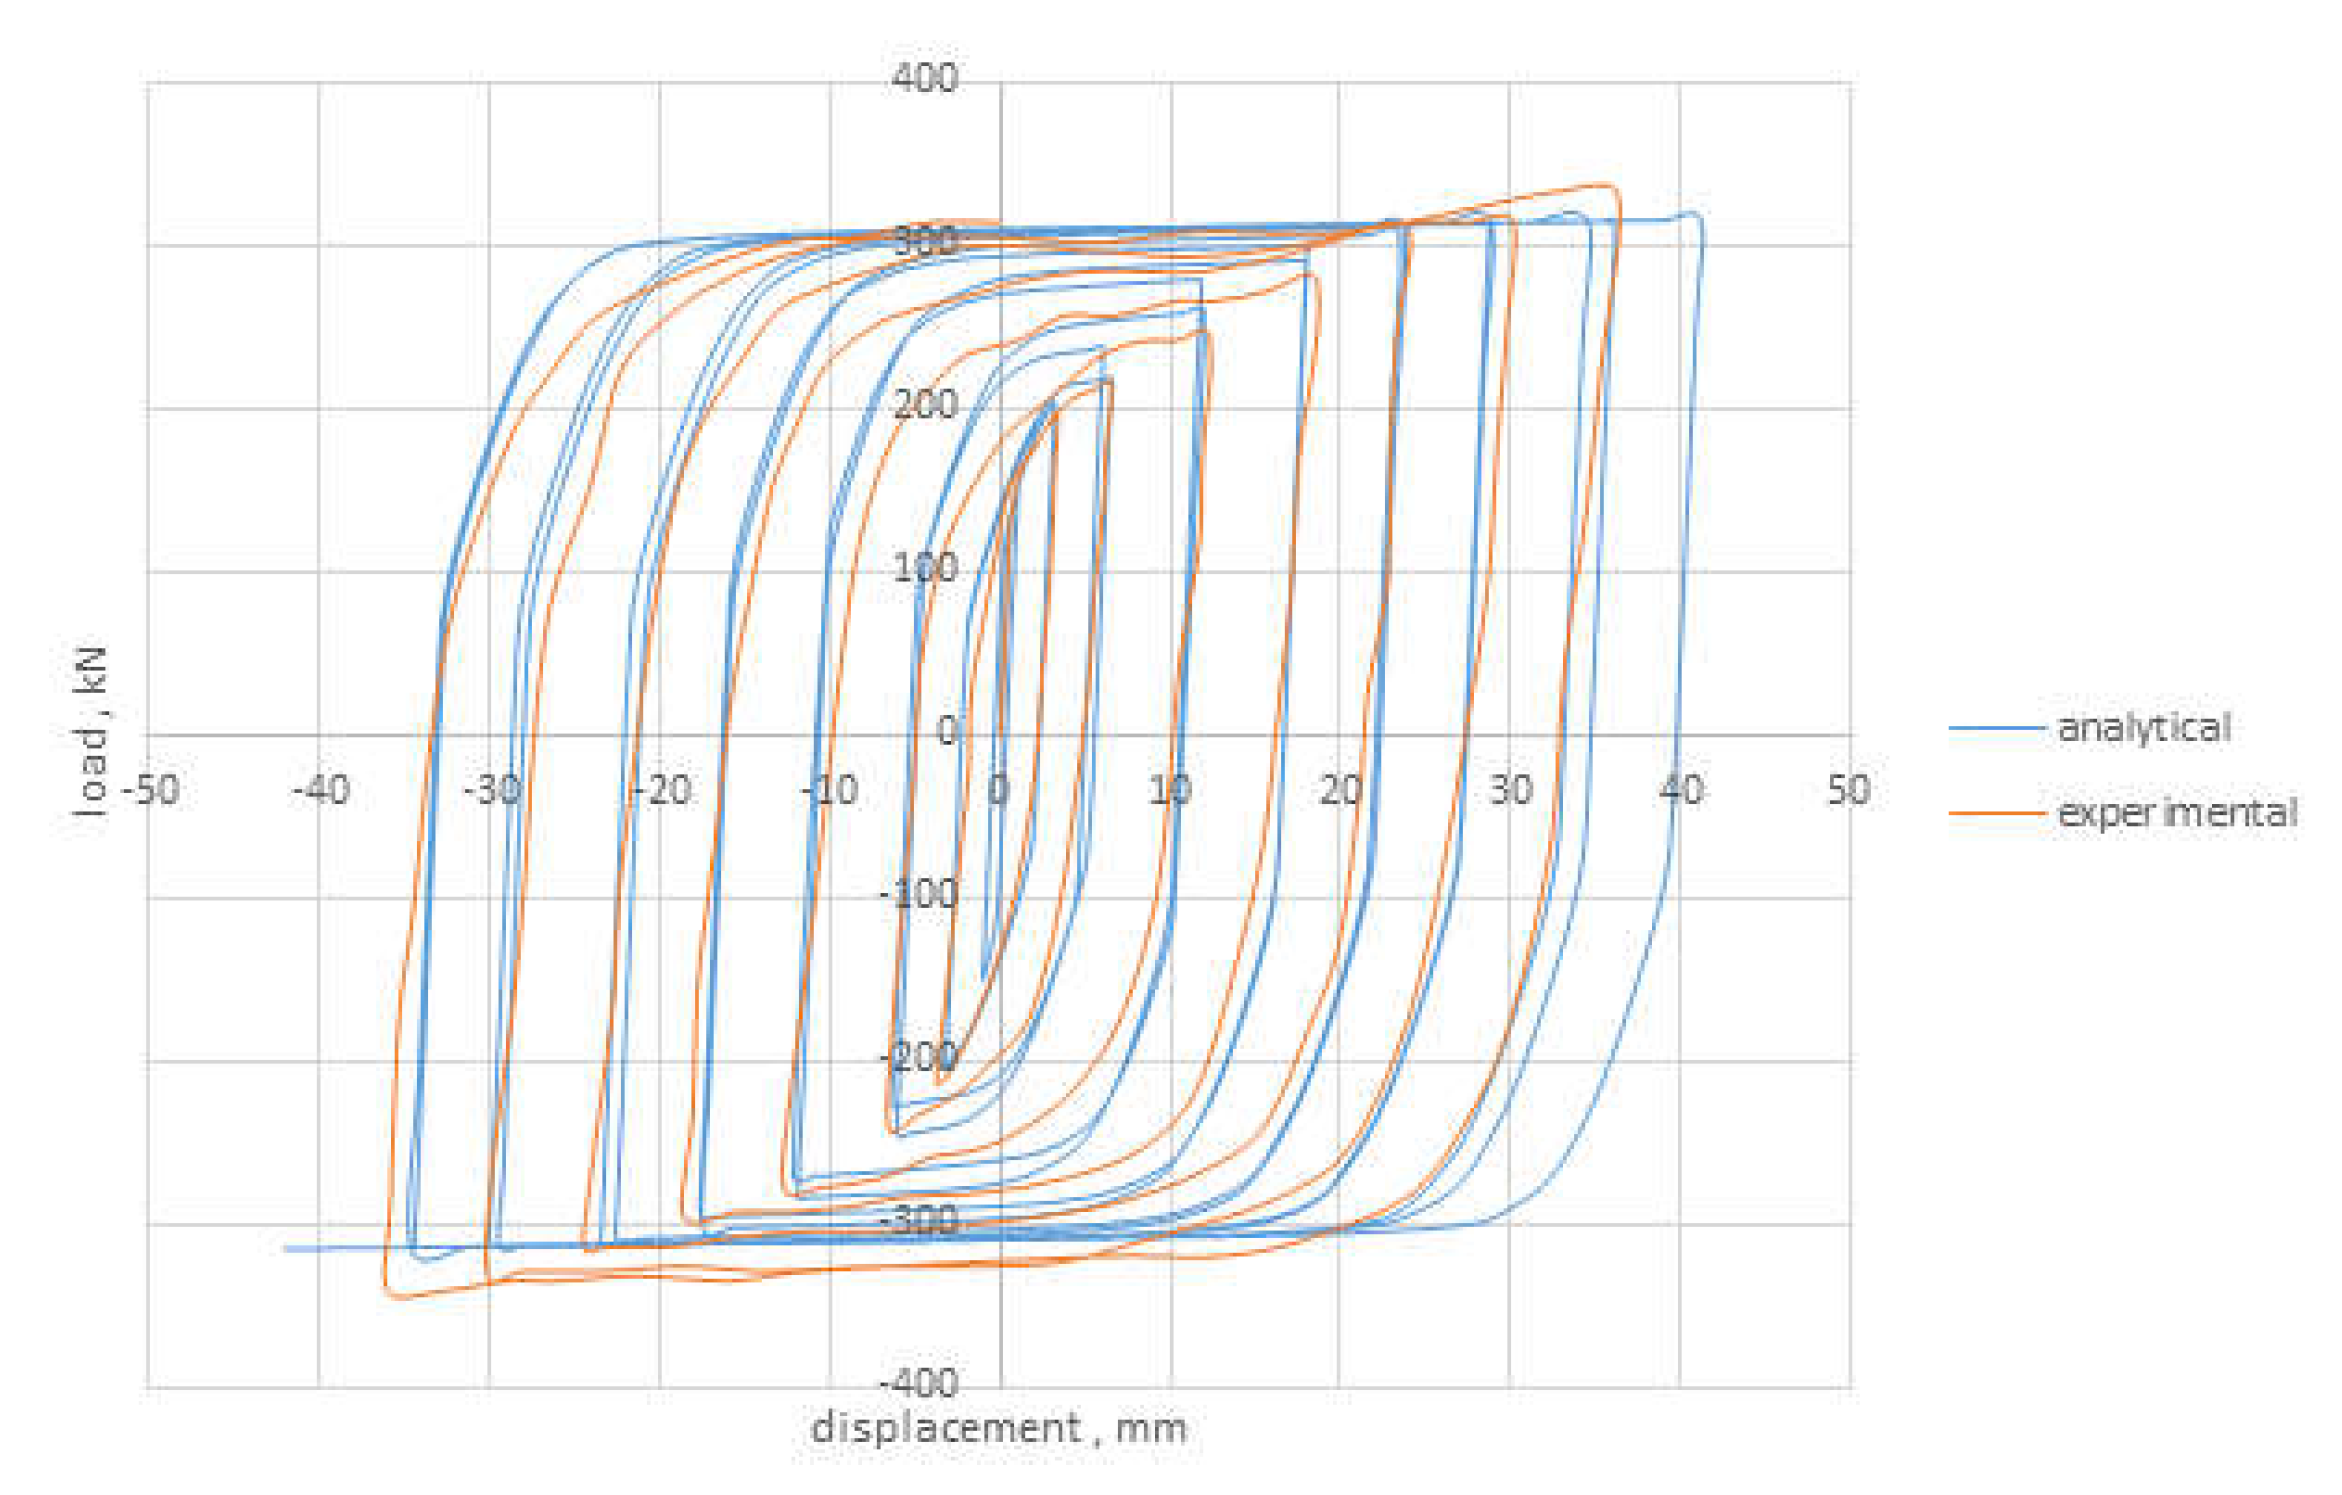
The comparison between the numerical model and the experimental test, provided in
Figure 5, demonstrated that the simulation could successfully predict the behaviour of the box damper, and the results are in good agreement. Simulation results show that the experimental model’s maximum and corresponding displacement at the end of the tensile elastic limit is 36.37 mm and 2.53 mm, respectively. On the other hand, the parameters mentioned above under the compression force were 37.86 mm and 2.95 mm, respectively. Moreover, the maximum tension and compression force sustained by the model were 311.97 kN and 320.01 kN, respectively. Therefore, the ductility of the model in tension and compression can be calculated such that:
3. Main Model
3.1. Sample (BT150, 4 mm)
3.1.1. Examining the Sample (BT150, 4 mm) Individually
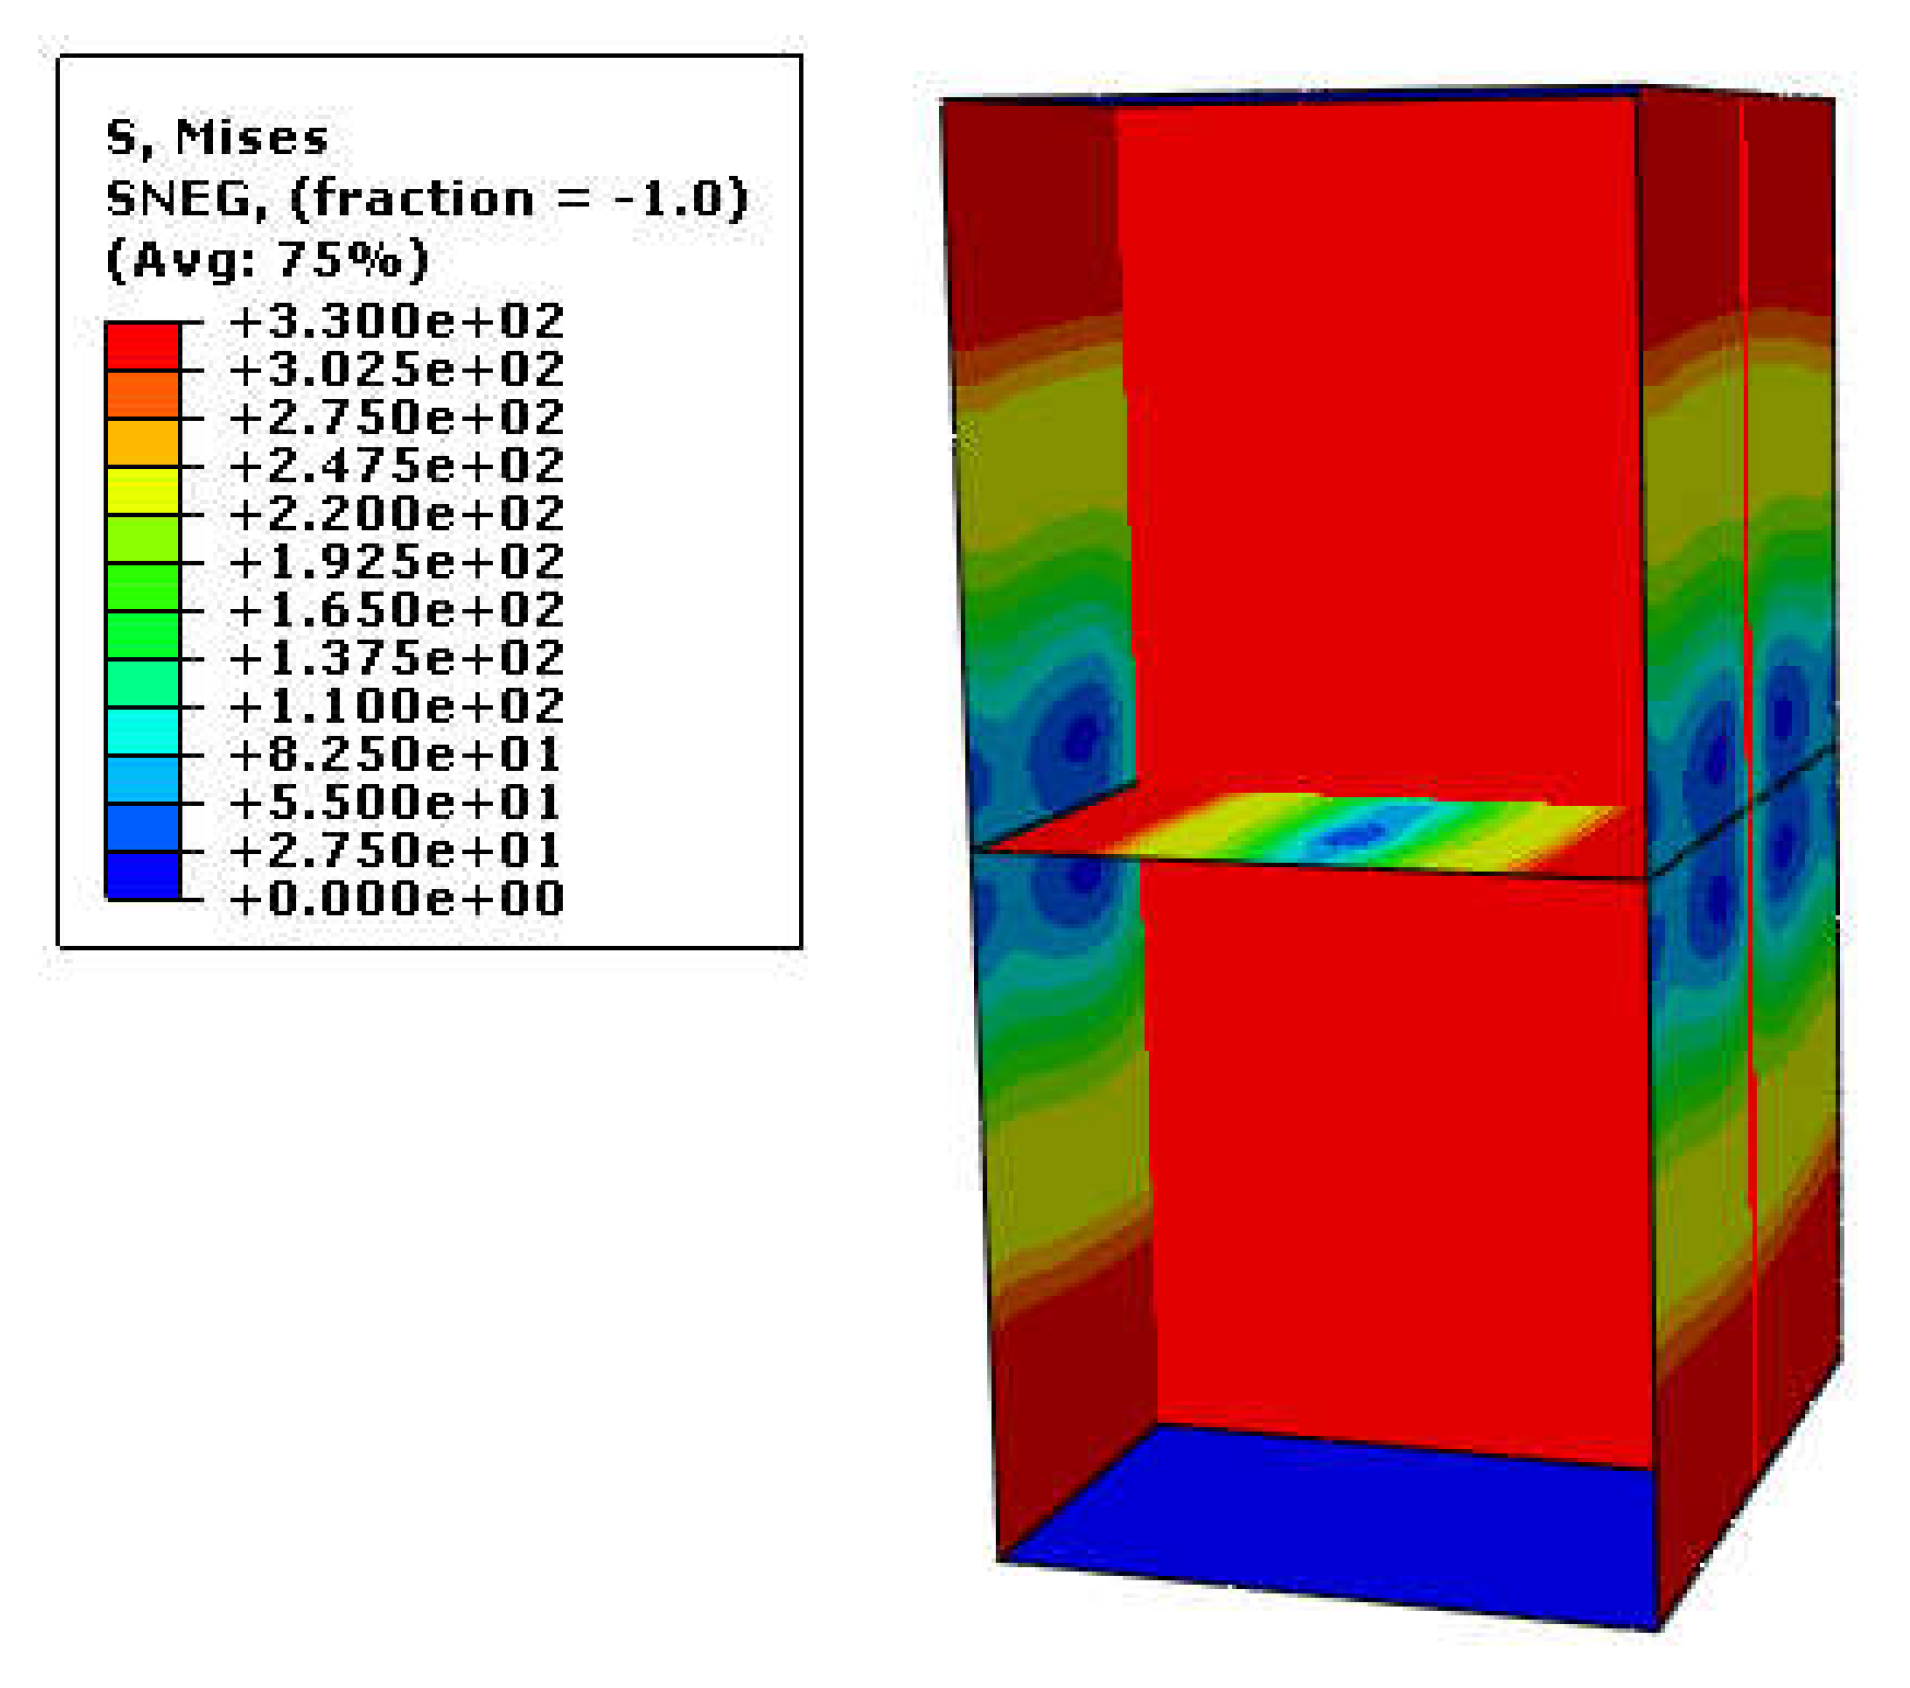
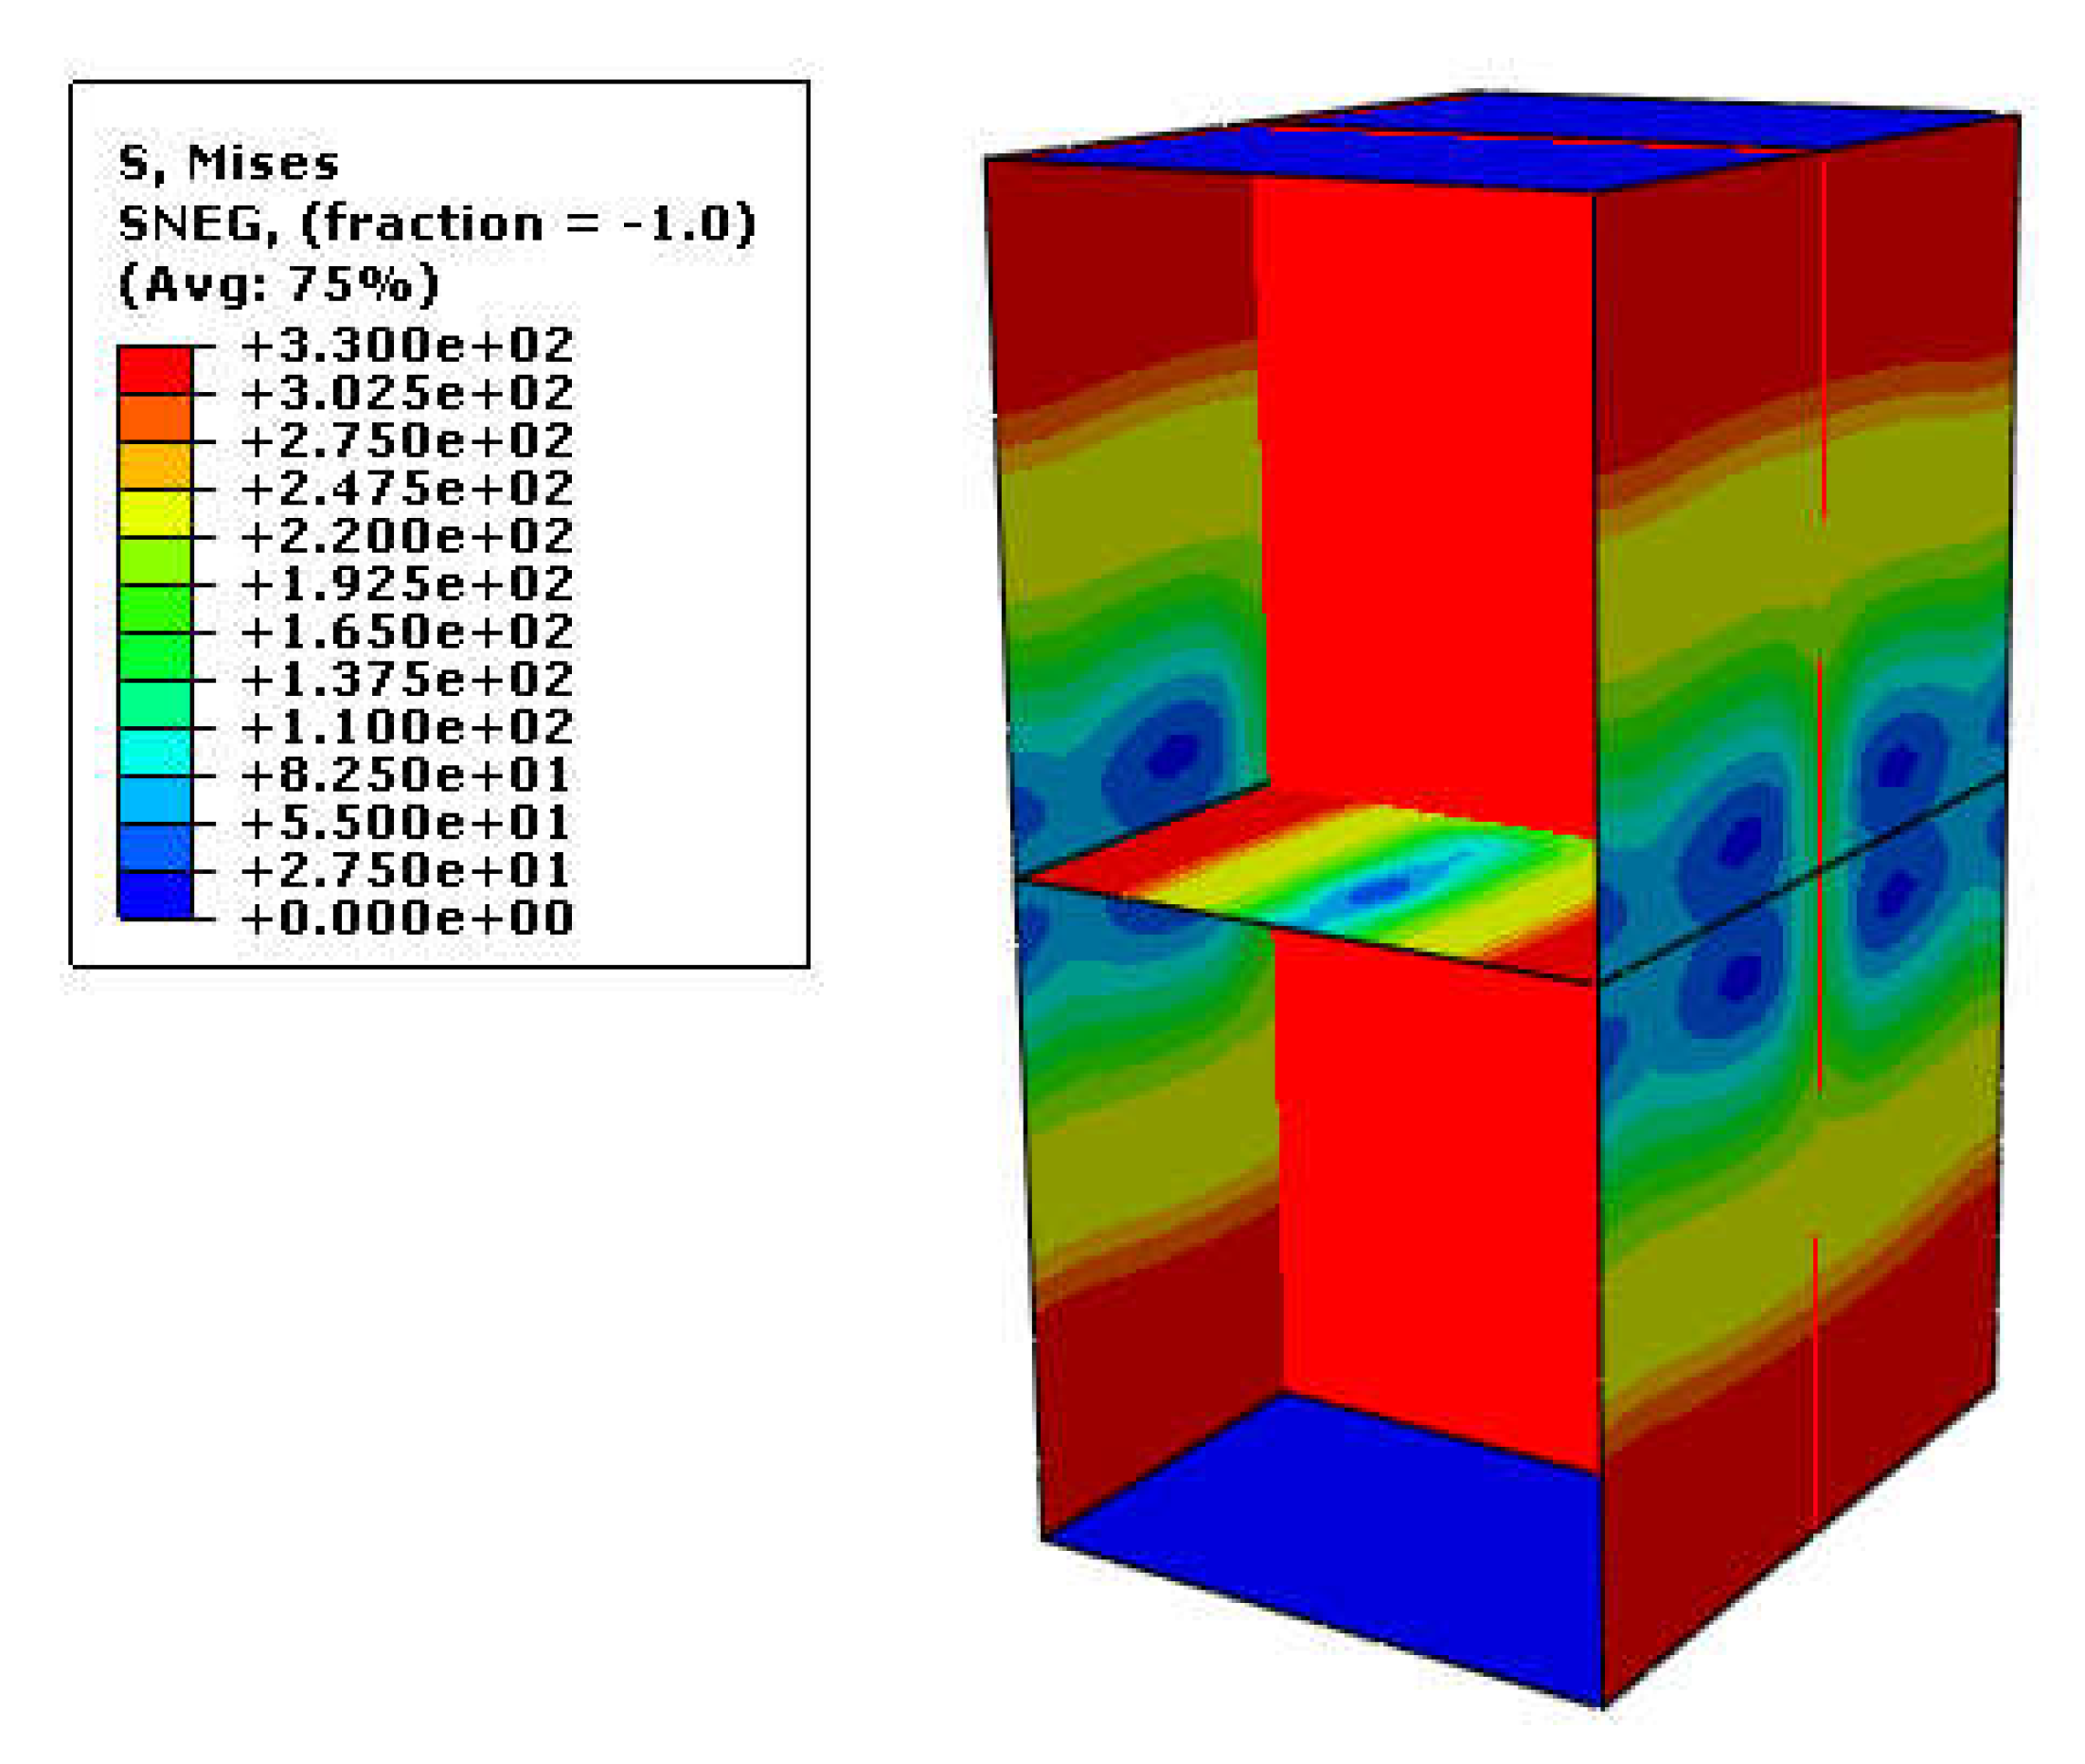
Figure 6 shows the stresses formed in sample BT150, four at the end of loading. In this sample, the characteristics of the damper remain the same, and the thickness of the web plate surrounding the box has increased from 2 mm to 4 mm.
Figure 6 shows the structure of the stresses created in this sample.
The equivalent plastic strain in a material (PEEQ), a scalar variable, was used to represent the material’s inelastic deformation. For porous metal plasticity, PEEQ is the equivalent plastic strain the matrix material defined as
. For cap plasticity, PEEQ provides
(the cap position). For crushable foam plasticity with volumetric hardening, PEEQ gives the volumetric compacting plastic strain defined as
. For crushable foam plasticity with isotropic hardening, PEEQ provides the equivalent plastic strain defined as
, where
is the uniaxial compression yield stress. As it is clear from
Figure 6, the maximum stresses are created in the plate of the web surrounded by box plates. In the next step, some stress concentration can be seen at the edges of the enclosing plates, including the steel box and the stiffener. The stress reaches its minimum value in the middle of the piece, that is, in the upper and lower sides of the damper and in the middle of the vertical sides and the horizontal stiffener. The maximum stress, in this case, is equal to 330 MPa, which shows the yielding stress of steel.
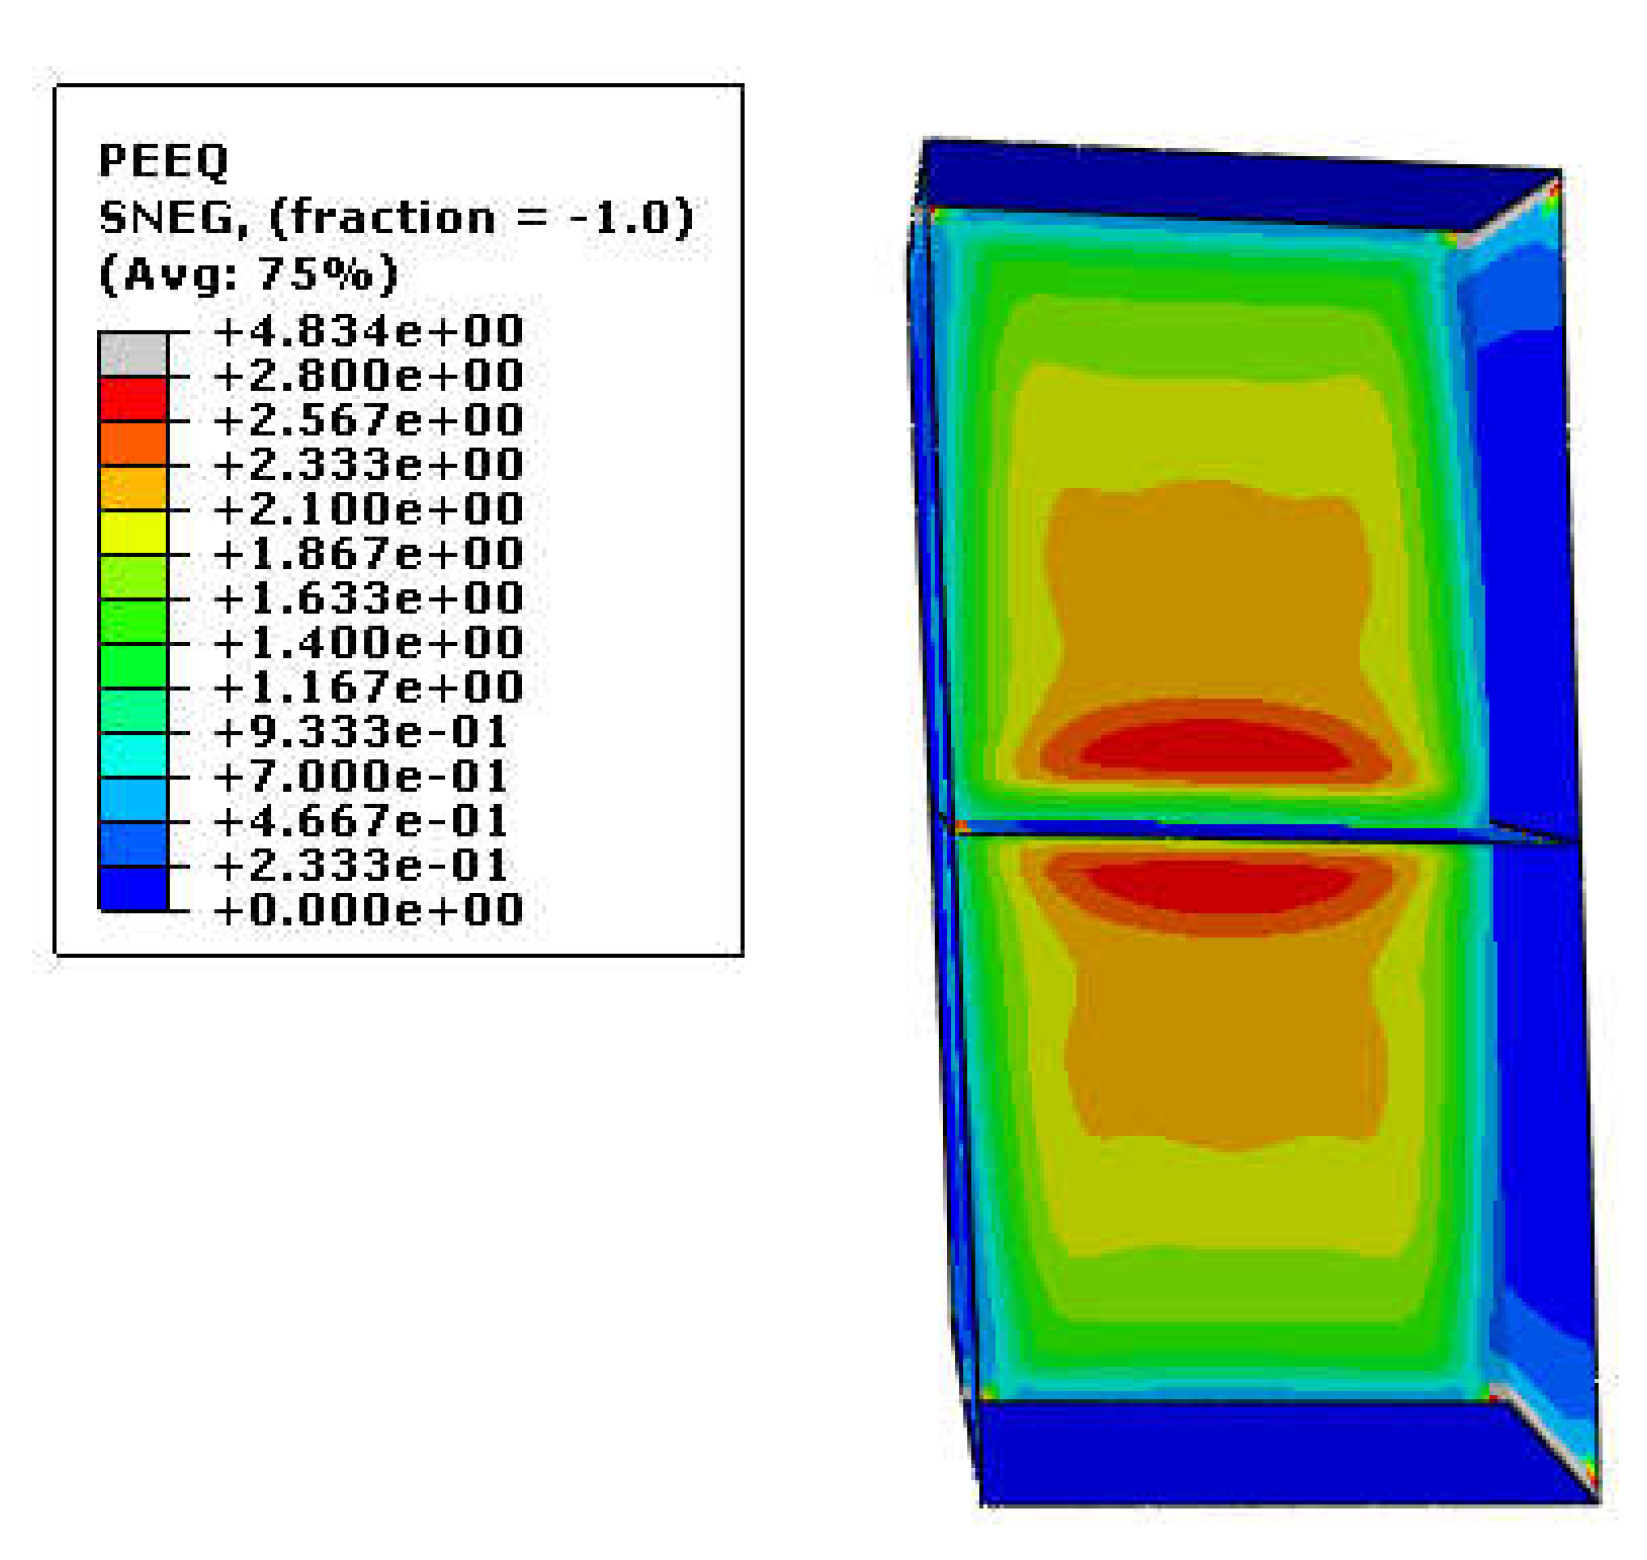
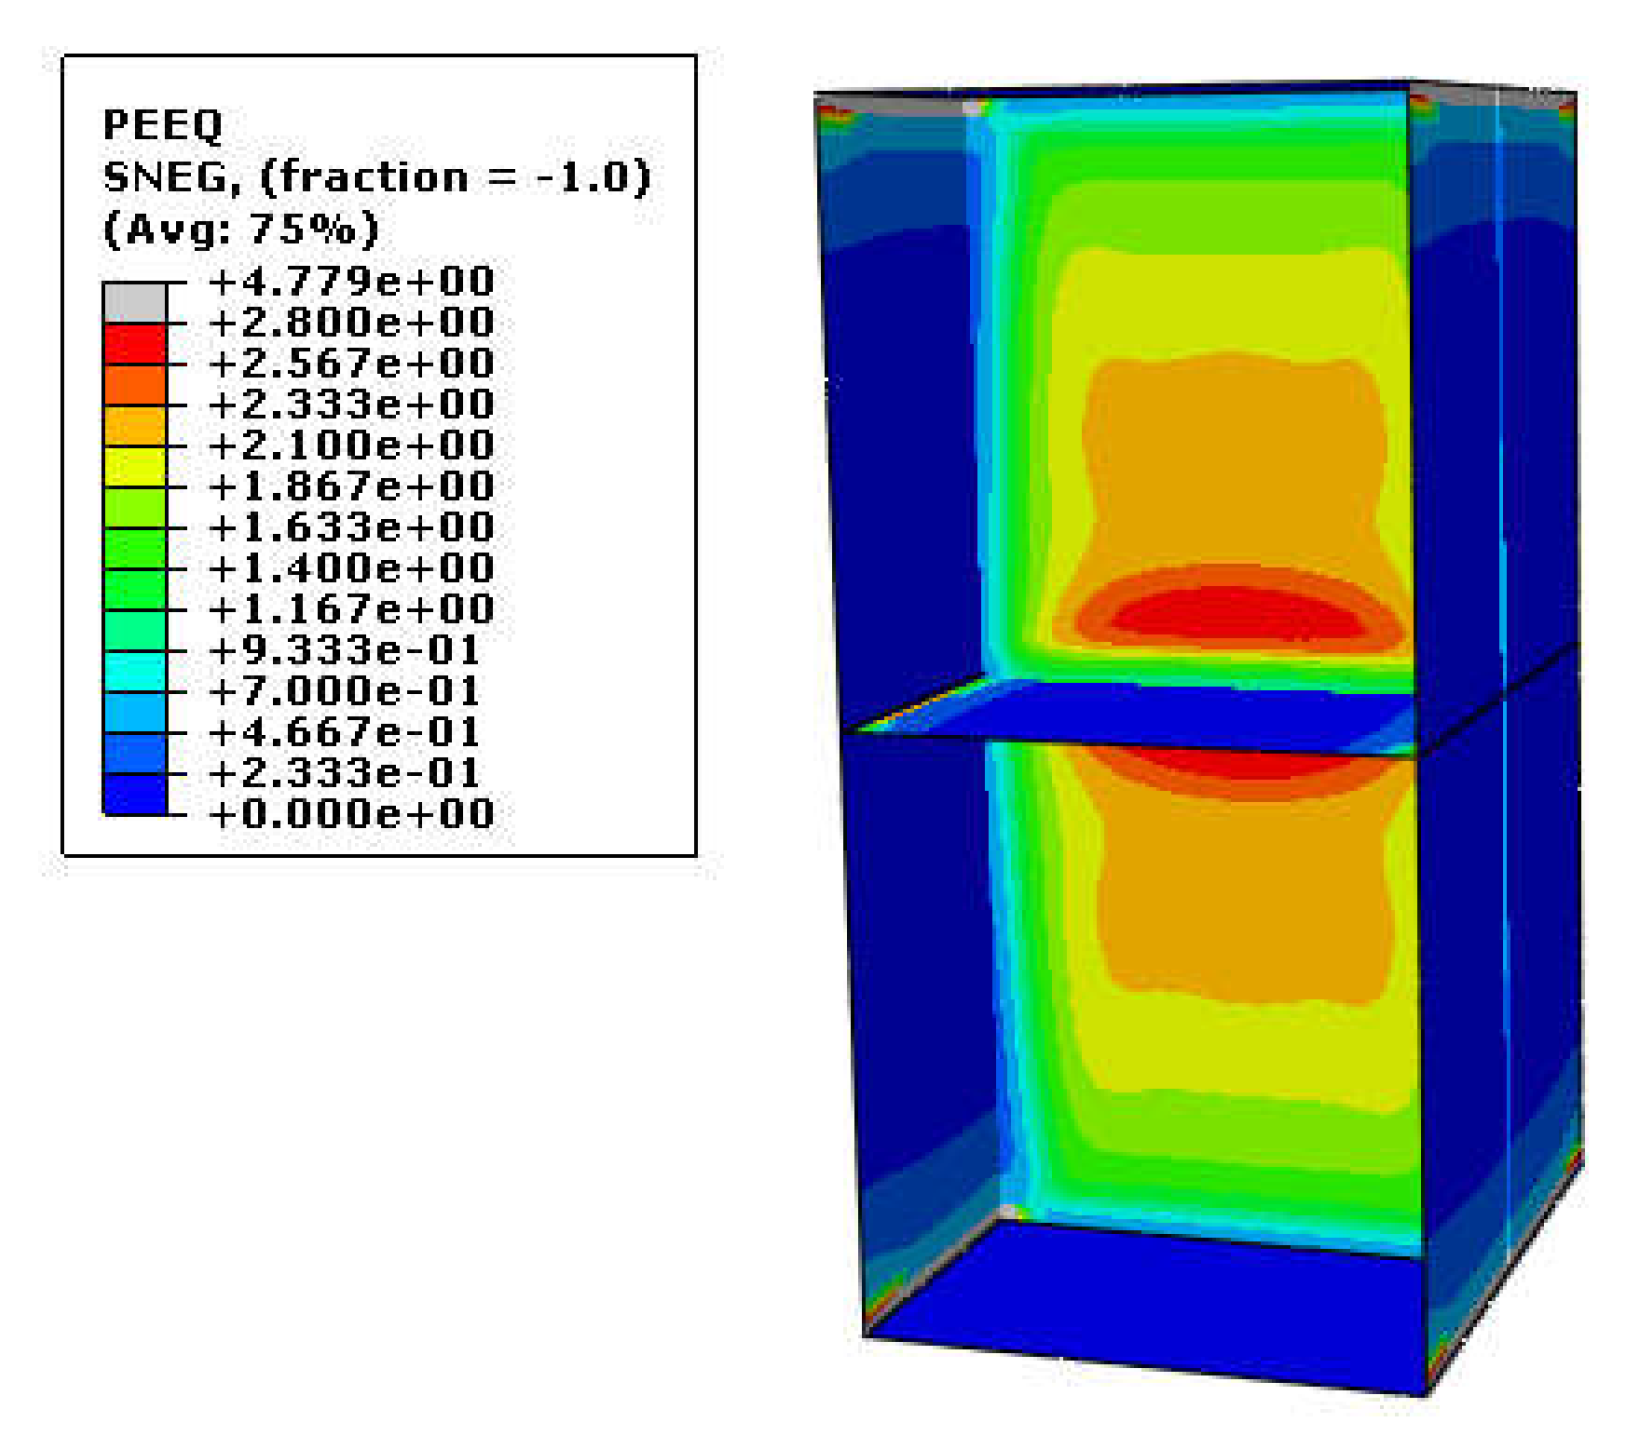
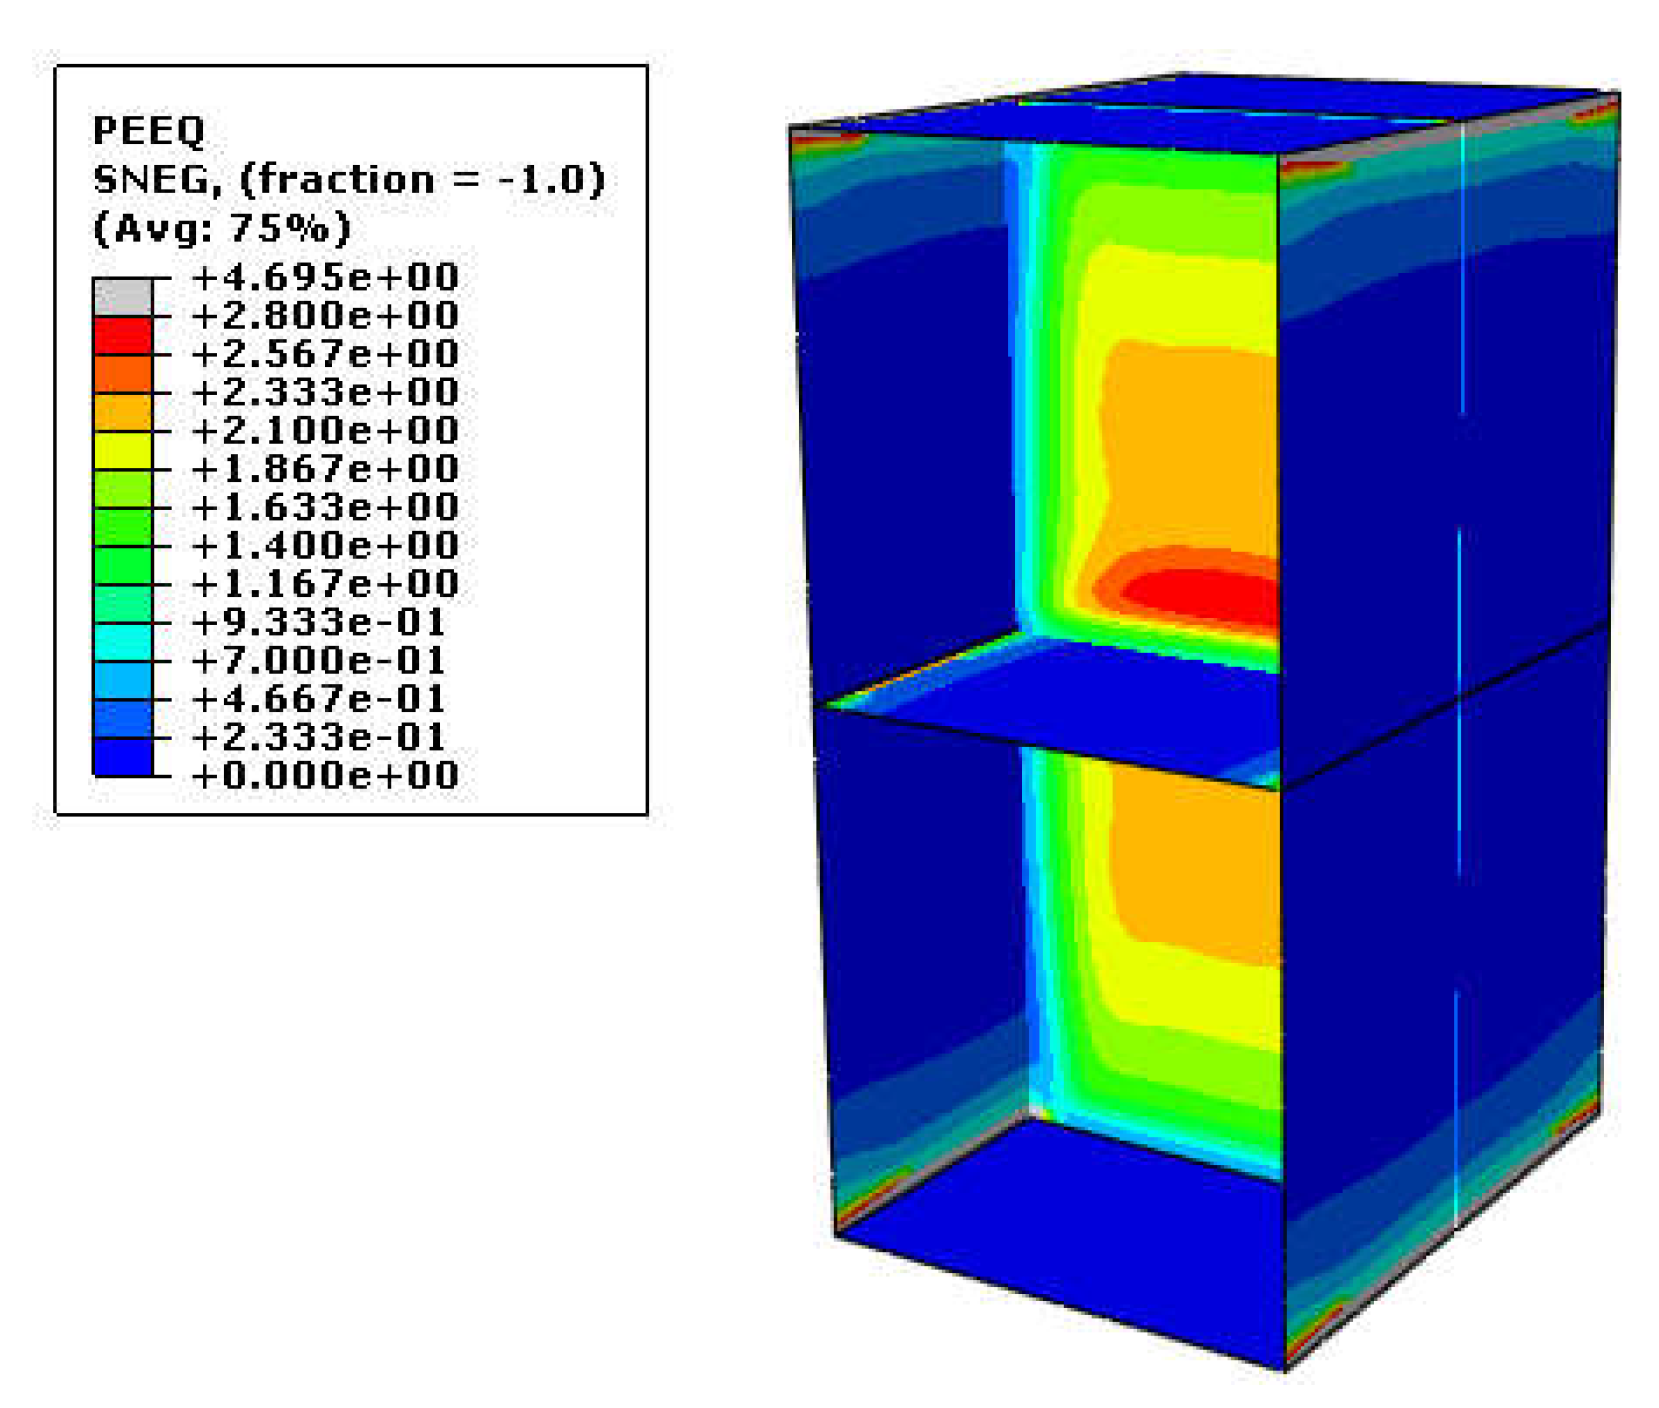
Figure 7 shows the plastic strain in this sample.
As seen in
Figure 7, the structure of plastic strains, in this case, is mainly similar to the previous example. The most hyperplastic deformations occurred in the web plate and on the sides of the stiffener. In the following stages, the strain distribution around the plate increases until it reaches the minimum value at the sides of the enclosing plate. The extensive distribution of strains throughout the web plate shows that this part has yielded in a shearing manner and will absorb a large amount of incoming energy. Of course, in this sample, as in the previous sample, the corners of the connection plate experienced some plastic strain due to stress concentration. It is possible that to prevent breakage in this part of the connection of the plate from the enclosing box, the connection welds must be designed and executed very precisely.
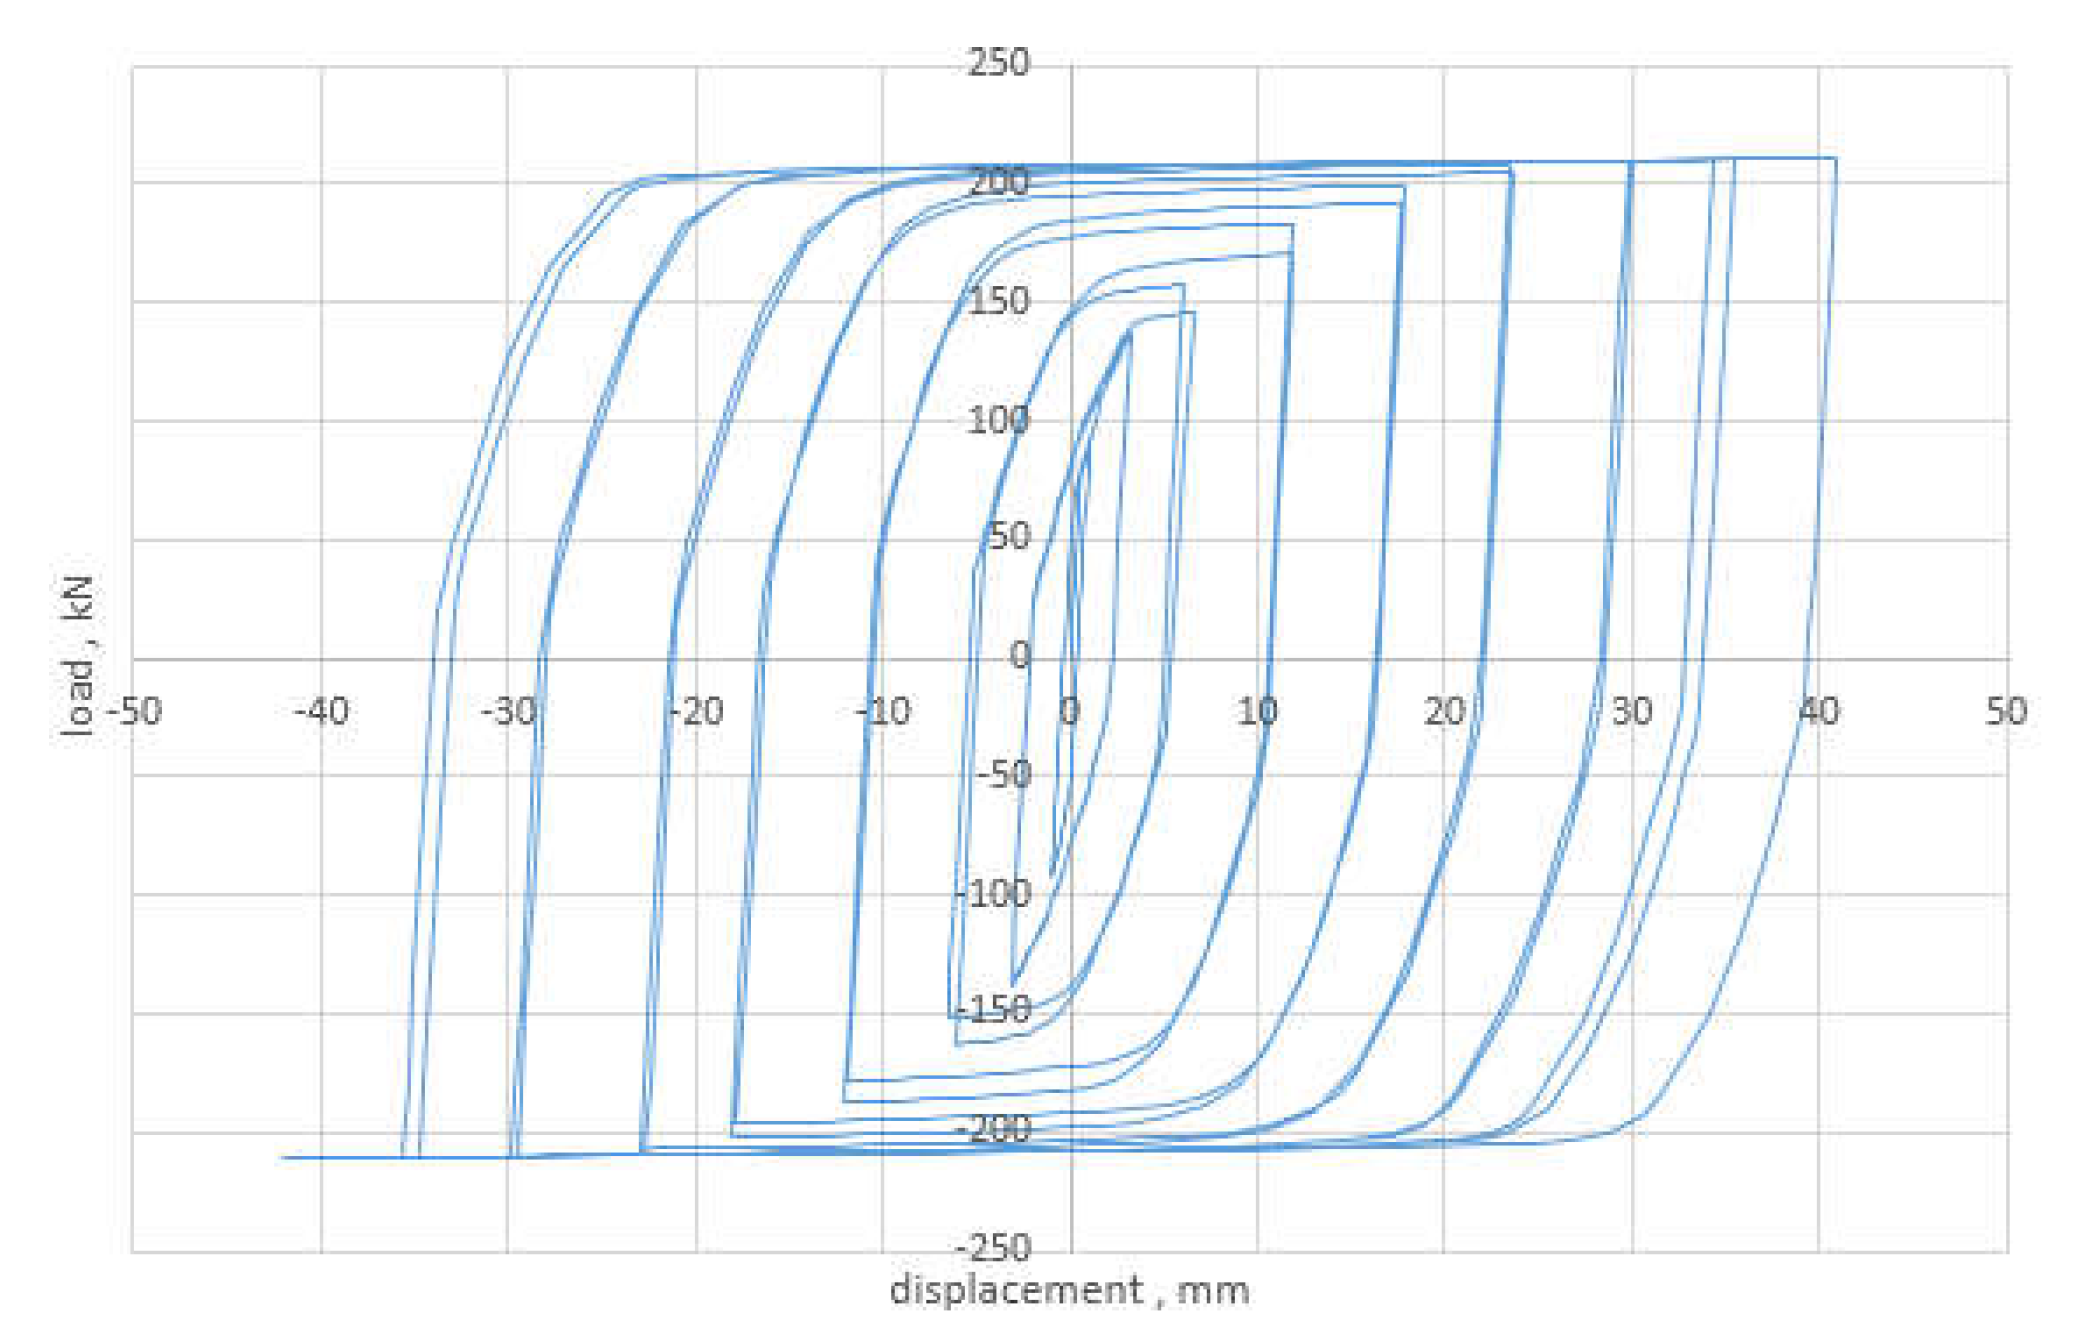
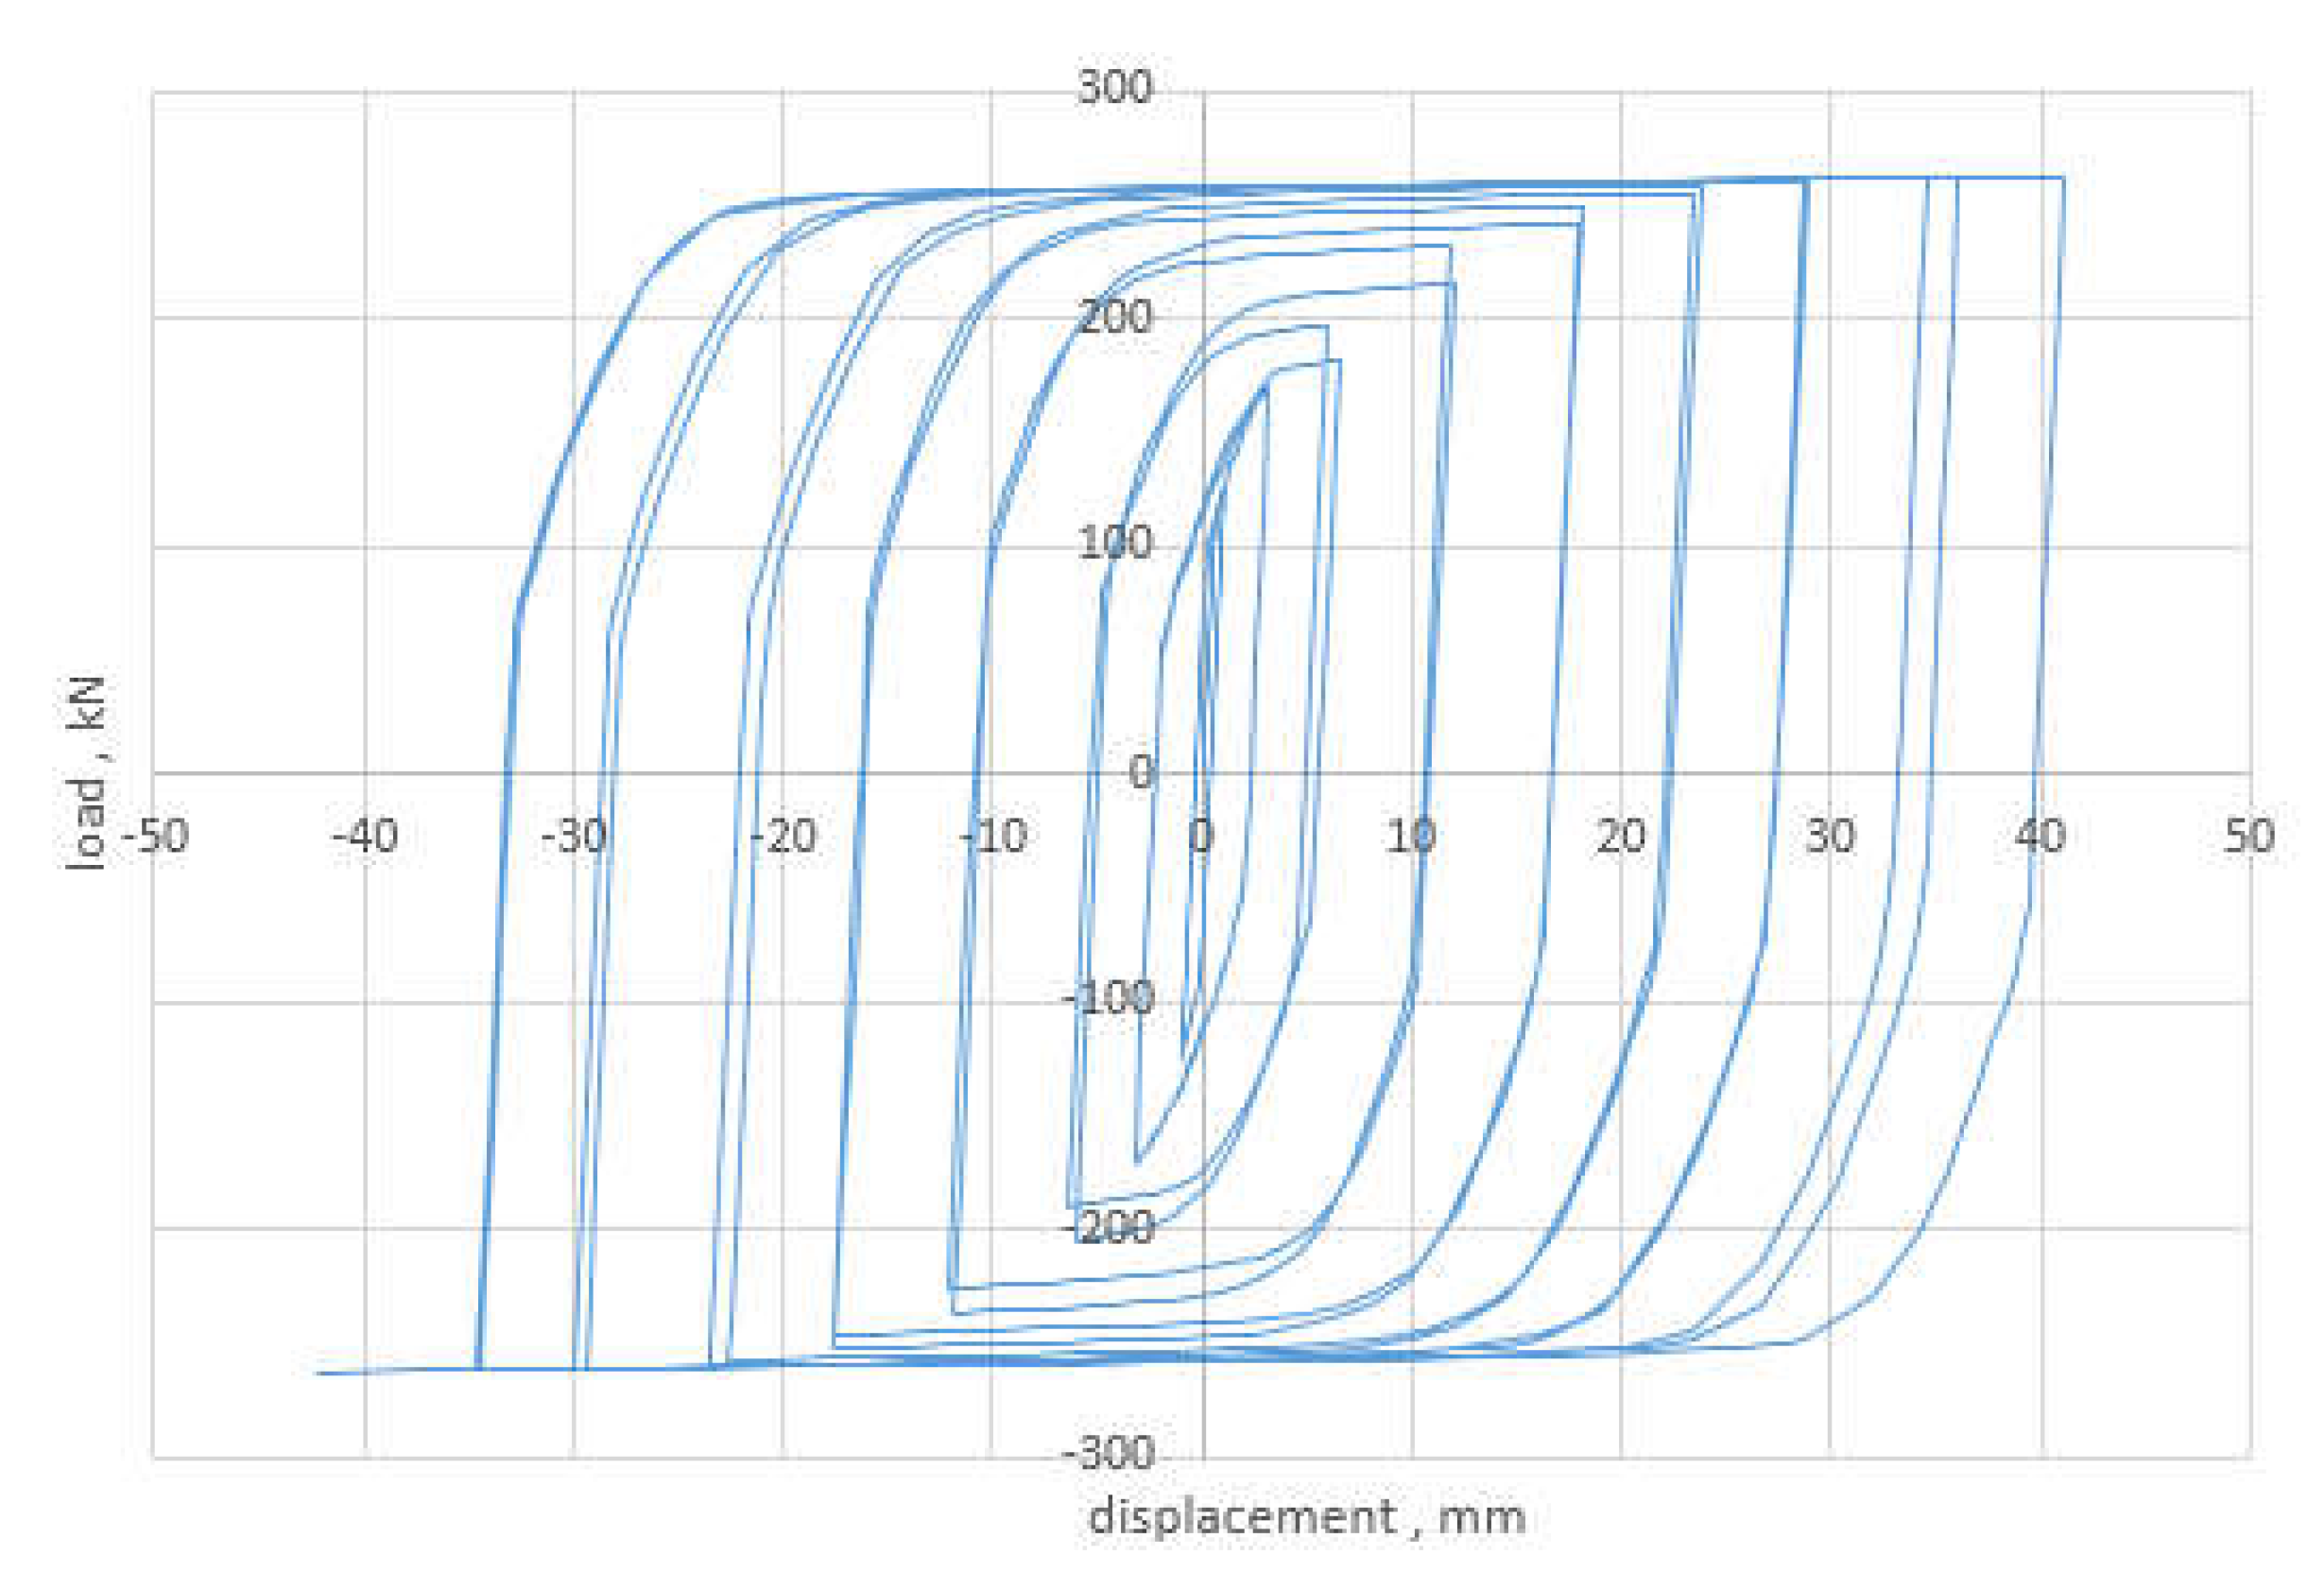
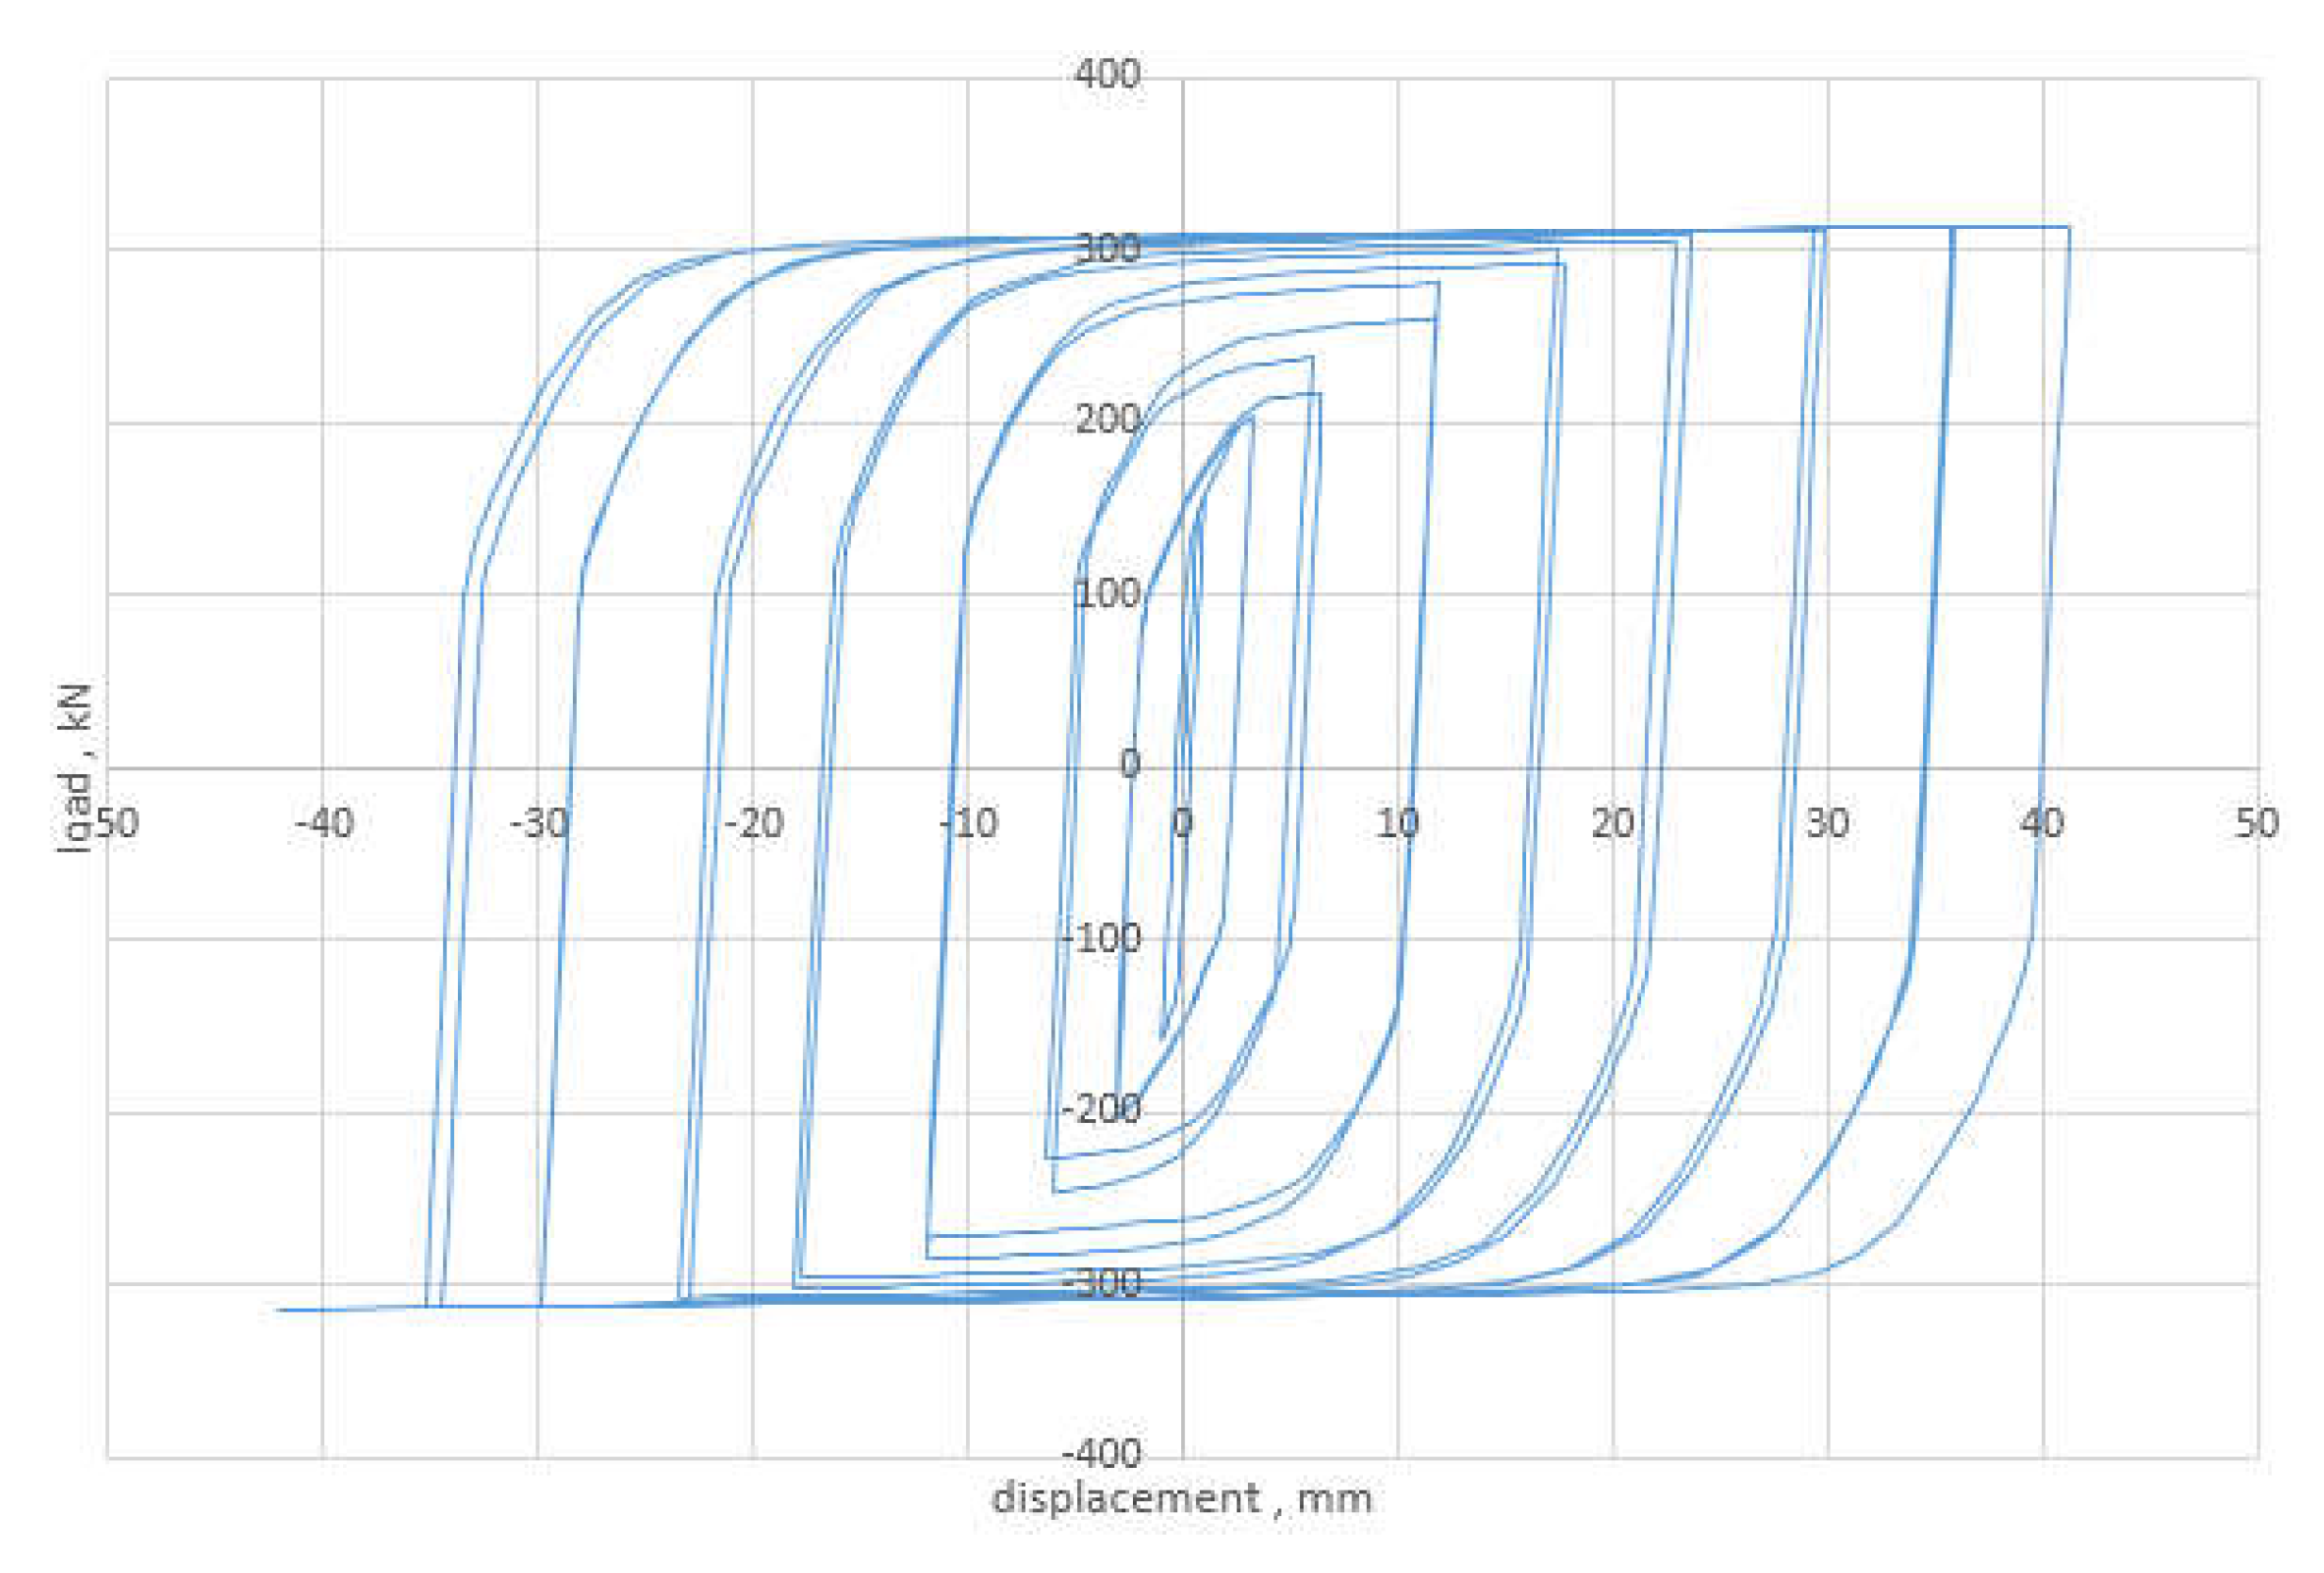
Figure 8 shows the hysteresis diagram resulting from the analysis of this sample in cyclic loading.
As seen in
Figure 8, the behaviour of the damper is entirely stable. However, the deflection at the end of the diagram due to the yielding condition of the plate shows that the damper can consume a large amount of incoming energy and protect the structure against the incoming lateral force. In this case, the maximum displacement applied to the damper is 40 mm, which is 0.15 of the total height of the damper, and it shows that the member has reached its maximum capacity. In this case, the maximum capacity of the structure reached 210 kN, which shows that a suitable resistance was obtained from the structure in proportion to the amount of steel used.
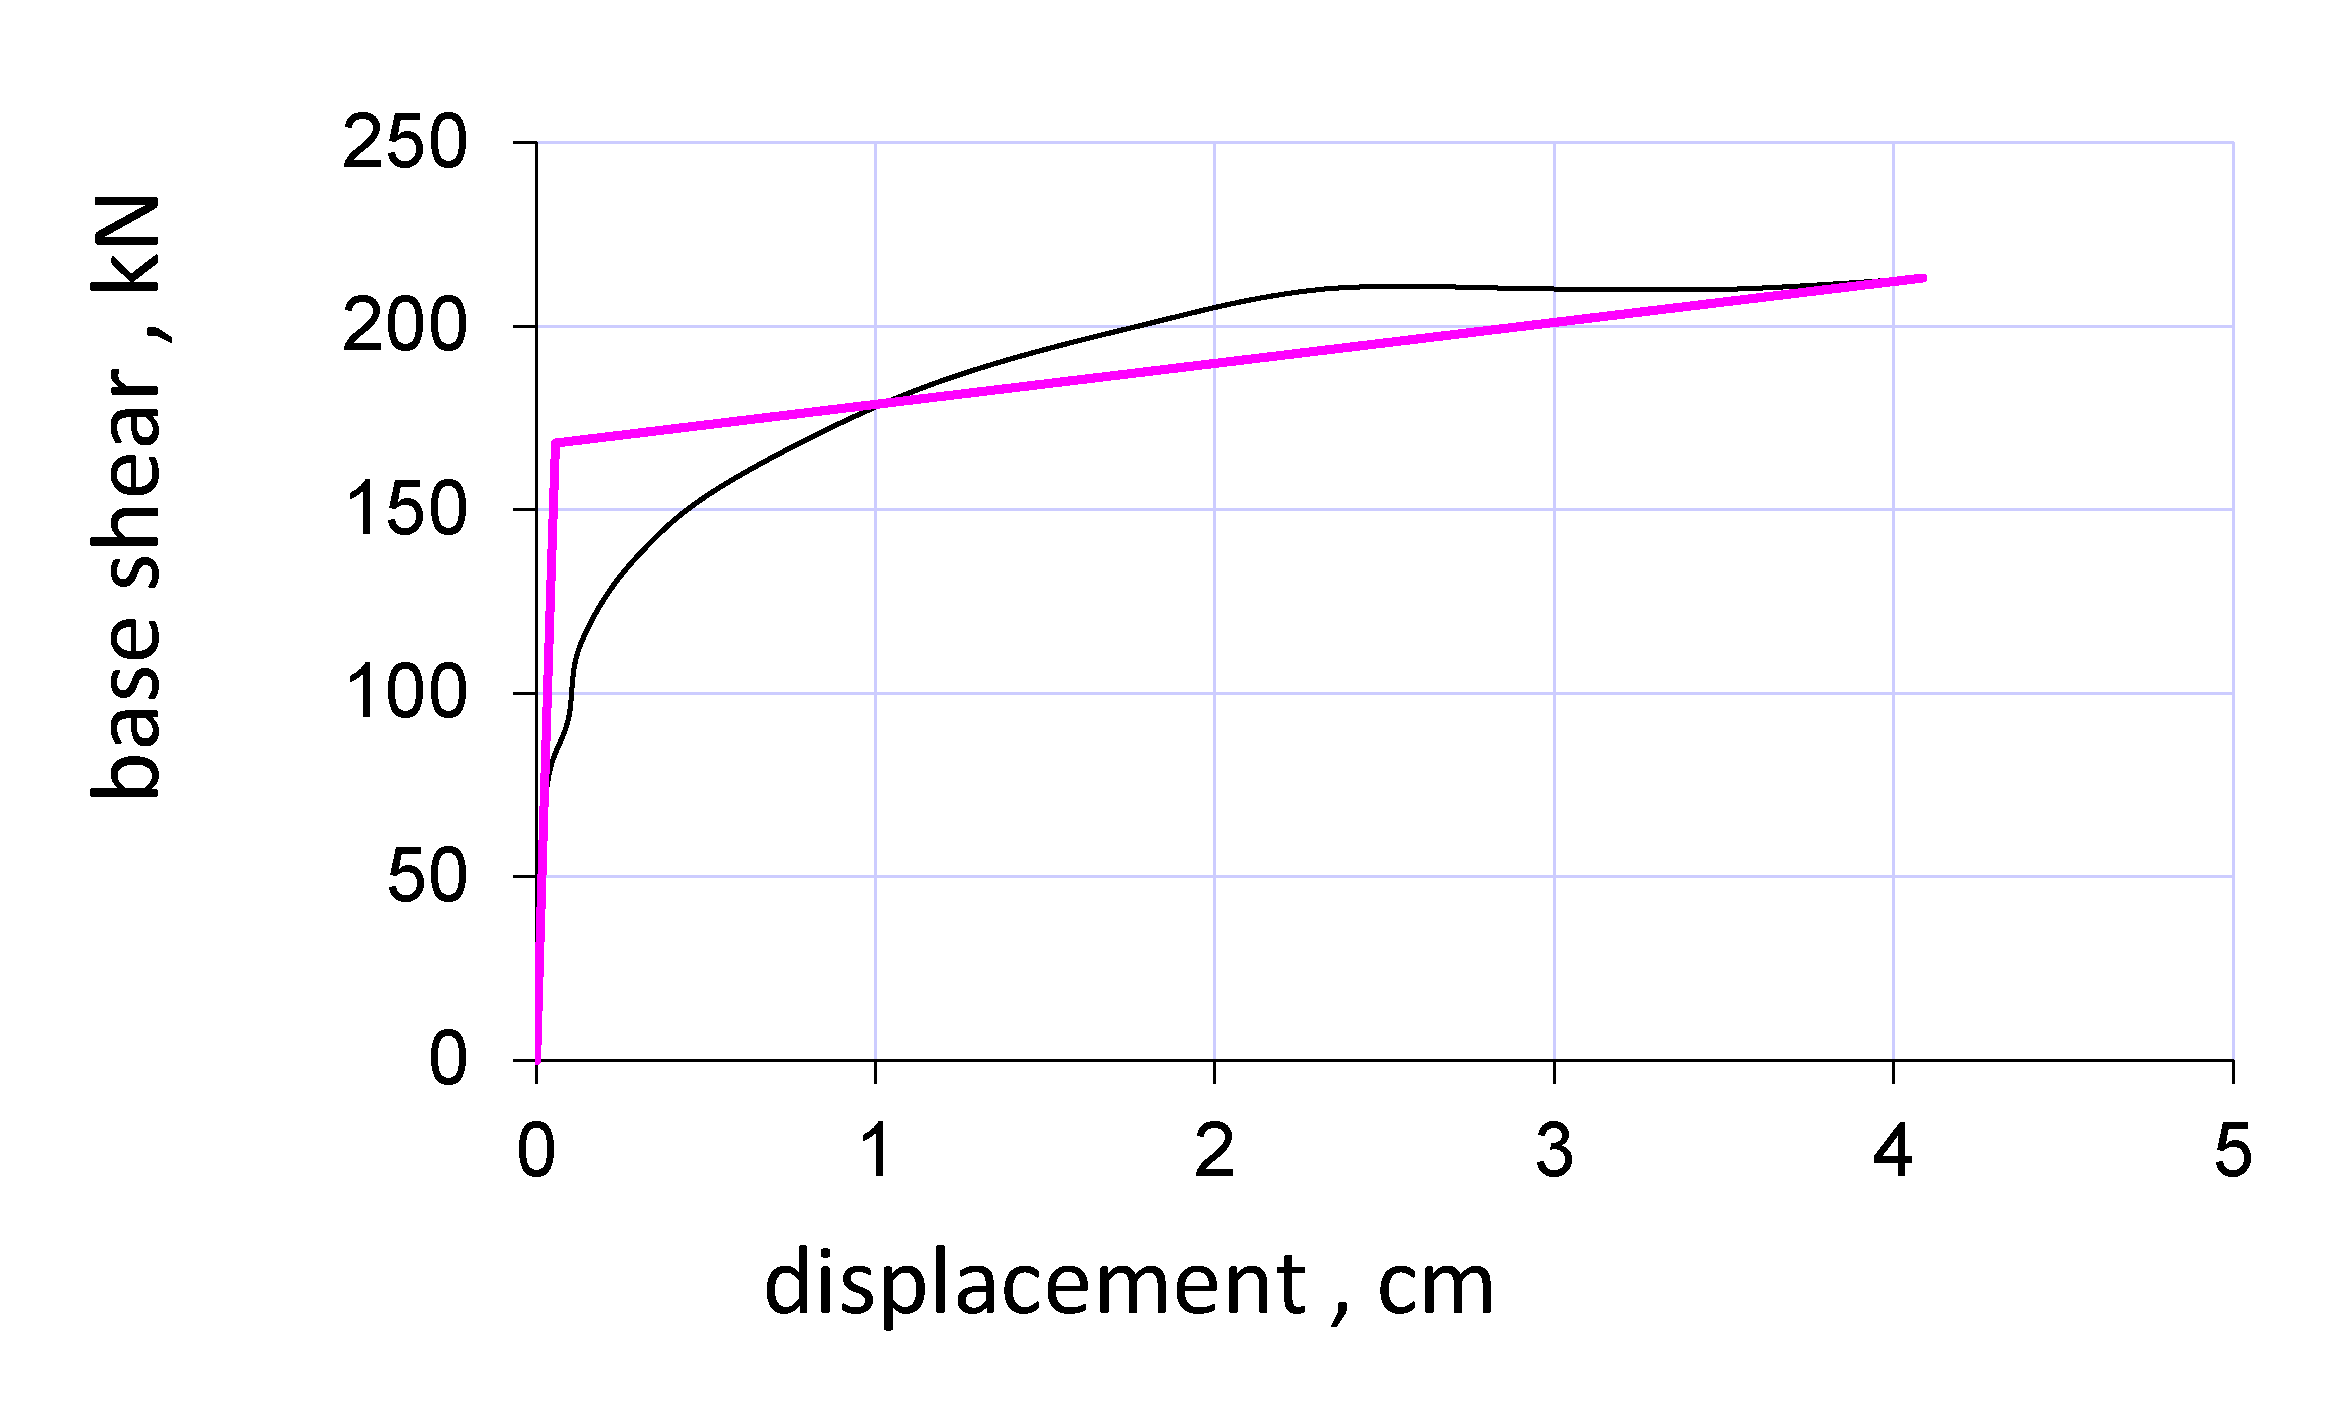
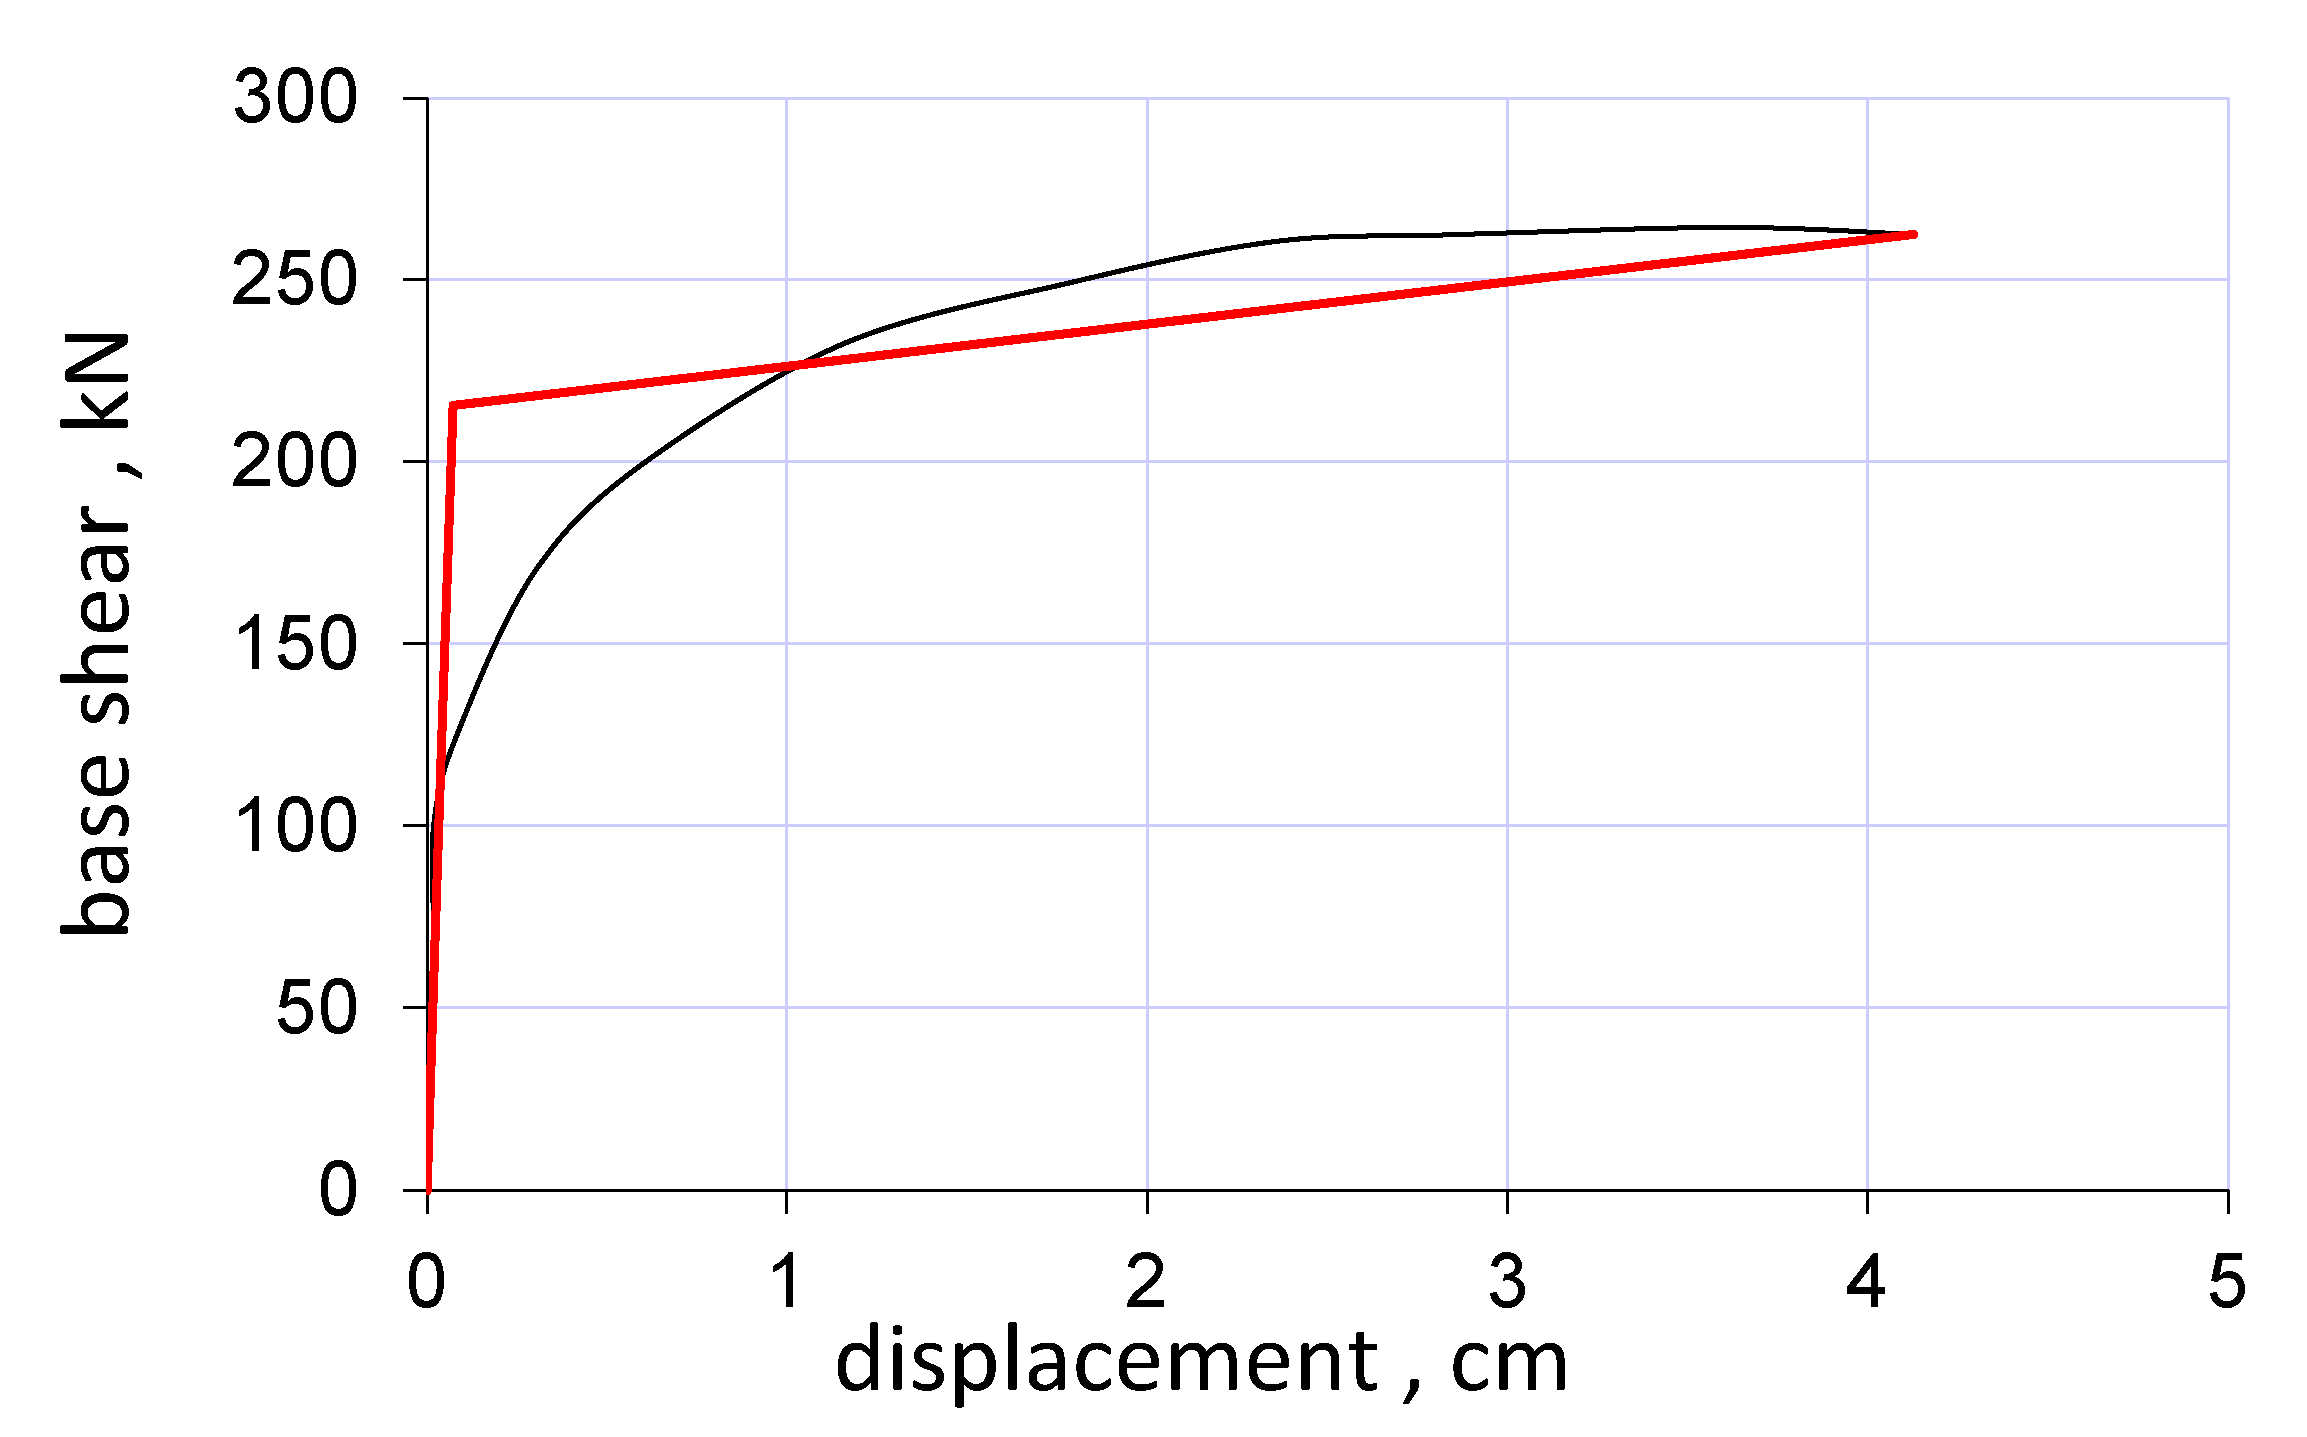
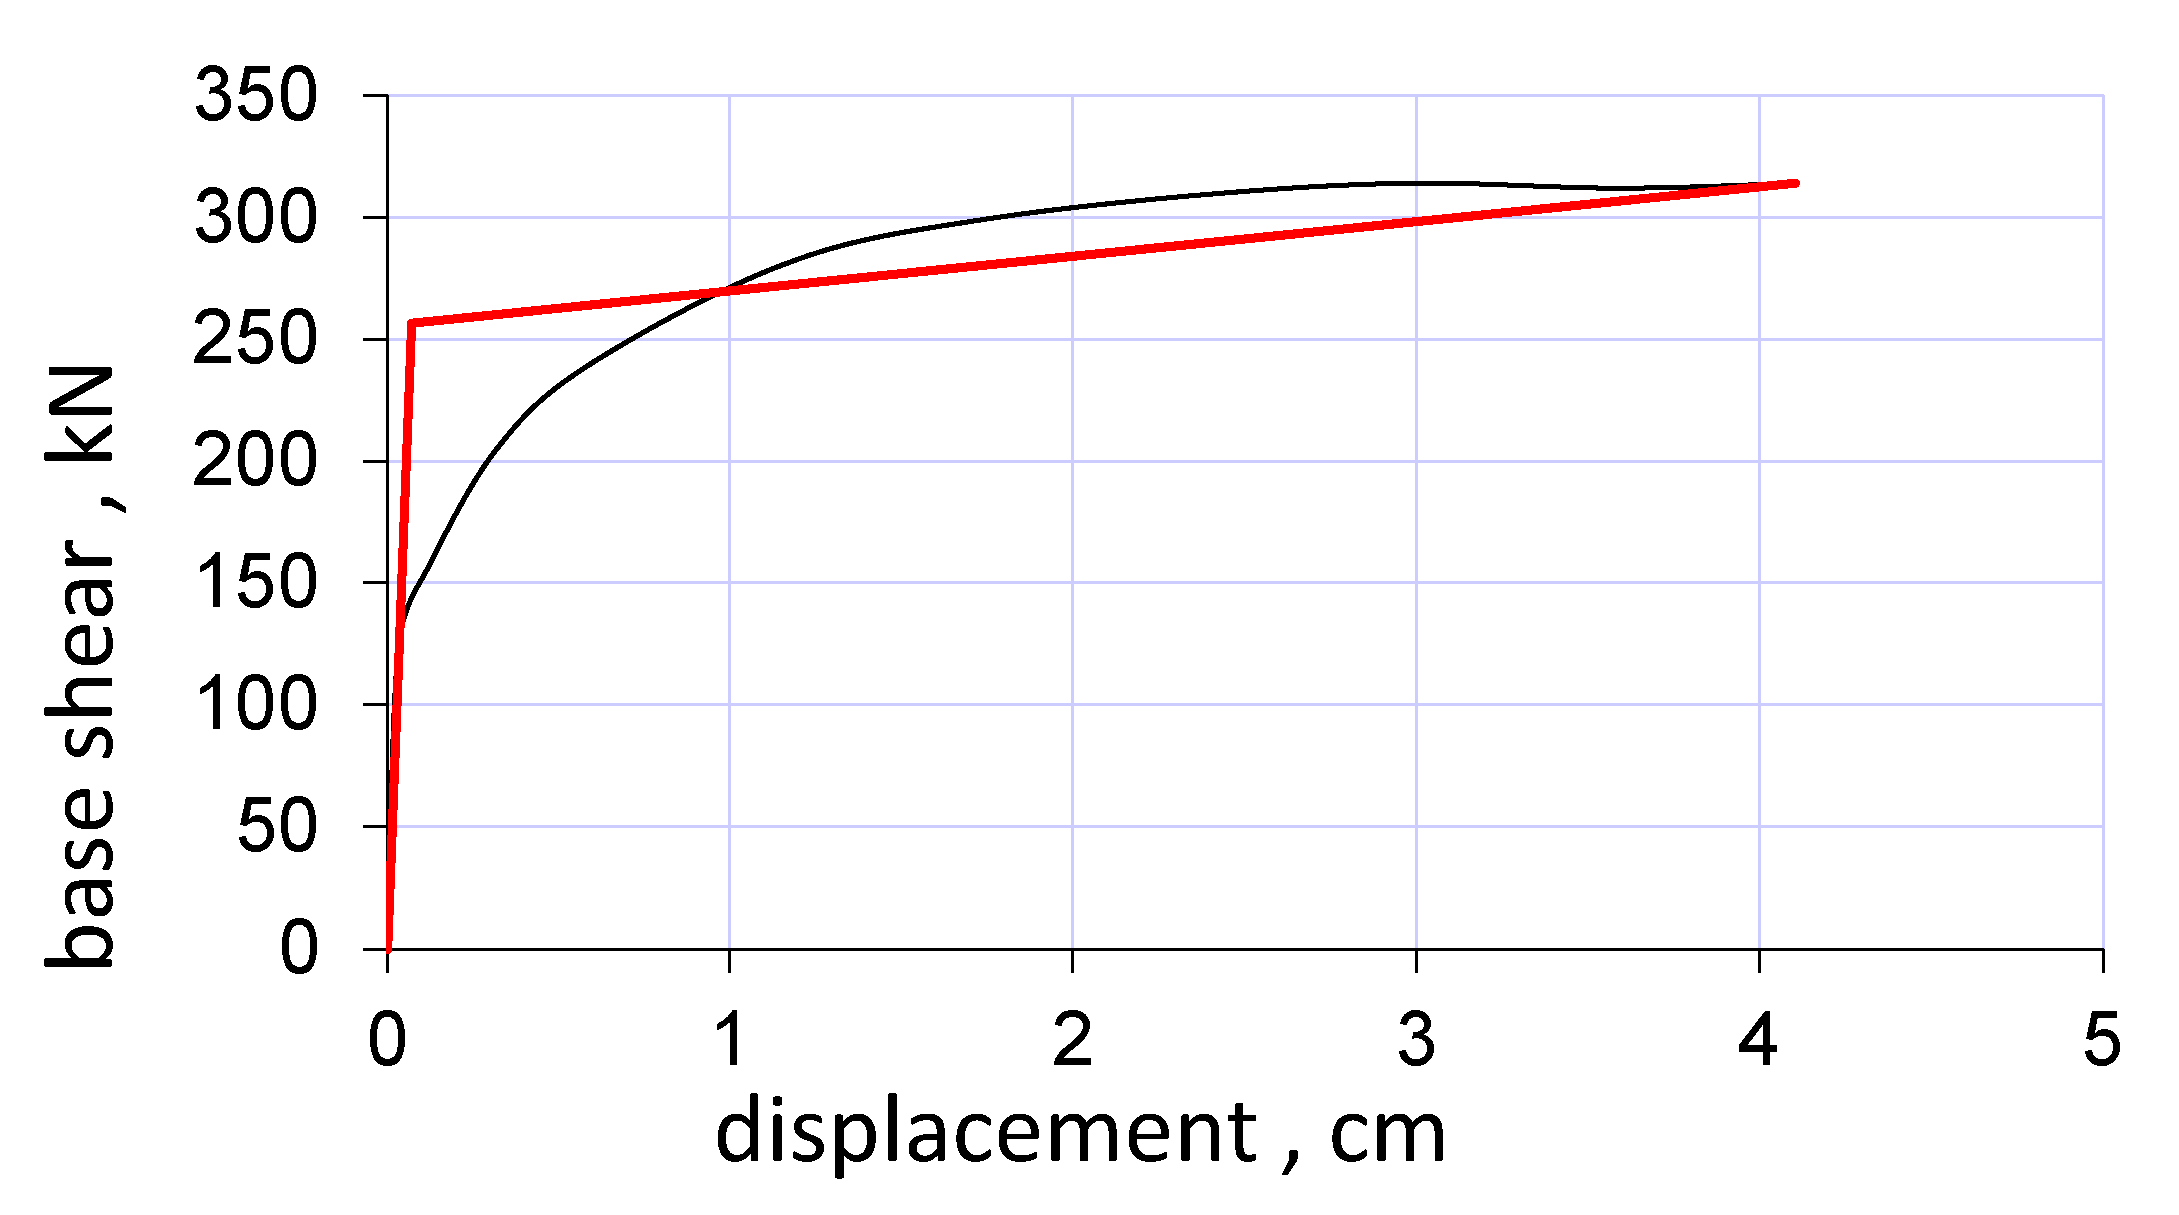
Figure 9 shows the two-line graph resulting from the cyclic loading curve of the damper in this case and its related specifications.
Figure 9 shows the seismic characteristics of the structure. Similar to the previous example, this sample also shows the appropriate correspondence between the first line of the graph and the graph obtained from push. In this example, the slope of the line in the nonlinear mode is about 0.3% of the slope of the curve in the first part, which is much higher than in the first example. The high plasticity of this sample is visible due to the intersection of the two and the intersection of the curve and the second line. The result shows the excellent ductility behaviour of this damper against incoming loads and the possibility of using it effectively against incoming loads.
Table 1 shows the specifications resulting from the pushover curve in this case.
As it is known, the plasticity factor in this sample is very high and reaches about 45.8.
3.1.2. Examining the Sample (BT150, 4 mm) as a Connection to the Braced Frame
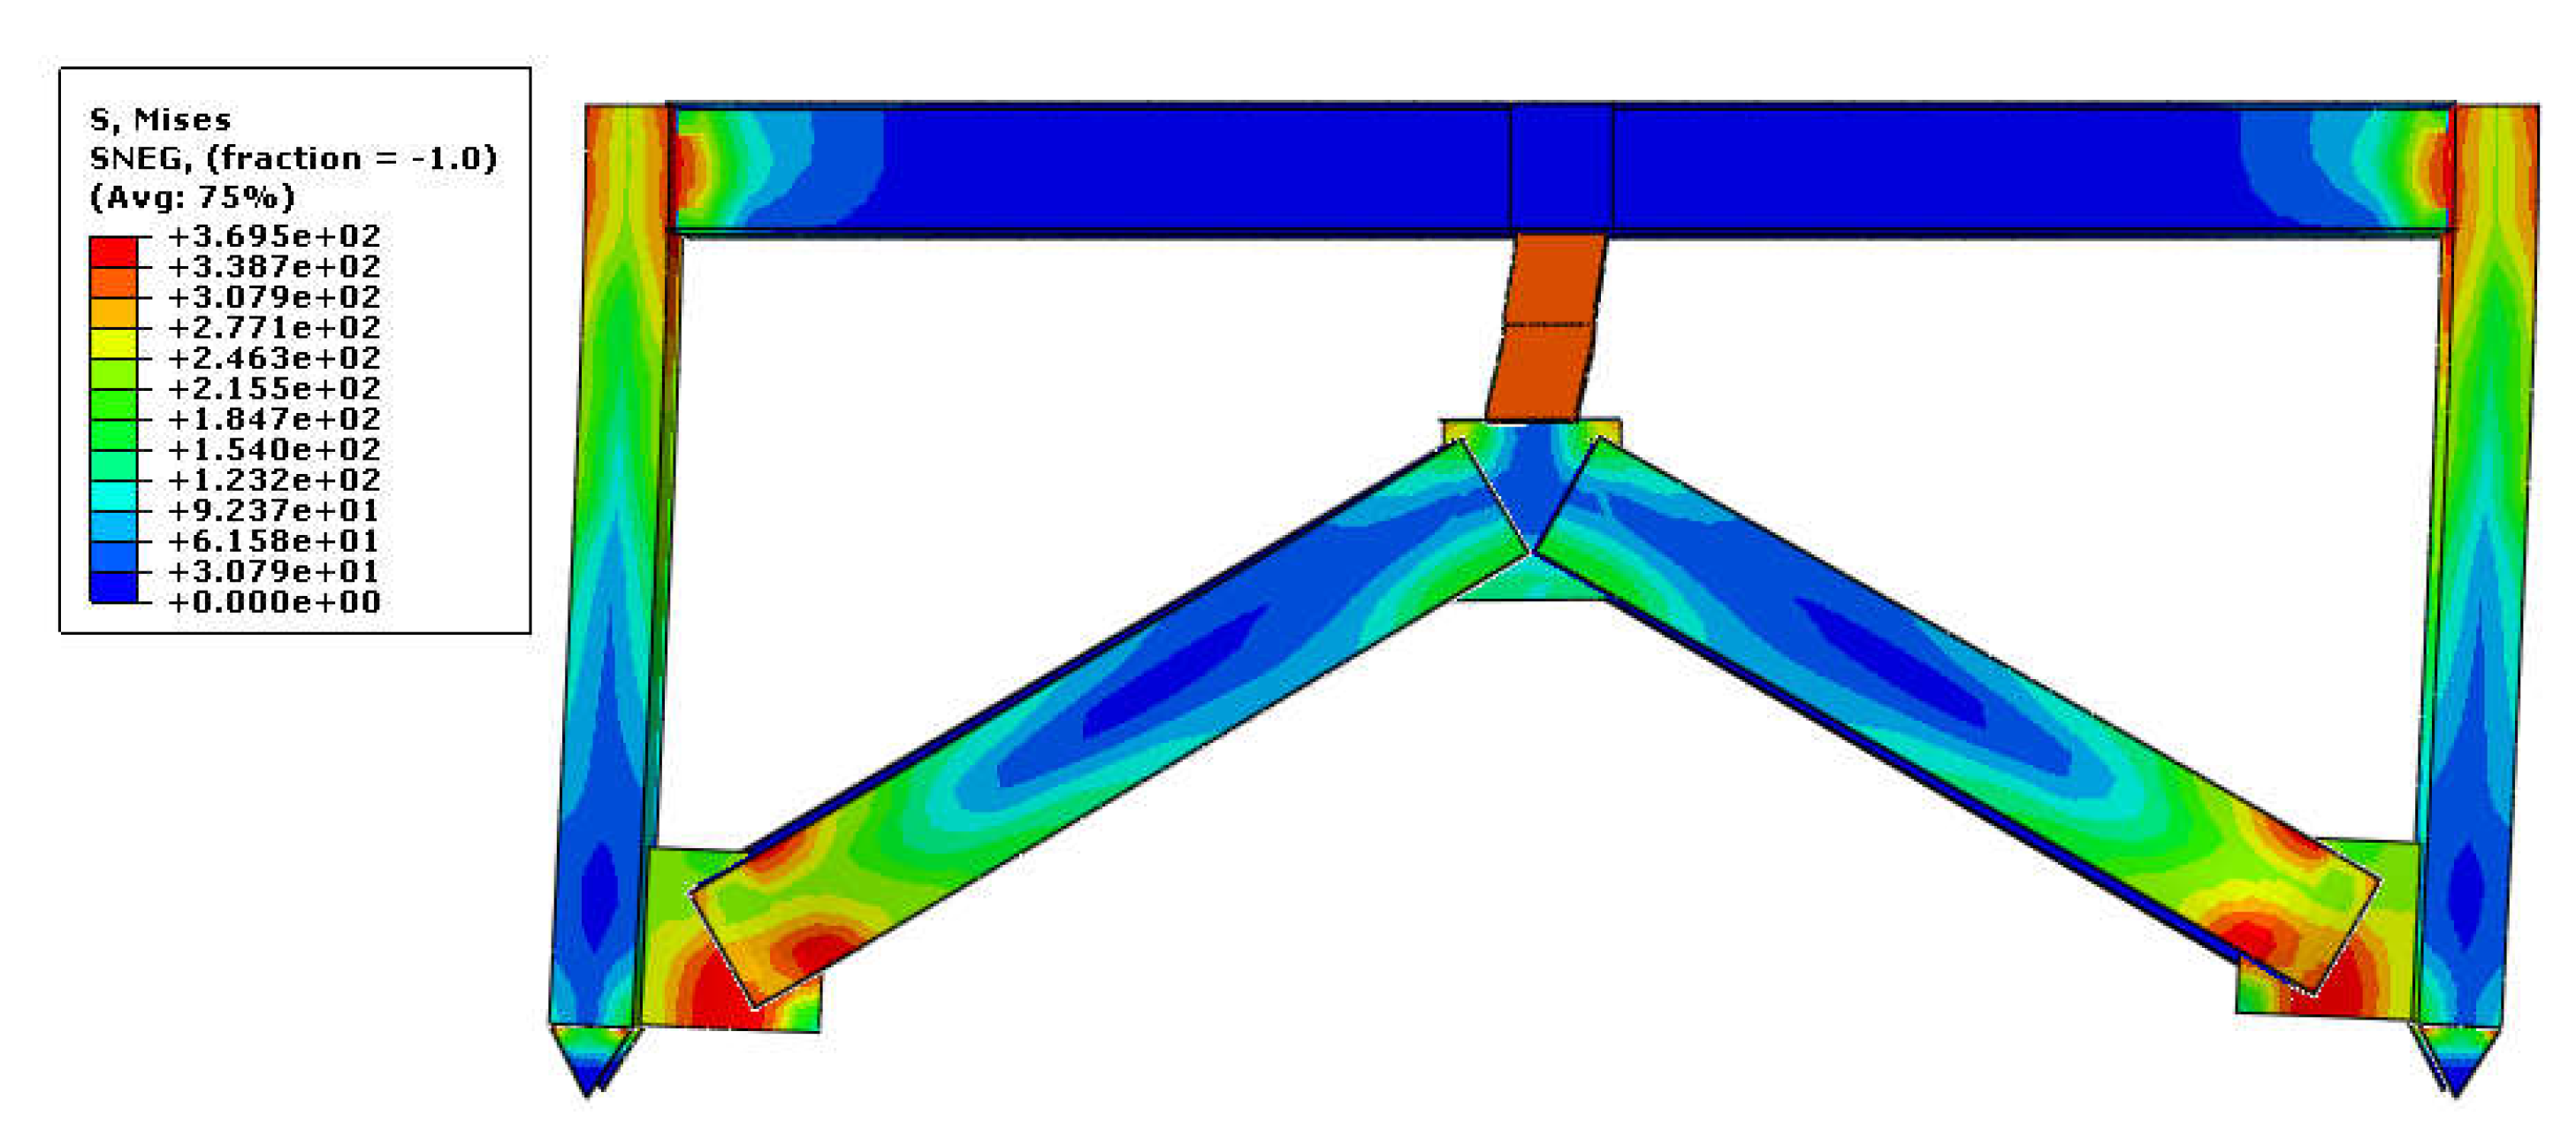
Figure 10 shows the stresses in the eccentrically braced frame.
As shown in
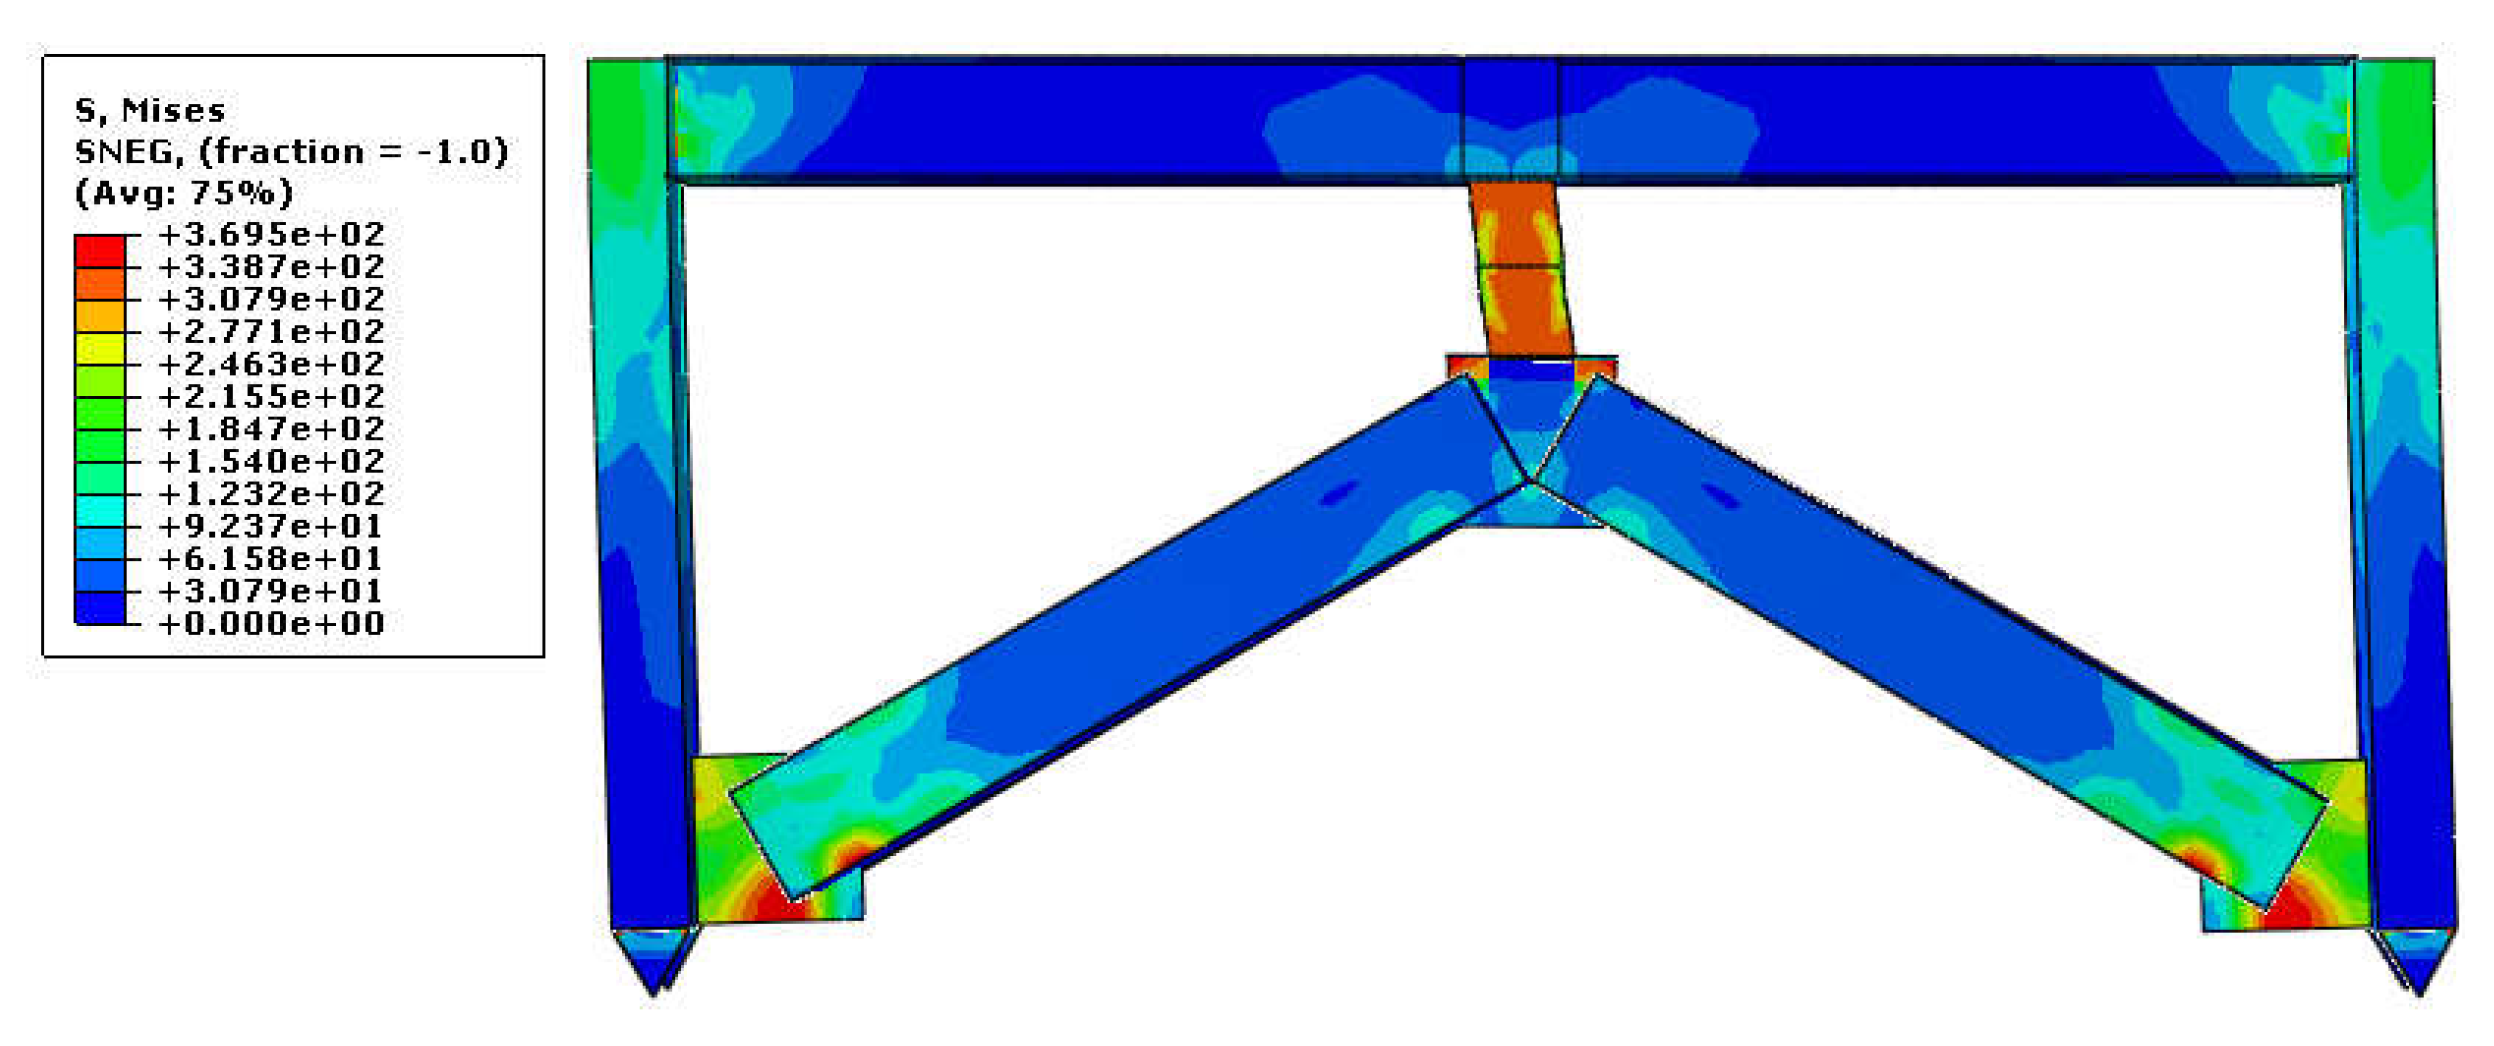
Figure 10, the maximum stresses are formed in the damper as in the previous example. In addition, of course, parts of the connecting plate and brace are also subjected to these maximum stresses in this sample. The maximum stress value, in this case, reaches 370 MPa, which is higher than the rupture stress of the damper material. This is because the materials used in other frame members are made of standard steel, yielding stress of 370 MPa. Moreover, the range of stresses and the changed shape of the frame indicate the symmetry of the structure’s behaviour in cyclic loads applied to the structure.
In this sample, the maximum value of the plastic strain index reaches 4.9, which shows a decrease of almost 0.9 units compared to the previous sample of 5.8. This problem is caused by the increase in the thickness of the web of the box plate and the large distribution of the strain in this thickness. The distribution of strains in this case, as in the previous example, shows that this member has shown complete ductility behaviour and can fully play the role of a ductility member in the structure. The change in shapes created in the frame shows the behaviour of the members is articulated, and there is no bending deformation in the members. Based on this, it can be said that all the anchor created in the structure is concentrated at the place where the damper is connected to the frame, and this member absorbs the created force with its shear-bending behaviour.
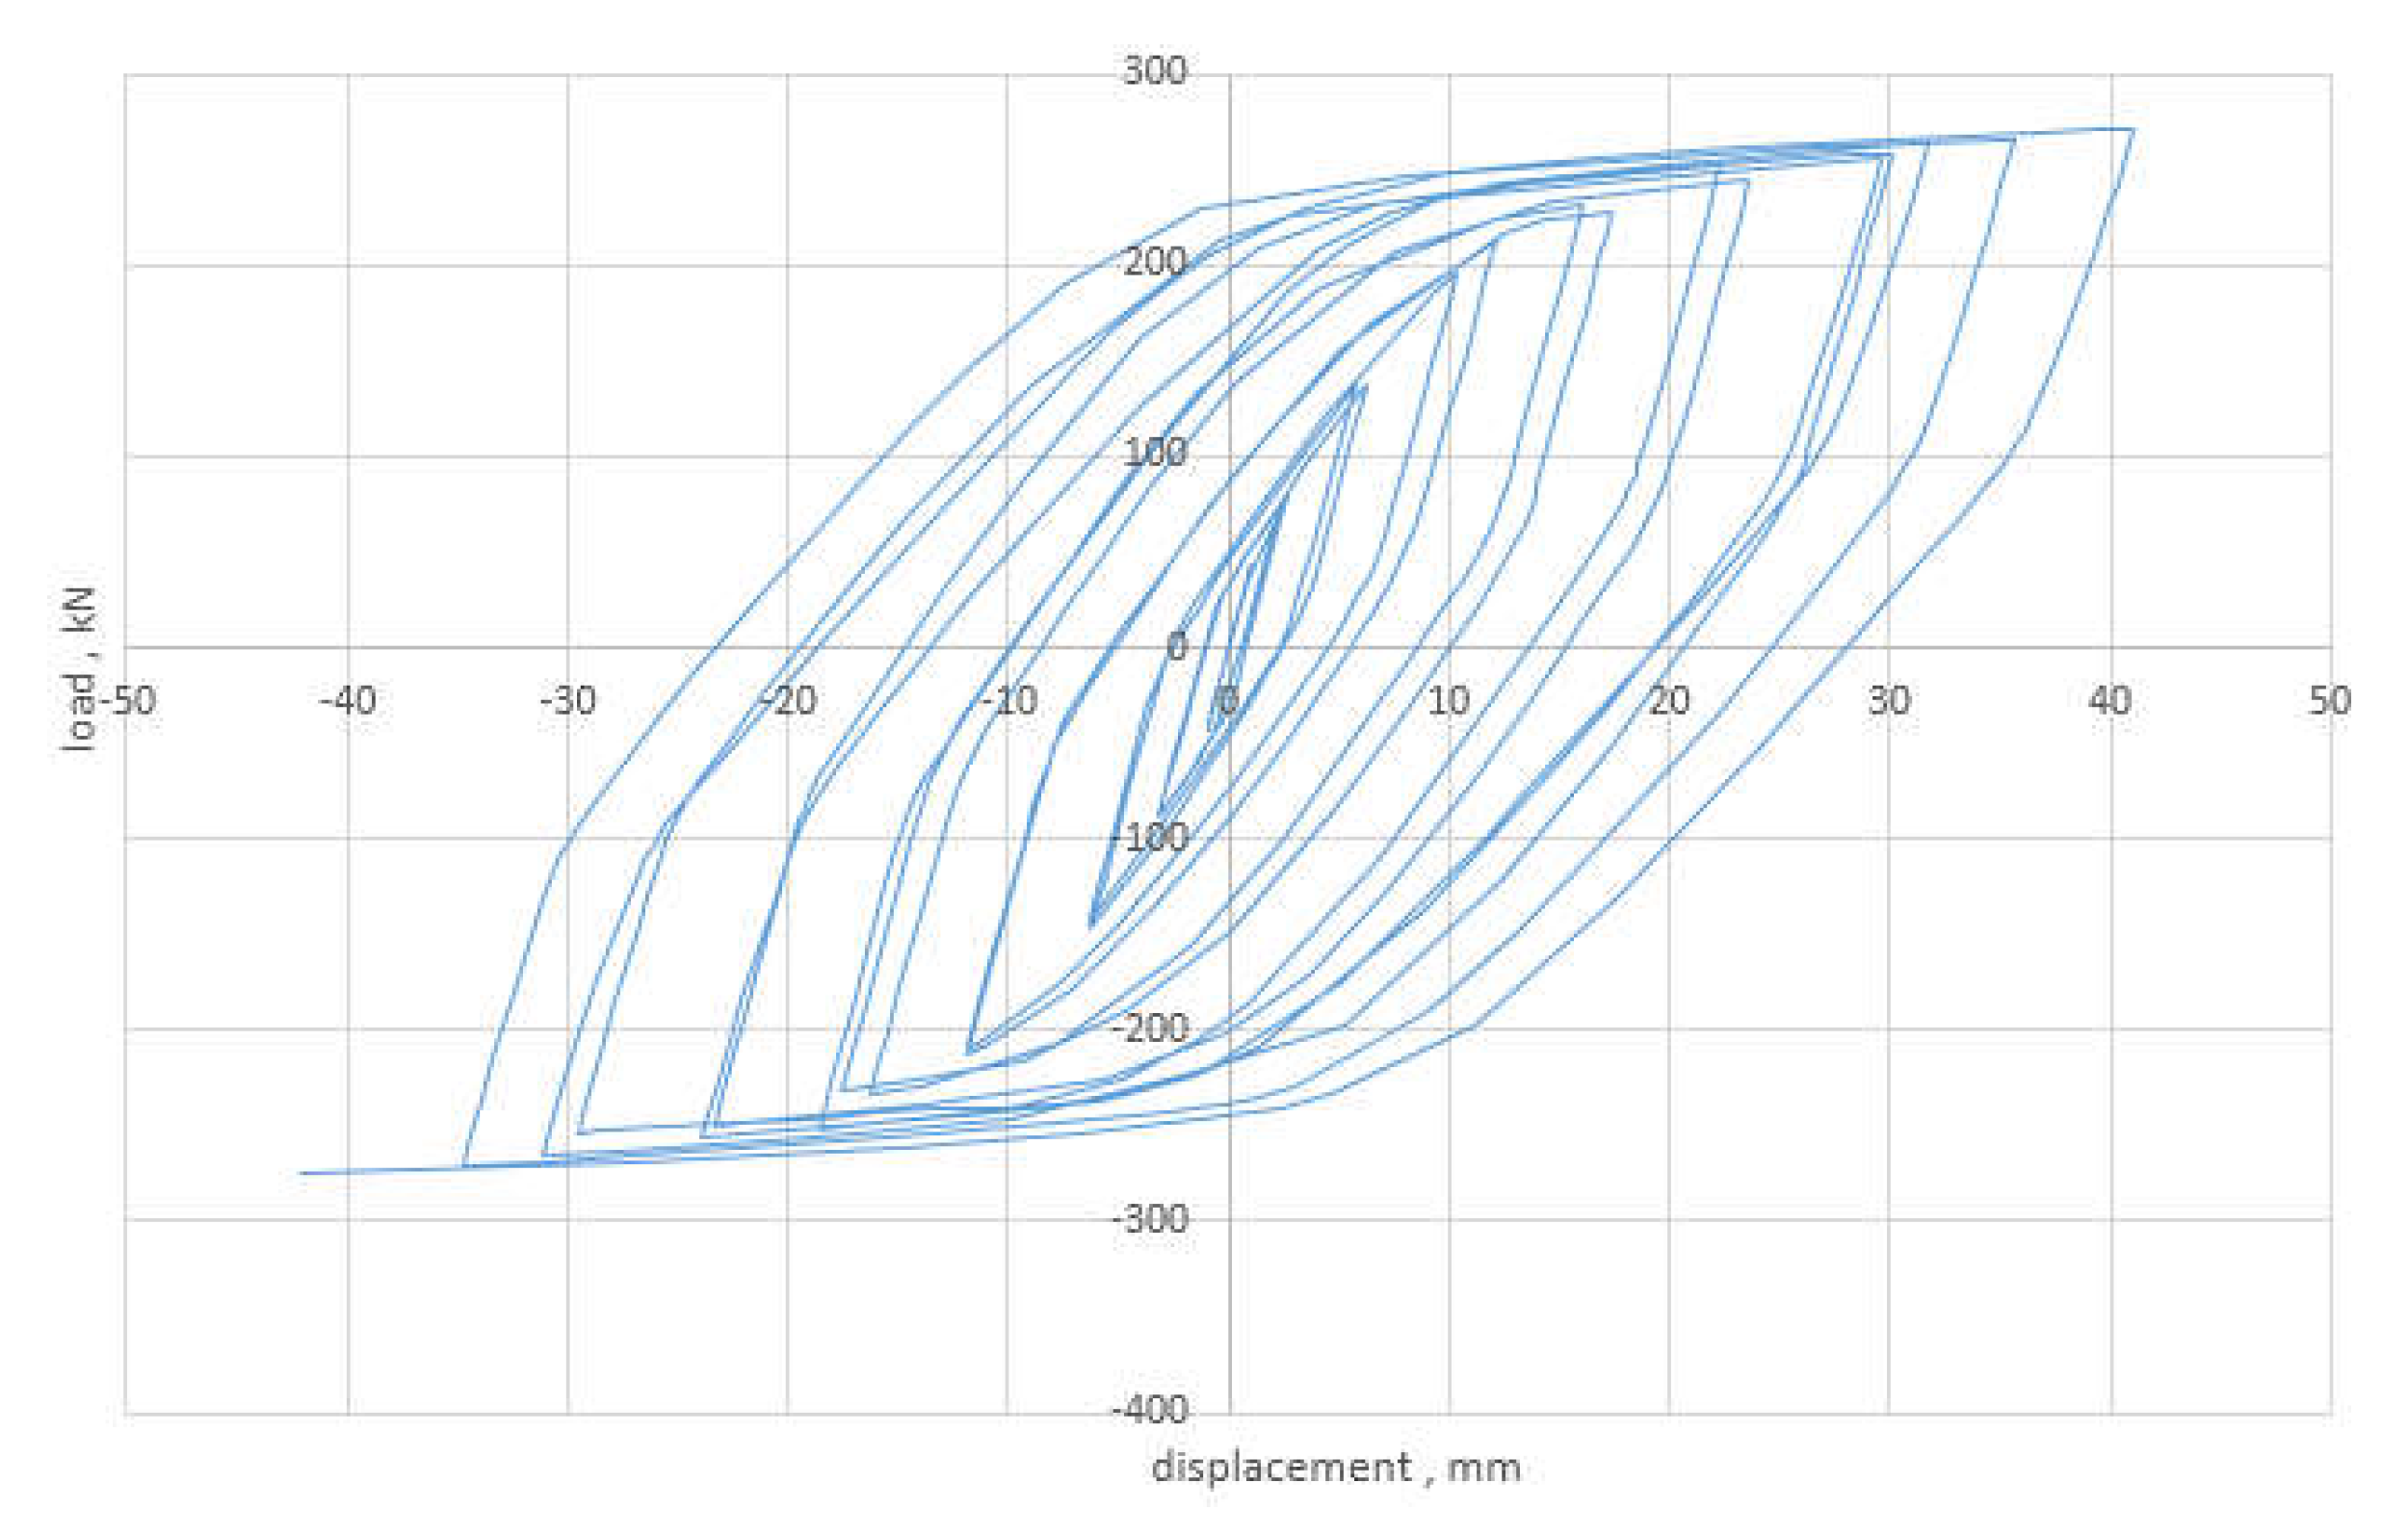
Figure 11 shows the hysteresis diagram due to loading on the frame.
As shown in
Figure 11, the hysteresis curve created in the frame has changed as in the previous example by connecting the damper to the frame. This problem shows the interaction between the frame members and the damper and their effect on the behaviour of the structure. However, we see different conditions in this diagram compared to the single damper diagram. The rings formed in this way create a smaller area, but the final strength of the structure increased to some extent and reached about 275 kN. By increasing the thickness of the plate in the damper, the structure’s resistance increased by only 10%. However, the number of rings and their loading stability indicate that the damper can be used effectively, and a large amount of energy input to the structure can be dissipated in this state.
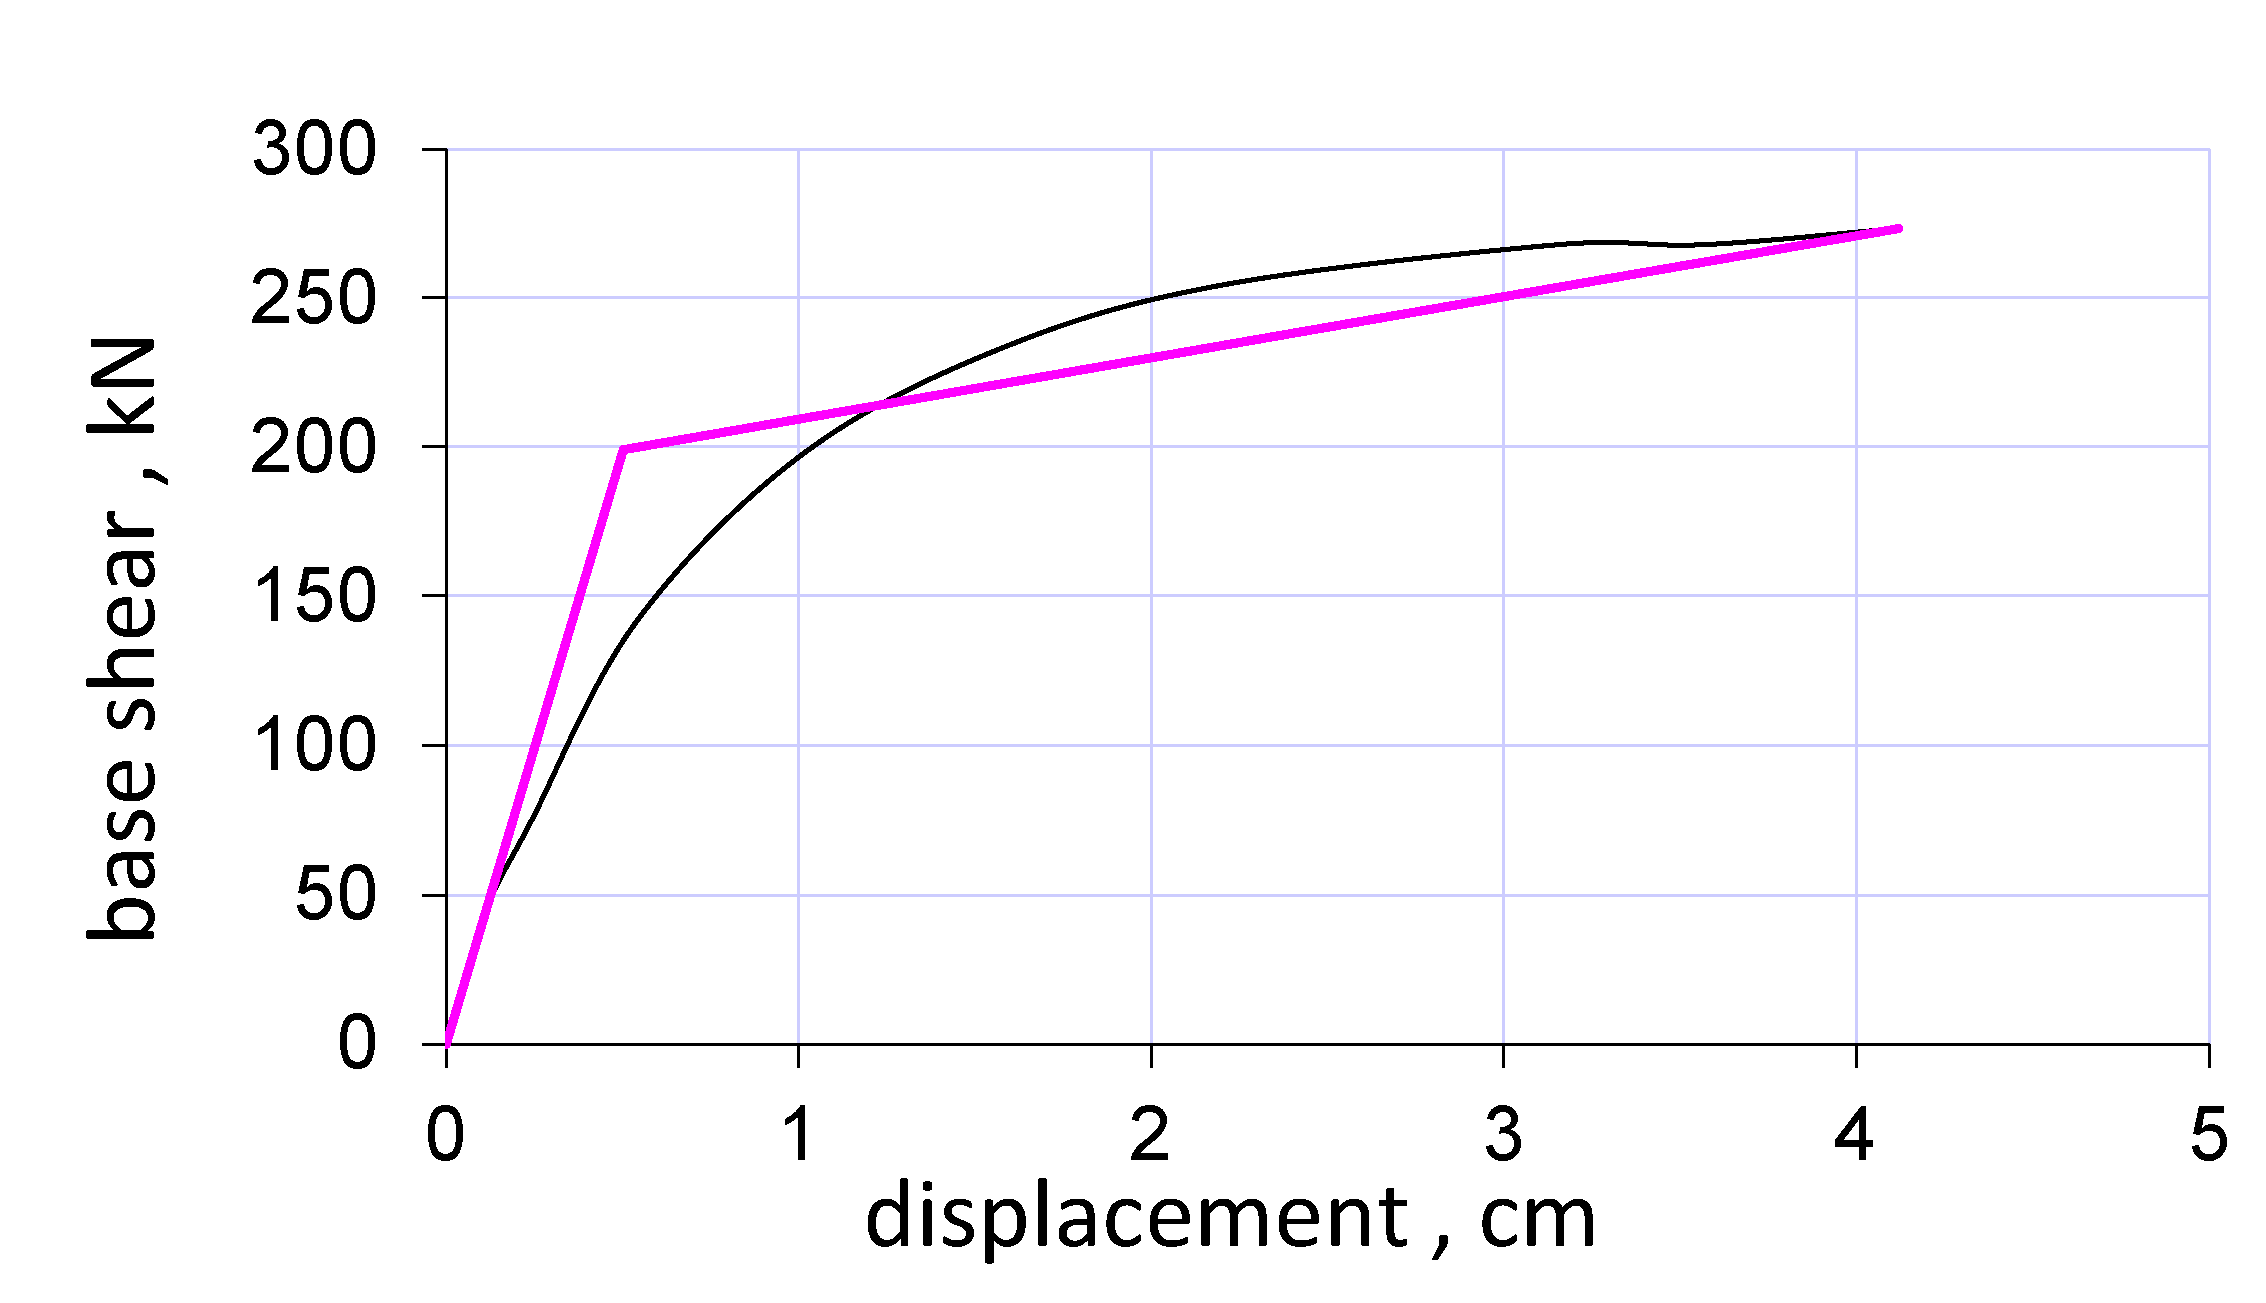
Figure 12 shows the two-line graph resulting from the cyclic loading curve.
As can be seen in
Figure 12, in this sample, as well as in the previous sample, the two-line graph behaviour resulting from the hysteresis chart overlay, the separation between the curve and the first line of the chart occurs at high speed, which is due to the geometric imperfection effects of the frame on It is a dampener on behaviour. The lower slope ratio in the second part of the diagram indicates the proper conduct of the damper in the two-line graph approximation mode. In this example, the slope of the second line is approximately 9.9% of the slope of the curve in the first part. The initial stiffness change from 3080 kN/cm of the single sample to 395 kN/cm in the sample connected to the frame shows the effect of the frame characteristics on the damper behaviour in this case. Examining the ductility of the structure indicates that, in this case, flexibility is greatly reduced.
Table 2 shows the characteristics resulting from the pushover curve of this graph.
As can be seen in
Table 2, plasticity decreased from 48.5 to 8.2. Although this reduction is noticeable, in the structural scale of ductility 8.2, it represents an outstanding value, which confirms the very appropriate behaviour coefficient of the structure against the incoming loads.
3.2. Sample (BT150, 6 mm)
3.2.1. Examining the Sample (BT150, 6 mm) Individually
Figure 13 shows the stresses formed in sample BT150, six at the end of loading. In this sample, the characteristics of the damper remain the same, and the thickness of the body plate surrounding the box increased from 4 mm to 6 mm compared to the previous sample.
As it is clear from
Figure 13, as in the previous examples, the maximum stresses are created in the web plate of the box. In the next step, some stress concentration can be seen at the edges of the enclosing plates, including the steel box and the stiffener. The stress reaches its minimum value in the middle of the piece, i.e., the middle of the vertical sides and the horizontal stiffener. There is almost no tension on the upper and lower sides of the damper, and these plates only act as a containment effect for the web plate.
Figure 14 shows the plastic strain in this sample.
As seen in
Figure 14, the figure for plastic strains, in this case, is mainly similar to the previous example. The highest deformations of meta elasticity occurred in the web plate and on the sides of the stiffener, which reaches 4.77 in this sample. In the following stages, the strain distribution around the plate increases until it reaches the minimum value at the sides of the enclosing plate. The extensive distribution of strains throughout the plate shows that this part yielded in shear and will absorb a large amount of incoming energy. Of course, the intermediate stiffener solves this problem to some extent, but in the end cycles of loading, the use of only one plate may not be enough, and it may be strained by cutting the web plate from the middle of the member.
Figure 15 shows the hysteresis diagram resulting from the analysis of this sample in cyclic loading.
As seen in
Figure 15, the behaviour of the damper was entirely stable, and it created rings with a very suitable area. This problem showed that the damper could consume much incoming energy and protect the structure against the incoming lateral force. The diagram indicates that the damper reached its maximum capacity, and the rings became almost horizontal. In this case, the maximum capacity of the structure reached 262 kN, which shows a 25% increase in the ultimate resistance.
Figure 16 shows the two-line graph resulting from the cyclic loading curve.
As seen in
Figure 16, the two-line behaviour resulting from the hysteresis plot shows the seismic characteristics of the structure well. Similar to the previous two examples, this sample also shows the appropriate correspondence between the first line of the graph and the graph obtained from push. In this sample, the slope of the line in nonlinear mode is about 0.37% of the slope of the curve in the first part, which is much higher than the first sample and almost the same as the second sample. The high plasticity of this sample is visible due to the intersection of the two and the intersection of the curve and the second line. This is an excellent example of the ductility behaviour of this damper against incoming loads and the possibility of using it effectively against incoming loads.
Table 3 shows the specifications resulting from the pushover curve in this case.
As it is known, the plasticity factor in this sample is very high and reaches about 56.5.
3.2.2. Examining the Sample (BT150, 6 mm) as a Connection to the Braced Frame
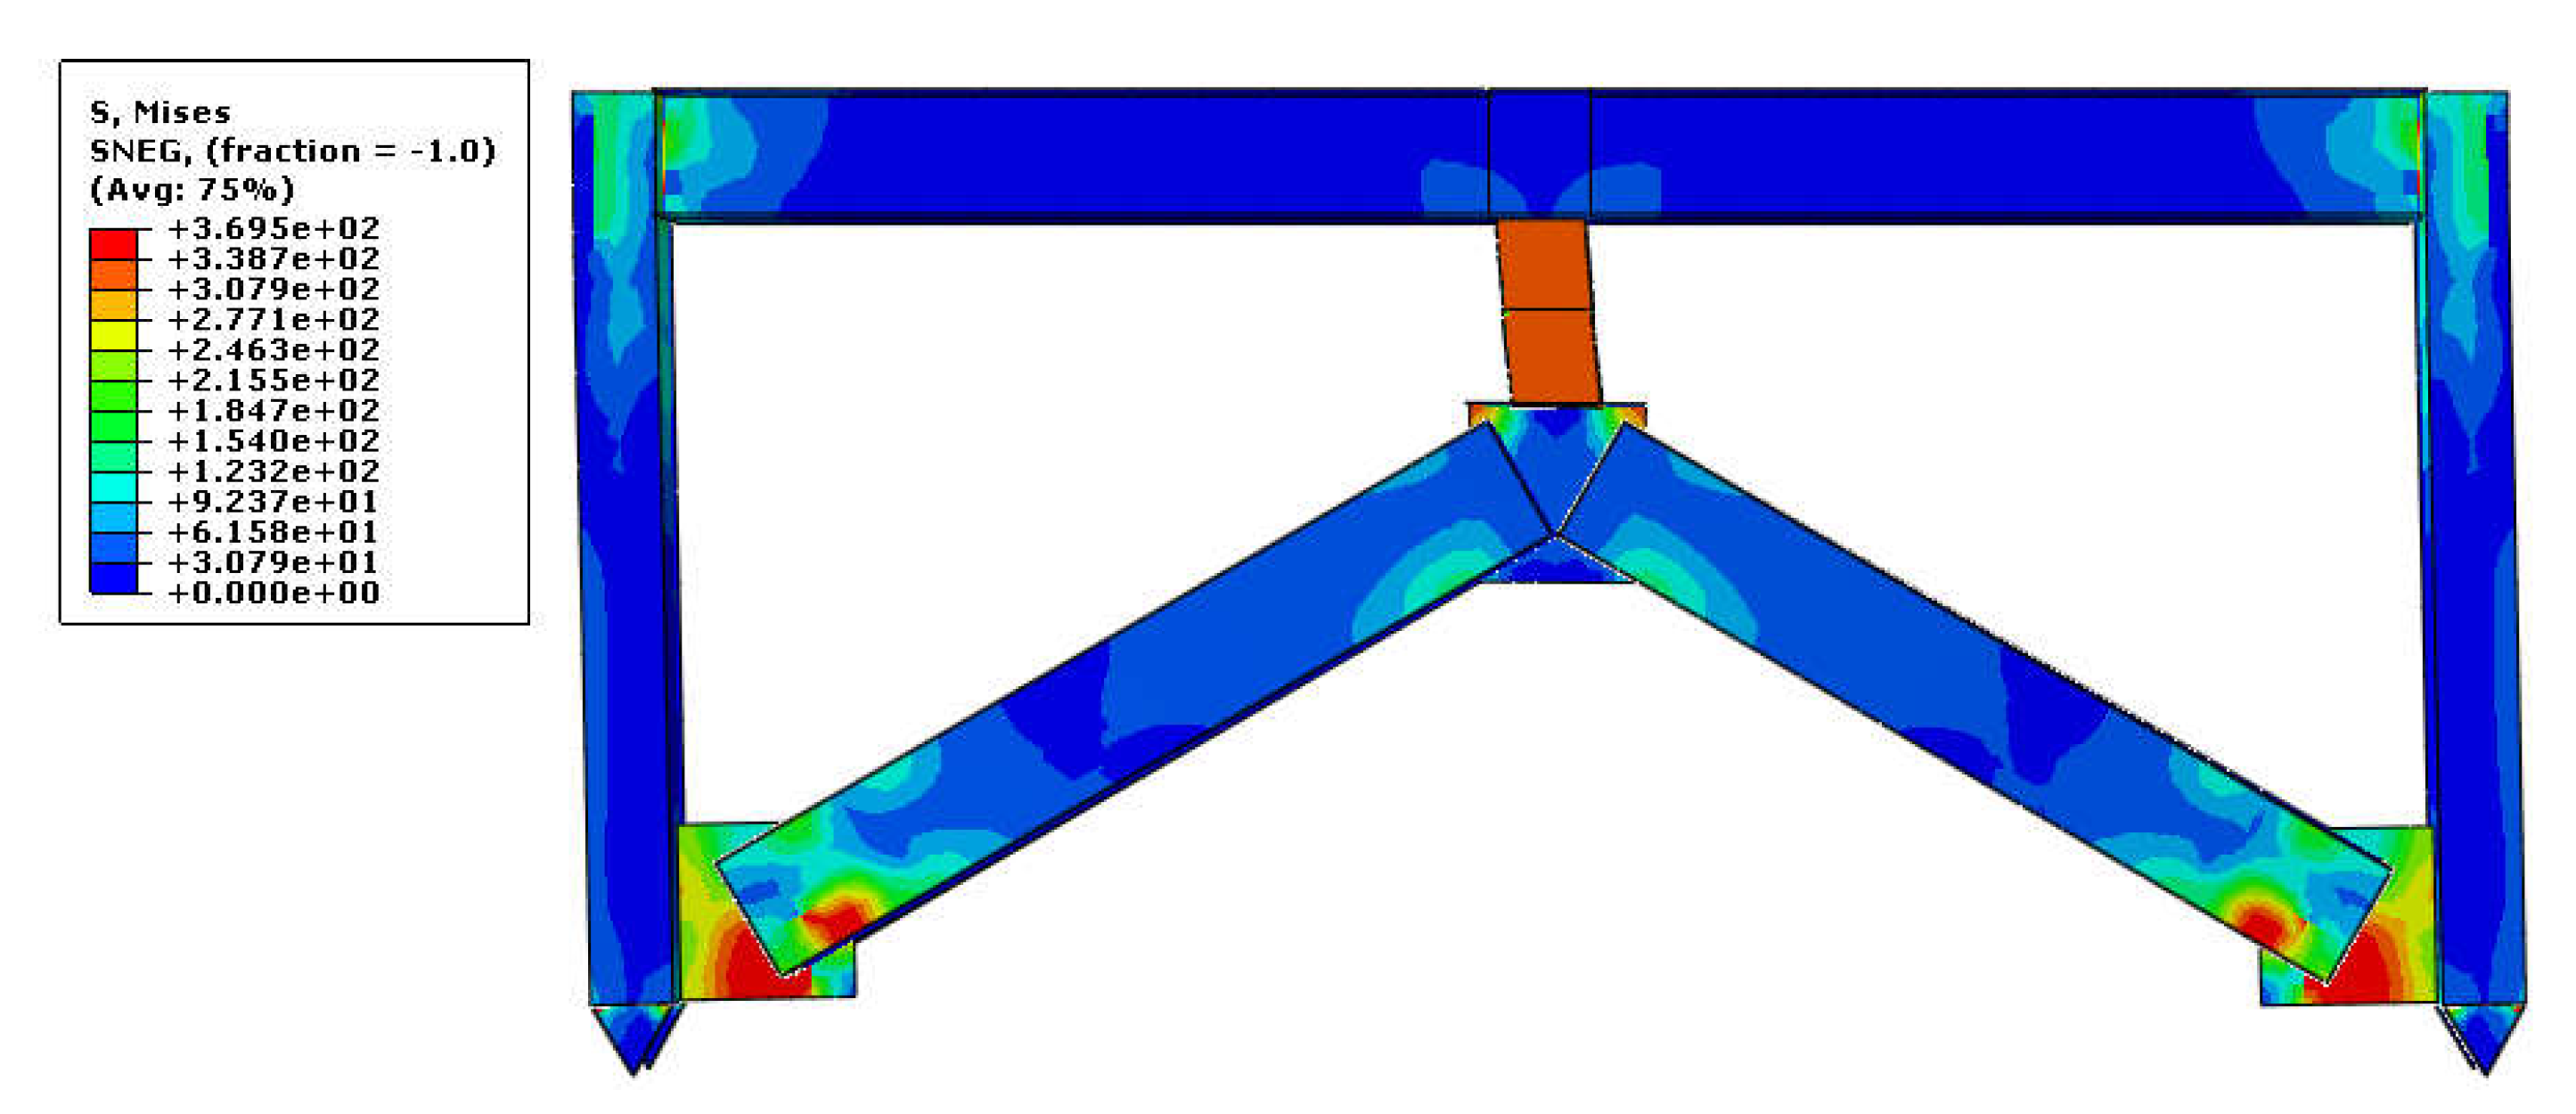
Figure 17 shows the structure of the stresses created in the eccentrically braced frame.
As shown in
Figure 17, as with the previous two examples, the maximum stresses are formed inside the damper. Of course, parts of the connecting plate and brace are also subjected to these maximum stresses in this sample. This phenomenon is due to the excessive increase in stress and causes the other members, except the ductility member, to remain in the elastic state to experience hyperplastic strains. Of course, in this case, since these values are small and do not cause visible deformation in the failure member, they can be ignored.
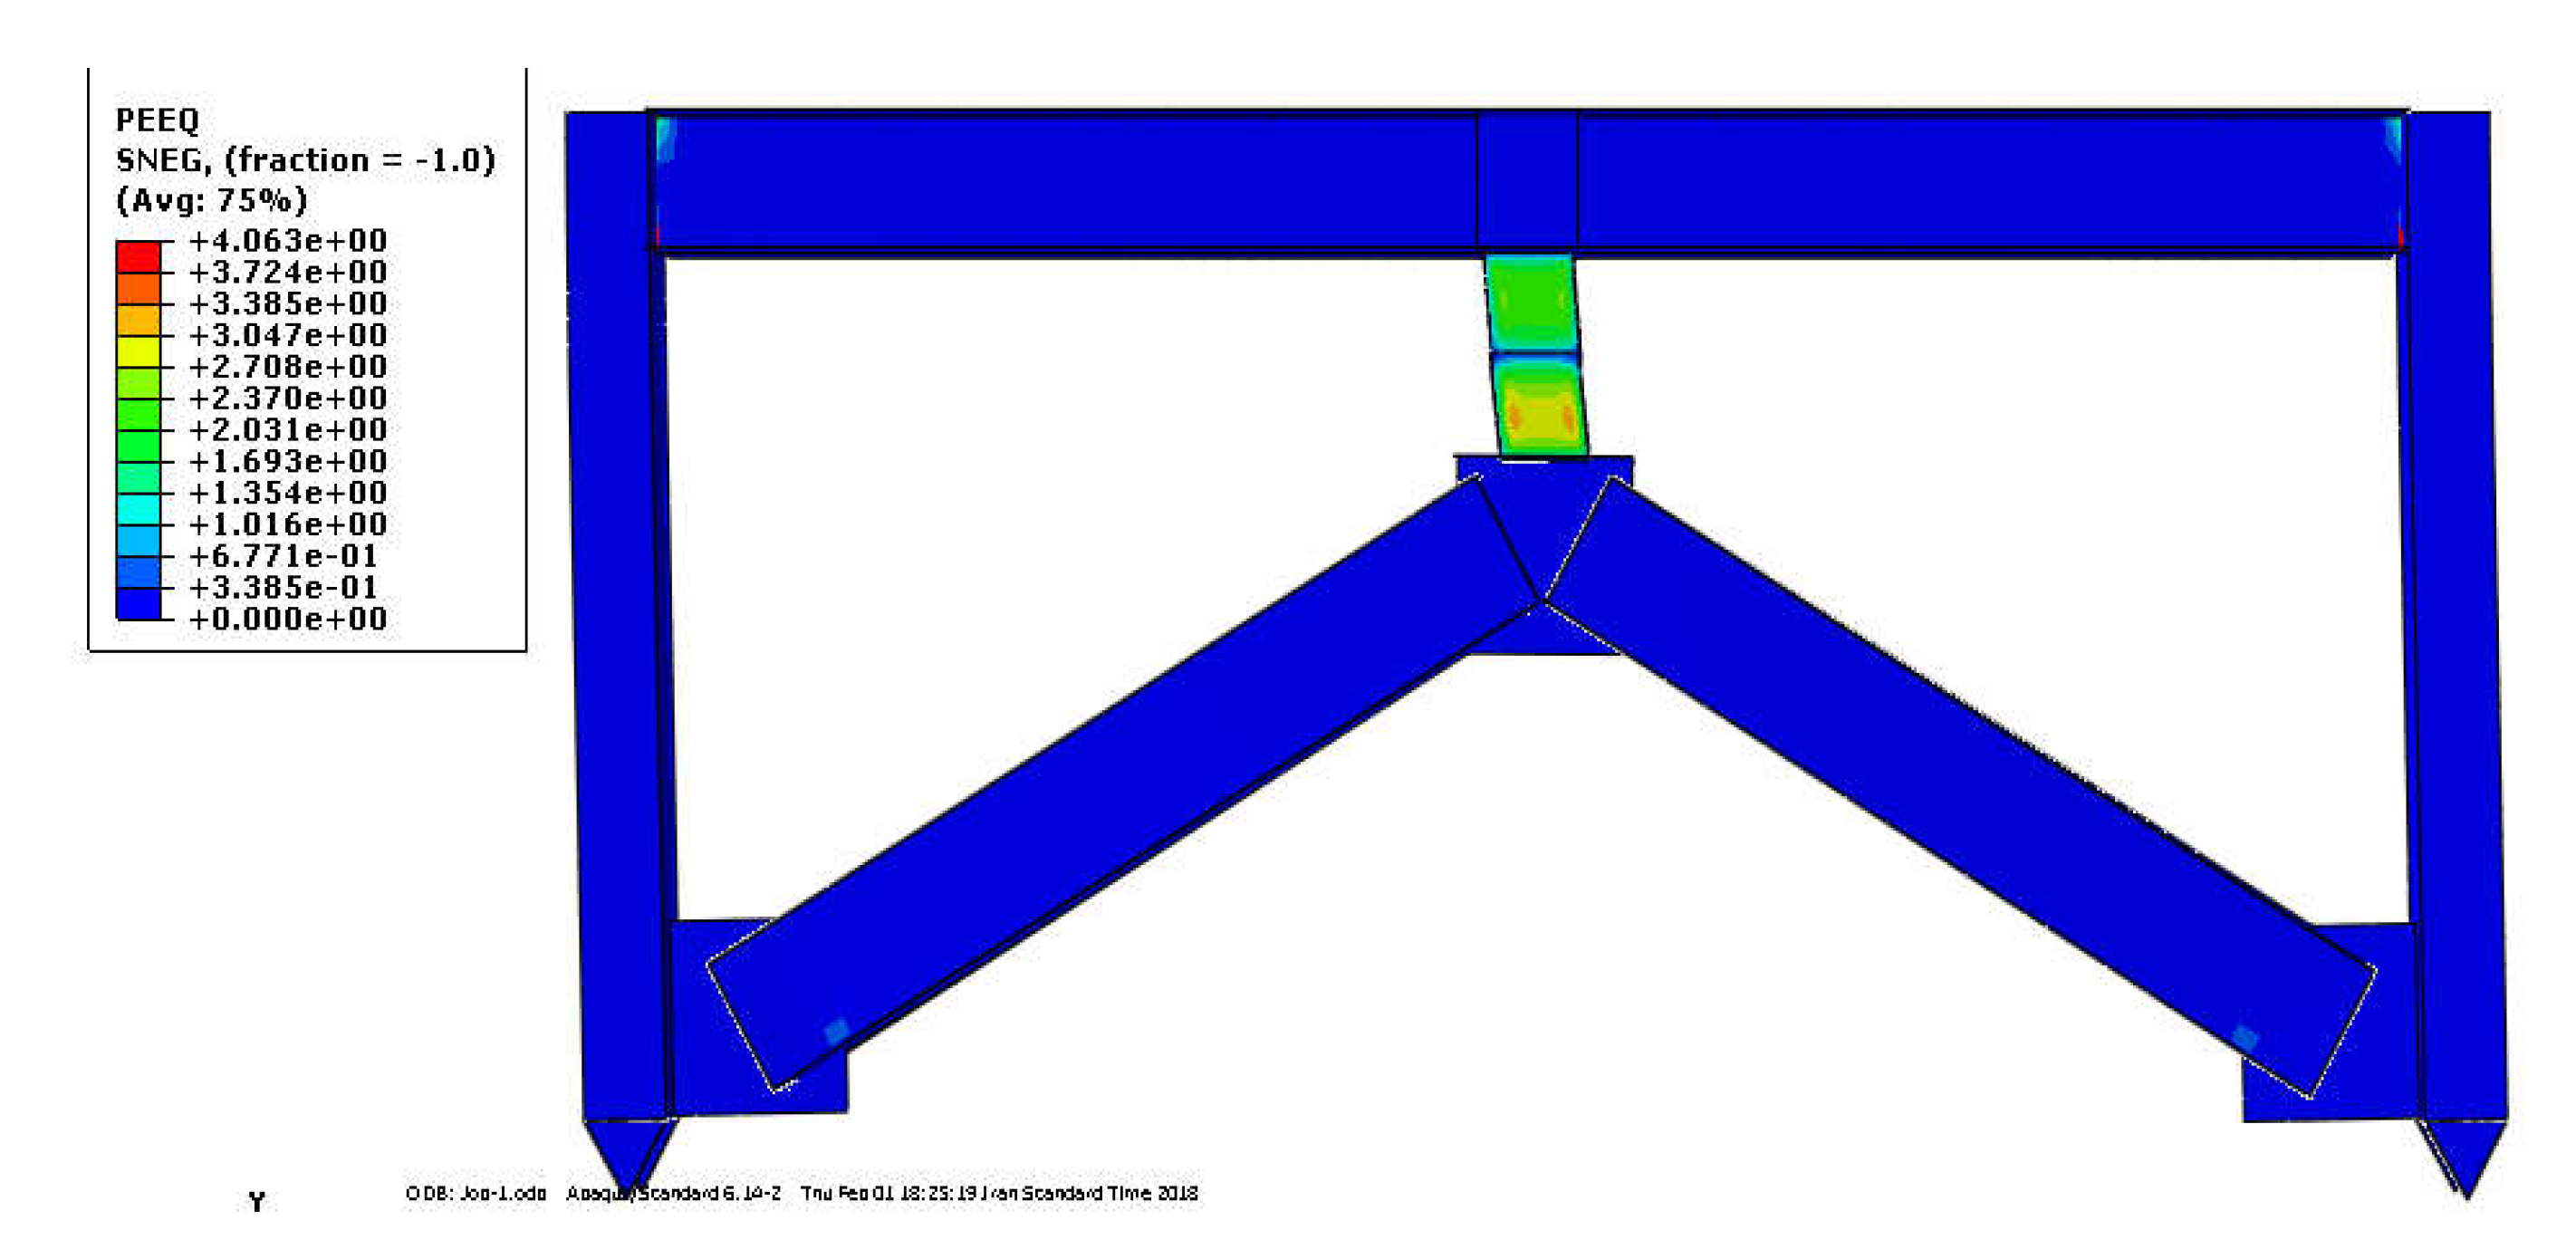
Figure 18 shows the plastic strain in the frame body.
As it is clear from
Figure 18, all the plastic strains have accumulated in the damper. In this sample, the maximum value of the plastic strain index reaches 4.1, which shows a decrease of almost 0.9 units compared to the previous sample, whose value is 4.9. This problem is caused by the increase in the thickness of the box plate web and the large distribution of the strain in this thickness. The distribution of strains in this case, as with the previous two examples, shows that this member shows a complete ductility behaviour and can fully play the role of a ductility member in the structure. It means that the behaviour of the members is articulated, and there is no bending deformation in the members. Based on this, it can be said that all the anchor created in the structure is concentrated at the place where the damper is connected to the frame, and this member will absorb the created force with its shear-bending behaviour.
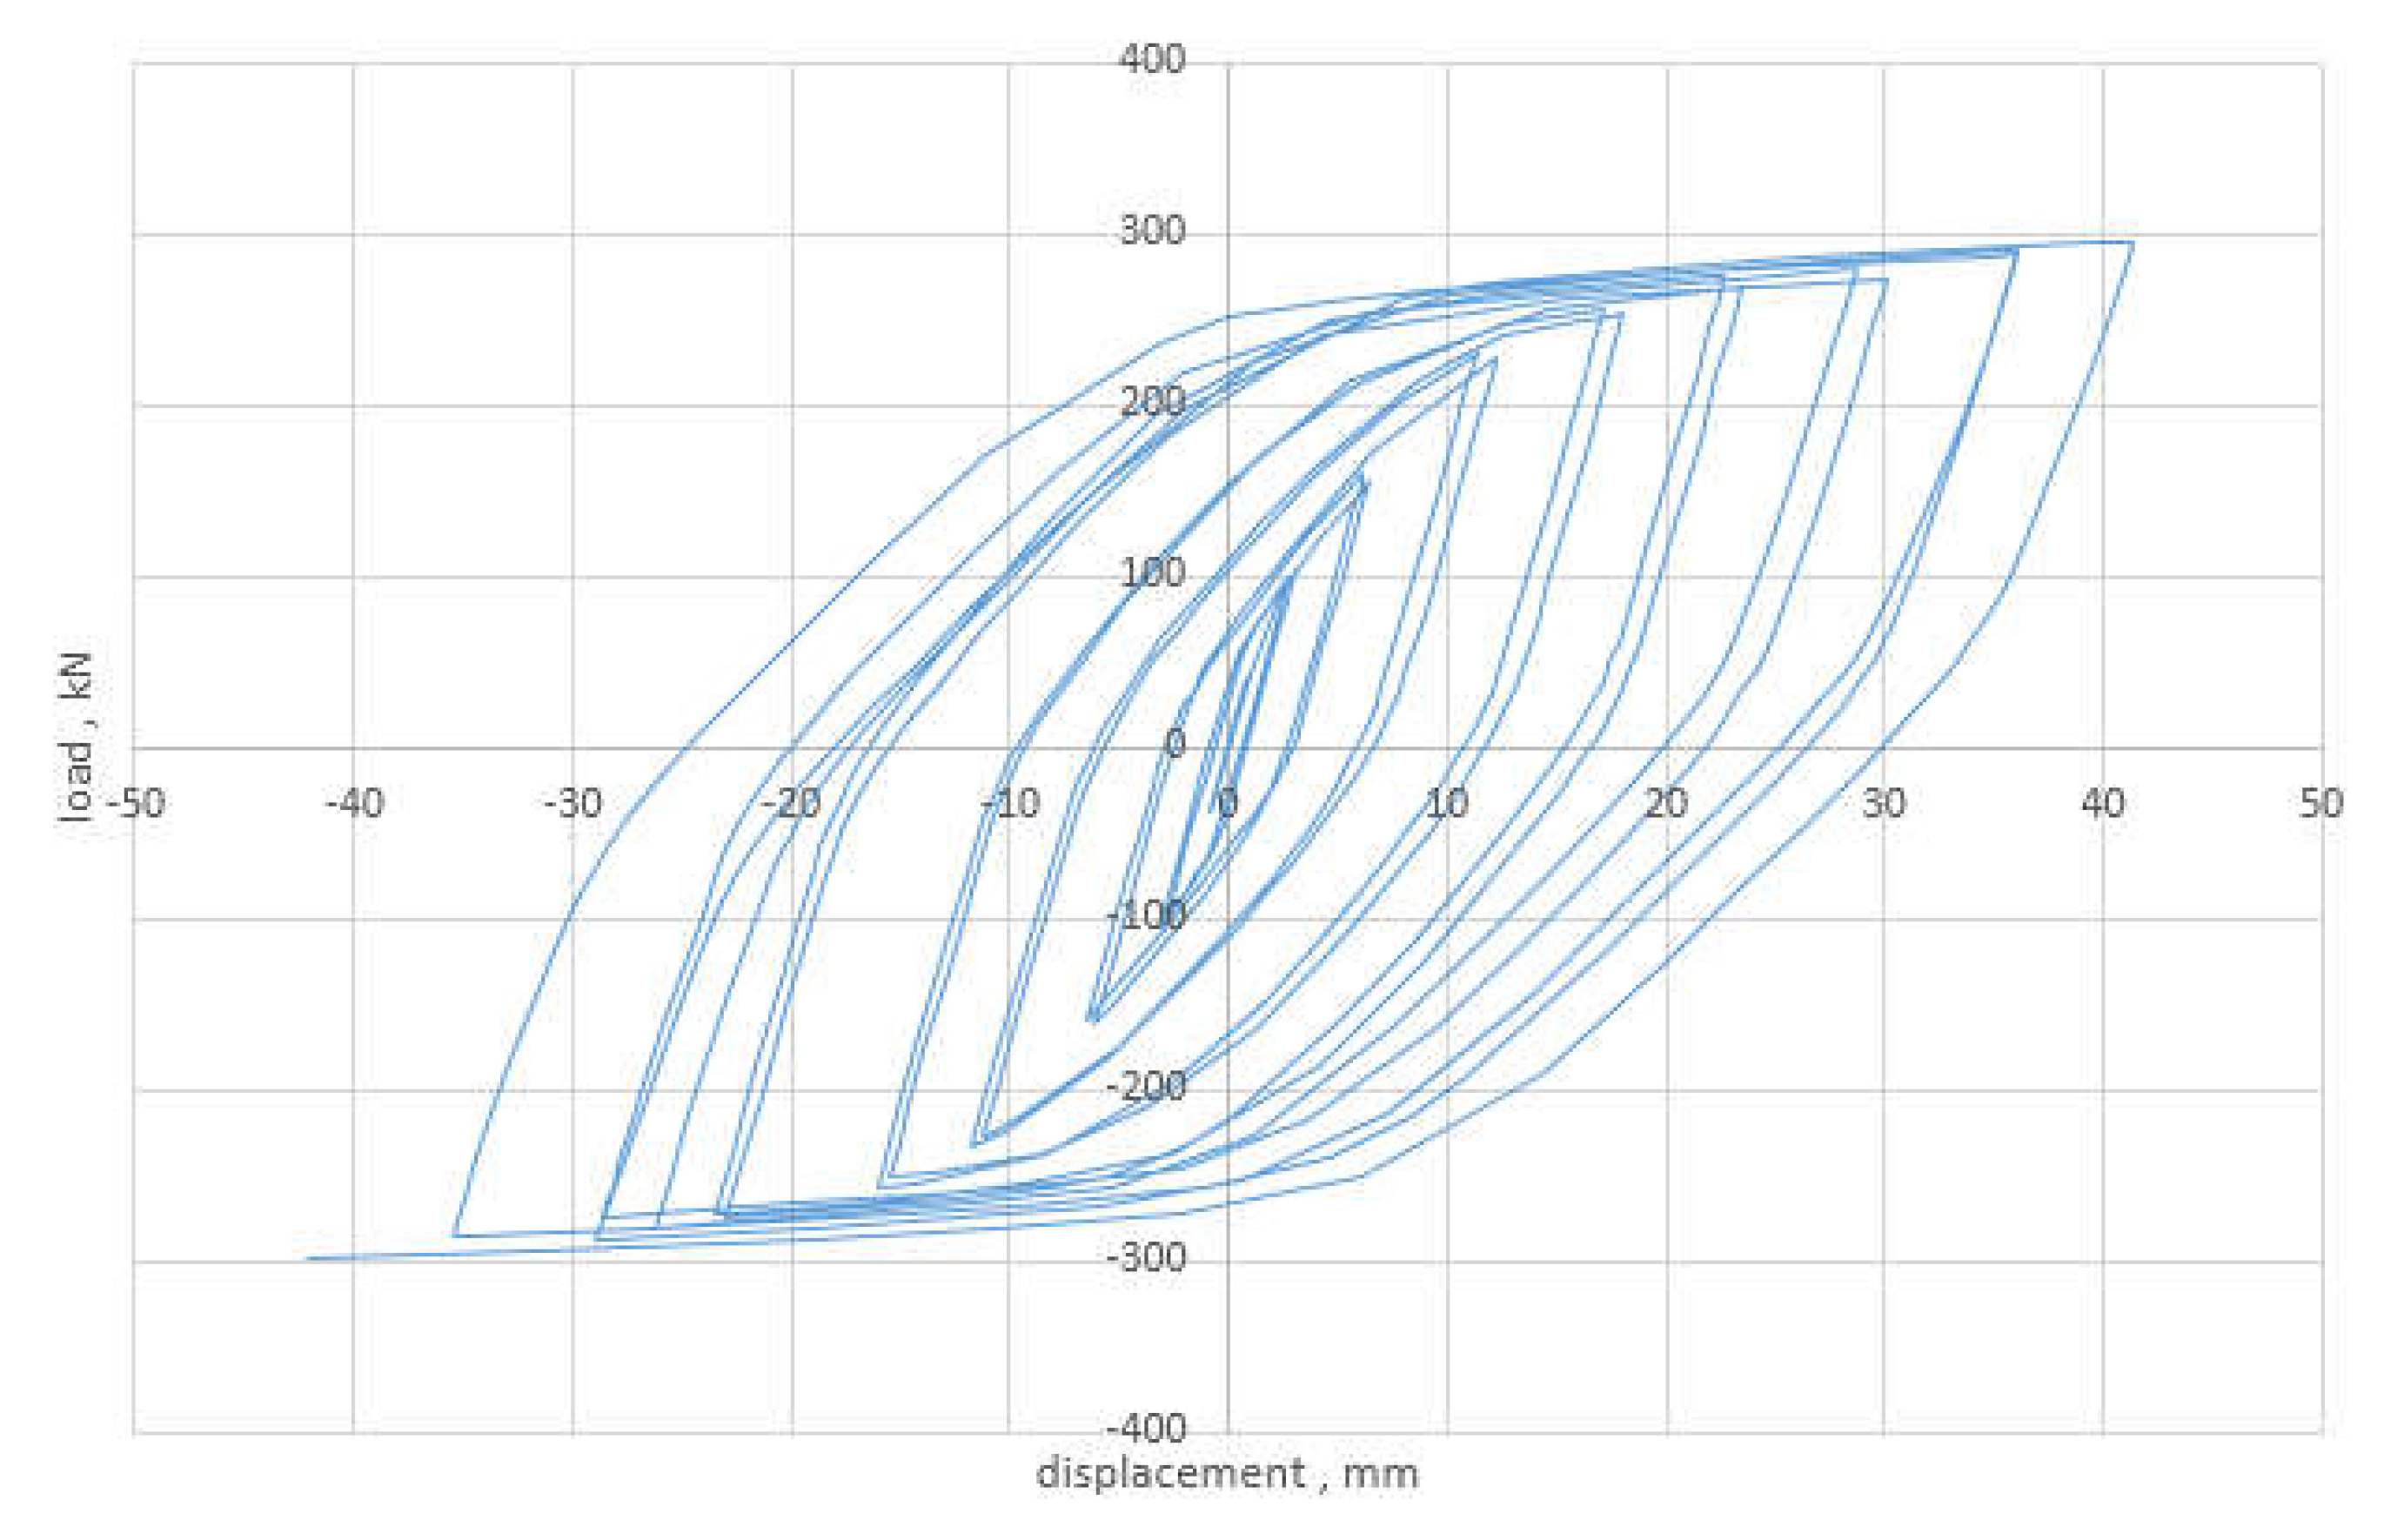
Figure 19 shows the hysteresis diagram due to loading on the frame.
As seen in
Figure 19, as with the previous two examples, the hysteresis curve created in the frame was changed by connecting the damper to the frame. The rings formed in this sample make a larger area compared to the similar case in the two samples; at the same time, the final strength of the structure has increased to some extent and has reached about 296 kN. With 1.5 times the thickness of the plate in the damper, the structure’s resistance increased by only 7%. However, the number of rings and their stability in loading, similar to the previous examples, show that it is possible to use the damper effectively and depreciate a large amount of energy input to the structure in this case.
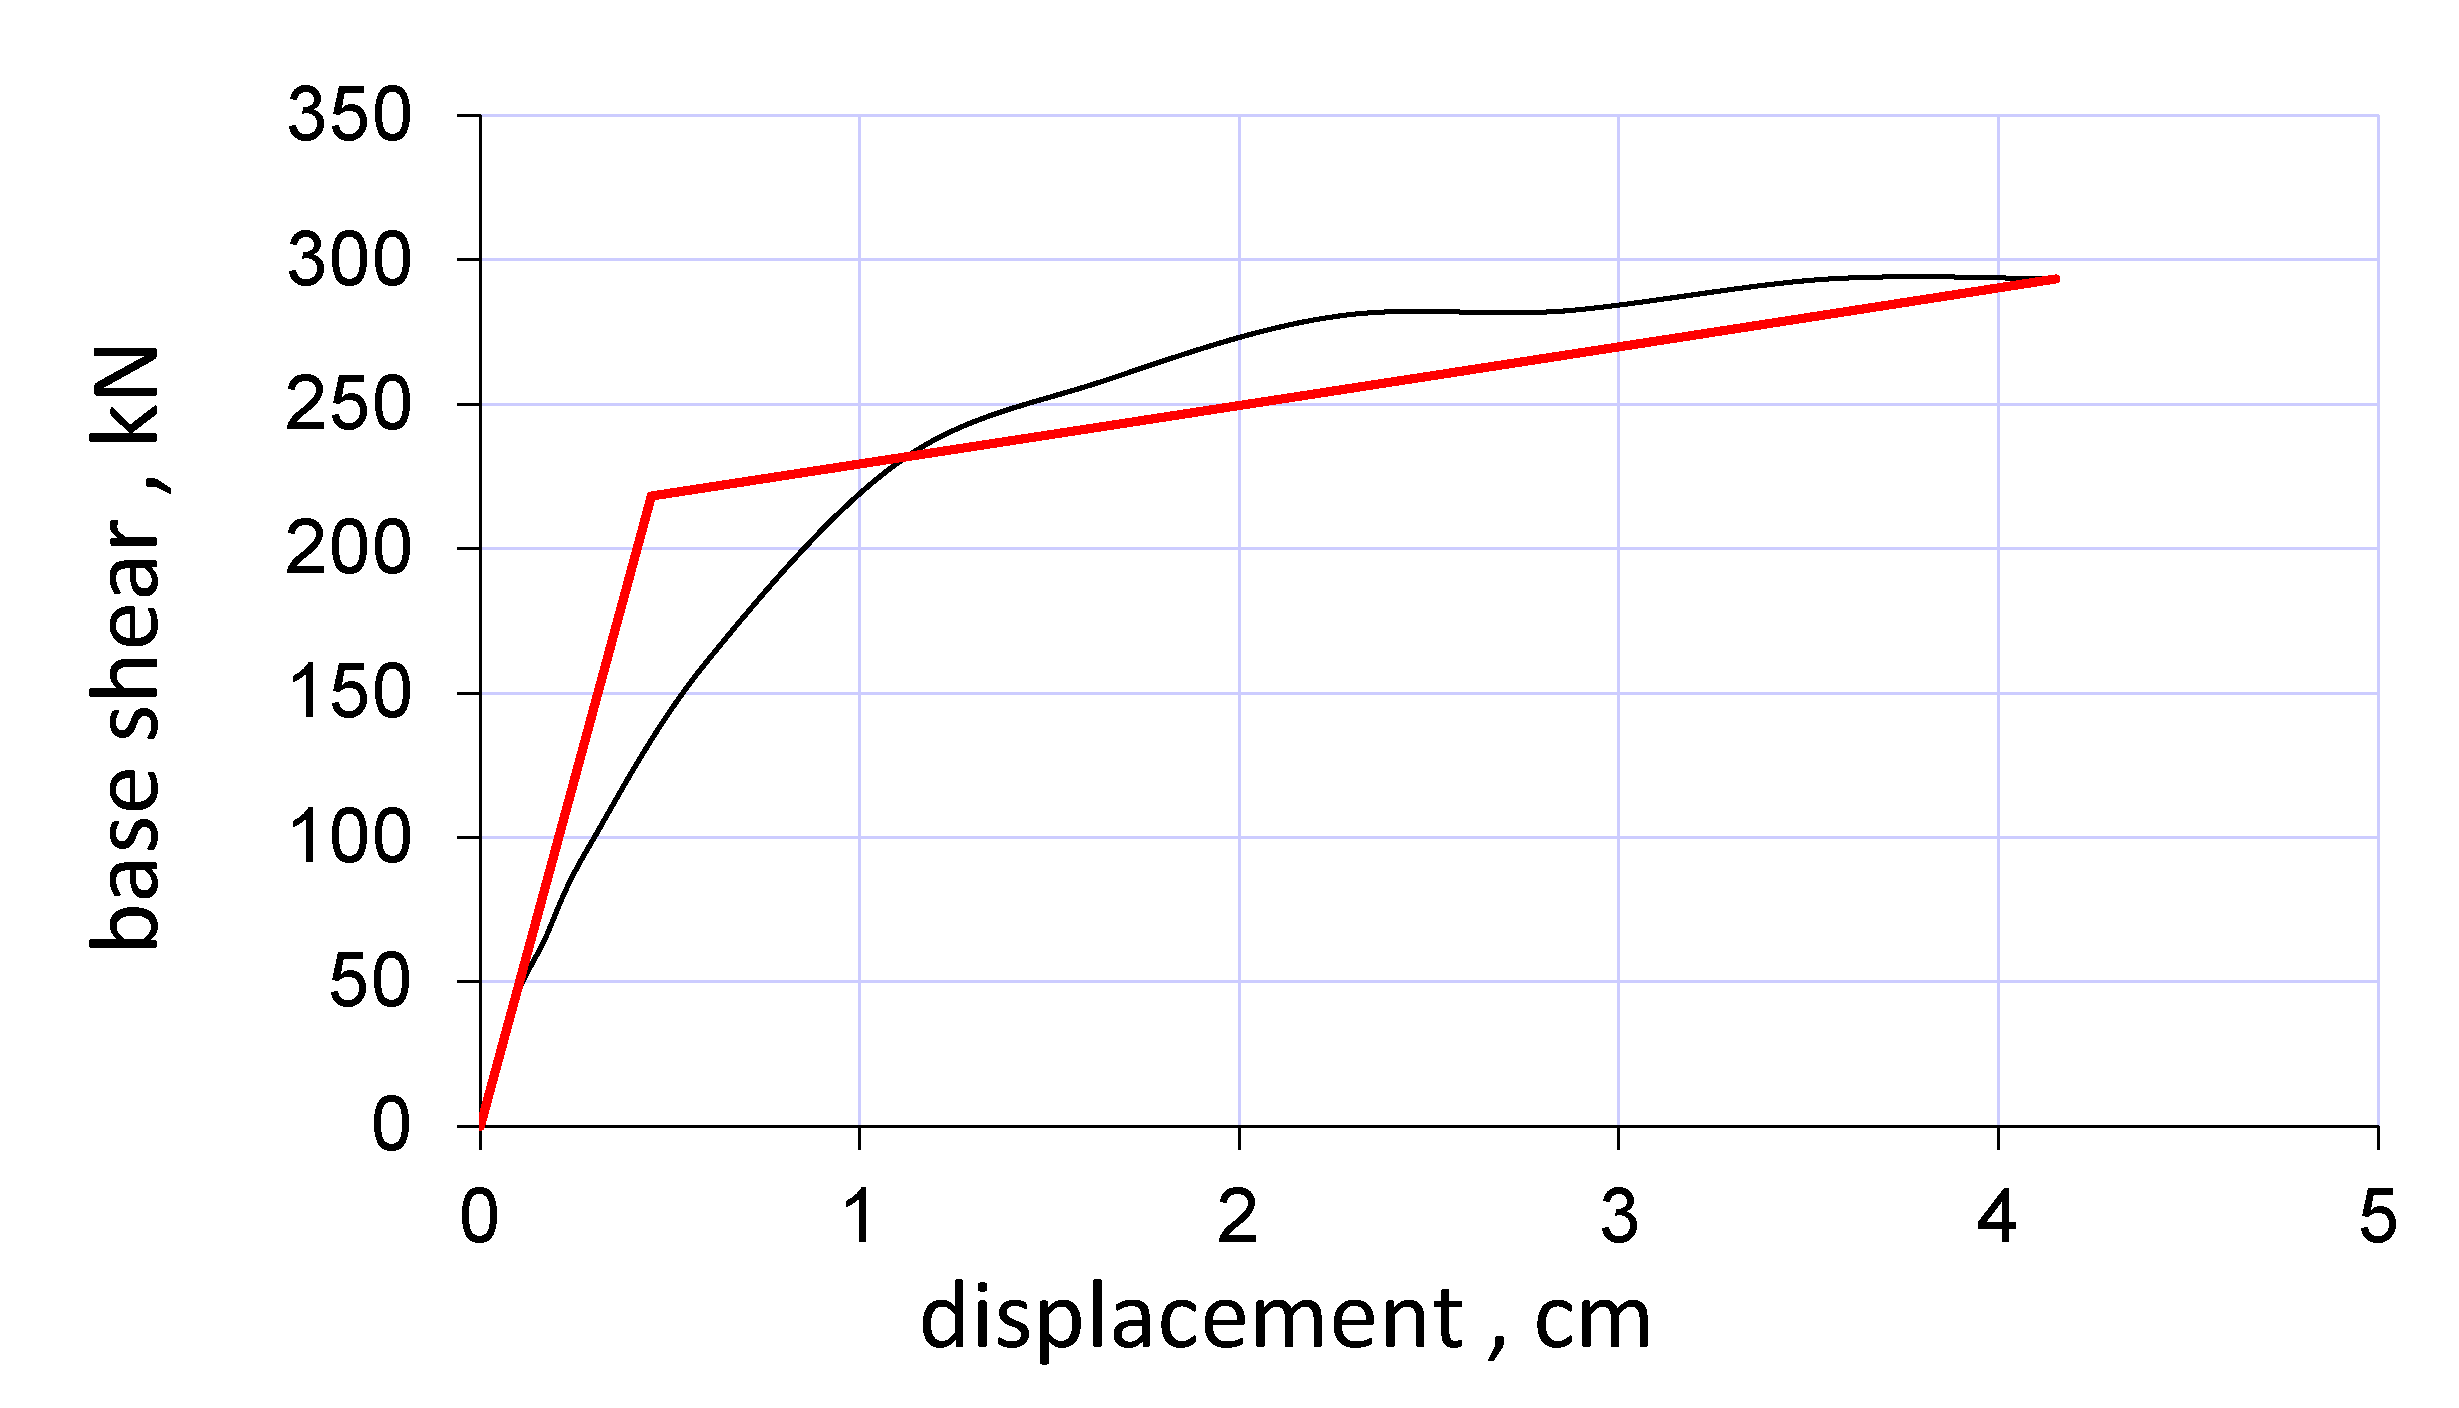
Figure 20 shows the two-line graph resulting from the cyclic loading curve.
As seen in
Figure 20, in this sample and the previous two samples, the bilinear behaviour resulting from the hysteresis graph cover, the separation between the curve and the first line of the graph, occurs at high speed. In this sample, the slope of the second line is approximately 4.4% of the slope of the curve in the first part, which shows a noticeable decrease compared to the previous samples. This problem shows the improvement of nonlinear behaviour due to the increase in the thickness of the plate web in the damper. The initial stiffness change from 2950 kN/cm of the single sample to 485 kN/cm in the sample connected to the frame shows the effect of the frame characteristics on the damper behaviour in this case. Examining the ductility of the structure indicates that, in this case, the ductility is greatly reduced.
Table 4 shows the characteristics resulting from the pushover curve of this graph.
As can be seen in
Table 4, plasticity decreased from 56.4 to 9.23. Although this reduction is noticeable, the structural scale of ductility 9.23 shows an outstanding value, which confirms the perfect behaviour coefficient of the structure against the incoming loads.
3.3. Sample (BT150, 8 mm)
3.3.1. Examining the Sample (BT150, 8 mm) Individually
Figure 21 shows the stresses formed in sample BT150, eight at the end of loading. In this sample, the characteristics of the damper remain the same, and the thickness of the body plate surrounding the box increased from 6 mm to 8 mm compared to the previous sample.
As it is clear from
Figure 21, as in the previous examples, the maximum stress is created in the web plate surrounded by the box plates. In this sample, due to the greater thickness of the surrounding plate, we observed a greater intensity of stresses, so the range of minimum stresses in this sample is extensive in the middle compared to the previous samples at the end of loading. There is almost no tension on the upper and lower sides of the damper, and these plates only act as a containment effect for the web plate.
Figure 22 shows the plastic strain in this sample.
As seen in
Figure 23, the structure of plastic strains, in this case, is mainly similar to the previous examples. The highest deformations of meta elasticity occurred in the web plate and on the sides of the stiffener, which in this sample reaches 4.7, which shows a slight decrease. The large dispersion of strains throughout the plate indicates that this part is yielded in shear and will absorb a large amount of incoming energy. Of course, in this sample, due to the non-uniform distribution of the strain, the plate can buckle and shear failure. It will increase sharply.
Figure 24 shows the hysteresis diagram resulting from the analysis of this sample in cyclic loading.
As shown in
Figure 24, the behaviour of the damper is entirely stable, and it has created rings with a suitable approximate area. In this case, the shape of the rings is closer to the square, and it shows that energy absorption is also improved in each step with the increase in the thickness of the wire and the increase in the tolerable cut. In addition, this issue shows that the damper can absorb a large amount of incoming energy and protect the structure against the incoming lateral force. The diagram indicates that the damper reached its maximum capacity, and the rings became almost horizontal. In this case, the maximum capacity of the structure has reached 314 kN, which shows an increase of 20% in the ultimate resistance.
Figure 24 shows the two-line graph resulting from the cyclic loading curve.
As shown in
Figure 20, this sample also shows the appropriate correspondence between the first line of the graph and the graph obtained from push, similar to the previous examples. In this sample, the slope of the line in nonlinear mode is about 0.31% of the slope of the curve in the first part, which is much higher than the first sample and almost the same as the second and third samples. The high plasticity of this sample is visible due to the intersection of the two and the intersection of the curve and the second line. This is an excellent example of the ductility behaviour of this damper against incoming loads and the possibility of using it effectively against incoming loads.
Table 5 shows the specifications resulting from the pushover curve in this case.
As it is known, the plasticity factor in this sample is very high and reaches about 62.5.
3.3.2. Examining the Sample (BT150, 8) as a Connection to the Braced Frame
Figure 25 shows the structure of the stresses created in the eccentrically braced frame.
As shown in
Figure 25, the previous examples of maximum stresses were formed in the shear body of the damper plate. Of course, parts of the connecting plate and brace have also entered the field of plastic, as with the previous examples. Of course, this state is more due to the conditions of the damper plate and the increase in its thickness, but again, in this case, since these values are small and do not cause visible deformation in the failure member, it can be ignored.
In this sample, the maximum value of the plastic strain index reached 4.46, which shows an increase of approximately 0.35 units compared to the previous sample, whose value was 4.1. The distribution of strains in this case, as with the previous examples, shows that this member shows a complete ductility behaviour and can fully play the role of a ductility member in the structure. It means that the behaviour of the members is articulated, and there is no bending deformation in the members. Of course, due to the increase in the thickness of the damper plate, a small amount of strain can be seen in the connecting plate and brace. Based on this, it can be said that all the anchor created in the structure is concentrated at the place where the damper is connected to the frame, and this member absorbs the created force with its shear-bending behaviour.
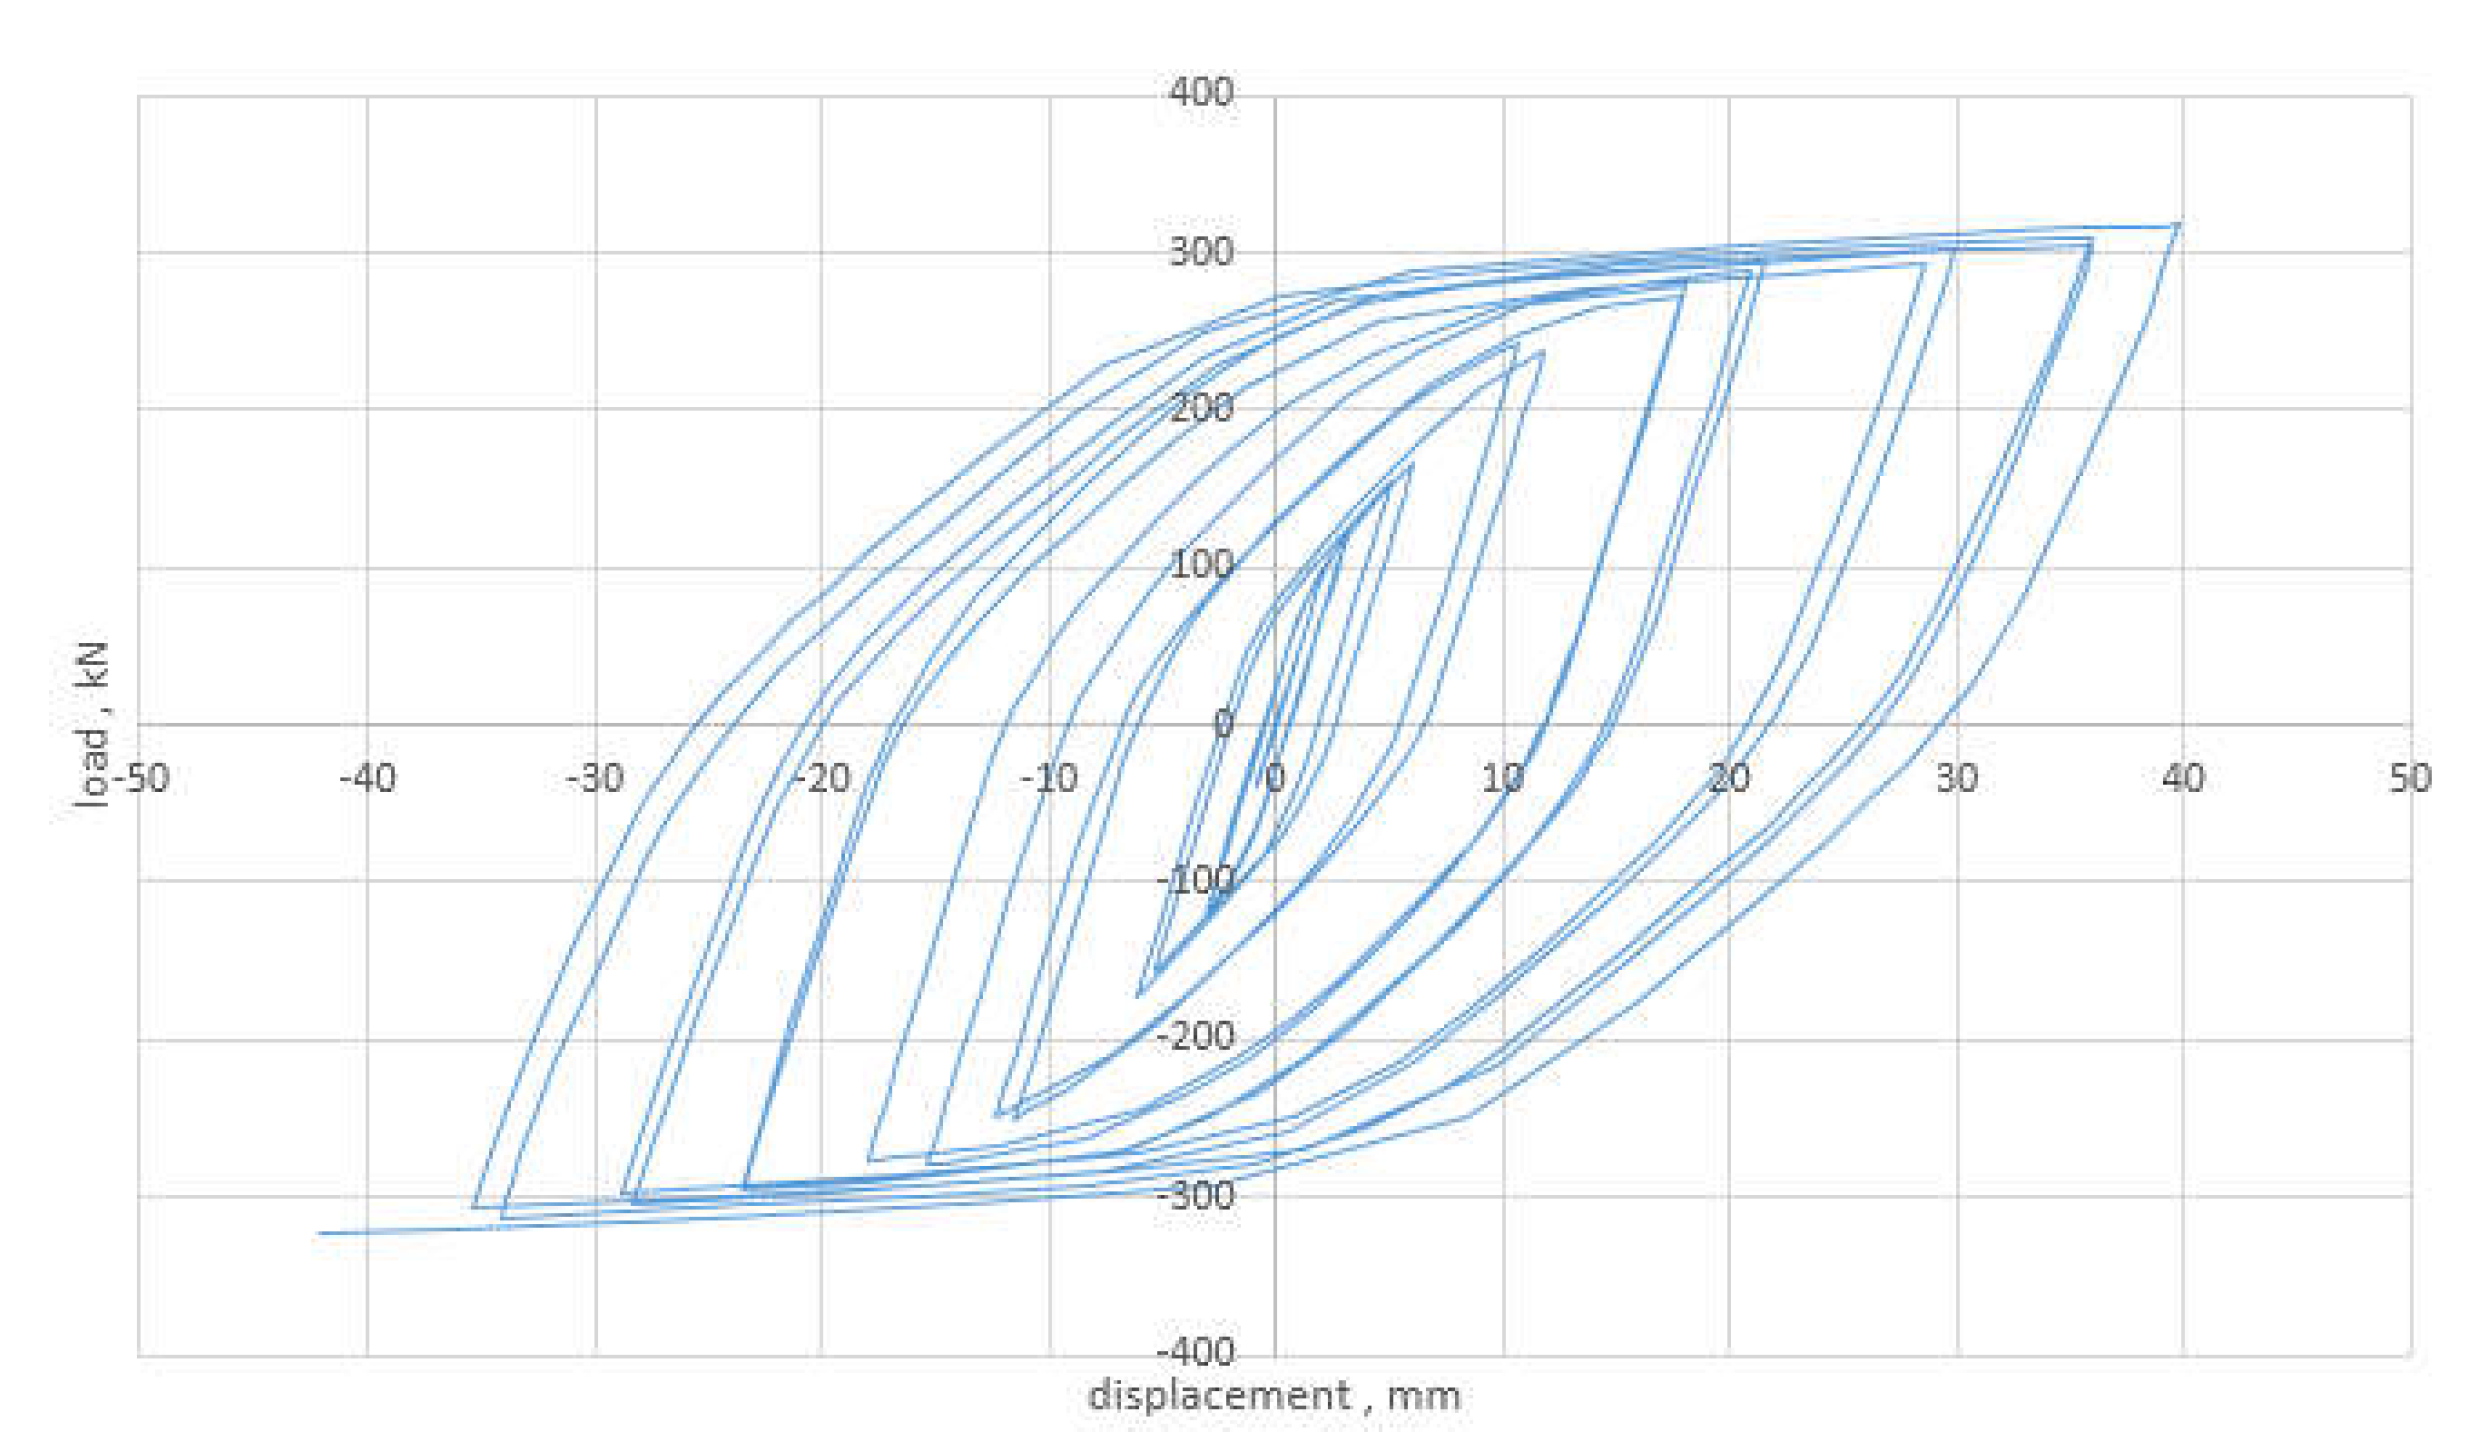
Figure 26 shows the hysteresis diagram due to loading on the frame.
As shown in
Figure 26, as in the previous examples, the hysteresis curve created in the frame was changed by connecting the damper to the frame. As a result, the rings formed in this sample make a slightly larger area compared to the similar case in the samples; at the same time, the final strength of the structure increased to some extent and reached about 320 kN. With the increase of 1.33 times the thickness of the plate in the damper, the structure’s resistance increased by only 8%. However, the number of rings and their stability in loading, similar to the previous examples, show that it is possible to use the damper effectively and depreciate a large amount of energy input to the structure in this case.
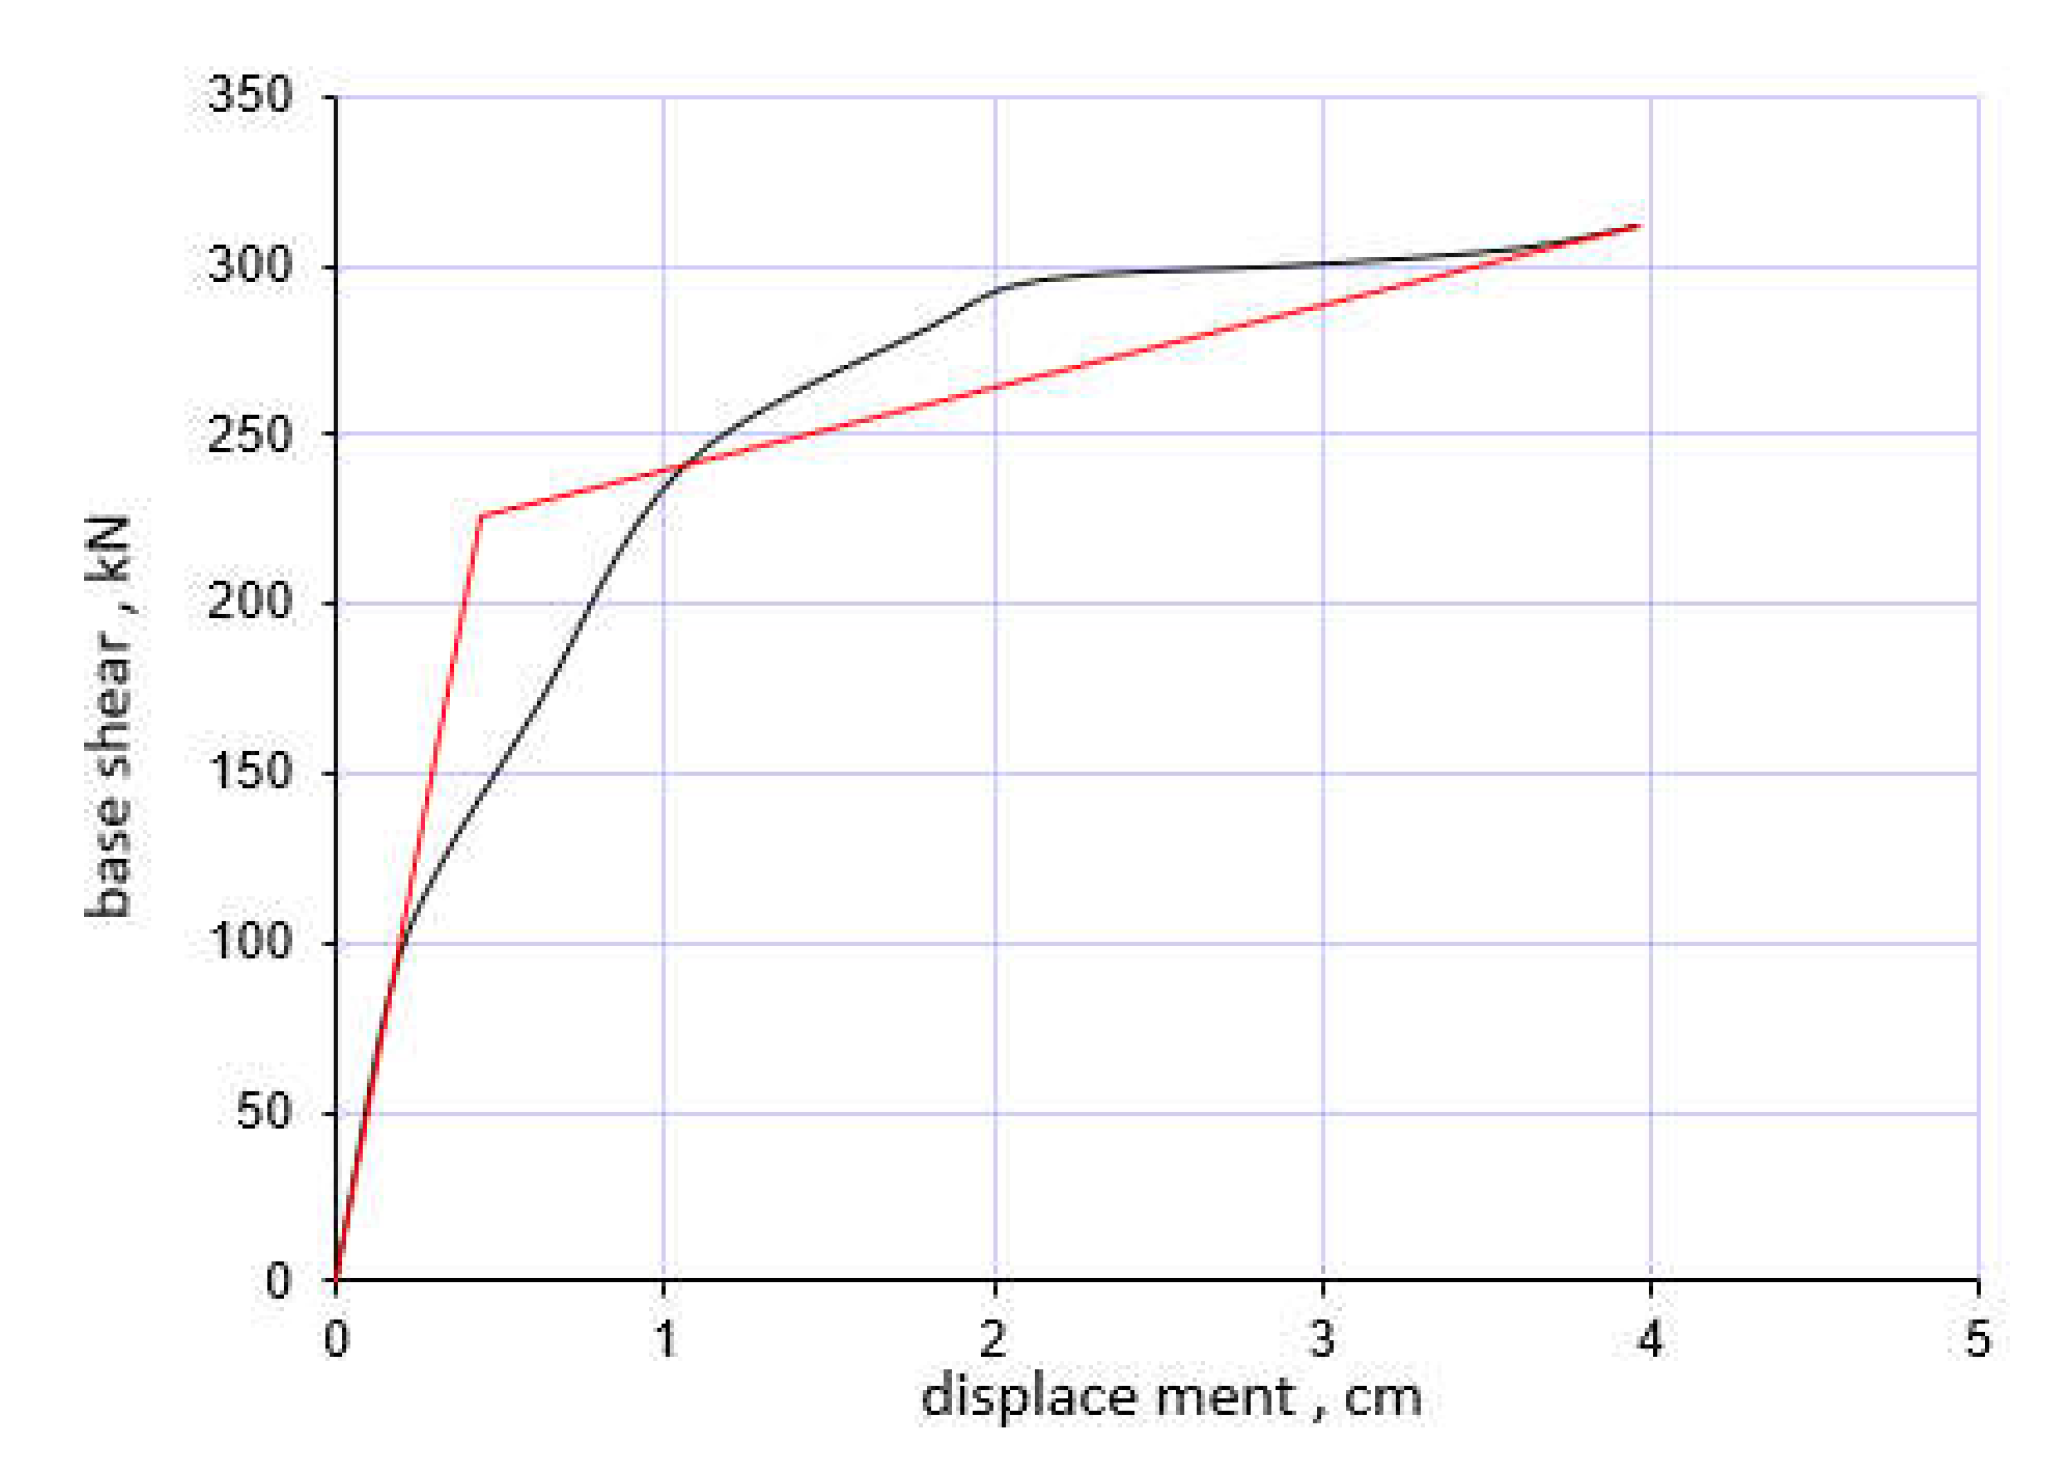
Figure 27 shows the two-line graph resulting from the cyclic load curve fitting.
As can be seen in
Figure 27, in this sample, as well as the previous two samples, the bilinear behaviour resulting from the hysteresis graph overlay, the separation between the curve and the first line occurs with a greater distance than in other samples, and the reason for this is the noticeable difficulty control. Lateral by the damper member and its increase in the structure. In this sample, the slope of the second line is approximately 4.6% of the slope of the curve in the first part, which is similar to the previous sample. This problem shows the improvement of nonlinear behaviour due to the increase in the thickness of the plate web in the damper. The initial stiffness change from 3800 kN/cm of the single sample to 525 kN/cm in the sample connected to the frame shows the influence of the frame characteristics on the behaviour of the damper in this case. Examining the ductility of the structure indicates that, in this case, the ductility is greatly reduced.
Table 6 shows the characteristics resulting from the pushover curve of this graph.
As can be seen in
Table 6, plasticity decreased from 65.4 to 10.6. Although this reduction is noticeable, in the structural scale of ductility, 10.6 shows an outstanding value, which confirms the structure’s very suitable behaviour coefficient against the loads.
3.4. Comparison of Results
As mentioned above, the area below the hysteresis curve specifies the energy dissipated from the loading process. As shown in
Figure 19,
Figure 23 and
Figure 26, the energy absorption of the third model with plates of 8 mm is more considerable relative to other models. The larger the area below the curve, the more significant the deformability and structure potential in dissipating energy; thus, the deformability of the third model is higher than other models. The symmetric hysteresis curve also indicates the uniform behaviour of the structure against reciprocating loads. Therefore, the third model has more uniform behaviour than the first and second models. Suppose the height of the hysteresis curve decreases in consecutive cycles. In that case, the structure suffers from strength degradation, and contrarily, when the curve height increases in each cycle, the structure hardens, and the strength increases from one cycle to another. Therefore, by observing the hysteresis curve of the models mentioned above, it can be found that all of the frames have a constant hardening slope. As a result, the energy absorption and deformability of the third model are 20.25% higher than the other model. The strength of the third model with plates of a thickness of 8 mm is higher than the two previous models.
4. Conclusions
Ductility is a feature that allows a structure to undergo large plastic deformations without any strength loss. Yield dampers are energy dissipation devices that increase the ductility and control the vibration of structures by absorbing earthquake input energy. All navigation systems in the past research require unique technology. Therefore, analysing and designing a system with simple techniques that can be easily prepared and installed is felt.
In this research, the seismic behaviour of the box damper and the effect of its use on the seismic response of the eccentrically brace frame were investigated. Based on this, it was determined:
In cyclic loading, suitable residual loops are formed on the single damper. This box damper is as stable as possible and does not have curvature or pinching.
By increasing the thickness of the web in each stage of cyclic resistance, elastic stiffness, energy absorbed by the damper, and even increased ductility and stability in the behaviour of the dampers. For example, by increasing the thickness of the damper from 2 to 8 mm, the resistance increases by two times.
Examining the linear graph resulting from the structure’s hysteresis curve shows the damper’s excellent ductility in the individual mode, which can be considered an essential indicator in the seismic design of structures equipped with this damper. Furthermore, the ductility of the structure has a noticeable change with the increase in thickness, as the ductility increases from 38 to 75 mm with the increase in thickness from 2 to 8 mm.
When connecting the damper to the bracing frame, all plastic deformations accumulate in the damper area. This issue shows that combining the damper with the braced frame can effectively control the frame’s seismic behaviour and depreciate a large amount of energy input to the structure.
By connecting the damper to the frame, the resulting hysteresis behaviour changes completely, showing the frame members’ influence on the damper’s behaviour and the interaction between them. In this case, the resistance of the damper is usually increased, but the hysteresis loops are smaller and show less stiffness than in the single point. For example, in the connection of the damper with a thickness of 150 mm and a thickness of web 4 mm, we see a 16% increase in the final strength of the structure.
When the damper is connected to the frame, its ductility is greatly reduced, but we see a good ductility in the system in this case, which shows an average ductility of about
Finally, it was found that although some of its characteristics are reduced when connecting the damper to the frame, the stability of the hysteresis rings showed that this tool could be used effectively to control the seismic behaviour of structural structures used effectively.
Based on results obtained after an earthquake, damage concentration on the energy absorbing plates and other structural members being kept in the elastic region, the structure can be deployed again only by replacing damaged plates; this indicates that these parts are economical to be used for seismic design of modern steel structures and refurbishment of existing structures against earthquakes.
Given that the geometry and dimensions of absorbing plates and positioning and locating plates with the proper distance affect the deformability, energy absorption, and stable hysteresis curve, it is hoped that more attention is focused on these subjects in future research works. Moreover, by adding some horizontal elements to the vertical link, we can increase the plastic hinge area, resulting in improved energy absorption.


