Article

A Contractor-Centric Construction Performance Model Using Non-Price Measures

Centre for Smart Modern Construction, School of Engineering, Design and Built Environment, Western Sydney University, Kingswood, NSW 2747, Australia
*
Author to whom correspondence should be addressed.
Buildings 2021, 11(8), 375; https://doi.org/10.3390/buildings11080375
Submission received: 12 July 2021 / Revised: 13 August 2021 / Accepted: 19 August 2021 / Published: 23 August 2021
(This article belongs to the Special Issue Procurement in Construction Industry)

Abstract

:
Selecting a better performing contractor at the procurement stage is crucial in achieving a successful outcome for a construction project. The construction industry lacks a systematic and purpose driven method to assess performance of contractors using objective metrics. There are many approaches to measuring construction performance, but most are complicated and have high dependency on data that is difficult to attain. This paper aims to create a model for evaluating construction contractors’ performance based on directly attributable measures that are quantitative and easy to gather. This makes such a model more attractive and easier to use. Initially, a detailed literature review revealed different categories of measures of performance (MoP) and corresponding critical measures of performance (CMoP). Through a series of Delphi-based expert forums, the set of measures were fine-tuned and shortlisted. Fuzzy analytic hierarchy process-based comparisons were then used for developing a contractors’ performance model to quantify their level of performance based on a limited set of organisation-specific and project-specific measures. The results indicate a shift from traditional measures and a higher preference towards non-price measures. The performance model can be further developed to systematically rank the prospective contractors at the procurement stage based on seven non-price measures.

1. Introduction

Contributing around 13 percent of Gross Domestic Product (GDP), construction is one of the largest industry sectors with an annual spending of about USD 10 trillion worldwide [1]. However, it significantly lags in performance compared to other industries with nearly 70% of the projects suffering time and cost overruns and flat lined productivity growth [1,2]. Performance reflects the success of a project and is judged and quantified through performance measurement [3]. A construction project is considered to be successful if it is able to meet the project objectives with minimum variations [4]. To achieve project success, selecting a better performing contractor is pivotal [5,6]. Conversely, in the traditional procurement system, the adversity and uncertainty experienced in any construction project, coupled with an unsuitable choice of a contractor, are known to be causes of underperformance [7].
The contractor selection process attempts to assess a contractor’s capability based on price, past performance and performance potential [6]. According to Holt et al. [8], a contractor selection technique would be effective if the candidate contractors’ capability in terms of performance requirements can be evaluated. Consequently, predicting the performance of the contractor has become imperative [9]. It requires identification of possible measures. Performance measurement is conducted in various streams where critical success factors (CSF), success criteria (SC), key performance indicators (KPI) and contractor selection/prequalification criteria (CSPC) can be considered as measures of performance (MoP).
Previous research has identified MoPs considering the overall construction project without specifically focussing on the contractors, thereby leading to MoPs that could unreasonably be attributed to the contractors. Another gap exists with the typical top-down approach of initially identifying different aspects of performance and then deciding on suitable metrics to capture them. It eventually leads to the reliance on qualitative measures resulting in subjective judgments, such as in the benchmarking model developed by Yeung et al. [10]. In contrast, this study uses a set of simple and easy to capture critical measures of performance (CMoP) that are quantitatively measurable, within the control of the contractor and significant to the overall project performance, when comparing different categories of MoPs.
Generally, the performance measurement is limited to traditional financial measures [11]. However, Ashton [12] was of the view that financial measures promote reactive method of management and mostly focus on short term goals whereas non-price measures promote proactive method of management and lead towards long term goals. Ali et al. [13] added that financial measures have been long criticised due to their limitations, retrospective outlook and the inability to reflect current value-creating actions. This insufficiency has led to increased interest of nonfinancial measures, such as client and user satisfaction, project functionality, freedom from defects and absence of legal claims [14]. Although the focus of the study was for non-price measures, some price related measures were also initially included in the ten measures of performance and their corresponding critical measures. The reason for such inclusion was to provide an overview of different measures and obtain informed opinions of the experts, without directly dropping all price related measures.
By reviewing literature on different measures of performance used to evaluate performance in construction industry, ten categories of MoPs were identified alongside possible CMoPs that are reflective of the respective categories. Through a comprehensive Delphi-based expert review process, the MoPs were shortlisted and subjected to pairwise comparisons using fuzzy analytic hierarchy process (Fuzzy AHP) to calculate the corresponding weights. Finally, a contractor-centric performance model, identifying critical measures of performance and respective weights, was developed based on the outcomes of the expert forum rounds.

2. Literature Review

Literature related to different kinds of measures of performance including SC, CSF, KPI and CSPC was reviewed, and key areas were identified. Table 1 provides a summary of the relevant MoPs and CMoPs identified and proposed.
As one of the most accident-prone industries in the world, construction accounts for many work-related deaths and injuries [3,15]. According to Egan [16], the health and safety record for the construction industry was the second worst for any industry. Therefore, prominence has to be placed on health and safety aspects in the construction industry [17]. Furthermore, safety performance can be considered a primary measure of success [18] and a project is highly unlikely to be declared successful if safe working conditions are lacking [4]. Hence, it was considered an essential constituent for a performance model.
Quality is a fundamental need for clients, and is a key factor of client satisfaction [19]. Xiao and Proverbs [19] found that the clients’ long-term interests lie in the high quality of their projects where the work performed conforms to the established specifications. Quality consciousness is an important attribute for the measurement of the success of an organisation [20]. At present, there is no objective recognised method of measuring quality in the construction industry [21].
Cost, as the basic financial measure, includes the overall cost that a project incurs from inception to completion covering the costs arising out of variations and legal claims [22] and the basis of performance measurement comes in the form of a measure associated with overrun or underrun [23]. Despite being a price measure, cost was included as a measure of performance for the initial rounds of expert discussions. The majority of the previous researchers considered organisational financial performance-related measures when selecting a contractor. Since the industry is project based, each project has a greater influence on the overall financial performance of the contracting organisation [24]. Conversely, better financial health of a contractor could indicate better performance of their projects. There are many financial measures used for assessing organisational performance. Since the financial reports are generally analysed at contractor selection stage, obtaining such financial measures is quite possible and practical.
According to Silva et al. [25], time refers to the agreed or approved duration for the completion of a project. Time, which is specified prior to commencement of construction, is usually taken as the elapsed period from the commencement of site works to the completion and handover of the constructed asset to the client [15]. On-time completion is a target set to achieve by constructors. For individual project success as well as overall organisational success, managing project schedules is a key metric, as it will ensure the effective utilisation of the completed facility by the client as planned [26]. Ineffective time management leads to delays, loss of revenue and loss of productivity [26]. Based on these reasons, ‘Time performance’ was identified as a category of MoPs that reflects a project’s performance.
Human resources are the lifeline of any organisation, especially if it is related to a labour-intensive industry like construction. Measures related to having a capable, competent and committed team and the adequacy of labour/trained resources were highlighted from previous research (please refer to Table 1). Therefore, categorising ‘Human resources strength’ is justifiable concerning the heavy reliance of human resources in the construction industry. Another important criterion for contractor evaluation was experience and track record [27]. Past project experience in terms of type and scale, is often considered as a predictor about the contractor’s performance. Based on the prominence given, it is reasonable to identify ‘Experience and track record’ as a separate category of MoPs for this study.
The construction industry has a greater obligation towards environmental performance since it is a heavy consumer of natural resources as well as being a large polluter. A series of environmental performance indicators can help the construction organisations to direct their focus and resource deployment towards better environmental performance [28]. According to The KPI Team [29], the KPI related to environment was viewed in two aspects, product performance vs. construction process performance. Project planning is the process of deciding what and how to do before action is required [30], and is a continuous process that spans throughout the delivery of a project [31]. Measures such as ‘planning efficiency’ and ‘planning effectiveness’ are often used to assess the level of planning performance. It is evident that project planning is a continuous process that ultimately affects time, cost and other performance outputs.
Productivity, being a fundamental value adding function, is defined as the ratio between output of a production process to its corresponding input [32,33,34]. It measures how well resources are leveraged to achieve the desired outcomes [35]. Often, it is measured and indicated as labour productivity [36]. The importance of good labour productivity was highlighted by Doloi [37], stating that an unproductive workforce will be detrimental to the time management, workmanship, use of materials, safety, and profitability of a project. Therefore, it is an important measure of performance.
Table 1. Measures of performance.
Category Candidate Measures of Performance Identified from Literature Proposed Critical Measures of PerformanceReferences
Health and safety performance
(HS.MoP)
Keeping health and safety records, Having an effective health & safety management plan, Having favourable working conditions, Experience Modification Rating, Incident rate/Near miss incident frequency rate, Number of incidents notifiable to a regulator, Accident frequency, Lost time injury rate/Lost time frequency, First aid frequency rate, Accident gravity, Number of notices and fines received from health and safety regulators
  • Reported incidents rate = number of reported incidents/100,000 h worked
  • Lost time injury frequency rate = Number of lost time injuries/Total hours worked × 1,000,000
  • Number and amount of fines received from health and safety regulators
[4,6,10,33,38,39,40,41,42,43,44,45,46,47,48,49,50,51,52,53,54,55,56,57,58,59,60,61,62,63,64,65,66,67]
Quality performance
(QP.MoP)
Commitment to achieve expected quality, Quality of product/Freedom from defects, Emphasis on high quality workmanship, Rework/Rework efficiency, Construction field rework index, Defects/Punch list value/Punch list time, Quality control/management/assurance system
  • Number of non-conformance reports
  • Construction rework index = Total cost for rework/Total construction cost
  • Time taken to rectify all defects
[4,5,6,10,33,38,39,40,41,42,43,44,45,47,48,49,50,51,52,53,54,55,56,57,58,59,60,61,62,63,64,65,66,67,68,69,70]
Cost performance
(CP.MoP)
Cost expectation, Preparing accurate cost estimates, Within budget/Under budget/Minimising cost, Cost growth: Project/construction phase, Project cost control, Budget factor, Cost predictability: Design/construction, Unit cost/Cost per unit at tender, Cost in use
  • Project budget factor = Actual total project cost/(Total project estimate at tender + Approved changes)
  • Cost predictability (construction) = (Actual construction cost—Estimated construction cost × 100)/Actual construction cost
[4,6,10,23,33,38,39,40,41,42,43,45,47,48,49,50,51,52,53,54,55,56,58,60,62,63,65,68,69,70,71,72,73,74,75]
Financial performance
(FP.MoP)
Having favourable turnover history/growth in revenue, Having a favourable cash flow forecast, Revenue & profit, Profitability, Possessing quick liquid assets, Bank credit/Credit rating, Having a favourable credit history, Having a favourable bonding capacity
  • Percentage increase in average annual turnover in the last 5 years
  • Gross profit margin ratio = Gross profit/Sales revenues
  • Debt ratio = Total liabilities/Total assets
[6,38,40,44,45,47,51,53,57,58,59,60,61,62,63,64,65,66,69,70,75,76]
Time Performance
(TP.MoP)
Completing the project on time, Minimising project duration, Schedule deviation, Project time control, Schedule growth: Project/construction phase, Schedule factor: Project/construction phase, Time predictability: Design/construction, Updating the schedule/programme regularly, Time per unit at tender
  • Time variance = (increase or decrease in actual total project duration − Extension of Time/original contract period
  • Time predictability (construction) = 100 × (Actual construction duration—Estimated construction duration)/Actual construction duration
[4,6,10,33,38,39,40,41,42,43,44,45,47,48,50,51,52,53,54,55,56,58,60,62,63,64,65,66,68,69,70,71,72,74,75,77]
Human resources strength
(HR.MoP)
Effective allocation of manpower, Adequacy of labour/trained resources, Having fulltime employees, Having a favourable employee culture environment, Worker turnover, Having a contingency plan to manage possible turnovers, Absenteeism, Availability of qualified, skilled staff, Highly performing staff, Having high team spirit/morale of the staff team, Motivation
  • Adequacy of labour (Skilled vs. unskilled man hours)
  • Worker turnover rate = Number of employees leaving during the project period × 100%/Average number employed during the project period
[5,23,33,44,45,46,47,48,49,55,57,58,59,60,61,62,63,64,65,66,67,68,69,71,72,73,75,76,78,79]
Experience and track record
(EX.MoP)
Experience in similar type projects completed, Experience in similar size projects completed, Failure to have completed a contract
  • Number of similar type and size projects completed
  • Number of failures in completing a contract
[6,44,45,47,57,58,59,60,61,63,65,67,69,70,73,75,76,79]
Environmental performance
(EP.MoP)
Environmental management system maturity, Having an environmental impact/performance plan, Environmental sustainability, Having proper waste disposal during construction, Reduction of waste, Less environmental complaints
  • Volume of total waste removed from site
  • Number of environment related complaints and fines
[10,38,39,40,41,42,43,44,47,49,52,54,65,67,70]
Project planning performance
(PP.MoP)
Effective project monitoring mechanism, Adequate planning and control techniques, Effective strategic planning, Change readiness, Change management, Proper management and supervision of the site, Project understanding, Availability of backup strategies, Systematic documentation, Availability of complete and detailed drawings, Planning effectiveness, Planning efficiency
  • Planning effectiveness = number of activities completed/number of activities programmed
  • Hit rate percentage = Total number of activities having zero start or finish variance value/Total number of activities in a package
[5,46,47,48,49,50,53,56,69,71,72,78]
Productivity achievement
(PR.MoP)
Efficient use of resources, Units per man hours, Engineering productivity factor, Construction productivity factor (Physical work), Construction productivity factor (Cost), Productivity estimate accuracy, Resources management/Efficient use of resources, Earned Man Hours, Lost time accounting/Idle time
  • Labour productivity = actual labour input/Actual completed work
  • Lost time accounting (Man hours lost due to idle time)
[4,33,38,40,43,50,51,53,55,56,68,74]

3. Methods

This research used a mixed-method approach for creating a performance model to evaluate contractors’ performance based on project and organisation records. Initially a traditional literature review was carried out to identify categories of measures of performance (MoP) and corresponding critical measures that can be used to represent each category. The key steps in developing the basic performance model were carried out in four expert forums based on the Modified Delphi Method (MDM) and Fuzzy Analytic Hierarchical Process (FAHP), as illustrated in Figure 1 and explained subsequently.

3.1. Expert Forums Based on Modified Delphi Method

3.1.1. Modified Delphi Method

Delphi method is a highly structured technique used to extract the maximum amount of unbiased information from a panel of experts and to achieve a consensus [80,81]. Ameyaw, Hu, Shan, Chan and Le [82] highlighted that Delphi methods are increasingly being applied in construction, engineering and management research during the last three decades. Although Delphi studies are traditionally considered as qualitative, past two decades have experienced the emergence of more quantitative versions with carefully designed research and statistical data analysis approaches [82]. According to Biggs et al. [83], such combination of qualitative and quantitative methods with a panel of experts is often referred to as a ‘Modified Delphi Method’ (MDM). Delphi process involves several steps. After the appointment of a panel where members have expertise in the relevant topic, an initial round of data collection is performed and analysed. The results are then circulated in the second round of data collection, where the panellists can compare their answers against others and then revise or affirm in the subsequent round [81]. The process is repeated until consensus is reached.

3.1.2. Selection of the Experts

The success of a Delphi process principally relies on the choice of the panel of experts. Generally, non-probability purposive sampling can be used for selecting the experts based on their knowledge, experience and expertise [81]. Accordingly, the researcher has to rely on his or her judgment to perform the selection that enables answering of the research question the best. Saunders [81] further stated that the issue of sample size is vague in non-probability sampling and have flexible rules. Since generalisation is made to theory, unlike to a population, the logical relationship between sample selection and the focus of the research is more important [81,84]. The ‘Guidelines for the Rigorous Implementation of the Delphi Research Method’, presented by Hallowell and Gambatese [85], were applied for selecting the experts. The number of experts to be included in a panel is another important discussion regarding Delphi-based studies. Ameyaw, Hu, Shan, Chan and Le [82] stated that an optimal size of the Delphi cannot be concluded as the literature extends to a wide range regarding the numbers. However, more than 70% of the papers which mentioned the Delphi panel sizes had between three to 20 panellists. Eight potential experts were identified based on the set of selection criteria and five of them agreed to participate and their profiles are presented in Table 2.

3.1.3. Data Collection Techniques

Interviews combined with questionnaires were used as the data collection techniques for the expert forums. Since the requirement was to obtain feedback from small group of respondents (experts), it was important that the particular persons could be reached and achieve very high response rates. As the Delphi method require several rounds, the time taken to complete collection of questionnaires had to be minimised where possible. Additionally, it was required to guide the respondents at least at the initial round, in order to clarify any ambiguities and to extract more details about their ratings. Considering all these factors, a combination of both face-to-face and online-based questionnaires were used for the expert forums.

3.1.4. Expert Forum Round 1

The online survey tool ‘Qualtrics’ was used to design the questionnaire, which was shared with the five experts, via email. The experts were instructed to select one CMoP from each category, that is best representative of the contractor’s performance, which can be easily obtained from completed project records. For each MoP, the experts were given the opportunity to introduce any other CMoP as an alternative. The results were extracted and summarised for use in round 2.

3.1.5. Expert Forum Round 2

Individual online interviews were conducted as follow-up to the online questionnaire survey in round 1. Each expert was informed about the spread of the answers received for the choice of CMoP for each category and requested to justify their own choices. The experts were also given the opportunity to change their answers if required. The interviews were recorded, transcribed and analysed.

3.1.6. Expert Forum Round 3

Expert forum 3 was conducted with the intention of shortlisting the categories of MoPs and obtaining consensus on overall choice of respective CMoPs. The shortlisting was proposed based on the findings of previous rounds and the domain knowledge. The MoPs (and CMoPs) were assessed based on accessibility of data, ability to compute and fairness in reflecting contractor’s performance. These details were presented to the experts through a second online questionnaire survey and were requested to indicate their level of agreement using a five-point Likert scale where 1 = Very Low, 2 = Low, 3 = Moderate, 4 = High and 5 = Very High. The results were extracted and summarised for analysis.

3.2. Expert Forum Based on Fuzzy Analytic Hierarchy Process

Developed by Saaty [86], Analytic Hierarchy Process (AHP) uses pairwise comparisons to analyse and organise quantifiable and non-quantifiable factors in a scaled systematic manner [87,88]. With respect to a given attribute, pairwise comparisons are made using a scale of absolute judgments which represent the extent to which one element dominates another [86]. However, according to Saaty [86], AHP is more suitable for crisp-decision applications rather than to situations which require both quantitative and qualitative attributes. By adding fuzzy logic into AHP, van Laarhoven and Pedrycz [89] extended it as Fuzzy AHP (FAHP) with the use of fuzzy triangular membership functions. FAHP eliminates the reliability issues in traditional AHP where uncertainty was not dealt properly [90]. According to Ozdagoglu and Ozdagoglu [91], in traditional AHP, the numerical values are exact crisp numbers, whereas in the FAHP method they are intervals between two numbers with most likely value. They further stated that, while linguistic values can change from person to person, taking the fuzziness into account will provide less risky decisions.

3.2.1. Fuzzification

The first step in fuzzifying crisp numbers is to assign a fuzzy membership function. Accordingly, fuzzy set theory provides the mechanism for an element to partially belong to a set, through the use of membership functions [92]. There are several fuzzy membership functions used, such as triangular, trapezoidal, interval, etc., out of which the triangular membership functions are the most popular due to the applicability with linguistic terms [93]. Therefore, a triangular membership function was used in the current research, having lower (l), middle (m) and upper (u) value where a triangular fuzzy number à is denoted as (l, m, u). The reciprocal Ã−1 is denoted by (1/u, 1/m, 1/l). The corresponding fuzzy scale used in the research is provided in Table 3.

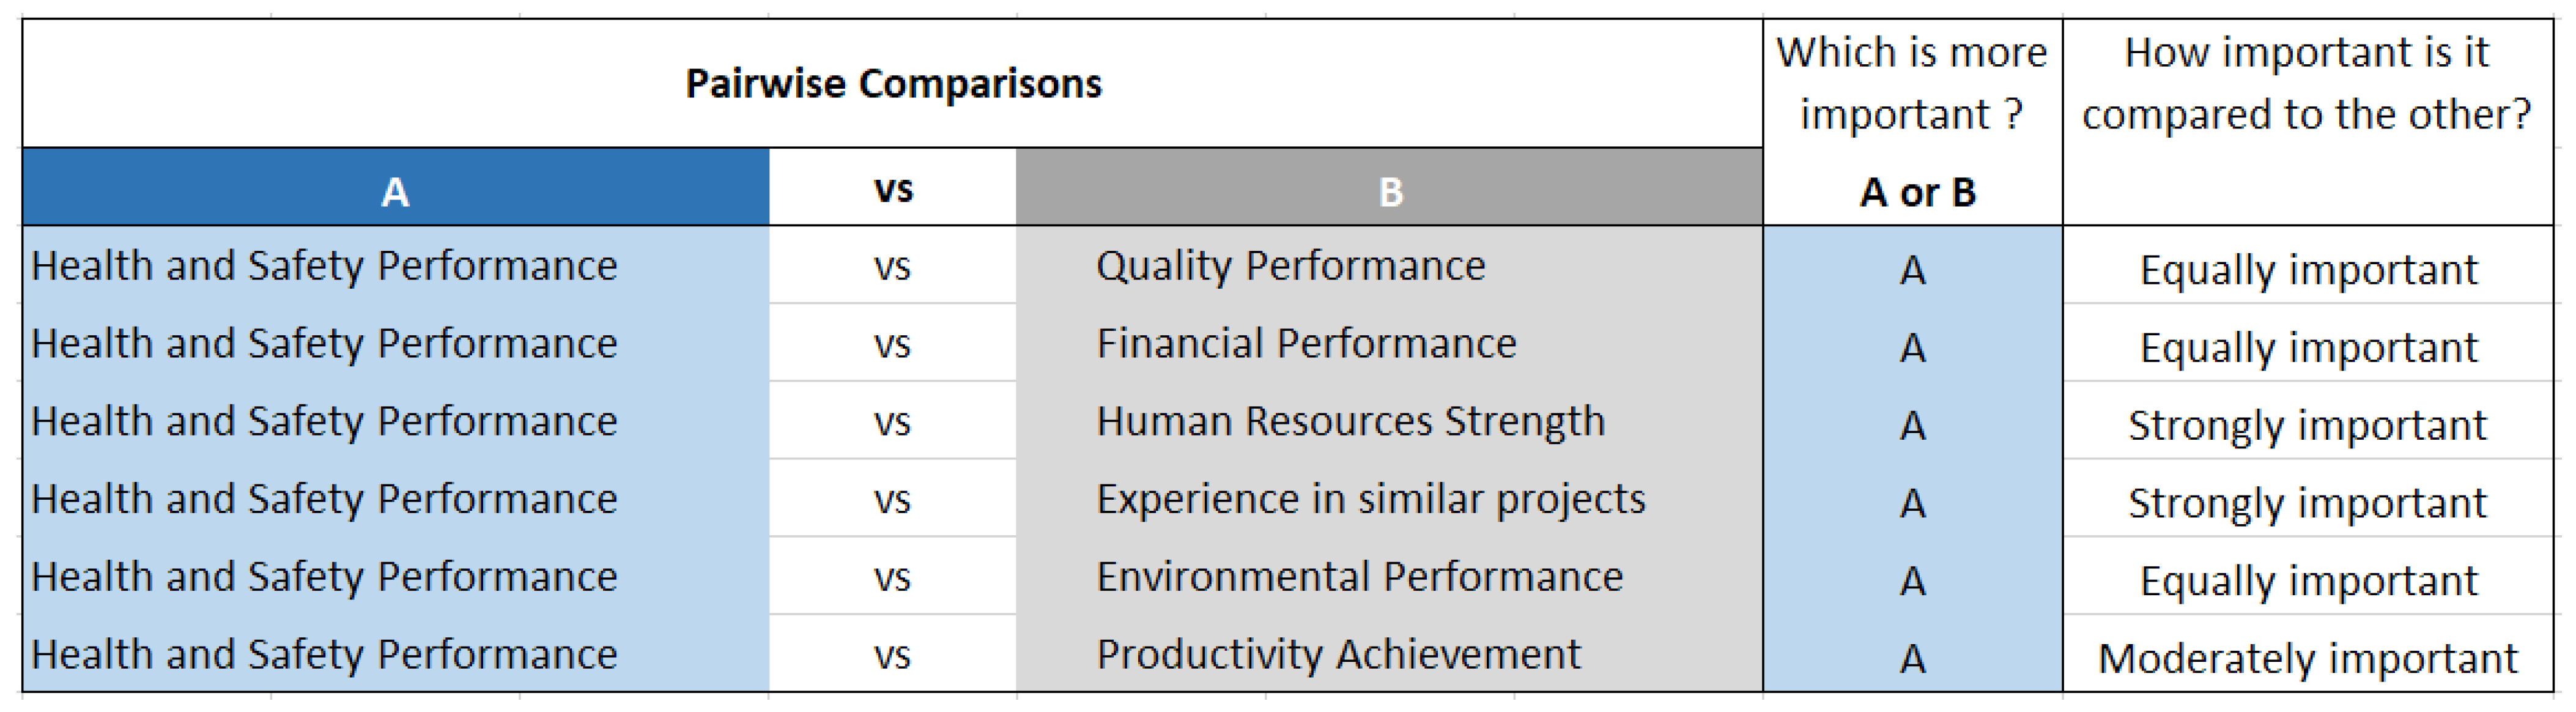
3.2.2. Pairwise Comparisons

AHP is conducted by comparing one criterion with another as pair, until all such comparisons are completed. This is typically done with a template that is easier to understand by the participants of the exercise. Irrespective of the chosen template for such comparisons, the final output of the pairwise comparisons have to be transferred to a pairwise comparison matrix. After exploring several options, the Microsoft Excel template version of the online AHP tool created by Goepel [94] was selected as it was free to use and accommodated comparing 7 or more criteria. The template was slightly modified to enable fuzzy characteristics required for FAHP. Accordingly, instead of the crisp numeric scales originally present, fuzzy linguistic scales were displayed. Through an online video call, the template screen was shared with each expert individually and asked to perform the pairwise comparisons.

3.2.3. Aggregation and Defuzzification

Aggregation is the process of combining decisions of multiple decision makers and it varies depending on the decision context [95]. For a homogeneous group structure where decision makers’ individual judgments are treated as group judgments, geometric mean method of aggregation has been considered the preferred option [95,96,97,98]. Since the experts were selected using similar criteria, the group decision aggregation was therefore done using geometric mean method. Combined matrix for all 5 individual matrices was prepared by calculating the geometric mean of each lower value, middle value and upper value of the fuzzy numbers. The explanation given by Liu et al. [99] was used in this research. The next step was to derive the fuzzy weights from the aggregated pairwise comparison matrix. This step was also performed using geometric mean method [99].
Defuzzification converts aggregated fuzzy results into crisp values and can be performed in several generic method types such as methods related to mean, methods associated with the minimum, methods associated with the maximum and others [99,100]. Among the methods related to mean, the centroid method (centre of area) has been suggested as the better choice of defuzzification in terms of simplicity and wider usage [99]. Therefore, the centroid method was used in this research for defuzzifying.

3.2.4. Checking for Consistency of Individual Comparisons

Consistency is a crucial property of AHP that needs to be checked and maintained in order to ensure that the pairwise comparisons result in a consistent judgment with limited contradictions [99]. Basaran [101] asserted that the most accepted method to calculate Consistency Ratio (CR) for fuzzy pairwise comparison matrices is to convert the fuzzy numbers into crisp numbers and then proceed as ordinary CR calculations of AHP. Taking this approach, the consistency of the pairwise comparisons was checked in real-time using the in-built CR check functionality of the AHP tool used.

3.2.5. Expert Forum Round 4

The experts were given a pairwise comparison chart to compare the measures of performance in order to calculate the weights. Based on the top seven MoP identified by the end of expert forum round 3, all pairwise comparison combinations were set out in the questionnaire. In one-to-one online sessions, the experts were asked to compare one MoP against the other and mark ‘X’ in the appropriate box to indicate whether it is ‘Equally important’, ‘Equal to moderately important’, ‘Moderately important’, and so on as per the nine levels indicated in Table 3. The resulting matrices were prepared, consistency was checked (for individual matrices), aggregated, consistency was checked (for aggregated matrix), defuzzified and weightings were calculated.

4. Results

4.1. Results of Expert Forum Round 1

Table 4 summarises the results of the first round of expert forums. Accordingly, ‘labour productivity’ was the only unanimously chosen critical measure among all CMoPs. ‘Number of similar type and size projects completed’ was the next most agreed-upon by four experts. ‘Worker turnover rate’, ‘debt ratio’ and ‘number of non-conformance reports’ were able to achieve simple majority through three out of five experts in agreement. In contrast, the choice of CMoPs in other five categories of MoPs were split between two or more proposed CMoPs.

4.2. Results of Expert Forum Round 2

The follow-up discussions with the experts, while presenting the results of round 1, enabled further clarifications and refinement of the CMoPs. Table 4 summarises the finalised choices for CMoPs by the respective experts. This discussion round with the experts resulted in a shift of their choices in majority of the categories of MoPs. Seven of the ten categories achieved majority consensus on the choice of respective CMoPs. Out of these seven categories, five achieved 80% or more agreement towards the choice of respective CMoPs. Therefore, it is evident that a reasonable consensus has been achieved at the end of expert forum round 2. However, a consensus for cost performance, time performance and planning performance was not achieved.

4.3. Results of Expert Forum Round 3

Based on the findings of expert forum rounds 1 and 2, and domain knowledge, the list of CMoPs were further refined. To provide more context on the capabilities/issues of each CMoP, they were assessed based on three criteria: (1) accessibility of data, (2) ability to compute and measure, and (3) fairness in reflecting contractor’s performance. Categories of MoPs that have CMoPs that do not fulfil all three assessment criteria were marked as dropouts from the final list of MoPs.
Although data are available to a certain extent, cost is a factor that is not within full control of the contractor. Since construction projects are usually subjected to design changes and other variations, there could be implications to the cost due to reasons beyond the contractor’s control. Hence it would be unfair to consider cost as a measure of performance when assessing contractor’s performance. Furthermore, data related to cost are often heavily contentious and may not be finalised long after the completion of the projects as well. Due to all these reasons, ‘Cost performance’ was deemed as not suitable as a measure to proceed with developing the performance index. ‘Time performance’ also has similar issues regarding the ability to compute and not being fair in assessing the contractor’s performance. Although being directly related to the contractor, ‘Planning performance’ measures are not readily available from project records. Furthermore, it is hard to compute such measures from the available records. Therefore, it was reasonable to drop the measure moving forward.
When presented with the results of the previous rounds along with the justifications for shortlisting to the top seven CMoPs, the experts replied expressing their levels of agreement along with comments, regarding the shortlisting process. Summary of the feedback from experts is presented in Table 5. Based on the comments received, it can be stated that a high level of consensus has been achieved at the end of expert forum round 3 with regard to the choice of the top seven categories of MoPs and the corresponding CMoPs.

4.4. Results of Expert Forum Round 4

Using the seven shortlisted MoPs, a pairwise comparison chart was prepared and shared with the experts via online video calls. Each expert was asked to compare the MoPs in pairs based on the relevant linguistic expressions (as listed in Table 3). The corresponding CMoPs were also displayed alongside. Figure 2 shows an extract from the pairwise comparisons template used.

4.4.1. Pairwise Comparison Matrices

Pairwise comparison matrices were generated based on the pairwise comparisons performed by the experts. A sample pairwise comparison matrix (by expert E2) is presented in Table 6.
Consistency of each individual matrix was checked. The process and results are explained in Section 4.4.4.

4.4.2. Aggregated Pairwise Comparison Matrix

Using the method explained by Liu, Eckert and Earl [99], geometric means from all five experts’ pairwise comparisons were calculated, as explained below: Let DM1, DM2, DMq be the q number of decision makers (experts); Let C1, C2, …. Cn be the n number of criteria used to compare; Let C ˜ i j ( t ) = (   l i j ( t ) ,   m i j ( t ) ,   u i j ( t ) ) be a triangular fuzzy number representing the relative importance of Ci over Cj judged by DMt and; Let w ˜ i be the fuzzy weight of Ci.
According to geometric mean method,
C ˜ i j = ( l i j ,   m i j ,   u i j ) = ( t = 1 q C ˜ i j ( t ) ) 1 q   = [ ( t = 1 q l i j ( t ) ) 1 q ,   ( t = 1 q m i j ( t ) ) 1 q ,   ( t = 1 q u i j ( t ) ) 1 q ] .
The resulting aggregated pairwise comparison matrix is presented in Table 7. To derive fuzzy weights from the aggregated pairwise comparison matrix, geometric mean method was again used as explained by Liu, Eckert and Earl [99]:
C ˜ i = ( C ˜ i 1       C ˜ i 2   C ˜ i 3   .   C ˜ i n ) 1 n
w ˜ i = C ˜ i j = 1 n C ˜ j

4.4.3. Defuzzifying the Weights

Based on the given equations, ‘Fuzzy geometric mean values’ were calculated across each row to obtain the values for the MoPs followed by the ‘Fuzzy weights’, as shown in Table 7. As the final step, ‘Defuzzified crisp numeric weights’ were calculated using the centroid method presented in Equation (4) [99] (refer to Section 3.2.1 for definitions).
Defuzzified   crisp   numeric   weight   w i = ( l + m + u ) 3

4.4.4. Checking for Consistency of the Aggregated Comparison Matrix

Consistency ratio was calculated using the formulae given below [93].
Consistency   Index   CI = λ m a x n n 1
Consistency Ratio → CR = Consistency Index CI/Random Index RI
where
  • λ m a x = largest eigenvalue of the matrix
    • n = number of criteria
    • Random Index RI = 1.32 for a matrix of 7 criteria [102]
  • Expert E1: λ m a x value = 7.6713
    • Consistency Index CI = (7.6713 − 7)/(7 − 1) = 0.1119
    • Consistency Ratio CR for E1 = 0.1119/1.32 = 0.0848 = 8.48%
  • Expert E2: λ m a x value = 7.7618
    • Consistency Index CI = (7.7618 − 7)/(7 − 1) = 0.1270
    • Consistency Ratio CR for E2 = 0.1270/1.32 = 0.0962 = 9.62%
  • Expert E3: λ m a x value = 7.8267
    • Consistency Index CI = (7.8267 − 7)/(7 − 1) = 0.1378
    • Consistency Ratio CR for E3= 0.1378/1.32 = 0.1044 = 10.44%
  • Expert E4: λ m a x value = 7.5574
    • Consistency Index CI = (7.5574 − 7)/(7 − 1) = 0.0929
    • Consistency Ratio CR for E4 = 0.0316/1.32 = 0.0704 = 7.04%
  • Expert E5: λ m a x value = 7.9632
    • Consistency Index CI = (7.9632 − 7)/(7 − 1) = 0.1605
    • Consistency Ratio CR for E5 = 0.1605/1.32 = 0.1216 = 12.16%
  • Aggregate Matrix: λ m a x value = 7.1898
    • Consistency Index CI = (7.1898 − 7)/(7 − 1) = 0.0316
    • Consistency Ratio CR for Aggregate Matrix = 0.0316/1.32 = 0.024 = 2.4%
When CR is less than 10%, the consistency of the pairwise comparisons become acceptable [93]. Therefore, the consistency of the aggregated pairwise comparisons can be considered acceptable.

4.4.5. Developing the Performance Model with Weights

Taking the normalised weights calculated in Table 7, the constituents of the performance model are summarised in Table 8. Accordingly, the critical measures that are readily accessible, easily computable and fair to reflect contractor’s performance have been identified along with the respective levels of importance (weights). Further discussion is provided in Section 5.

5. Discussion

By the end of the expert forum rounds, it was evident that some of the most commonly quoted measures tended to have limitations based on the comments received from the experts. One of the most significant outcomes was dropping of time and cost performance from the top measures of performance. From what was traditionally referred to as the ‘iron triangle’, only ‘quality’ remained after the comprehensive series of expert forum rounds. The experts did not have agreement that time and cost performance should be included as measures. Cost performance, as a measure, failed the test of being easily accessible data for the fact that it cannot be defined clearly. To define cost performance, it needs to be identified through data such as the original cost, the completed cost, the reasons for any difference and whether the difference was attributable to contractor performance. These are not easy to prove, and it is fairly difficult to say who is responsible. The differences often may result in variations. A portion of the variations could be pure variations coming from the client or the design team while some maybe due to contractor attributable factors. Sifting that and finding how much is affected solely by contractor performance is a difficult measure. As such, the tests of ease of access and measurability failed, which was agreed by the expert forum. In this regard, time performance has issues similar to cost performance. For example, compared to the original schedule, the final schedule could be affected by many factors which are beyond the control of the contractor (e.g., weather), as well as factors attributable to their own failures. Complexity of such differentiation fails the test of the data being easy to access. The shortfalls of time and cost performance measures similarly affect project planning performance, hence leading to its removal as a suitable category of measure of performance based on experts’ agreement.
When subjected to FAHP-based pairwise comparisons, the remaining seven categories of MoPs resulted in weights indicating their level of importance. With an aggregate weight of over 50%, priority was given to health and safety and quality of construction. Health and safety performance, achieving a weight close to one-third of the performance index, indicates the importance of making the industry safer and focuses on performance of the ‘process’. While its limitations were highlighted, majority of the experts chose lost time injury frequency rate due to the higher availability of data across the industry. Although reported incidents rate has more coverage than LTIFR and technically easier to compare across, it was less preferred mainly due to the limitations of obtaining data compared to LTIFR. This is one example which substantiate the need to revamp some of the commonly used performance metrics that are still in use throughout the construction industry. Focusing in the performance of the ‘product’, quality gained a weight of one fifth of the overall performance. Based on experts’ choices, it was evident that any measure related to construction defects or rework would not be suitable in gauging quality performance. On the other hand, non-conformance reports were identified to be a good alternative if the records are properly kept and maintained.
When it comes to overall organisation’s financial performance, the experts’ clear preference was to calculate the debt ratio. It is common that some of the contracting organisations (including developers with their in-house construction arms) operate under several business entities. This increases the risk for construction clients, as some of the businesses would declare bankruptcy and re-emerge as a different entity. Therefore, debt ratio would be an ideal indicator for financial performance. With an importance level close to that of financial performance, past experience is another important category of performance when assessing a contracting organisation. Counting the number of similar type and size projects completed is a traditional measure for assessing experience. The expert forum results affirmed that it continues to be a valid measure from the client’s perspective. However, it can be disadvantageous for newcomers to the industry.
Despite being one of the least cited categories of measures of performance from literature, environmental performance ended up having close to one tenth of weight of the performance index. The chosen critical measure, total waste removed from a site, achieved the largest jump in terms of experts’ preference by the end of round 2. It is also an indication of the push towards more sustainable construction practices leading to waste minimisation and recycling. Human resources strength was considered an important MoP (with a weight of 8.3%) where worker turnover rate was unanimously chosen by the experts as an indicator that can be tracked and compared easily. It was further revealed that the key staff turnover would severely affect the performance of a project. Productivity achievement, with the least weight of 6.3%, was proposed to be measured using labour productivity which can be a good comparator for predominantly on-site vs. predominantly off-site-based construction projects. Labour productivity being chosen unanimously is an indicator that simple and straightforward measures are preferred.
Since the CMoPs are measured in different units, they need to be converted to a unified scale. Furthermore, CMoPs related to health and safety, quality, financial performance, human resources strength and environmental performance will indicate better performance if the numbers are lower. Similarly, CMoPs for experience and track record and productivity achievement will indicate better performance when the respective figures are higher. Therefore, the CMoPs have to be made unidirectional. Ultimately, it can be represented as a linear additive model where an index score can be computed.
Even though price related measures were originally included for the discussions, they naturally did not make it to the final list of critical measures. This affirms the need for more non-price measures when assessing performance.

6. Conclusions

Construction industry is suffering from poor performance, and it is largely attributable to the contractors. Therefore, assessing the performance of a contractor becomes crucial for their own improvement as well as for the purpose of selecting the better performing one when procuring for construction projects.
Comparing and calculating weights for different performance criterions are not new to the construction industry and over the years, this has been conducted using various methods. Often, these performance criterions are compared at high level and the actual way of measuring them would be decided later. In contrast, this research approached the problem with both the categories of measures of performance and the respective critical measures identified through a comprehensive literature review. Followed by a series of systematically driven Delphi-based expert forum rounds, the measures of performance and their corresponding critical measures were shortlisted. These measures were subjected to fuzzy analytic hierarchy process-based pairwise comparisons which resulted in a basic performance index with weights for seven categories of measures of performance; health and safety (30.9%), quality (19.2%), experience (13.3%), financial (12.9%), environmental (9.1%), human resources (8.3%) and productivity (6.3%).
The main contribution of this research was the identification of key areas of performance (along with the respective weights) that can be gauged using non-price metrics which are objective, tangible and readily available when evaluating contractors’ performance. Further research will be carried out to convert the identified CMoPs and the corresponding weights into a performance index with a unified and unidirectional scale. The resulting performance model can be used to quantify individual project performance and be aggregated as a score for ranking contractors. The simplicity of the identified critical measures of performance makes the model more usable without the need for complex analytics.
Since the metrics relate to data that is generally recorded on a day-to-day basis due to administrative and regulatory requirements, high availability of data is anticipated. The simplicity and availability of required data increase the possibility of using archived information to gauge performance of past projects in retrospect as well. The developed performance index allows the contractors to self-evaluate their level of performance. On the other hand, clients and consultants are able to review contractors’ performance easily based on readily available data. Ultimately, the outcome of this research can lead to a rating mechanism which encourages a culture of measured improvement of performance of contractors.

Author Contributions

Conceptualisation, K.G., S.P., M.H. and X.J.; methodology, K.G., S.P., M.H. and X.J.; formal analysis, K.G.; data curation, K.G.; writing—original draft preparation, K.G.; writing—review and editing, K.G., S.P., M.H. and X.J.; supervision, S.P., M.H. and X.J.; project administration, S.P. All authors have read and agreed to the published version of the manuscript.

Funding

This research is funded by Centre for Smart Modern Construction Postgraduate Scholarship.

Institutional Review Board Statement

The study was conducted according to the guidelines of the National Statement on Ethical Conduct in Human Research 2007 (Updated 2018). Ethical approval for this project has been granted by the Western Sydney University Human Research Ethics Committee. (HREC Approval Number: H13593 and Date of Approval: 4 December 2019).

Informed Consent Statement

Informed consent was obtained from all participants involved in the study.

Data Availability Statement

Not applicable.

Acknowledgments

The authors acknowledge the expert forum participants for providing their opinions, which were incorporated in producing this research paper and Centre for Smart Modern Construction (c4SMC) for the provision of necessary infrastructure for the research.

Conflicts of Interest

The authors declare no conflict of interest.

References

  1. McKinsey Global Institute. Reinventing Construction: A Route to Higher Productivity; McKinsey Global Institute: New York, NY, USA, 2017. [Google Scholar]
  2. KPMG. Global Construction Survey 2015; KPMG International Cooperative: Amstelveen, The Netherlands, 2015. [Google Scholar]
  3. Leong, T.K.; Zakuan, N.; Mat Saman, M.Z.; Ariff, M.S.M.; Tan, C.S. Using project performance to measure effectiveness of quality management system maintenance and practices in construction industry. Sci. World J. 2014, 2014, 591361. [Google Scholar] [CrossRef]
  4. Toor, S.-u.-R.; Ogunlana, S.O. Beyond the ‘iron triangle’: Stakeholder perception of key performance indicators (KPIs) for large-scale public sector development projects. Int. J. Proj. Manag. 2010, 28, 228–236. [Google Scholar] [CrossRef]
  5. Alarcon, L.F.; Mourgues, C. Performance modeling for contractor selection. J. Manag. Eng. 2002, 18, 52–60. [Google Scholar] [CrossRef]
  6. Singh, D.; Tiong, R.L.K. A fuzzy decision framework for contractor selection. J. Constr. Eng. Manag. 2005, 131, 62–70. [Google Scholar] [CrossRef]
  7. Hatush, Z.; Skitmore, M. Evaluating contractor prequalification data: Selection criteria and project success factors. Construction Manag. Econ. 1997, 15, 129–147. [Google Scholar] [CrossRef] [Green Version]
  8. Holt, G.D.; Olomolaiye, P.O.; Harris, F.C. Evaluating prequalification criteria in contractor selection. Build. Environ. 1994, 29, 437–448. [Google Scholar] [CrossRef]
  9. Wong, C.H. Contractor performance prediction model for the United Kingdom construction contractor: Study of logistic regression approach. J. Constr. Eng. Manag. 2004, 130, 691–698. [Google Scholar] [CrossRef]
  10. Yeung, J.F.Y.; Chan, A.P.C.; Chan, D.W.M.; Chiang, Y.H.; Yang, H. Developing a benchmarking model for construction projects in Hong Kong. J. Constr. Eng. Manag. 2013, 139, 705–716. [Google Scholar] [CrossRef] [Green Version]
  11. Costa, D.B.; Formoso, C.T.; Kagioglou, M.; Alarcón, L.F.; Caldas, C.H. Benchmarking initiatives in the construction industry: Lessons learned and improvement opportunities. J. Manag. Eng. 2006, 22, 158–167. [Google Scholar] [CrossRef]
  12. Ashton, C. Strategic Performance Measurement, 1st ed.; Business Intelligence Ltd.: London, UK, 1997. [Google Scholar]
  13. Ali, H.A.E.M.; Al-Sulaihi, I.A.; Al-Gahtani, K.S. Indicators for measuring performance of building construction companies in Kingdom of Saudi Arabia. J. King Saud Univ.-Eng. Sci. 2013, 25, 125–134. [Google Scholar] [CrossRef] [Green Version]
  14. Takim, R.; Adnan, H. Analysis of effectiveness measures of construction project success in malaysia. Asian Soc. Sci. 2008, 4, 74–91. [Google Scholar] [CrossRef] [Green Version]
  15. Ali, A.S.; Rahmat, I. The performance measurement of construction projects managed by ISO-certified contractors in Malaysia. J. Retail Leis. Prop. 2010, 9, 25–35. [Google Scholar] [CrossRef] [Green Version]
  16. Egan, J. Rethinking Construction: The Report of the Construction Task Force; Department of Trade and Industry: London, UK, 1998. [Google Scholar]
  17. Lin, J.; Mills, A. Measuring the occupational health and safety performance of construction companies in Australia. Facilities 2001, 19, 131–139. [Google Scholar] [CrossRef] [Green Version]
  18. Hughes, S.W.; Tippett, D.D.; Thomas, W.K. Measuring project success in the construction industry. Eng. Manag. J. 2004, 16, 31–37. [Google Scholar] [CrossRef]
  19. Xiao, H.; Proverbs, D. The performance of contractor in Japan, the UK and the USA: An evaluation of construction quality. Int. J. Qual. Reliab. Manag. 2002, 19, 616–672. [Google Scholar] [CrossRef]
  20. Tripathi, K.K.; Jha, K.N. An empirical study on performance measurement factors for construction organizations. KSCE J. Civ. Eng. 2018, 22, 1052–1066. [Google Scholar] [CrossRef]
  21. The KPI Working Group. KPI Report for the Minister for Construction; Department of the Environment, Transport and the Regions: London, UK, 2000. [Google Scholar]
  22. Chan, A.P.C.; Chan, A.P.L. Key performance indicators for measuring construction success. Benchmarking An. Int. J. 2004, 11, 203–221. [Google Scholar] [CrossRef]
  23. Tabish, S.Z.S.; Jha, K.N. Success traits for a construction project. J. Constr. Eng. Manag. 2012, 138, 1131–1138. [Google Scholar] [CrossRef]
  24. Kaka, A.; Lewis, J. Development of a company-level dynamic cash flow forecasting model (DYCAFF). Constr. Manag. Econ. 2003, 21, 693–705. [Google Scholar] [CrossRef]
  25. Silva, G.A.S.K.; Warnakulasuriya, B.N.F.; Arachchige, B.J.H. Criteria for construction project success: A literature review. In Proceedings of the 13th International Conference on Business Management, University of Sri Jayewardenepura, Colombo, Sri Lanka, 8 December 2016; pp. 697–717. [Google Scholar]
  26. Perrenoud, A.J.; Sullivan, K.T. Implementing project schedule metrics to identify the impact of delays correlated with contractors. J. Adv. Perform. Inf. Value 2013, 4, 41–49. [Google Scholar]
  27. Tao, L.; Kumaraswamy, M. Unveiling relationships between contractor inputs and performance outputs. Constr. Innov. 2012, 12, 86–98. [Google Scholar] [CrossRef]
  28. Tam, V.W.Y.; Tam, C.M.; Zeng, S.X.; Chan, K.K. Environmental performance measurement indicators in construction. Build. Environ. 2006, 41, 164–173. [Google Scholar] [CrossRef]
  29. The KPI Team. UK Industry Performance Report; The KPI Team: London, UK, 2016. [Google Scholar]
  30. Lines, B.C.; Sullivan, K.T.; Hurtado, K.C.; Savicky, J. Planning in Construction: Longitudinal Study of Pre-Contract Planning Model Demonstrates Reduction in Project Cost and Schedule Growth. Int. J. Constr. Educ. Res. 2015, 33, 21–39. [Google Scholar] [CrossRef]
  31. Idoro, G. Evaluating Levels of Project Planning and their Effects on Performance in the Nigerian Construction Industry. Aust. J. Constr. Econ. Build. 2012, 9, 39–50. [Google Scholar] [CrossRef] [Green Version]
  32. Abdel-Wahab, M.; Vogl, B. Trends of productivity growth in the construction industry across Europe, US and Japan. Constr. Manag. Econ. 2011, 29, 635–644. [Google Scholar] [CrossRef]
  33. Cox, R.F.; Issa, R.R.A.; Ahrens, D. Management’s perception of key performance indicators for construction. J. Constr. Eng. Manag. 2003, 129, 142–151. [Google Scholar] [CrossRef]
  34. Khlaifat, D.M.; Alyagoub, R.E.; Sweis, R.J.; Sweis, G.J. Factors leading to construction projects’ failure in Jordon. Int. J. Constr. Manag. 2017, 19, 65–78. [Google Scholar] [CrossRef]
  35. Durdyev, S.; Mbachu, J. On-site Labour Productivity of New Zealand Construction Industry: Key Constraints and Improvement Measures. Aust. J. Constr. Econ. Build. 2011, 11, 18–33. [Google Scholar] [CrossRef] [Green Version]
  36. Pekuri, A.; Haapasalo, H.; Herrala, M. Productivity and performance management: Managerial practices in the construction industry. Int. J. Perform. Meas. 2011, 1, 39–58. [Google Scholar]
  37. Doloi, H. Application of AHP in improving construction productivity from a management perspective. Constr. Manag. Econ. 2008, 26, 841–854. [Google Scholar] [CrossRef]
  38. Chan, A.P.C.; Scott, D.; Lam, E.W.M. Framework of Success Criteria for Design/Build Projects. J. Manag. Eng. 2002, 18, 120–128. [Google Scholar] [CrossRef]
  39. Ahadzie, D.K.; Proverbs, D.G.; Olomolaiye, P.O. Critical success criteria for mass house building projects in developing countries. Int. J. Proj. Manag. 2008, 26, 675–687. [Google Scholar] [CrossRef]
  40. Koops, L.; van Loenhout, C.; Bosch-Rekveldt, M.; Hertogh, M.; Bakker, H. Different perspectives of public project managers on project success. Eng. Constr. Archit. Manag. 2017, 24, 1294–1318. [Google Scholar] [CrossRef]
  41. Krajangsri, T.; Pongpeng, J. Effect of sustainable infrastructure assessments on construction project success using structural modeling equation. J. Manag. Eng. 2017, 33, 1–12. [Google Scholar] [CrossRef]
  42. Akbari, S.; Khanzadi, M.; Gholamian, M.R. Building a rough sets-based prediction model for classifying large-scale construction projects based on sustainable success index. Eng. Constr. Archit. Manag. 2018, 25, 534–558. [Google Scholar] [CrossRef] [Green Version]
  43. Yan, H.; Elzarka, H.; Gao, C.; Zhang, F.; Tang, W. Critical success criteria for programs in china: Construction companies’ perspectives. J. Manag. Eng. 2019, 35, 04018048. [Google Scholar] [CrossRef]
  44. Ng, S.T.; Tang, Z. Labour-intensive construction sub-contractors: Their critical success factors. Int. J. Proj. Manag. 2010, 28, 732–740. [Google Scholar] [CrossRef]
  45. Chen, Y.Q.; Zhang, Y.B.; Liu, J.Y.; Mo, P. Interrelationships among critical success factors of construction projects based on the structural equation model. J. Manag. Eng. 2012, 28, 243–251. [Google Scholar] [CrossRef]
  46. Jin, X.-H.; Tan, H.C.; Zuo, J.; Feng, Y. Exploring critical success factors for developing infrastructure projects in Malaysia: Main contractors’ perspective. Int. J. Constr. Manag. 2012, 12, 25–41. [Google Scholar] [CrossRef]
  47. Alzahrani, J.I.; Emsley, M.W. The impact of contractors’ attributes on construction project success: A post construction evaluation. Int. J. Proj. Manag. 2013, 31, 313–322. [Google Scholar] [CrossRef]
  48. Yong, Y.C.; Mustaffa, N.E. Critical success factors for Malaysian construction projects: An empirical assessment. Constr. Manag. Econ. 2013, 31, 1–20. [Google Scholar] [CrossRef]
  49. Kuwaiti, E.A.; Ajmal, M.M.; Hussain, M. Determining success factors in Abu Dhabi health care construction projects: Customer and contractor perspectives. Int. J. Constr. Manag. 2018, 18, 430–445. [Google Scholar] [CrossRef]
  50. Luu, V.T.; Kim, S.-Y.; Huynh, T.-A. Improving project management performance of large contractors using benchmarking approach. Int. J. Proj. Manag. 2008, 26, 758–769. [Google Scholar] [CrossRef]
  51. Skibniewski, M.; Ghosh, S. Determination of Key Performance Indicators with Enterprise Resource Planning Systems in Engineering Construction Firms. J. Constr. Eng. Manag. 2009, 135, 965–978. [Google Scholar] [CrossRef]
  52. Butcher, D.C.A.; Sheehan, M.J. Excellent contractor performance in the UK construction industry. Eng. Constr. Archit. Manag. 2010, 17, 35–45. [Google Scholar] [CrossRef]
  53. Dawood, N. Development of 4D-based performance indicators in construction industry. Eng. Constr. Archit. Manag. 2010, 17, 210–230. [Google Scholar] [CrossRef]
  54. Ngacho, C.; Das, D. A performance evaluation framework of development projects: An empirical study of constituency development fund (CDF) construction projects in Kenya. Int. J. Proj. Manag. 2014, 32, 492–507. [Google Scholar] [CrossRef]
  55. Omar, M.N.; Fayek, A.R. Modeling and evaluating construction project competencies and their relationship to project performance. Autom. Constr. 2016, 69, 115–130. [Google Scholar] [CrossRef]
  56. Castillo, T.; Alarcon, L.; Pellicer, E. Influence of organizational characteristics on construction project performance using corporate social networks. J. Manag. Eng. 2018, 34, 1–13. [Google Scholar] [CrossRef] [Green Version]
  57. Hatush, Z.; Skitmore, M. Criteria for contractor selection. Constr. Manag. Econ. 1997, 15, 19–38. [Google Scholar] [CrossRef] [Green Version]
  58. Fong, P.S.-W.; Choi, S.K.-Y. Final contractor selection using the analytical hierarchy process. Constr. Manag. Econ. 2000, 18, 547–557. [Google Scholar] [CrossRef]
  59. El-Sawalhi, N.; Eaton, D.; Rustom, R. Contractor pre-qualitication model: State-of the-art. Int. J. Proj. Manag. 2007, 25, 465. [Google Scholar] [CrossRef]
  60. Li, Y.; Nie, X.; Chen, S. Fuzzy approach to prequalifying construction contractors. J. Constr. Eng. Manag. 2007, 133, 40–49. [Google Scholar] [CrossRef]
  61. Plebankiewicz, E. Contractor prequalification model using fuzzy sets. J. Civil. Eng. Manag. 2009, 15, 377–385. [Google Scholar] [CrossRef]
  62. Jafari, A. A contractor pre-qualification model based on the quality function deployment method. Constr. Manag. Econ. 2013, 31, 746–760. [Google Scholar] [CrossRef]
  63. Hosny, O.; Nassar, K.; Esmail, Y. Prequalification of Egyptian construction contractors using fuzzy-AHP models. Eng. Constr. Archit. Manag. 2013, 20, 381–405. [Google Scholar] [CrossRef]
  64. Alhumaidi, H.M. Construction contractors ranking method using multiple decision-makers and multiattribute fuzzy weighted average. J. Constr. Eng. Manag. 2015, 141, 04014092. [Google Scholar] [CrossRef]
  65. Afshar, M.R.; Alipouri, Y.; Sebt, M.H.; Chan, W.T. A type-2 fuzzy set model for contractor prequalification. Autom. Constr. 2017, 84, 356–366. [Google Scholar] [CrossRef]
  66. Semaan, N.; Salem, M. A deterministic contractor selection decision support system for competitive bidding. Eng. Constr. Archit. Manag. 2017, 24, 61–77. [Google Scholar] [CrossRef]
  67. Lew, Y.-L.; Hassim, S.; Muniandy, R.; Hua, L.T. Structural equation modelling for subcontracting practice: Malaysia chapter. Eng. Constr. Archit. Manag. 2018, 25, 835–860. [Google Scholar] [CrossRef]
  68. Radujković, M.; Vukomanović, M.; Dunović, I.B. Application of key performance indicators in South-Eastern European construction. J. Civil. Eng. Manag. 2010, 16, 521–530. [Google Scholar] [CrossRef]
  69. Abudayyeh, O.; Zidan, S.J.; Yehia, S.; Randolph, D. Hybrid prequalification-based, innovative contracting model using AHP. J. Manag. Eng. 2007, 23, 88–96. [Google Scholar] [CrossRef]
  70. Wang, W.-C.; Yu, W.-D.; Yang, I.T.; Lin, C.-C.; Lee, M.-T.; Cheng, Y.-Y. Applying the AHP to support the best-value contractor selection—lessons learned from two case studies in Taiwan. J. Civil. Eng. Manag. 2013, 19, 24–36. [Google Scholar] [CrossRef] [Green Version]
  71. Chua, D.K.H.; Kog, Y.; Loh, P. Critical Success Factors for Different Project Objectives. J. Constr. Eng. Manag. 1999, 125, 142–150. [Google Scholar] [CrossRef]
  72. Hwang, B.-G.; Lim, E.S.J. Critical success factors for key project players and objectives: Case study of Singapore. J. Constr. Eng. Manag. 2013, 139, 204–215. [Google Scholar] [CrossRef]
  73. Tripathi, K.K.; Jha, K.N. An empirical study on factors leading to the success of construction organizations in India. Int. J. Constr. Manag. 2019, 19, 222–239. [Google Scholar] [CrossRef]
  74. Tennant, S.; Langford, D.; Murray, M. Construction site management team working: A serendipitous event. J. Manag. Eng. 2011, 27, 220–228. [Google Scholar] [CrossRef]
  75. Nieto-Morote, A.; Ruz-Vila, F. A fuzzy multi-criteria decision-making model for construction contractor prequalification. Autom. Constr. 2012, 25, 8–19. [Google Scholar] [CrossRef] [Green Version]
  76. Horta, I.; Camanho, A.; Lima, A. Design of performance assessment system for selection of contractors in construction industry e-marketplaces. J. Constr. Eng. Manag. 2013, 139, 910–917. [Google Scholar] [CrossRef]
  77. Langston, C. Construction efficiency: A tale of two developed countries. Eng. Constr. Archit. Manag. 2014, 21, 320–335. [Google Scholar] [CrossRef]
  78. Kog, Y.C.; Loh, P.K. Critical success factors for different components of construction projects. J. Constr. Eng. Manag. 2012, 138, 520–528. [Google Scholar] [CrossRef]
  79. Watt, D.J.; Kayis, B.; Willey, K. The relative importance of tender evaluation and contractor selection criteria. Int. J. Proj. Manag. 2010, 28, 51–60. [Google Scholar] [CrossRef]
  80. Chan, A. Framework for Measuring Success of Construction Projects; CRC for Construction Innovation: Brisbane, Australia, 2001. [Google Scholar]
  81. Saunders, M.; Lewis, P.; Thornhill, A. Research Methods for Business Students, 8th ed.; Pearson: New York, NY, USA, 2019. [Google Scholar]
  82. Ameyaw, E.E.; Hu, Y.; Shan, M.; Chan, A.P.C.; Le, Y. Application of Delphi method in construction engineering and management research: A quantitative perspective. J. Civil. Eng. Manag. 2016, 22, 991–1000. [Google Scholar] [CrossRef]
  83. Biggs, S.E.; Banks, T.D.; Davey, J.D.; Freeman, J.E. Safety leaders’ perceptions of safety culture in a large Australasian construction organisation. Saf. Sci. 2013, 52, 3–12. [Google Scholar] [CrossRef] [Green Version]
  84. Bell, E.; Bryman, A.; Harley, B. Business Research Methods, 5th ed.; Oxford University Press: Oxford, UK, 2019. [Google Scholar]
  85. Hallowell, M.R.; Gambatese, J.A. Qualitative Research: Application of the Delphi Method to CEM Research. J. Constr. Eng. Manag. 2010, 136, 99–107. [Google Scholar] [CrossRef]
  86. Saaty, T.L. How to make a decision: The analytic hierarchy process. Eur. J. Oper. Res. 1990, 48, 9–26. [Google Scholar] [CrossRef]
  87. Chiang, F.; Yu, V.; Luarn, P. Construction contractor selection in Taiwan using AHP. Int. J. Eng. Technol. 2017, 9, 211–215. [Google Scholar] [CrossRef] [Green Version]
  88. Rahman, S.; Odeyinka, H.; Perera, S.; Bi, Y. Product-cost modelling approach for the development of a decision support system for optimal roofing material selection. Expert Syst. Appl. 2012, 39, 6857–6871. [Google Scholar] [CrossRef]
  89. van Laarhoven, P.J.M.; Pedrycz, W. A fuzzy extension of Saaty’s priority theory. Fuzzy Sets Syst. 1983, 11, 229–241. [Google Scholar] [CrossRef]
  90. Kaganski, S.; Majak, J.; Karjust, K. Fuzzy AHP as a tool for prioritization of key performance indicators. Procedia CIRP 2018, 72, 1227–1232. [Google Scholar] [CrossRef]
  91. Ozdagoglu, A.; Ozdagoglu, G. Comparison of AHP and fuzzy AHP for the multi-criteria decision making process with linguistic evaluations. Istanb. Commer. Univ. J. Sci. 2007, 6, 65–85. [Google Scholar]
  92. Fayek, A.; Lourenzutti, R. Fuzzy Hybrid Computing in Construction Engineering and Management: Theory and Applications; Emerald Publishing Limited: Bingley, UK, 2018. [Google Scholar]
  93. Chan, H.K.; Sun, X.; Chung, S.-H. When should fuzzy analytic hierarchy process be used instead of analytic hierarchy process? Decis. Support. Syst. 2019, 125, 113114. [Google Scholar] [CrossRef]
  94. Goepel, K. Implementation of an Online Software Tool for the Analytic Hierarchy Process (AHP-OS). Int. J. Anal. Hierarchy Process. 2018, 10. [Google Scholar] [CrossRef] [Green Version]
  95. Ossadnik, W.; Schinke, S.; Kaspar, R.H. Group Aggregation Techniques for Analytic Hierarchy Process and Analytic Network Process: A Comparative Analysis. Group Decis. Negot. 2016, 25, 421–457. [Google Scholar] [CrossRef] [Green Version]
  96. Aczél, J.; Saaty, T.L. Procedures for synthesizing ratio judgements. J. Math. Psychol. 1983, 27, 93–102. [Google Scholar] [CrossRef]
  97. Buckley, J.J. Fuzzy hierarchical analysis. Fuzzy Sets Syst. 1985, 17, 233–247. [Google Scholar] [CrossRef]
  98. Krejčí, J.; Stoklasa, J. Aggregation in the analytic hierarchy process: Why weighted geometric mean should be used instead of weighted arithmetic mean. Expert Syst. Appl. 2018, 114, 97–106. [Google Scholar] [CrossRef]
  99. Liu, Y.; Eckert, C.M.; Earl, C. A review of fuzzy AHP methods for decision-making with subjective judgements. Expert Syst. Appl. 2020, 161, 113738. [Google Scholar] [CrossRef]
  100. Talon, A.; Curt, C. Selection of appropriate defuzzification methods: Application to the assessment of dam performance. Expert Syst. Appl. 2017, 70, 160–174. [Google Scholar] [CrossRef] [Green Version]
  101. Basaran, B. A Critique on the Consistency Ratios of Some Selected Articles Regarding Fuzzy AHP and Sustainability. In Proceedings of the 3rd International Symposium on Sustainable Development (ISSD’12), Sarajevo, Bosnia and Herzegovina, 31 May–1 June 2012. [Google Scholar]
  102. Saaty, R.W. The analytic hierarchy process—what it is and how it is used. Math. Model. 1987, 9, 161–176. [Google Scholar] [CrossRef] [Green Version]
Figure 1. Research methodology.
Buildings 11 00375 g001
Figure 2. Extract from pairwise comparisons template.
Buildings 11 00375 g002
Table 2. Profiles of the expert forum panellists.
CodeExpertiseAt Least Advanced Degree Level QualificationMembership in a Related Professional BodyWork ExperienceSpecial Achievements/InvolvementDesignationOrganisation Type & Size
E1 Project management, Business developmentYesYes10 yearsChair of a nationally recognised committee,
Invited speaker at conferences/panels
Manager—New BusinessContractor
(Large)
E2 Health, safety & environment management,
Risk management, Procurement
YesYes28 yearsInvited as an expert to guide teams at a construction hackathon eventOperational Risk ManagerDeveloper/Client
(Large)
E3 Project management, Contract administration,
Risk management
YesYes15 yearsChair of a committee of a globally recognised professional bodyAssociate Director—Project risk consultingConsultant
(Large)
E4 Cost planning, quantity surveying, performance measurementYesYes21 yearsChair of a nationally recognised committeeHead of Cost PlanningContractor
(Large)
E5 Cost planning, estimatingYesYes25 yearsMember of a nationally recognised committeeEstimating ManagerContractor
(Large)
Table 3. Fuzzy scale for pairwise comparisons.
Linguistic TermFuzzy NumberTriangular Fuzzy ScaleReciprocal Fuzzy Scale
Equal importance 1(1, 1, 1)(1, 1, 1)
Equal to moderate importance 2(1, 2, 3)(1/3, 1/2, 1)
Moderate importance 3(2, 3, 4)(1/4, 1/3, 1/2)
Moderate to strong importance 4(3, 4, 5)(1/5, 1/4, 1/3)
Strong importance 5(4, 5, 6)(1/6, 1/5, 1/4)
Strong to very strong importance 6(5, 6, 7)(1/7, 1/6, 1/5)
Very strong importance 7(6, 7, 8)(1/8, 1/7, 1/6)
Very strong to extreme importance 8(7, 8, 9)(1/9, 1/8, 1/7)
Extreme importance 9(9, 9, 9)(1/9, 1/9, 1/9)
Table 4. Results of expert forum round 1 and round 2.
CodeCategories of MoPsProposed CMoPsExpert Choice in Round 1CommentsExpert Choice in Round 2
E1E2E3E4E5 E1E2E3E4E5
HS.MoPHealth and Safety Performance1.1 Lost time injury frequency rate (LTIFR)
  • There is a legal and contractual obligation to report lost time injuries (LTI).
  • LTIFR can be easily benchmarked due to availability of data.
  • The numbers are very low compared to medical treatment injuries (MTI).
  • Builders generally try their best to keep the LTI numbers low.
1.2 Reported incidents rate
  • Since it captures both MTI and LTI, it is more reflective of health and safety.
  • Number of reported incidents is higher and more tangible to compare across.
  • Incidents are usually reported in weekly safety reports or cost reports.
  • Underreporting and manipulation is possible.
1.3 Number and amount of fines received from regulators
  • Fines cannot be relied upon as a measure since the health and safety offences are not always captured by the authorities.
1.4 Other measure
  • Having an effective health and safety management plan is a suitable measure.
QP.MoPQuality Performance2.1 Construction rework index
  • It is hard to track rework at site and data are not sufficient
  • Rework during construction is usually handled at subcontractor level and does not escalate to the client.
  • Defects at the point of handover or end of liability period could be measured.
2.2 Number of non-conformance reports
  • Non-conformances can be issued to the builder for incorrect constructions.
  • For tier 1 builders, internal audits would report on the non-conformances while lower level builders would obtain external auditors’ help to get those records.
  • Non-conformances are captured in a register and reported in site meetings.
  • Document managing software used by builders can track non-conformances.
  • The number of non-conformance reports could range from 10’s to 100’s or more.
  • The willingness and ethics of the contractor would dictate how data on non-conformances will be disclosed to the clients.
  • It may mislead based on the type of work (e.g., high quantity of minor non-conformances vs. low quantity of major non-conformances may skew the data).
2.3 Time taken to rectify all defects
  • It can be misleading (e.g., rectifying a large quantity of defects quickly vs. taking longer to rectify smaller defects).
  • Some of the work could be hard to classify as defects or incomplete work.
  • Average time to rectify defects could be a measure that can be compared.
2.4 Other measure
  • Cost to rectify defective work is a suitable measure as any defect identified would be rectified at a cost.
CP.MoPCost Performance3.1 Project budget factor
  • Approved changes, tender price and actual cost are all clear elements, which make the calculations straightforward.
  • It is suitable for a client when assessing contractors’ performance as part of the tender process.
  • It could reflect the consultant’s errors in estimating the project cost.
  • Total project estimate at tender would vary depending on the procurement route.
3.2 Cost predictability (Construction)
  • The calculation can get complex with the inclusion of provisional sums and their subsequent changes during construction.
  • The comparison between actual cost and original estimated cost is not ‘like for like’ especially due to scope changes.
3.3 Other measure
  • Cost performance index (earned value/actual cost)
FP.MoPFinancial Performance4.1 Debt Ratio
  • It is a good indicator from client’s point of view in terms of the risk of engaging a contractor.
  • A contractor could be terribly in debt but still do a good job in a project.
  • The risk of contractors going out of business and coming back with a different registration (‘phoenixing’) is high in the industry. Assessing debt ratio is helpful to curb this issue.
4.2 Gross profit margin ratio
  • It would be a good indicator to understand how much revenue a contractor is making on a project, which can be compared across different contractors.
  • It is more relevant for a developer as opposed to a builder.
4.3 Percentage increase in average annual turnover in the last 5 years
  • It gives a good indication of whether a contractor has a growth out of bounds of what they can actually perform.
  • Even with a high increase of turnover the contractor could be in heavy debt, which will not be captured through this measure.
4.4 Other measure
TP.MoPTime Performance5.1 Time variance
  • Time variance could be affected by the type of procurement arrangement.
5.2 Time predictability (Construction)
  • The consultant’s estimation of project time has a significant influence on the project.
5.3 Other measure
  • Schedule performance index (in line with cost performance index)
HR.MoPHuman Resources Strength6.1 Worker turnover rate
  • The records are available and can be obtained from project control meetings.
  • It is strongly correlated with having a good team.
  • Calculation of the worker turnover maybe limited due to differentiation of employees and other subcontractors’ workers onsite.
  • The unplanned exits from project key staff would be a good measure.
6.2 Adequacy of labour
  • The distinction between skilled and unskilled workers may not be significant.
  • It is not a good measure as it depends on the procurement model too.
6.3 Other measure
EX.MoPExperience and track record7.1 Number of similar type and size projects completed
  • For a newcomer to the construction market, this measure can be a barrier. Instead, the experience of key staff could be sufficient to assess the capability.
  • From a client’s perspective, this measure is preferable.
7.2 Number of failures in completing a contract
  • Some of the clients would request to disclose any previous or ongoing legal action involving the contractor.
  • Serious breaches of contractual obligations could indicate the poor performance of a contractor.
7.3 Other measure
EP.MoPEnvironmental Performance8.1 Volume of total waste removed from site
  • It can mislead if demolition waste is included in the total volume.
  • The comparison would be fair for conventional building practices as opposed to the ones having a lot of precast components.
  • The volume of waste recycled vs. removed as landfill would be a better level of measurement if possible.
  • Even if the client’s design was wasteful to construct, an environmentally conscious contractor would provide an alternative that is less wasteful.
8.2 Number of environment related complaints and fines
  • It is something often queried at tender submissions.
  • It is unlikely to be measured properly.
8.3 Other measure
  • Measuring the carbon footprint
PP.MoPPlanning Performance9.1 Hit rate percentage
  • Programme Managers in major projects would be able to track hit rate percentage easily.
  • Changes caused by variations need to be adjusted when calculating.
  • It gives a better indication on how well the project was planned out.
9.2 Planning Effectiveness
  • Due to the comprehensive nature of data available at the project planning departments of the contractors, calculating this measure should be easy.
  • It gives a better indication of the level of proper planning.
9.3 Other measure
  • Schedule performance index
PR.MoPProductivity Achievement10.1 Labour productivity
  • It is hard to measure, but the data are available.
  • It is not recorded as well as it should be.
  • Working out the actual total number of man hours would be troublesome.
10.2 Lost time accounting
10.3 Other measure
Table 5. Shortlisting of the top categories of measures of performance.
CodeTop Categories of Measures of PerformanceRefined Critical Measures (from Similar Type Projects)Assessment CriteriaLevel of Agreement by the Experts
Accessibility of DataAbility to Compute the MeasureFairness in Reflecting Contractor’s PerformanceE1E2E3E4E5
HS.MoPHealth and Safety PerformanceLost time injury frequency rateHigh High Very HighVery HighHigh
QP.MoPQuality PerformanceNumber of non-conformance reportsHigh HighHighLowHigh
CP.MoPCost PerformanceCost predictability or Project budget factorX 1X 2Agreed to remove from the top categories of MoPs
FP.MoPFinancial PerformanceContractor’s Debt Ratio High High High 6HighHigh
TP.MoPTime PerformanceTime variance or time predictabilityX 3X 2Agreed to remove from the top categories of MoPs
HR.MoPHuman Resources StrengthWorker turnover rate High High Very HighHighHigh
EX.MoPExperience and track record Number of projects completed within last 5 yearsHigh 7High LowHighHigh
EP.MoPEnvironmental PerformanceVolume of total waste removed from site, per gross floor area High High Very HighModerateLow 8
PP.MoPPlanning PerformanceHit rate percentage or planning effectiveness X 4X 5Agreed to remove from the top categories of MoPs
PR.MoPProductivity AchievementLabour productivity High High Moderate 9HighHigh
1—Hard to interpret cost data to find actual/initial/final costs of a project and it is highly contentious due to variations and claims; 2—Depends on the procurement route, consultant’s errors in estimation, scope changes etc; 3—Time is a highly contentious matter due to variations and claims; 4—Hard to access details of construction programme; 5—Not practical to identify details related to construction tasks due to scope changes, variations etc; 6—Can consider another measure: tender baseline vs. actual baseline cost; 7—Past experience may impede new comers to the industry. However, it is reasonable to consider from a client’s perspective; 8—Often the clients do not consider environmental performance as a key requirement. It usually gets superseded by factors of cost; 9—Total man hours onsite will not work for modular construction projects. Also depends on the project value.
Table 6. Pairwise comparison matrix of expert E2.
HS.MoPQP.MoPFP.MoPHR.MoPEX.MoPEP.MoPPR.MoP
HS.MoP(1, 1, 1)(1, 1, 1)(1, 1, 1)(4, 5, 6)(4, 5, 6)(1, 1, 1)(2, 3, 4)
QP.MoP(1, 1, 1)(1, 1, 1)(1, 1, 1)(4, 5, 6)(6, 7, 8)(1/4, 1/3, 1/2)(2, 3, 4)
FP.MoP(1, 1, 1)(1, 1, 1)(1, 1, 1)(4, 5, 6)(4, 5, 6)(1/4, 1/3, 1/2)(1/4, 1/3, 1/2)
HR.MoP(1/6, 1/5, 1/4)(1/6, 1/5, 1/4)(1/6, 1/5, 1/4)(1, 1, 1)(2, 3, 4)(1/6, 1/5, 1/4)(1/6, 1/5, 1/4)
EX.MoP(1/6, 1/5, 1/4)(1/8, 1/7, 1/6)(1/6,1/5, 1/4)(1/4, 1/3, 1/2)(1, 1, 1)(1/6, 1/5, 1/4)(1/6, 1/5, 1/4)
EP.MoP(1, 1, 1)(2, 3, 4)(2, 3, 4)(4, 5, 6)(4, 5, 6)(1, 1, 1)(2, 3, 4)
PR.MoP(1/4, 1/3, 1/2)(1/4, 1/3, 1/2)(2, 3, 4)(4, 5, 6)(4, 5, 6)(1/4, 1/3, 1/2)(1, 1, 1)
Table 7. Aggregated pairwise comparison matrix with subsequent calculations.
HS.MoPQP.MoPFP.MoPHR.MoPEX.MoPEP.MoPPR.MoPFuzzy Geometric Mean ValuesFuzzy WeightsDefuzzified Crisp Numeric WeightsNormalised Weights
HS.MoP(1, 1, 1)(1.55, 1.93, 2.35)(2.22, 2.41, 2.61)(3.29, 4.36, 5.40)(1.61, 1.90, 2.22)(2.35, 2.67, 2.93)(5.22, 6.11, 6.89)(2.166, 2.511, 2.840)(0.228, 0.313, 0.423)0.3210.309
QP.MoP(0.43, 0.52, 0.64)(1, 1, 1)(1.15, 1.38, 1.64)(2.17, 2.81, 3.57)(1.08, 1.31, 1.64)(1.52, 1.90, 2.35)(3.03, 4.08, 5.10)(1.268, 1.539, 1.851)(0.133, 0.192, 0.276)0.2000.192
FP.MoP(0.38, 0.42, 0.45)(0.61, 0.72, 0.87)(1, 1, 1)(1.15, 1.53, 2.05)(0.80, 1.00, 1.25)(0.87, 1.25, 1.74)(1.52, 2.14, 2.86)(0.835, 1.030, 1.258)(0.088, 0.128, 0.187)0.1350.129
HR.MoP(0.19, 0.23, 0.30)(0.28, 0.36, 0.46)(0.49, 0.65, 0.87)(1, 1, 1)(0.64, 0.82, 1.00)(0.87, 1.07, 1.32)(0.94, 1.12, 1.35)(0.540, 0.656, 0.804)(0.057, 0.082, 0.120)0.0860.083
EX.MoP(0.45, 0.53, 0.62)(0.61, 0.76, 0.92)(0.80, 1.00, 1.25)(1.00, 1.23, 1.55)(1, 1, 1)(1.52, 1.84, 2.17)(1.40, 1.72, 2.05)(0.897, 1.065, 1.256)(0.094, 0.133, 0.187)0.1380.133
EP.MoP(0.34, 0.37, 0.43)(0.43, 0.53, 0.66)(0.57, 0.80, 1.15)(0.76, 0.93, 1.15)(0.46, 0.54, 0.66)(1, 1, 1)(0.87, 1.25, 1.74)(0.592, 0.720, 0.885)(0.062, 0.090, 0.132)0.0950.091
PR.MoP(0.15, 0.16, 0.19)(0.20, 0.25, 0.33)(0.35, 0.47, 0.66)(0.74, 0.89, 1.06)(0.49, 0.58, 0.72)(0.57, 0.80, 1.15)(1, 1, 1)(0.413, 0.500, 0.623)(0.043, 0.062, 0.093)0.0660.063
Table 8. Performance model constituents.
CodeCategory of Measure of PerformanceWeightCritical Measure of Performance
HS.MoPHealth and safety performance30.9%Lost time injury frequency rate
QP.MoPQuality performance19.2%Number of non-conformance reports
FP.MoPFinancial performance13.3%Contractor’s debt ratio
HR.MoPHuman resources strength12.9%Worker turnover rate
EX.MoPExperience and track record9.1%Number of projects completed within last 5 years
EP.MoPEnvironmental performance8.3%Volume of total waste removed from site, per gross floor area constructed
PR.MoPProductivity achievement6.3%Labour productivity
Publisher’s Note: MDPI stays neutral with regard to jurisdictional claims in published maps and institutional affiliations.

