Review

Experimental Campaigns on Mechanical Properties and Seismic Performance of Unstabilized Rammed Earth—A Literature Review

Faculty of Civil Engineering and Architecture Osijek, Josip Juraj Strossmayer University of Osijek, Vladimira Preloga 3, 31000 Osijek, Croatia
*
Author to whom correspondence should be addressed.
Buildings 2021, 11(8), 367; https://doi.org/10.3390/buildings11080367
Submission received: 19 July 2021 / Revised: 14 August 2021 / Accepted: 18 August 2021 / Published: 19 August 2021
(This article belongs to the Special Issue Buildings: 10th Anniversary)

Abstract

:
Earthen architecture has a significant share in the world’s fund of both residential architecture and cultural heritage. It provides a home to more than half of the world’s population and can be found in seismically active areas. Empirically acquired knowledge on building with rammed earth (RE) has usually been passed down from generation to generation by word of mouth, with no written scientific grant for the load-bearing capacity and resistance of structural elements. Today, many countries still do not have standards for the design of RE structures. In the development of new as well as existing design standards, the results of experimental research play a significant role. The focus of this study was on unstabilized RE, which is locally available material with low embodied energy. This paper elaborates experimental campaigns, within which meticulous techniques were employed to provide new knowledge on RE for use in earthquake-prone areas. Furthermore, this paper includes: (i) ranges of values of mechanical properties determined on RE specimens from all over the world; (ii) a comparative summary of experimental research conducted on walls and buildings to assess their seismic performance; (iii) an overview of standards and testing methods used in experiments; and (iv) recommendations for further research.

1. Introduction

Earth constructions contribute to a significant and important share in the world’s residential architecture and cultural heritage [1,2,3]. Earthen architecture provides a home to more than half of the world’s population [4]. About one third of all constructions globally contain earth as a construction element [5]. Moreover, homes made of earth can be found in both seismically quiet and active areas [2,6,7,8,9,10,11,12].
The first houses in the world were built in an improvised way by applying material found in the immediate surroundings or obtained by digging basements, wells, or watering pits for cattle [11]. Empirically acquired knowledge on building with earth has been passed down from generation to generation by word of mouth, with no written scientific information for load-bearing capacity and resistance of structural elements. The industrialization process and development of new technologies has resulted in modern materials used in construction in accordance with constantly improved design standards. Moreover, the oral tradition of sharing empirical knowledge was replaced with code-based architecture, the behavior of which is predicted and planned by computer software.
Among the other types of vernacular earth-building techniques, earthen architecture includes adobe [12,13,14], cob [15,16], compressed earth block [17,18,19], and rammed earth (RE) [4,10,11]. However, this paper focused only on the unstabilized RE building technique. It is considered that this building technique is one of the most important earth-building techniques both in traditional and modern earth architecture [4]. Moreover, vernacular unstabilized RE buildings are still important on the global scale and need to be protected from disappearing [20].
Building with RE consists of pouring moistened soil in layers inside a wooden or metal formwork and compacting it by using a manual or pneumatic rammer to form walls [3,21,22]. Sassu et al. [19] demonstrated an innovative, very reproducible procedure for making earth blocks using a manual press. This procedure could potentially be used in the preparation of RE specimens for testing material properties. The formwork can be removed later and placed to a new construction location or to a new part of a future house. The soil composition varies and strongly depends on building location, which is demonstrated in the next chapter. However, it is known that RE suitable soil always comprises clay, silt, and sand [4,6,7].
In the unstabilized RE construction technique, clay acts as a natural binder that holds together larger particles once the formwork is removed. In contrast, the stabilized rammed earth (SRE) construction technique uses modern industrially produced binders such as hydraulic or calcium lime, cement, or asphalt emulsions [6,21]. Modern stabilizers in SRE have a favorable effect on its strength, durability, and resistance to external actions (e.g., earthquakes), however, at the same time, they reduce the possibility to fully recycle RE as a building material and increase its embodied energy. This paper only deals with unstabilized RE as it is a low-cost material available practically everywhere. Moreover, it does not contain artificial binders and can be returned to nature en block. When compared to modern materials, unstabilized RE has become competitive as it greatly supports sustainability and low energy consumption [5,11,23]. Despite its advantages, unstabilized RE possesses relatively poor mechanical properties and low seismic resistance.
Eastern Croatia has been taken as an example of seismically active areas with many houses made by the RE technique [11,24]. Although being more than 100 years old, many of these houses have withstood the devastation of war and natural disasters. Through field research, the authors have learned that many such houses are still in use for housing or as outbuildings. However, experimental research of the load-bearing capacity of RE walls or houses in Croatia has not been carried out yet, and the techniques of making soil mixtures and building with RE are neglected or forgotten. Another challenge of building with RE in Croatia is the lack of relevant norms. These are just some of the issues related to building with RE in Croatia as well as in some other European Union member states [7,25].
As already pointed out, a significant amount of earthen architecture is located in seismically active areas. However, despite the growing volume of research, a lack of knowledge regarding the mechanical properties and seismic resistance of RE still exists not only in the European Union, but also in most countries around the world. The most likely culprit for this situation is to be found in the uniqueness and high variability of properties of local material used in RE, but also in the lack of coded methods and procedures.
Only the synergy between numerical and experimental research methods can contribute to the development of codes for the design of RE structures. They both complement each other. Numerical methods are used for the preliminary design and prediction of the behavior of real structures. However, input data determined by experimental tests are required to define the numerical models. Experiments are conducted to verify the validity of numerical models, and to gain new knowledge on the behavior of real structures. Finally, numerical methods are relatively inexpensive and suitable for the implementation of rapid parametric studies. In contrast, experimental methods are often very expensive and rarely harmless, but can provide superior insight into the actual behavior and failure mechanisms of real structures. There have been many numerical studies on the seismic behavior of RE structures conducted recently [26,27,28]. The data from the available peer-reviewed papers collected in the following chapters will facilitate the implementation of further similar studies.
The aim of this paper is twofold. First, to collect the key experimental data from cutting-edge laboratories to facilitate the implementation of numerical studies but also norms and codes, and second, to define niches for future experimental research in the field of URE. This paper encompasses: (i) an overview of both norms and testing methods used in experiments on small-scale RE specimens from all over the world; (ii) an overview of experimentally tested RE walls and buildings allowing easier calibrations and validations of both numerical and analytical models; (iii) insight into the minimum and maximum values of mechanical properties that can be expected in load-bearing RE walls and buildings; (iv) data that can enable machine learning aided by artificial intelligence; and (v) recommendations for further research.
To gain a better understanding of the mechanical properties of RE, this paper begins with a description and interpretation of the fundamental physical properties of RE available in the reviewed literature. Emphasis was placed on the particle size distribution, moisture content, and dry density as these properties are provided in most of the reviewed literature. Moreover, it is well known that these properties directly affect the mechanical properties of the soil, so they were considered first. Then, the mechanical properties of RE were placed under the loupe. The third part of the paper describes the experimental research conducted on models and mockups made of URE. Finally, the niches for further research are highlighted.

2. Digest on Physical Characteristics of RE

2.1. Particle Size Distribution (PSD)

The fundamental description of an earth mixture suitable for RE construction can be provided through PSD. PSD is usually mentioned in papers dealing with RE, so it is also observed in this paper as the first factor. PSD governs the compaction behavior of the soil, its maximum dry density, and finally unconfined compressive strength UCS [29]. Particle size ranges defined according to Knappett and Craig [30] were used in this study. As RE usually contains clay, silt, and sand particles, special attention was given to particle sizes between 0 and 2 mm. However, it should be noted that some mixtures described in the available literature [4,6,31,32,33] even contained gravel and cobbles, however, in very low quantity. Table 1 presents the PSD curves of 39 earth mixtures described in 23 studies conducted in Australia, Asia, and Europe. Table 1 indicates natural materials originated from different parts of the world and man-made earth mixtures produced for construction.
As presented in Table 1, the PSD for RE mixtures showed high dispersion. On average, natural mixtures contained 12.83% of clay, 23.73% of silt, 42.92% of sand, and 18.89% of gravel. Man-made mixtures predominantly consisted of sand particles.
Figure 1 shows data on the PSD of soils and soil mixtures used in Australia, France, and Portugal (Table 1). To the authors’ best knowledge, RE architecture in those countries is common, so special attention was given to studies from these countries. In addition, most of the observed PSD curves in this study were obtained from studies particularly conducted in the above-mentioned countries. However, New Zealand should also be mentioned here as a country with a long tradition of building earthen houses, but also as a country that has the most comprehensive earth building standards in the world (http://www.earthbuilding.org.nz/ accessed on 13 August 2021). In Figure 1, natural material is presented by continuous lines, while man-made soil mixtures are presented by dashed lines. As expected, Figure 1 shows that PSD for each observed country vary significantly. In the context of the PSD of local material used for RE, it is presumed that it varies not only because of the geological location of the building site, but also because of the local builders’ empirical knowledge and preferences when selecting a suitable soil for building.
Earlier studies [29,42,47] presented Houben and Guillard’s envelope (HGE in Figure 1) on PSD that indicated soils suitable for use in RE construction. The same envelope was used in this paper, as shown in Figure 1. It can be observed from Figure 1 that not even one PSD curve obtained from Australia and merely one PSD curve obtained from France respects the limits defined by the envelope. However, most of the PSD curves obtained from Portugal fit well inside the envelope proposed by Houben and Guillard. The PSD of all man-made soil mixtures from Australia were above the upper envelope threshold, except in the range of coarse silt and fine sand, where they were located within the recommended envelope. Moreover, Figure 1 shows that natural soils from Australia lack clay and fine silts, but that sand content is between the recommended upper and lower threshold. Soils A5—A7 had to be stabilized by cement as the clay content was negligible.
However, it should be noted that Houben and Guillard’s envelope has the strictest limit on the amount of smaller particles that RE-suitable soil may contain. Observing the PSD curves of soils used in recent experiments, as given in Figure 1, led to the conclusion that there is still no consensus on how many smaller particles a soil suitable for RE construction should contain.

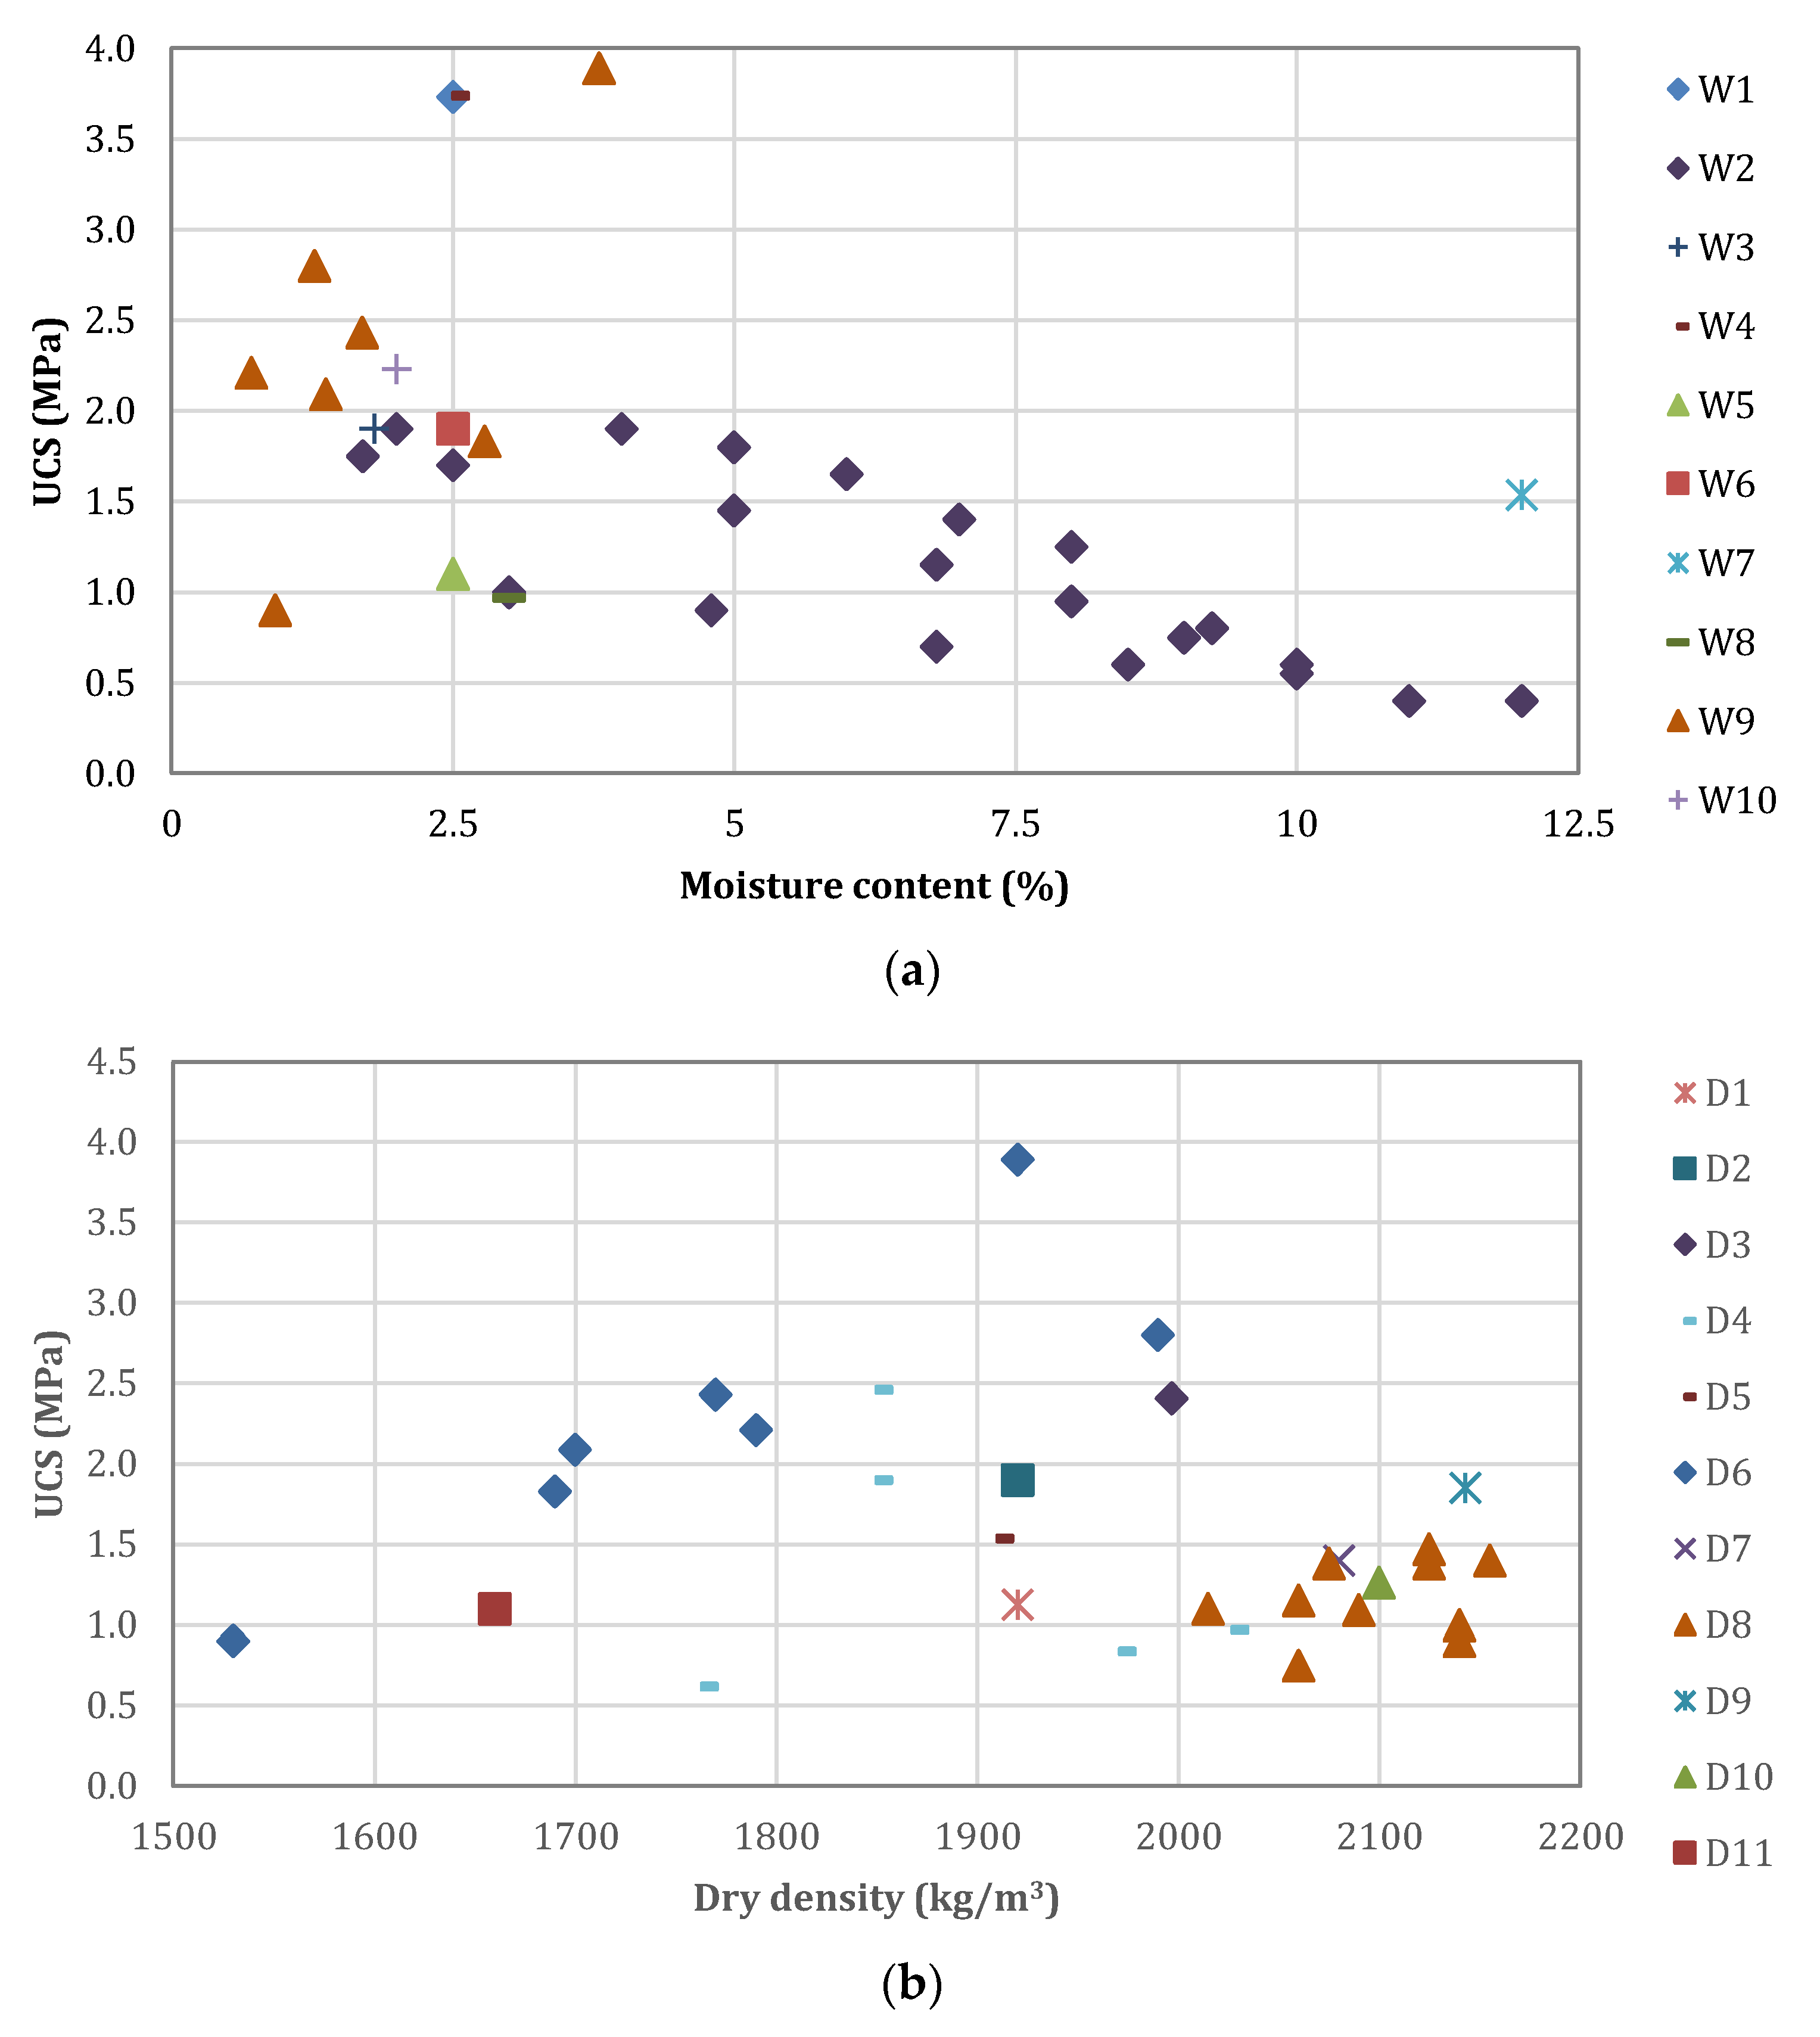
2.2. Moisture Content and Dry Density

Determination of moisture and dry density is usually performed in one or two consecutive steps. In addition to PSD, moisture and dry density are also among the key factors that greatly influence the value of UCS [49,50,51,52,53].
Due to its porous structure, RE has the ability to absorb moisture from the air and/or the substructure on which it rests (e.g., foundation and/or foundation soil). Likewise, RE can release moisture when heated. By observing Figure 2, it can be seen that moisture content in the specimens used to determine UCS ranged from 0.7 to 12.0%, whereas dry density ranged from 1530 to 2155 kg/m3. Mean moisture content equaled 4.53% and dry density was 1969 kg/m3.
In an intuitive way of thinking, it would be concluded that UCS would be higher at larger dry density and/or lower moisture content. However, Figure 2 does not show such trend. Higher UCS is usually followed by lower percentage of moisture content, but this does not always appear to be the case. The relationship between UCS and dry density is even less apparent with all values dispersed. It is assumed that UCS is also affected by the size of test sample and by PSD as well as by energy and the method of compaction.

3. Experimental Campaigns on Mechanical Properties of RE

3.1. Unconfined Compressive Strength and Young’s Modulus of Elasticity

Usually determined in a pair, unconfined compressive strength (USC) and Young’s modulus of elasticity, E, make the most important mechanical characteristics for describing structural materials.
Methods for testing concrete have been used by many authors to determine mechanical properties of RE [2,56,65]. While considering those properties, Table 2, defined by Tomičić [66], overviews the different shapes and dimensions of concrete specimens that result in different UCS. Meticulous testing of UCS by using different specimens ought to be carried out to determine if the same principle is also valid for RE. To the authors’ best knowledge, up until today, such testing has only been presented by Maniatidis and Walker [51], and El-Nabouch [67]. In both of these studies, higher values of UCS were obtained on small cylindrical specimens with respect to the values obtained on larger prismatic counterparts (Table 3). A 150 mm cube was used as a reference specimen in Table 2 as it is one of the recommended test specimens according to the European standards for concrete. The possibility of using the results obtained by testing specimens of other dimensions and shapes as orientation data is not excluded.
Over the past 26 years, studies have been carried out to determine UCS and modulus of elasticity, the results of which are presented in Table 3 and Table 4, respectively. Usually, UCS is determined by unconfined compression test on small prismatic or cylindrical specimens of various dimensions, and rarely on wallets or full-scale walls (Table 3). To the authors′ best knowledge, in only one study [46] dealing with RE, UCS and modulus of elasticity were determined by triaxial tests.
For some authors [51,68], the cylindrical shape of specimens is by far superior. As there are no corners, cylindrical specimens are easier to manufacture and better compacted, thus having higher density, higher compression strength, and higher modulus than prismatic specimens. However, “true” compressive strength of RE walls is, in some instances, smaller than the one determined on cylindrical specimens. This is the reason why some authors [21,32,37] agree on the limitations of cylindrical specimens when determining the compression strength of RE.
Yamin et al. [76] proposed that the specimen scale does not considerably affect the mechanical properties of RE. It was later observed that larger specimens yield lower UCS [51,65]. Namely, a reduction in UCS in larger specimens can be explained by using larger fractions of soil, which requires greater compaction effort. For this reason, Ciancio and Gibbings [37] recommended making cylindrical specimens out of SRE at least three times larger than the maximum particle size of the used soil.
In some instances [2,53], instead of ramming the specimen inside mold, cylindrical specimens were extracted from the walls, usually by a drilling machine with diamond core bits. This technique can save time and attempts to replicate manufacturing the wall better than ramming separate specimens. However, according to Ciancio and Gibbins [37], this technique is not recommended for unstabilized RE as it may severely damage the specimen.
Another important feature is the age of the specimen at the time of testing. Figure 3 shows the average value of UCS and standard deviation with respect to the age of the specimen at the time of testing. Above the columns in Figure 3, numbers in brackets show the number of specimens tested at a particular age. Researchers usually follow the norms for concrete and test specimens after 28 days, as shown in Figure 3. Lilley and Robinson [56] tested cubes at the ages of 24 h, seven days, and 28 days to conclude that after seven days, UCS increased to the value of around 2 MPa, but then decreased for 10% after 28 days, particularly if the used soil contained more than 15% of clay. However, Schroeder [58] suggested that the determination of UCS should be carried out after 90 days, since the drying of RE takes longer than the drying of concrete.
Based on the graph shown in Figure 3, neither definite trend nor conclusion on the ideal age for the testing of UCS can be made. However, it was calculated that the standard deviation of UCS at the age of 28 days was equal to 0.93 MPa. Furthermore, the number of tested specimens clearly plays an important role when determining the standard deviation. The combination of different techniques and possibly different compositions of the local soil used for earth architecture can be blamed for such a large dispersion of the measured UCS. Moreover, to the authors′ best knowledge, no study has been conducted on several-year-old specimens produced in laboratories. For this reason, it is suggested to test specimens of controlled material at various periods of time.
It is known that the UCS of RE is strongly dependent on granulometry, especially on the clay percentage in the mixture [1,69]. The type of clay can also influence the UCS of RE [52]. When it comes to particle composition, Liu and Tong [71] proposed empirical expression (1) for calculating UCS based on the ratio of fine aggregates to coarse aggregates:
UCS = 0.033 ω 2 + 0.376 ω + 0.297
where ω is ratio of fine aggregates (silt and clay) to coarse aggregates (sand and gravel).
According to Liu and Tong [71], UCS is maximal when ω equals 5.77 because the intake of fine aggregates is then sufficient enough to wrap around coarse aggregates, but not immoderate so that coarse aggregates loose contact.
As presented in Table 3 and Table 4, tests are being carried out in accordance with different norms and recommendations. In the majority of observed countries, norms for determining mechanical properties of RE have not been developed yet. Thus, in most cases, researchers are using norms to determine the mechanical properties of concrete (Table 2). Exceptions are experimental campaigns conducted in Australia and New Zealand, where norms for RE constructions are already in use.
Table 3 presents the list of studies conducted over the past 25 years, along with methods for the description of specimens used for determining UCS. For each study, the average value of UCS was calculated and, if known, the norm by which UCS testing was performed is provided.
Determining modulus of elasticity usually goes hand-in-hand with determining UCS. To plot the stress–strain curve, deformation is measured by extensometers or, more commonly, by LVDTs during testing. Miccoli et al. [1,69] measured deformations by using ARAMIS in pair with LVDTs. From the σ–ε curve, the modulus of elasticity is determined by linear fitting curve between 5 and 30% UCS [3,41,42] or between 0 and 20% UCS for the secant modulus [20]. Furthermore, in two recent studies [3,59], the dynamic modulus of elasticity was determined by an ultrasonic test on full-scale walls, yielding much greater values of modulus when compared with static modulus determined on small scale specimens made from the same material.
Table 4 presents studies published over the past 13 years. The same table presents the test methods and describes the specimen used to determine the modulus of elasticity. In most cases, the modulus was determined from the compression tests, with a few exceptions being the axial and uniaxial compression test or calculating the modulus according to norm. For each study presented in Table 4, the average value of the modulus of elasticity is listed in MPa and, if known, the norm according to which the testing was performed is provided.
Figure 4 presents the data gathered from 25 studies, providing information on the measured modulus of elasticity and UCS. Significant scatter of values implicates high dependency of RE mechanical characteristics on many factors such as granulometry and composition of mixture, specimen shape and size, compaction energy, compaction technique, the age at which the testing was conducted, etc. A large scatter in the value of the modulus of results can be noted, which was also pointed out in [47].

3.2. Tensile Strength

When talking about the seismic capacity of RE construction, having information about the tensile strength is one of the key elements. Similar to concrete, an Achilles’ heel of RE is its significantly lower tensile strength as opposed to the compressive strength. In addition, it has been proven [49,65] that the interface between two layers of RE has even lower tensile strength than the RE layer, thus making the interfaces as critical places in RE structures.
Table 5 overviews some studies published over the past seven years that have dealt with the determination of RE tensile strength. As in the case with UCS, specimens of various shapes and dimensions were observed, and each study employed a different norm.
Four references studying SRE have been included in Table 5 to present methods used for the testing of tensile strength and corresponding norms, if applicable. For those tests, no results were presented in Table 5 because SRE was not a focus of this review.
As presented in Table 5, two different methods prevail: the splitting tensile test (i.e., Brazilian test) that uses cylindrical specimens, and the three-point bending test that uses prismatic specimens. Exception was found in one study [49], in which direct tension test was applied in addition to splitting tensile test. The direct tension test was conducted on cylindrical specimens, where the diameter was smaller in the middle part. The reason for choosing this method is the apparent underestimation of tensile strength during splitting testing [80]. Although using the same method almost ten years later, Araki, Koseki, and Sato [49] did not observe much of a difference.
In Table 5, the average value of tensile strength is listed for each reviewed study and, if known, the norm by which the test was performed is given respectively.
When not determined experimentally, tensile strength was estimated as the function of UCS. It was suggested that tensile strength may be estimated equal to 10% of UCS value [21], but also as being equal to 20% of the UCS value [71]. These recommendations are shown as linear functions in Figure 5. Figure 5 demonstrates that tensile strength for RE with UCS higher than 1 MPa can be well estimated as 10% of UCS, while for RE with UCS lower than 1 MPa, it is more appropriate to estimate tensile strength equal to 20% UCS. However, as Figure 5 demonstrates, there is no clear relationship between tensile strength and UCS.

3.3. Shear Strength

The shear strength of RE is essential for the design of resilient and safe structures in seismically active areas. For the testing of RE shear strength, geotechnical and masonry testing techniques are usually employed.
The most common test for determining shear strength is the diagonal compression test, carried out in accordance with the norms for the design of masonry structures. Specimens observed and listed in Table 6 are similar in geometry. However, a scaled diagonal compression test was performed in one study [81].
Another approach to the determination of the shear strength employs a geotechnical procedure. T.-T. Bui et al. [21] defined the shear strength as a function of cohesion, normal stress, and friction angle, according to the Mohr–Coulomb criterion. In the same study, they concluded that shear strength could be estimated as 10% of UCS. Furthermore, Corbin and Augarde [82] suggested that shear strength should be determined from the direct shear box test, while in two other studies [46,83], shear strength was determined by using the triaxial test on cylindrical specimens.
Table 6 lists nine studies that describe the methods for the determination of shear strength on RE specimens, in which the diagonal compression test is preferred. For each study, the average value of shear strength is listed and, if known, the norm by which the test was performed is given.

3.4. Cohesion and Friction Angle

When building with RE, it is crucial to perceive geotechnical parameters such as cohesion and friction angle (Table 7), especially when constructing the computational model of a RE structure. Experimentally, cohesion and friction angle are usually determined from the direct shear test, which can be used for the assessment of cohesion and friction angle of the interface (IF). IF is the surface between two layers of RE. Values for IF properties are almost exclusively lower than the counterparts determined for RE layers (LAY). Namely, the friction angle of IF equals around 90% of the friction angle of the layer, while cohesion of IF equals around 80% of the layer cohesion, according to El-Nabouch, Bui, Perrotin et al. [40].
To determine cohesion values, Nowamooz and Chazallon [84] used the drained monotonic triaxial test, while Schroeder [58] used the cohesion test published by Richard Niemeyer in 1944 and adopted in the German norm. The cohesion test appears to be a simplified version of the direct tension test that uses special hourglass-shaped specimens.
When experiments cannot be conducted, cohesion can be estimated by applying the Mohr’s circles theory for tensile and compressive (UCS) strengths as 14% of UCS [21]. In some studies, cohesion was taken as equal to tensile strength [55,77,85] or as a fraction of tensile strength [1,26].
El-Nabouch, Bui, Perrotin et al. [40] studied the influence of specimen size on cohesion and friction angle to conclude that larger specimens provide lower values of cohesion and friction angle due to high variation of the moisture content inside large specimens.
Table 7 lists seven studies that describe the methods and norms for the assessment of cohesion and friction angle. Three of those studies also provide information on IF characteristics. For each observed study, the average value of cohesion and friction angle are listed, and if known, the norms by which the tests were performed are given.

4. Experimental Campaigns on Seismic Performance

Each experimental study is preceded by the definition of: (i) sample geometry; (ii) modeling and scaling techniques; (iii) building technology; (iv) load input; and (v) measurement of data of interest.
Table 8 and Table 9 provide a chronological overview of experimental studies conducted on mock-up RE structures over the past 12 years. The observed studies were conducted to primarily determine the crack patterns, seismic capacity, drift ratios, failure mode, load-displacement relationships, stiffness degradation as well as to assess the equivalent viscous damping and the effects of layer thickness and drying period on the RE shear resistance. All were measured and assessed in laboratory conditions on available measuring devices. In most cases, experimental tests performed on seismic tables are the only ones to provide insight into the overall seismic behavior of the structure and the associated mechanical and dynamic properties. For instance, damping ratio value for RE was expressed in only one observed study conducted by using a shaking table [75]. The determined damping ratio was estimated to be 9.81% during low intensity shaking. This is a relatively high value when compared to the same quantity obtained experimentally on real RE structures in the field [7], where the value of damping ratio ranged between 2.5 and 4%.
To simulate the vertical stress at the top of RE mock-up structures resulting from the dead loads (e.g., self-weight of roof) and the live loads (e.g., snow and wind), there were concrete blocks, vertically orientated hydraulic presses and/or steel profiles employed. Vertical compressive stress of 0.30 MPa applied at the top of the wall in tests conducted by El-Nabouch et al. [68] corresponded to the stress created by the self-weight of structural and non-structural loads and live loads in upper two stories of a three-storey RE house. On the other hand, vertical compressive stress of 0.56 MPa was applied at the top of the specimens tested by Miccoli, Müller, and Pospíšil [54] corresponding to 15% of the mean value of UCS determined before the test. Namely, high values of vertical compressive stress were used in tests to prevent possible rocking and flexural failure mechanisms [54,68], but also to enforce a shear-type behavior [54]. Many of the experiments listed in Table 8 did not employ any vertical stress at the top of RE mock-up structures. This configuration can correspond to RE walls that serve as an infill of load-bearing frame structures.
In the context of seismic performance assessment, different limit states are defined for structures subjected to horizontal forces until failure [68,86]. Inter-storey drift can be used to assess a limit state. With the occurrence of cracking (i.e., with leaving the elastic region), the first limit state can be defined. Definition of other limit states depend on the extent of damage, the degree of stiffness or strength degradation as well as on the width of cracking.
For the walls and one-storey buildings observed here, inter-storey drift, Δu, can be obtained as the top horizontal displacement normalized by the height of the observed structure. Inter-storey drifts at leaving the elastic region are listed in Table 8. In the absence of inter-storey drift values available in the reviewed literature, the authors approximated inter-storey drift values from cyclic load-displacement or pushover curves. In case when cyclic load-displacement curves are used, only the positive (pushing) direction was observed. Inter-storey drift values determined by the authors are marked with an asterisk in Table 8. In this study, only inter-storey drifts for the first limit state were defined as there was not enough available data in the literature observed to assess inter-storey drifts for higher limit states. Table 8 indicates the conservative lower bound of cracking inter-storey drift for RE walls as 0.08%.
Out of the 11 experimental studies listed in Table 8, only three studies examined the out-of-plane behavior of RE walls, while only one study investigated the behavior of RE walls with openings. To the authors’ best knowledge, only two studies were conducted by using shaking tables to provide the full insight into the seismic performance of RE mock-ups. This suggests limited knowledge on the out-of-plane behavior of RE walls and behavior of RE walls with openings for seismically active areas. Furthermore, there is limited knowledge on the behavior of corners in RE structures (i.e., joints of RE walls meeting from two perpendicular directions).
The most common height of tested walls is 1.50 m, which refers to a 1:2 scale model of a real RE building, considering that the height of the floor in a real building is 3 m [11,57]. The same conclusion regarding the scaling can be determined based on wall thickness. Namely, RE walls in real structures are usually between 0.40 and 0.60 m thick [11,24,42,57]. Walls tested in 1:2 scale have a thickness ranging between 0.20 and 0.30 m. Table 8 indicates that the conservative lower bound of the maximum horizontal load that 1:2 scaled RE walls can attain is 40 kN. On the other hand, real scale RE structures show a pronounced scattering of maximum horizontal load attained during testing.
The size of the laboratory and the ability to make models outdoors has a major impact on the model scale. Real scale models can provide the most accurate data, but such models require significant human, material, and financial resources. In the case of using small-scale models, it is necessary to follow the scaling rules. Except for the study of Zhou and Liu [8], other reviewed studies did not refer to the scaling rules employed in experiments. Almost all studies listed in Table 9 provided only the scale at which the model was derived.
From the studies listed in Table 9, it was not possible to establish whether the thickness of the RE layer was scaled when scaling the global geometry of the specimen (i.e., it was not possible to establish whether the number of RE layers was scaled when scaling the global geometry of wall samples). This is an important issue because it is known that the zones between the RE layers are weak points in RE structures [40,68].
Today, although there are advanced technologies that allow for the creation of models of walls and houses, many of the research projects listed in Table 9 used traditional methods employing wood formwork and manual ramming. By applying such building techniques, more faithful replicas of traditional constructions can be created.
The RE mock-ups were first tested after 30 days. This test time corresponds to the standard test time for concrete specimens [87]. However, many experiments were conducted after a curing period of two or more months.

5. Outlook and Perspectives

This study addressed the experimental campaigns conducted in different countries worldwide to determine the mechanical properties and assess the seismic performance of RE. It provides a report on the experimental campaigns conducted during the last 20 years within which meticulous techniques were used to obtain new knowledge on RE for use in earthquake prone areas.
The study included:
i.
A short survey on the key physical properties of RE that can influence its mechanical properties and consequently its seismic performance;
ii.
A survey of peer-reviewed literature to identify the norms and testing methods used in various experiments to determine the mechanical properties of RE;
iii.
Data collection from peer-reviewed literature to define the minimum and maximum values of mechanical properties that can be expected in load-bearing RE walls and buildings; and
iv.
An overview of experimentally tested RE walls and buildings from all over the world.
The main conclusions regarding the physical properties of RE are the following:
i.
On average, natural soil mixtures for RE used in experimental campaigns consist of 12.83% clay, 23.73% silt, 42.92% sand, and 18.89% gravel. Man-made soil mixtures predominantly consist of sand particles; and
ii.
Based on ten peer-reviewed studies, it was concluded that moisture content in specimens used to determine UCS ranged from 0.7 to 12, whereas dry density ranged from 1530 to 2155 kg/m3. Mean moisture content equaled 4.53% and dry density was 1969 kg/m3.
When considering the experimental campaigns on mechanical properties, the main conclusions are as follows:
i.
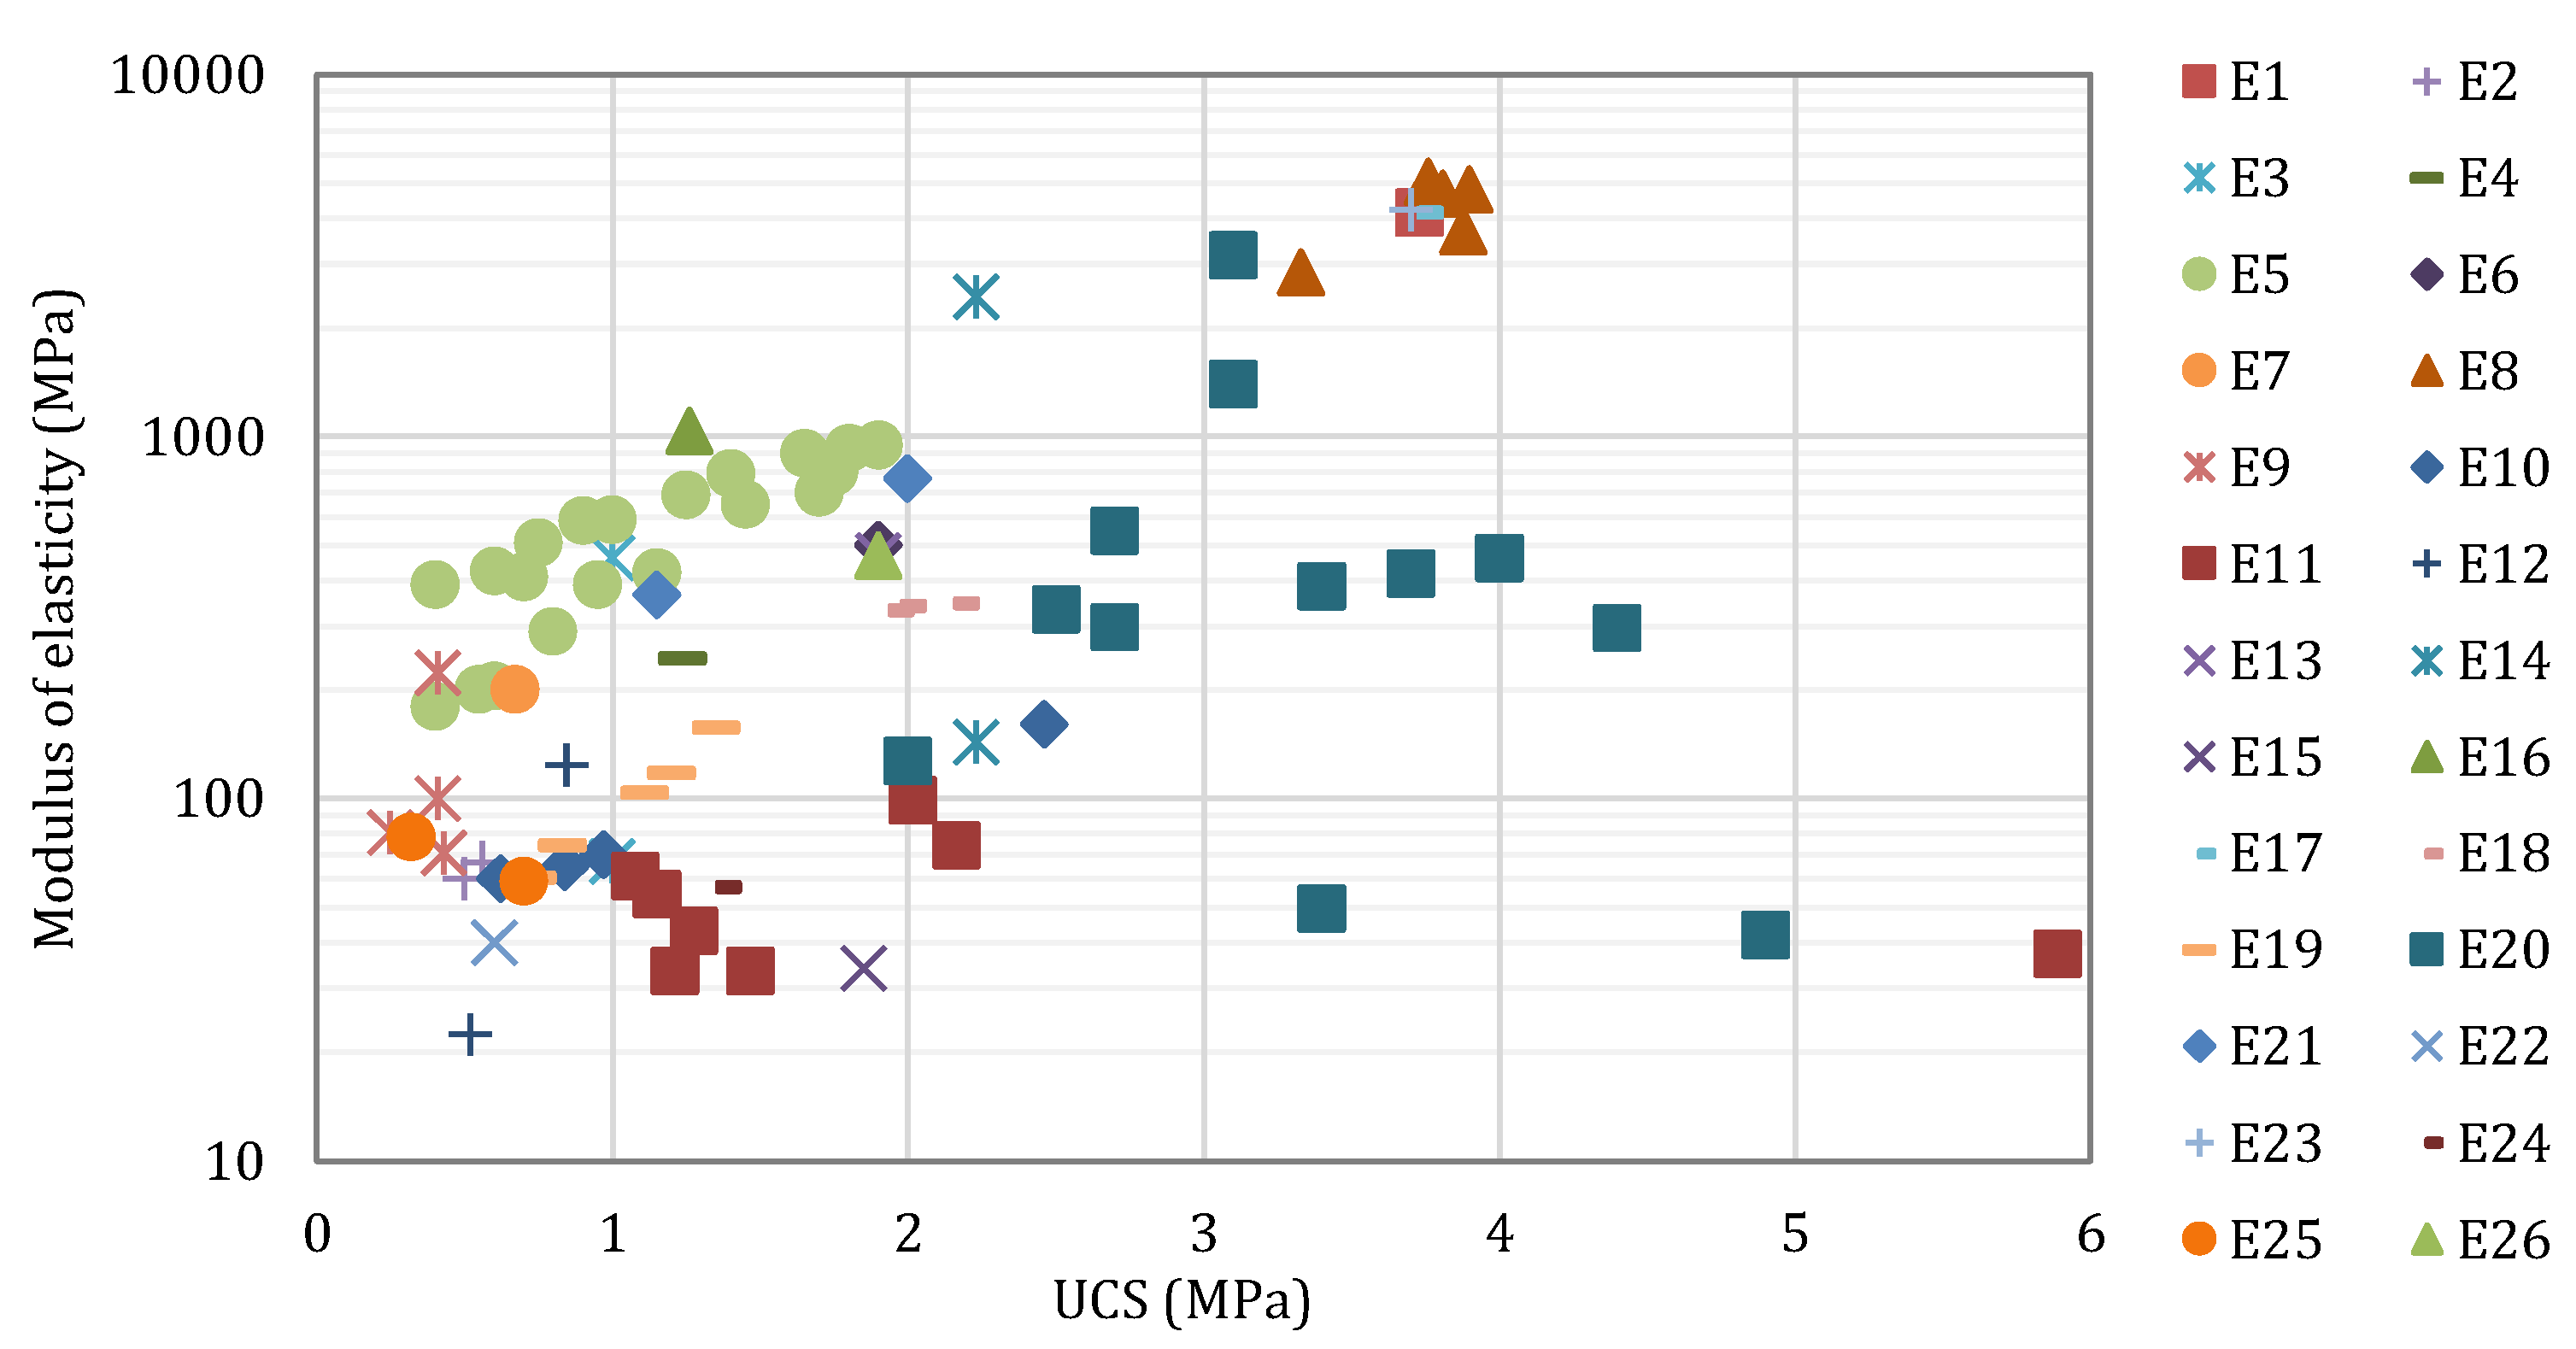
The observed values of UCS ranged from 0.38 to 4.15 MPa, with the average value being 1.72 MPa;
ii.
Values of modulus of elasticity ranging from 40 to 4207 MPa were recorded, pointing out a large disperse of results, with the average value being equal to 932.30 MPa;
iii.
A survey conducted on 31 peer-reviewed research papers showed that there is no standardized mold for the determination of UCS of RE. Molds of different sizes and shapes were used to determine UCS;
iv.
Values of tensile strength ranging from 0.08 to 040 MPa were noted, with the average value being equal to 0.22 MPa;
v.
Values of shear strength ranging from 0.15 to 2.20 MPa were noted, with the average value being equal to 0.77 MPa;
vi.
Values of cohesion of RE layer ranged from 9.81 to 214 kPa, with the average value being equal to 101.10 kPa;
vii.
Values of friction angle of RE layers ranged from 37.3° to 54.11°, with the average value being equal to 44.16°;
viii.
In most of the cases observed in the literature, reviewed ASTM norms were employed to determine the mechanical properties of RE; and
ix.
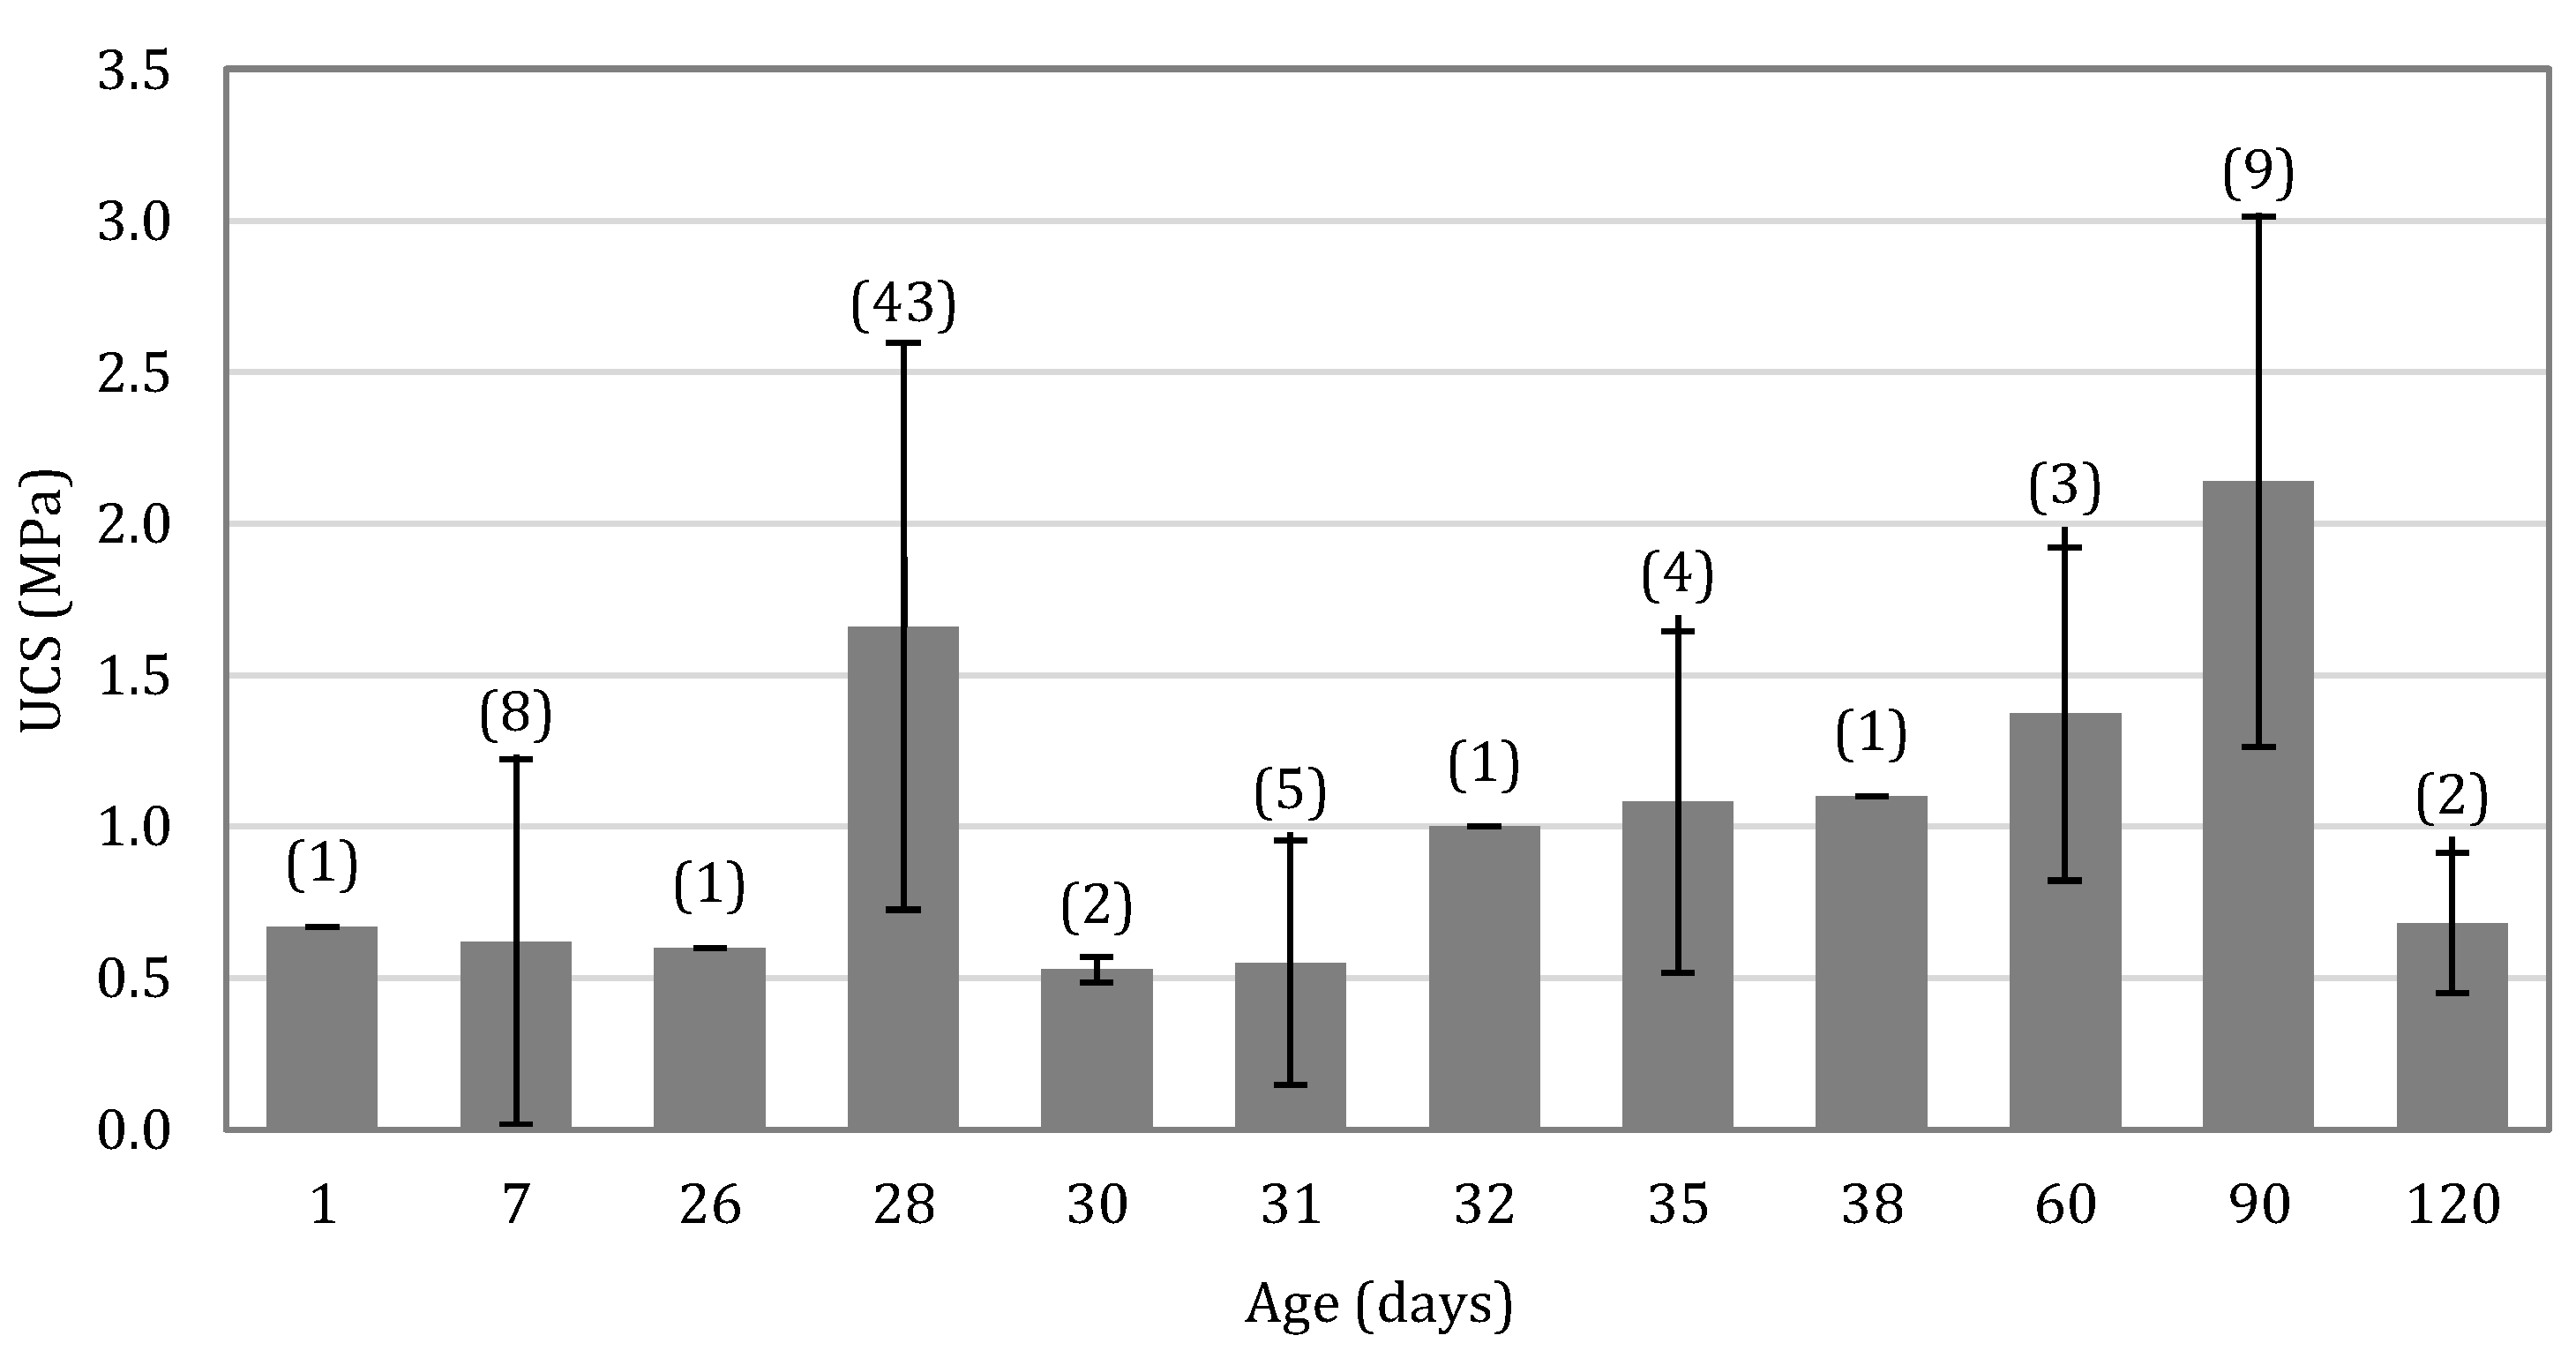
Researchers usually follow the norms for concrete and test RE specimens for mechanical properties after 28 days of curing.
The main conclusions regarding the experimental campaigns conducted to assess the seismic performance of RE structures are as follows:
i.
Many of the experimental campaigns did not employ any vertical stress at the top of the RE mock-up structures. However, when applied, the vertical stress ranged from 0.1 to 0.56 MPa;
ii.
The most common height of tested walls is 1.50 m, which refers to a 1:2 scale model of a real RE building. Walls tested in 1:2 scale have a thickness ranging between 0.20 and 0.30 m;
iii.
RE mock-ups are usually tested after 30 days of curing;
iv.
For RE walls in general, a conservative lower bound of cracking inter-storey drift equal to 0.08% was indicated based on 11 observed experimental campaigns;
v.
For 1:2 scaled RE walls, a conservative lower bound of maximum horizontal load equal to 40 kN was indicated based on eight different solid walls experimentally tested until failure; and
vi.
The damping ratio determined by the shaking table test was estimated to be 9.81% for a RE structure subjected to low intensity shaking. This is relatively high value when compared to the same quantity obtained experimentally on real RE structures in the field, where the value of damping ratio ranged between 2.5 and 4%.
The following niches for future experimental research in the field of RE are defined:
i.
It was learned that different shapes and dimensions of specimens can dictate different values of UCS. Meticulous testing of UCS on different RE specimens ought to be carried out to clearly determine if the same principles determined for concrete are also valid for RE;
ii.
There is no clear relationship between tensile strength and UCS;
iii.
There is very limited knowledge on damping ratio of RE;
iv.
Limited data on the sheer strength, cohesion, and friction angle for RE is available in the peer-reviewed literature; and
v.
From the peer-reviewed literature, it was not possible to establish whether the thickness of the RE layer was scaled when scaling the global geometry of the specimen (i.e., it was not possible to establish whether the number of RE layers was scaled when scaling the global geometry of wall samples). This could be an important issue because it is known that the zones between the RE layers are weak points in RE structures.

Author Contributions

Conceptualization, A.P. and I.K.; methodology, I.K. and J.K.; formal analysis, A.P. and I.K.; investigation, A.P., I.K., J.K. and L.K.; resources, A.P., I.K., J.K. and L.K.; writing—original draft preparation, A.P. and I.K.; writing—review and editing, A.P., I.K., J.K. and L.K.; visualization, A.P., I.K. and L.K.; supervision, I.K.; project administration, I.K.; funding acquisition, I.K. All authors have read and agreed to the published version of the manuscript.

Funding

This research and the APC was funded by Croatian Science Foundation, under the project UIP-2020–02-7363 Rammed earth for modelling and standardization in seismically active areas—RE-forMS.

Conflicts of Interest

The authors declare no conflict of interest.

References

  1. Miccoli, L.; Drougkas, A.; Müller, U. In-plane behaviour of rammed earth under cyclic loading: Experimental testing and finite element modelling. Eng. Struct. 2016, 125, 144–152. [Google Scholar] [CrossRef]
  2. Shrestha, K.C.; Aoki, T.; Miyamoto, M.; Wangmo, P. In-plane shear resistance between the rammed earth blocks with simple interventions: Experimentation and finite element study. Buildings 2020, 10, 57. [Google Scholar] [CrossRef] [Green Version]
  3. Silva, R.A.; Mendes, N.; Oliveira, D.V.; Romanazzi, A.; Domínguez-Martínez, O.; Miranda, T. Evaluating the seismic behaviour of rammed earth buildings from Portugal: From simple tools to advanced approaches. Eng. Struct. 2018, 157, 144–156. [Google Scholar] [CrossRef]
  4. Gomes, M.I.; Gonçalves, T.D.; Faria, P. Unstabilized rammed earth: Characterization of material collected from old constructions in south portugal and comparison to normative requirements. Int. J. Archit. Herit. 2014, 8, 185–212. [Google Scholar] [CrossRef]
  5. Mateus, L.; Veiga, M.D.; de Brito, J. In situ characterization of rammed earth wall renders. Int. J. Archit. Herit. 2015, 9, 430–442. [Google Scholar] [CrossRef]
  6. Arslan, M.E.; Emiroğlu, M.; Yalama, A. Structural behavior of rammed earth walls under lateral cyclic loading: A comparative experimental study. Constr. Build. Mater. 2017, 133, 433–442. [Google Scholar] [CrossRef]
  7. Bui, Q.-B.; Hans, S.; Morel, J.-C.; Do, A.-P. First exploratory study on dynamic characteristics of rammed earth buildings. Eng. Struct. 2011, 33, 3690–3695. [Google Scholar] [CrossRef]
  8. Zhou, T.; Liu, B. Experimental study on the shaking table tests of a modern inner-reinforced rammed earth structure. Constr. Build. Mater. 2019, 203, 567–578. [Google Scholar] [CrossRef]
  9. Arrigoni, A.; Beckett, C.T.S.; Ciancio, D.; Pelosato, R.; Dotelli, G.; Grillet, A.C. Rammed Earth incorporating Recycled Concrete Aggregate: A sustainable, resistant and breathable construction solution. Resour. Conserv. Recycl. 2018, 137, 11–20. [Google Scholar] [CrossRef]
  10. Jaquin, P.A.; Augarde, C.; Gallipoli, D.; Toll, D.G. The strength of unstabilised rammed earth materials. Geotechnique 2009, 59, 487–490. [Google Scholar] [CrossRef] [Green Version]
  11. Lončar-Vicković, S.; Stober, D. Tradicijska Kuća Slavonije i Baranje; Ministarstvo turzima Republike Hrvatske, Sveučilište Josipa Jurja Strossmayera u Osijeku, Građevinski fakultet Osijek: Osijek, Croatia, 2011. Available online: https://mint.gov.hr/UserDocsImages//arhiva//150514_Slavonija_Baranja.pdf (accessed on 13 August 2021).
  12. Momin, S.; Lovon, H.; Silva, V.; Ferreira, T.M.; Vicente, R. Seismic Vulnerability Assessment of Portugese Adobe Buildings. Buildings 2021, 11, 200. [Google Scholar] [CrossRef]
  13. Aguilar, R.; Noel, M.F.; Ramos, L.F. Integration of reverse engineering and non-linear numerical analysis for the seismic assessment of historical adobe buildings. Autom. Constr. 2019, 98, 1–15. [Google Scholar] [CrossRef]
  14. Niroumand, H.; Zain, M.F.M.; Jamil, M. Various Types of Earth Buildings. Procedia Soc. Behav. Sci. 2013, 89, 226–230. [Google Scholar] [CrossRef] [Green Version]
  15. Vinceslas, T.; Hamard, E.; Razakamanantsoa, A.; Bendahmane, F. Further development of a laboratory procedure to assess the mechanical performance of cob. Environ. Geotech. 2016, 7, 200–207. [Google Scholar] [CrossRef]
  16. Hamard, E.; Cazacliu, B.; Razakamanantsoa, A.; Morel, J.-C. Cob, a vernacular earth construction process in the context of modern sustainable building. Build. Environ. 2016, 106, 103–119. [Google Scholar] [CrossRef]
  17. Mostafa, M.; Uddin, N. Effect of banana fibers on the compressive and flexural strength of compressed earth blocks. Buildings 2015, 5, 282–296. [Google Scholar] [CrossRef] [Green Version]
  18. Hema, C.; Messan, A.; Lawane, A.; Van Moeseke, G. Impact of the Design of Walls Made of Compressed Earth Blocks on the Thermal Comfort of Housing in Hot Climate. Buildings 2020, 10, 157. [Google Scholar] [CrossRef]
  19. Sassu, M.; Romanazzi, A.; Giresini, L.; Franco, W.; Ferraresi, C.; Quaglia, G.; Orefice, E. Production procedures and mechanical behaviour of interlocking stabilized compressed earth blocks (ISCEBs) manufactured using float ram 1.0 press. Eng. Solid Mech. 2018, 6, 89–104. [Google Scholar] [CrossRef]
  20. Bui, Q.-B.; Morel, J.-C.; Hans, S.; Walker, P. Effect of moisture content on the mechanical characteristics of rammed earth. Constr. Build. Mater. 2014, 54, 163–169. [Google Scholar] [CrossRef]
  21. Bui, T.-T.; Bui, Q.-B.; Limam, A.; Maximilien, S. Failure of rammed earth walls: From observations to quantifications. Constr. Build. Mater. 2014, 51, 295–302. [Google Scholar] [CrossRef] [Green Version]
  22. Narloch, P.; Woyciechowski, P. Assessing cement stabilized rammed earth durability in a humid continental climate. Buildings 2020, 10, 26. [Google Scholar] [CrossRef] [Green Version]
  23. Soudani, L.; Woloszyn, M.; Fabbri, A.; Morel, J.-C.; Grillet, A.C. Energy evaluation of rammed earth walls using long term in-situ measurements. Sol. Energy 2017, 141, 70–80. [Google Scholar] [CrossRef]
  24. Živković, Z. Hrvatsko Tradicijsko Graditeljstvo; Ministarstvo Kulture Uprava za Zaštitu Kulturne Baštine: Zagreb, Croatia, 2013. Available online: https://min-kulture.gov.hr/UserDocsImages//arhiva/Bastina//HTG_web.pdf (accessed on 13 August 2021).
  25. Gomes, M.I.; Lopes, M.; De Brito, J. Seismic resistance of earth construction in Portugal. Eng. Struct. 2011, 33, 932–941. [Google Scholar] [CrossRef]
  26. Miccoli, L.; Oliveira, D.V.; Silva, R.A.; Müller, U.; Schueremans, L. Static behaviour of rammed earth: Experimental testing and finite element modelling. Mater. Struct. Constr. 2015, 48, 3443–3456. [Google Scholar] [CrossRef]
  27. Fagone, M.; Loccarini, F.; Ranocchiai, G. Strength evaluation of jute fabric for the reinforcement of rammed earth structures. Compos. Part B Eng. 2017, 113, 1–13. [Google Scholar] [CrossRef]
  28. François, B.; Palazon, L.; Gerard, P. Structural behaviour of unstabilized rammed earth constructions submitted to hygroscopic conditions. Constr. Build. Mater. 2017, 155, 164–175. [Google Scholar] [CrossRef]
  29. Lin, H.; Zheng, S.; Lourenço, S.D.N.; Jaquin, P. Characterization of coarse soils derived from igneous rocks for rammed earth. Eng. Geol. 2017, 228, 137–145. [Google Scholar] [CrossRef]
  30. Knappett, J.A.; Craig, R.F. Craig’s Soil Mechanics, 8th ed.; CRC Press: Boca Raton, FL, USA, 2012. [Google Scholar]
  31. Bui, Q.-B.; Morel, J.-C. Assessing the anisotropy of rammed earth. Constr. Build. Mater. 2009, 23, 3005–3011. [Google Scholar] [CrossRef]
  32. Bui, Q.-B.; Morel, J.-C.; Hans, S.; Meunier, N. Compression behaviour of non-industrial materials in civil engineering by three scale experiments: The case of rammed earth. Mater. Struct. Constr. 2009, 42, 1101–1116. [Google Scholar] [CrossRef]
  33. Bui, Q.-B.; Morel, J.-C. First exploratory study on the ageing of rammed earth material. Materials 2015, 8, 1–15. [Google Scholar] [CrossRef] [Green Version]
  34. Arrigoni, A.; Grillet, A.C.; Pelosato, R.; Dotelli, G.; Beckett, C.T.S.; Woloszyn, M.; Ciancio, D. Reduction of rammed earth’s hygroscopic performance under stabilisation: An experimental investigation. Build. Environ. 2017, 115, 358–367. [Google Scholar] [CrossRef]
  35. Bui, Q.-B.; Morel, J.-C.; Reddy, B.V.; Ghayad, W. Durability of rammed earth walls exposed for 20 years to natural weathering. Build. Environ. 2009, 44, 912–919. [Google Scholar] [CrossRef]
  36. Ciancio, D.; Beckett, C.T.S.; Carraro, J.A.H. Optimum lime content identification for lime-stabilised rammed earth. Constr. Build. Mater. 2014, 53, 59–65. [Google Scholar] [CrossRef] [Green Version]
  37. Ciancio, D.; Gibbings, J. Experimental investigation on the compressive strength of cored and molded cement-stabilized rammed earth samples. Constr. Build. Mater. 2012, 28, 294–304. [Google Scholar] [CrossRef]
  38. Millogo, Y.; Aubert, J.-E.; Hamard, E.; Morel, J.-C. How Properties of Kenaf Fibers from Burkina Faso Contribute to the Reinforcement of Earth Blocks. Materials 2015, 8, 2332–2345. [Google Scholar] [CrossRef]
  39. El-Nabouch, R.; Bui, Q.-B.; Plé, O.; Perrotin, P. Characterizing the shear parameters of rammed earth material by using a full-scale direct shear box. Constr. Build. Mater. 2018, 171, 414–420. [Google Scholar] [CrossRef]
  40. El-Nabouch, R.; Bui, Q.-B.; Perrotin, P.; Plé, O. Shear parameters of rammed earth material: Results from different approaches. Adv. Mater. Sci. Eng. 2018, 2018, 8214604. [Google Scholar] [CrossRef] [Green Version]
  41. Silva, R.A.; Oliveira, D.V.; Miranda, T.; Cristelo, N.; Escobar, M.C.; Soares, E. Rammed earth construction with granitic residual soils: The case study of northern Portugal. Constr. Build. Mater. 2013, 47, 181–191. [Google Scholar] [CrossRef] [Green Version]
  42. Silva, R.A.; Oliveira, D.V.; Schueremans, L.; Miranda, T.; Machado, J. Effectiveness of the repair of unstabilised rammed earth with injection of mud grouts. Constr. Build. Mater. 2016, 127, 861–871. [Google Scholar] [CrossRef] [Green Version]
  43. Silva, R.A.; Domínguez-Martínez, O.; Oliveira, D.V.; Pereira, E.B. Comparison of the performance of hydraulic lime- and clay-based grouts in the repair of rammed earth. Constr. Build. Mater. 2018, 193, 384–394. [Google Scholar] [CrossRef]
  44. Serrano, S.; Rincón, L.; González, B.; Navarro, A.; Bosch, M.; Cabeza, L.F. Rammed earth walls in Mediterranean climate: Material characterization and thermal behaviour. Int. J. Low Carbon Technol. 2017, 12, 281–288. [Google Scholar] [CrossRef] [Green Version]
  45. Tinsley, J.; Pavía, S. Thermal performance and fitness of glacial till for rammed earth construction. J. Build. Eng. 2019, 24, 1–8. [Google Scholar] [CrossRef]
  46. Xu, L.; Wong, K.K.; Fabbri, A.; Champiré, F.; Branque, D. Loading-unloading shear behavior of rammed earth upon varying clay content and relative humidity conditions. Soils Found. 2018, 58, 1001–1015. [Google Scholar] [CrossRef]
  47. Ávila, F.; Puertas, E.; Gallego, R. Characterization of the mechanical and physical properties of unstabilized rammed earth: A review. Constr. Build. Mater. 2021, 270, 1–12. [Google Scholar] [CrossRef]
  48. Millogo, Y.; Morel, J.-C.; Aubert, J.-E.; Ghavami, K. Experimental analysis of Pressed Adobe Blocks reinforced with Hibiscus cannabinus fibers. Constr. Build. Mater. 2014, 52, 71–78. [Google Scholar] [CrossRef]
  49. Araki, H.; Koseki, J.; Sato, T. Tensile strength of compacted rammed earth materials. Soils Found. 2016, 56, 189–204. [Google Scholar] [CrossRef]
  50. Pakand, M.; Toufigh, V. A multi-criteria study on rammed earth for low carbon buildings using a novel ANP-GA approach. Energy Build. 2017, 150, 466–476. [Google Scholar] [CrossRef]
  51. Maniatidis, V.; Walker, P. Structural capacity of rammed earth in compression. J. Mater. Civ. Eng. 2008, 20, 230–238. [Google Scholar] [CrossRef]
  52. Mužíková, B.; Plaček Otcovská, T.; Padevět, P. Modulus of Elascity of Unfired Rammed Earth. Acta Polytech. CTU Proc. 2018, 15, 63–68. [Google Scholar] [CrossRef]
  53. Wangmo, P.; Shrestha, K.C.; Miyamoto, M.; Aoki, T. Assessment of out-of-plane behavior of rammed earth walls by pull-down tests. Int. J. Archit. Herit. 2019, 13, 273–287. [Google Scholar] [CrossRef]
  54. Miccoli, L.; Müller, U.; Pospíšil, S. Rammed earth walls strengthened with polyester fabric strips: Experimental analysis under in-plane cyclic loading. Constr. Build. Mater. 2017, 149, 29–36. [Google Scholar] [CrossRef]
  55. Bui, Q.-B.; Limam, A.; Bui, T.-T. Dynamic discrete element modelling for seismic assessment of rammed earth walls. Eng. Struct. 2018, 175, 690–699. [Google Scholar] [CrossRef]
  56. Lilley, D.M.; Robinson, J. Ultimate strength of rammed earth walls with openings. Proc. Inst. Civ. Eng. Struct. Build. 1995, 110, 278–287. [Google Scholar] [CrossRef]
  57. El-Nabouch, R.; Bui, Q.-B.; Plé, O.; Perrotin, P.; Poinard, C.; Goldin, T.; Plassiard, J.P. Seismic Assessment of Rammed Earth Walls Using Pushover Tests. Procedia Eng. 2016, 145, 1185–1192. [Google Scholar] [CrossRef] [Green Version]
  58. Schroeder, H. Moisture transfer and change in strength during the construction of earthen buildings. Inf. Constr. 2011, 63, 107–116. [Google Scholar] [CrossRef]
  59. Toufigh, V.; Kianfar, E. The effects of stabilizers on the thermal and the mechanical properties of rammed earth at various humidities and their environmental impacts. Constr. Build. Mater. 2019, 200, 616–629. [Google Scholar] [CrossRef]
  60. Arrigoni, A.; Pelosato, R.; Dotelli, G.; Beckett, C.T.S.; Ciancio, D. Weathering’s beneficial effect on waste-stabilised rammed earth: A chemical and microstructural investigation. Constr. Build. Mater. 2017, 140, 157–166. [Google Scholar] [CrossRef] [Green Version]
  61. Hall, M.; Djerbib, Y. Rammed earth sample production: Context, recommendations and consistency. Constr. Build. Mater. 2004, 18, 281–286. [Google Scholar] [CrossRef]
  62. Kosarimovahhed, M.; Toufigh, V. Sustainable usage of waste materials as stabilizer in rammed earth structures. J. Clean Prod. 2020, 277, 1–10. [Google Scholar] [CrossRef]
  63. Silva, R.A.; Oliveira, D.V.; Schueremans, L.; Lourenço, P.B.; Miranda, T. Modelling the Structural Behaviour of Rammed Earth Components. In Civil-Comp Proceedings; Civil-Comp Press: Stirlingshire, UK, 2014. [Google Scholar]
  64. Tripura, D.D.; Singh, K.D. Characteristic Properties of Cement-Stabilized Rammed Earth Blocks. J. Mater. Civ. Eng. 2015, 27, 1–8. [Google Scholar] [CrossRef]
  65. Ciancio, D.; Augarde, C. Capacity of unreinforced rammed earth walls subject to lateral wind force: Elastic analysis versus ultimate strength analysis. Mater. Struct. Constr. 2013, 46, 1569–1585. [Google Scholar] [CrossRef] [Green Version]
  66. Tomičić, I. Betonske Konstrukcije; Društvo hrvatskih građevinskih inženjera: Zagreb, Croatia, 1996. [Google Scholar]
  67. El Nabouch, R. Mechanical Behavior of Rammed Earth Walls under Pushover Tests/Comportement Mécanique des Murs en Pisé. Ph.D. Thesis, Université Grenoble Alpes, Grenoble, France, 2017. [Google Scholar]
  68. El-Nabouch, R.; Bui, Q.-B.; Plé, O.; Perrotin, P. Assessing the in-plane seismic performance of rammed earth walls by using horizontal loading tests. Eng. Struct. 2017, 145, 153–161. [Google Scholar] [CrossRef]
  69. Miccoli, L.; Müller, U.; Fontana, P. Mechanical behaviour of earthen materials: A comparison between earth block masonry, rammed earth and cob. Constr. Build. Mater. 2014, 61, 327–339. [Google Scholar] [CrossRef]
  70. Koutous, A.; Hilali, E. Reinforcing rammed earth with plant fibers: A case study. Case Stud. Constr. Mater. 2021, 14, 1–15. [Google Scholar]
  71. Liu, Q.; Tong, L. Engineering properties of unstabilized rammed earth with different clay contents. J. Wuhan Univ. Technol. Mater. Sci. Ed. 2017, 32, 914–920. [Google Scholar] [CrossRef]
  72. Lombillo, I.; Villegas, L.; Fodde, E.; Thomas, C. In situ mechanical investigation of rammed earth: Calibration of minor destructive testing. Constr. Build. Mater. 2014, 51, 451–460. [Google Scholar] [CrossRef]
  73. Porter, H.; Blake, J.; Dhami, N.K.; Mukherjee, A. Rammed earth blocks with improved multifunctional performance. Cem. Concr. Compos. 2018, 92, 36–46. [Google Scholar] [CrossRef]
  74. Silva, R.A.; Oliveira, D.V.; Miccoli, L.; Schueremans, L. Modelling of Rammed Earth Under Shear Loading. In Proceedings of the SAHC 2014—9th International Conference on Structural Analysis of Historicak Constructions, Mexico City, Mexico, 14–17 October 2014. [Google Scholar]
  75. Wang, Y.; Wang, M.; Liu, K.; Pan, W.; Yang, X. Shaking table tests on seismic retrofitting of rammed-earth structures. Bull. Earthq. Eng. 2017, 15, 1037–1055. [Google Scholar] [CrossRef]
  76. Yamin, L.E.; Phillips, C.A.; Reyes, J.C.; Ruiz, D.M. Seismic behaviour and rehabilitation alternatives for adobe and rammed earth buildings. In Proceedings of the 13th World Conference on Earthquake Engineering, Vancouver, BC, Canada, 1–6 August 2004; pp. 1–10. [Google Scholar]
  77. Bui, Q.-B.; Bui, T.-T.; Limam, A. Assessing the seismic performance of rammed earth walls by using discrete elements. Cogent. Eng. 2016, 3, 1–12. [Google Scholar] [CrossRef]
  78. Bernat-Maso, E.; Gil, L.; Escrig, C. Textile-reinforced rammed earth: Experimental characterisation of flexural strength and thoughness. Constr. Build. Mater. 2016, 106, 470–479. [Google Scholar] [CrossRef]
  79. Otcovska, T.; Padevět, P. Dependence of Tensile Bending Strength of Rammed Earth on Used Clay Composition and Amount of Mixture Water. Adv. Mater. Res. 2017, 1144, 48–53. [Google Scholar] [CrossRef]
  80. Namikawa, T.; Koseki, J. Evaluation of tensile strength of cement-treated sand based on several types of laboratory tests. Soils Found. 2007, 47, 657–674. [Google Scholar] [CrossRef] [Green Version]
  81. Ruiz, D.; López, C.; Unigarro, S.; Domínguez, M. Seismic Rehabilitation of Sixteenth- and Seventeenth-Century Rammed Earth-Built Churches in the Andean Highlands: Field and Laboratory Study. J. Perform. Constr. Facil. 2015, 29, 1–17. [Google Scholar] [CrossRef]
  82. Corbin, A.; Augarde, C. Investigation into the shear behaviour of rammed earth using shear box tests. In Proceedings of the First International Conference on Bio-Based Building Materials, Clermont-Ferrand, France, 22–24 June 2015; pp. 93–98. [Google Scholar]
  83. Cheah, J.S.J.; Walker, P.; Heath, A.; Morgan, T.K.K.B. Evaluating shear test methods for stabilised rammed earth. Proc. Inst. Civ. Eng. Constr. Mater. 2012, 165, 325–334. [Google Scholar] [CrossRef] [Green Version]
  84. Nowamooz, H.; Chazallon, C. Finite element modelling of a rammed earth wall. Constr. Build. Mater. 2011, 25, 2112–2121. [Google Scholar] [CrossRef]
  85. Bui, Q.-B.; Bui, T.-T.; Limam, A.; Morel, J.-C. Discrete element modeling of rammed earth wall. In Rammed Earth Construction, Proceedings of the 1st International Conference on Rammed Earth Construction, ICREC 2015, Perth, Australia, 11–13 February 2015; CRC Press: Boca Raton, FL, USA, 2015; pp. 57–61. [Google Scholar]
  86. Reyes, J.C.; Yamin, L.E.; Hassan, W.M.; Sandoval, J.D.; Gonzalez, C.D.; Galvis, F.A. Shear behavior of adobe and rammed earth walls of heritage structures. Eng. Struct. 2018, 174, 526–537. [Google Scholar] [CrossRef]
  87. Sorić, Z.; Kišiček, T. Betonske Konstrukcije 1; Građevinski fakultet: Zagreb, Croatia, 2014. [Google Scholar]
Figure 1. PSD for soils and soil mixtures used in RE structures in: (a) Australia: A1—A3 [34], A4 [36]; A5—A7 [37]; (b) France: F2 [31], F1 [34], F5—F7 [35], F3 [40], F8—F10 [46], F4 [48]; and (c) Portugal: P1—P6 [4], P7—P10 [41], P11 [42], P12 [43].
Buildings 11 00367 g001
Figure 2. UCS value depending on (a) moisture: W1 [1], W2 [20], W3 [21], W4 [26,54], W5 [39], W6 [55], W7 [56], W8 [57], W9 [58], W10 [59]; and (b) dry density: D1 [20], D2 [21], D3 [49], D4 [51], D5 [56], D6 [58], D7 [60], D8 [61], D9 [62], D10 [63], D11 [64].
Buildings 11 00367 g002
Figure 3. Average value of UCS with respect to the age of the specimen at the time of testing.
Buildings 11 00367 g003
Figure 4. The relationship between UCS and modulus of elasticity: E1 [1], E2 [2], E3 [3], E4 [8], E5 [20], E6 [21], E7 [25], E8 [26,54], E9 [41], E10 [51], E11 [52], E12 [53], E13 [55], E14 [59], E15 [62], E16 [63], E17 [69], E18 [70], E19 [71], E20 [72], E21 [68], E22 [73], E23 [74], E24 [75], E25 [76], E26 [77].
Buildings 11 00367 g004
Figure 5. The relationship between UCS and tensile strength: T1 [2], T2 [21], T3 [25], T4 [49], T5 [52], T6 [53], T7 [55], T8 [59], T9 [63], T10 [70], T11 [71].
Buildings 11 00367 g005
Table 1. PSD for RE-suitable soils and soil mixtures.
Study ByCountryTypeClay (%)Silt (%)Sand (%)Gravel (%)
[2]BhutanNatural20.217.948.113.8
[4]PortugalNatural26.520.523.030.0
9.012.070.09.0
16.023.033.727.3
10.017.347.725.0
12.522.826.837.9
17.530.711.039.5
[6]TurkeyMan-made47.51.65.944.3
[10]UK and IrelandMan-made10.015.154.416.3
[29]Hong KongNatural211.579.07.5
1040.748.80.5
410.866.219.0
[31,32]FranceNatural3.531.049.513.3
[33]FranceNatural8.227.947.413.3
[34]AustraliaMan-made20.08.359.811.9
18.715.355.110.9
16.325.149.49.2
FranceNatural19.964.515.00.8
[35]FranceNatural16.049.534.50
Man-made06.660.526.6
[36]AustraliaMan-madeN/AN/A60.010.0
[37]AustraliaNatural0050.050.0
0075.568.0
0024.532.0
[38]FranceNatural23.561.714.70.1
[39,40]FranceNatural19.964.615.50
[41]PortugalNatural5.613.745.835.0
5.215.358.521.0
4.513.858.823.0
11.512.452.623.5
[42]PortugalMan-made14.215.632.637.7
[43]PortugalMan-made7.427.744.920.0
[44]SpainNatural0076.024.0
0080.020.0
[45]UK and IrelandNatural23.026.829.720.5
[46]FranceNatural34.34.024.80
17.418.664.00
26.330.043.80
Average valueNatural13.224.443.119.9
Min (non-zero)2.04.011.00.1
Max34.364.679.068.0
Average valueMan-made14–311.651.922.4
Min (non-zero)7.41.65.99.2
Max47.532.590.050.0
Table 2. UCS of concrete depending on dimensions and shape of the specimen.
Specimen Dimensions (mm)The Ratio of UCS of 150 mm Cube to
Specimen of Different Dimensions
Cube
a/a/a
1000.95
1501.00
2001.05
3001.14
Cylinder
d/h
100/2001.23
150/3001.26
200/4001.33
100/1001.07
150/1501.10
200/2001.16
Note: a is the cube side length; d is the specimen diameter; h is the height of specimen.
Table 3. UCS values obtained at different age, along with description of methods, specimens, and norms employed.
Study ByMethodSpecimen:
h/w/t (mm);
d/h (mm)
No. of Specimens Tested per MixtureUCS (MPa)Age (Days)Norm
[1,69]UCT500/500/110N/A3.7328DIN 18945
[2]CT92 to 96/163 to 200N/A0.53 *30ASTM C39/C39M-17b
[3]UCT150/230N/A1.0032N/A
[8]CT800/300/30041.24 *90GB/T 50129-2011
[21]CST160/30031.90 *N/AN/A
[26,54]AXCT500/500/11053.74 *N/AN/A
[39]UCT500/250/25031.10 *N/AN/A
[41]CT100/200N/A0.38 *27–35N/A
[50]UCT75/15031.77 *28ASTM D2166/D2166M-16
[51]UCT100/200N/A2.4628N/A
300/6001.9028–42
600/300/3000.81 *28–42
[52]CT100/20/20N/A2.03 *28N/A
[53]CST92/180N/A0.68 *120ASTM C39
[56]CT150/150/150N/A0.671BS 1881–108:1983
2.047
1.9028
[58]CT200/200/20030.42 *7N/A
31.38 *28
32.31 *90
[59]UCT75/150102.23 *28N/A
[60]UCT100/20031.40 *28N/A
[61]UCT100/100/100161.16 *28NZS 4298:1998
[62]UCT75/15051.85 *90ASTM D2166/D2166M
[63]AXCT100/20061.26 *27–35N/A
[64]CT100/100/10061.10 *38IS 4332 Part 5
[70]UCT100/20052.03 *28NF EN 12390-4
[71]UCT39/80N/A1.04 *28ASTM D 2166
[72]CT150/NA83.18 *N/AN/A
DFJ1130/2100/380N/A3.10
MPT1130/2100/380N/A4.15 *
[68]UCT200/40032.00 *60N/A
500/250/25051.15 *
[73]UXCT150/150/15060.60 *26Bulletin 5: Earth wall
construction
[74]AXCT505/499/11753.70 *N/AN/A
[75]CT600/600/60031.36 *N/AN/A
Average value 1.72
Min 0.38
Max 4.15
Note: d is the specimen diameter; h is the height of the specimen; t is the thickness of the specimen; w is the width of the specimen; AXCT is the axial compression test; CST is the compressive strength test; CT is the compression test; DFJ is the double flat-jack test; MPT is the mini-pressuremeter test; UCT is the unconfined compression test; UXCT is the uniaxial compression test; * average value.
Table 4. Modulus of elasticity (E) values obtained at different age, along with description of methods, specimens, and norms employed.
Study ByMethodSpecimen:
h/w/t (mm);
d/h (mm)
No. of Specimens Tested per MixtureE (MPa)Age (Days)Norm
[1,69]UCT + LVDTs + ARAMIS500/500/110N/A414328DIN 1408-5
[2]Derived from CT resultsFrom σ-ε plotN/A63.36 *30N/A
[3]UCT (5–30% UCS)From σ-ε plotN/A6732N/A
UST2750–3600/7200/600462.2032BS 1881-203-Part 203
[8]Linear regression below 0.8σmaxFrom σ-ε plot124390N/A
[20]UCT (0–20% UCS)From σ-ε plotN/A569.05 *N/AN/A
[21]CT + extensometers + LVDTs160/3003500 *N/AN/A
[26,54]AXCT + LVDTsFrom σ-ε plot54206.80 *N/AN/A
[41]Linear fitting σ-ε curve (5–30% UCS)From σ-ε plotN/A118.18 *27–35N/A
[51]Derived from UXCT (from σ-ε plot)100/200N/A16028N/A
600/300/30065 *28–42
[52]Derived from CT resultsFrom σ-ε plotN/A54.61 *28N/A
[53]Derived from CT resultsN/AN/A72.92 *120ASTM C39
[59]Derived from UCT results + LVDTsFrom σ-ε plot10143 *28N/A
UST75/150N/A242628ASTM C5697
[62]Calculated according to normEstimated534 *90ASTM C469/C469M-14
[63]Derived from AXCT resultsFrom σ-ε plot61034 *27–35N/A
[70]Derived from UCT resultsFrom σ-ε plot5340 *28N/A
[71]UCT61.8/125N/A102.68 *28N/A
[72]Derived from
CT results
N/A8359.03 *N/AN/A
Derived from DFJ resultsFrom σ-ε plotN/A3170.66
PTFrom σ-ε plotN/A1394
MPTEstimatedN/A45.90 *
[68]DIC200/4003763 *60N/A
500/250/2505365 *
[73]Derived from UXCT resultsFrom σ-ε plot64026N/A
[74]Derived from AXCT resultsFrom σ-ε plot54207 *N/AN/A
[75]Derived from
CT results
N/A357 *N/AN/A
Average value 900.23
Min 34
Max 4207
Note: d is the specimen diameter; h is the height of the specimen; t is the thickness of the specimen; w is the width of the specimen; σ-ε is stress-strain; σmax is maximum stress; AXCT is the axial compression test; CT is the compression test; DFJ is the double flat-jack test; DIC is digital image correlation; MPT is the mini-pressuremeter test; PT is potentiometric transducers; UCT is the unconfined compression test; UST is ultrasonic test; UXCT is the uniaxial compression test; * average value.
Table 5. Tensile strength values obtained at different age, with description of methods, specimens, and norms employed.
Study ByTypeMethodSpecimen:
h/w/t (mm);
d/h (mm)
No. of Specimens Tested per Mixtureft (MPa)Age (Days)Norm
[2]REST92 to 96/163 to 200N/A0.09 *30ASTM C496/C496–17
[21]REST160/30030.20 *N/AN/A
[49]REDT50 (middle 45)/140190.24 *28N/A
ST50/50230.30 *28JGS 2551-2009
[53]REST92/180N/A0.08 *120ASTM C496
[59]REST75/150100.24 *28N/A
[70]REST100/20050.40 *28NF EN 12390-6
[71]REST39/80N/A0.22 *28ASTM D 2166
[42]SRE3P150/600/150--42N/A
[65]SREST150/300--28AS 1012.10
4P100/400/10028
150/400/150
3P50/200/50-28
[78]SRE3P100/350/100--N/AJSCE-SF4
[79]SRE3P40/160/40--N/AN/A
Average value 0.22
Min 0.08
Max 0.40
Note: d is the specimen diameter; h is the height of the specimen; t is the thickness of the specimen; w is the width of the specimen; 3P is the three-point bending test; 4P is the four-point bending test; DT is the direct tension; ST is the splitting tensile test; * average value.
Table 6. Shear strength values obtained at different age, along with description of methods, specimens, and norms employed.
Study ByMethodSpecimen:
h/w/t (mm)
No. of Specimens Tested per Mixturefs (MPa)Age (Days)Norm
[1,26,54,69]DCT500/500/11050.71 *N/AASTM E 519-10
[21]MCN/AN/A0.18N/AN/A
[41]DCT550/550/200N/AN/A46ASTM E 519
[63]DCT550/550/200110.15 *84ASTM E 519-02
[74]DCT505/499/11750.70 *N/AASTM E 519-10
[82]DST60/60/2062.20 *7BS EN 1377-7:1990
Average value 0.79
Min 0.15
Max 2.20
Note: h is the height of the specimen; t is the thickness of the specimen; w is the width of the specimen; DCT is the diagonal compression test; DST is the direct shear test; MC is the Mohr–Coulomb criterion; * average value.
Table 7. Cohesion and friction angle values of the RE layer (LAY) and interface (IF) obtained at different age, with description of methods, specimens, and norms employed.
Study ByTypeMethodSpecimen:
h/w/t (mm);
d/h (mm)
No. of Specimens Tested per Mixturec (kPa)φ (°)Age (Days)Norm
[21]LAYMCN/AN/A170.051.0N/A-
[40]LAYDST35/100/100N/A214.0 *44.3 *60NF P 94-071-1
450/500/50031.037.360NF P 94-071-1
[58]LAYCThourglass-shaped specimensN/A9.81N/AN/ADIN V 18952
[82]LAYDST20/60/606118.0 *54.1 *7BS EN 1377-7:1990
[84]LAYDMT76.2/147.2N/A134.041.0N/AN/A
[40]IFDST450/500/500N/A24.034.860N/A
[62]IFDST150/150/180350.0 *65.0 *90ASTM D3080/D3080M, ASTM D5321
Average valueLAY 112.845.5
Min 9.837.3
Max 214.054.1
Average valueIF 3749.9
Min 24.034.8
Max 50.065.0
Note: d is the specimen diameter; h is the height of the specimen; t is the thickness of the specimen; w is the width of the specimen; CT is the cohesion test; DMT is the drained monotonic triaxial test; DST is the direct shear test; MC is the Mohr–Coulomb criterion; * average value.
Table 8. Specimen geometry, loading methods, and maximum load attained by country and study observed.
Study BySpecimenTypeNo. of SpecimenGeometry
h/w/t (m)
σv (MPa)Testing MethodDir. of LoadingΔu (%)Fmax (kN)
[1,54]Solid wallScaled31.30/1.05/0.250.56CSCTIn-plane0.13–0.1459–78
[2]Solid wallReal11.20/1.20/0.600STIn-plane0.08 *13.5
[6]Solid wallScaled11.50/1.50/0.200LRCLIn-plane0.15 *52–54
[8]BuildingScaled21.50/2.15/0.20N/ATBLX and Y directionN/AN/A
1.50/2.45/0.20N/A
[21]Solid wallScaled11.00/1.00/0.30MIVCILIn-planeN/A112
[32]Solid wallReal32.30/varies/0.50
(L shaped)
0DMN/AN/AN/A
[53]Solid wallReal12.87/5.53/0.600PDOut-of-plane0.1730
[57,68]Solid wallScaled21.50/1.50/0.250.10, 0.20, 0.30PMIn-plane0.20 *40–42
Scaled21.00/1.50/0.250.35 *36–52
[75]BuildingReal12.10/2.60/0.40N/ATBLX and Y directionN/AN/A
2.10/2.40/0.40N/A
[86]Solid wallReal31.80/2.50/0.400.018, 0.048, 0.067LRCLIn-plane0.08–0.2517–33
Wall with openingsReal13.45/7.00/0.600.010LRCLIn-plane0.0859–76
Note: h is the height of the specimen; t is the thickness of the specimen; w is the width of the specimen; Δu is the inter-storey drift; σv is the vertical compressive stress at the top of the specimen; Fmax is the maximum load attained during testing; CSCT is the cyclic shear-compression test; DM is the dynamic measurements; LRCL is the lateral reversed cyclic loading; MI is monotonically increasing; PD is the pull-down test; PM is the pushover method; VCIL is the vertical concentrated increasing load; ST is the shear test; TBL is the shaking table.
Table 9. Specimen geometry, preparation, and time of curing by country and study observed.
Study BySpecimenTypeScaleType of FormworkCompaction Methoddlay,0 (m)dlay (m)tcur (Days)Country
[1,54]WallScaledN/APlywoodMechanically compacted with a rammer0.150.10ca. 60Germany
[2]WallReal1:1Wooden planksManual ramming0.240.12ca. 30Bhutan
0.120.06
[6]WallScaledN/AN/APneumatic rammerN/A0.15–0.2030Turkey
[8]BuildingScaled1:2N/AN/AN/A7.5ca. 90China
[21]WallScaledN/AN/AN/AN/A0.15148 to 155France
[32]WallReal1:1MetalPneumatic rammerN/AN/A3 to 53France
[53]Solid wallReal1:1Shutter planksManual ramming0.240.12ca. 120Bhutan
[57,68]WallScaled1:2SteelPneumatic rammerN/AN/Aca. 60France
[75]BuildingReal1:1N/AN/AN/AN/AN/AChina
[86]Solid wallReal1:1WoodManual rammingN/AN/AN/AColumbia
Wall with openingsReal1:1
Note: ca. stands for circa (around); dlay is the layer thickness after ramming; dlay,0 is the layer thickness before ramming; and tcur is the time of curing.
Publisher’s Note: MDPI stays neutral with regard to jurisdictional claims in published maps and institutional affiliations.

