Article

Volume Stability of Cement Paste Containing Limestone Fines

Faculty of Engineering, Beirut Arab University, Beirut P.O. Box 11-5020, Lebanon
*
Author to whom correspondence should be addressed.
Buildings 2021, 11(8), 366; https://doi.org/10.3390/buildings11080366
Submission received: 28 July 2021 / Revised: 12 August 2021 / Accepted: 17 August 2021 / Published: 19 August 2021

Abstract

:
The common cause of cracking in cement paste is shrinkage due to different reasons, such as loss of water and chemical reactions. Incorporating limestone fines (LF) as a cement replacement can affect the shrinkage of the paste. To examine this effect, five paste mixes were prepared with 0, 5, 10, 15 and 20% LF as a cement replacement and with a water-to-binder ratio (w/b) of 0.45. Four volume stability tests were conducted for each paste: chemical, autogenous and drying shrinkage and expansion. Chemical shrinkage was tested each hour for the first 24 h and thereafter every 2 days for a total period of 90 days. The drying shrinkage, autogenous shrinkage and expansion were monitored every 2 days until 90 days. The results showed that replacing 15% LF enhanced the chemical shrinkage of the paste. However, autogenous shrinkage of the paste was found to increase between 0 and 10% LF and decline sharply at 15 and 20% LF. Drying shrinkage was found to increase with the increase in LF content. Expansion exhibited little variation between 0 and 10% LF and an increase for replacement above 15% LF. These results are discussed in terms of the formation of hydration products and self-desiccation due to hydration.

1. Introduction

Concrete’s tendency to crack is historically recognized as inevitable. Therefore, most current concrete buildings tend to be affected by the formation of cracks. In order to reduce cracking and improve building materials, the concrete shrinkage during construction needs to be controlled, as this will have an impact on the concrete’s durability. There are different types of shrinkage responsible for these cracks such as chemical, autogenous and drying shrinkage. Drying shrinkage is defined as the contracting of a hardened concrete caused by the removal of free water from the concrete, which is caused by the changes in relative humidity and temperature [1]. This can be controlled by using concrete with a lower w/c ratio or by adding supplementary cementitious materials (SCMs) that lead to its reduction [2]. Chemical shrinkage is well-defined as the internal volume change of cement paste resulting from the hydration of cementitious materials [3]. This is affected by the temperature and cement composition. Traditionally, chemical shrinkage was tested by three main measurement methods such as dilatometry, pycnometry and gravimetry. Many authors prefer using the dilatometry method to monitor chemical shrinkage [4,5,6,7,8,9,10,11,12,13,14]. The dilatometry method is based on measuring a drop of water in a hydrating cement paste through a graduated pipette [15]. Autogenous shrinkage is the macroscopic reduction in the external dimensions of cement particles during curing without any loss of moisture that occurs simultaneously with chemical shrinkage [16]. The cement content and temperature are the major factors affecting this type of shrinkage. These are controlled by the change in internal curing of the system due to self-dehydration at lower water-to-cement ratios (w/c < 0.4) [17]. Expansion of concrete occurs if exposed to water or an excessive amount of moisture. The hydration process is liable for water withdrawal from the capillary pores that are present within the concrete. Through the first hours of hydration, the capillary activities can be considered negligible. Therefore, the autogenous shrinkage is mainly corresponding to the chemical shrinkage [18]. The phenomenon of water withdrawal from the capillary pores to bring out the hydration is called “self-desiccation”. When specimens are cured in water, they show continuous expansion with time, even though the total system volume continues to decline [9,19].
Limestone is a hard sedimentary rock with multiple uses consisting of calcium carbonate (CaCO3). It is mostly crushed and used as a construction material. Some contractors throughout a wide range of industries are interested in gathering up crushed limestone to complete their projects. Its main applications are in concrete, road base, railroad ballast, driveways and pipe bedding because of its strength, practicality and durability [20]. Many authors examined the effect of LF as a cement or aggregate replacement on concrete shrinkage. It was found that incorporating LF as a cement replacement affected the drying shrinkage of the concrete [21,22,23,24]. Aquino et al. [25] proved that integrating LF as a fines aggregate replacement could decrease the drying shrinkage in concrete. Another study conducted by Valcuende et al. [26] showed that the drying shrinkage increased as the LF content increased. Chemical shrinkage is also considered a point of controversy among researchers. The presence of limestone filler produced an acceleration of chemical shrinkage and the hydration process in the early ages. This filler acts as the nucleation sites for hydrates [27]. In addition to that, combining 5% LF increased the chemical shrinkage [28]. On the other side, Wang et al. [29] proved that incorporating LF reduced the chemical shrinkage. The inclusion of LF will definitely reduce the cement content and lead to a rise in the W/C ratio. Therefore, the internal humidity of concrete increases, which results in reducing the concrete shrinkage. Adding a small content of LF as a cement replacement improves the degree of hydration and reinforces the hydration of concrete. Hence, adding LF enhances the autogenous shrinkage [30]. However, Bentz et al. [31] proved that adding 10% LF with a particle size of 16 µm as a cement replacement diminished the autogenous shrinkage of the concrete.
According to the premises mentioned above, there is a substantial amount of research on chemical, autogenous and drying shrinkage and expansion of concrete and paste containing SCM [32,33,34,35,36,37,38,39,40,41,42,43] and some on chemical shrinkage [44,45]. However, there is hardly any research to compare the chemical shrinkage of paste with other types of shrinkage such as autogenous shrinkage, drying shrinkage and expansion. In addition, cement manufacturing contributes about 7% of global CO2 emissions [23]. Therefore, partial replacement of cement with LF will reduce such emissions and contribute toward sustainable development. Therefore, the aim of this paper is to examine the volume stability of pastes containing LF. Volume stability includes chemical, autogenous and drying shrinkage as well as expansion.

2. Materials and Methods
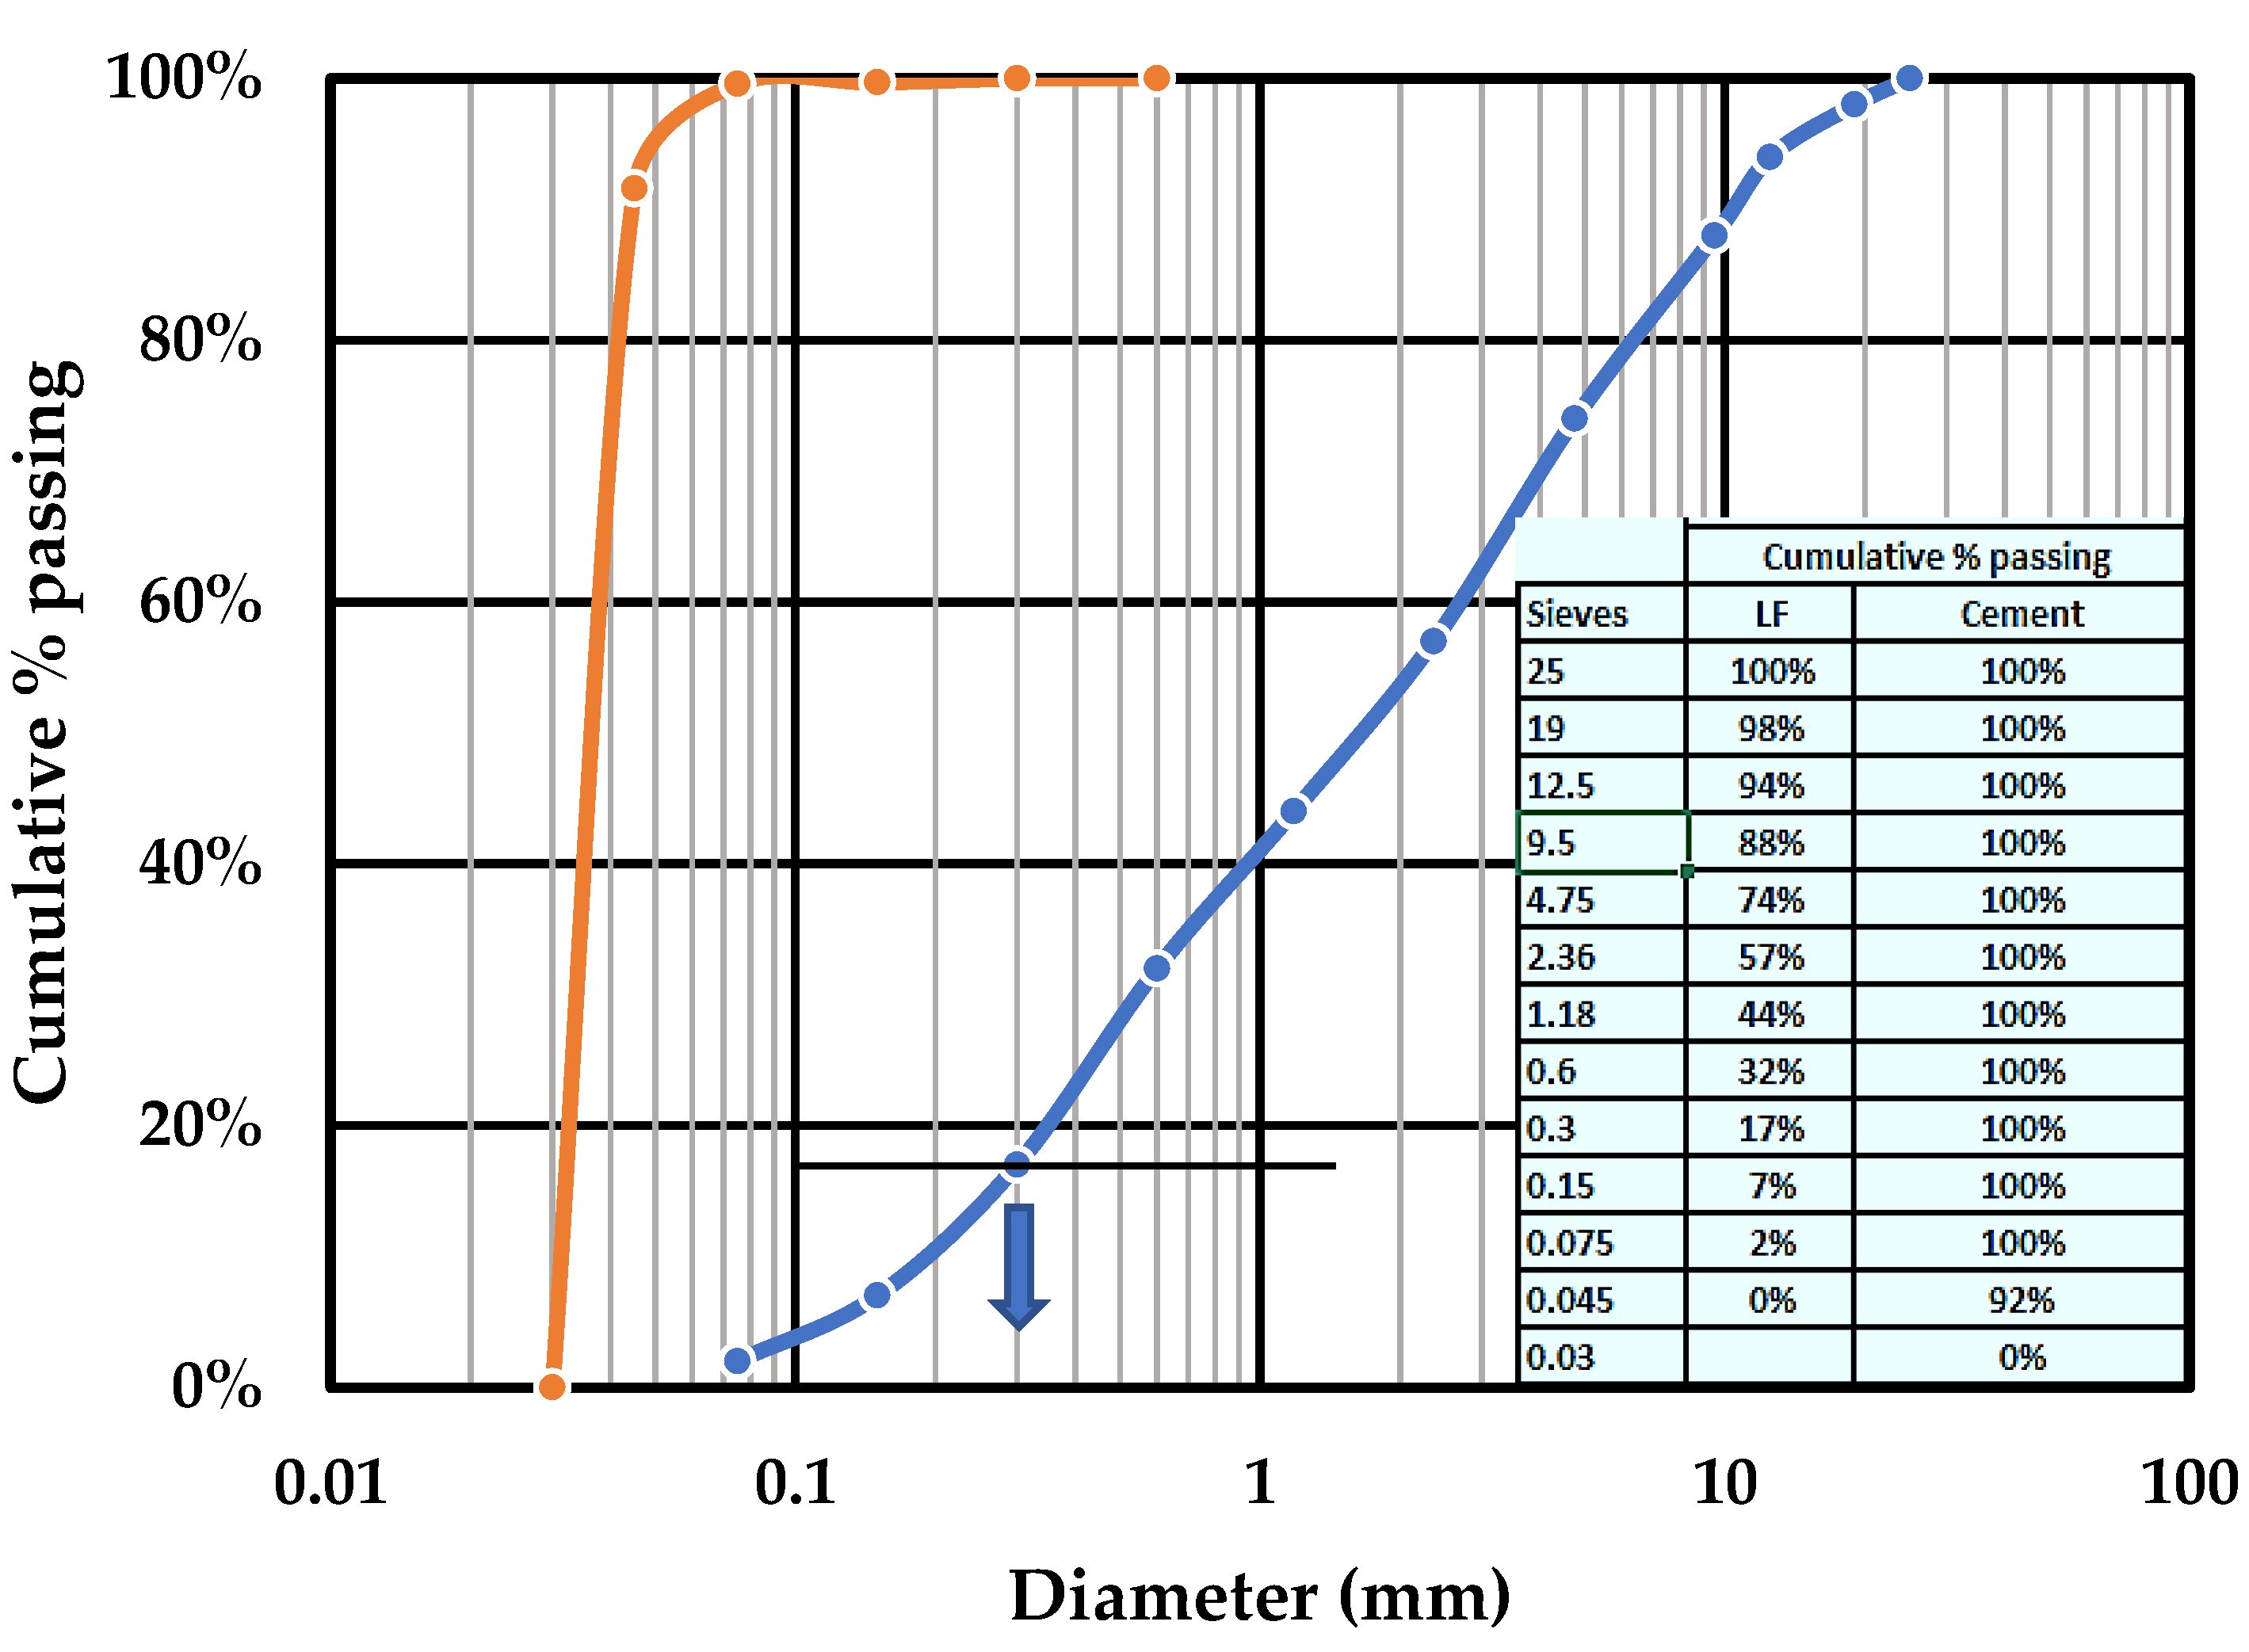
2.1. Materials

Portland cement PA-L 42.5 N type I was used in this study. This type of cement contained 0.5% free limestone. The incorporated raw limestone was extracted from Lebanon quarries. This limestone was first ground and then sieved until reaching a fines particle size below 300 µm. The particle size distributions of the limestone and cement are illustrated in Figure 1. The limestone density was 2.7 g/cm3. The chemical properties for the cement and limestone are shown in Table 1. The physical properties of the cement are presented in Table 2.

2.2. Mix Proportions

During this experiment, LF with 5 replacement levels of cement (0, 5, 10, 15 and 20%) were incorporated in paste specimens with a w/b ratio of 0.45. Five paste mixes were employed. The total number of specimens tested was 40, with 10 specimens for each type of shrinkage (chemical, autogenous and drying shrinkage and expansion). The details of the paste mix ratio are presented in Table 3.

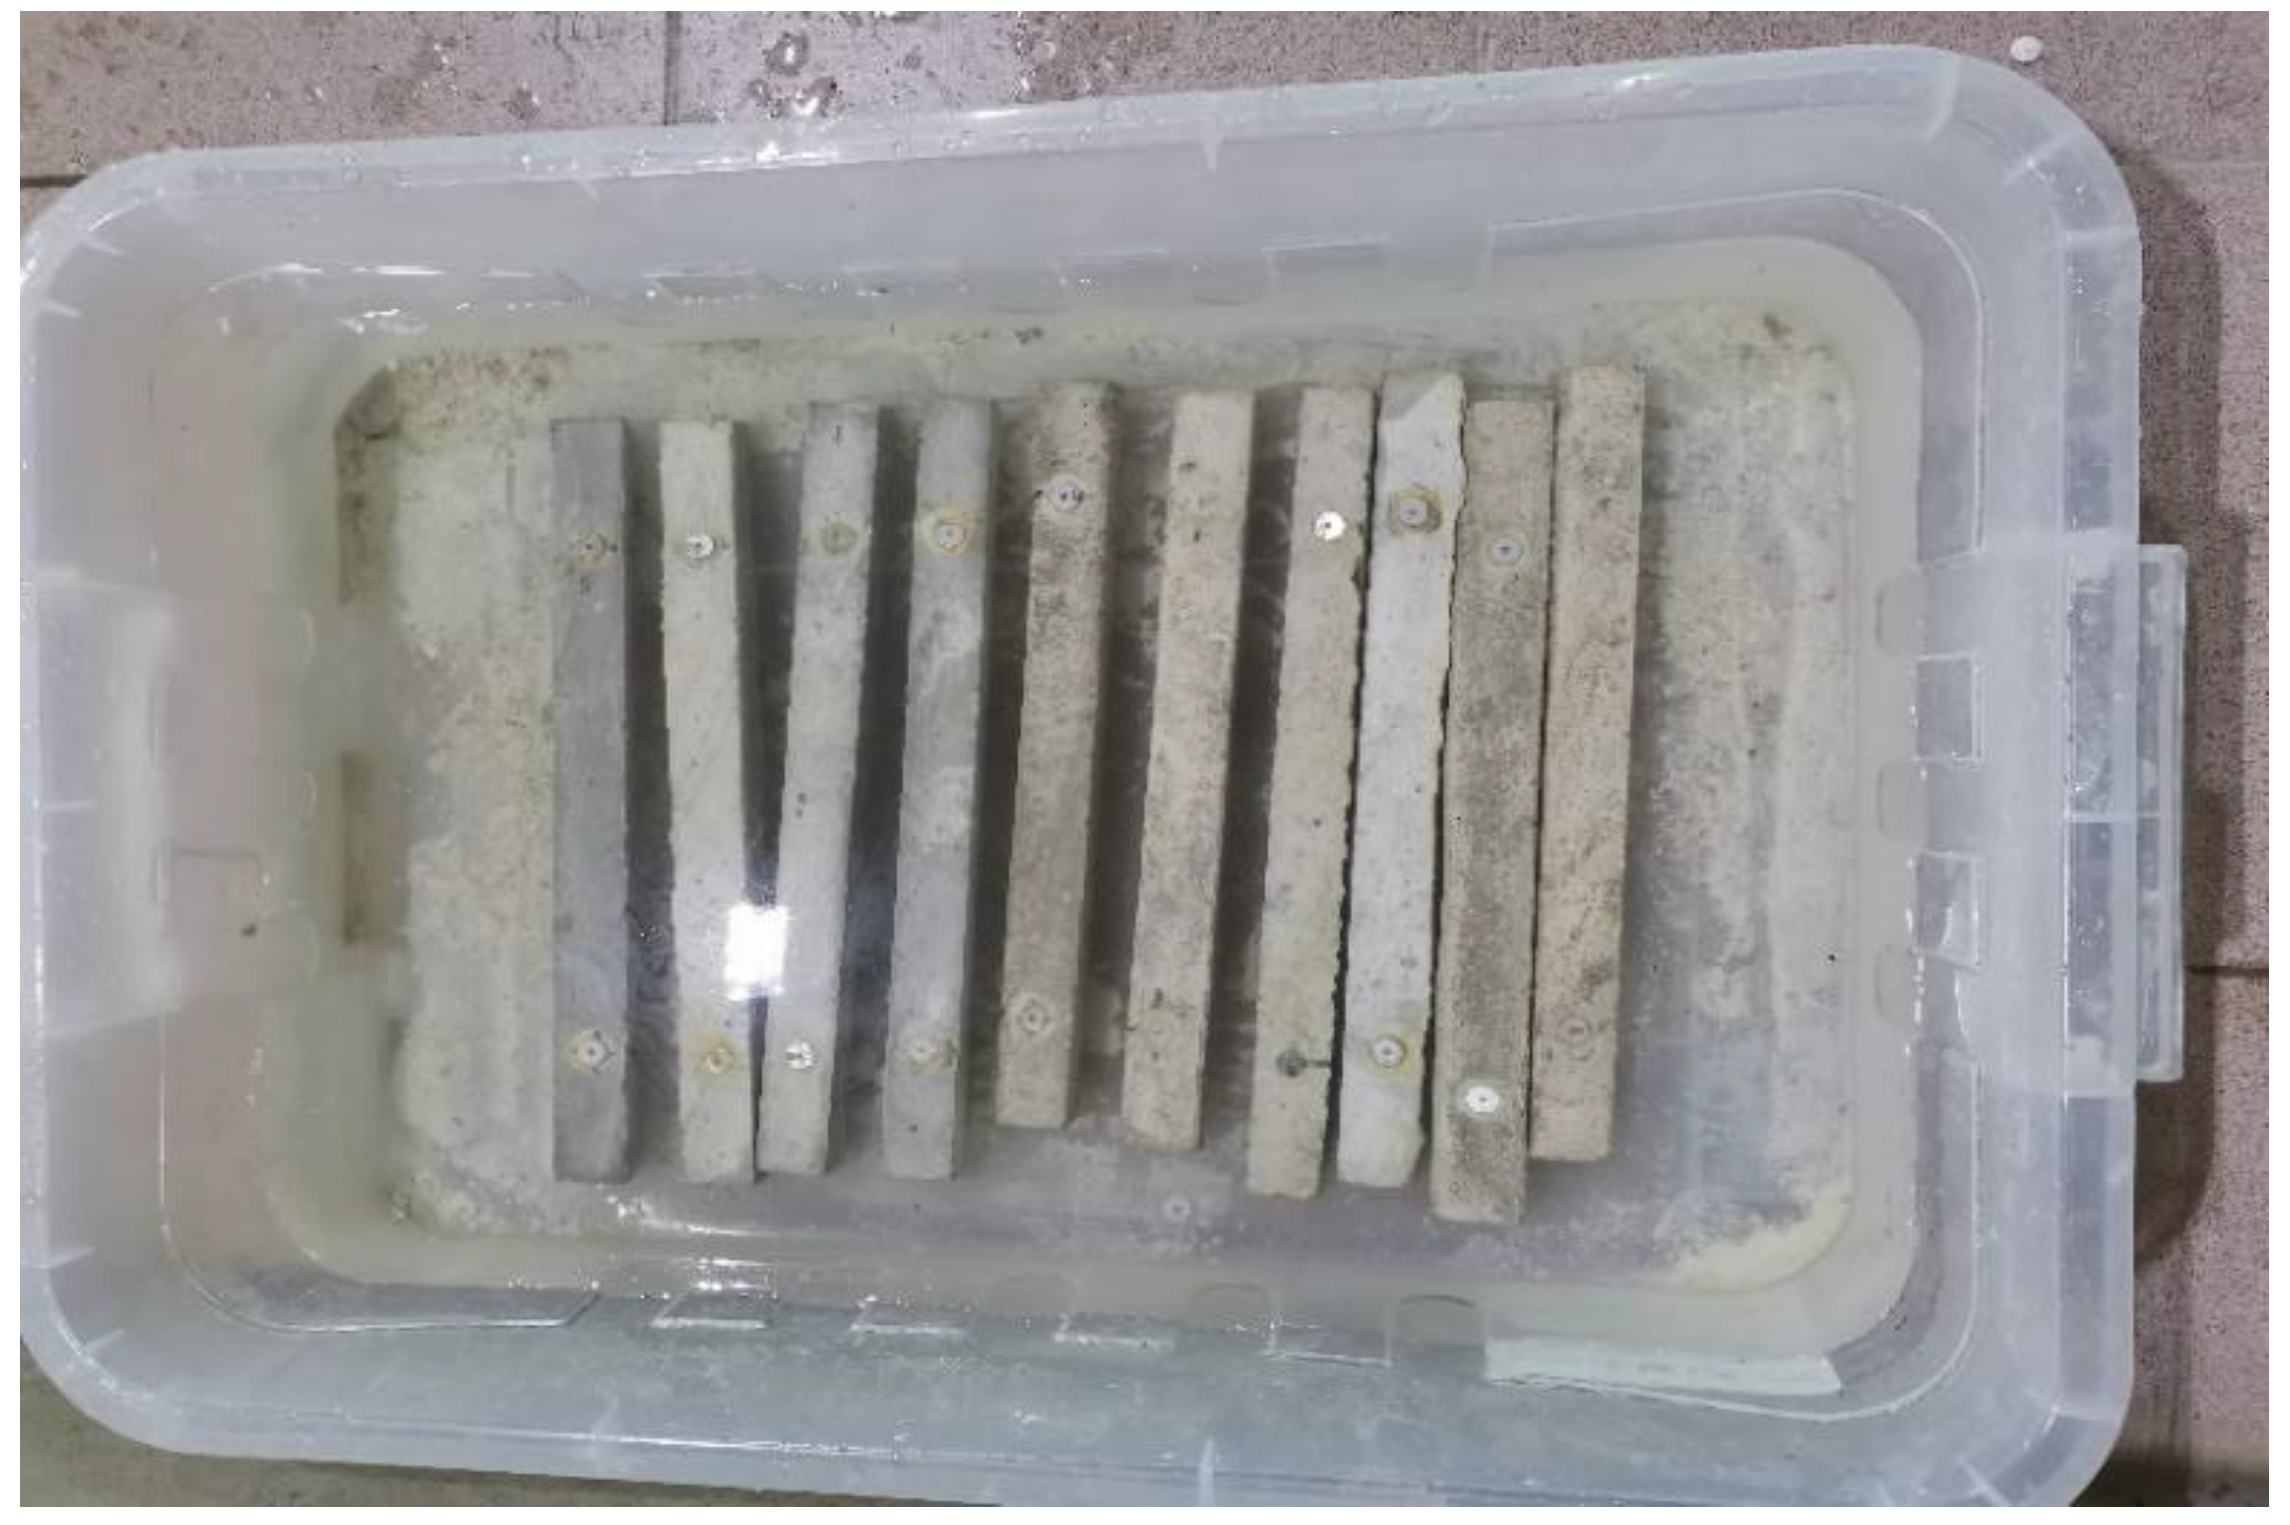
2.3. Specimen Preparation and Test Procedure

2.3.1. Chemical Shrinkage

A chemical shrinkage test was performed according to ASTM C 1608 [46]. The chemical shrinkage specimens and test set-up are shown in Figure 2a,b, respectively. The cement and LF were dry mixed for 2 min and then poured with water. After that, 30 gm of paste was placed in a 250-mL glass bottle for each mix, which corresponded to a depth of around 1.8 cm. Subsequently, a 2-mL graduated pipette was inserted through a hole in a rubber stopper and filled with water. This level of water was considered the chemical shrinkage initial value (i.e., zero). At the end, a drop of oil was added to prevent any water evaporation. Two replicate specimens were tested for each mix. One bottle filled with water only playing the role of a control specimen was used to monitor any drop in the water level due to several environmental conditions (e.g., temperature variation, stopper relaxation or water absorption by the stopper or the bottle). The average value of the two readings represented the chemical shrinkage. During the first 24 h, the drop of water was monitored every 1 h and then once every 2 days until a total period of 90 days. The volume change (chemical shrinkage) was transformed to length change using the following equation [19]:
∆V/V = 3 ∆L/L
The results obtained were expressed in micrometers/meter in order to be compared with autogenous and drying shrinkage and expansion.

2.3.2. Autogenous Shrinkage

Autogenous shrinkage specimens were prepared using a Hobart mixer and tested according to ASTM C192 [47]. The specimens were cast in steel molds with dimensions of 25 mm × 25 mm × 300 mm and kept for 24 h. After demolding, two demec points at 200 mm on two sides of the specimens were applied. The length change was recorded using a dial gauge (Figure 3). The specimens were then placed in plastic bags (Figure 4). The lengths of the specimens were recorded every 2 days for a total period of 90 days. The length changes reported were the average values of four readings from two specimens for each mix.

2.3.3. Drying Shrinkage

The drying shrinkage was tested according to ASTM C157 [48]. The specimens were cast in 25 mm × 25 mm × 300 mm steel molds. After 24 h, the specimens were placed in air at an average temperature of 25 °C as shown in Figure 4. The procedure for taking the readings and frequency was similar to that for the autogenous shrinkage specimens.

2.3.4. Expansion

The paste specimens were cast in 25 mm × 25 mm × 300 mm steel molds. Two specimens for each mix were prepared to measure expansion. After 24 h, the specimens were immersed in water at a constant temperature (20 ± 1 °C) as shown in Figure 5. The procedure for taking the readings and frequency was similar to that for the autogenous shrinkage specimens.

3. Results and Discussion

3.1. Chemical Shrinkage

The results for the chemical shrinkage (µm/m) over 90 days are presented in Figure 6. For the purpose of comparison, the units of chemical shrinkage were converted to the same units as those for drying shrinkage, autogenous shrinkage and expansion (micrometer/meter) using Equation (1). It should be noted that there is a 1-day difference between chemical shrinkage and other shrinkages. Hence, the zero time for chemical shrinkage is the time immediately after placing, while the zero time for other shrinkage bars is the time after demolding (day 1). As shown in this figure, the inclusion of 0, 5, 10, 15 and 20% LF increased the chemical shrinkage within the first 24 h. Thus, the formation of calcium carboaluminate resulting from the reaction between LF and C3A in the cement increased the total volume of the hydrate products [28,29,49,50]. For the longer curing period, it was shown that chemical shrinkage kept going up as the curing time increased. For example, at 1 day, the chemical shrinkage of the 10% LF replacement level was about 619.5 µm/m. This value rose to around 840.7 and 1239 µm/m at 10 and 45 days, respectively. Therefore, the reaction between cement particles and LF perpetuated with time. For the first 3 days, the chemical shrinkage values were approximately similar for all mixes. At 90 days, the chemical shrinkage of pastes with 0% LF attained a value of 1578.2 µm/m. This value increased to 1961.7 µm/m at 5% LF and then faintly dropped with the addition of 10% LF (1917.4 µm/m). After this slight decline, the chemical shrinkage went up to the optimum value of 2861.4 µm/m at 15% LF. For an inclusion of 20%, the chemical shrinkage displayed a sharp drop and reached a value of 1770 µm/m. This may be explained by the fact that with a high amount of LF (>15%), as the curing time increased, the formation of calcium carboaluminate hydrate could consume CH. Thus, the chemical effect of LF could increase the solid volume of hydration products (external expansion), which reduced the total system volume (chemical shrinkage) [19]. Additionally, LF would mainly show a filler effect which refined the pore structure and reduced the porosity of the cement [23]. The incorporation of diverse percentages of LF enhanced the chemical shrinkage of pastes. This finding can be explained as follows: (a) Considering the fact that chemical shrinkage is a direct result of the hydration processes, the cement hydration acceleration due to the presence of LF increases the chemical shrinkage [27], and (b) LF with a fine particle size afford nucleation sites for hydration products to precipitate, accelerate the hydration process and increase the hydration degree of the cement [23].

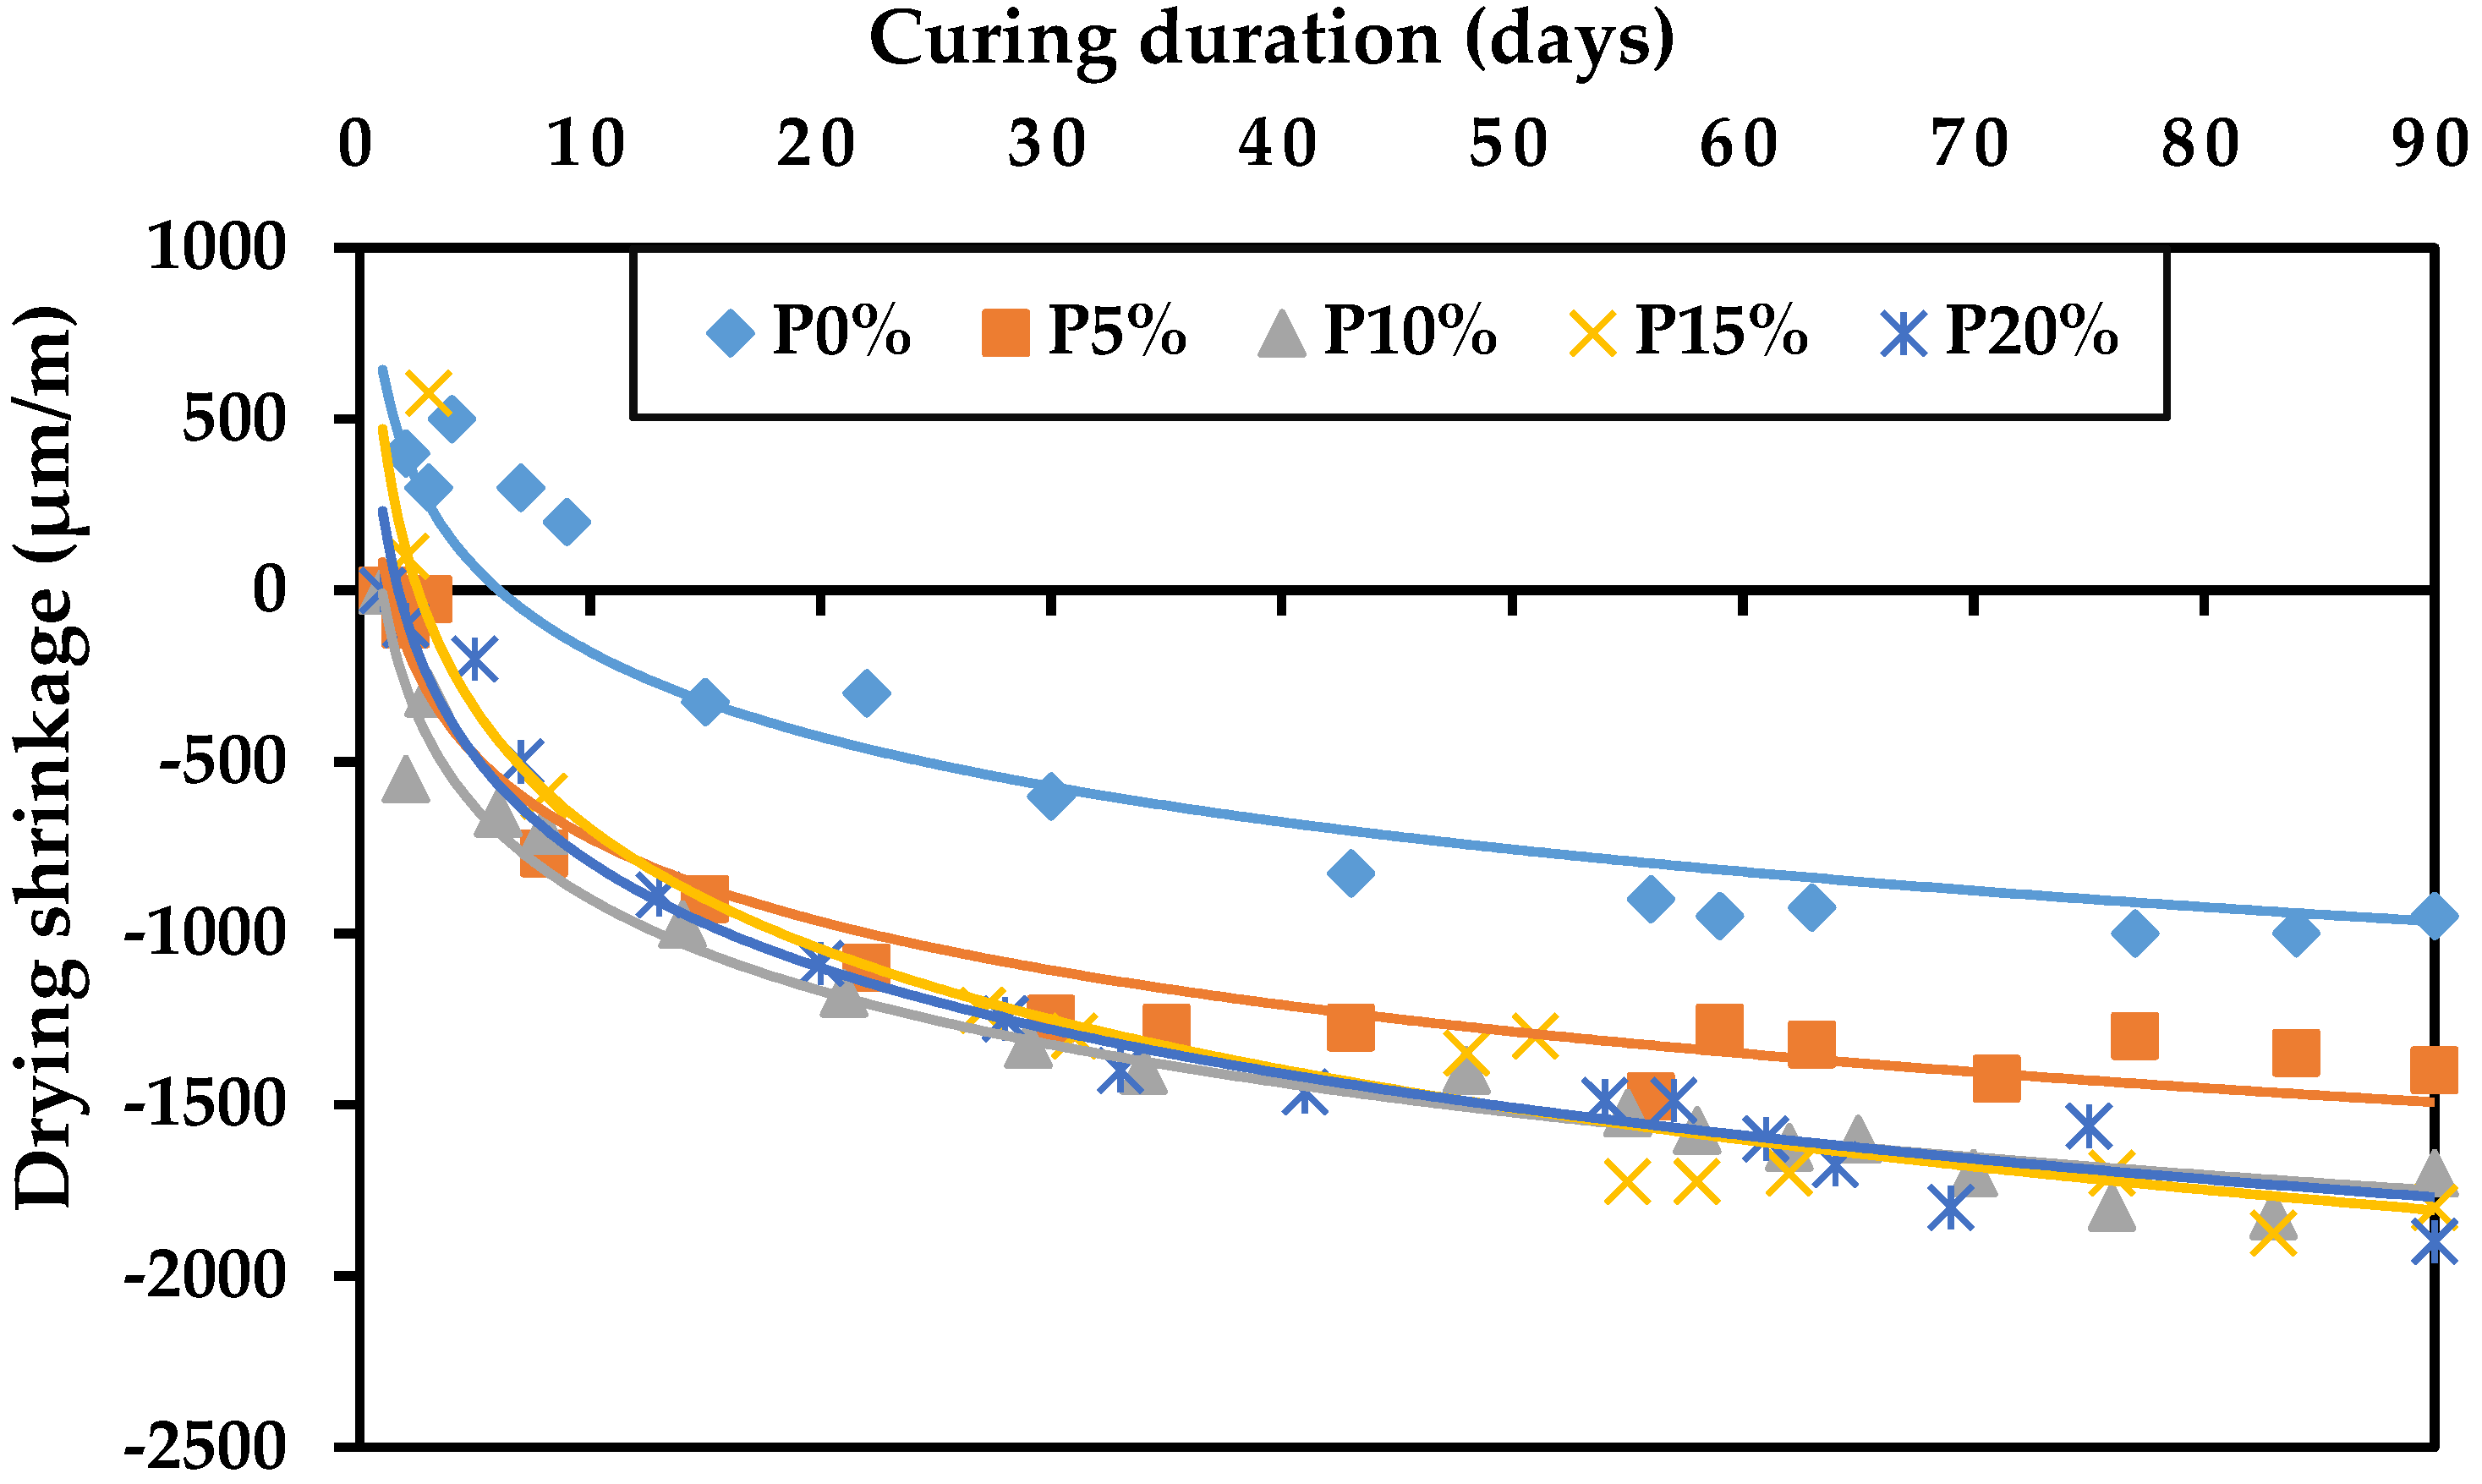
3.2. Drying Shrinkage

The results for the drying shrinkage for all paste specimens are presented in Figure 7. The incorporation of 0% LF displayed expansion for the first few days. This phenomenon was not expected, but this small expansion has been observed by other studies [51]. As displayed, all plots show similar trends. Drying shrinkage values increased as the curing time went up. For example, at 1 day, the drying shrinkage of the 5% LF replacement was 0 µm/m. This value went up to a value of 900 and 1275 µm/m at 15 and 45 days, respectively. The mechanism of long-term drying shrinkage can be well explained by the disjoining pressure, which is relevant to the drying shrinkage in paste [52,53,54,55]. This disjoining pressure existing between capillary pores could result in the contraction of the solid body.
It was noticed as well that the drying shrinkage rose as the LF content increased. For example, at 90 days, the inclusion of 0% LF achieved a value of 950 µm/m. This value subsequently rose until achieving the highest value of 1900 µm/m with the addition of 20% LF. The reason for this elevation may be attributed to the drop of Young’s modulus of the paste as well as the difference in capillary pore structure connectivity, which led to easier moisture escape [56,57,58,59].
It can be stated that the w/b ratio can play a significant role in drying shrinkage development. The paste in this case will be more porous with more connectivity, which can increase the rate of water evaporation, thus increasing the drying shrinkage of the paste [17,56,60,61]. The addition of the LF content tended to amplify the drying shrinkage. This was due to the strong impact of an internal reaction which enhanced the cohesion between the cement and LF [62]. Hence, this opposite phenomenon encourages disruption in the compaction of the paste, resulting in a higher amount of entrapped voids, which leads to greater drying shrinkage [62].

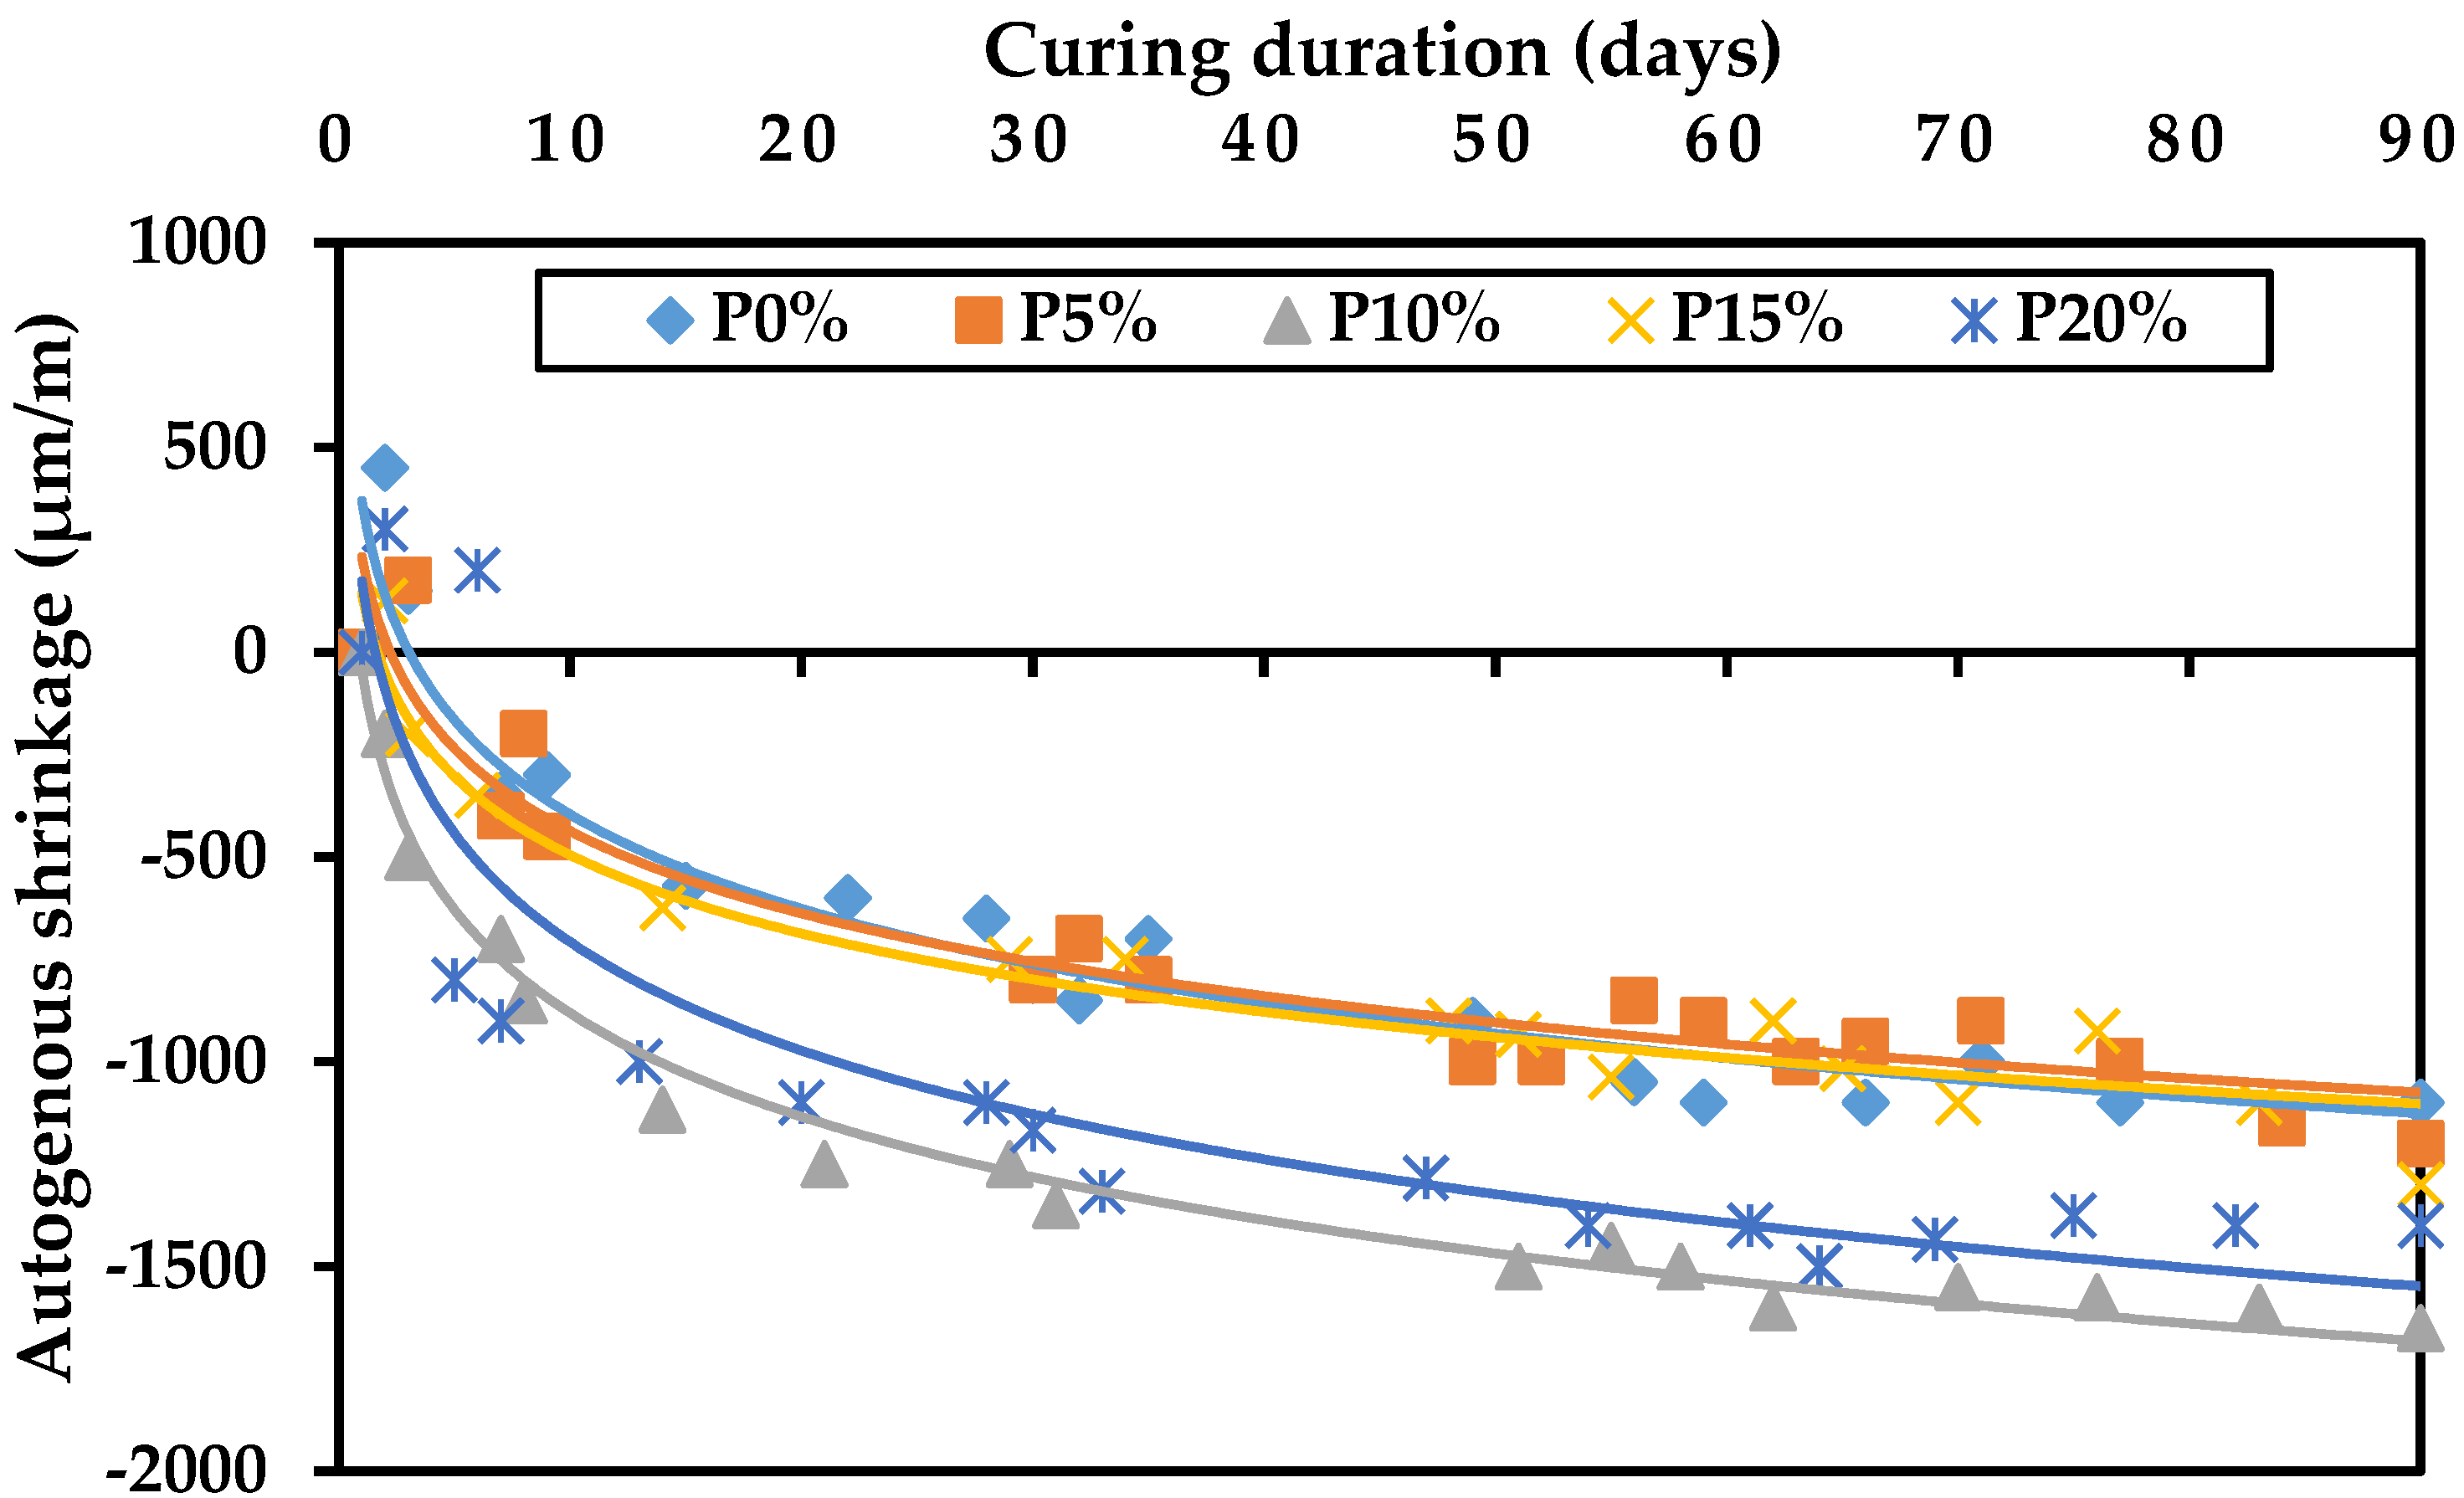
3.3. Autogenous Shrinkage

Figure 8 displays the autogenous shrinkage for various pastes during the first 90 days of curing. Generally, there was a tendency to have small expansion during the first few days of curing, and thereafter autogenous shrinkage started to occur. As shown, the autogenous shrinkage was influenced by the LF content. At 90 days, the autogenous shrinkage for the 0% addition was 1100 µm/m. This value went up and reached the optimum value of 1650 µm/m with the incorporation of 10% LF. After this sharp increase, the autogenous shrinkage values dropped with the addition of 15 and 20% LF. This can be explained by the fact that LF fills the porous structures and produces higher capillary forces, which increases the self-desiccation during cement hydration. Moreover, for replacements above 10% LF, due to the internal curing effect, the released water from specimens with 15 and 20% LF can fill the emptied pore and leads to a reduction in the degree of self-desiccation and autogenous shrinkage [7,63,64,65,66,67].
It can be also detected that with the rising of curing time, the autogenous shrinkage will definitely rise. For example, at 1 day, the autogenous shrinkage value for 5% LF was 0 µm/m. This value rose to a value of 450 and 900 µm/m at 10 and 45 days, respectively. This was due to the pozzolanic reactions of the LF, which led to an increase in autogenous shrinkage [26,63,68,69].

3.4. Expansion

The expansion results for the paste specimens with different percentages of LF are presented in Figure 9. The paste specimens displayed continuous expansion from zero time until 90 days. As shown in this plot, there was a logical variation in the expansion results when incorporating the LF content. For example, at 90 days, the expansion value for the 0% LF replacement was 2000 µm/m. This value rapidly decreased to a minimum value of 1200 µm/m with the addition of 10% LF. After this sharp decrease, the expansion value rose again up to 2100 µm/m and 2150 µm/m with the inclusion of 15 and 20% LF, respectively. Therefore, adding 15% LF and above enhanced the self-desiccation due to hydration. In particular, the curing time had an obvious effect on the expansion. The expansion increased as the curing time rose for all percentages. For example, at 1 day, the expansion of the 5% LF replacement was 0 µm/m. This value went up to a value of 800 and 1400 µm/m at 10 and 45 days, respectively. Moreover, as the curing time increased, swelling in the bars rose much more for the pastes with high LF contents (15 and 20%) than in specimens with low LF contents. This was due to the hydrate products (monocarboaluminate and hemi or mono-carbonate) [49] that were formed at high LF contents being able to absorb more water and swell more than pastes with low LF contents [19,26]. Furthermore, it could be a result of the changes in phase composition within the hydrate network. As the CH content in the system reduced due to the addition of the LF content, the calcium aluminate was gradually replaced by carboaluminate, which has a lower density than calcium aluminate, providing an extra contribution to the expansion process [19,49].

3.5. Comparison between Chemical, Autogenous and Drying Shrinkage and Expansion

Figure 10, Figure 11, Figure 12, Figure 13 and Figure 14 present the length change (chemical, drying and autogenous shrinkage and expansion) of pastes for 0, 5, 10, 15 and 20% LF, respectively, over 90 days. By comparing the development of shrinkage over 90 days, it seems that the chemical shrinkage values were the highest among all other shrinkages. Likewise, the inclusion of LF achieved a noticeable enhancement in shrinkage. According to the results illustrated in these figures, it appears that the drying shrinkage was clearly greater than the autogenous shrinkage. This is well observed in Figure 13. The results are to be expected given that autogenous shrinkage is caused by self-desiccation in paste as water is consumed during the hydration process. This generally occurs within the early days of casting the paste. However, drying shrinkage is the reduction in paste volume caused by the loss of water during the drying mechanism, and this continues perhaps for years after paste curing [63,64,65,66]. Additionally, all shrinkage values increased as the curing time went up. Adding 15% LF attained the maximum chemical shrinkage. However, the inclusion of 10% LF and 20% LF exhibited the highest autogenous and drying shrinkage, respectively. Concerning the expansion, there was a decrease between 0 and 10% LF. Beyond this level, there was an increase in shrinkage, with a maximum value of 2150 µm/m occurring at the 20% replacement level.

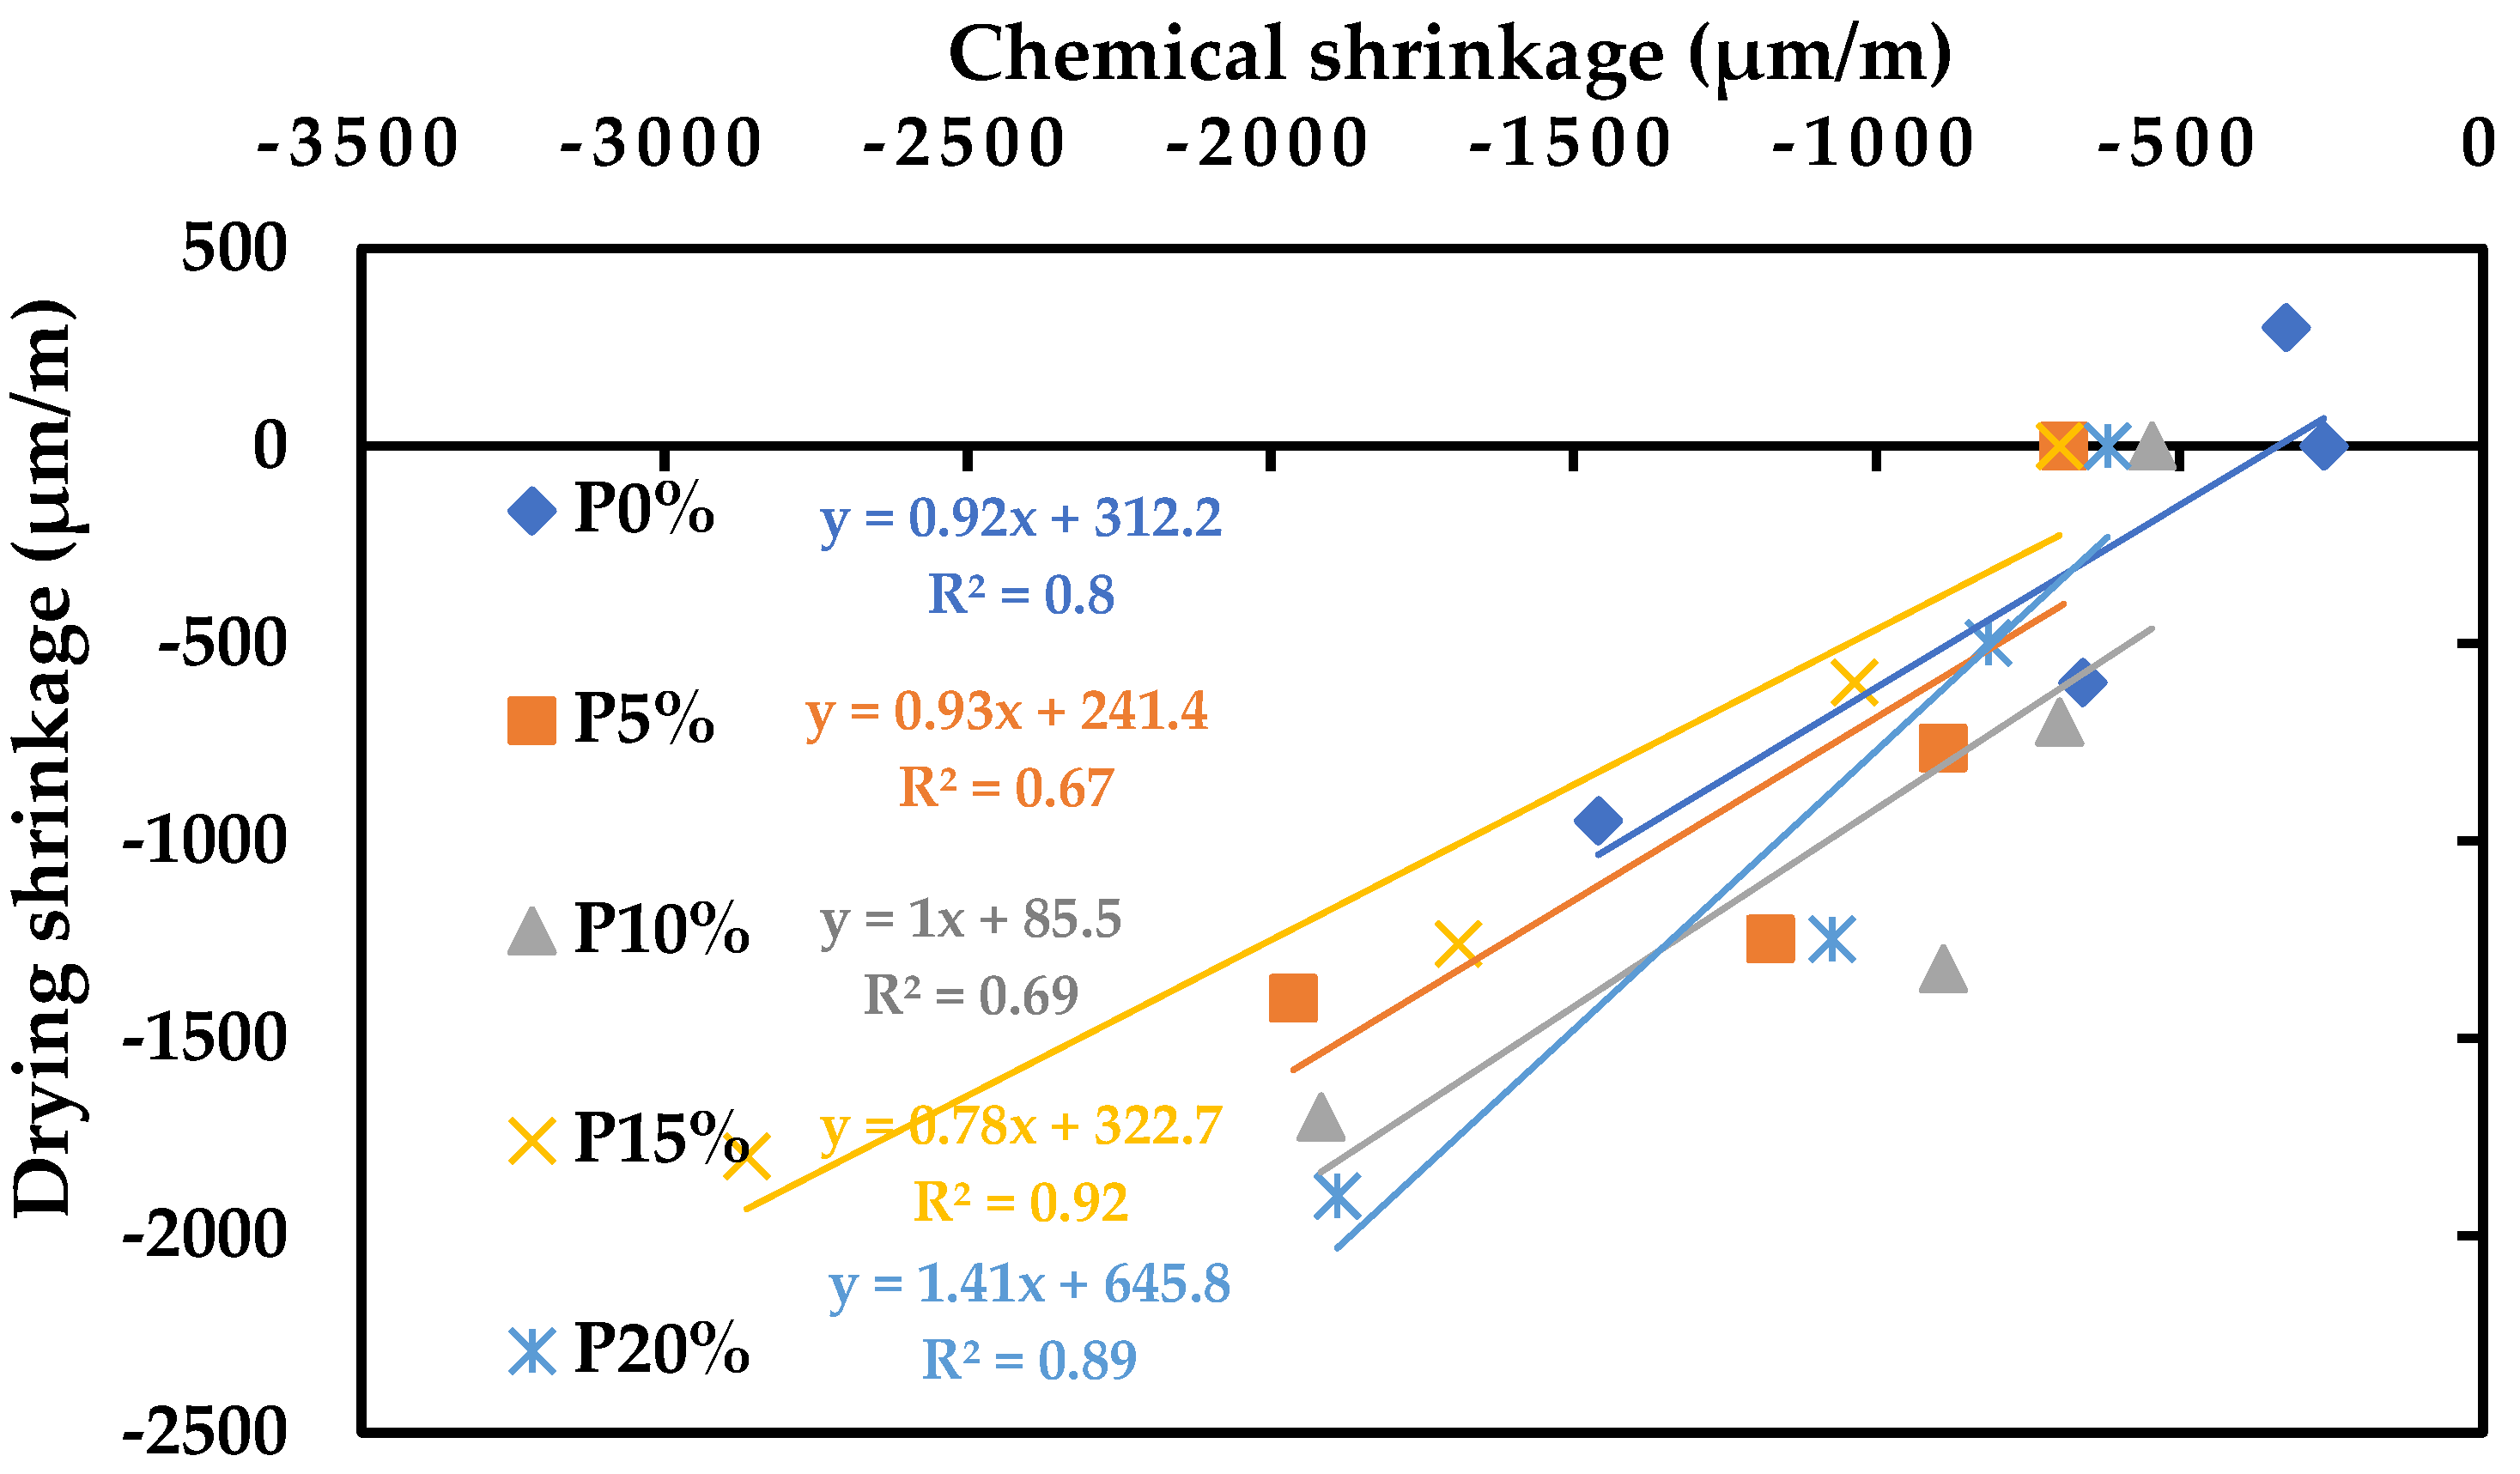
3.6. Relationships between Different Length Change Parameters

As mentioned in previous studies, the total chemical shrinkage is the sum of the external and internal volume changes [8,70,71]. In general, at early ages, the external dimensions of a paste can either drop due to self-desiccation (i.e., autogenous shrinkage) or to external drying (i.e., drying shrinkage) or rise due to expansion. The internal volume change represents the chemical shrinkage [3]. On the other side, some authors define chemical shrinkage in terms of the total chemical shrinkage and external chemical shrinkage [5,9]. After the paste becomes stiff and can resist a contracting force, the external chemical shrinkage is equal to the total chemical shrinkage.
The relationships between chemical shrinkage and the other length change parameters—autogenous shrinkage, drying shrinkage and expansion at different curing ages (1, 7, 28 and 90 days)—are illustrated in Figure 15, Figure 16 and Figure 17, respectively. As shown in Figure 15, a positive relation existed between chemical shrinkage and autogenous shrinkage. This plot draws a linear relationship, with a coefficient of determination R2 of 0.89, 0,89, 0.73, 0.96 and 0.66 for 0, 5, 10, 15 and 20% LF, respectively. This means that during the hydration process and after setting started, chemical shrinkage did not occur spontaneously, since it was delayed by the rigidity of the paste itself [3]. Hence, water took its place in the finesse pores of the cement paste. As the hydration process progressed, the volume of the water in the pores dropped. Thus, a process known as self-desiccation took place and led to creating autogenous shrinkage. Additionally, and before the initial setting of the paste, the capillary forces were almost negligible. Thus, chemical shrinkage was essentially the only motivator for autogenous shrinkage.
Similarly, the relation between chemical shrinkage and drying shrinkage was proportional. The coefficient of determination R2 was 0.8, 0.67, 0.69, 0.92 and 0.89 for 0, 5, 10, 15 and 20% LF, respectively (Figure 16). This indicates that chemical shrinkage increased with the increase in drying shrinkage. Chemical shrinkage occurred before the setting time of the paste while drying shrinkage took place after the setting time or when the paste started to harden. Thus, chemical shrinkage was a basic contributor for drying shrinkage. Furthermore, the driving force of drying shrinkage was the loss of moisture resulting from the self-desiccation in the cement paste [26].
There was a negative linear relation between chemical shrinkage and expansion (Figure 17). This negative relation indicates that as the chemical shrinkage values increased, the expansion of the paste dropped. In fact, when the bars were cured in water, where no self-desiccation existed, the bars exhibited continuous expansion over time. Therefore, shrinkage did not take place. Furthermore, as the amount of the LF content increased (above 15% LF), the less shrinkage and expansion would always exist.

4. Conclusions

This paper discusses the volume stability of paste incorporating limestone fines as a cement replacement. The volume stability included three types of shrinkage—chemical, autogenous and drying—and expansion. Based on the results obtained in this experimental work, the following conclusions can be made:
  • Chemical shrinkage increased for substitutions levels between 0 and 15% LF, where it achieved the highest value of 2861.4 µm/m at 90 days. Beyond 15% LF substitution, the chemical shrinkage decreased.
  • Drying shrinkage increased as the LF content in the paste increased. At 90 days, the maximum drying shrinkage value of 1900 µm/m was achieved for 20% LF replacement.
  • The length change (autogenous shrinkage) showed positive values (i.e., expansion) for the first few days (7 days) for all replacements except for 10% LF replacement. After this period, all replacements showed contraction. Autogenous shrinkage increased between 0 and 10% LF, where it achieved the highest value of 1650 µm/m at 90 days followed by a sharp drop for compositions above 10% LF.
  • The expansion values for the paste specimens showed a slight decrease for replacements between 0 and 10% LF. Above 10% LF, there was sharp increase in expansion, and the highest value of 2150 µm/m was achieved for the paste with 20% LF.
  • A positive correlation existed between chemical shrinkage and both autogenous and drying shrinkage. However, a negative correlation occurred between chemical shrinkage and expansion.

Author Contributions

Conceptualization, J.K.; methodology, R.R.; formal analysis, R.R.; writing—original draft preparation, R.R. and H.G.; writing-review and editing, J.K., H.G. and A.E.; supervision, J.K. and A.E.; project administration, H.G. All authors have read and agreed to the published version of the manuscript.

Funding

This research received no external funding.

Institutional Review Board Statement

Not applicable.

Informed Consent Statement

Not applicable.

Data Availability Statement

Data sharing is not applicable to this article.

Conflicts of Interest

The authors declare no conflict of interest.

References

  1. Di Bella, C. Drying Shrinkage of Cementitious Materials at Early Age. Ph.D. Thesis, ETH Zurich, Zürich, Switzerland, 2016. [Google Scholar]
  2. Hammer, T.A. The Influence of some mix design parameters on drying shrinkage of SCC. In Proceedings of the 5th International RILEM Symposium on Self-Compacting Concrete, Ghent, Belgium, 3–5 September 2007; pp. 559–564. [Google Scholar]
  3. Zhutovsky, S.; Kovler, S. Chemical shrinkage of high-strength/high-performance cementitious materials. Int. Rev. Civ. Eng. 2010, 1, 110–118. [Google Scholar] [CrossRef]
  4. Justnes, H.; Reyniers, B.; Sellevold, E.J. An evaluation of methods for measuring chemical shrinkage of cementitious pastes. Nordic. Concr. Res. 1994, 14, 45–61. [Google Scholar]
  5. Justnes, H.; Van Gemert, A.; Verboven, F.; Sellevold, E.J. Total and external chemical shrinkage of low W/C ratio cement pastes. Adv. Cem. Res. 1996, 8, 121–126. [Google Scholar] [CrossRef]
  6. Justnes, H.; Ardouillie, B.; Hendrix, E.; Sellevold, E.J.; Van Gemert, D. The chemical shrinkage of pozzolanic reaction products. In Proceedings of the 6th Canmet/ACI/JCI International Conference on Fly Ash, Silica Fume, Slag and Natural Pozzolan in Concrete; Malhotra, V.M., Ed.; ACI Special Publications: Farmington Hills, MI, USA, 1998; pp. 191–206. [Google Scholar]
  7. Justnes, H.; Sellevold, E.J.; Reyniers, B.; Van Loo, D.; Van Gemert, A.; Verboven, F. The influence of cement characteristics on chemical shrinkage. In Proceedings of the International Workshop on Autogenous Shrinkage of Concrete (Autoshrink’98), Hiroshima, Japan, 13–14 June 1998; Tazawa, E.I., Ed.; E&FN Spon: Londres, UK, 1999; pp. 71–80. [Google Scholar]
  8. Justnes, H.; Sellevold, E.J.; Reyniers, B.; Van Loo, D.; Van Gemert, A.; Verboven, F. Chemical shrinkage of cement pastes with plasticizing admixtures. Nordic. Concr. Res. 2000, 24, 39–54. [Google Scholar]
  9. Tazawa, E.I.; Miyazawa, S.; Kasai, T. Chemical shrinkage and autogenous shrinkage of hydrating cement paste. Cem. Concr. Res. 1995, 25, 288–292. [Google Scholar] [CrossRef]
  10. Persson, B. Experimental studies of the effect of silica fume on chemical shrinkage and self-desiccation in Portland cement mortars. In Proceedings of the 1st International Research Seminar on Self-Desiccation and Its Importance in Concrete Technology, Lund, Sweden, 10 June 1997; Persson, B., Fagerlund, G., Eds.; Lund University: Lund, Sweden, 1997; pp. 116–131. [Google Scholar]
  11. Hammer, T.; Heese, C. Early age chemical shrinkage and autogenous deformation of cement pastes. In Proceedings of the 2nd International Research Seminar on Self-Desiccation and Its Importance in Concrete Technology; Persson, B., Fagerlund, G., Eds.; Lund University: Lund, Sweden, 1999; pp. 7–13. [Google Scholar]
  12. Beltzung, F.; Wittmann, F.H. Dissolution of Cement and Early Chemical Shrinkage of Cement Paste; RILEM Publications SARL: Geneva, Switzerland, 2000; pp. 91–97. [Google Scholar]
  13. Charron, J.P.; Marchand, J.; Bissonnette, B.; Pigeon, M.; Zuber, B. Comparative study of the effects of water/binder ratio and silica fume on the volume instability of hydrating cement pastes at early-age. In Proceedings of the 3rd International Research Seminar on Self-Desiccation and Its Importance in Concrete Technology, Lund, Sweden, 14–15 June 2002; Persson, B., Fagerlund, G., Eds.; Lund University: Lund, Sweden, 2002; pp. 39–50. [Google Scholar]
  14. Charron, J.P.; Marchand, J.; Bissonnette, B. Early-age deformations of hydrating cement systems: Comparison of linear and volumetric shrinkage measurements. In Proceedings of the International Conference on Early Age Cracking in Cementitious Systems (EAC’01); Bentur, A., Ed.; RILEM Publications: Haifa, Israel, 12 March 2001; pp. 245–257. [Google Scholar]
  15. Lura, P. Autogenous Deformation and Internal Curing of Concrete. Ph.D. Thesis, Delft University, Delft, The Netherlands, 2003. Available online: http://resolver.tudelft.nl/uuid:1a1efc2d-a638-4787-b543-5bd643a39a4b (accessed on 15 June 2021).
  16. Wu, L.; Farzadnia, N.; Shi, C.; Zhang, Z.; Wang, H. Autogenous shrinkage of high performance concrete: A review. Constr. Build. Mater. 2017, 149, 62–75. [Google Scholar] [CrossRef]
  17. Zhou, S.B.; Shen, A.Q.; Liang, X.Y.; Tian, F.; Jiang, Z. Effect of Water to Cement Ratio on Autogenous Shrinkage of Pavement Cement Concrete and Its Mechanism Analysis. J. Highw. Transp. Res. Dev. (Engl. Ed.) 2014, 8, 7–12. [Google Scholar] [CrossRef]
  18. Henkensiefken, R.; Bentz, D.; Nantung, T.; Weiss, J. Volume change and cracking in internally cured mixtures made with saturated lightweight aggregate under sealed and unsealed conditions. Cem. Concr. Comp. 2009, 31, 427–437. [Google Scholar] [CrossRef]
  19. Wild, S.; Khatib, J.M.; Roose, L.J. Chemical shrinkage and autogenous shrinkage of Portland cement—Metakaolin pastes. Adv. Cem. Res. 1998, 10, 109–119. [Google Scholar] [CrossRef]
  20. Dhir, R.K.; Limbachiya, M.C.; McCarthy, M.J.; Chaipanich, A. Evaluation of Portland limestone cements for use in concrete construction. Mater. Struct. 2007, 40, 459–473. [Google Scholar] [CrossRef]
  21. Goto, Y.; Fujiwara, T. Volumetric change of aggregates by absorption and drying. In Proceedings of the Japan Society of Civil Engineers; Japan Society of Civil Engineers: Tokyo, Japan, 1976; Volume 1976, pp. 97–108. [Google Scholar] [CrossRef]
  22. Goto, Y.; Fujiwara, T. Effect of aggregate on drying shrinkage of concrete. In Proceedings of the Japan Society of Civil Engineers; Japan Society of Civil Engineers: Tokyo, Japan, 1979; Volume 1979, pp. 125–137. [Google Scholar] [CrossRef] [Green Version]
  23. Meddah, M.S.; Lmbachiya, M.C.; Dhir, R.K. Potential use of binary and composite limestone cements in concrete production. Constr. Build. Mater. 2014, 58, 193–205. [Google Scholar] [CrossRef]
  24. Salman, M.M.; Taofeq, J.M. Effect of using limestone as a partial sustainable material on drying shrinkage of concrete. J. Eng. Sustain. Dev. 2019, 22, 30–45. Available online: https://iasj.net/iasj/download/24dcdf30eea41e90 (accessed on 1 July 2021). [CrossRef]
  25. Aquino, C.; Inoue, M.; Miura, H.; Mizuta, M.; Okamoto, T. The effects of limestone aggregate on concrete properties. Constr. Build. Mater. 2010, 24, 2363–2368. [Google Scholar] [CrossRef]
  26. Valcuende, M.; Marco, E.; Parra, C.; Serna, P. Influence of limestone filler and viscosity-modifying admixture on the shrinkage of self-compacting concrete. Cem. Concr. Res. 2012, 583–592. [Google Scholar] [CrossRef]
  27. Bouasker, M.; Mounanga, P.; Turcry, P.; Loukili, A.; Khelidj, A. Chemical shrinkage of cement pastes and mortars at very early age: Effect of limestone filler and granular inclusions. Cem. Concr. Comp. 2008, 30, 13–22. [Google Scholar] [CrossRef] [Green Version]
  28. Weerdt, K.D.; Haha, M.B.; Saout, G.L.; Kjellsen, K.O.; Justnes, H.; Lothenbach, B. Hydration mechanisms of ternary Portland cements containing limestone powder and fly ash. Cem. Concr. Res. 2011, 41, 279–291. [Google Scholar] [CrossRef]
  29. Wang, C.; Wang, Y.W.; Pu, X.C.; Ye, J.X.; Bai, G. Characteristics and mechanisms for autogenous shrinkage of cement concrete with very low water-binder ratio. J. Constr. Build. Mater. 2010, 13, 75–79. [Google Scholar]
  30. Courard, L.; Michel, F. Limestone fillers cement based composites: Effects of blast furnace slags on fresh and hardened properties. Constr. Build. Mater. 2014, 51, 439–445. [Google Scholar] [CrossRef] [Green Version]
  31. Bentz, D.P.; Irassar, E.F.; Bucher, B.E.; Weiss, W.J. Limestone fillers conserve cement; Part 1: An analysis based on Powers’ model. Concr. Int. 2009, 31, 41–46. [Google Scholar]
  32. Cohen, M.D.; Olek, J.; Dolch, W.L. Mechanism of plastic shrinkage cracking in portland cement and portland cement-silica fume paste and mortar. Cem. Concr. Res. 1990, 20, 103–119. [Google Scholar] [CrossRef]
  33. Han, Y.; Lin, R.; Wang, X.Y. Performance and sustainability of quaternary composite paste comprising limestone, calcined Hwangtoh clay, and granulated blast furnace slag. J. Build. Eng. 2021, 43, 102655. [Google Scholar] [CrossRef]
  34. Lehner, P.; Konečný, P.; Ghosh, P. Variation of Durability and Strength Parameters of Pumice Based Mixtures. Materials 2021, 14, 3674. [Google Scholar] [CrossRef] [PubMed]
  35. Homayoonmehr, R.; Ramezanianpour, A.; Mirdarsoltany, M. Influence of metakaolin on fresh properties, mechanical properties and corrosion resistance of concrete and its sustainability issues: A review. J. Build. Eng. 2021, 44, 103011. [Google Scholar] [CrossRef]
  36. Li, Y.; Bao, J.; Guo, Y. The relationship between autogenous shrinkage and pore structure of cement paste with mineral admixtures. Constr. Build. Mater. 2010, 24, 1855–1860. [Google Scholar] [CrossRef]
  37. Tangtermsirikul, S. Effects of chemical composition and particle size of fly ash on autogenous shrinkage of paste. In Proceedings of the International Workshop Autoshrink’98, Hiroshima, Japan, 8–10 September 1999; pp. 175–185. [Google Scholar]
  38. Tazawa, E. Autogenous Shrinkage of Concrete; Japan Concrete Institute Technical Committee on Autogenous Shrinkage of Concrete: Tokyo, Japan, 1999; pp. 1–62. [Google Scholar]
  39. Chan, Y.W.; Liu, C.Y.; Lu, Y.S. Effects of slag and fly ash on the autogenous shrinkage of high performance concrete. In Autogenous Shrinkage of Concrete; CRC Press: Boca Raton, FL, USA, 1999. [Google Scholar]
  40. Lim, S.N.; Wee, T.H. Autogenous shrinkage of ground-granulated blast-furnace slag concrete. ACI Mater. J. 2000, 97, 587–593. [Google Scholar]
  41. Du, H.; Dai Pang, S. High-performance concrete incorporating calcined kaolin clay and limestone as cement substitute. Constr. Build. Mater. 2020, 264, 120152. [Google Scholar] [CrossRef]
  42. Lu, T.; Li, Z.; Huang, H. Effect of supplementary materials on the autogenous shrinkage of cement paste. Mater. J. 2020, 13, 3367. [Google Scholar] [CrossRef]
  43. Sukontasukkul, P.; Tiamlom, K. Expansion under water and drying shrinkage of rubberized concrete mixed with crumb rubber with different size. Constr. Build. Mater. 2012, 29, 520–526. [Google Scholar] [CrossRef]
  44. Markandeya, A.; Mapa, D.G.; Fincan, M.; Shanahan, N.; Stetsko, Y.P.; Riding, K.A.; Zayed, A. Chemical Shrinkage and Cracking Resilience of Metakaolin Concrete. ACI Mater. J. 2019, 116, 99–106. [Google Scholar] [CrossRef]
  45. Wang, J.; Cheng, Y.; Yuan, L.; Xu, D.; Du, P.; Hou, P.; Zhou, Z.; Cheng, X.; Liu, S.; Wang, Y. Effect of nano-silica on chemical and volume shrinkage of cement-based composites. Constr. Build. Mater. 2020, 247, 118529. [Google Scholar] [CrossRef]
  46. ASTM C 1608. Standard Test Method for Chemical Shrinkage of Hydraulic Cement Paste; American Society for Testing and Materials: West Conshohocken, PA, USA, 2007.
  47. ASTM C 192. Standard Practice for Making and Curing Concrete Test Specimens in the Laboratory; ASTM International: West Conshohocken, PA, USA, 2014.
  48. ASTM C 157. Standard Test Method for Length Change of Hardened Hydraulic-Cement Mortar and Concrete; ASTM C157-08; ASTM International: West Conshohocken, PA, USA, 2008.
  49. Wang, D.; Shi, C.; Farzadnia, N.; Shi, Z.; Jia, H.; Ou, Z. A review on use of limestone powder in cement-based materials: Mechanism, hydration and microstructures. Constr. Build. Mater. 2018, 181, 659–672. [Google Scholar] [CrossRef]
  50. Wang, D.; Shi, C.; Farzadnia, N.; Shi, Z.; Jia, H. A review on effects of limestone powder on the properties of concrete. Constr. Build. Mater. 2018, 192, 53–66. [Google Scholar] [CrossRef]
  51. Bartojay, K.; Lucero, C. Comparative Analysis on Reducing Concrete Shrinkage and Cracking; Research and Development Office, U.S. Department of the Interior, Bureau of Reclamation: Washington, DC, USA, 2018.
  52. Beltzung, F.; Wittmann, F.H. Role of disjoining pressure in cement based materials. Cem. Concr. Res. 2005, 35, 2364–2370. [Google Scholar] [CrossRef]
  53. Maruyama, I.; Sugie, A. Numerical study on drying shrinkage of concrete affected by aggregate size. J. Adv. Concr. Technol. 2014, 12, 279–288. [Google Scholar] [CrossRef] [Green Version]
  54. Kovler, K.; Zhutovsky, S. Overview and furure trends of shrinkage research. Mater. Struct. 2012, 39, 827–847. [Google Scholar] [CrossRef]
  55. Wittmann, F. Heresies on shrinkage and creep mechanisms. In Creep, Shrinkage and Durability Mechanics of concrete and Concrete Structures; Two Volume Set; Taylor and Francis Group: London, UK, 2008. [Google Scholar]
  56. Ye, H.; Radlinska, A. A review and comparative study of existing shrinkage prediction models for portland and non-portland cementitious materials. Adv. Mater. Sci. Eng. 2016, 1–13. [Google Scholar] [CrossRef] [Green Version]
  57. Idiart, A.E. Coupled Analysis of Degradation Processes in Concrete Specimens at the Meso-Level; Universitat Politècnica de Catalunya: Barcelona, Spain, 2009. [Google Scholar]
  58. Nagataki, S.; Yonekura, A. The mechanisms of drying shrinkage and creep of concrete. Concr. Libr. Int. 1984, 3, 177–191. [Google Scholar]
  59. Guneyisi, E.; Gesoglu, M.; Mermerdas, K. Improving strength, drying shrinkage, and pore stucture of concrete using metakaolin. Mater. Struct. 2007, 41, 937–949. [Google Scholar] [CrossRef]
  60. Almudaiheem, J.A. Prediction of drying shrinkage of portland cement paste: Influence of shrinkage mechanisms. J. King Saud Univ. Eng. Sci. 1991, 3, 69–86. [Google Scholar] [CrossRef]
  61. Maruyama, I.; Nishioka, Y.; Igarashi, G.; Matsui, K. Microstructural and bulk property changes in hardened cement paste during the first drying process. Cem. Concr. Res. 2014, 58, 20–34. [Google Scholar] [CrossRef]
  62. Tran, N.P.; Gunasekara, C.; Law, D.W.; Houshyar, S.; Setunge, S.; Cwirzen, A. A critical review on drying shrinkage mitigation strategies in cement-based materials. J. Build. Eng. 2021, 38, 102210. [Google Scholar] [CrossRef]
  63. Yang, Y.; Sato, R.; Kawai, K. Autogenous shrinkage of high –strength concrete contaning silica fume under drying at early ages. Cem. Concr. Res. 2005, 35, 449–456. [Google Scholar] [CrossRef]
  64. Meddah, M.S.; Tagnit-Hamou, A. Pore structure of concrete with mineral admixtures and its effect on self-desiccation shrinkage. ACI Mater. J. 2009, 106, 241–250. [Google Scholar]
  65. Huy, Q. Modelling Properties of Cement Paste from Microstructure: Porosity, Mechanical Properties, Creep and Shrinkage; École Polytechnique Fédérale de Lausanne: Lausanne, Switzerland, 2013. [Google Scholar]
  66. Jiang, Z.; Sun, Z.; Wang, P. Internal relative humidity distribution in highperformance cement paste due to moisture diffusion and self-desiccation. Cem. Concr. Res. 2006, 36, 320–325. [Google Scholar] [CrossRef]
  67. Jiang, Z.; Sun, Z.; Wang, P.; Wang, X. Study on self-desiccation effect of high performance concrete. J. Build. Mater. 2004, 7, 19–24. [Google Scholar]
  68. Gagné, R.; Aouad, I.; Shen, J.; Poulin, C. Development of a New Experimental Technique for the Study of the Autogenous Shrinkage of Cement Paste. Mater. Struct. 1999, 32, 635–642. [Google Scholar] [CrossRef]
  69. Knudsen, T.; Geiker, M. Obtaining Hydration Data by Measurement of Chemical Shrinkage with an Archimeter. Cem. Concr. Res. 1985, 15, 381–382. [Google Scholar] [CrossRef]
  70. Aitcin, P. 17 Autogenous shrinkage measurement, Autogenous shrinkage of concrete. In Proceedings of the International Workshop, Organised by JCI (Japan Concrete Institute), Hiroshima, Japan, 13 June 1998; Taylor & Francis: Oxfordshire, UK, 1999; p. 257. [Google Scholar]
  71. Zhang, M.; Tam, C.; Leow, M. Effect of water-to-cementitious materials ratio and silica fume on the autogenous shrinkage of concrete. Cem. Concr. Res. 2003, 33, 1687–1694. [Google Scholar] [CrossRef]
Figure 1. Particle size distribution of the LF and cement.
Buildings 11 00366 g001
Figure 2. (a) Chemical shrinkage specimens. (b) Chemical shrinkage test set-up.
Buildings 11 00366 g002
Figure 3. Dial gauge.
Buildings 11 00366 g003
Figure 4. Autogenous and drying shrinkage specimens.
Buildings 11 00366 g004
Figure 5. Expansion specimens.
Buildings 11 00366 g005
Figure 6. Chemical shrinkage of pastes with different percentages of LF over 90 days.
Buildings 11 00366 g006
Figure 7. Drying shrinkage of pastes with different percentages of LF over 90 days.
Buildings 11 00366 g007
Figure 8. Autogenous shrinkage of pastes with different percentages of LF.
Buildings 11 00366 g008
Figure 9. Expansion of pastes with different percentages of LF.
Buildings 11 00366 g009
Figure 10. Length change of pastes with 0% LF.
Buildings 11 00366 g010
Figure 11. Length change of pastes with 5% LF.
Buildings 11 00366 g011
Figure 12. Length change of pastes with 10% LF.
Buildings 11 00366 g012
Figure 13. Length change of pastes with 15% LF.
Buildings 11 00366 g013
Figure 14. Length change of pastes with 20% LF.
Buildings 11 00366 g014
Figure 15. Correlation between chemical shrinkage and autogenous shrinkage for pastes.
Buildings 11 00366 g015
Figure 16. Correlation between chemical shrinkage and drying shrinkage for pastes.
Buildings 11 00366 g016
Figure 17. Correlation between chemical shrinkage and expansion for pastes.
Buildings 11 00366 g017
Table 1. Chemical composition of cement and LF.
OxideSiO2AL2O3Fe2O3CaOMgOSO3Na2OK2OL.O.I
Cement %18.533.933.0661.781.742.920.180.476.3
LF %5.171.650.7750.98 00.210.180.1239.64
Table 2. Physical properties of the cement.
Initial Setting Time (min)232
Final Setting Time (min)282
Soundness (mm)0
Blaine (cm2/g)3998
Water Demand26.6
Table 3. Paste mix proportions.
Paste CodeCementLF 1W/B Ratio
P0%100.45
P5%0.950.050.45
P10%0.90.10.45
P15%0.850.150.45
P20%0.80.20.45
1 Limestone fines.
Publisher’s Note: MDPI stays neutral with regard to jurisdictional claims in published maps and institutional affiliations.

