Author Contributions
Conceptualization, T.G. and Z.Z.; methodology, T.G.; software, T.G.; validation, T.G., S.C. and L.Z.; formal analysis, S.C.; investigation, L.Z.; resources, L.Z.; data curation, T.G.; writing—original draft preparation, T.G.; writing—review and editing, T.G.; visualization, T.G.; supervision, Z.Z.; project administration, T.G.; funding acquisition, Z.Z. All authors have read and agreed to the published version of the manuscript.
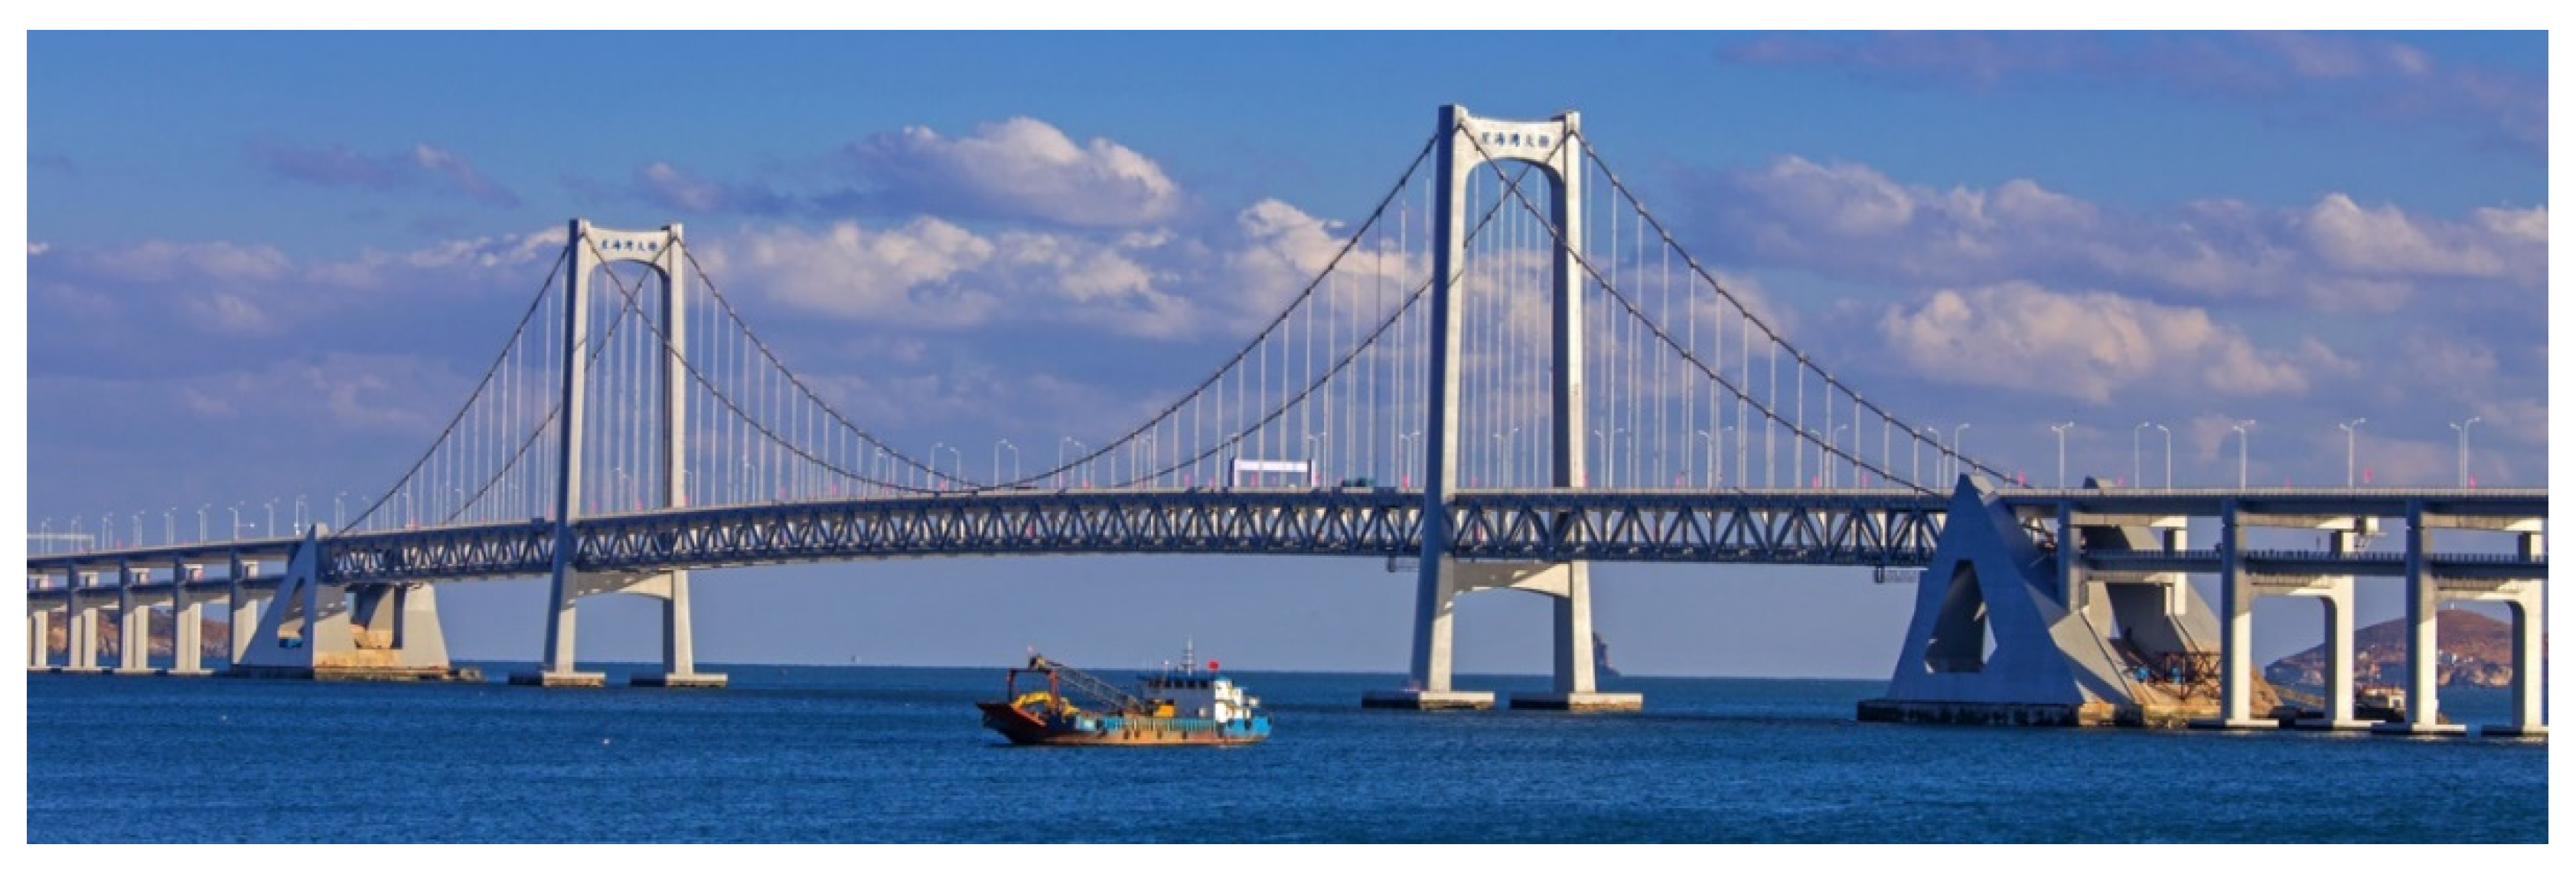
Figure 1.
Dalian Xinghai Bay Sea-crossing Bridge.
Figure 1.
Dalian Xinghai Bay Sea-crossing Bridge.
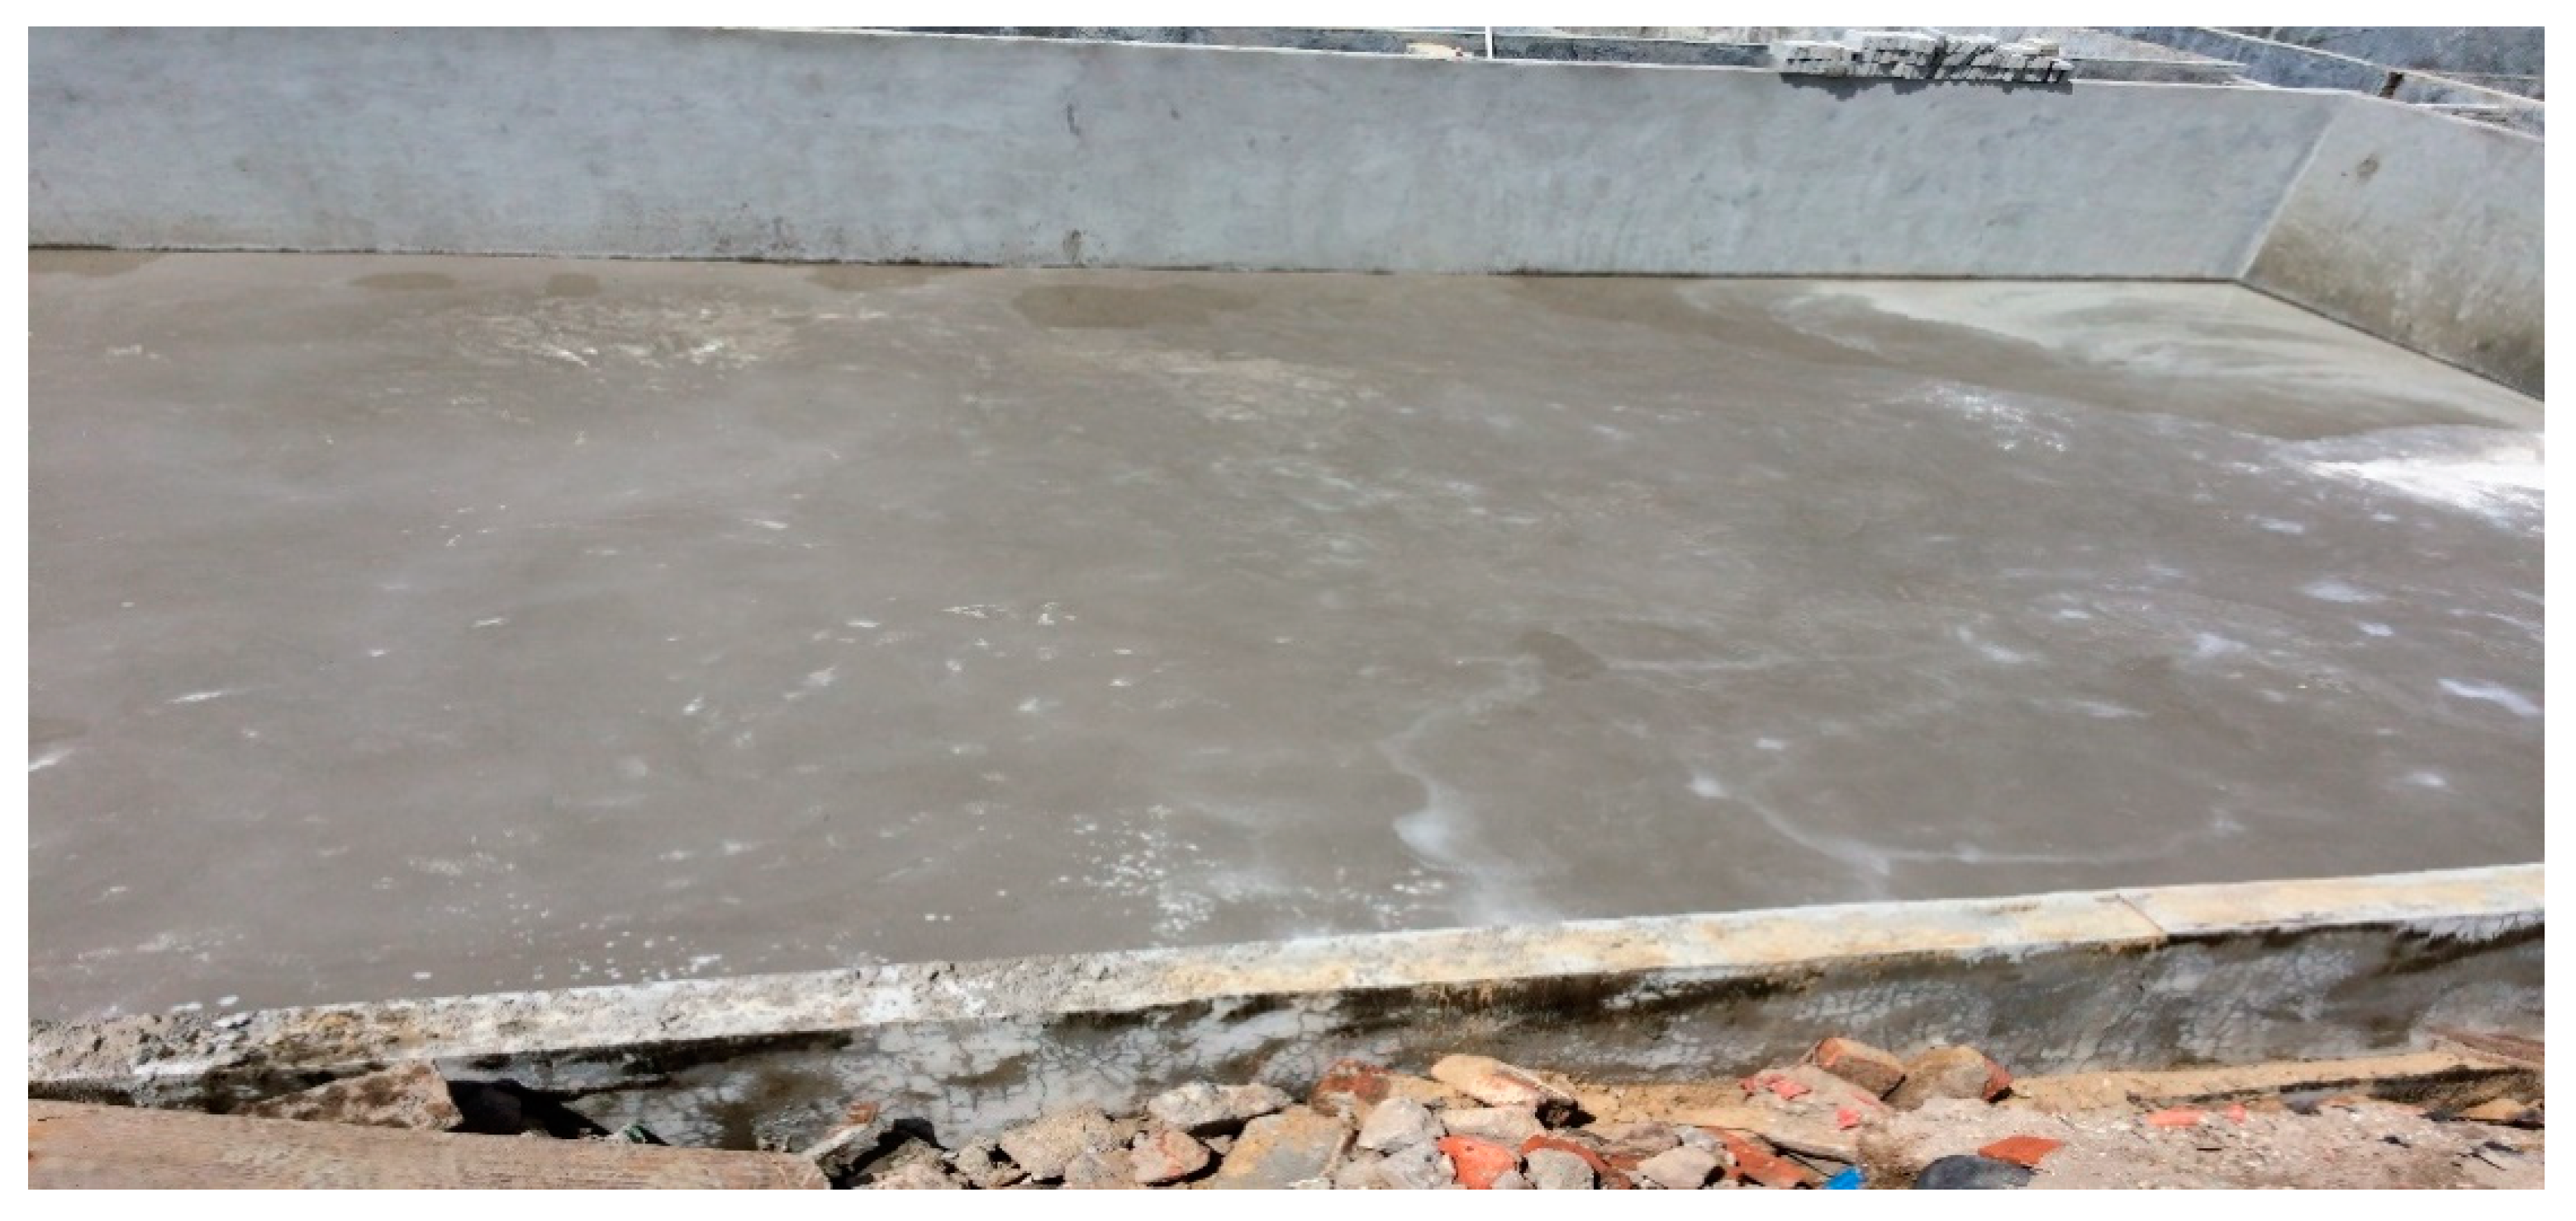
Figure 2.
The site of grouting bed.
Figure 2.
The site of grouting bed.
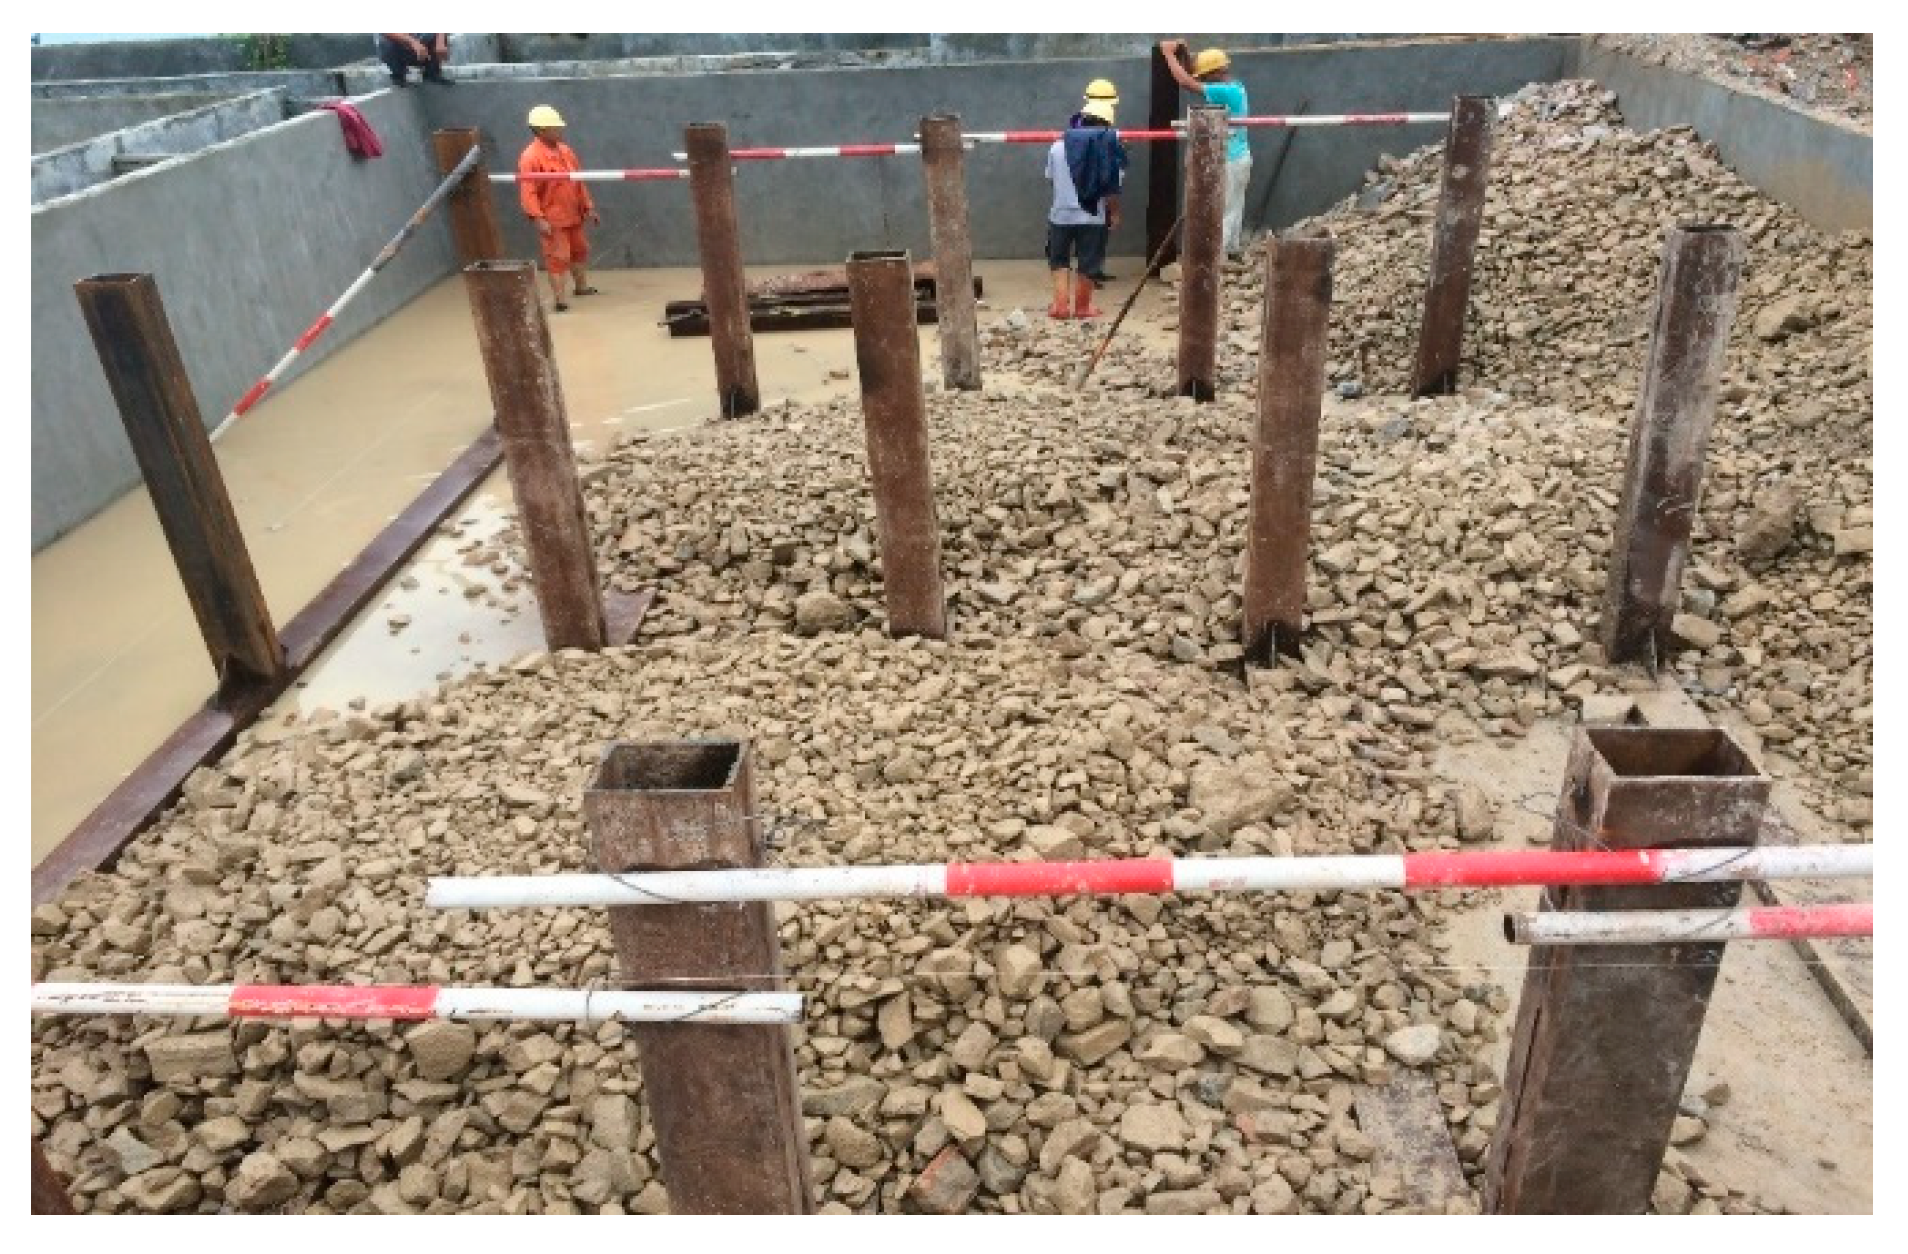
Figure 3.
The pre-placed reaction frame.
Figure 3.
The pre-placed reaction frame.
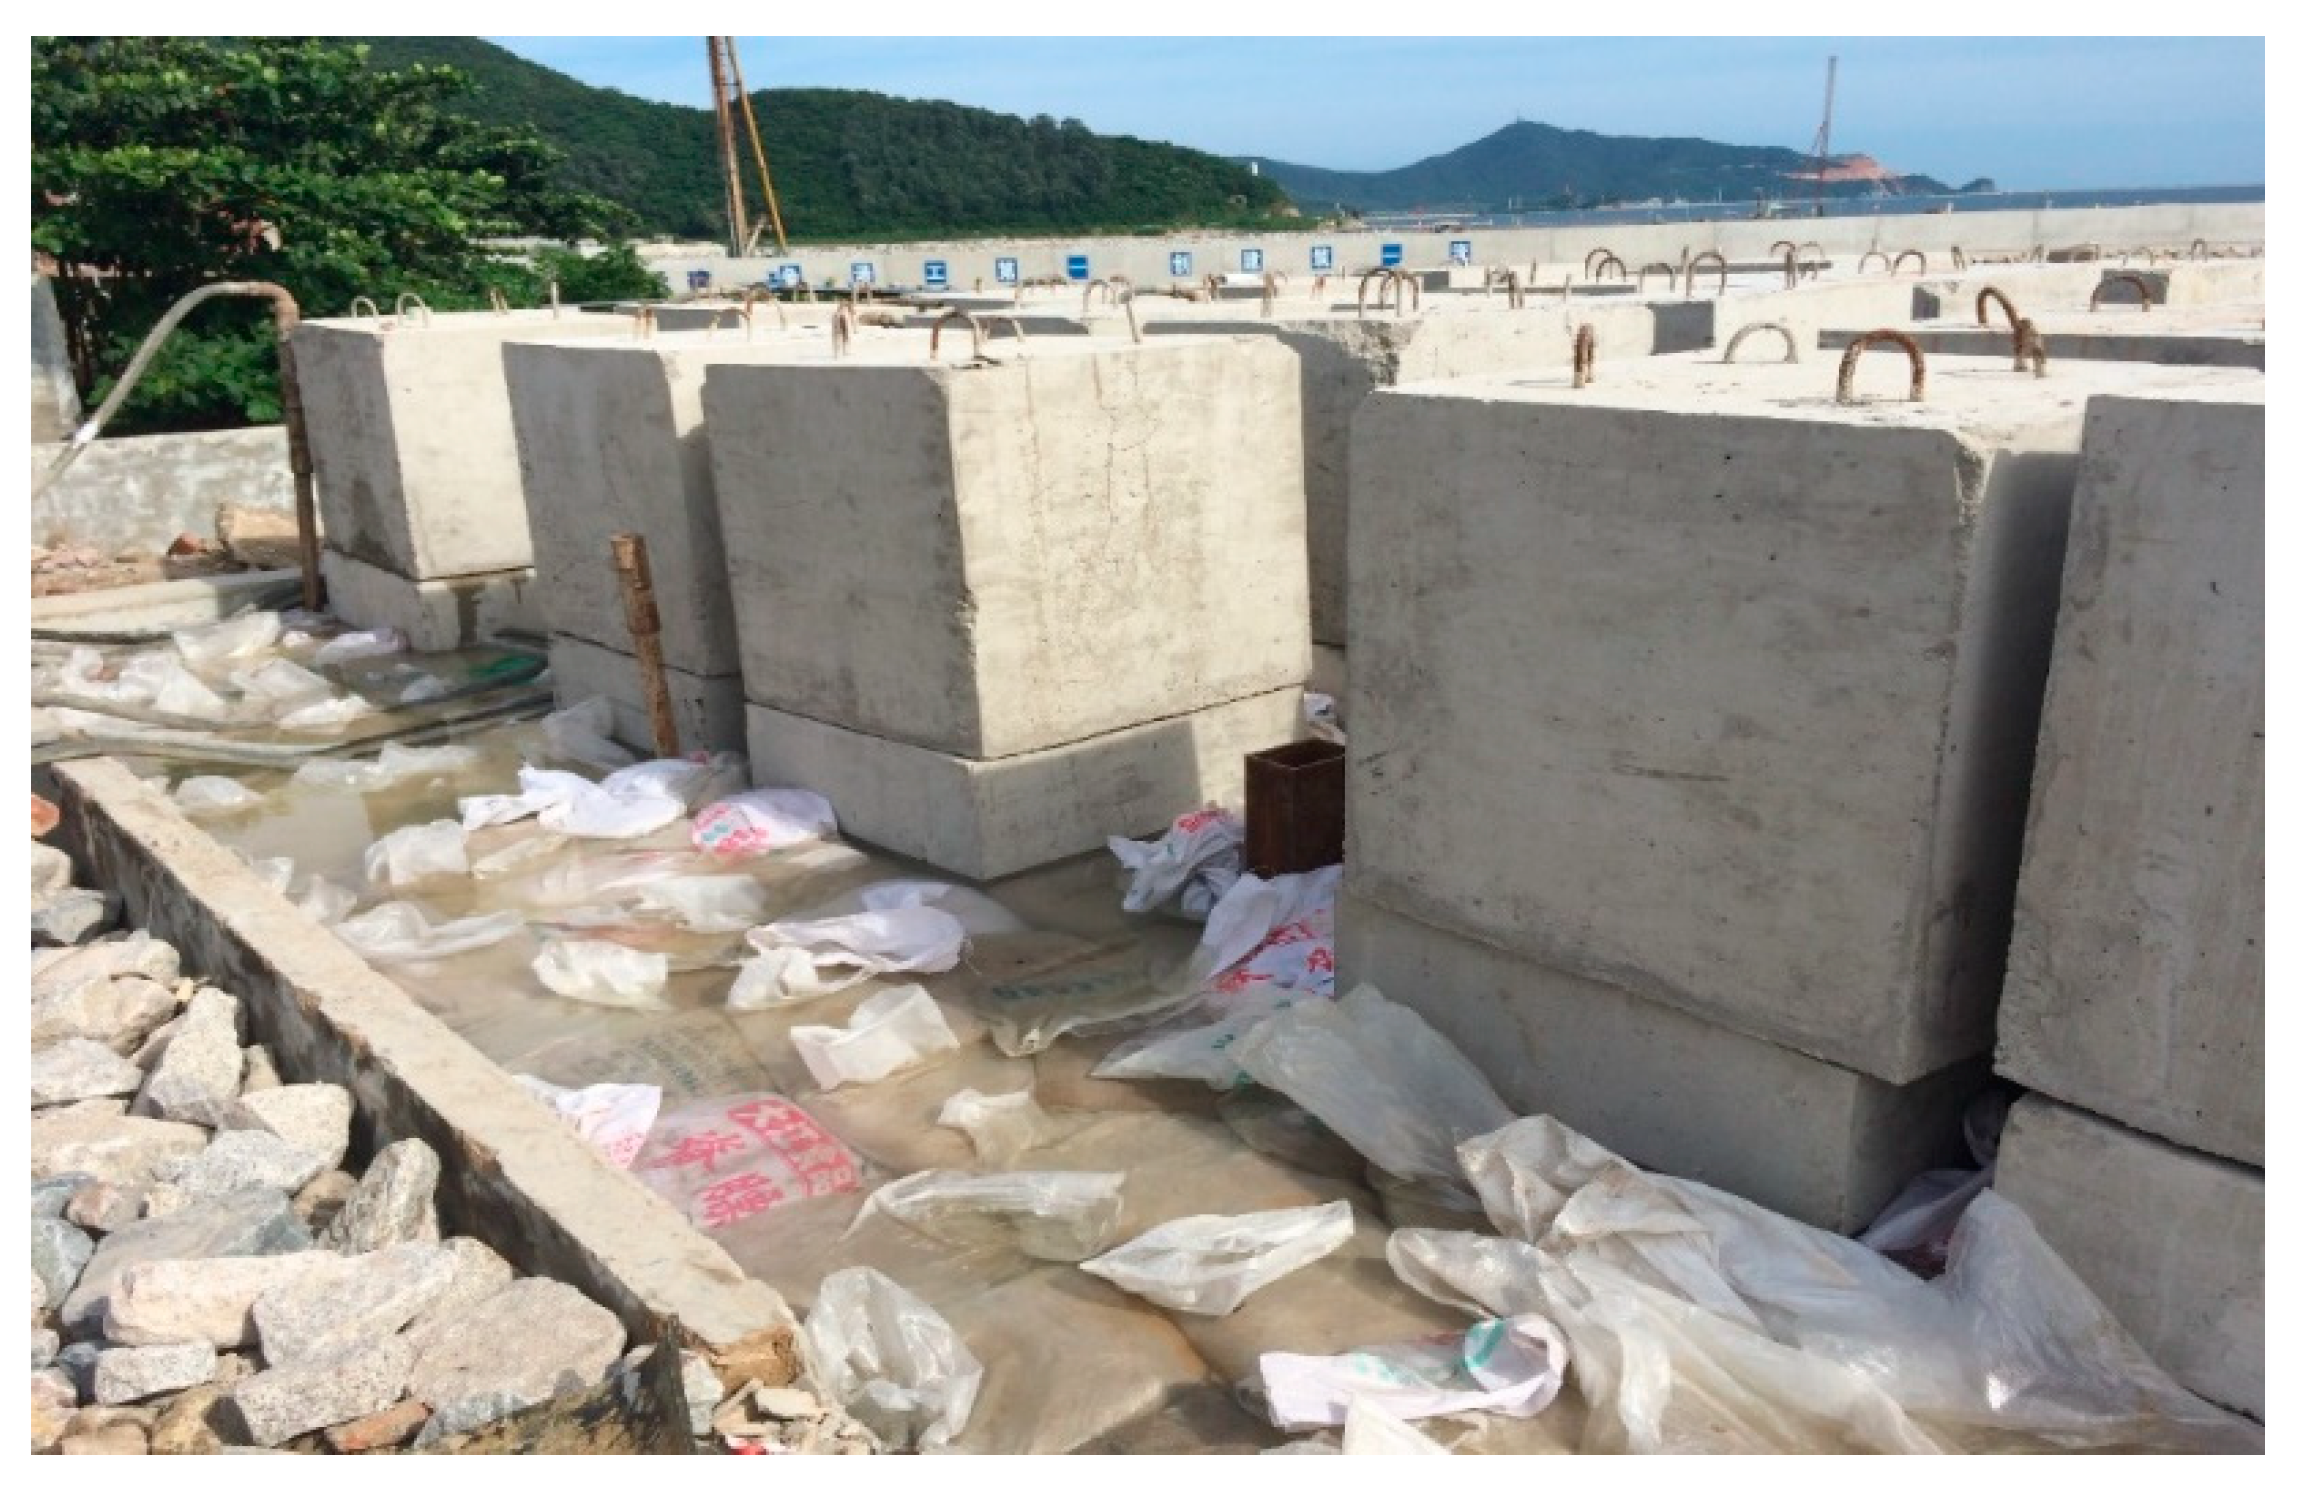
Figure 4.
Layout of concrete test blocks.
Figure 4.
Layout of concrete test blocks.
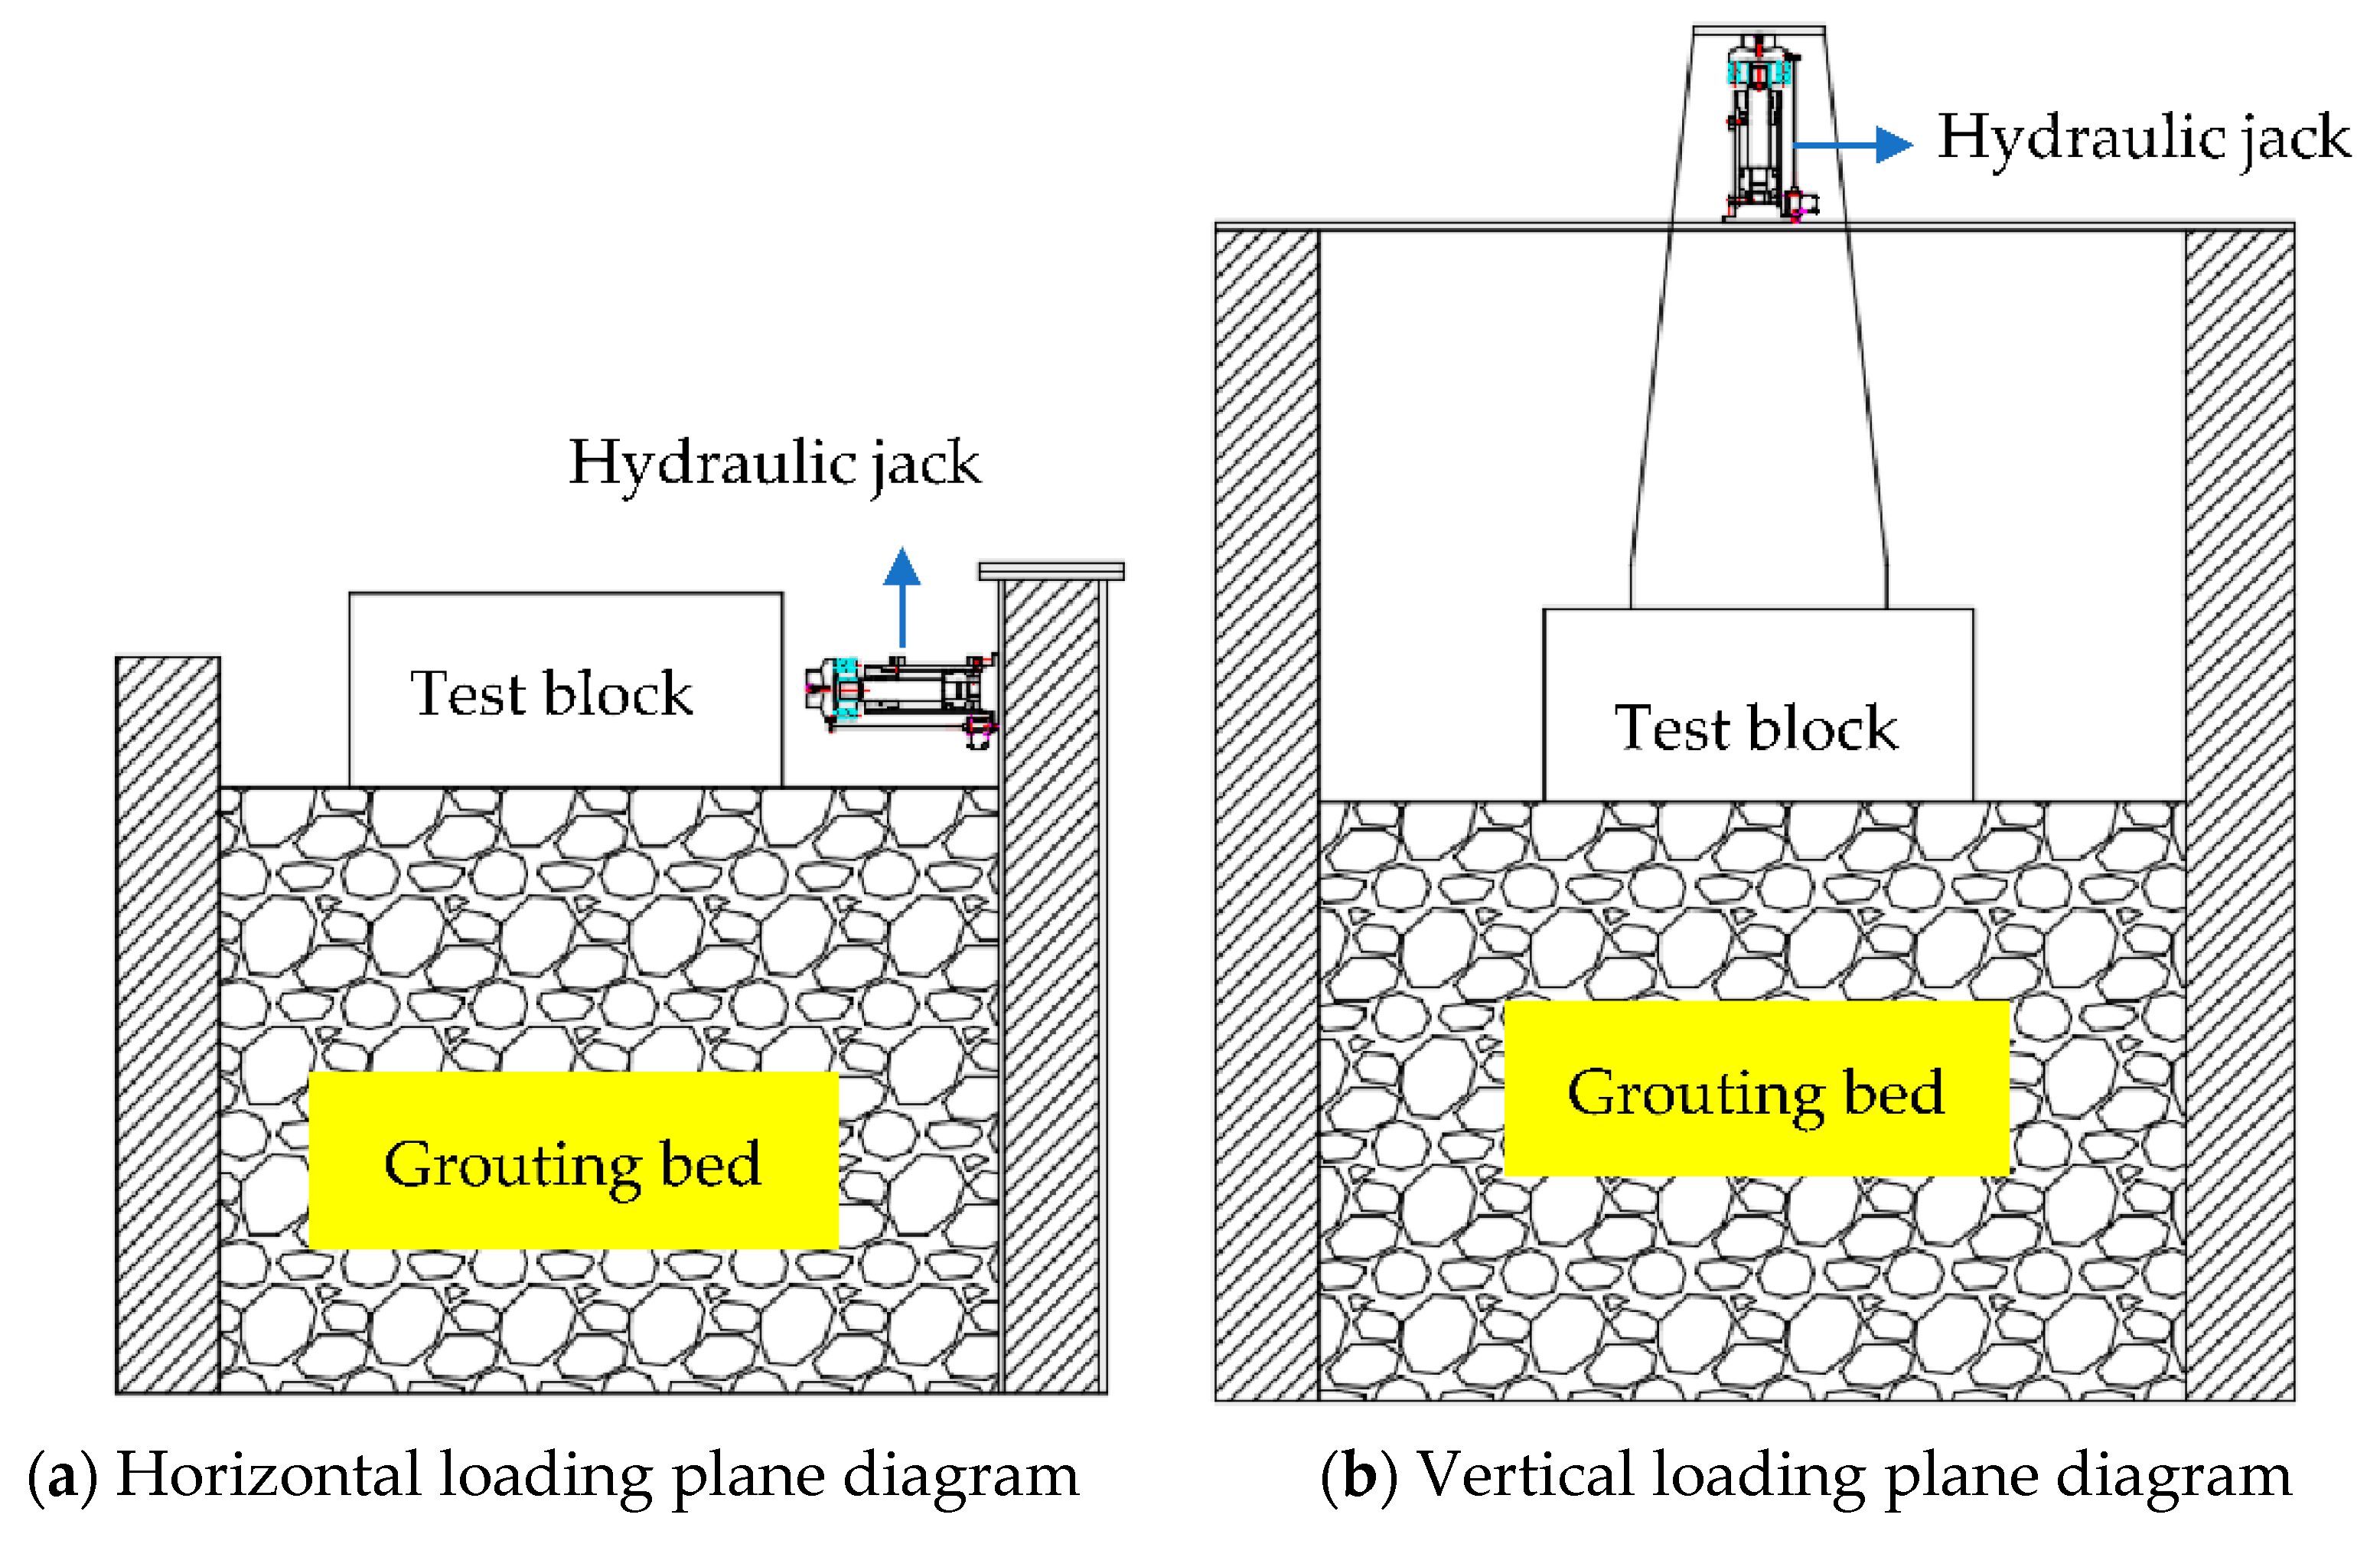
Figure 5.
Schematic diagram of the distribution position of the grouting bed, concrete test block, and loading system.
Figure 5.
Schematic diagram of the distribution position of the grouting bed, concrete test block, and loading system.
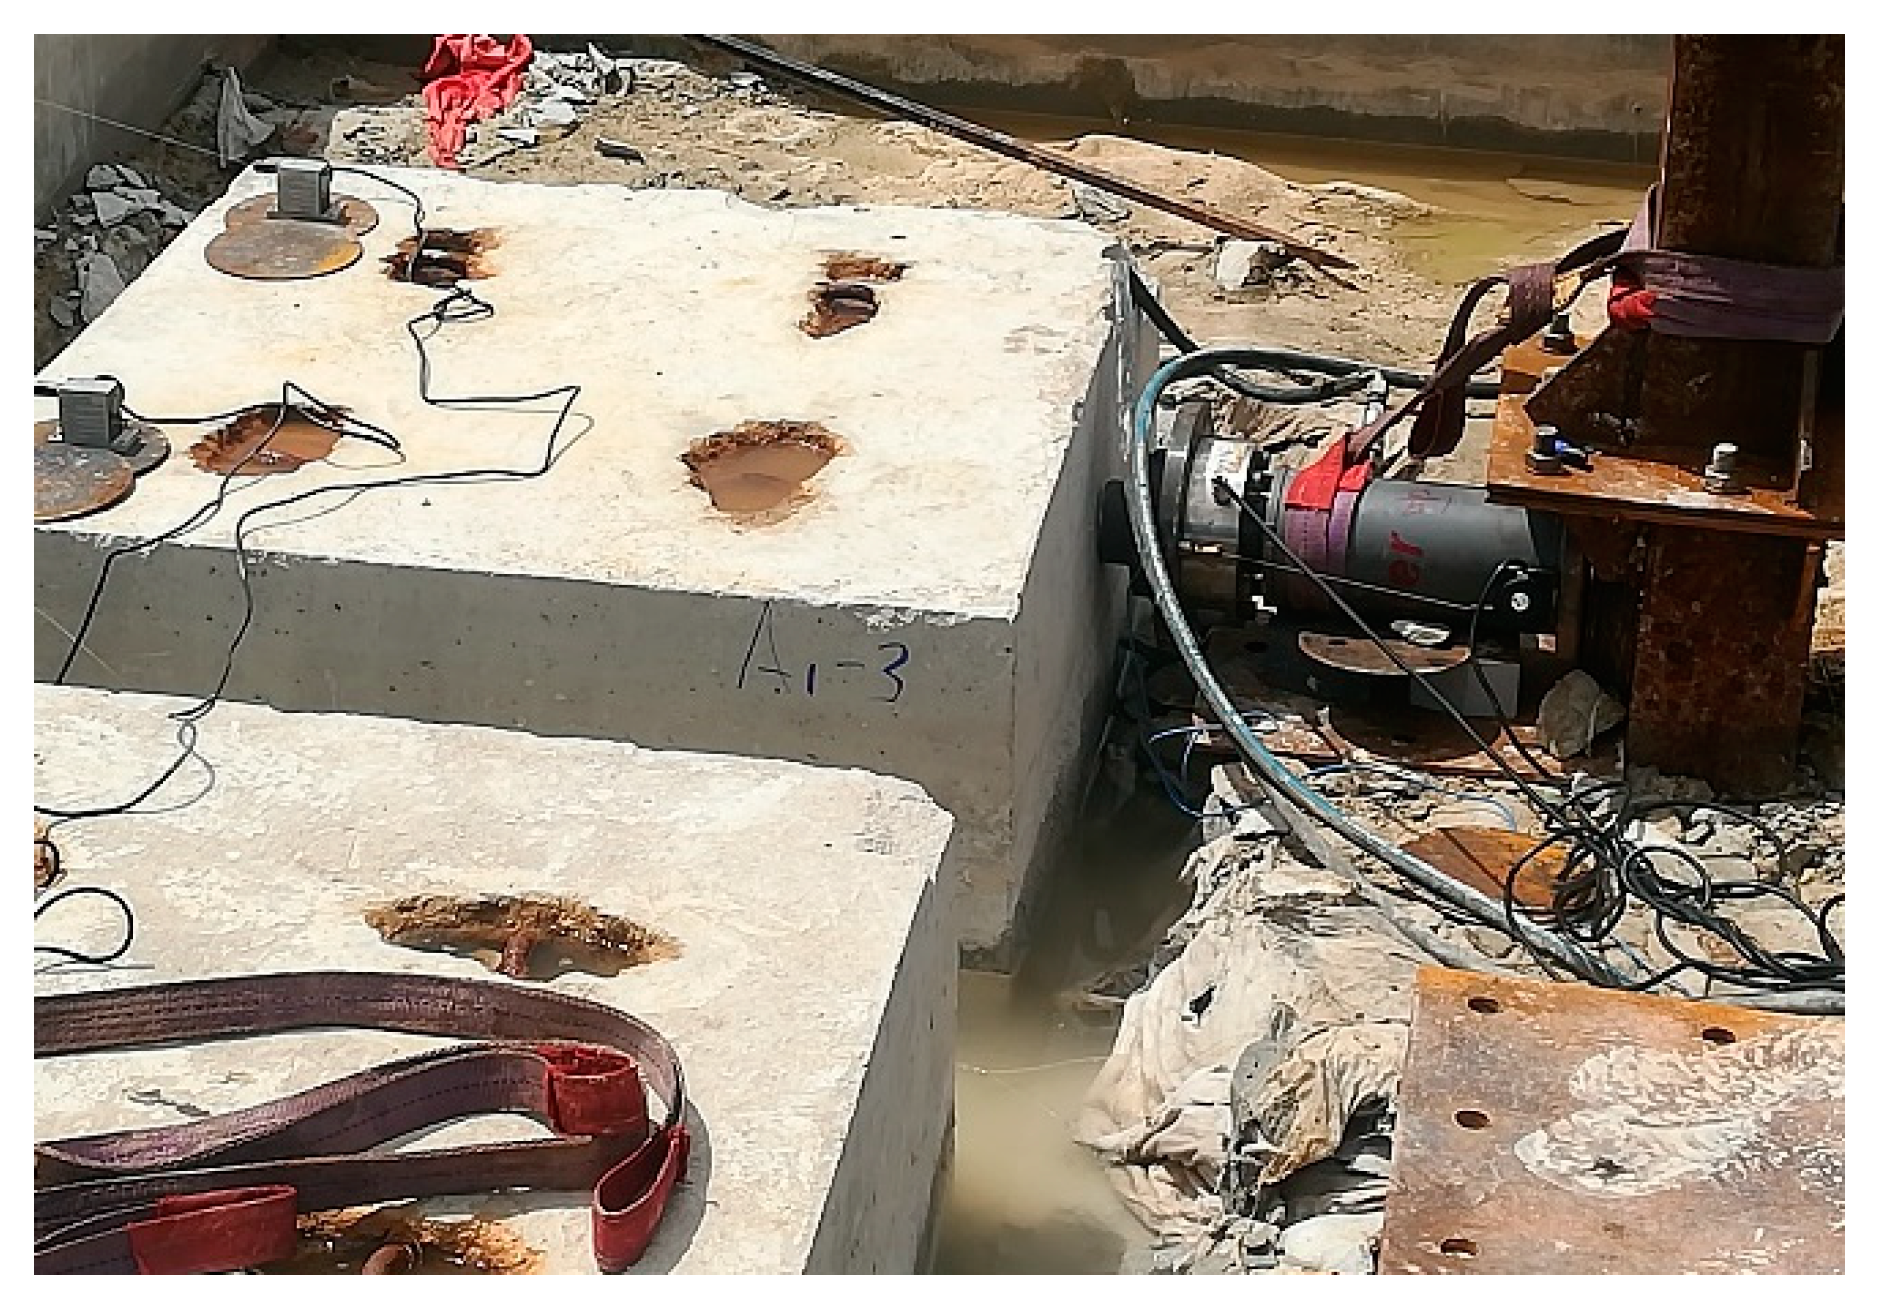
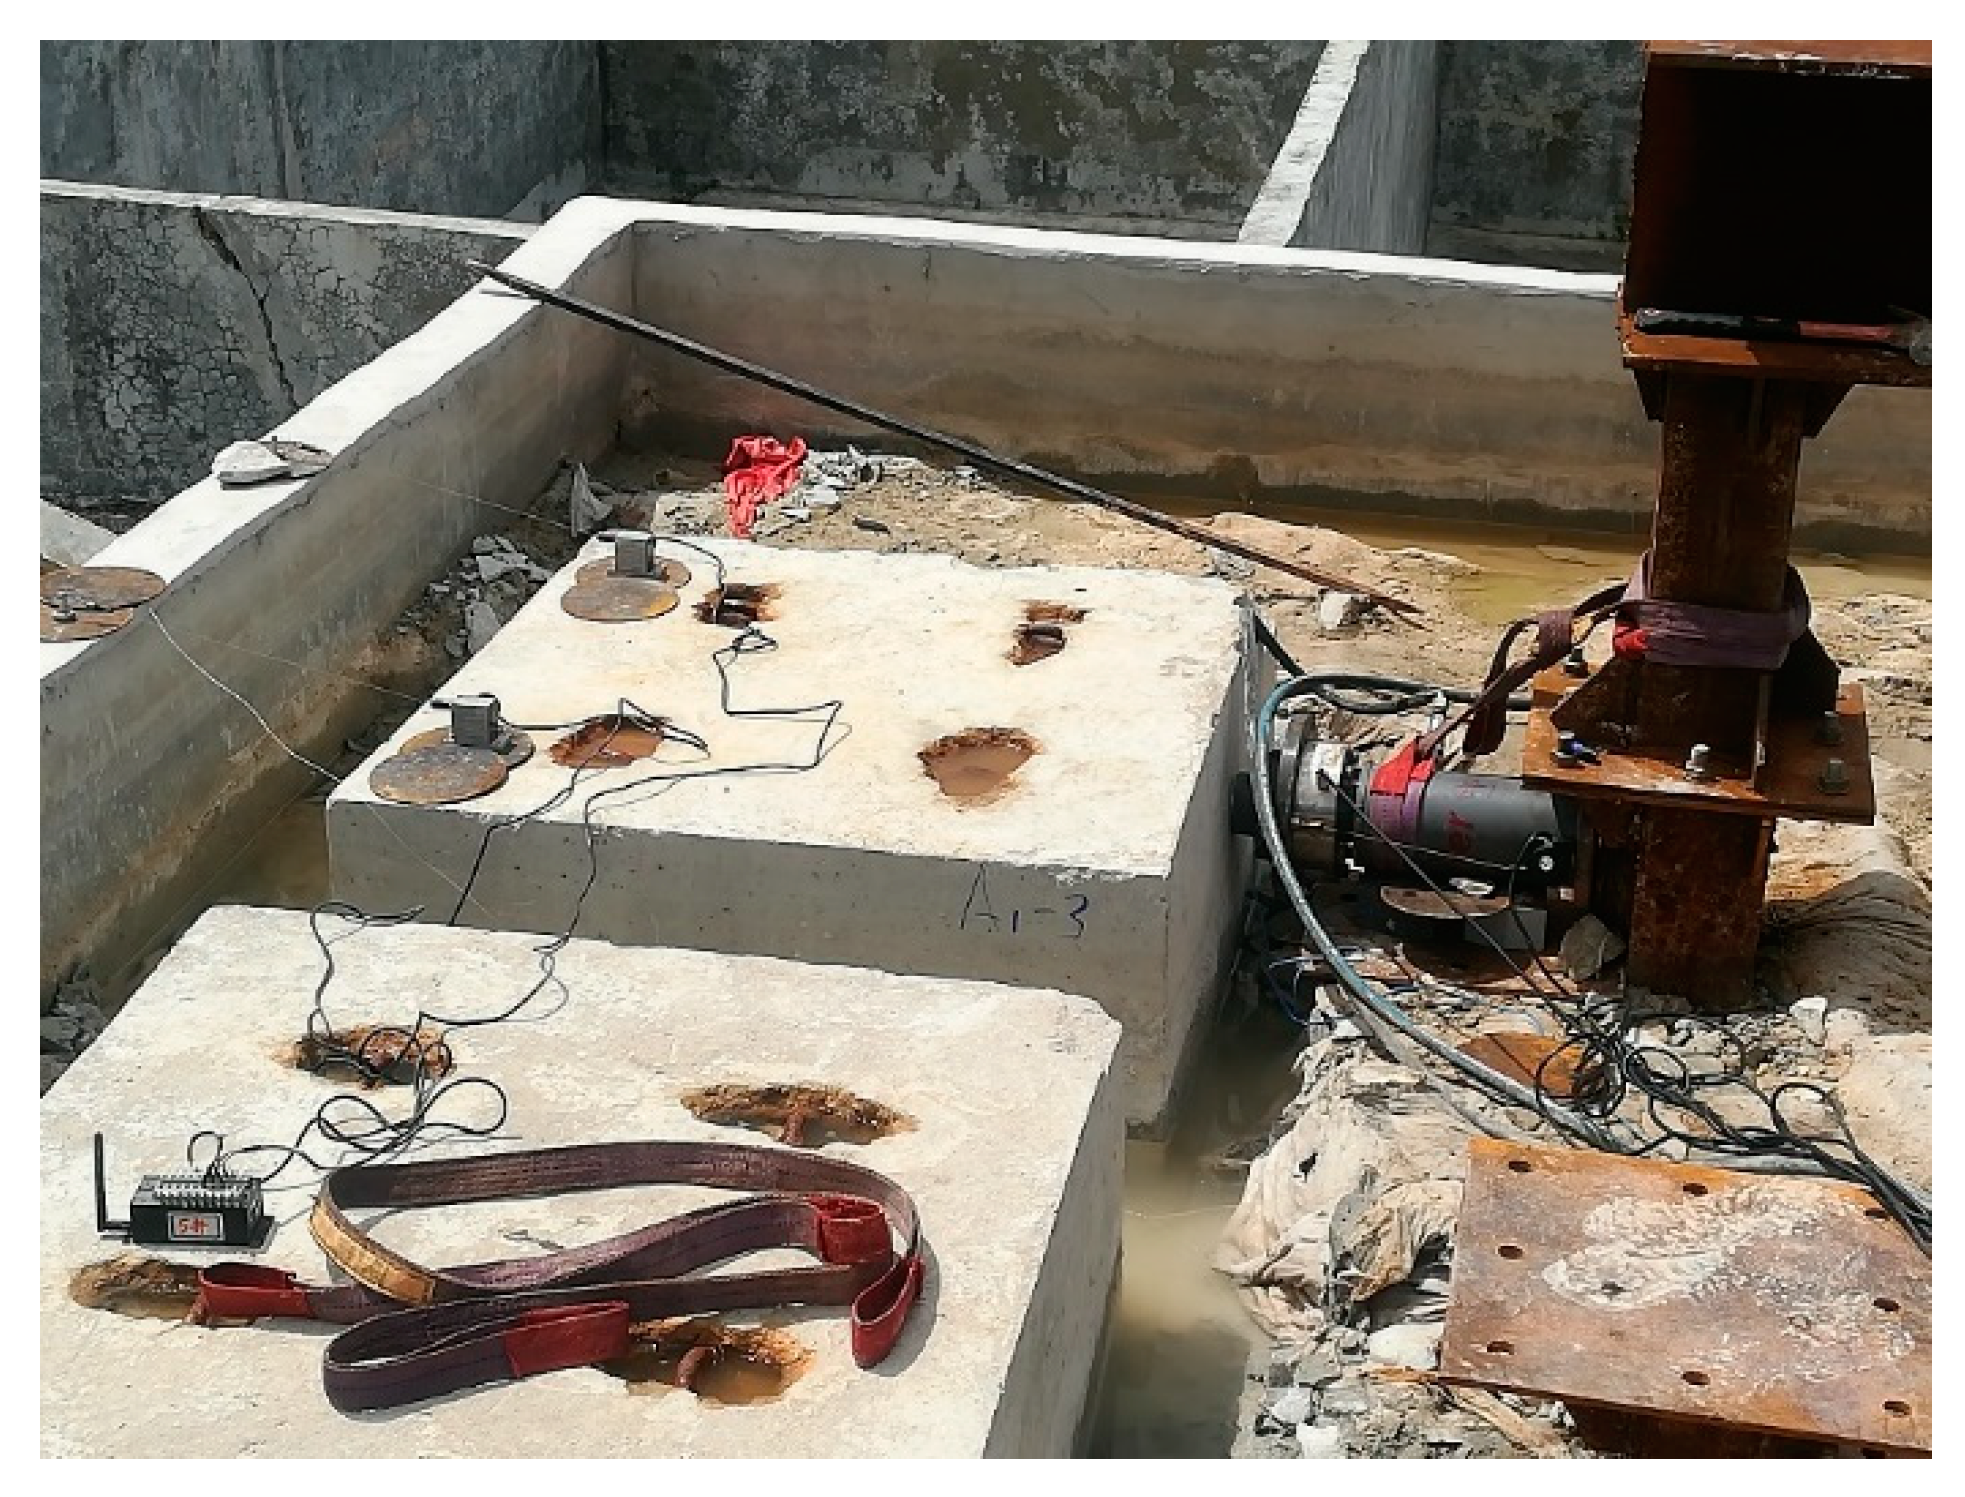
Figure 6.
Horizontal loading device for simulation test.
Figure 6.
Horizontal loading device for simulation test.
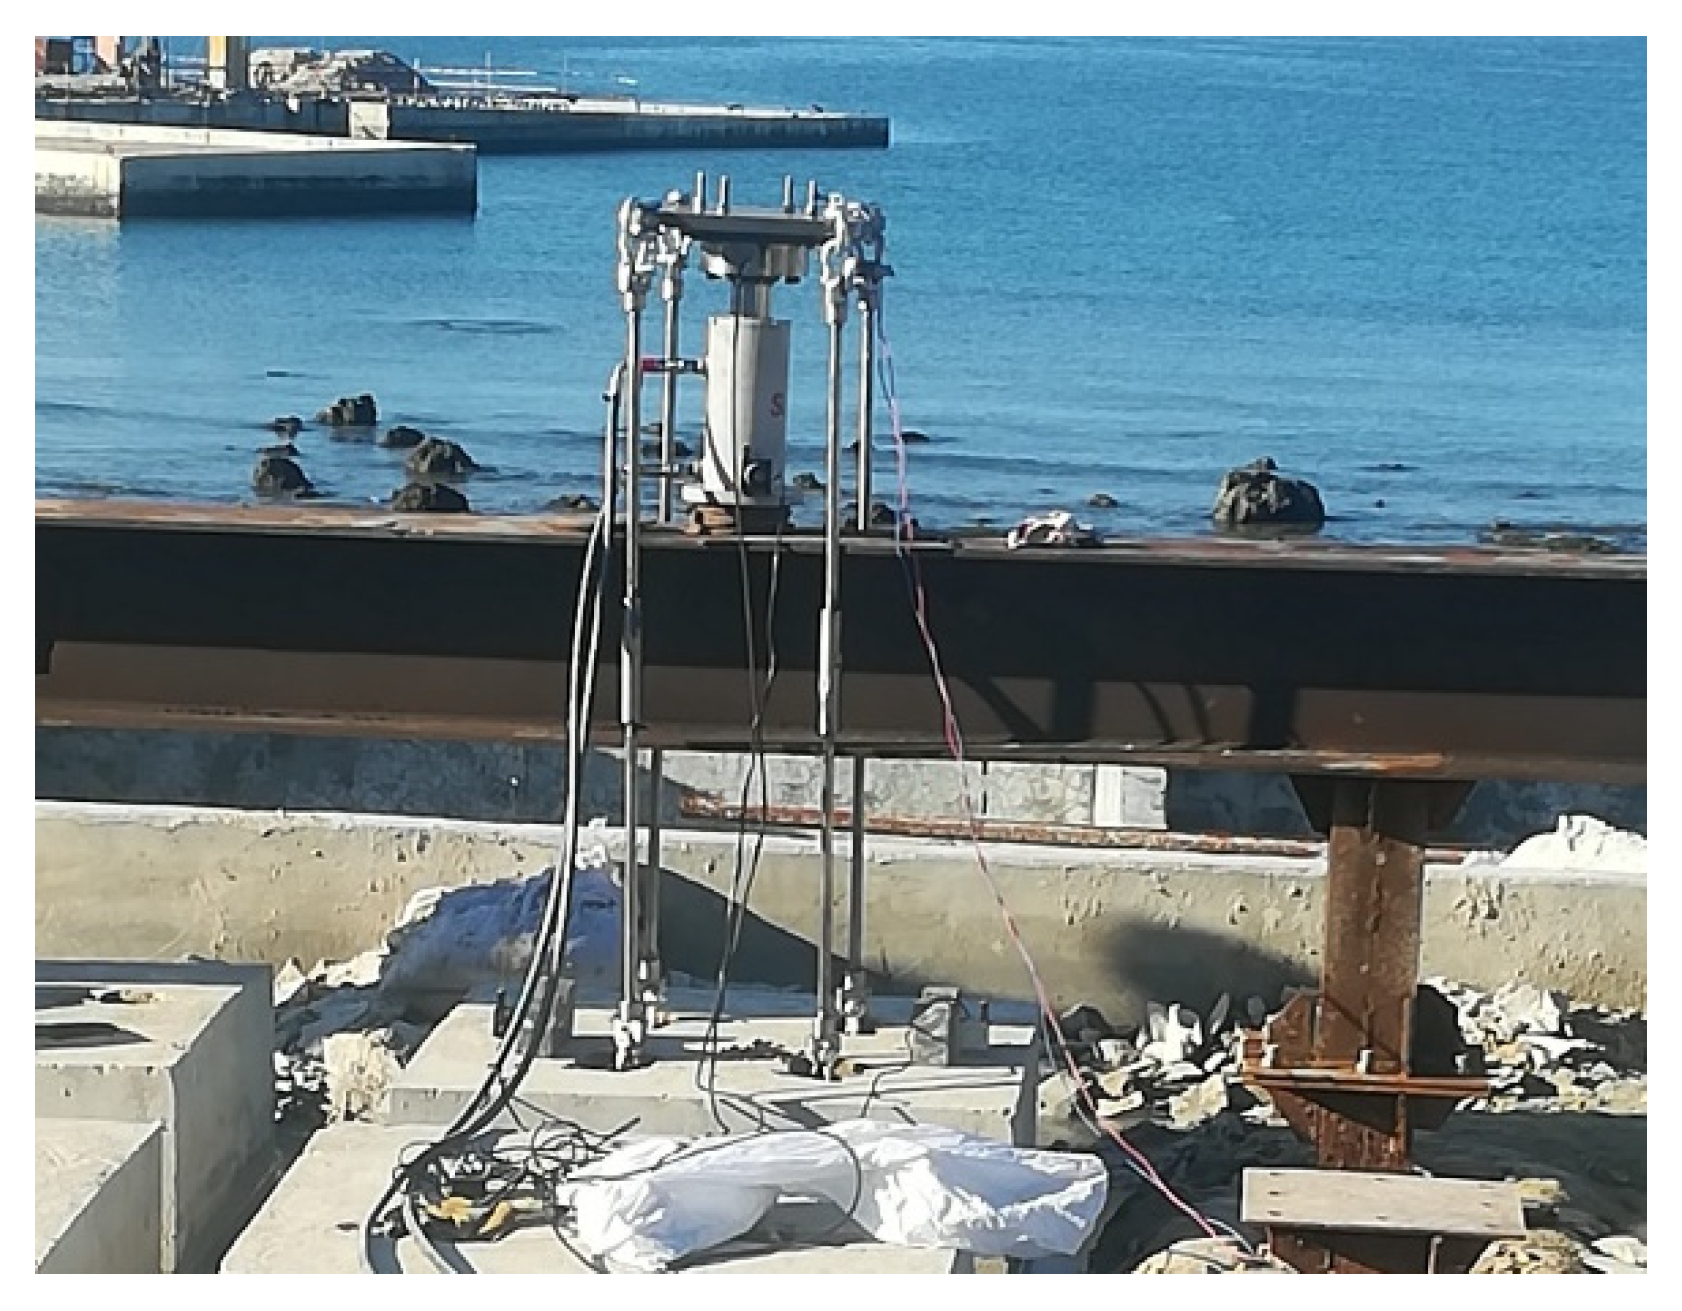
Figure 7.
Vertical loading device for simulation test.
Figure 7.
Vertical loading device for simulation test.
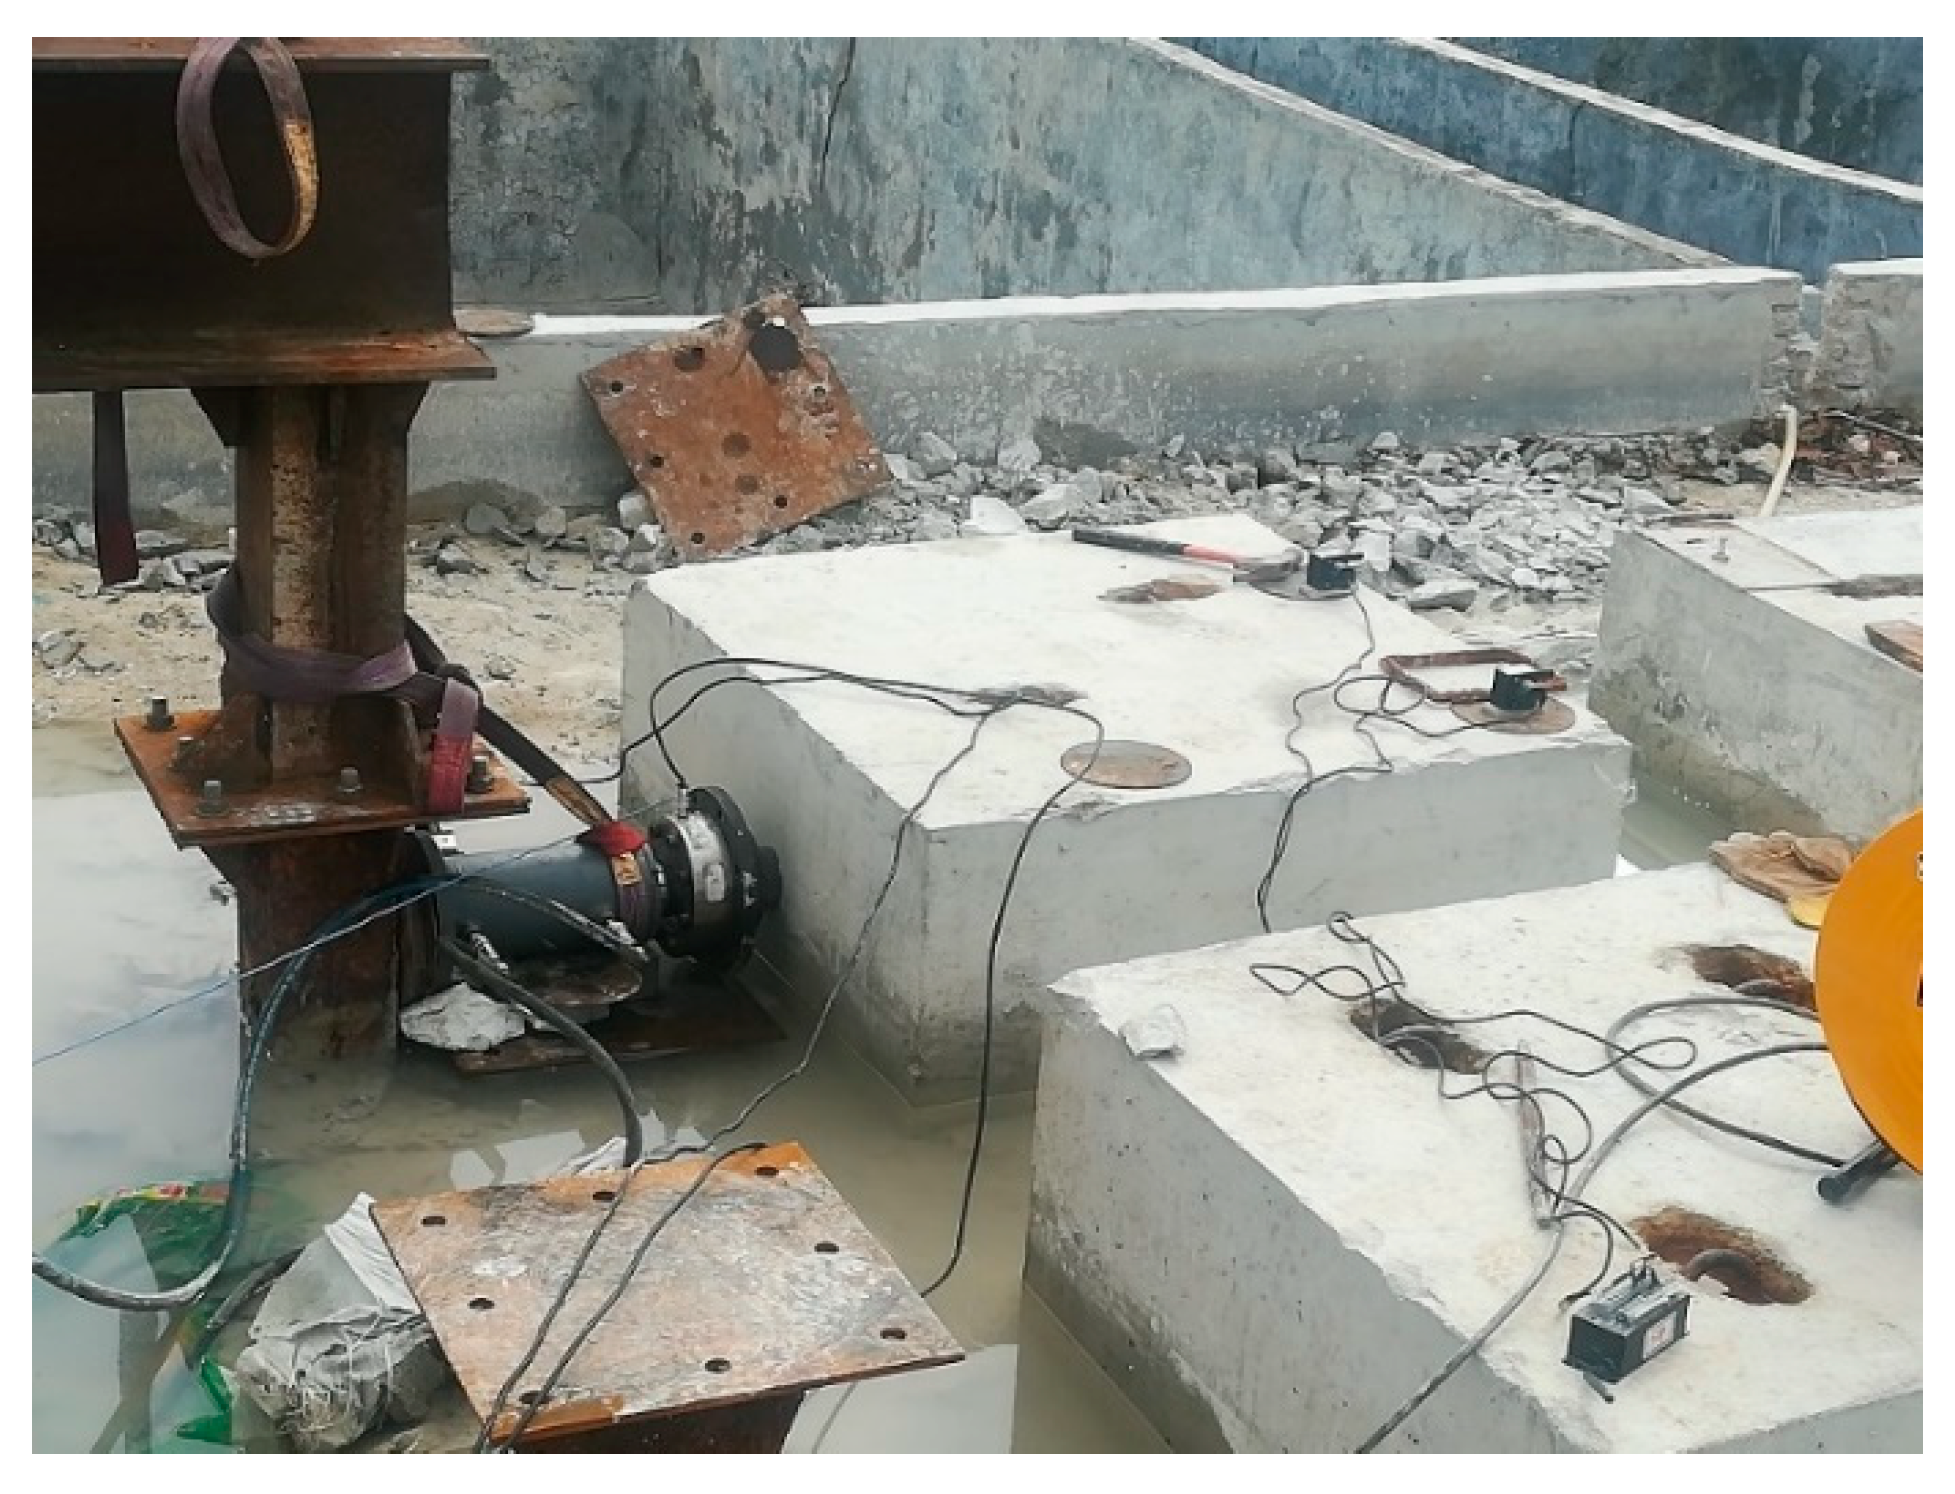
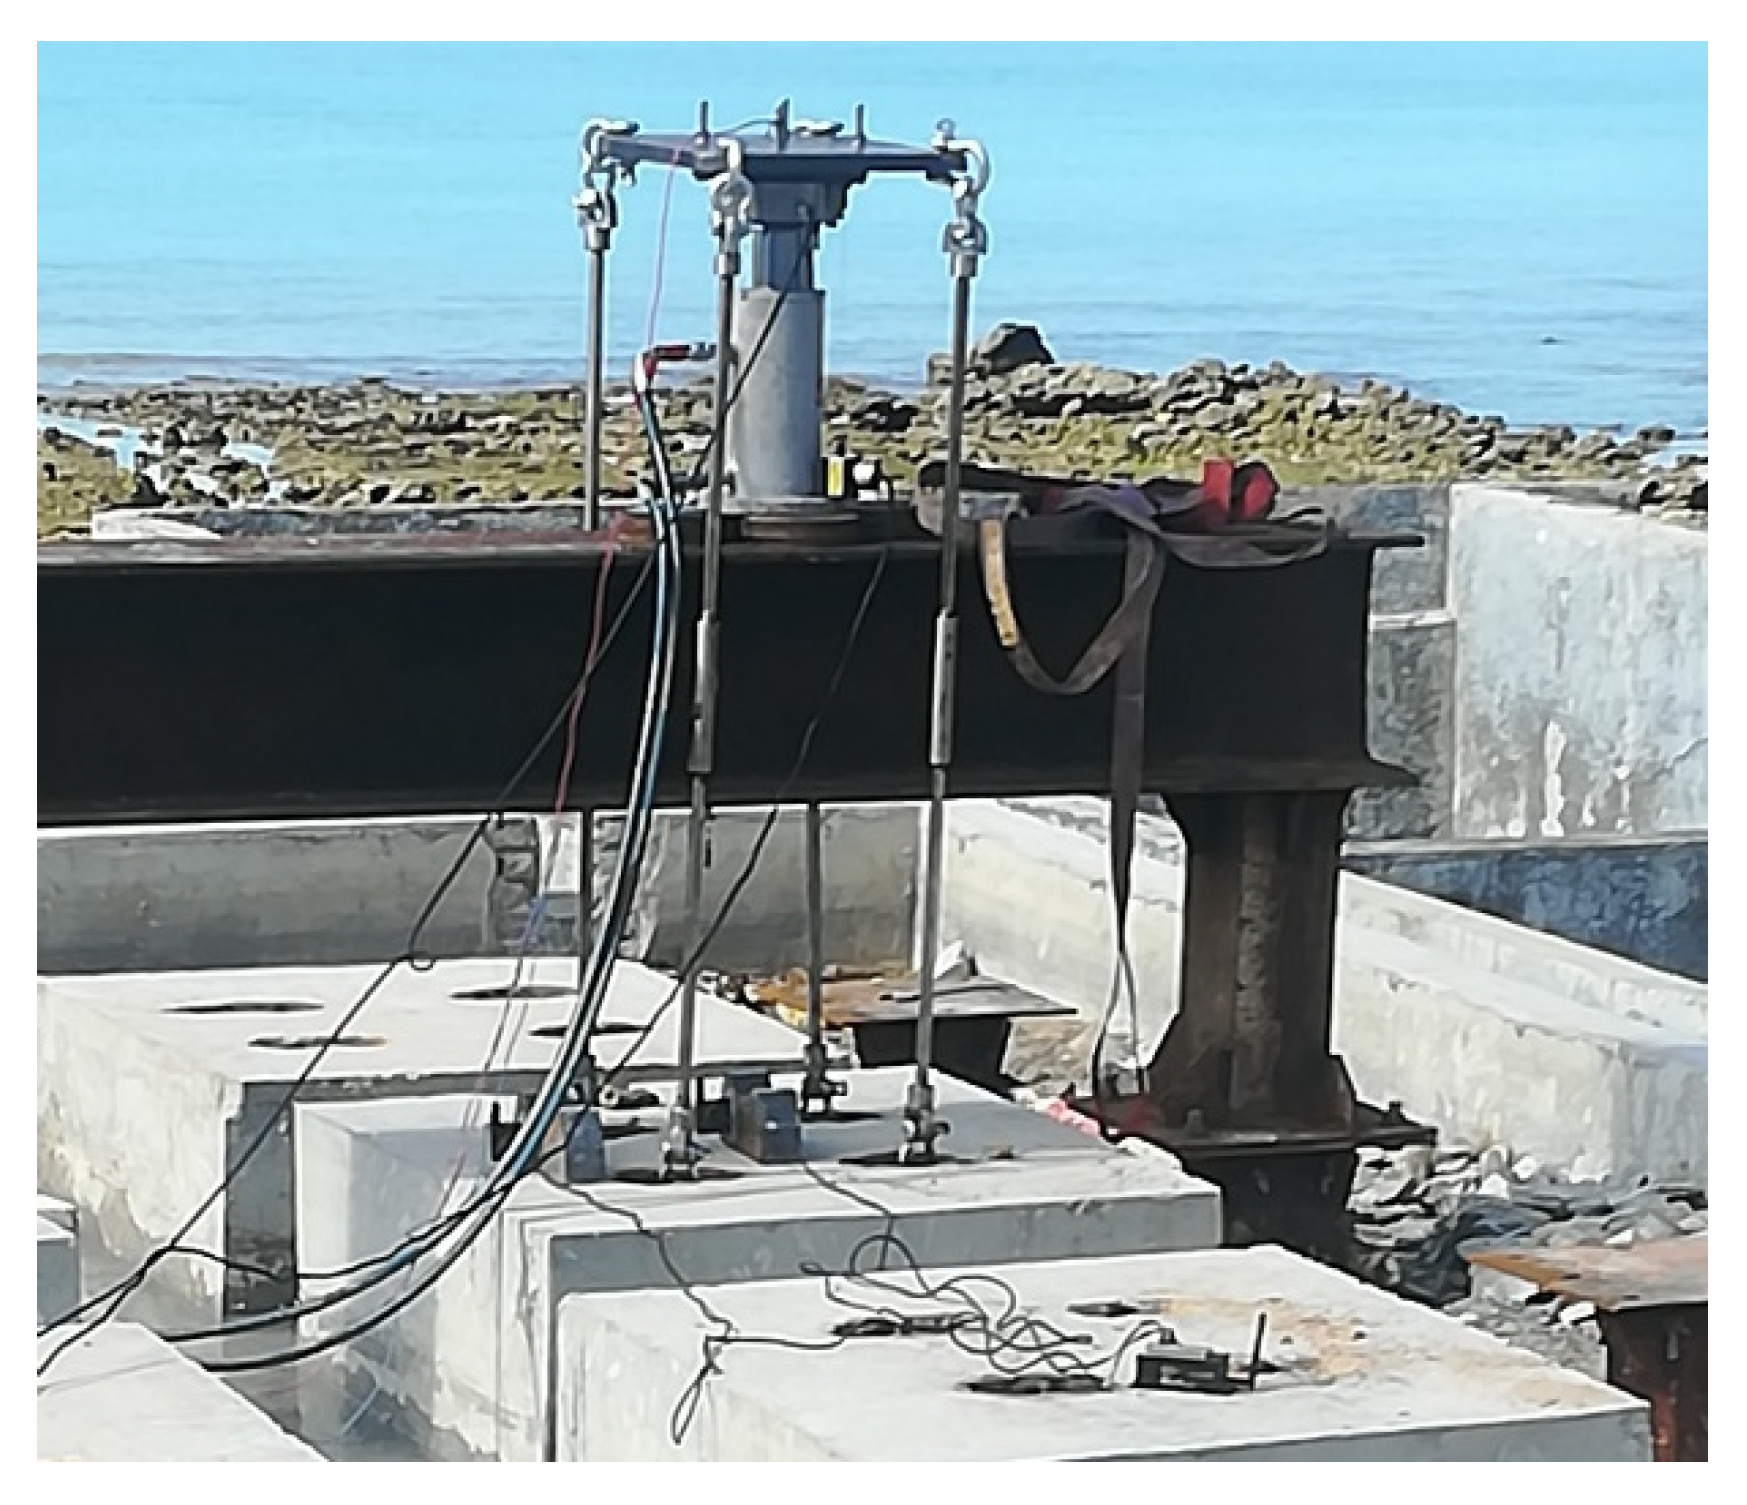
Figure 8.
Horizontal jack loading of Hc specimen.
Figure 8.
Horizontal jack loading of Hc specimen.
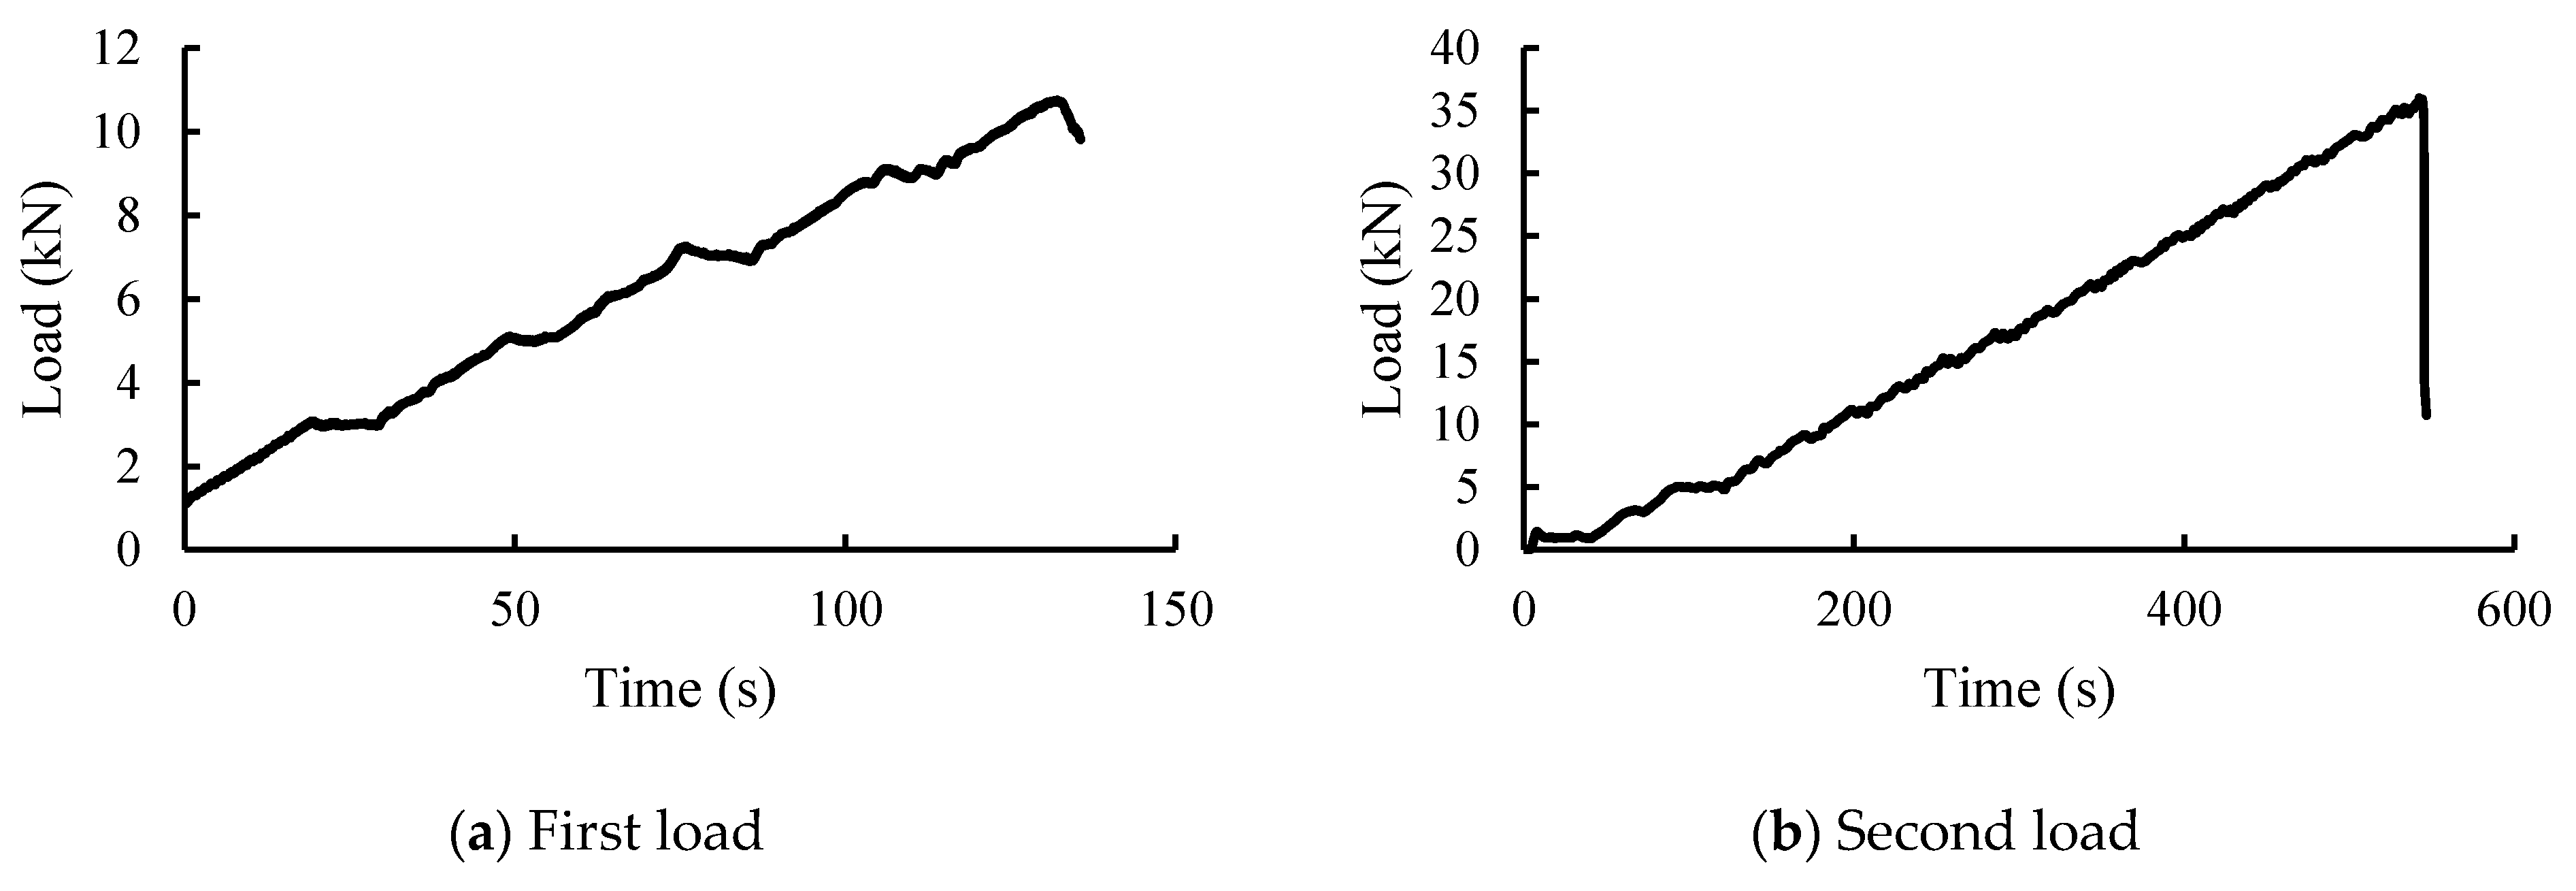
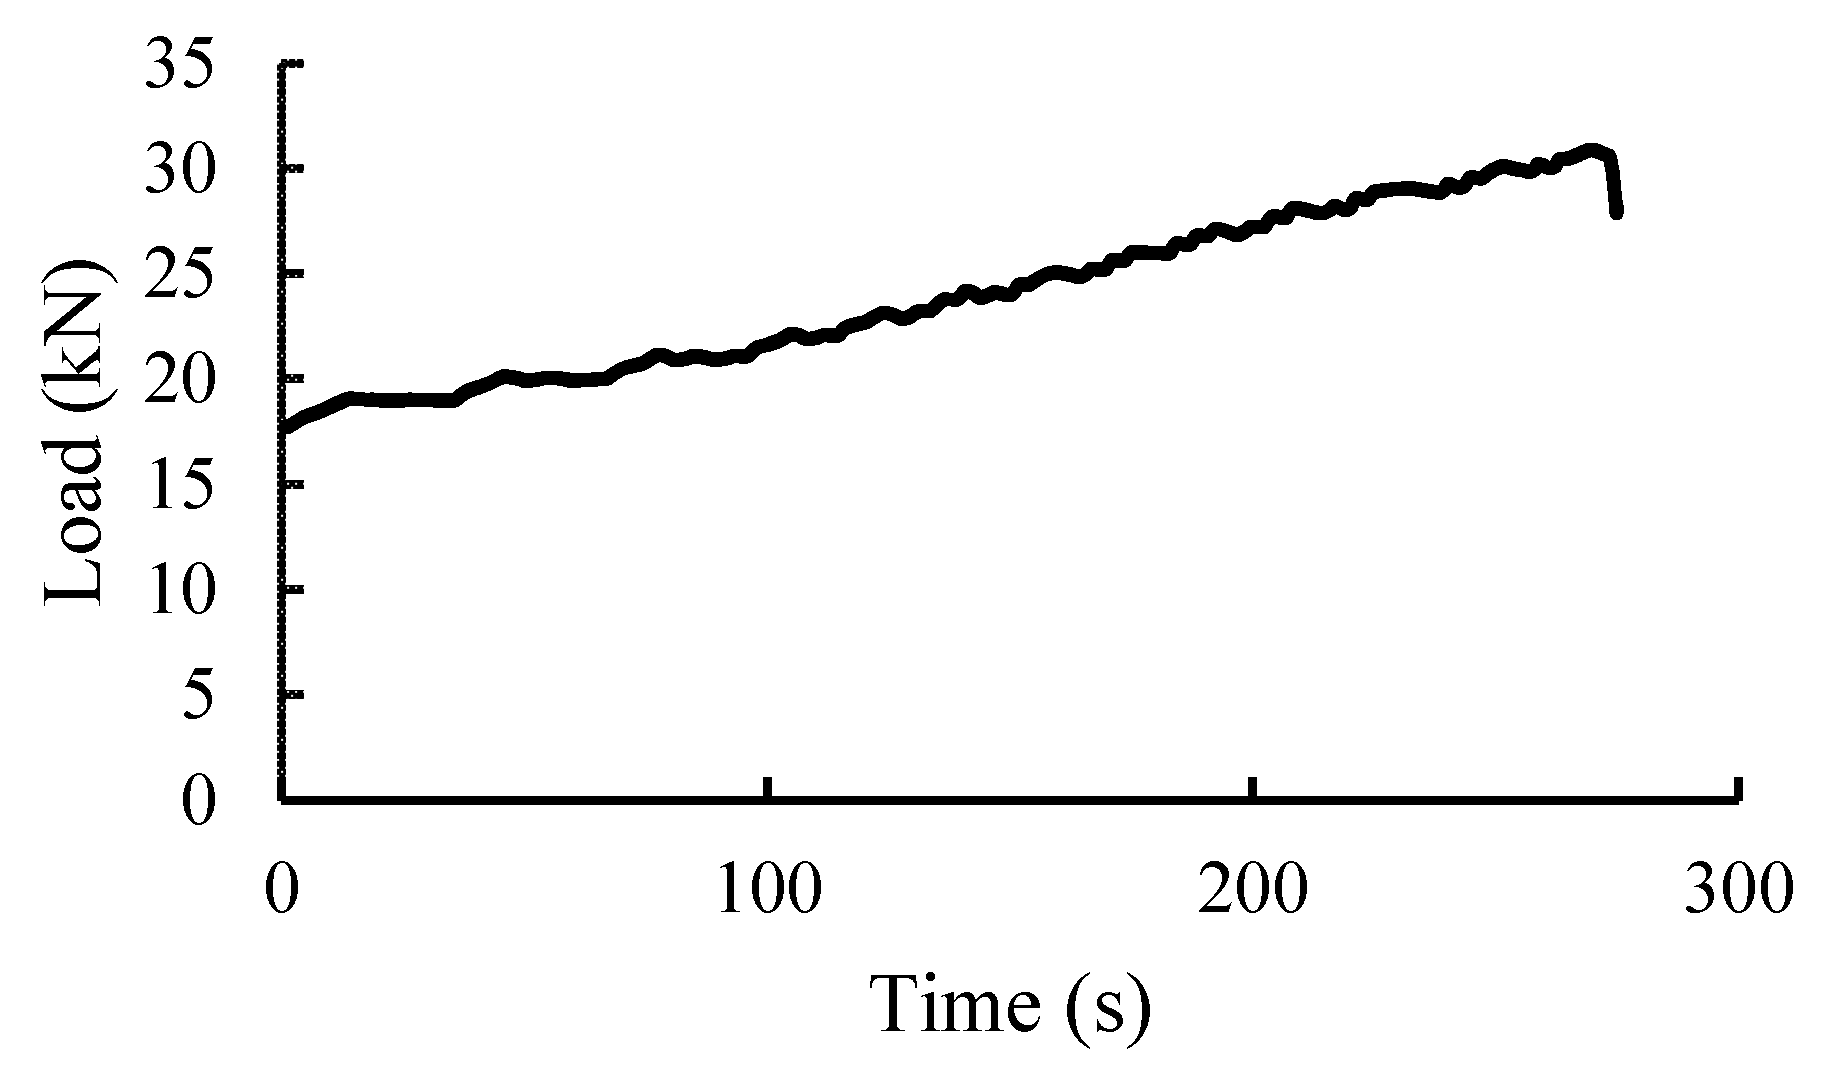
Figure 9.
Loading curve of horizontal jack of Hc specimen.
Figure 9.
Loading curve of horizontal jack of Hc specimen.
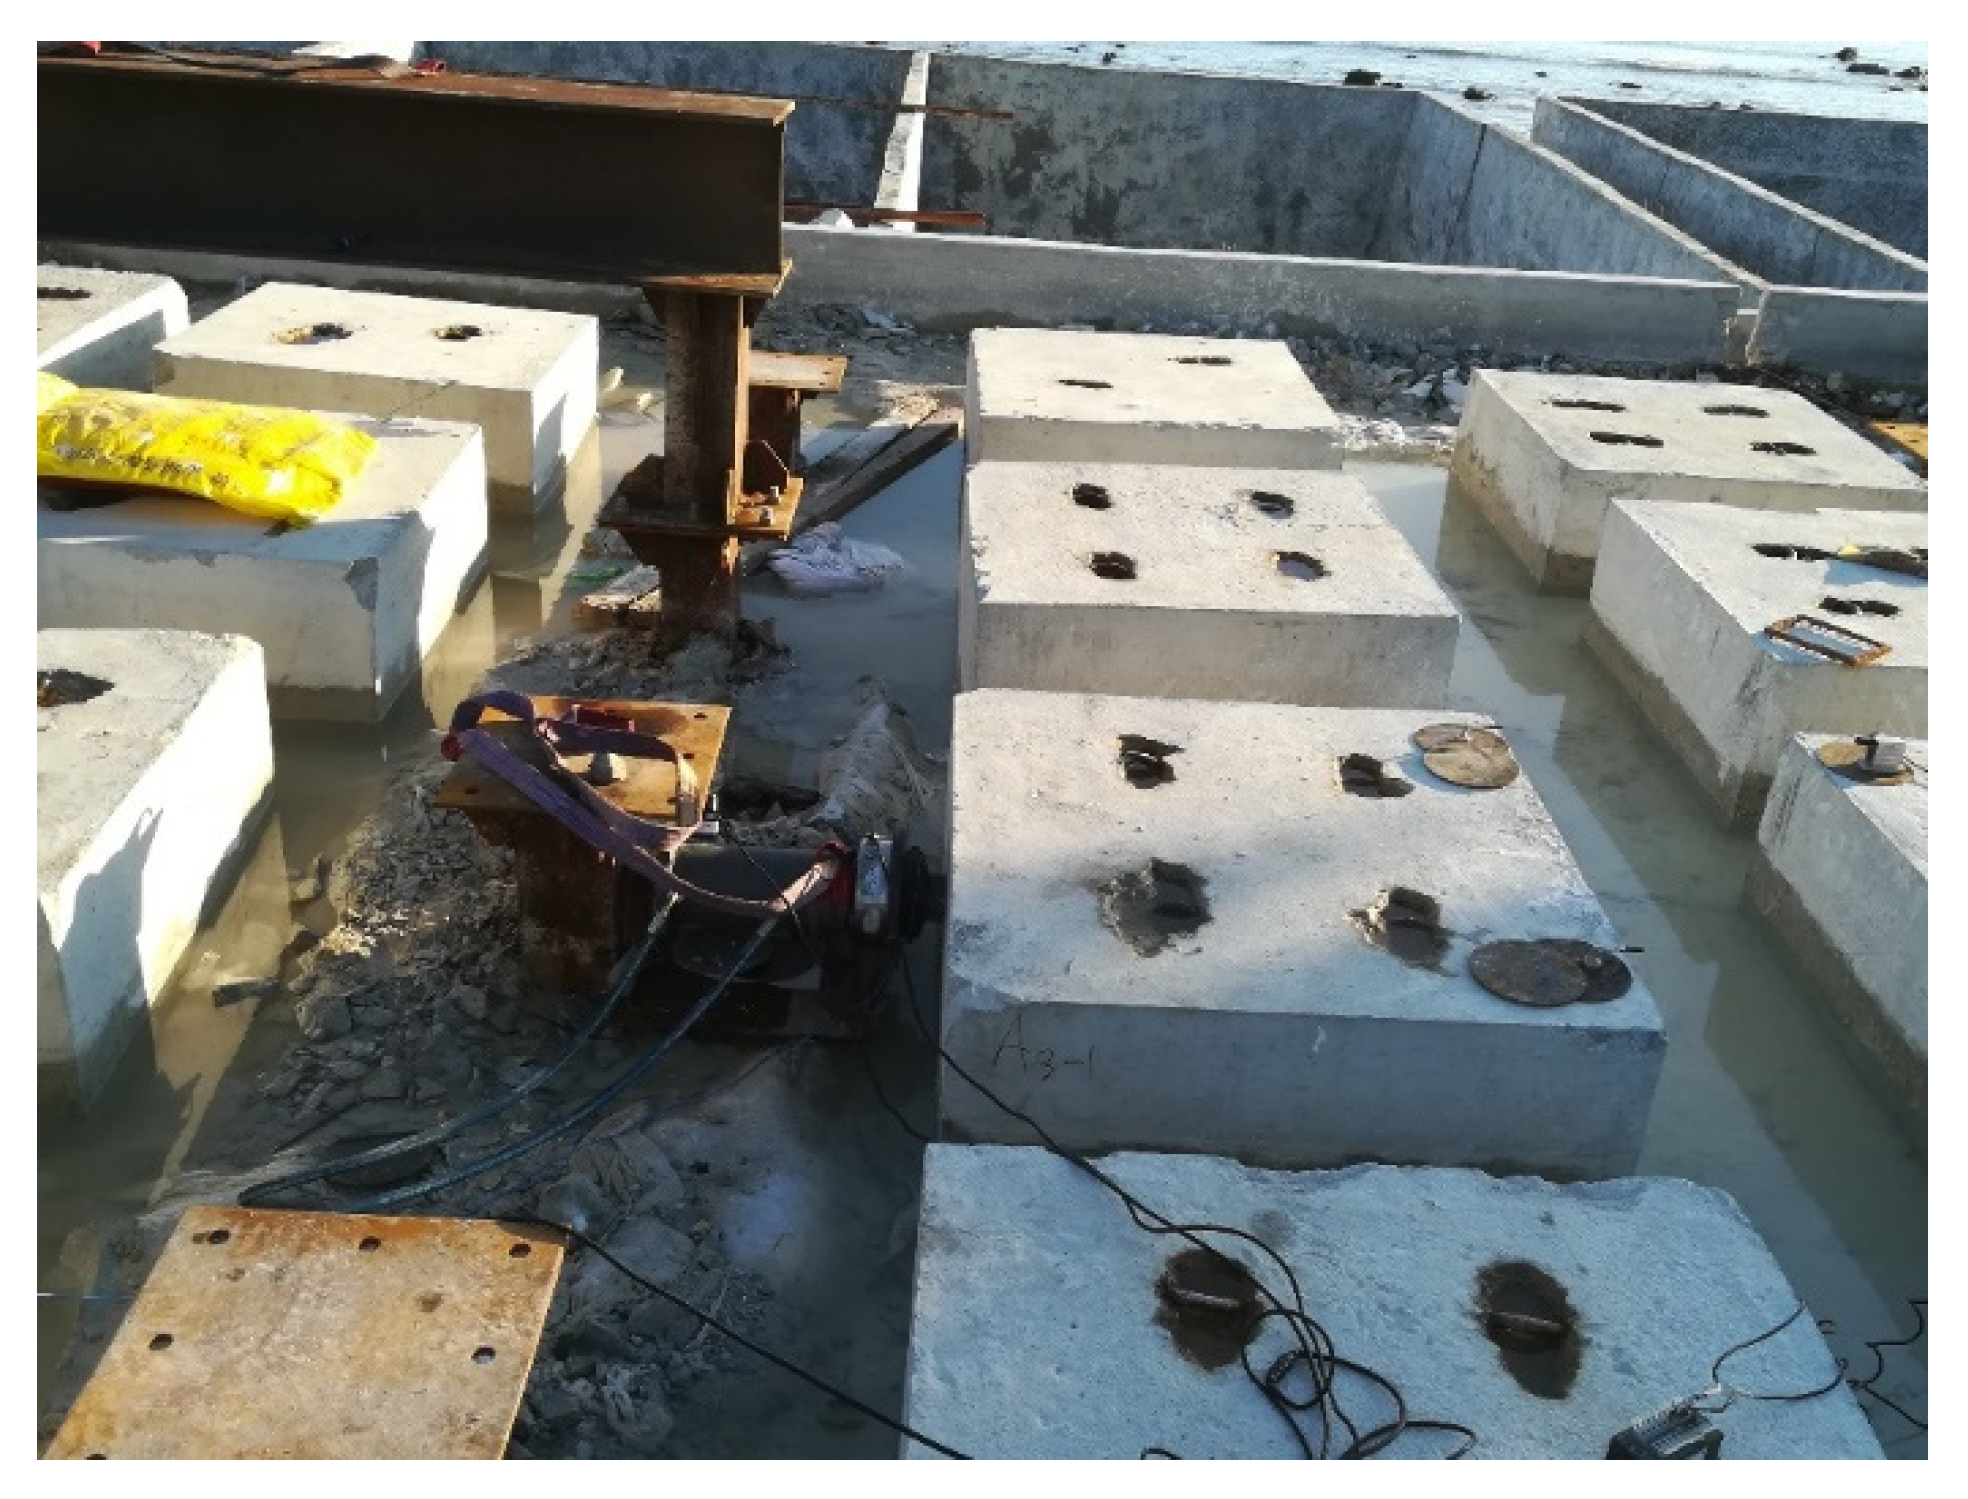
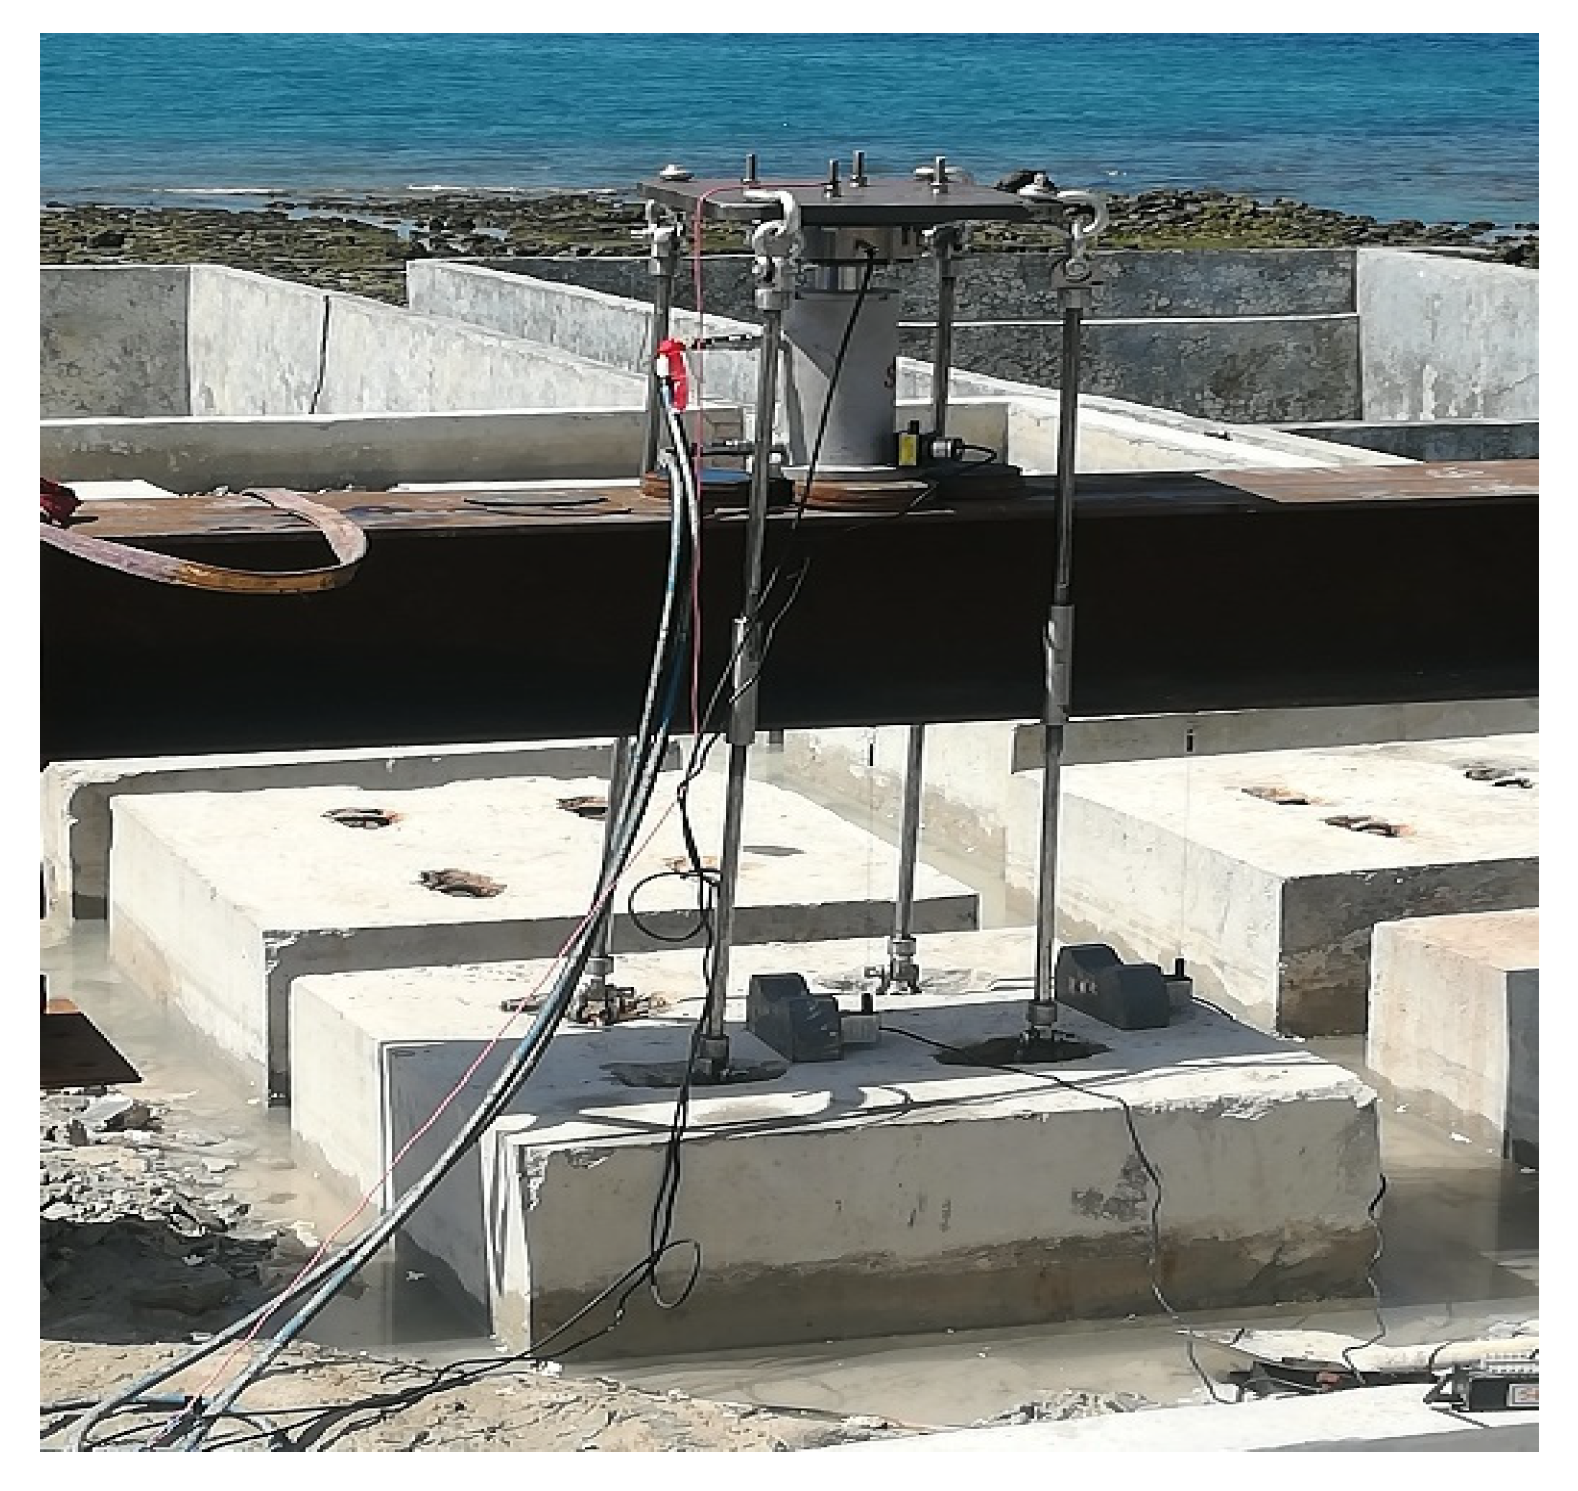
Figure 10.
Horizontal jack loading of Hp specimen.
Figure 10.
Horizontal jack loading of Hp specimen.
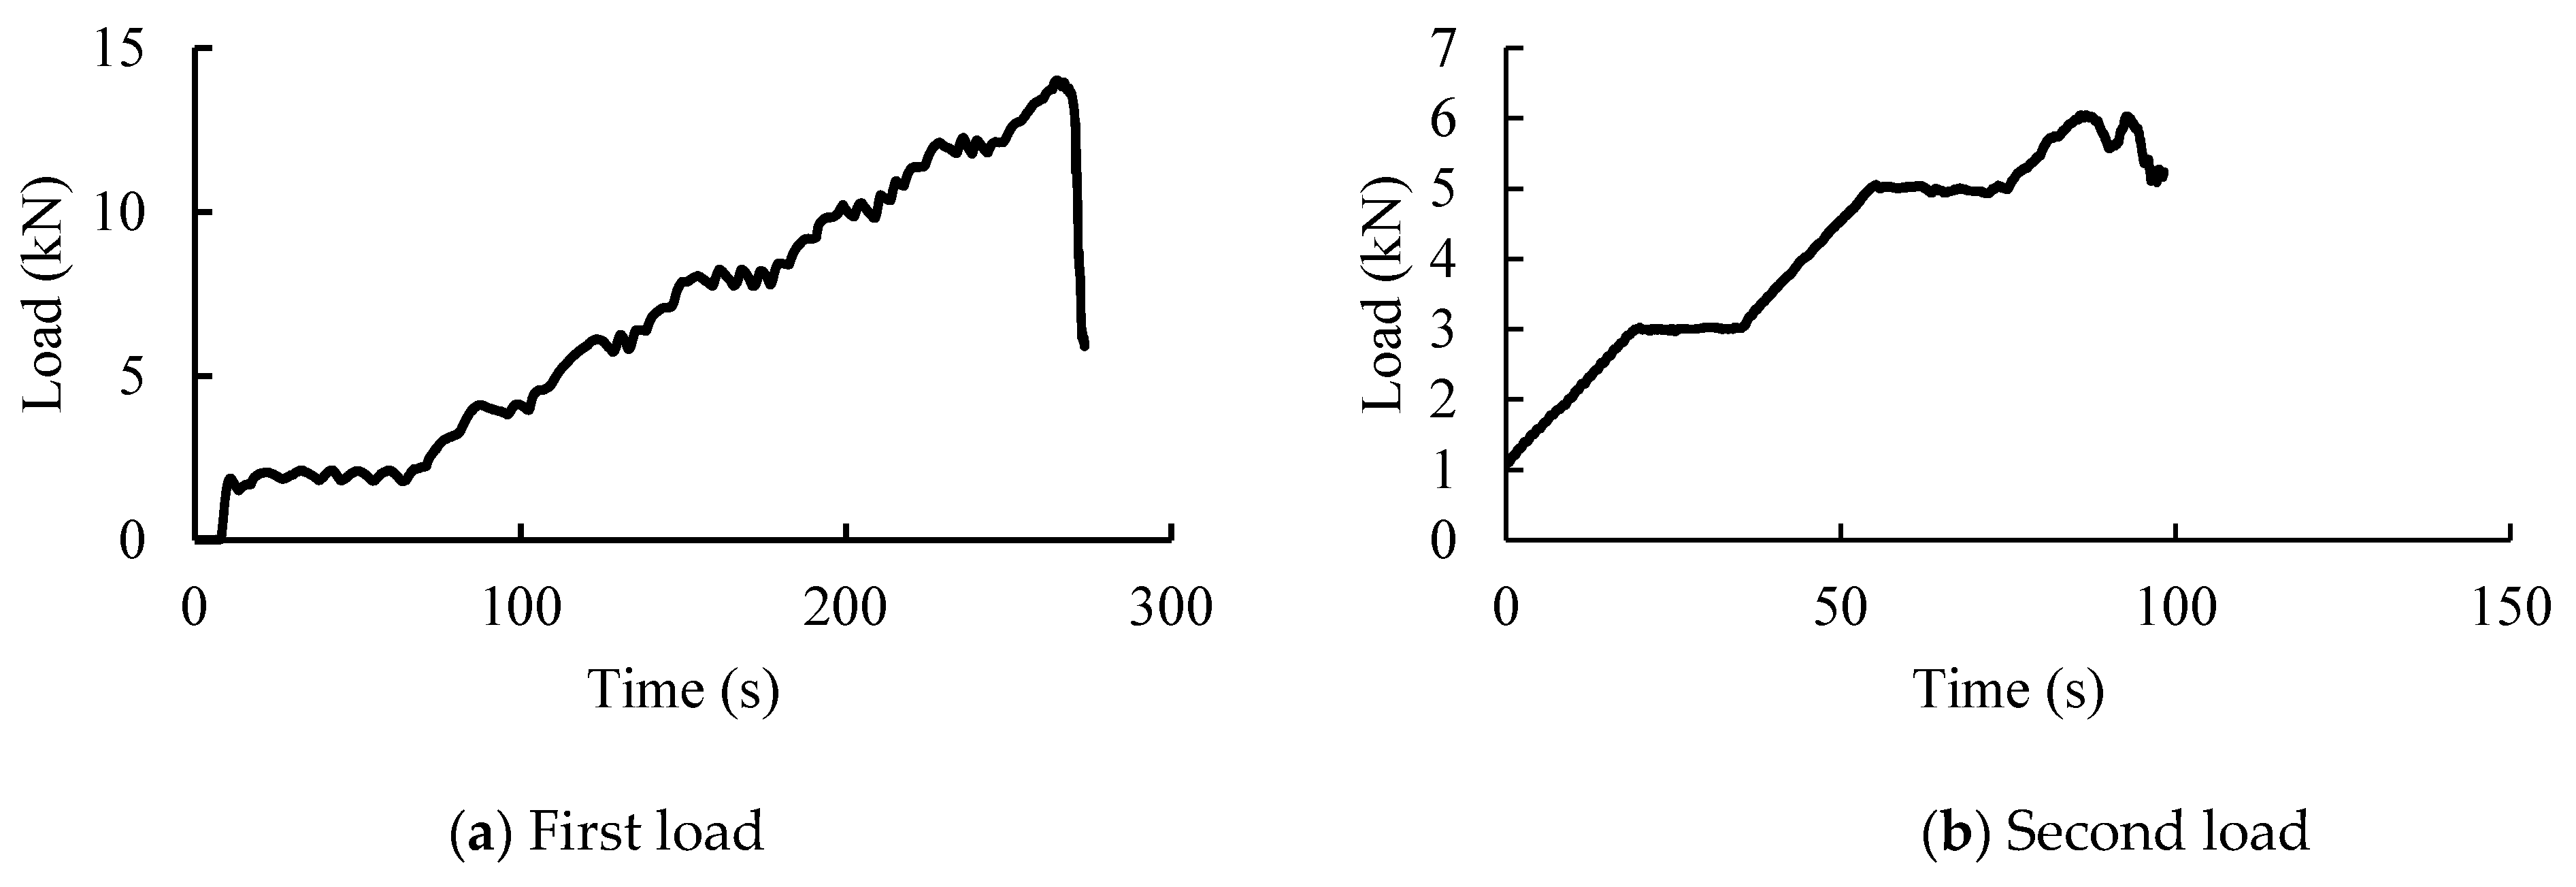
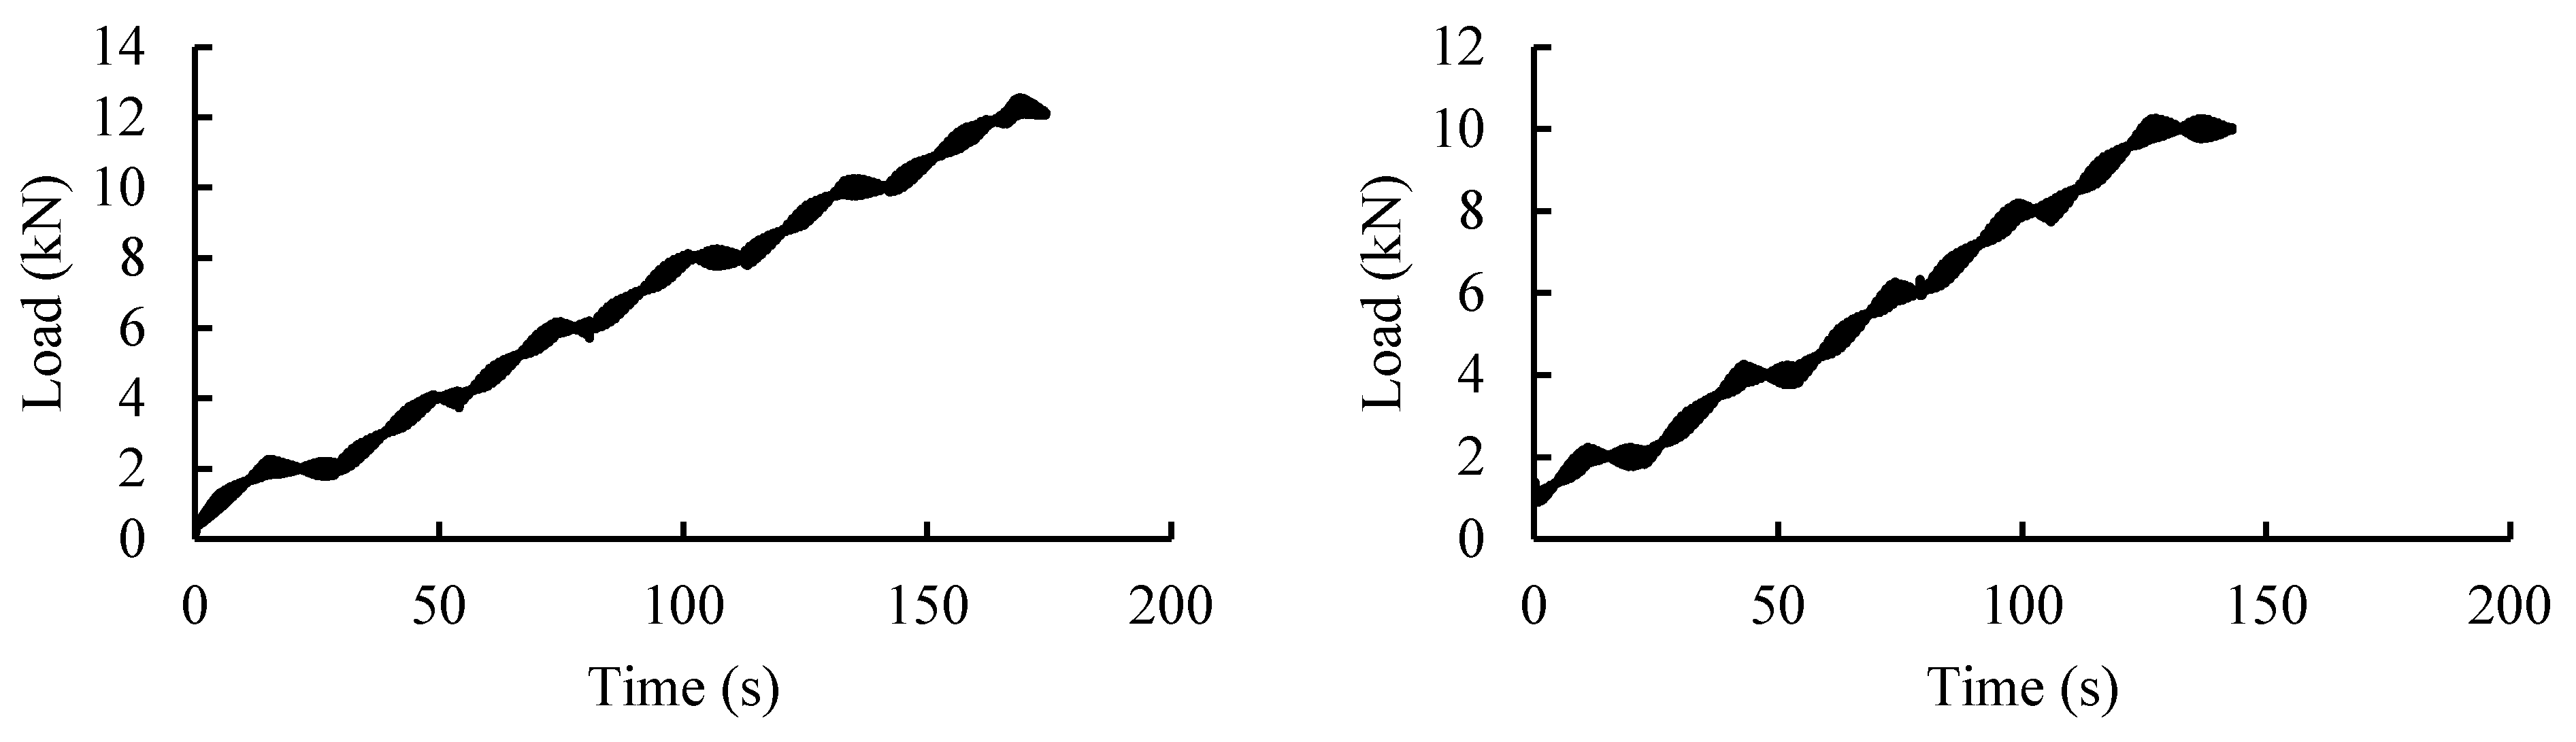
Figure 11.
Loading curve of horizontal jack of Hp specimen.
Figure 11.
Loading curve of horizontal jack of Hp specimen.
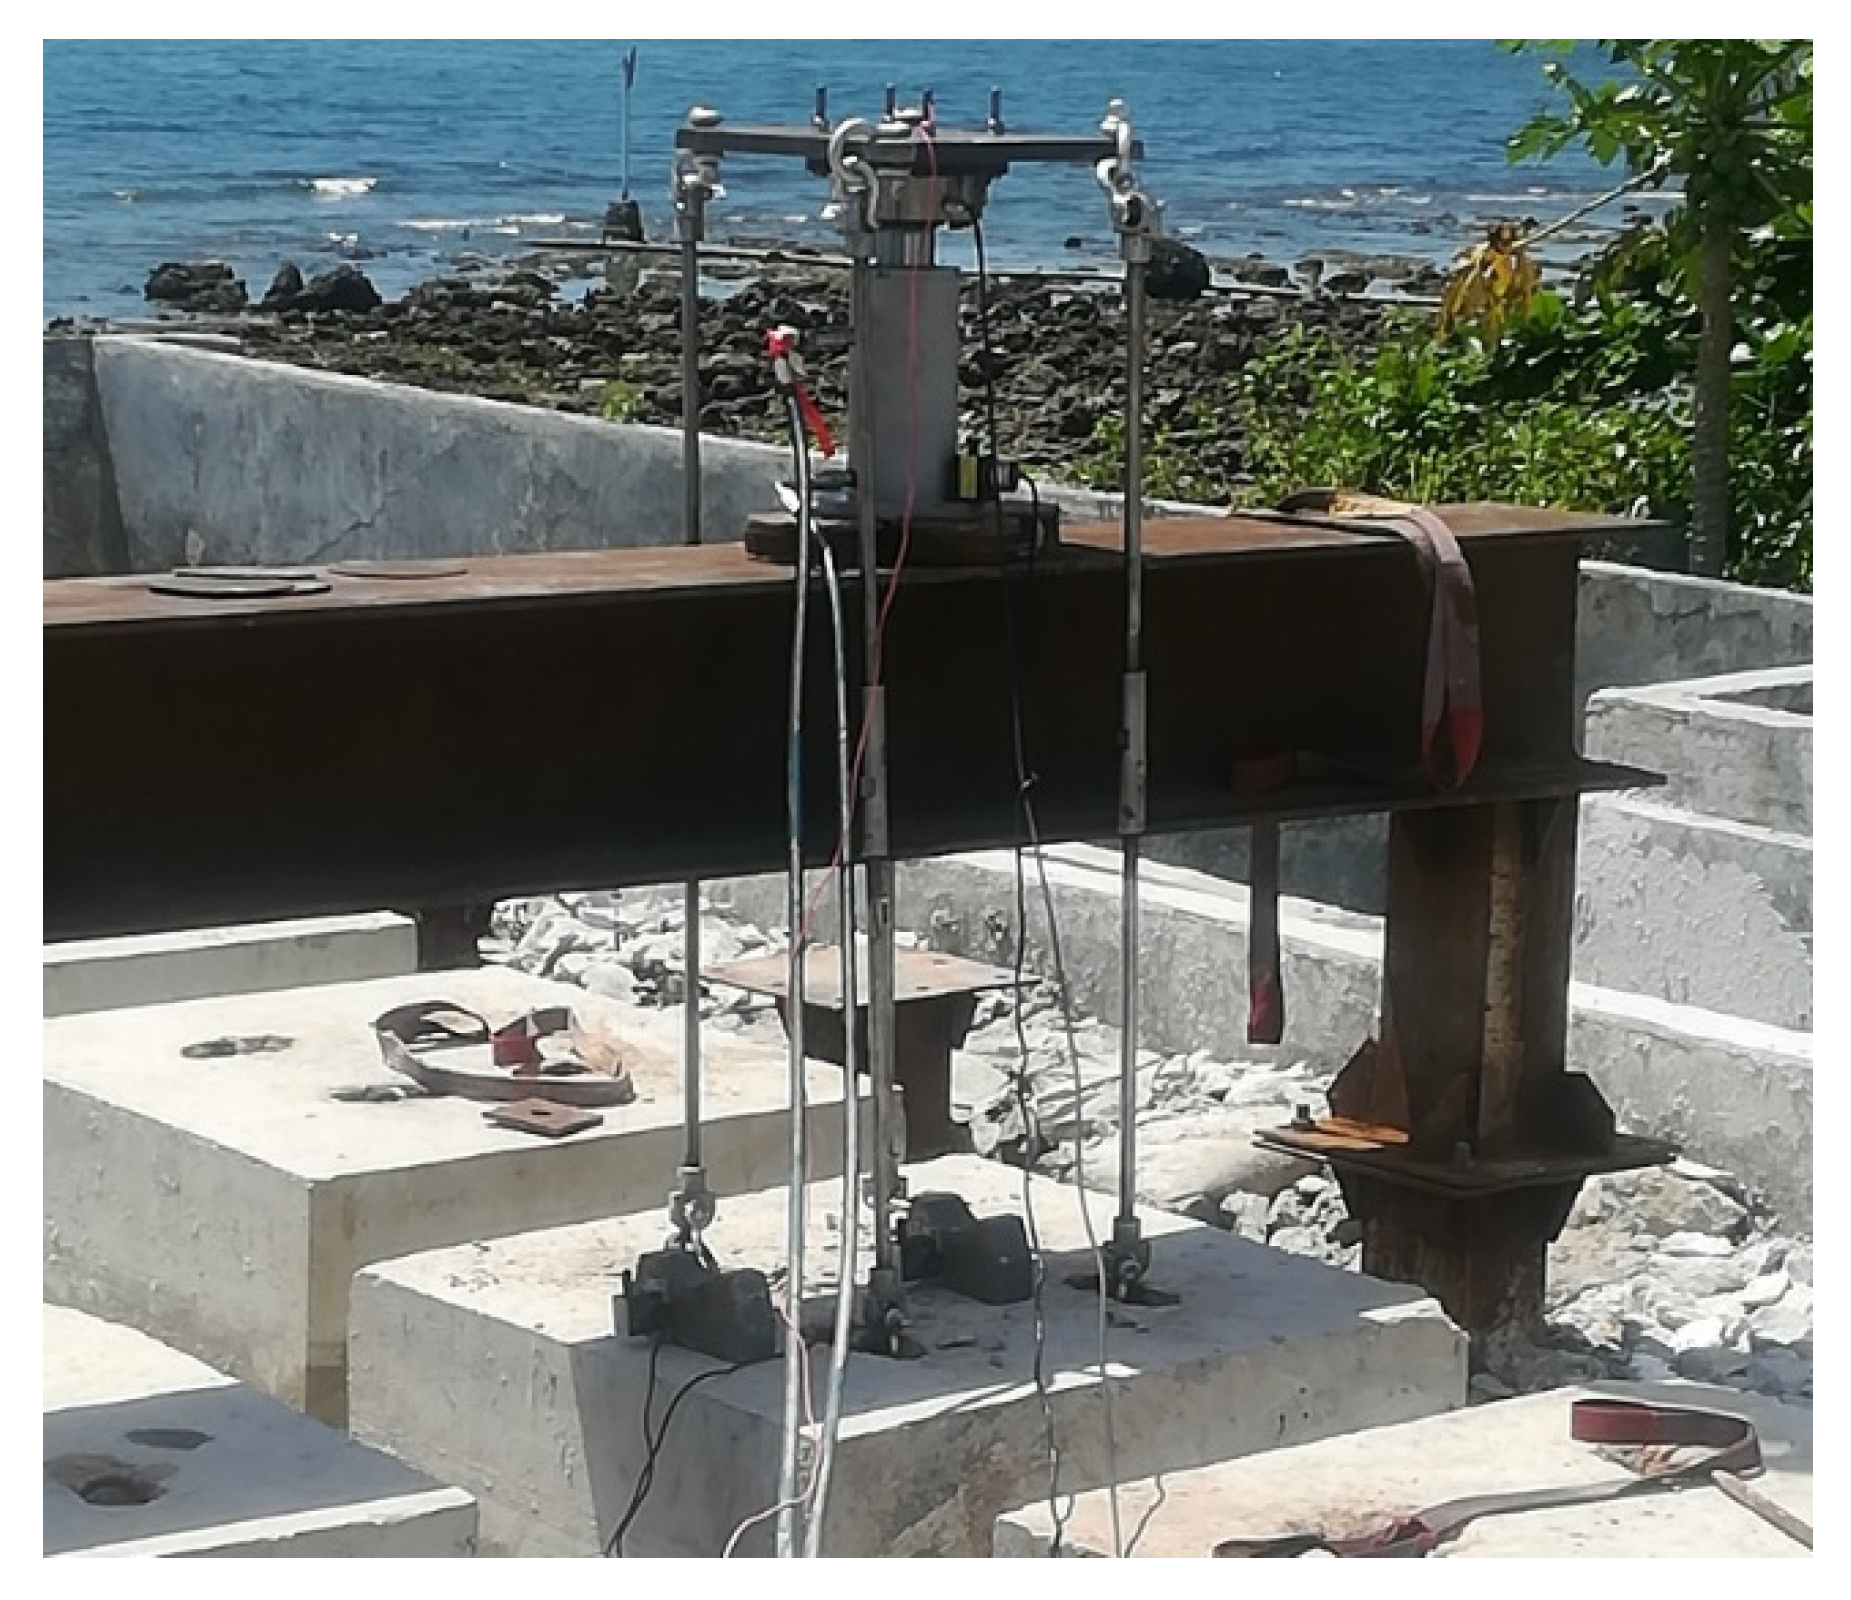
Figure 12.
Hg specimen loaded by horizontal jack.
Figure 12.
Hg specimen loaded by horizontal jack.
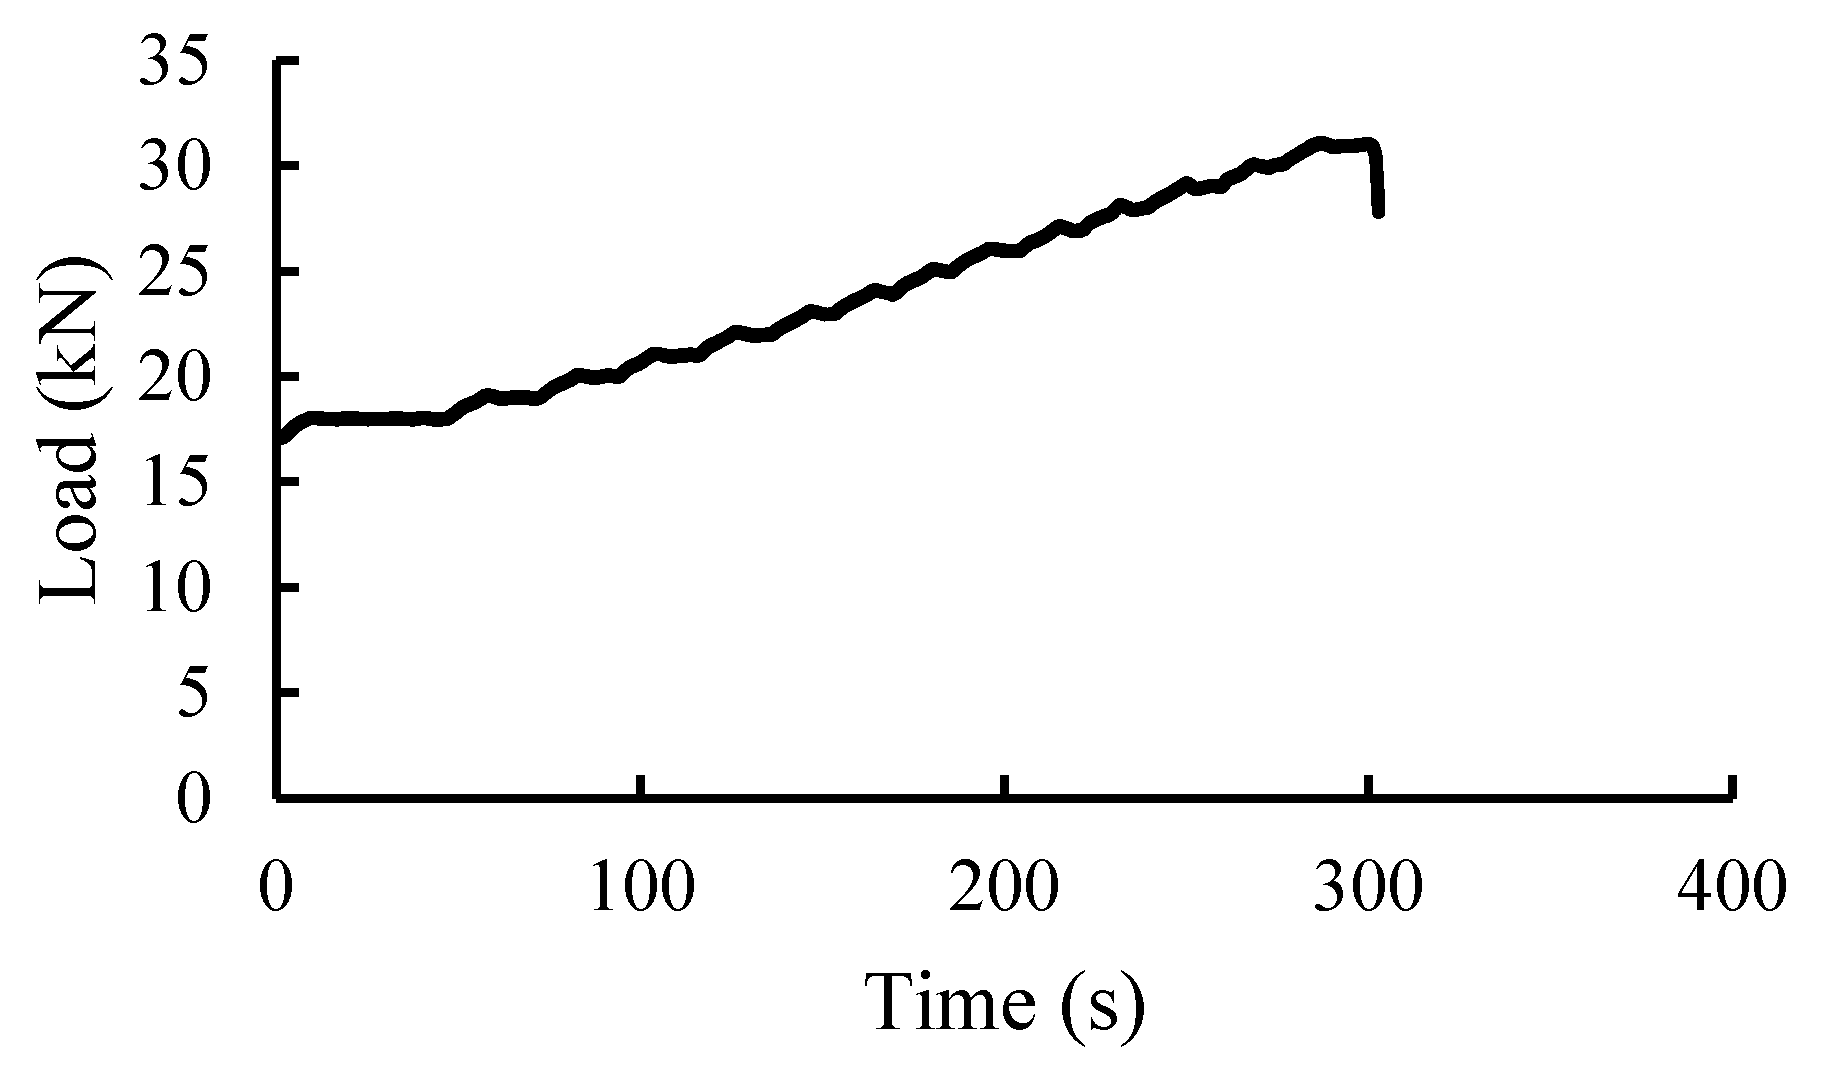
Figure 13.
Horizontal jack loading curve of Hg specimen.
Figure 13.
Horizontal jack loading curve of Hg specimen.
Figure 14.
Vertical jack loading of Hc specimen.
Figure 14.
Vertical jack loading of Hc specimen.
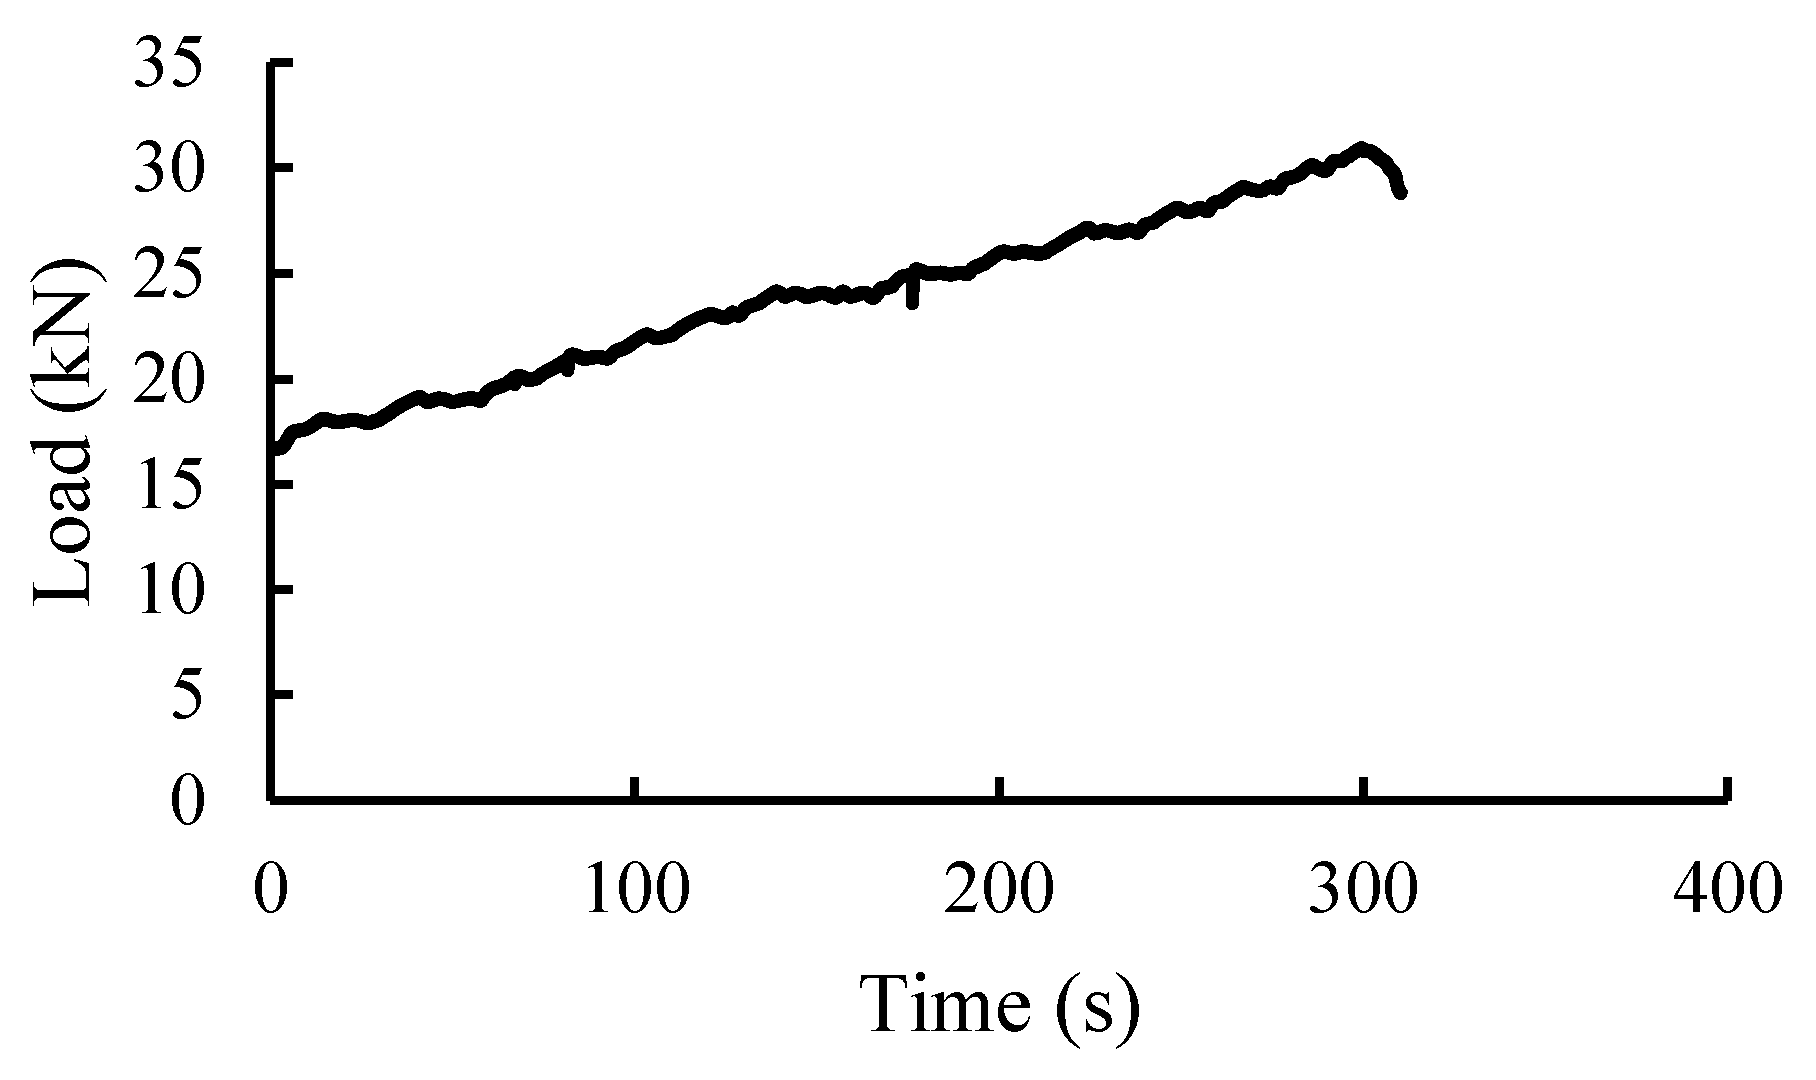
Figure 15.
Vertical jack loading curve of Hc specimen.
Figure 15.
Vertical jack loading curve of Hc specimen.
Figure 16.
Vertical jack loading of Hp specimen.
Figure 16.
Vertical jack loading of Hp specimen.
Figure 17.
Vertical jack loading curve of Hp specimen.
Figure 17.
Vertical jack loading curve of Hp specimen.
Figure 18.
Vertical jack loading of Hg specimen.
Figure 18.
Vertical jack loading of Hg specimen.
Figure 19.
Loading curve of vertical jack of Hg specimen.
Figure 19.
Loading curve of vertical jack of Hg specimen.
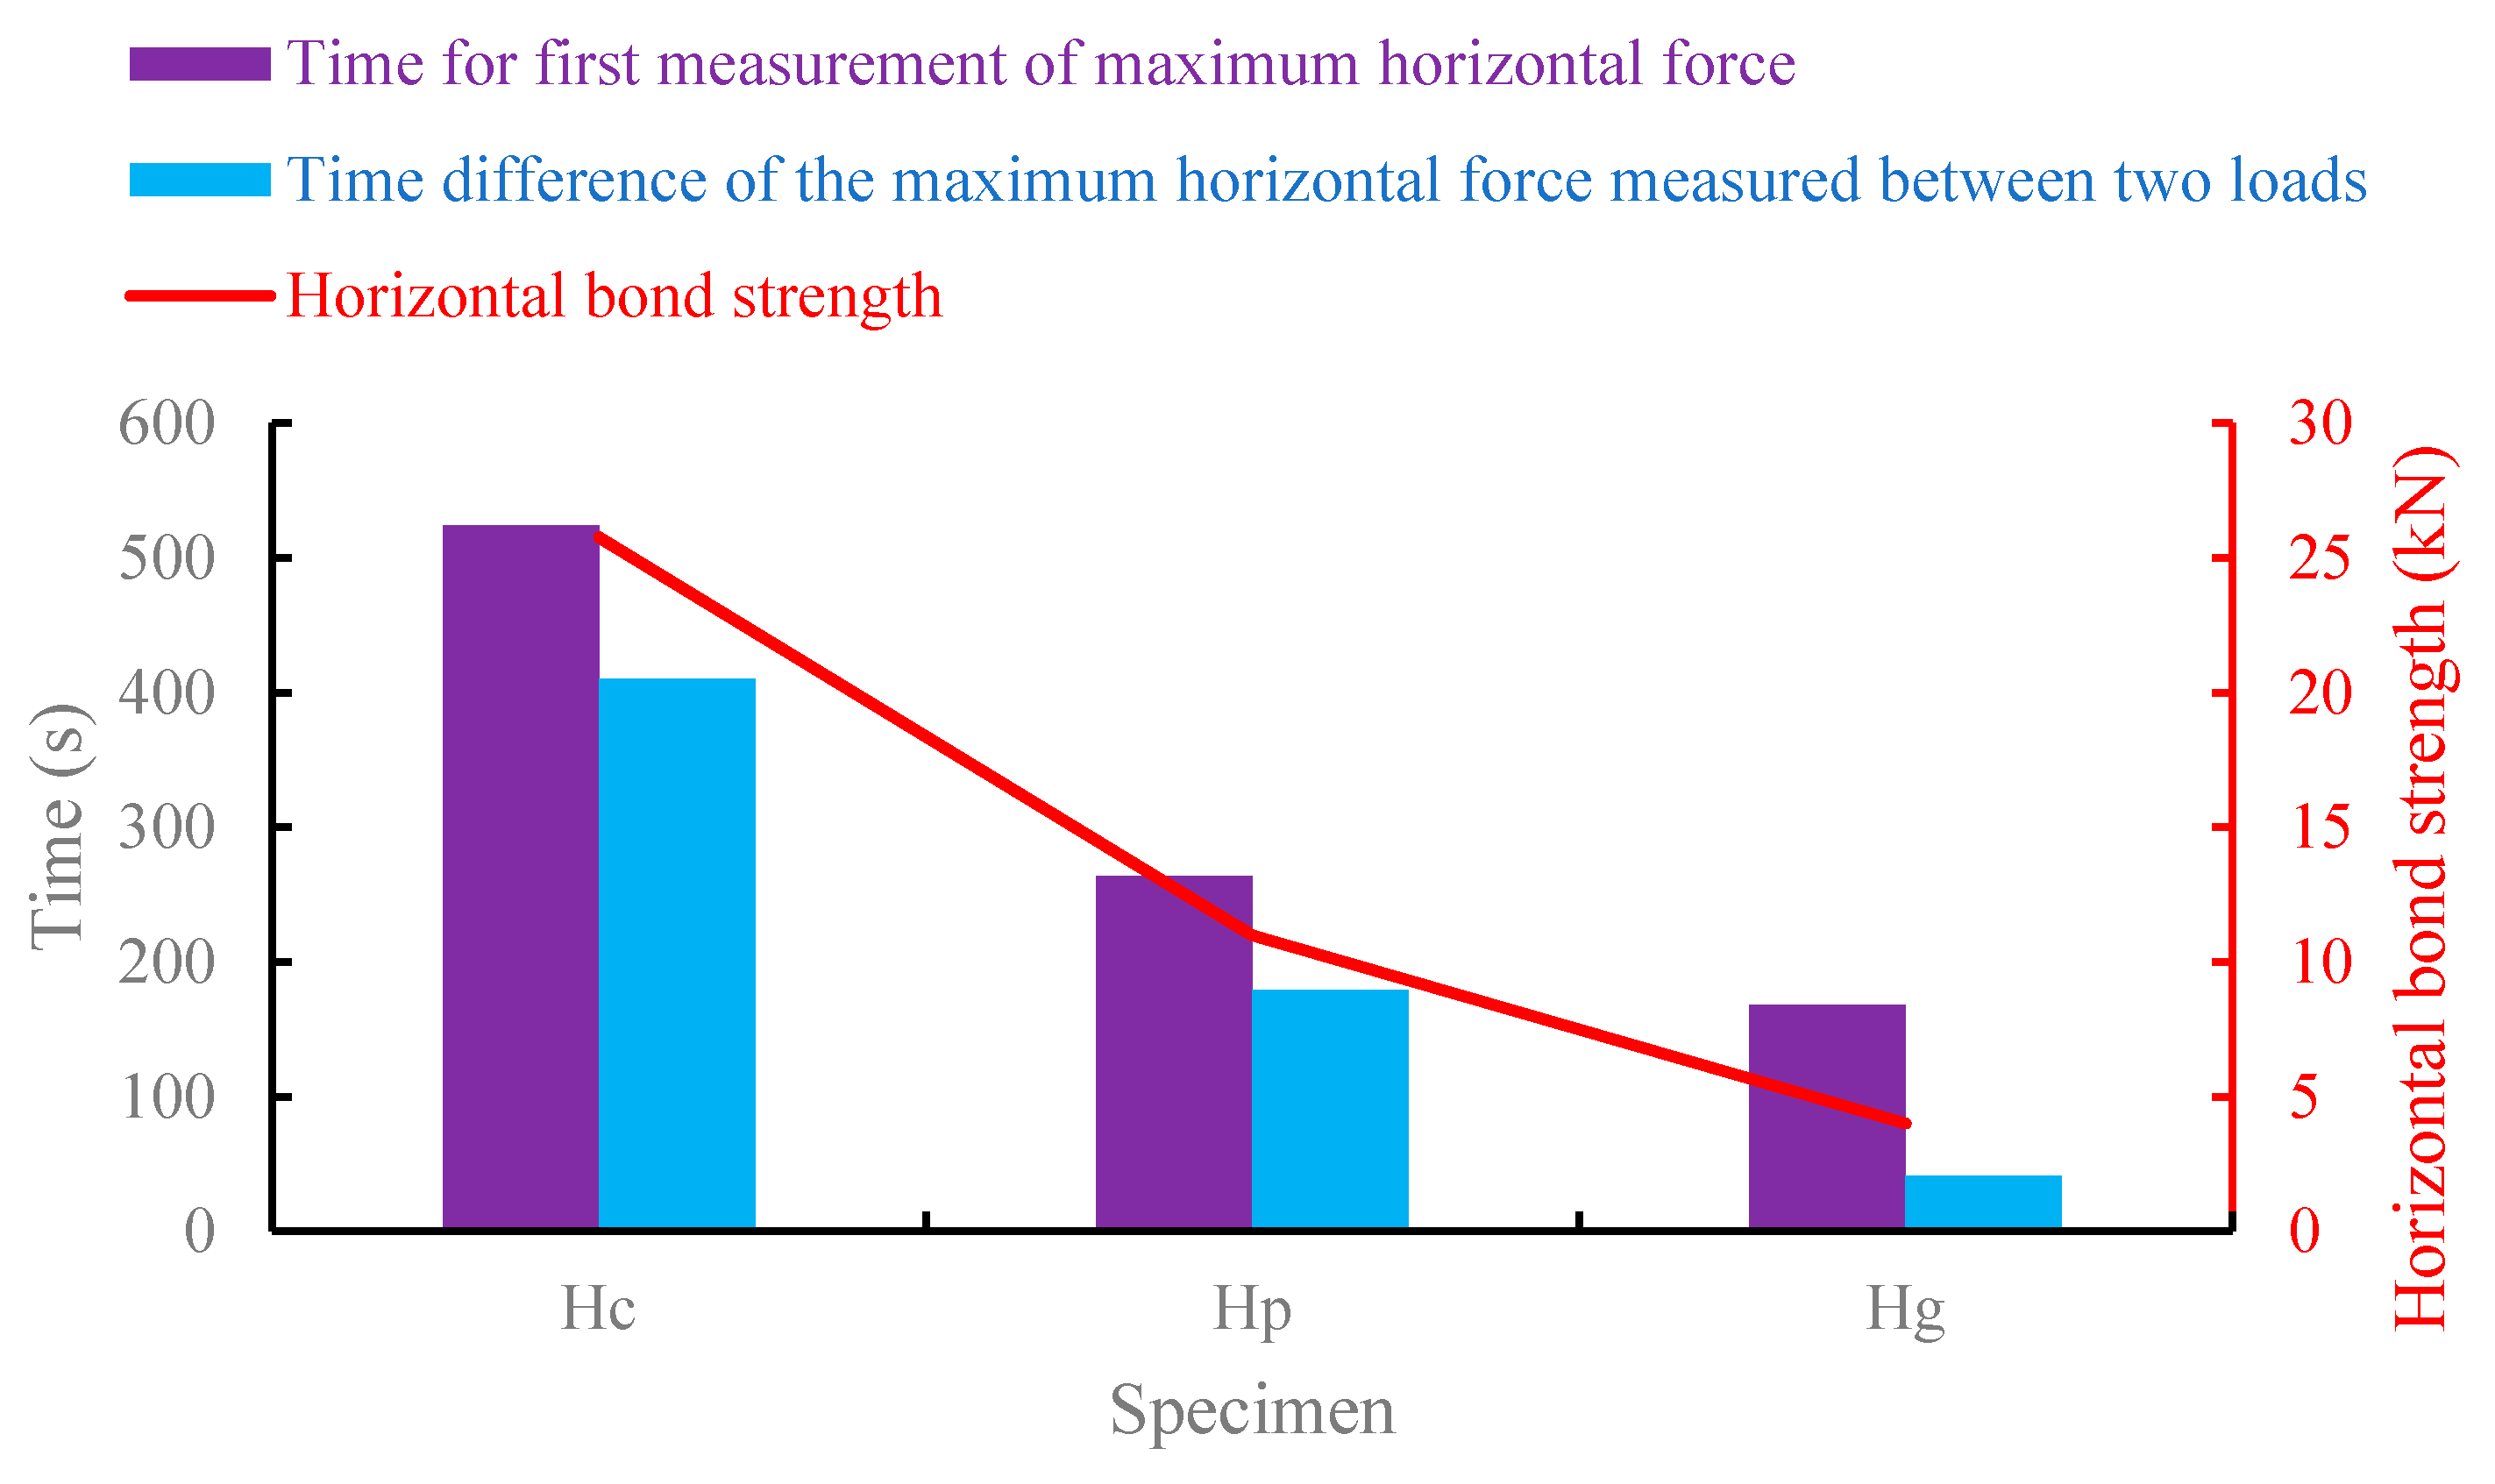
Figure 20.
Comparison of the horizontal bonding strength of different specimens and the time when the maximum horizontal force was measured.
Figure 20.
Comparison of the horizontal bonding strength of different specimens and the time when the maximum horizontal force was measured.
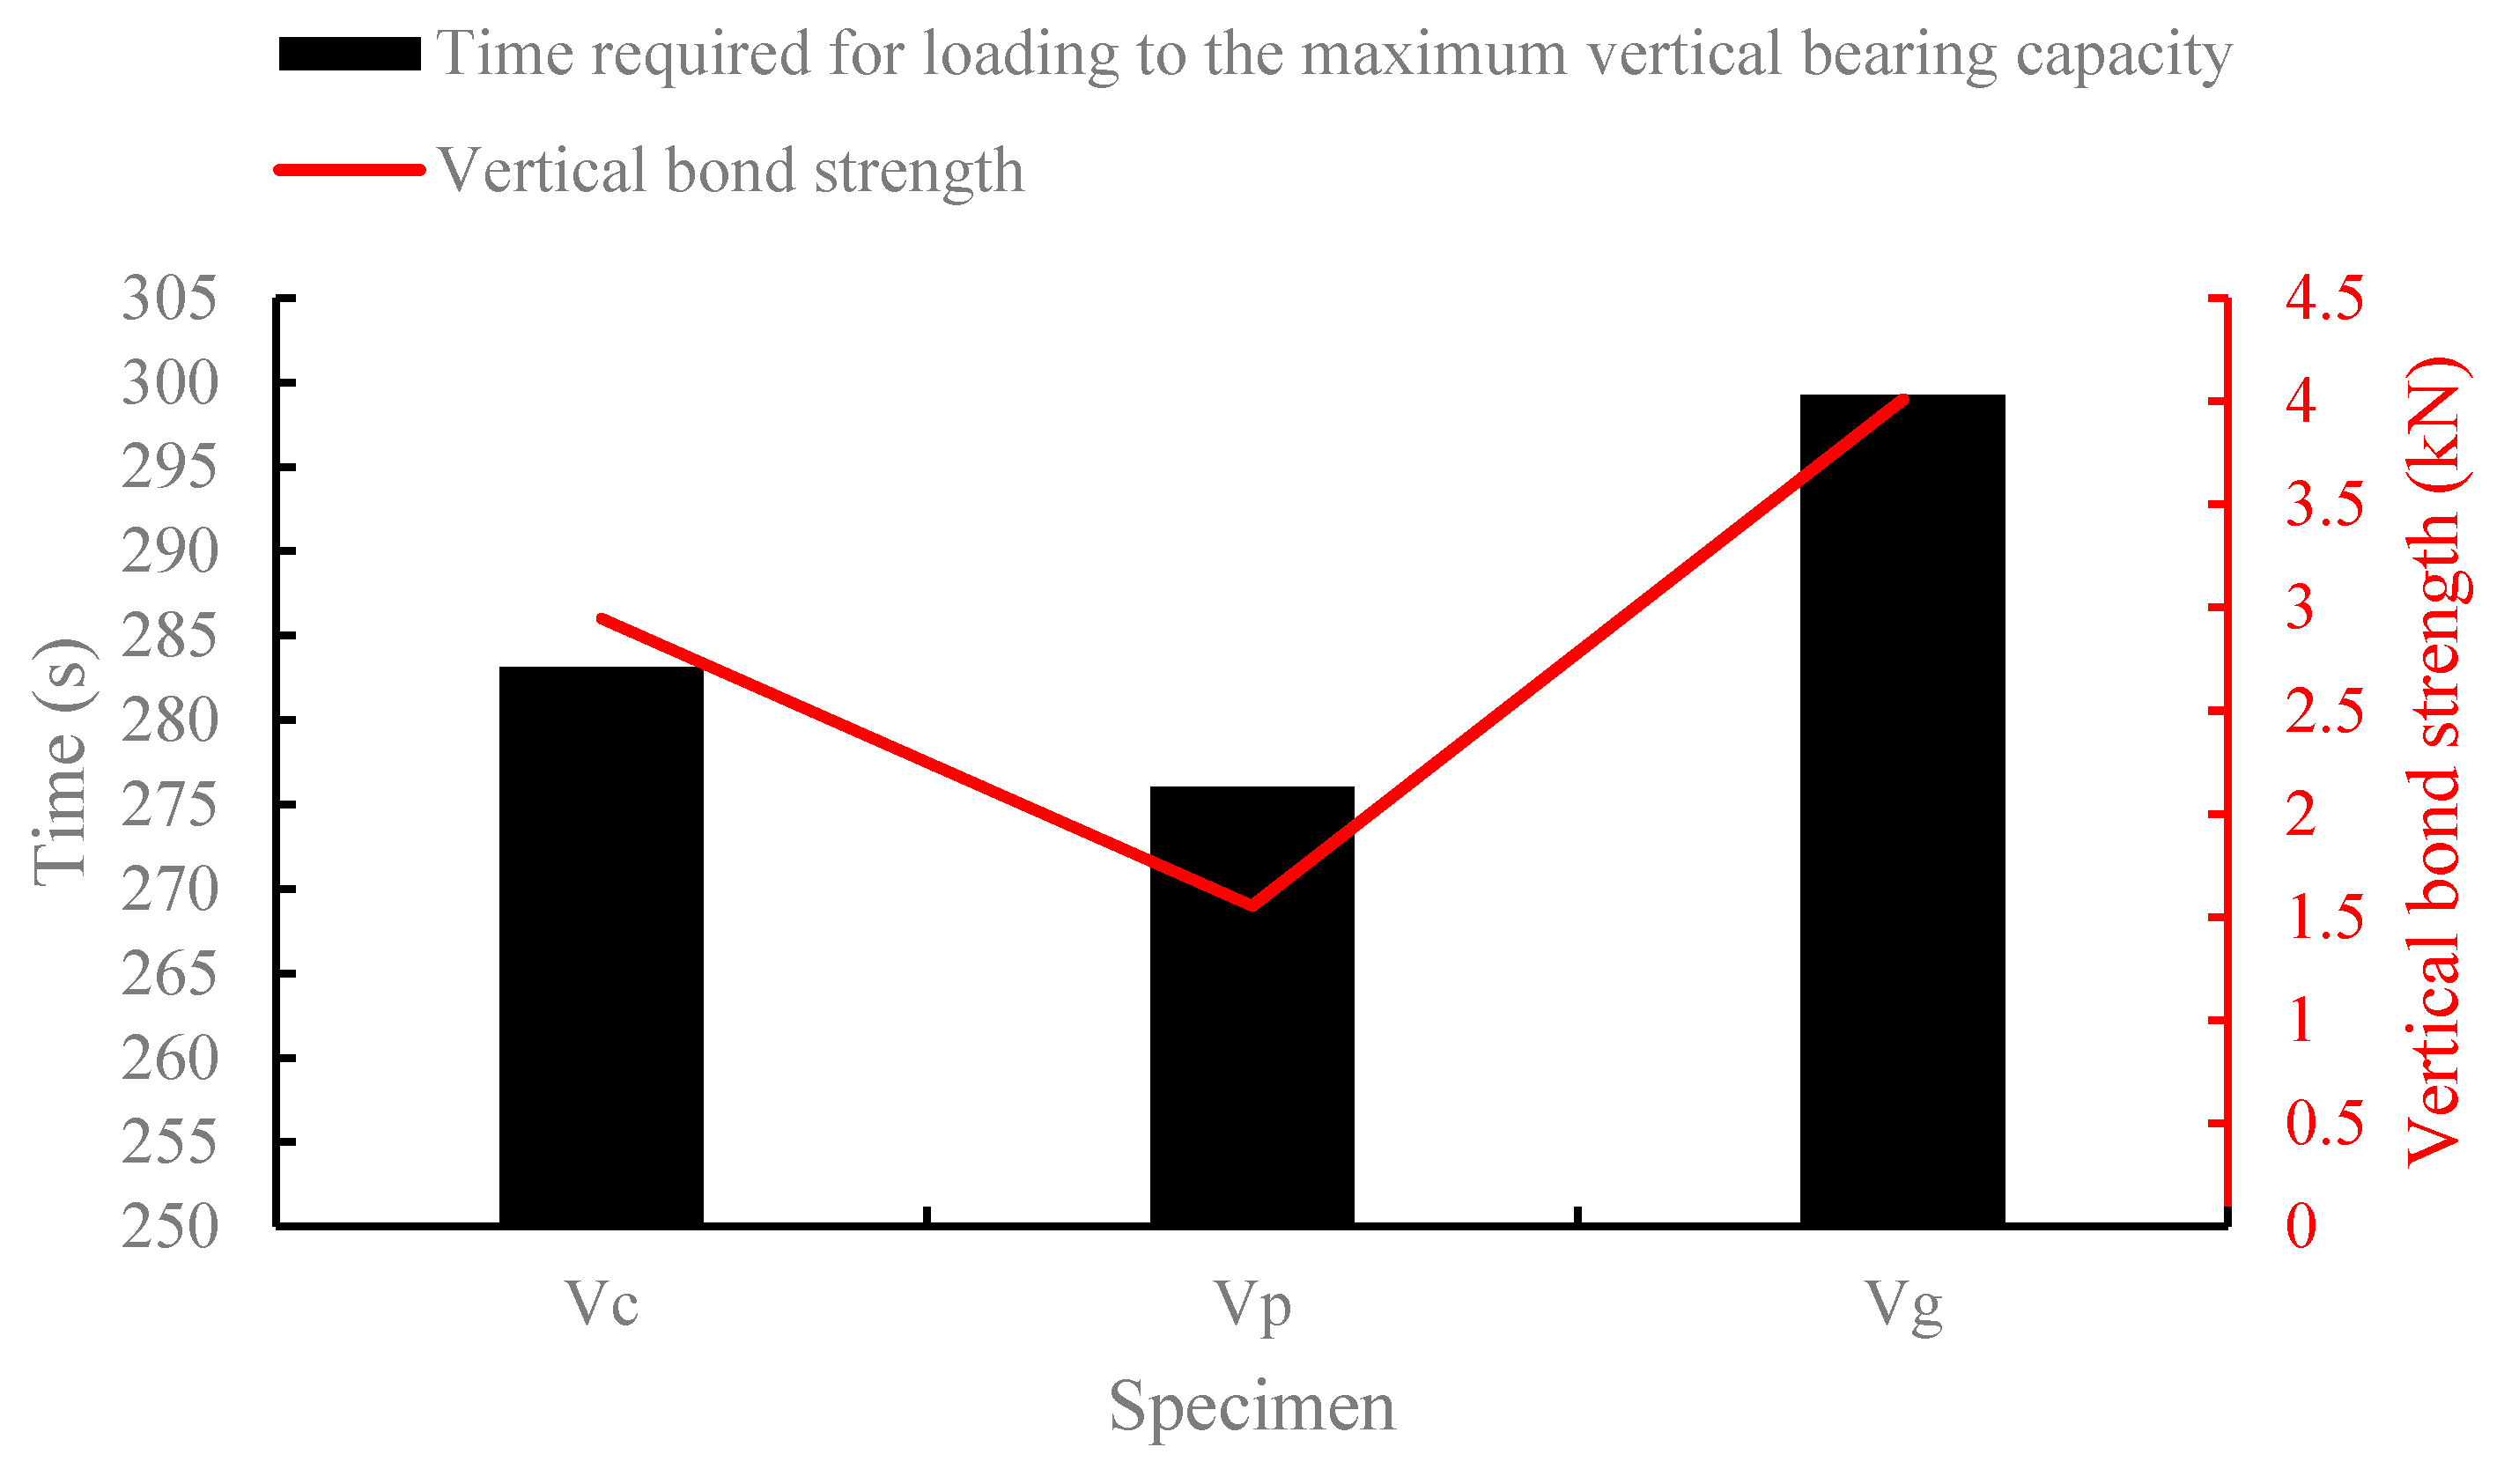
Figure 21.
Comparison of the vertical bonding strength of different specimens and the time required to measure the maximum vertical bearing capacity.
Figure 21.
Comparison of the vertical bonding strength of different specimens and the time required to measure the maximum vertical bearing capacity.
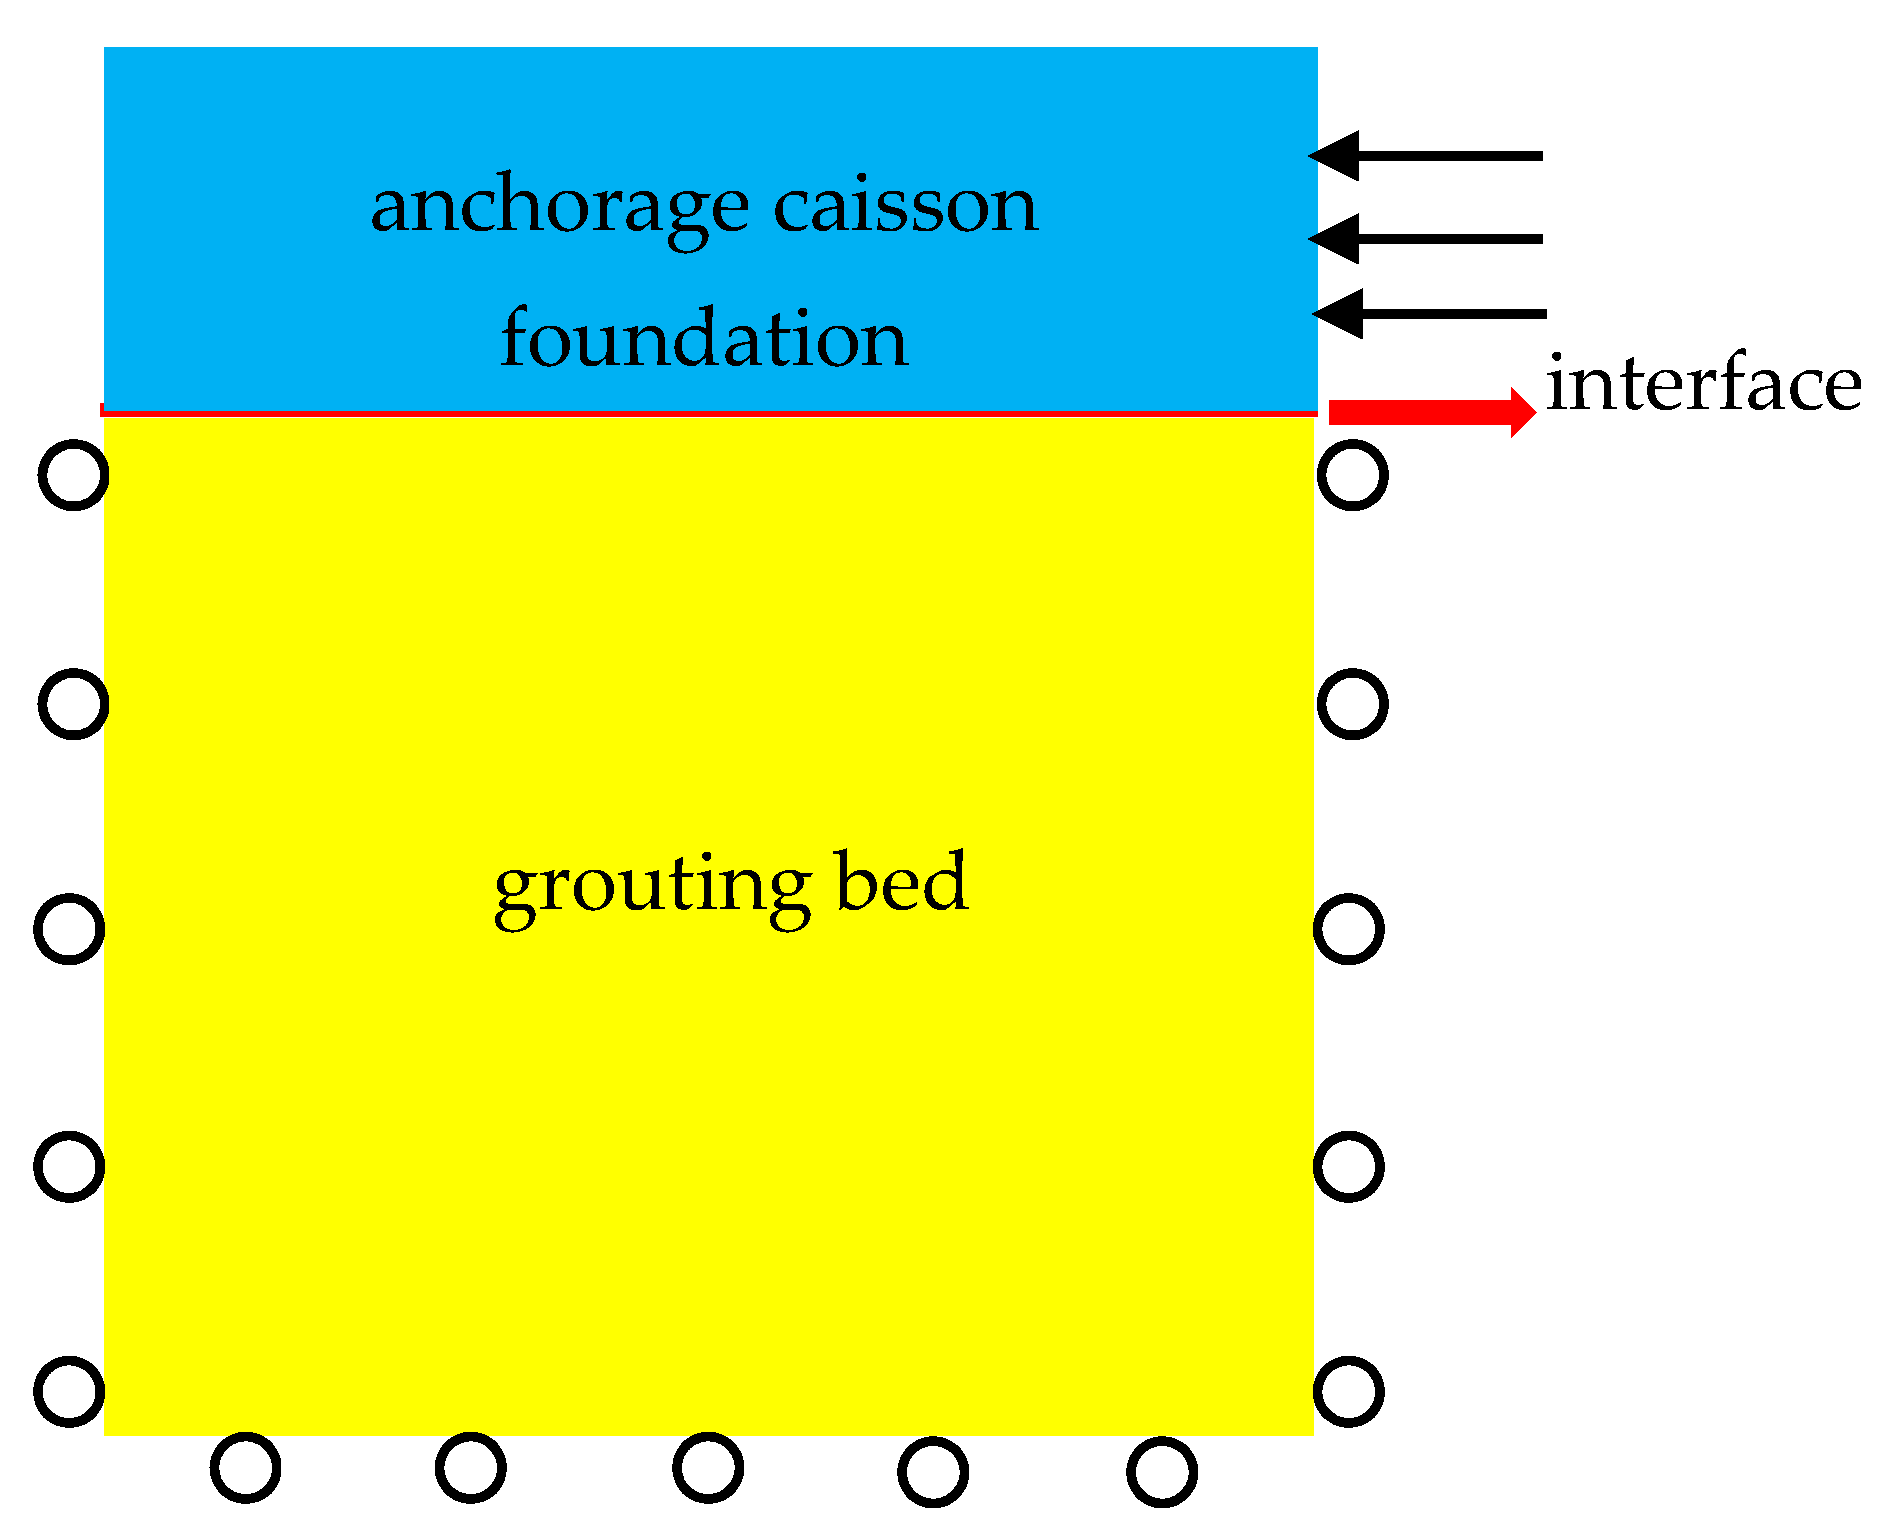
Figure 22.
Numerical model.
Figure 22.
Numerical model.
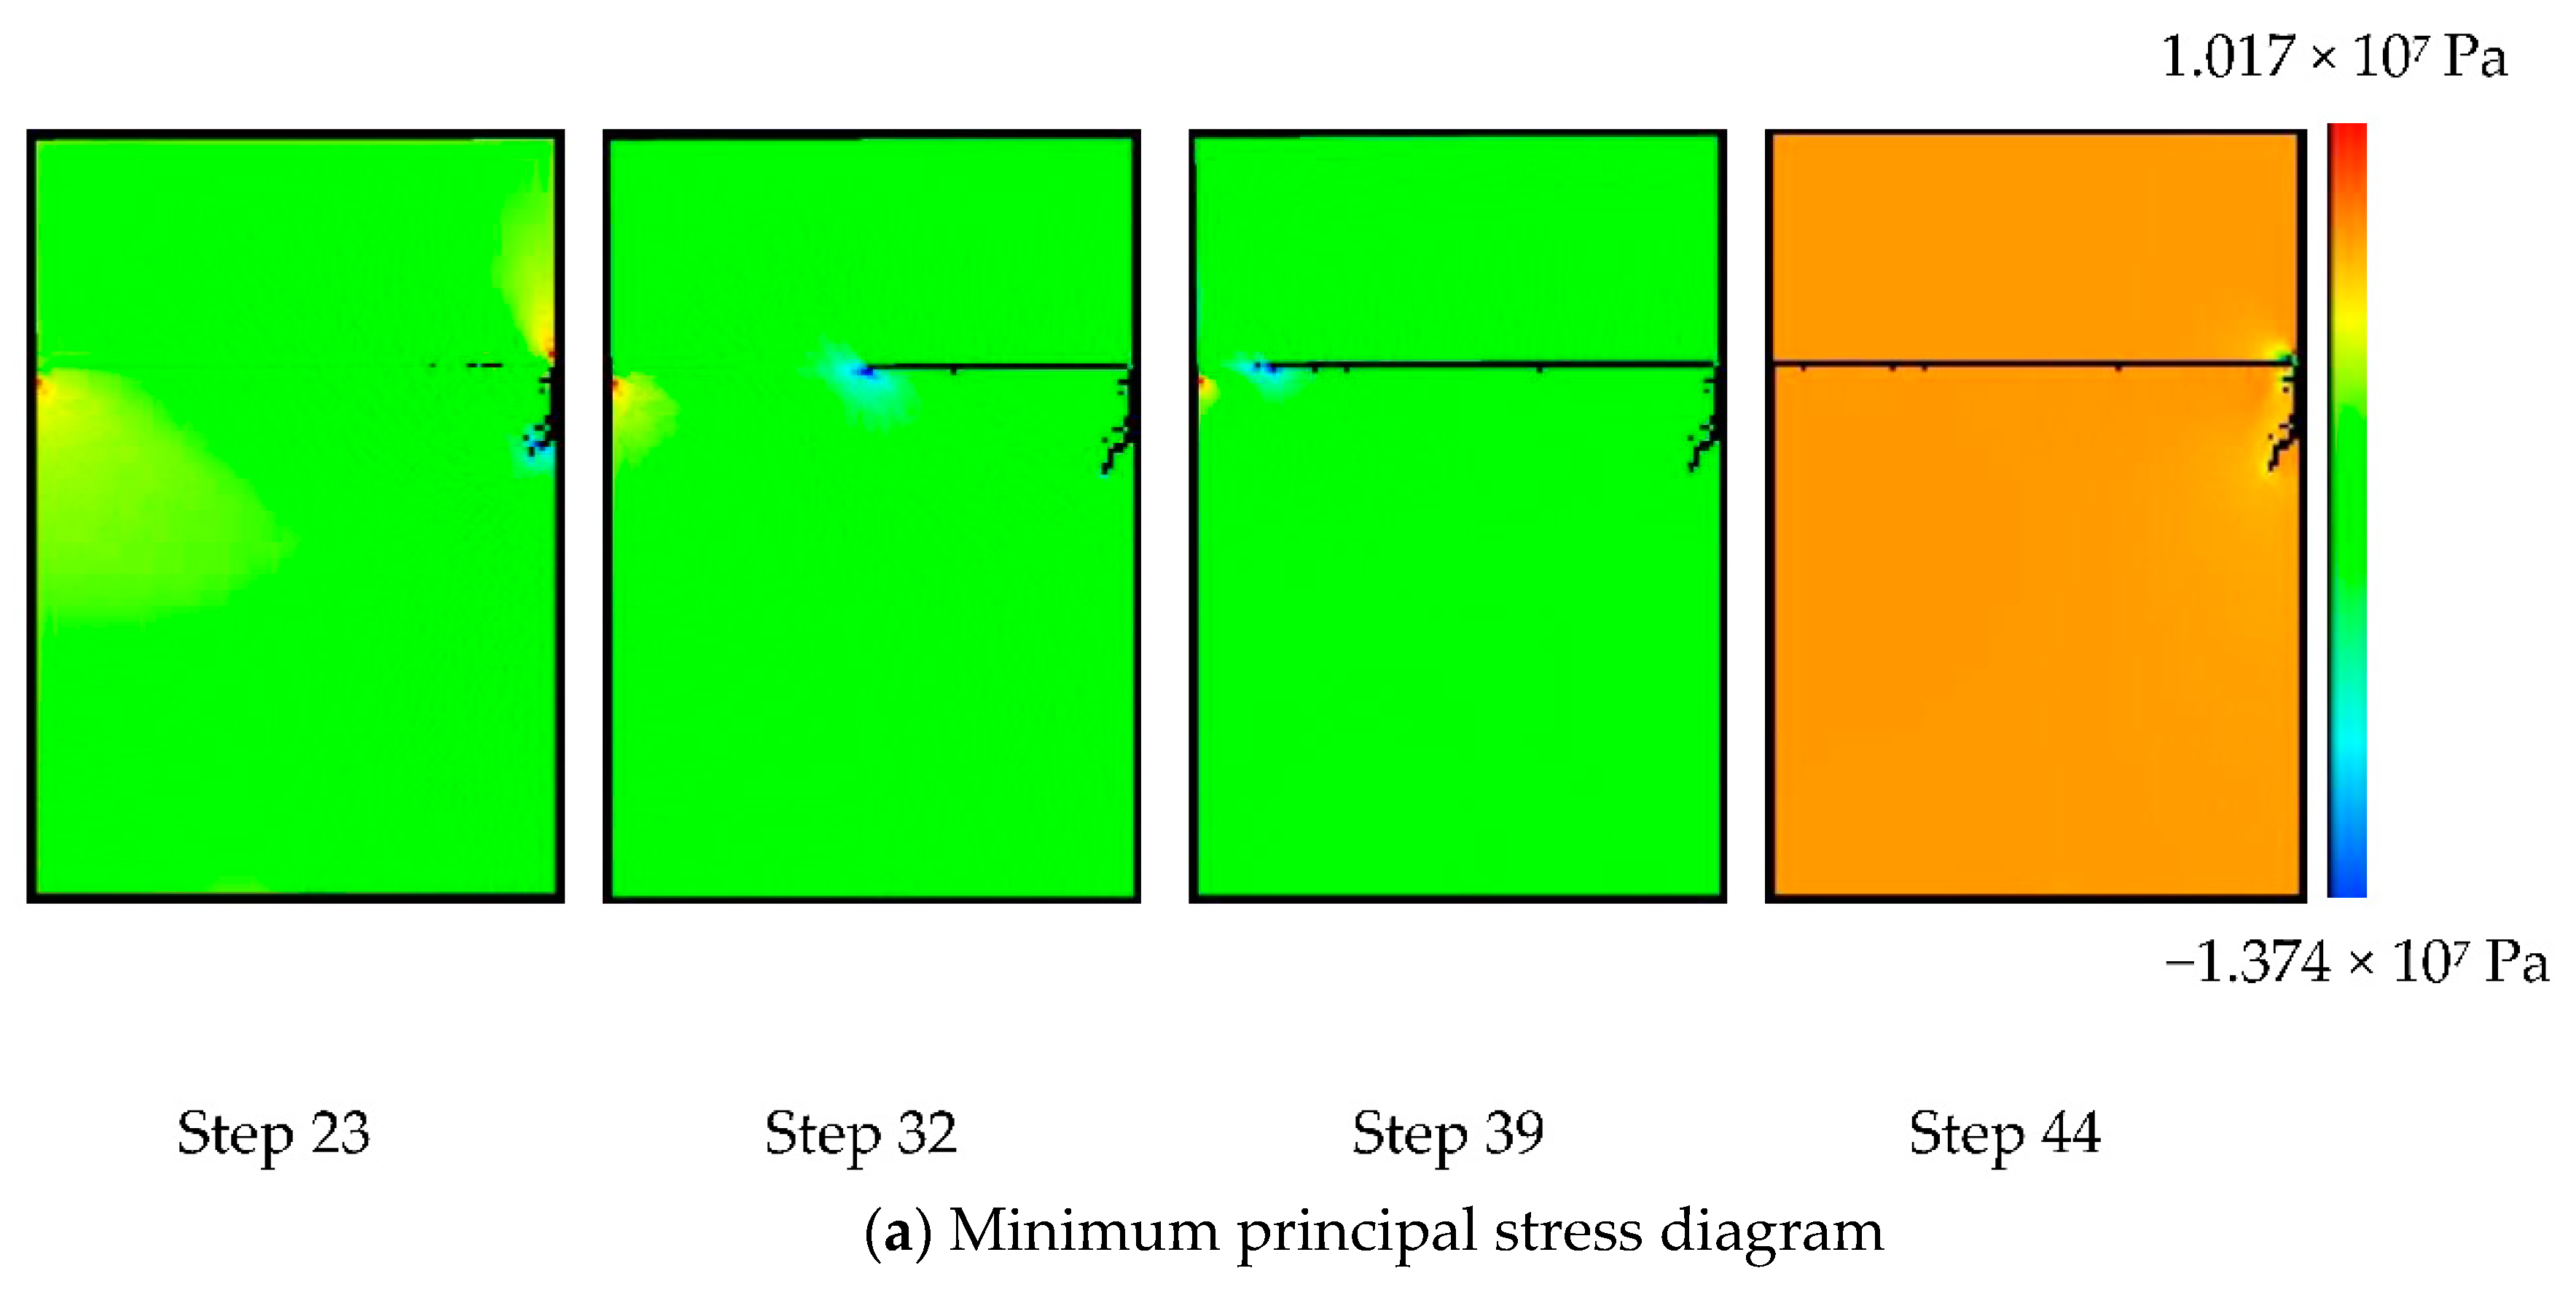
Figure 23.
Failure process of specimens with concrete interface.
Figure 23.
Failure process of specimens with concrete interface.
Figure 24.
Failure process of specimen with geotextile interface.
Figure 24.
Failure process of specimen with geotextile interface.
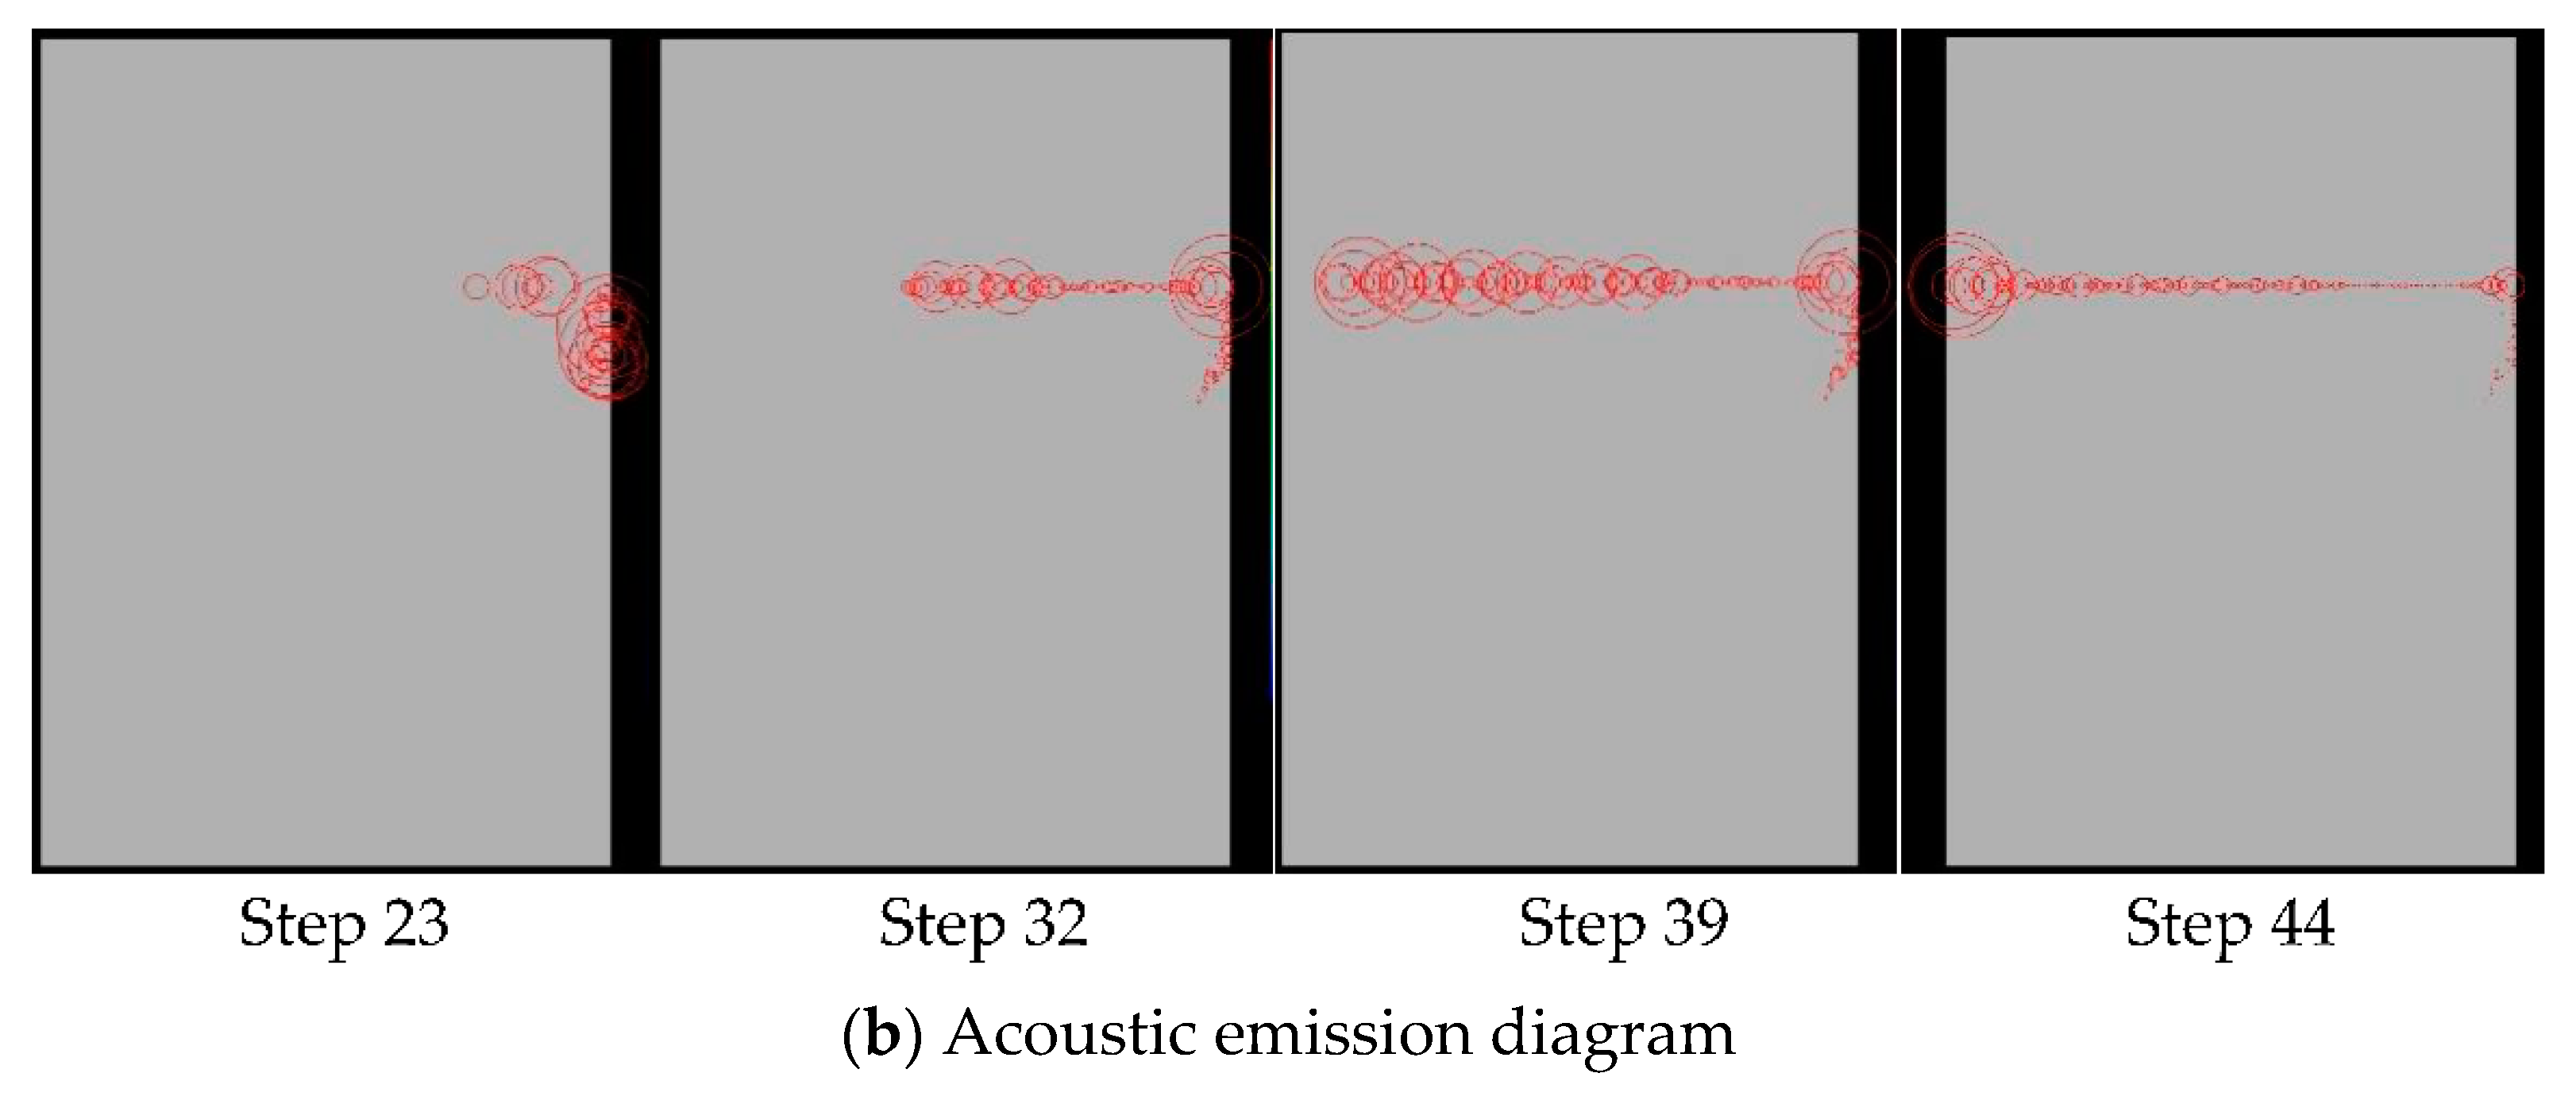
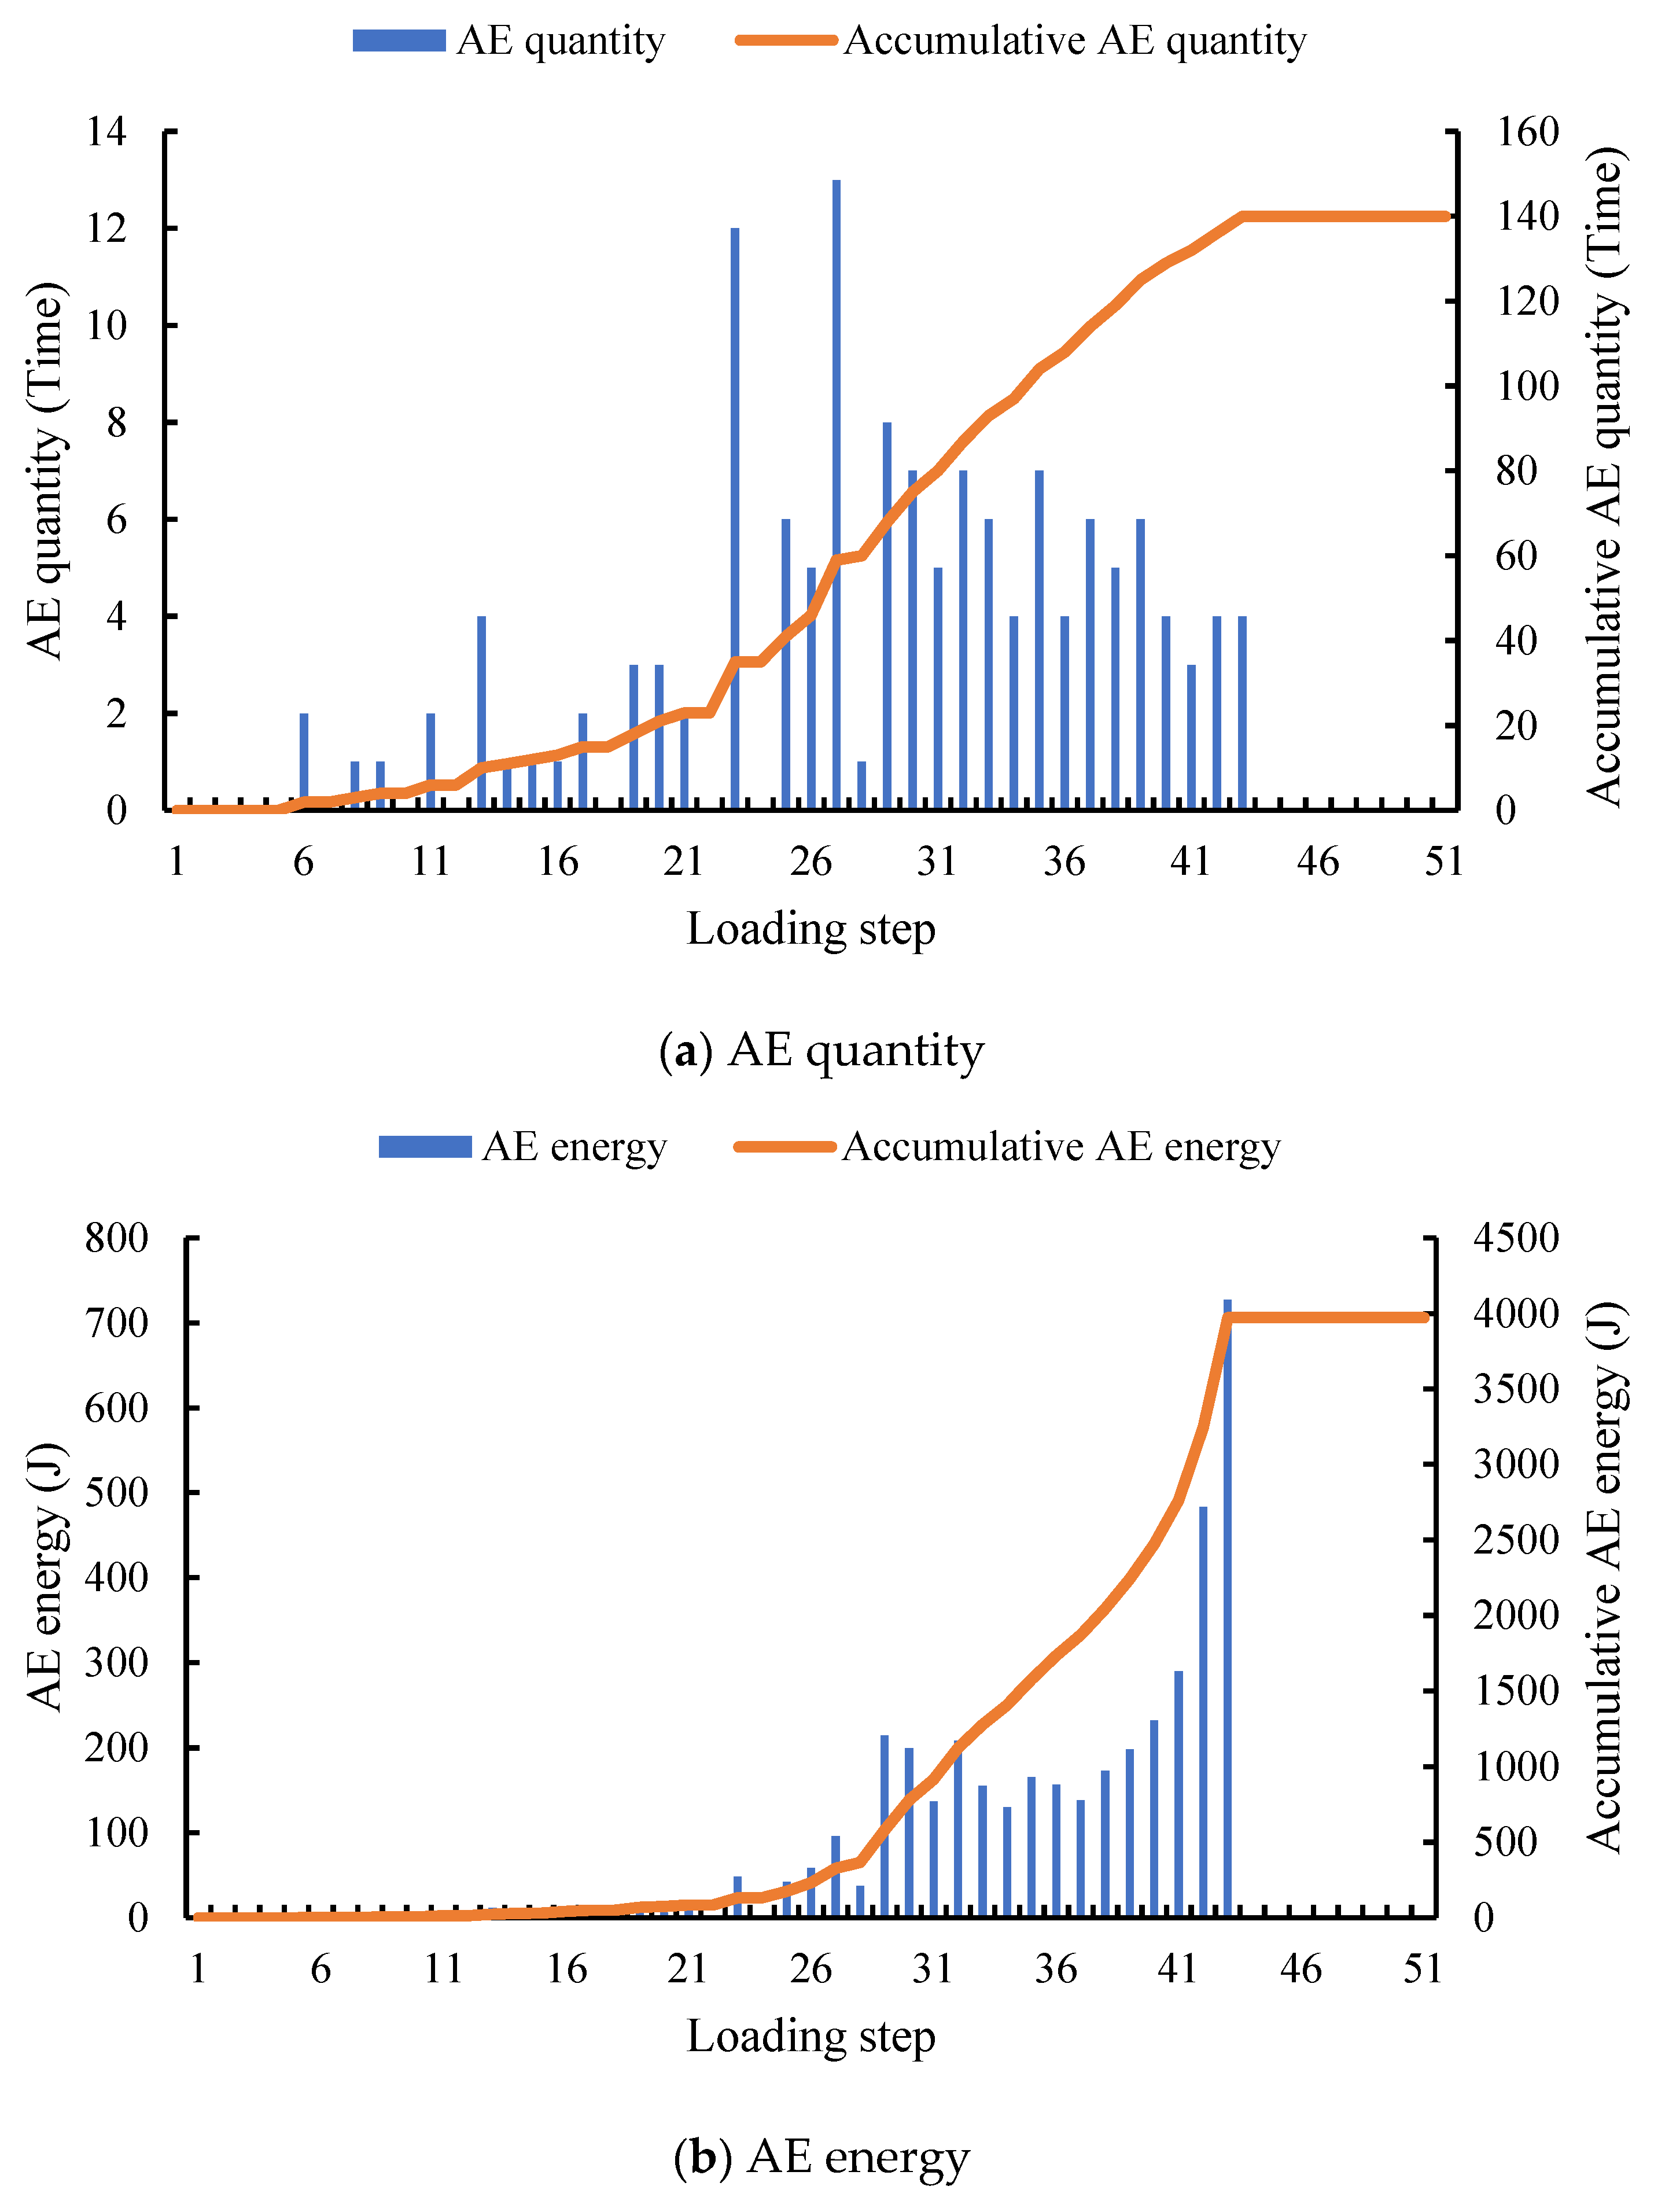
Figure 25.
Acoustic emission variation trend of specimens with concrete contact surface.
Figure 25.
Acoustic emission variation trend of specimens with concrete contact surface.
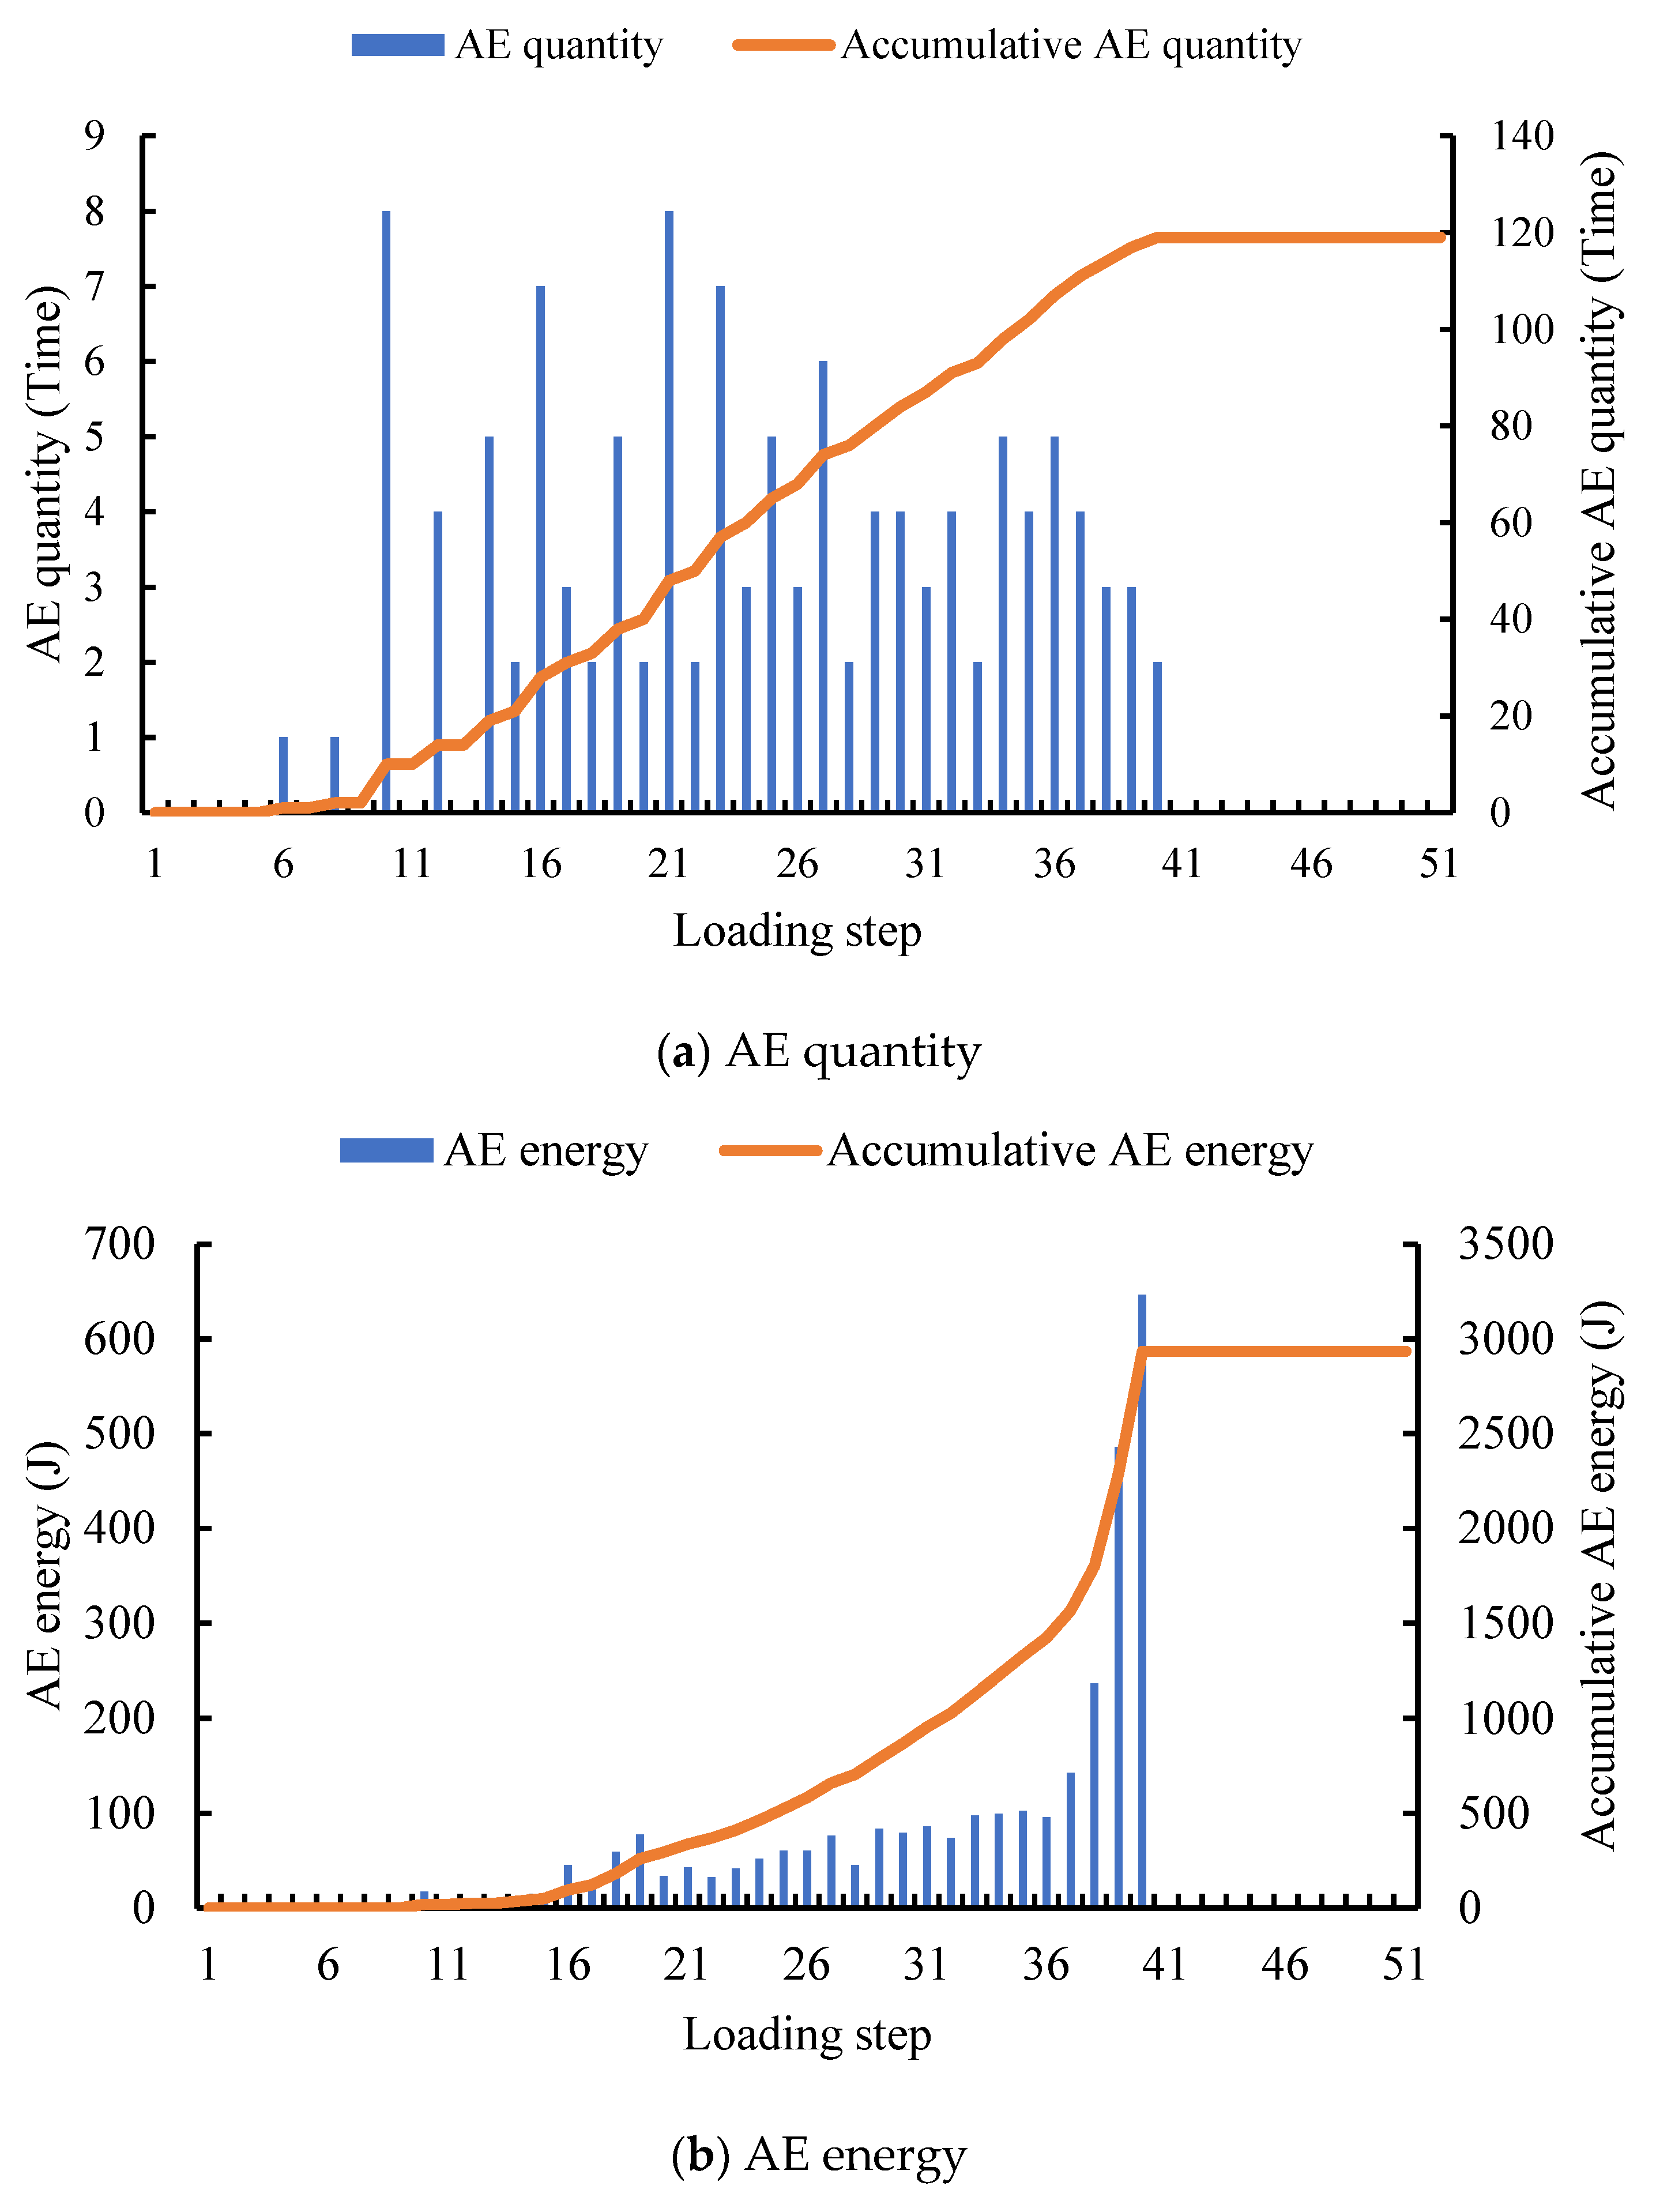
Figure 26.
Variation trend of acoustic emission of specimen with geotextile interface.
Figure 26.
Variation trend of acoustic emission of specimen with geotextile interface.
Table 1.
Test block classification table.
Table 1.
Test block classification table.
| | Contact Surface Category | Ordinary Concrete | Paper Base Asphalt Felt | Geotextile |
|---|
| Cohesion | |
|---|
| Horizontal Cohesion | Hc | Hp | Hg |
| Vertical Cohesion | Vc | Vp | Vg |
Table 2.
The horizontal force of specimens with normal concrete contact surface.
Table 2.
The horizontal force of specimens with normal concrete contact surface.
| | Total Weight of Concrete Test Block (kN) | The First Measured Horizontal Force (kN) | Horizontal Force Measured By Reloading (kN) | Horizontal Bond Force (kN) |
|---|
| Hc-1 | 11 | 36 | 10.7 | 25.3 |
| Hc-2 | 11 | 36 | 16 | 20 |
| Hc-3 | 11 | 44 | 12 | 33 |
| average value | 11 | 38.67 | 12.90 | 25.77 |
Table 3.
The horizontal force of the test piece when the contact surface is paper base asphalt felt.
Table 3.
The horizontal force of the test piece when the contact surface is paper base asphalt felt.
| | Total Weight of Concrete Test Block (kN) | The First Measured Horizontal Force (kN) | Horizontal Force Measured by Reloading (kN) | Horizontal Bond Force (kN) |
|---|
| Hp-1 | 11 | 14 | 6.05 | 7.95 |
| Hp-2 | 11 | 20 | 11 | 9 |
| Hp-3 | 11 | 26 | 20 | 16 |
| average value | 11 | 20.00 | 12.35 | 10.98 |
Table 4.
Horizontal force of the specimen with geotextile on the contact surface.
Table 4.
Horizontal force of the specimen with geotextile on the contact surface.
| | Total Weight of Concrete Test Block (kN) | The First Measured Horizontal Force (kN) | Horizontal Force Measured by Reloading (kN) | Horizontal Bond Force (kN) |
|---|
| Hg-1 | 11 | 12 | 10 | 2 |
| Hg-2 | 11 | 20 | 12 | 8 |
| Hg-3 | 11 | 14 | 12 | 2 |
| average value | 11 | 15.33 | 11.33 | 4.00 |
Table 5.
The vertical force of the specimen with the contact surface of ordinary concrete.
Table 5.
The vertical force of the specimen with the contact surface of ordinary concrete.
| | Total Weight of Concrete Test Block (kN) | Initial Value (kN) | Load Measured Vertical Force (kN) | Vertical Bonding Force (kN) |
|---|
| Hc-1 | 11 | 17.2 | 31.0 | 2.8 |
| Hc-2 | 11 | 17.5 | 31.0 | 2.5 |
| Hc-3 | 11 | 17.18 | 31.1 | 2.92 |
| average value | 11 | 17.29 | 31.0 | 2.71 |
Table 6.
The vertical force of the test piece when the contact surface is paper base asphalt felt.
Table 6.
The vertical force of the test piece when the contact surface is paper base asphalt felt.
| | Total Weight Of Concrete Test Block (kN) | Initial value (kN) | Load Measured Vertical Force (kN) | Vertical Bonding Force (kN) |
|---|
| Hp-1 | 11.8 | 16.8 | 28.4 | 0.6 |
| Hp-2 | 11.8 | 17.7 | 30.9 | 2.2 |
| Hp-3 | 11.8 | 18.3 | 32.9 | 3.6 |
| average value | 11.8 | 17.60 | 30.73 | 2.13 |
Table 7.
Vertical force of test piece with geotextile on the contact surface.
Table 7.
Vertical force of test piece with geotextile on the contact surface.
| | Total Weight Of Concrete Test Block (kN) | Initial Value (kN) | Load Measured Vertical Force (kN) | Vertical Bonding Force (kN) |
|---|
| Hg-1 | 11 | 18.2 | 34.5 | 5.3 |
| Hg-2 | 11 | 16.7 | 31 | 3.3 |
| Hg-3 | 11 | 16.5 | 31 | 3.5 |
| average value | 11 | 17.13 | 32.17 | 4.03 |
Table 8.
The horizontal bonding strength of different specimens and the time when the maximum horizontal force was measured.
Table 8.
The horizontal bonding strength of different specimens and the time when the maximum horizontal force was measured.
| | Hc | Hp | Hg |
|---|
| Horizontal cohesive force (kN) | 25.77 | 10.98 | 4 |
| Time of maximum horizontal bearing capacity measured at the first loading (s) | 524 | 264 | 168 |
| Time of maximum horizontal bearing capacity measured by the second loading (s) | 132 | 85 | 127 |
| The time difference of the maximum horizontal bearing capacity measured by two loadings (s) | 410 | 179 | 41 |
Table 9.
The vertical bonding strength of different specimens and the time required to measure the maximum vertical bearing capacity.
Table 9.
The vertical bonding strength of different specimens and the time required to measure the maximum vertical bearing capacity.
| | Vc | Vp | Vg |
|---|
| Vertical cohesive force (kN) | 2.71 | 2.13 | 4.03 |
| Time required for loading to the maximum vertical bearing capacity (s) | 286 | 269 | 299 |


