
Effect of Masonry Infill Constitutive Law on the Global Response of Infilled RC Buildings


Abstract
:1. Introduction
2. Modeling Approaches to Simulate the Presence of Masonry Infills
2.1. Micro- and Macro-Modeling Approaches
2.2. Single-Strut Model
2.3. Single-Strut Geometry
2.3.1. Single-Strut Constitutive Law
2.3.2. Single-Strut Cyclic Law
3. Research Methodology
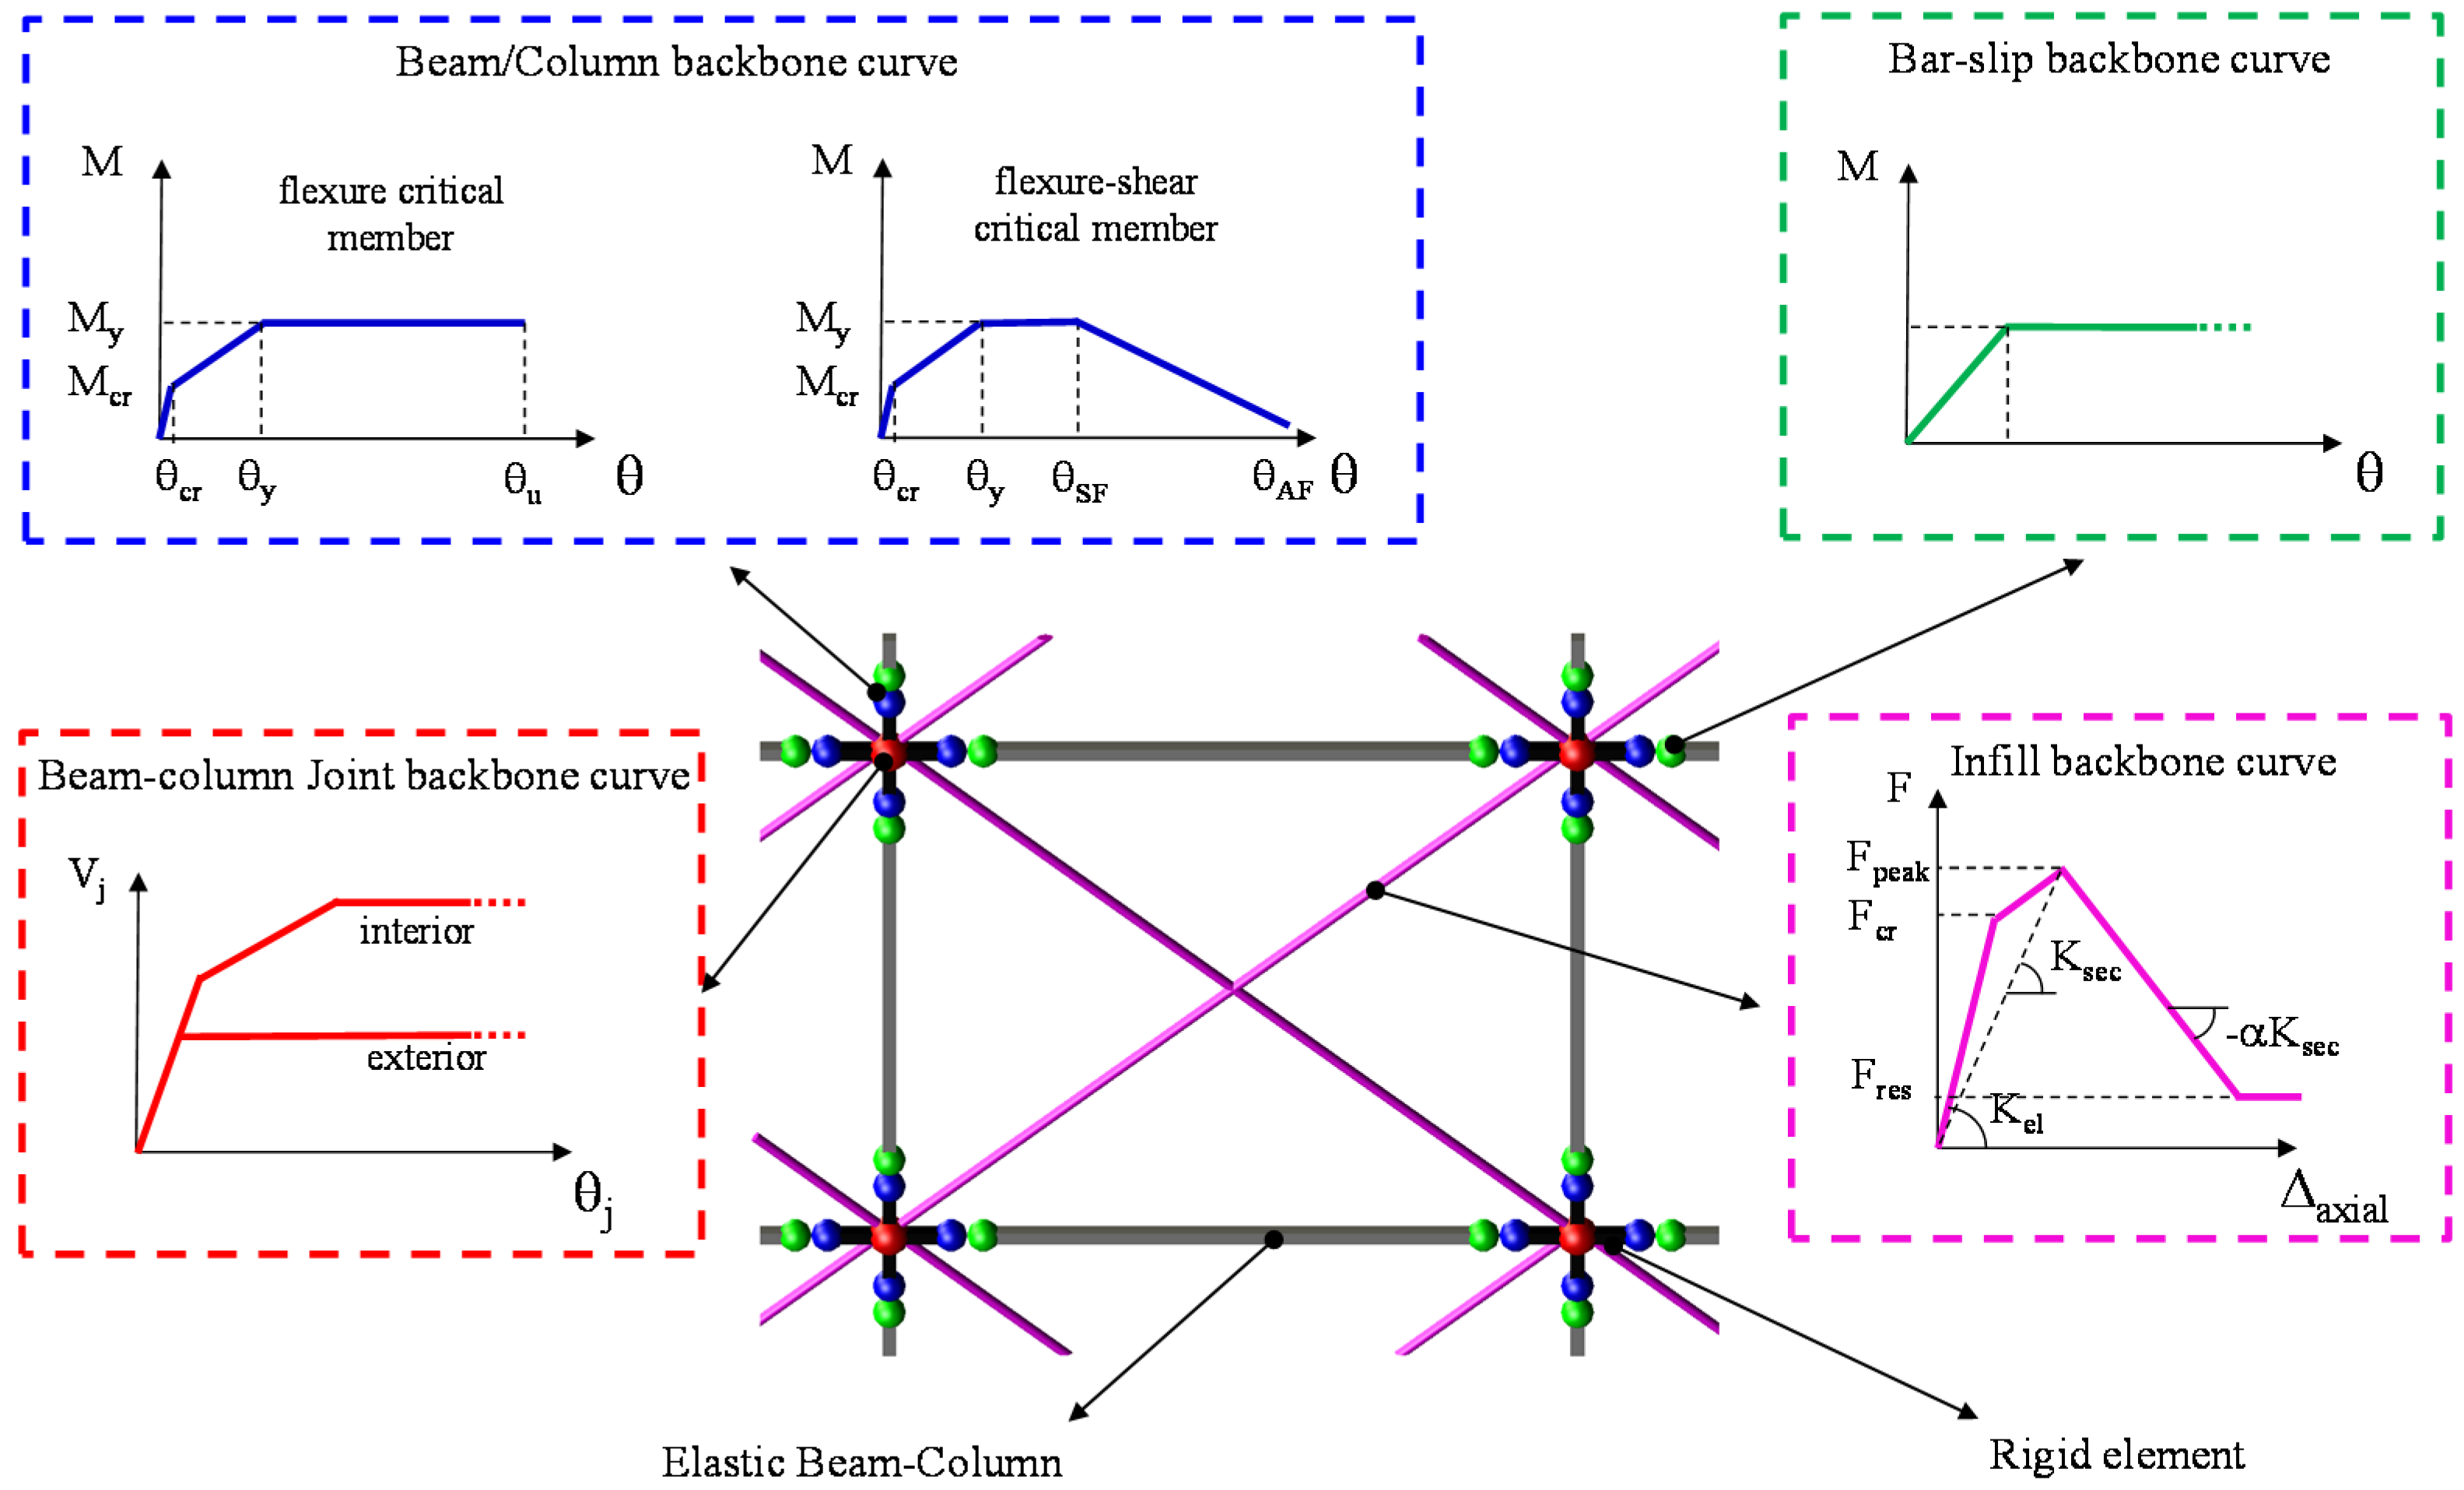
4. Numerical Model for the Case-Study Building
5. Influence of Modeling Assumptions
6. Results of NRHAs
7. Conclusions
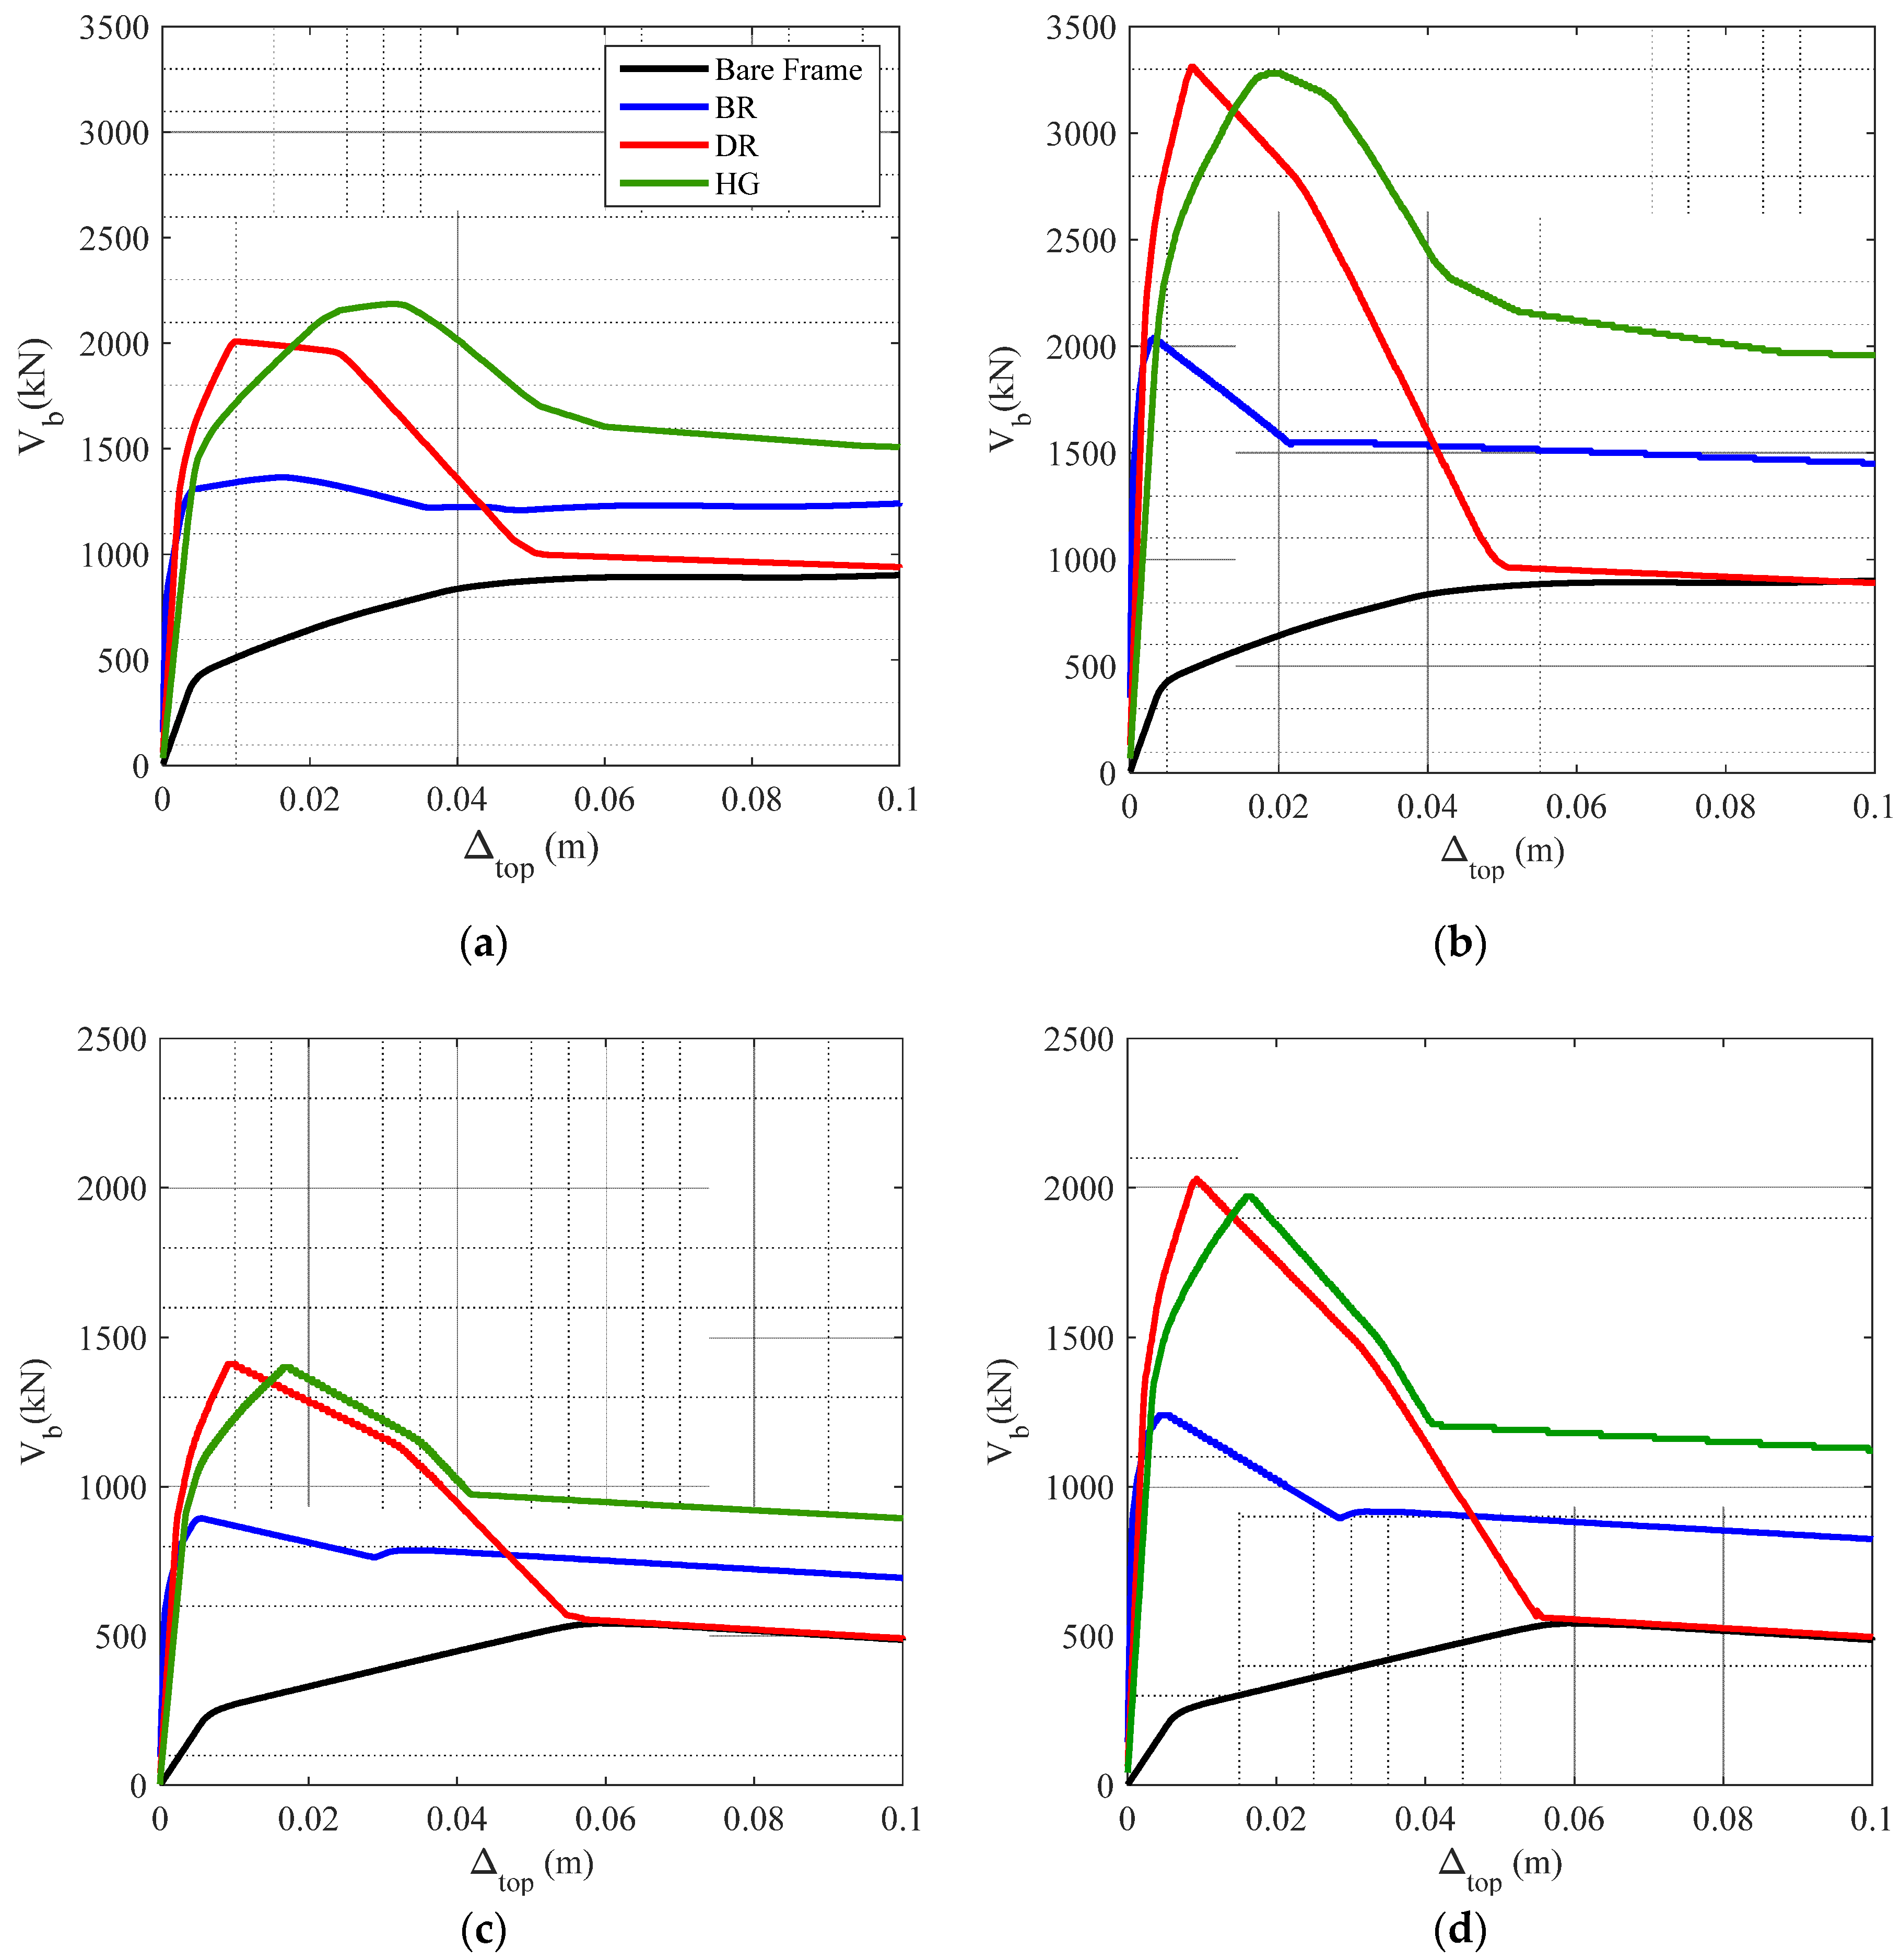
- The presence of infills has a significant effect on the global response of RC frames both in terms of lateral stiffness and strength. This effect depends on the relative contribution to the lateral strength of the infill panels with respect to that of the RC frame and reduces as the opening percentage increases. For fully filled frames, the base shear strength increases between 227% and 365% with respect to that obtained for the corresponding bare frame configuration. The infill contribution reduces to a value comprised between 152% and 261% considering the actual opening configuration for the case-study building.
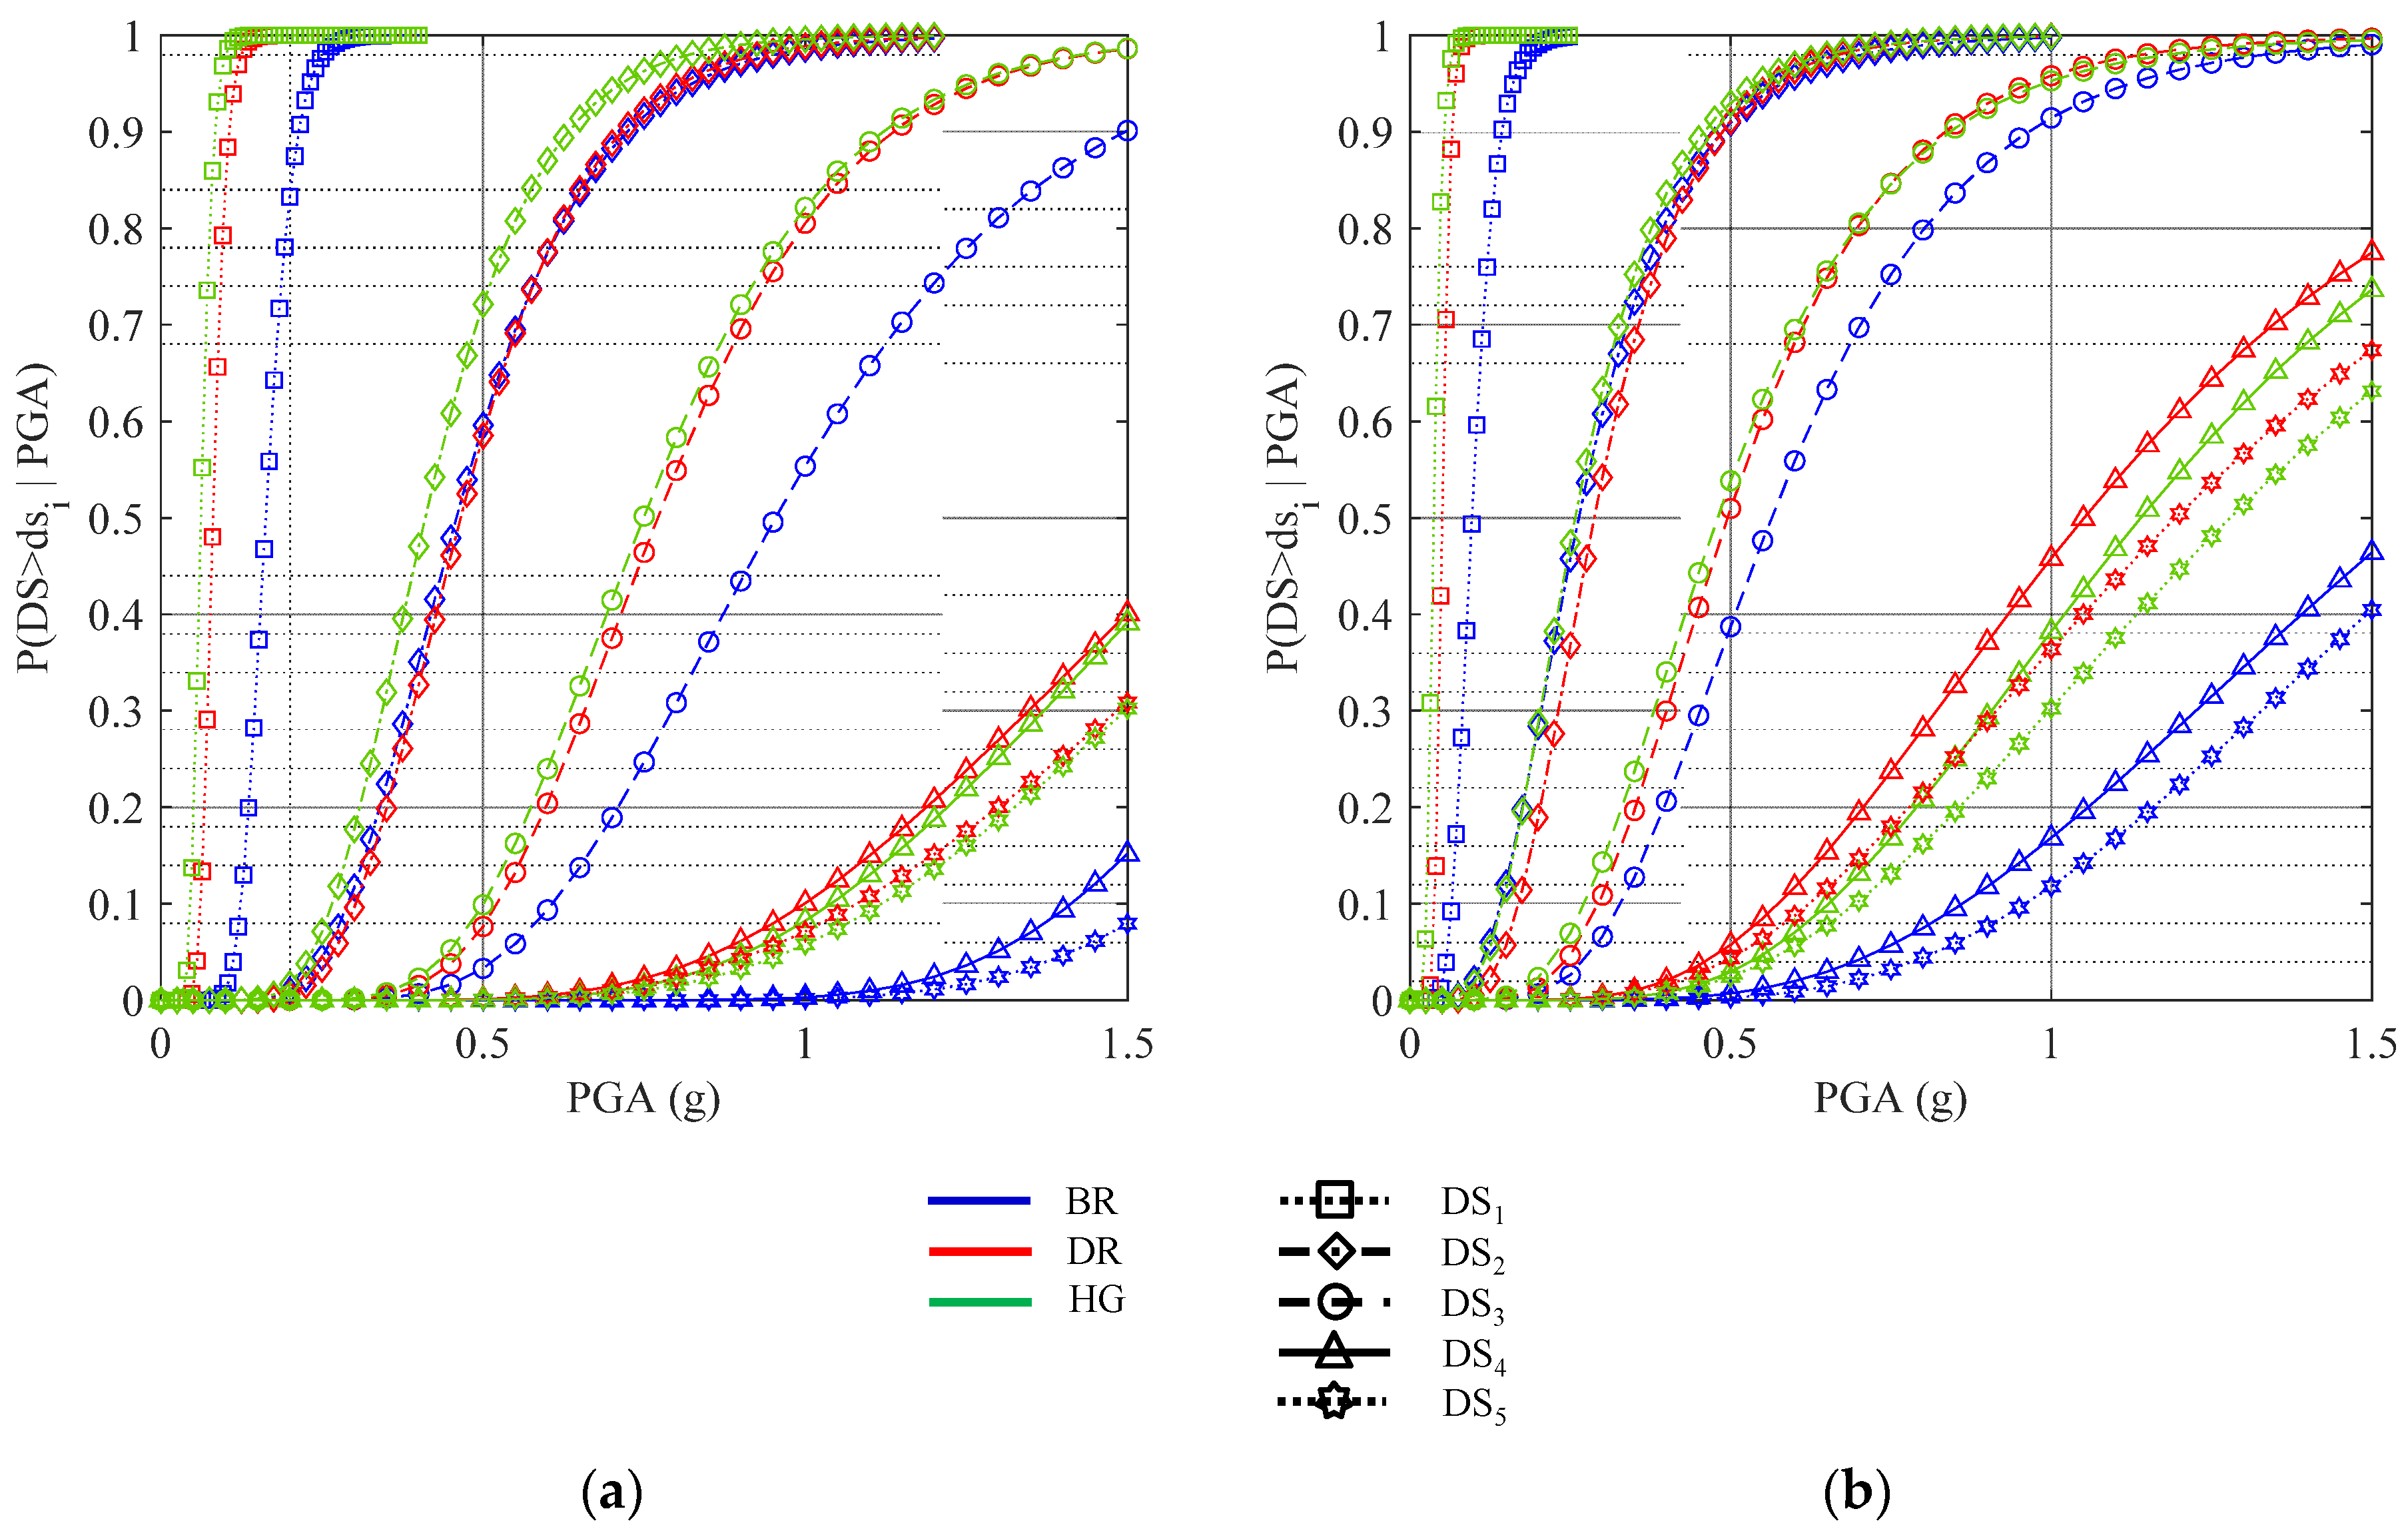
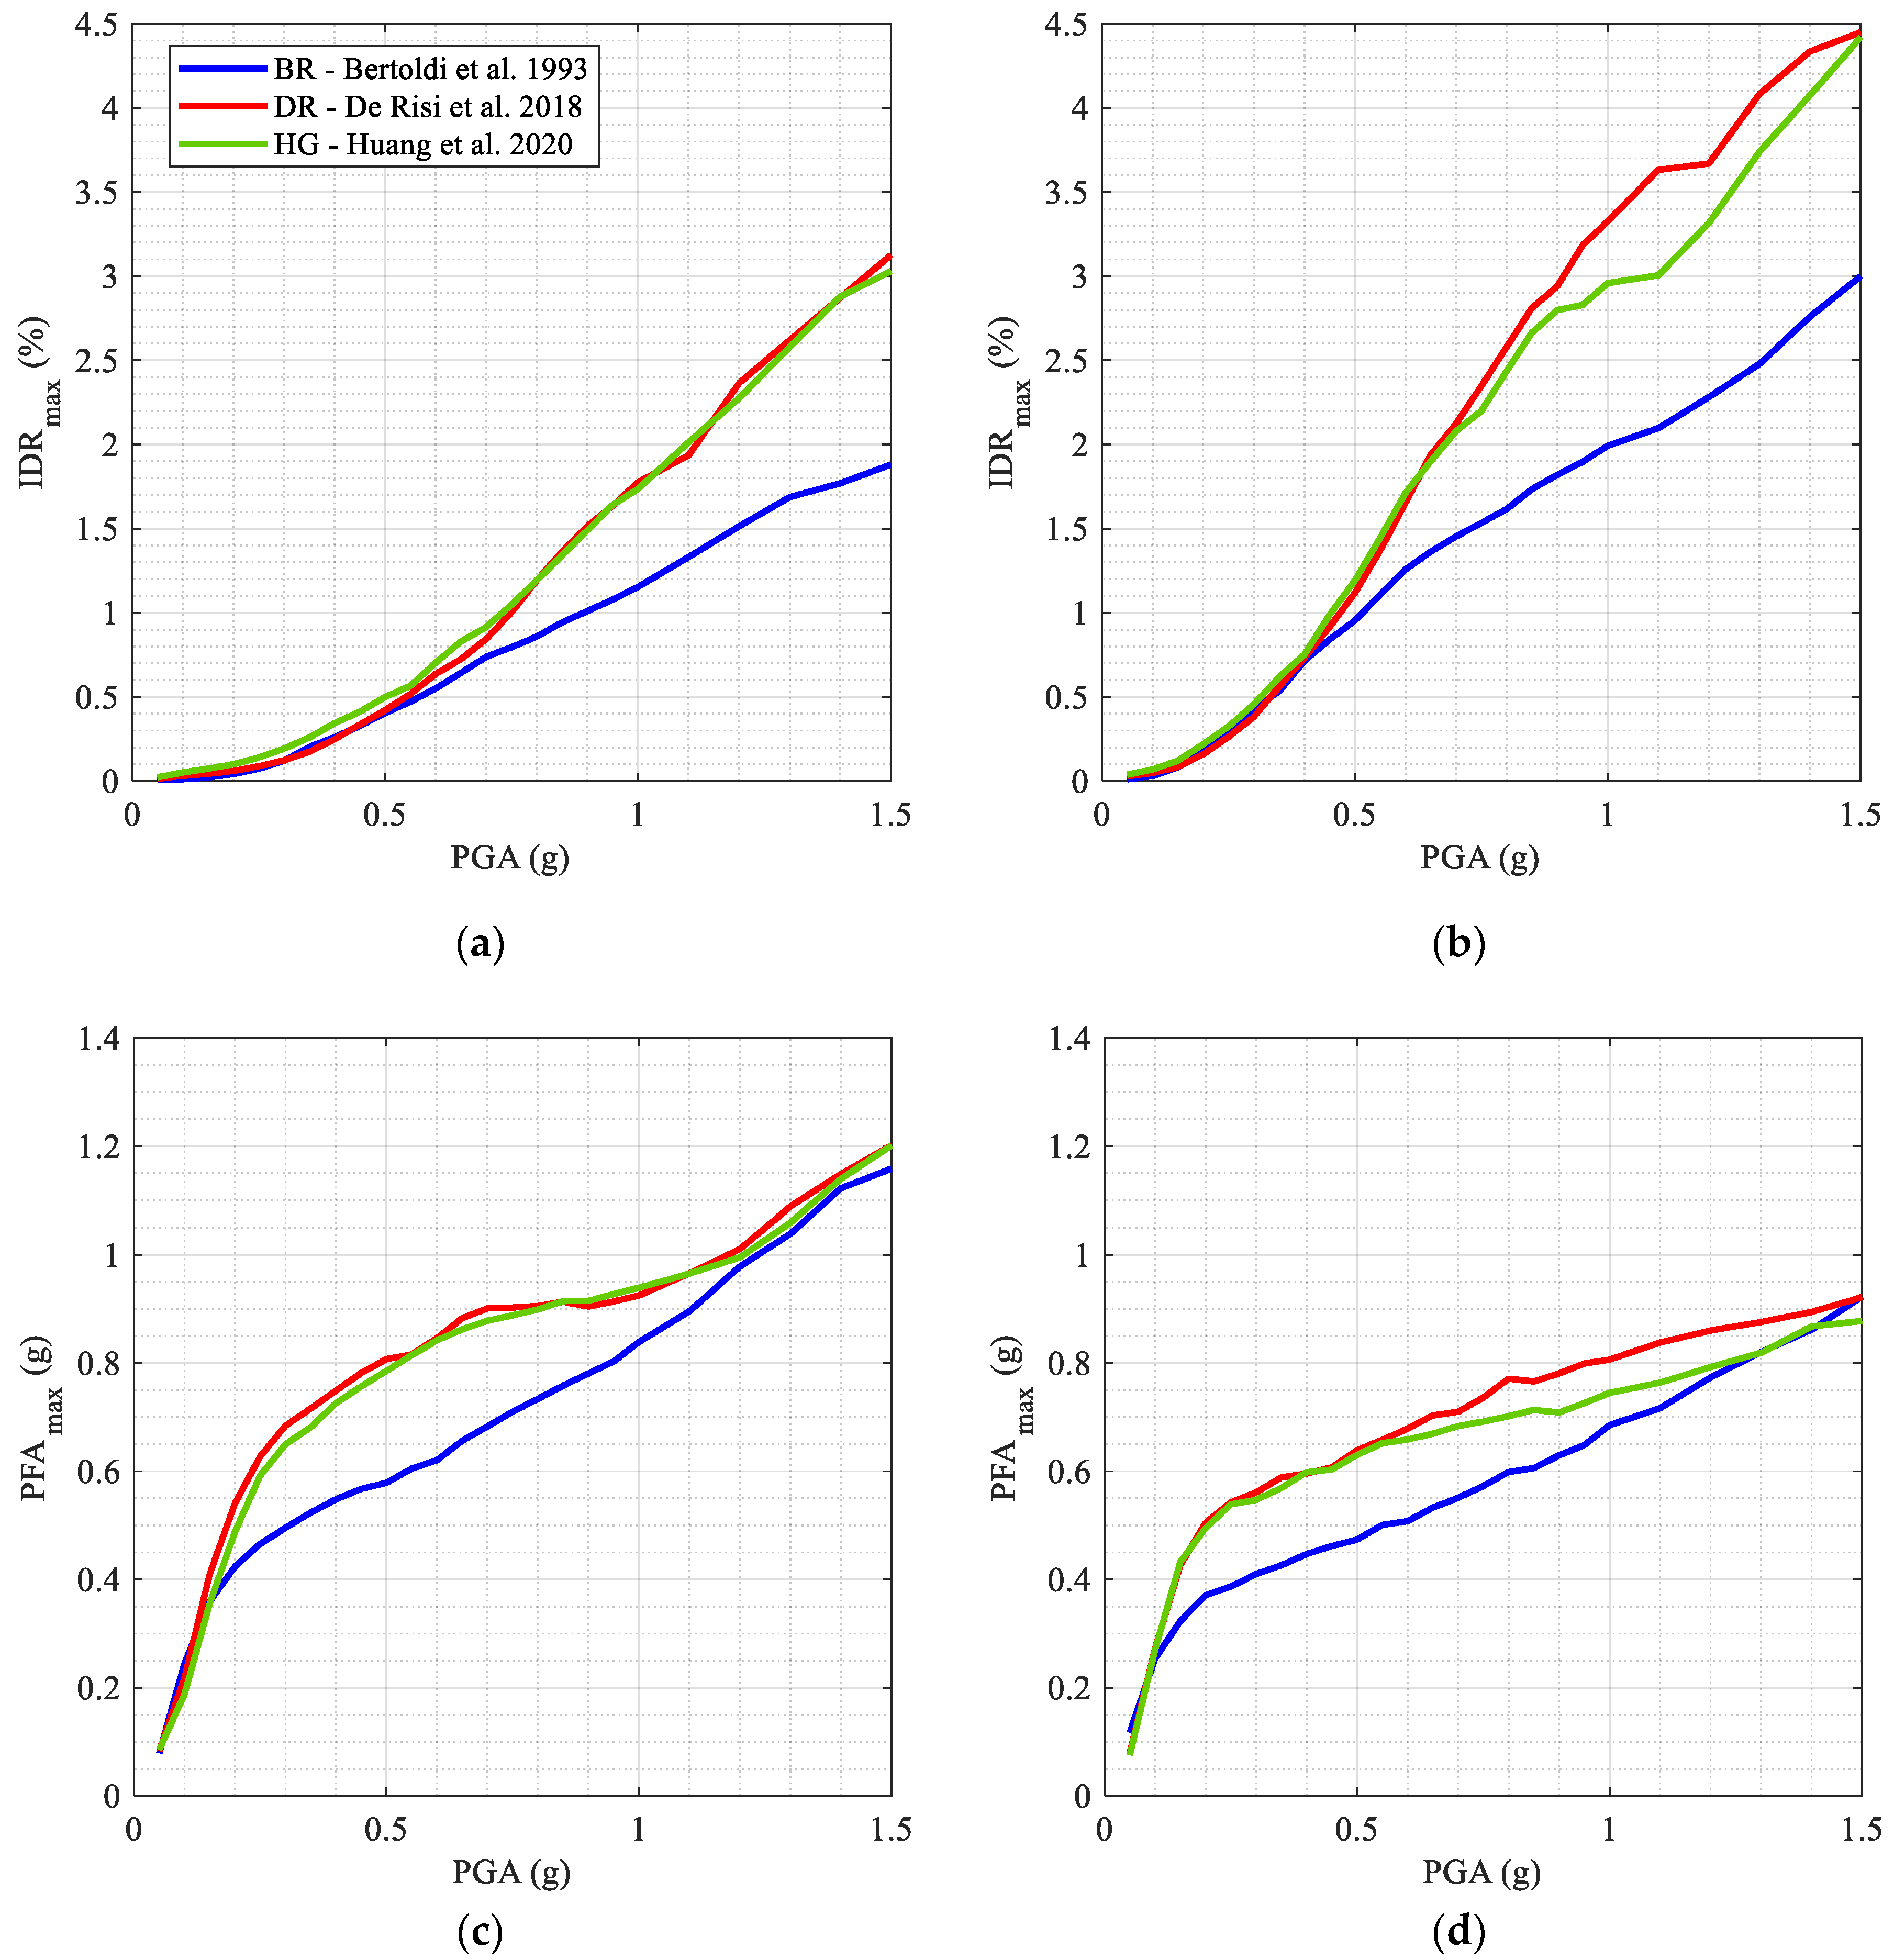
- The adopted constitutive model significantly influences the probability of attainment of a given damage state. The scatter in prediction between different constitutive models in terms of median PGAs is comprised between 2% and 60% depending on the adopted constitutive model and the selected damage state. The dispersion of results, which is related only to record-to-record variability, is slightly influenced by the constitutive law adopted while it mainly depends on the selected damage state and is comprised between 0.21 and 0.51 in terms of logarithmic dispersion.
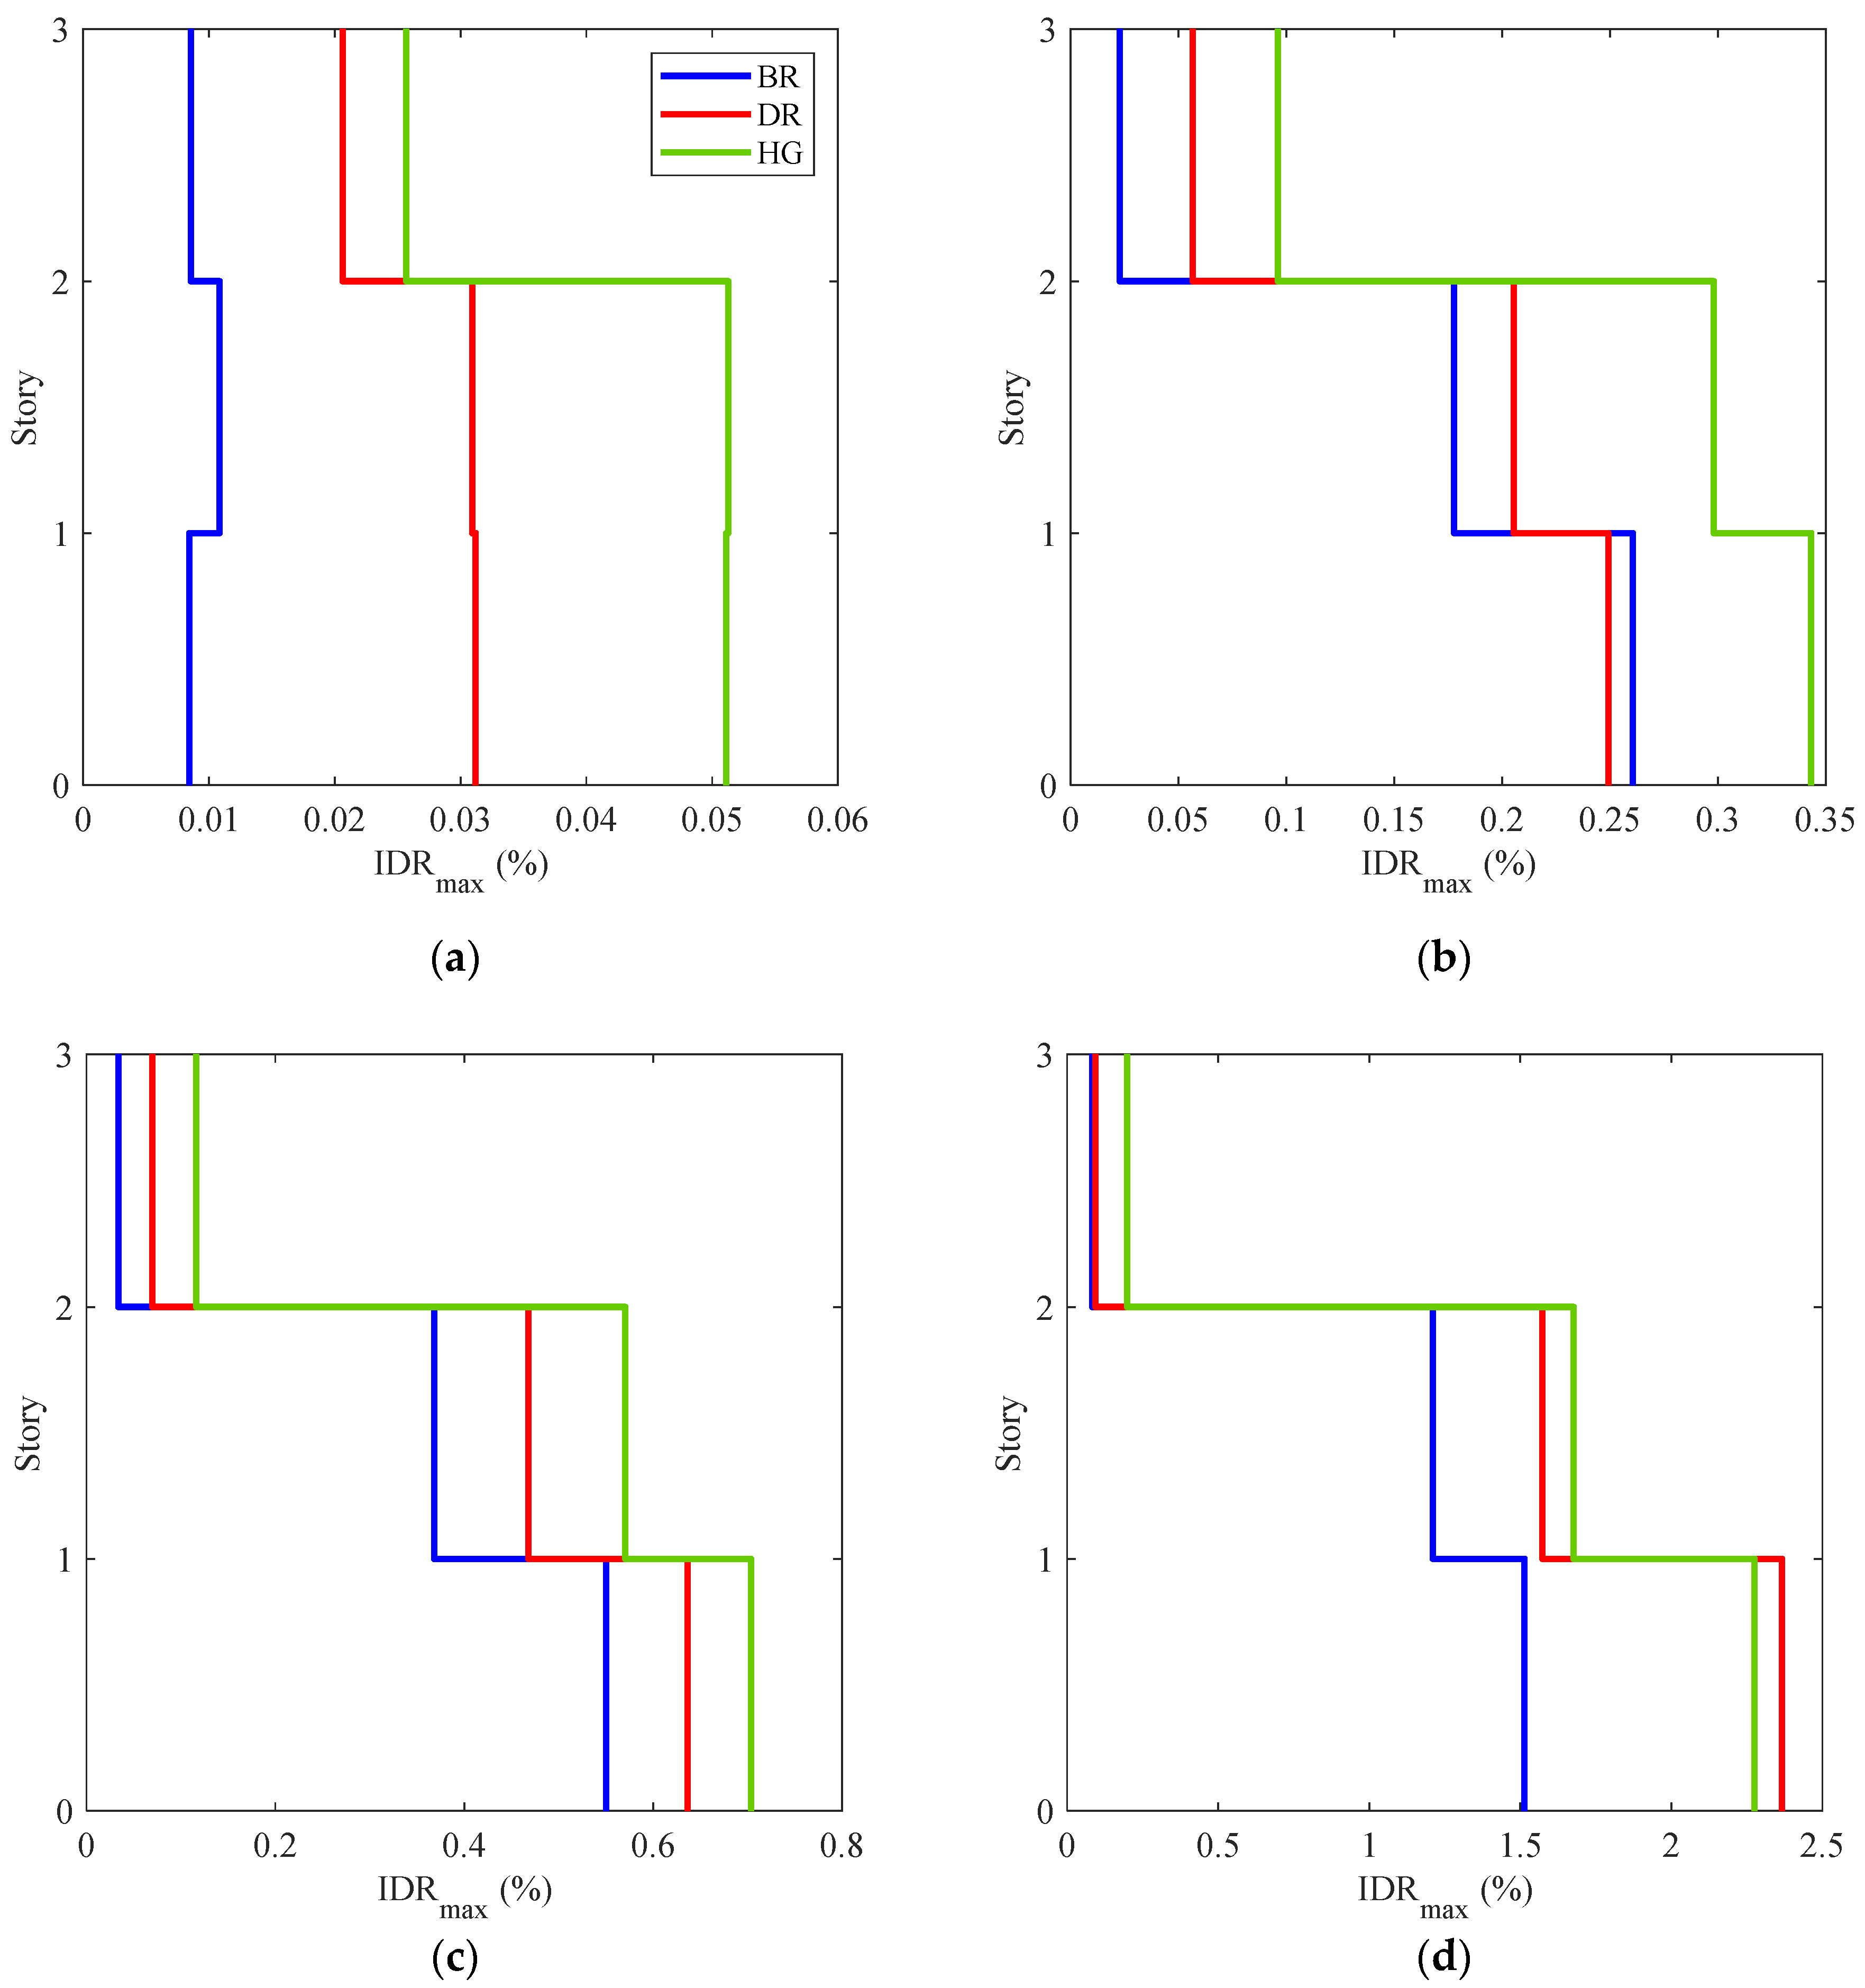
- In terms of interstory drift ratios, the presence of infills lead to a more uniform distribution along the height with respect to the corresponding bare frame. For lower seismic intensities, a uniform distribution of lateral deformations along the height occurs, and the scatter of IDR due to different infill constitutive models may be very high and comprised between 270% and 590%. For increasing intensities, the scatter due to different infill constitutive models significantly lowers to values comprised between 4% and 56%. However, the distribution of lateral deformation shape along the height is not influenced by the employed constitutive model.
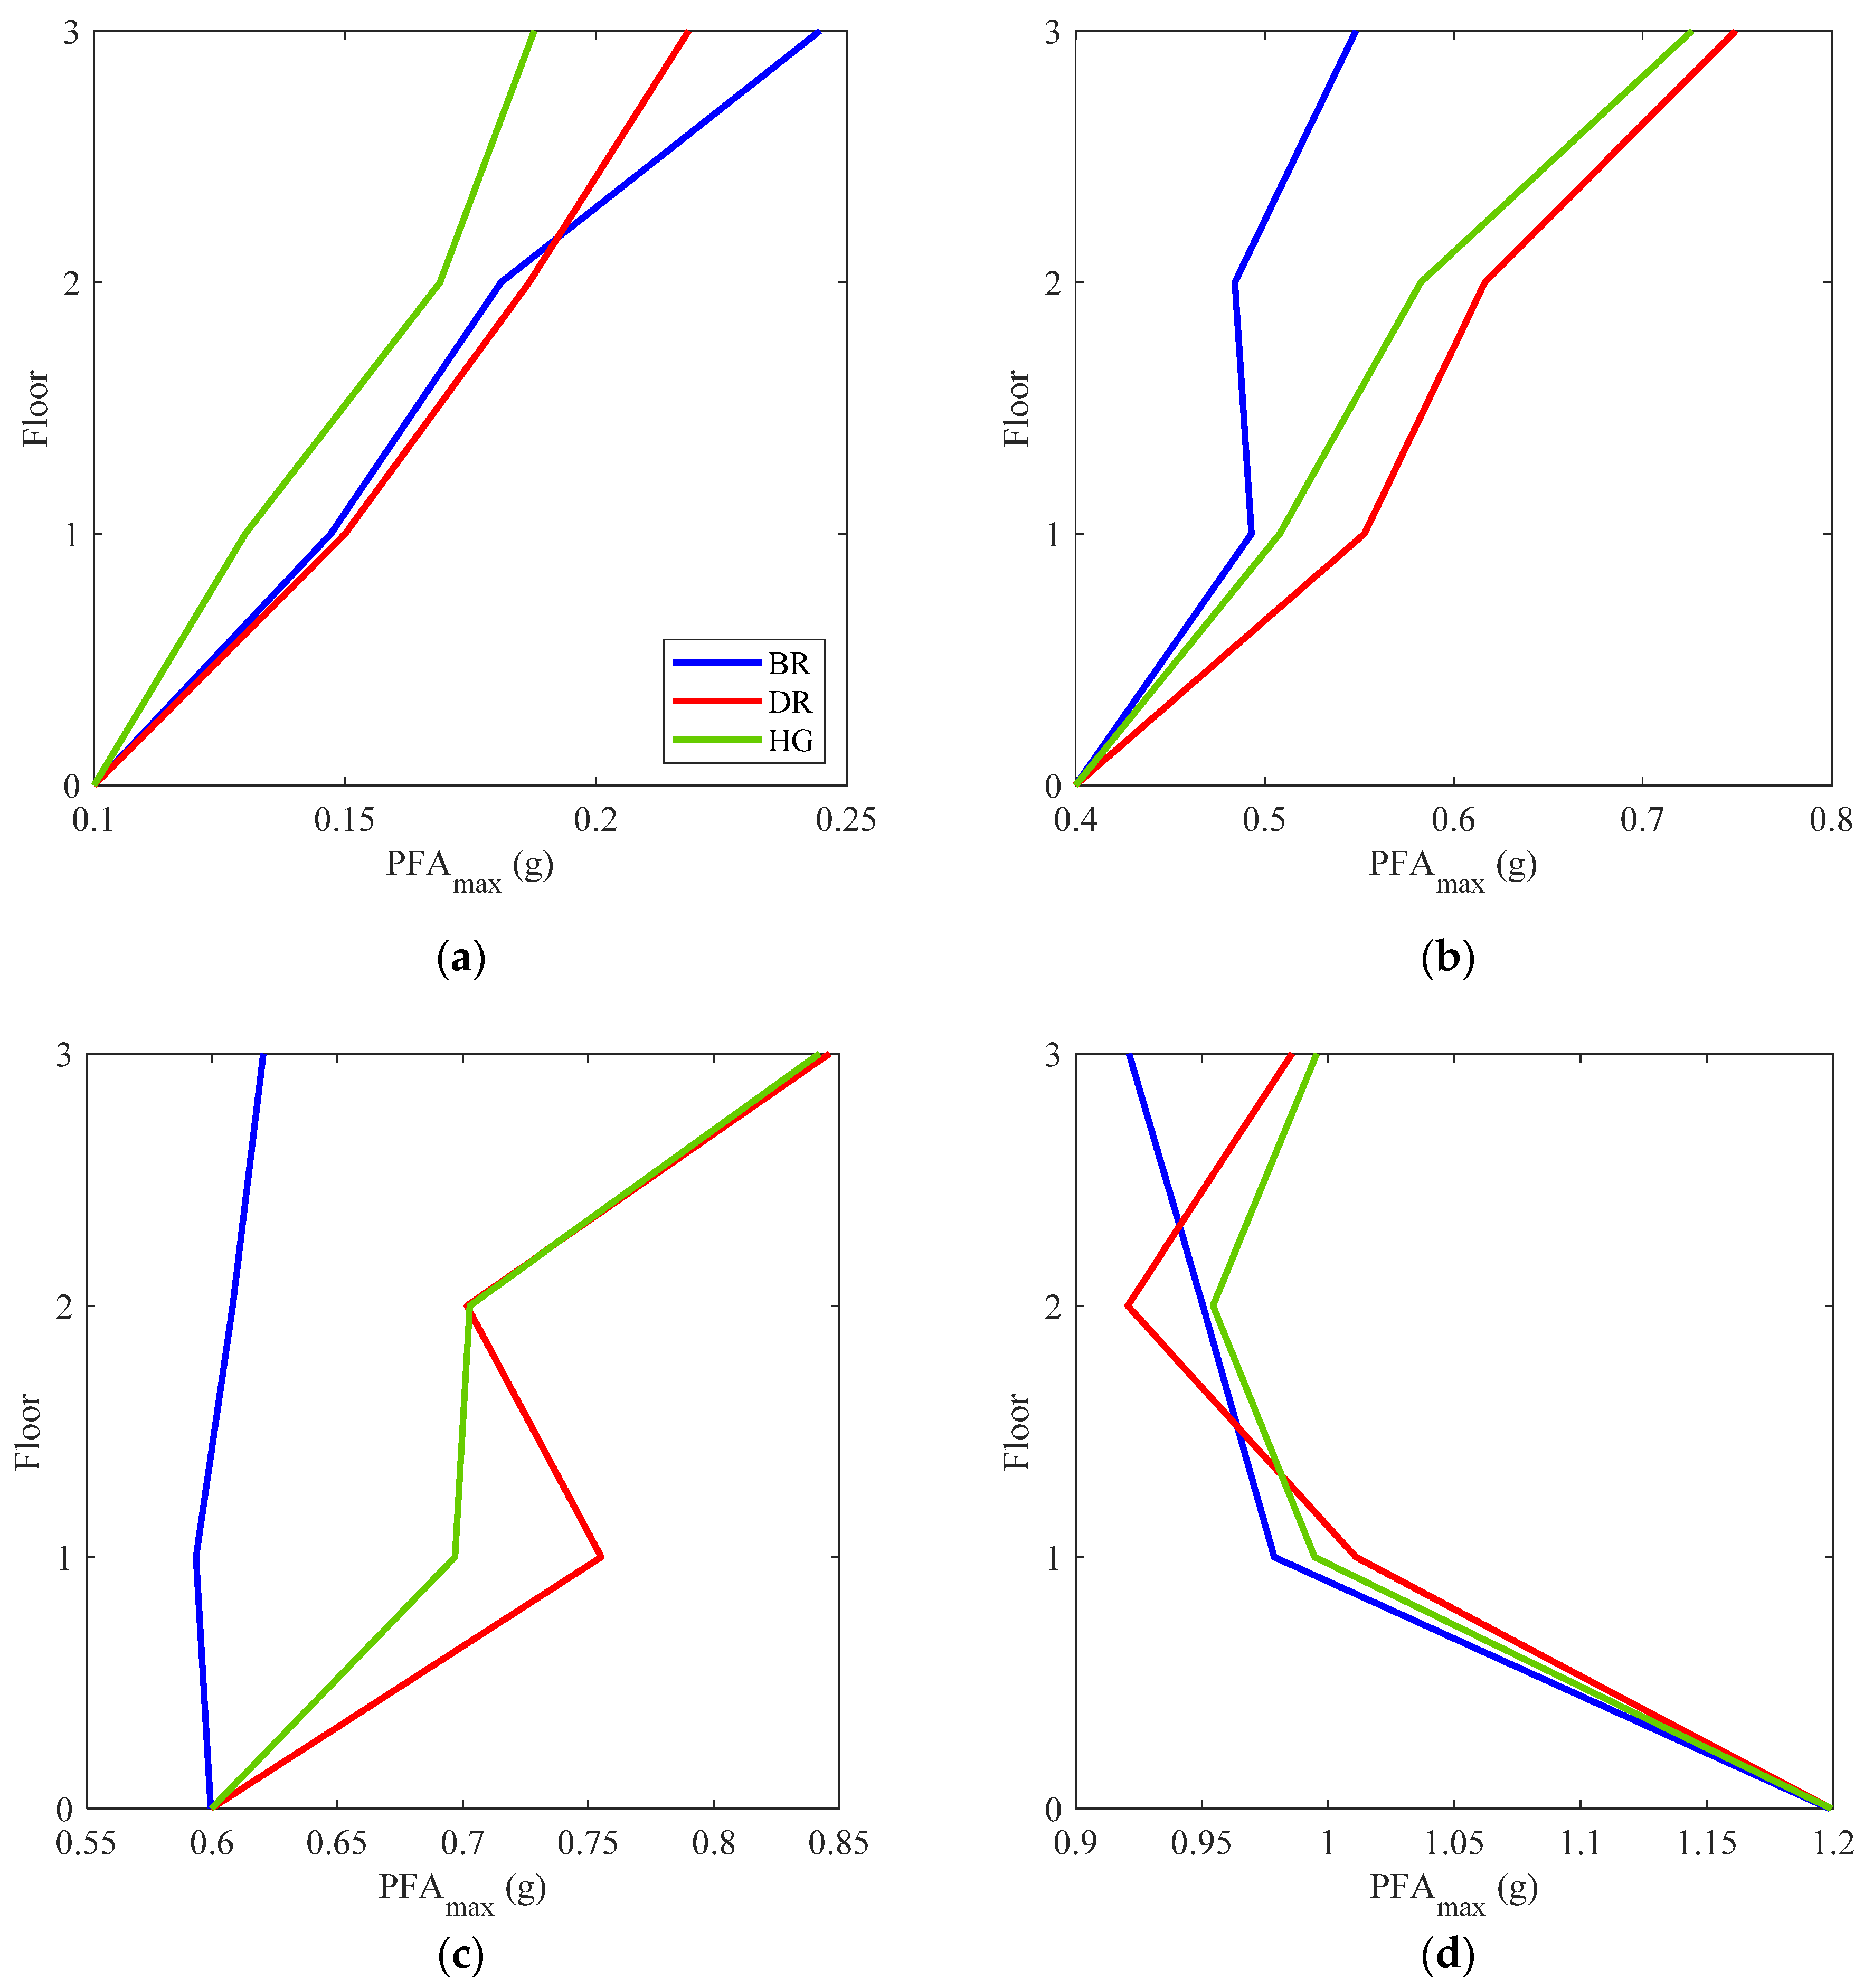
- In terms of peak floor accelerations, the distribution linearly increases along the height for lower seismic intensities. As the seismic intensity increases and the damage spreads throughout the structure, the acceleration demand reduces in upper stories with respect to the base acceleration. For higher seismic intensities, as the damage attained is very high, the acceleration demand at upper stories is lower than the base acceleration.
Author Contributions
Funding
Data Availability Statement
Acknowledgments
Conflicts of Interest
References
- Polese, M.; Gaetani d’Aragona, M.; Prota, A. Simplified approach for building inventory and seismic damage assessment at the territorial scale: An application for a town in southern Italy. Soil Dyn. Earthq. Eng. 2019, 121, 405–420. [Google Scholar] [CrossRef]
- Polese, M.; Di Ludovico, M.; Gaetani d’Aragona, M.; Prota, A.; Manfredi, G. Regional vulnerability and risk assessment accounting for local building typologies. Int. J. Disaster Risk Reduct. 2020, 43, 101400. [Google Scholar] [CrossRef]
- Manfredi, G.; Prota, A.; Verderame, G.M.; De Luca, F.; Ricci, P. Emilia earthquake, Italy: Reinforced concrete buildings re-sponse. Bull. Earthq. Eng. 2014, 12, 2275–2298. [Google Scholar] [CrossRef] [Green Version]
- Ricci, P.; Verderame, G.M.; Manfredi, G. Analytical investigation of elastic period of infilled RC MRF buildings. Eng. Struct. 2011, 33, 308–319. [Google Scholar] [CrossRef]
- Gaetani d’Aragona, M.; Polese, M.; Prota, A. Influence Factors for the Assessment of Maximum Lateral Seismic Deformations in Italian Multistorey RC Buildings. In Proceedings of the 6th ECCOMAS Thematic Conference on Computational Methods in Structural Dynamics and Earthquake Engineering, Rhodes Island, Greece, 15–17 June 2017. [Google Scholar]
- Gaetani d’Aragona, M.; Polese, M.; Cosenza, E.; Prota, A. Simplified assessment of maximum interstory drift for RC buildings with irregular infills distribution along the height. Bull. Earthq. Eng. 2019, 17, 707–736. [Google Scholar] [CrossRef]
- Dolšek, M.; Fajfar, P. The effect of masonry infills on the seismic response of a four storey reinforced concrete frame—A deterministic assessment. Eng. Struct. 2008, 30, 1991–2001. [Google Scholar] [CrossRef]
- Penava, D.; Sarhosis, V.; Kožar, I.; Guljaš, I. Contribution of RC columns and masonry wall to the shear resistance of masonry infilled RC frames containing different in size window and door openings. Eng. Struct. 2018, 172, 105–130. [Google Scholar] [CrossRef] [Green Version]
- Uva, G.; Porco, F.; Fiore, A. Appraisal of masonry infill walls effect in the seismic response of RC framed buildings: A case study. Eng. Struct. 2012, 34, 514–526. [Google Scholar] [CrossRef]
- Tesfamariam, S.; Goda, K.; Mondal, G. Seismic vulnerability of reinforced concrete frame with unreinforced masonry infill due to mainshock–aftershock earthquake sequences. Earthq. Spectra 2015, 31, 1427–1449. [Google Scholar] [CrossRef]
- Polese, M.; Gaetani d’Aragona, M.; Prota, A.; Manfredi, G. Seismic behavior of damaged buildings: A comparison of static and dynamic nonlinear approach. In Proceedings of the 4th ECCOMAS Thematic Conference on Computational Methods in Structural Dy-namics and Earthquake Engineering, Kos Island, Greece, 12–14 June 2013; pp. 608–625. [Google Scholar]
- Gaetani d’Aragona, M.; Polese, M.; Prota, A. Relationship between the variation of seismic capacity after damaging earth-quakes, collapse probability and repair costs: Detailed evaluation for a non-ductile building. In Proceedings of the 5th ECCOMAS Thematic Conference on Computational Methods in Structural Dynamics and Earthquake Engineering, Crete Island, Greece, 25–27 May 2015; pp. 1478–1495. [Google Scholar]
- Gaetani d’Aragona, M.; Polese, M.; Elwood, K.J.; Baradaran Shoraka, M.; Prota, A. Aftershock collapse fragility curves for non-ductile RC buildings: A scenario-based assessment. Earthq. Eng. Struct. Dyn. 2017, 46, 2083–2102. [Google Scholar] [CrossRef]
- Ricci, P.; De Luca, F.; Verderame, G.M. 6th April 2009 L’Aquila earthquake, Italy: Reinforced concrete building performance. Bull. Earthq. Eng. 2011, 9, 285–305. [Google Scholar] [CrossRef] [Green Version]
- Cavaleri, L.; Di Trapani, F. Prediction of the additional shear action on frame members due to infills. Bull. Earthq. Eng. 2015, 13, 1425–1454. [Google Scholar] [CrossRef]
- Cavaleri, L.; Di Trapani, F.; Asteris, P.G.; Sarhosis, V. Influence of column shear failure on pushover based assessment of masonry infilled reinforced concrete framed structures: A case study. Soil Dyn. Earthq. Eng. 2017, 100, 98–112. [Google Scholar] [CrossRef] [Green Version]
- Basha, S.H.; Kaushik, H.B. A novel macromodel for prediction of shear failure in columns of masonry infilled RC frames under earthquake loading. Bull. Earthq. Eng. 2019, 17, 2219–2244. [Google Scholar] [CrossRef]
- Di Trapani, F.; Macaluso, G.; Cavaleri, L.; Papia, M. Masonry infills and RC frames interaction: Literature overview and state of the art of macromodeling approach. Eur. J. Environ. Civ. Eng. 2015, 19, 1059–1095. [Google Scholar] [CrossRef]
- Noh, N.M.; Liberatore, L.; Mollaioli, F.; Tesfamariam, S. Modelling of masonry infilled RC frames subjected to cyclic loads: State of the art review and modelling with OpenSees. Eng. Struct. 2017, 150, 599–621. [Google Scholar] [CrossRef]
- Gaetani d’Aragona, M.; Polese, M.; Di Ludovico, M.; Prota, A. Seismic vulnerability for RC infilled frames: Simplified evaluation for as-built and retrofitted building typologies. Buildings 2018, 8, 137. [Google Scholar] [CrossRef] [Green Version]
- Polese, M.; Gaetani d’Aragona, M.; Di Ludovico, M.; Prota, A. Sustainable selective mitigation interventions towards effective earthquake risk reduction at the community scale. Sustainability 2018, 10, 2894. [Google Scholar] [CrossRef] [Green Version]
- Asteris, P.G. Finite Element Micro-Modeling of Infilled Frames. Elect. J. Struct. Eng. 2008, 8, 1–11. [Google Scholar]
- Asteris, P.; Cotsovos, D.; Chrysostomou, C.; Mohebkhah, A.; Al-Chaar, G. Mathematical micromodeling of infilled frames: State of the art. Eng. Struct. 2013, 56, 1905–1921. [Google Scholar] [CrossRef]
- Crisafulli, F. Seismic Behavior of Reinforced Concrete Structures with Masonry Infills; University of Canterbury: Canterbury, UK, 1997. [Google Scholar]
- Crisafulli, F.J.; Carr, A.J.; Park, R. Analytical modelling of infilled frame structures—A general review. Bull. N. Z. Soc. Earthq. Eng. 2000, 33, 30–47. [Google Scholar]
- Asteris, P.G.; Antoniou, S.T.; Sophianopoulos, D.S.; Chrysostomou, C.Z. Mathematical Macromodeling of Infilled Frames: State of the Art. J. Struct. Eng. 2011, 137, 1508–1517. [Google Scholar] [CrossRef]
- Lourenço, P.B. Computations on historic masonry structures. Prog. Struct. Eng. Mater. 2002, 4, 301–319. [Google Scholar] [CrossRef]
- Asteris, P.; Tzamtzis, A. On the use of a regular yield surface for the analysis of unreinforced masonry walls. Electron. J. Struct. Eng. 2003, 3, 23–42. [Google Scholar]
- Stafford Smith, B. Behaviour of square infilled frames. J. Struct. Div. 1966, 92, 381–403. [Google Scholar] [CrossRef]
- Mainstone, R.J. On the stiffness and strength of infilled frames. In Proceedings of the Institute of Civil Engineers, London, UK, June 1971; Volume 7360S, pp. 57–89. [Google Scholar] [CrossRef]
- Mainstone, R.J. Supplementary Note on the Stiffness and Strength of Infilled Frames Current Paper CP 13/UK: Building Research Establishment; Building Research Station: Watford, UK, 1974. [Google Scholar]
- Holmes, M. Steel frames with brickwork and concrete filling. In Proceedings of the Institution of Civil Engineers, London, UK, August 1961; Volume 19, pp. 473–478. [Google Scholar] [CrossRef]
- Chrysostomou, C.Z.; Gergely, P.; Abel, J.F. A six-strut model for nonlinear dynamic analysis of steel infilled frames. Int. J. Struct. Stab. Dyn. 2002, 2, 335–353. [Google Scholar] [CrossRef]
- El-Dakhakhni, W.W.; Elgaaly, M.; Hamid, A.A. Three-Strut Model for Concrete Masonry-Infilled Steel Frames. J. Struct. Eng. 2003, 129, 177–185. [Google Scholar] [CrossRef]
- Combescure, D. Some contributions of physical and numerical modelling to the assessment of existing masonry infilled RC frames under extreme loading. In Proceedings of the First European Conference on Earthquake Engineering and Seismology, Geneva, Switzerland, 3–8 September 2006. [Google Scholar]
- Verderame, G.M.; De Luca, F.; Ricci, P.; Manfredi, G. Preliminary analysis of a soft-storey mechanism after the 2009 L’Aquila earthquake. Earthq. Eng. Struct. Dyn. 2011, 40, 925–944. [Google Scholar] [CrossRef] [Green Version]
- Bertoldi, S.H.; Decanini, L.D.; Gavarini, C. Telai tamponati soggetti ad azioni sismiche, un modello semplificato: Confronto sperimentale e numerico. In Proceedings of the 6 Convegno Nazionale L’ingegneria Sismica in Italia, Perugia, Italy, 13–15 October 1993. [Google Scholar]
- Panagiotakos, T.B.; Fardis, M.N. Seismic response of infilled RC frames structures. In Proceedings of the 11th World Con-Ference on Earthquake Engineering, Acapulco, Mexico, 23–28 June 1996. [Google Scholar]
- Asteris, P.G.; Cavaleri, L.; Di Trapani, F.; Sarhosis, V. A macro-modelling approach for the analysis of infilled frame structures considering the effects of openings and vertical loads. Struct. Infrastruct. Eng. 2016, 12, 551–566. [Google Scholar] [CrossRef]
- Zarnic, R.; Tomazevic, M. Study of the behaviour of masonry lnfilled reinforced concrete frames subjected to seismic loading. In Proceedings of the Seventh International Brick Masonry Conference, Melbourne, Australia, 17–20 February 1985; Volume 2, pp. 1315–1325. [Google Scholar]
- Zarnic, R.; Tomazevic, M. An experimentally obtained method for evaluation of the behaviour of masonry infilled R/C frames. In Proceedings of the Ninth World Conference on Earthquake Engineering, Tokyo, Japan, 2–6 August 1988; Volume VI, pp. 163–168. [Google Scholar]
- Polyakov, S. On the interaction between masonry filler walls and enclosing frame when loading in the plane of the wall. Transl. Earthq. Eng. 1960, E2, 36–42. [Google Scholar]
- Liauw, T.C.; Kwan, K. Nonlinear behaviour of non-integral infilled frames. Comput. Struct. 1984, 18, 551–560. [Google Scholar]
- Decanini, L.D.; Fantin, G.E. Modelos Simplificados de la Mamposteria Incluida en Porticos. Caractreisticas de Rigidez y Resistencia Lateral en Estrado Limite (in Spanish). J. Argent. Ing. Estruct. 1987, 2, 817–836. [Google Scholar]
- Dawe, J.L.; Seah, C.K. Analysis of concrete masonry infilled steel frames subjected to in-plane loads. In Proceedings of the 5th Canadian Masonry Symposium, Vancouver, BC, Canada, 5–7 June 1989; pp. 329–340. [Google Scholar]
- Durrani, A.J.; Luo, Y.H. Seismic retrofit of flat-slab buildings with masonry infill. In Proceedings of the NCEER Workshop on Seismic Response of Masonry Infills, San Francisco, CA, USA, 4–5 February 1994. Report NCEER-94-0004. [Google Scholar]
- Saneinejad, A.; Hobbs, B. Inelastic Design of Infilled Frames. J. Struct. Eng. 1995, 121, 634–650. [Google Scholar] [CrossRef] [Green Version]
- De Risi, M.T.; Del Gaudio, C.; Ricci, P.; Verderame, G.M. In-plane behaviour and damage assessment of masonry infills with hollow clay bricks in RC frames. Eng. Struct. 2018, 168, 257–275. [Google Scholar] [CrossRef]
- Huang, H.; Burton, H.V.; Sattar, S. Development and Utilization of a Database of Infilled Frame Experiments for Numerical Modeling. J. Struct. Eng. 2020, 146, 04020079. [Google Scholar] [CrossRef]
- De Sortis, A.; Bazzurro, P.; Mollaioli, F.; Bruno, S. Influenza delle tamponature sul rischio sismico degli edifice in calcestruzzo armato. In Proceedings of the ANIDIS Conference L’ingegneria Sismica in Italia, Pisa, Italy, 10–14 June 2007. (In Italian). [Google Scholar]
- Mosalam, K.M.; White, R.N.; Gergely, P. Static Response of Infilled Frames Using Quasi-Static Experimentation. J. Struct. Eng. 1997, 123, 1462–4169. [Google Scholar] [CrossRef]
- Al-Chaar, G.; Lamb, G.E.; Issa, M.A. Effects of openings on structural performance of unreinforced masonry infilled frames. In Large Scale Structural Testing; Issa, M.A., Ed.; ACI Spec. Publ: Washington, DC, USA, 2003; Volume 211, pp. 247–262. [Google Scholar]
- Mohammadi, M.; Nikfar, F. Strength and Stiffness of Masonry-Infilled Frames with Central Openings Based on Experimental Results. J. Struct. Eng. 2013, 139, 974–984. [Google Scholar] [CrossRef]
- Decanini, L.D.; Liberatore, L.; Mollaioli, F. Strength and stiffness reduction factors for infilled frames with openings. Earthq. Eng. Eng. Vib. 2014, 13, 437–454. [Google Scholar] [CrossRef]
- Basha, S.H.; Surendran, S.; Kaushik, H.B. Empirical Models for Lateral Stiffness and Strength of Masonry-Infilled RC Frames Considering the Influence of Openings. J. Struct. Eng. 2020, 146, 04020021. [Google Scholar] [CrossRef]
- Klingner, R.E.; Bertero, V.V. Earthquake resistance of infilled frames. J. Struct. Div. 1978, 104, 973–989. [Google Scholar] [CrossRef]
- Cavaleri, L.; Fossetti, M.; Papia, M. Infilled frames: Developments in the evaluation of cyclic behaviour under lateral loads. Struct. Eng. Mech. 2005, 21, 469–494. [Google Scholar] [CrossRef]
- Cavaleri, L.; Di Trapani, F. Cyclic response of masonry infilled RC frames: Experimental results and simplified modeling. Soil Dyn. Earthq. Eng. 2014, 65, 224–242. [Google Scholar] [CrossRef]
- Tassios, T.P. Masonry Infill and RC Walls under Cyclic Actions, Proceedings of the 3rd International Symposium on Wall Structures, Warsaw, Poland, 1984; CIB: Ottawa, ON, Canada, 1984. [Google Scholar]
- Crisafulli, F.J.; Carr, A.J. Proposed macro-model for the analysis of infilled frame structures. Bull. N. Z. Soc. Earthq. Eng. 2007, 40, 69–77. [Google Scholar] [CrossRef] [Green Version]
- Lowes, L.N.; Mitra, N.; Altoontash, A. A Beam-Column Joint Model for Simulating the Earthquake Response of Reinforced Concrete Frames; Technical Rep. No. PEER 2003/10; Pacific Earthquake Engineering Research Center: Berkeley, CA, USA, 2003. [Google Scholar]
- Jeon, J.-S.; Park, J.-H.; Desroches, R. Seismic fragility of lightly reinforced concrete frames with masonry infills. Earthq. Eng. Struct. Dyn. 2015, 44, 1783–1803. [Google Scholar] [CrossRef]
- Lima, C.; De Stefano, G.; Martinelli, E. Seismic response of masonry infilled RC frames: Practice-oriented models and open issues. Earthq. Struct. 2014, 6, 409–436. [Google Scholar] [CrossRef]
- Koutromanos, I.; Stavridis, A.; Shing, P.B.; Willam, K. Numerical modeling of masonry-infilled RC frames subjected to seismic loads. Comput. Struct. 2011, 89, 1026–1037. [Google Scholar] [CrossRef]
- Kumar, M.; Rai, D.C.; Jain, S.K. Ductility Reduction Factors for Masonry-Infilled Reinforced Concrete Frames. Earthq. Spectra 2015, 31, 339–365. [Google Scholar] [CrossRef]
- Kakaletsis, D.J.; Karayannis, C.G. Influence of Masonry Strength and Openings on Infilled R/C Frames under Cycling Loading. J. Earthq. Eng. 2008, 12, 197–221. [Google Scholar] [CrossRef]
- Ricci, P.; De Risi, M.T.; Verderame, G.M.; Manfredi, G. Influence of infill distribution and design typology on seismic per-formance of low-and mid-rise RC buildings. Bull. Earthq. Eng. 2013, 11, 1585–1616. [Google Scholar] [CrossRef]
- Gaetani d’Aragona, M.; Polese, M.; Di Ludovico, M.; Prota, A. The use of Stick-IT model for the prediction of direct economic losses. Earthq. Eng. Struct. Dyn. 2020. [Google Scholar] [CrossRef]
- Gaetani d’Aragona, M.; Polese, M.; Prota, A. Stick-IT: A simplified model for rapid estimation of IDR and PFA for existing low-rise symmetric infilled RC building typologies. Eng. Struct. 2020, 223, 111182. [Google Scholar] [CrossRef]
- Hak, S.; Morandi, P.; Magenes, G.; Sullivan, T.J. Damage Control for Clay Masonry Infills in the Design of RC Frame Structures. J. Earthq. Eng. 2012, 16, 1–35. [Google Scholar] [CrossRef]
- FEMA 356. Prestandard and Commentary for the Seismic Rehabilitation of Buildings; Federal Emergency Management Agency: Washington, DC, USA, 2000. [Google Scholar]
- Ministero delle Infrastrutture e dei Trasporti. In Proceedings of the Circolare n.7 C.S.LL.PP 21 January 2019 Istruzioni per L’applicazione dell’Aggiornamento delle Norme Tecniche per le Costruzioni di cui al Decreto Ministeriale 17 gennaio 2018; Ministero delle Infrastrutture e dei Trasporti, C.S.LL.PP: Rome, Italy, 2019. (In Italian)
- Liberatore, L.; Noto, F.; Mollaioli, F.; Franchin, P. In-plane response of masonry infill walls: Comprehensive experimen-tally-based equivalent strut model for deterministic and probabilistic analysis. Eng. Struct. 2018, 167, 533–548. [Google Scholar] [CrossRef]
- Applied Technology Council & United States. Quantification of Building Seismic Performance Factors—FEMA P695; US Department of Homeland Security: Washington, DC, USA, 2009. [Google Scholar]
- Baker, J.W. Efficient Analytical Fragility Function Fitting Using Dynamic Structural Analysis. Earthq. Spectra 2015, 31, 579–599. [Google Scholar] [CrossRef]
- Grunthal, G. Cahiers du Centre Européen de Géodynamique et de Séismologie; European Macroseismic Scale: Luxembourg, 1998; pp. 1–97. [Google Scholar]
- Del Gaudio, C.; Ricci, P.; Verderame, G.M. A class-oriented mechanical approach for seismic damage assessment of RC buildings subjected to the 2009 L’Aquila earthquake. Bull. Earthq. Eng. 2018, 16, 4581–4605. [Google Scholar] [CrossRef]
- Porter, K.A. An overview of PEER’s performance-based earthquake engineering methodology. In Proceedings of the 9th Inter-National Conference on Applications of Statistics and Probability in Civil Engineering, Francisco, CA, USA, 6–9 July 2003. [Google Scholar]


| tw (mm) | Ew (MPa) | Gw (MPa) | τm0 (MPa) | τ0 (MPa) | σm0 (MPa) |
|---|---|---|---|---|---|
| 300 | 3240 | 1296 | 0.34 | 0.23 | 1.53 |
| Backbone Points | BR | DR | HG |
|---|---|---|---|
| Δcr (m) | 2.07 × 10⁻⁴ | 9.04 × 10⁻⁴ | 2.10 × 10⁻³ |
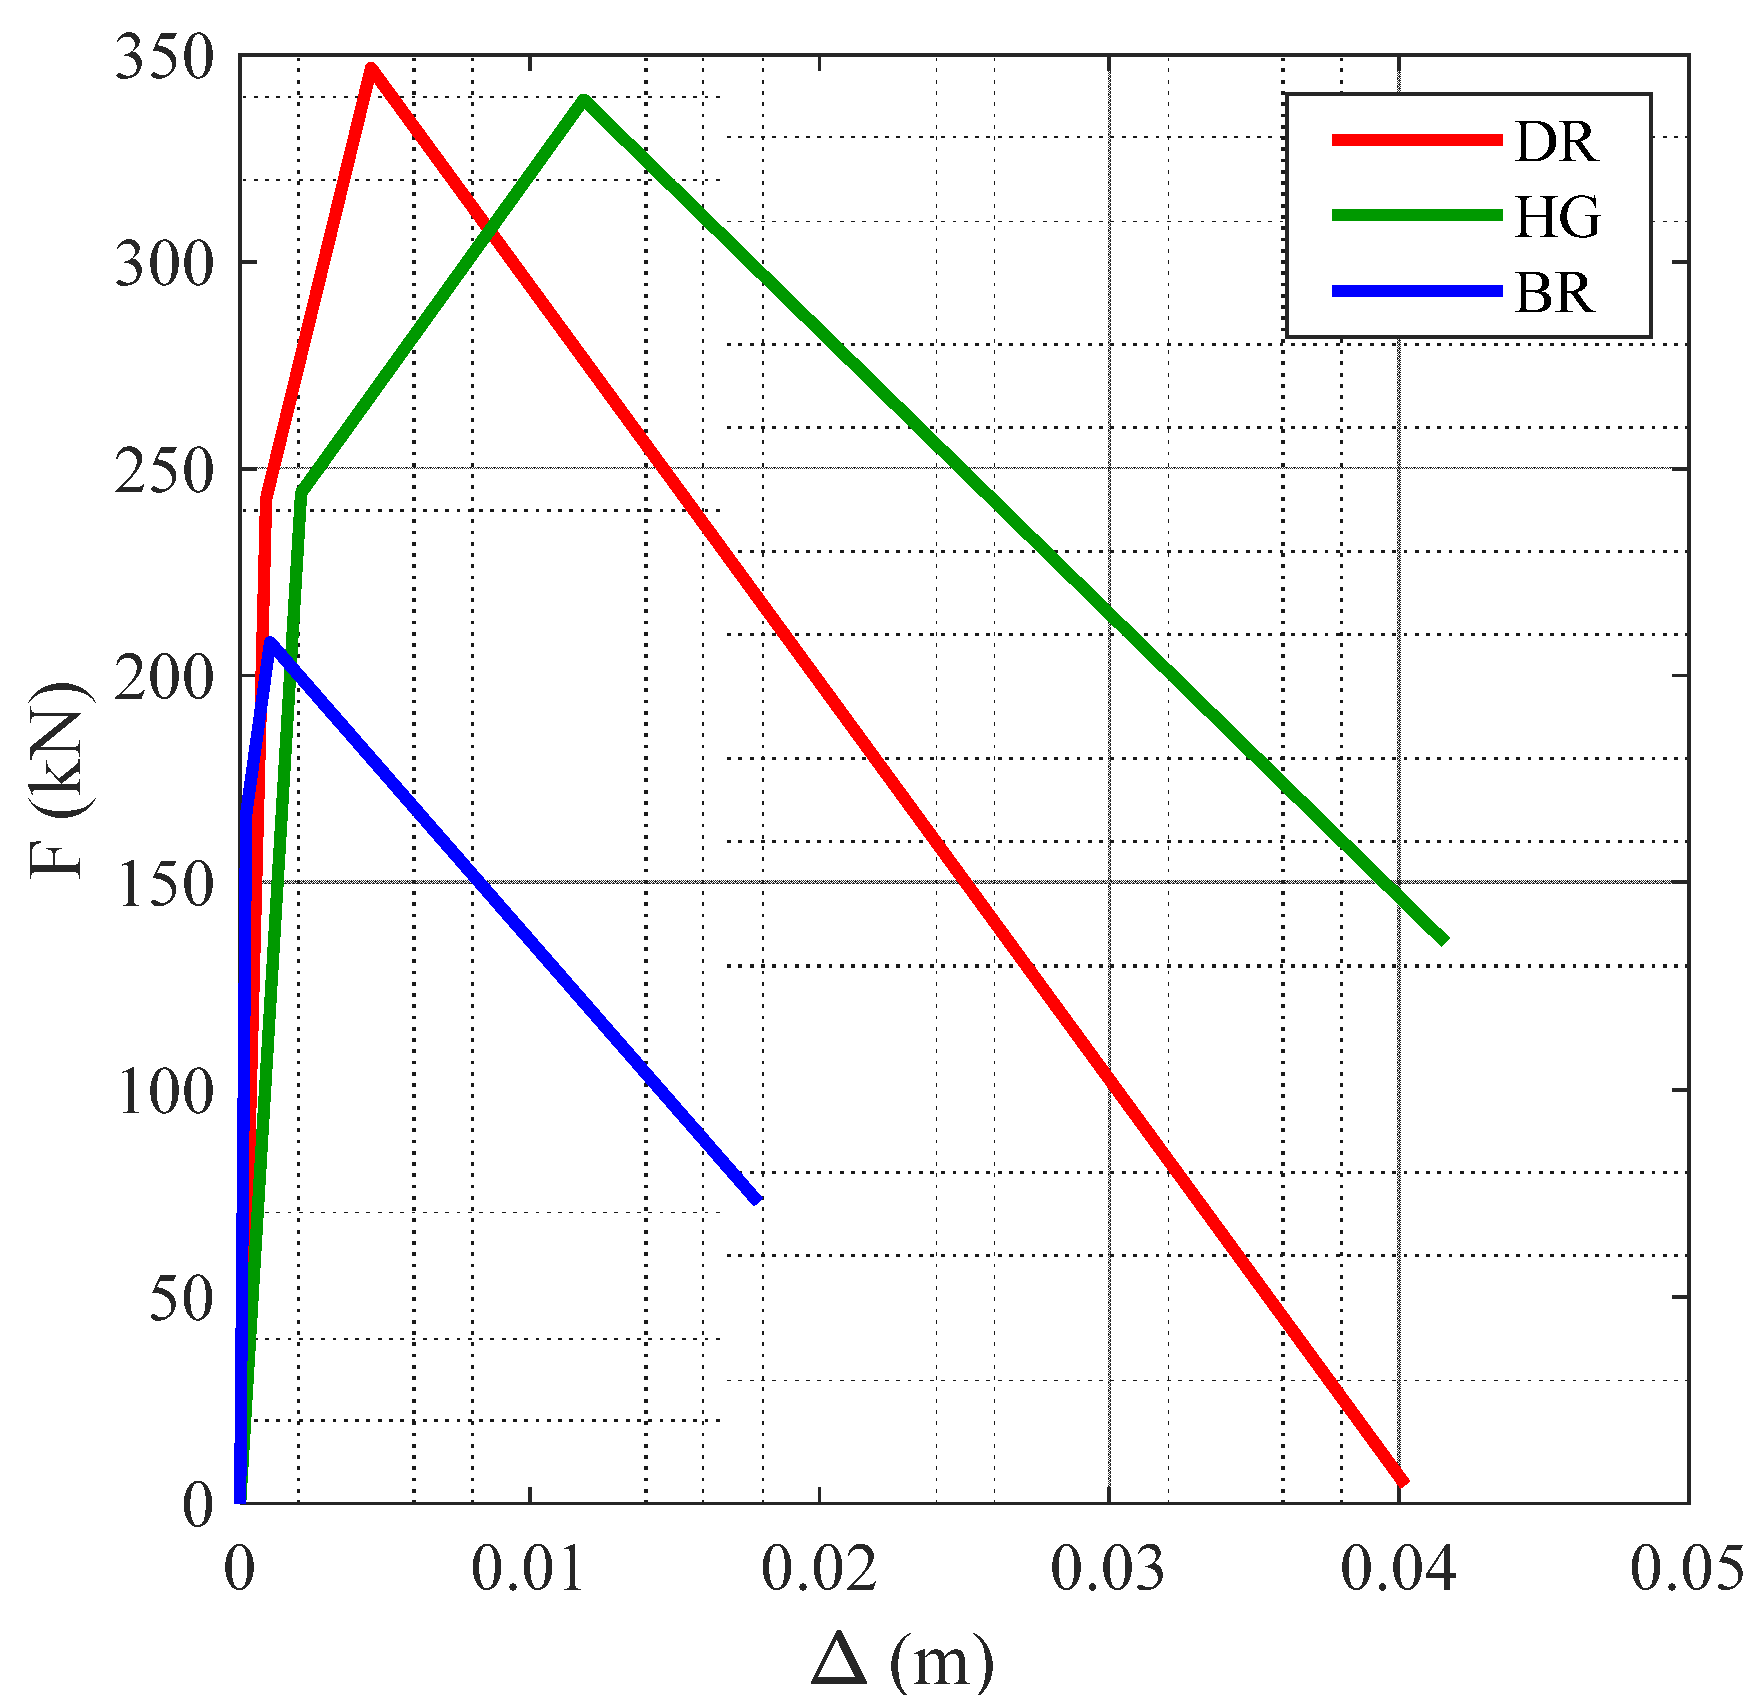
| Δpeak (m) | 1.04 × 10⁻³ | 4.52 × 10⁻³ | 1.19 × 10⁻² |
| Δult (m) | 1.80 × 10⁻² | 4.02 × 10⁻² | 4.16 × 10⁻² |
| Fcr (kN) | 166.4 | 242.7 | 244.2 |
| Fpeak (kN) | 208.0 | 347.0 | 339.0 |
| Fres (kN) | 72.8 | 0.0 | 135.6 |
| DS1 | DS2 | DS3 | DS4 | DS5 |
|---|---|---|---|---|
| 0.03% | 0.32% | 1.03% | 3.30% | 3.70% |
| Concrete cracking/Onset infill cracking | Rebar yielding/ Moderate infill cracking | Rebar buckling/ cover spalling/First column shear failure/Extensive infill cracking | First column axial failure/ ultimate capacity | All story columns exhibit axial failure/ultimate capacity |
| Longitudinal Direction | ||||||||||
|---|---|---|---|---|---|---|---|---|---|---|
| DS1 | DS2 | DS3 | DS4 | DS5 | ||||||
| Backbone model | θ | β | θ | β | θ | β | θ | β | θ | β |
| BR | 0.16 | 0.21 | 0.46 | 0.36 | 0.95 | 0.35 | 1.91 | 0.24 | 2.15 | 0.25 |
| DR | 0.08 | 0.21 | 0.47 | 0.34 | 0.77 | 0.30 | 1.66 | 0.40 | 1.85 | 0.42 |
| HG | 0.06 | 0.24 | 0.41 | 0.34 | 0.75 | 0.31 | 1.66 | 0.36 | 1.83 | 0.38 |
| Transverse Direction | ||||||||||
|---|---|---|---|---|---|---|---|---|---|---|
| DS1 | DS2 | DS3 | DS4 | DS5 | ||||||
| Backbone model | θ | β | θ | β | θ | β | θ | β | θ | β |
| BR | 0.10 | 0.31 | 0.26 | 0.48 | 0.56 | 0.42 | 1.56 | 0.47 | 1.66 | 0.43 |
| DR | 0.05 | 0.21 | 0.29 | 0.41 | 0.50 | 0.41 | 1.05 | 0.47 | 1.19 | 0.51 |
| HG | 0.04 | 0.28 | 0.26 | 0.45 | 0.48 | 0.44 | 1.14 | 0.43 | 1.28 | 0.48 |
Publisher’s Note: MDPI stays neutral with regard to jurisdictional claims in published maps and institutional affiliations. |
© 2021 by the authors. Licensee MDPI, Basel, Switzerland. This article is an open access article distributed under the terms and conditions of the Creative Commons Attribution (CC BY) license (http://creativecommons.org/licenses/by/4.0/).
Share and Cite
Gaetani d’Aragona, M.; Polese, M.; Prota, A. Effect of Masonry Infill Constitutive Law on the Global Response of Infilled RC Buildings. Buildings 2021, 11, 57. https://doi.org/10.3390/buildings11020057
Gaetani d’Aragona M, Polese M, Prota A. Effect of Masonry Infill Constitutive Law on the Global Response of Infilled RC Buildings. Buildings. 2021; 11(2):57. https://doi.org/10.3390/buildings11020057
Chicago/Turabian StyleGaetani d’Aragona, Marco, Maria Polese, and Andrea Prota. 2021. "Effect of Masonry Infill Constitutive Law on the Global Response of Infilled RC Buildings" Buildings 11, no. 2: 57. https://doi.org/10.3390/buildings11020057