
Physics-Based Ground Motion Simulations for the Prediction of the Seismic Vulnerability of Masonry Building Compounds in Mirandola (Italy)


Abstract
:1. Introduction
2. Activity Framework
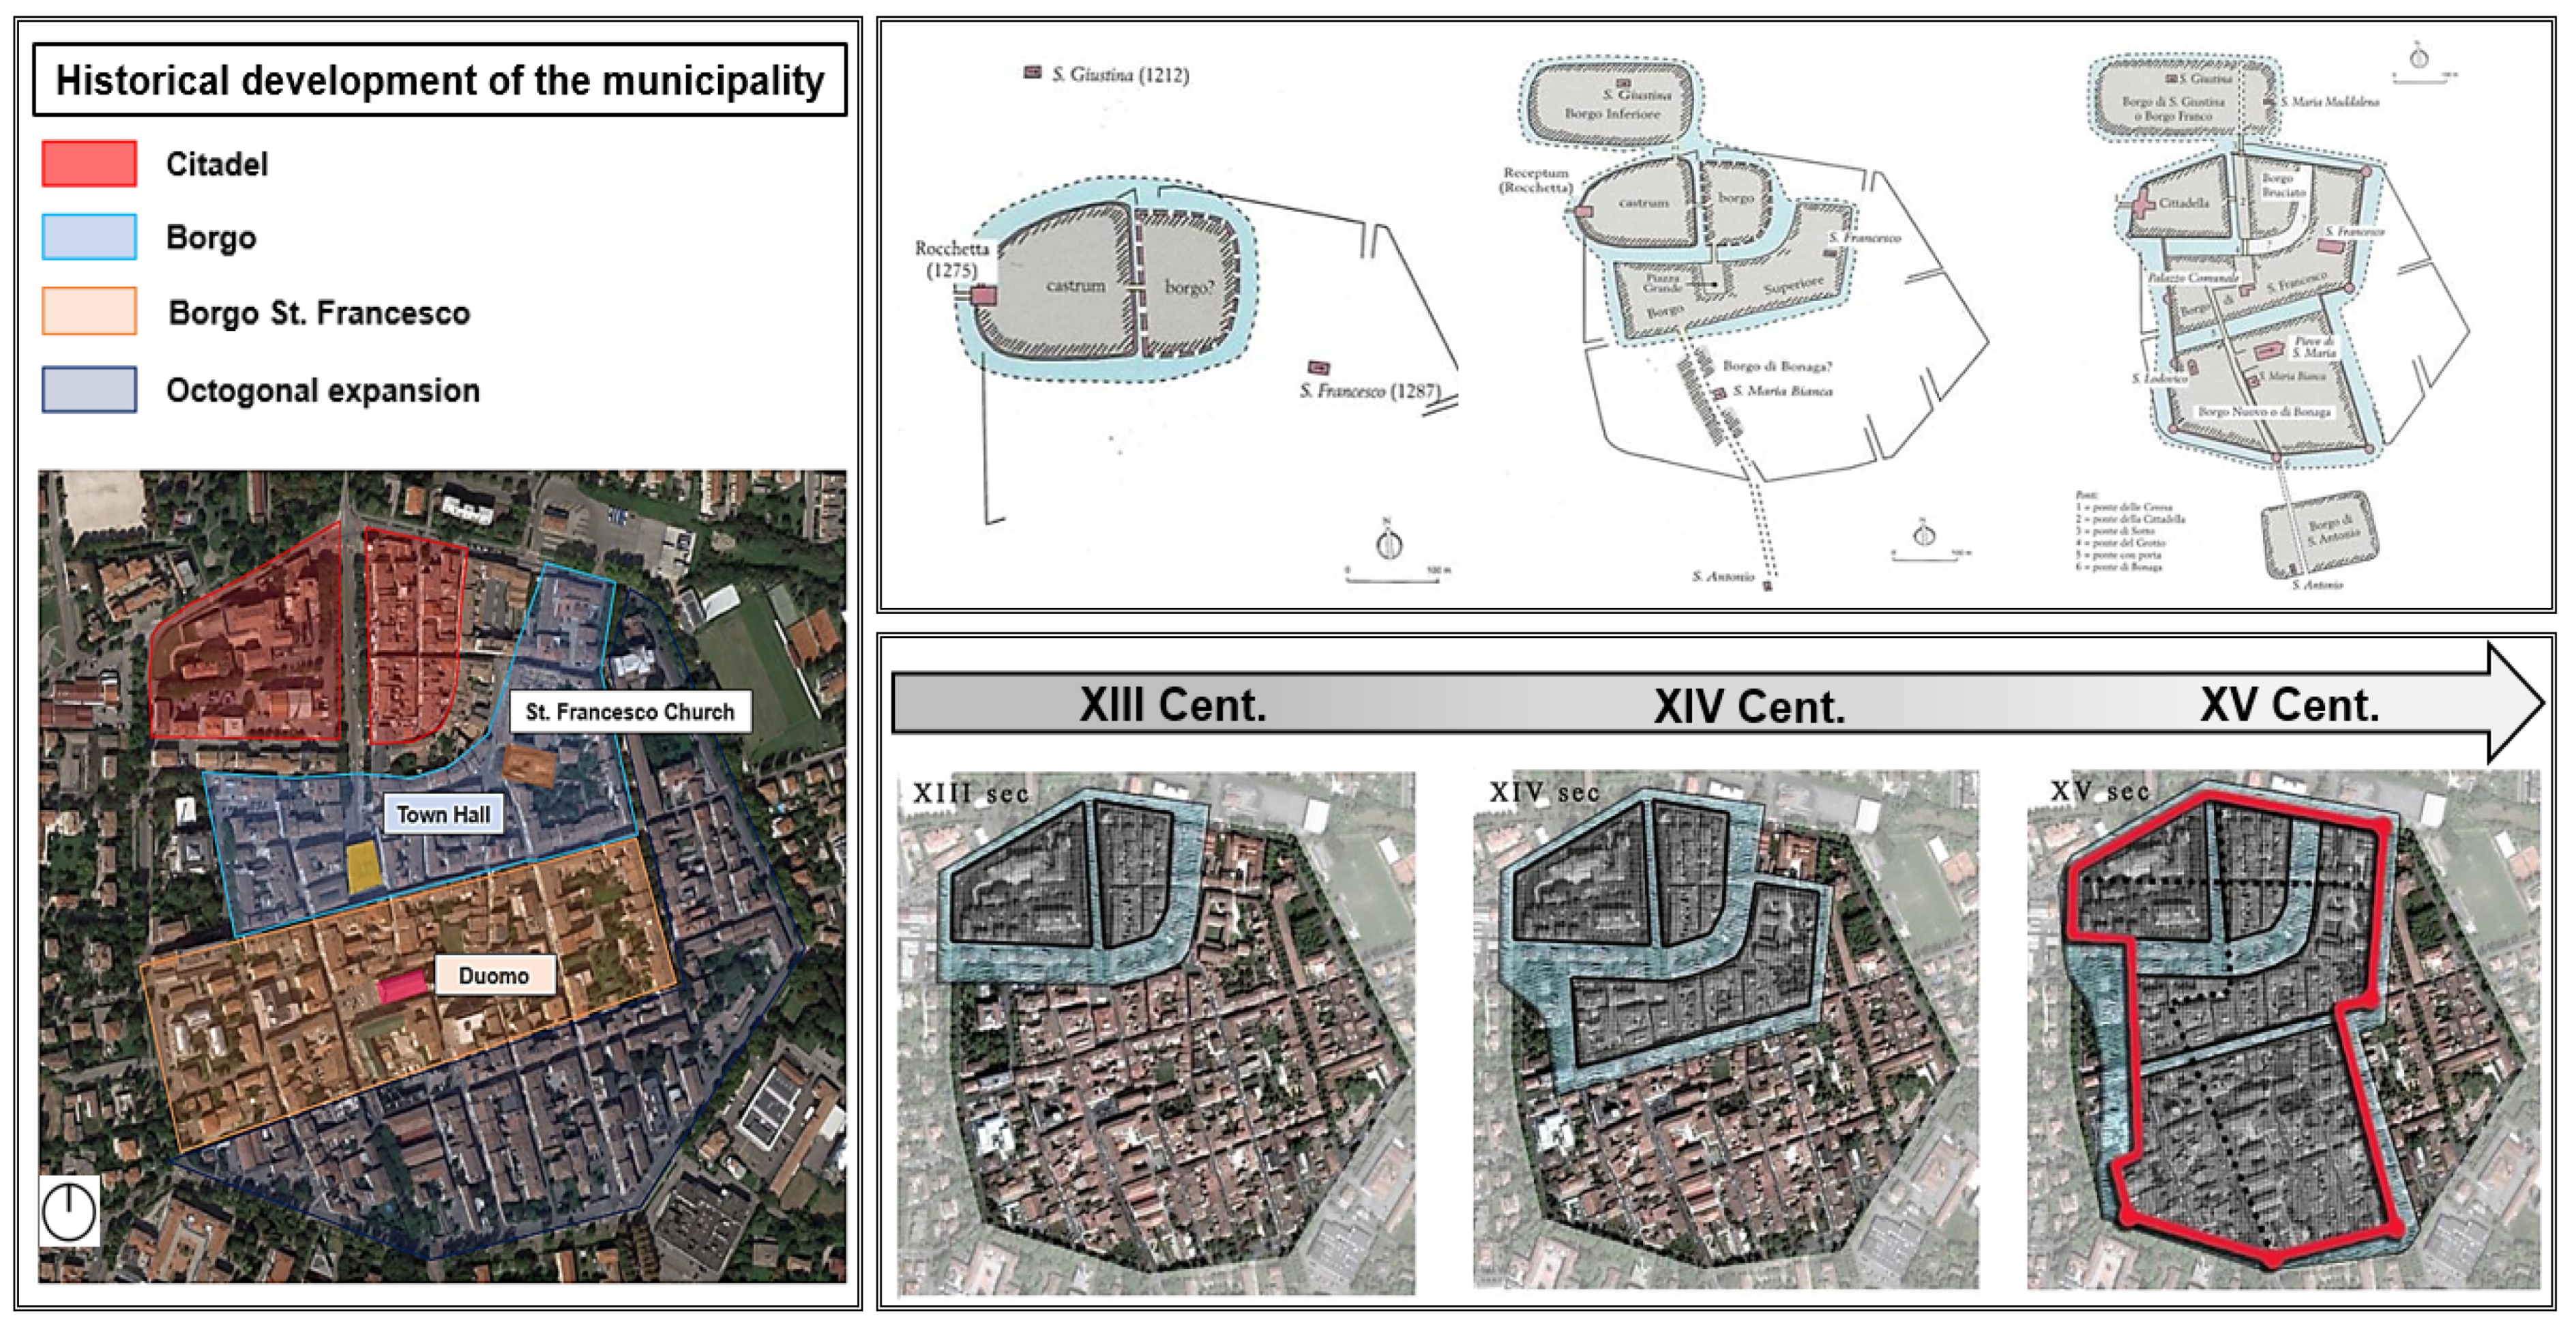
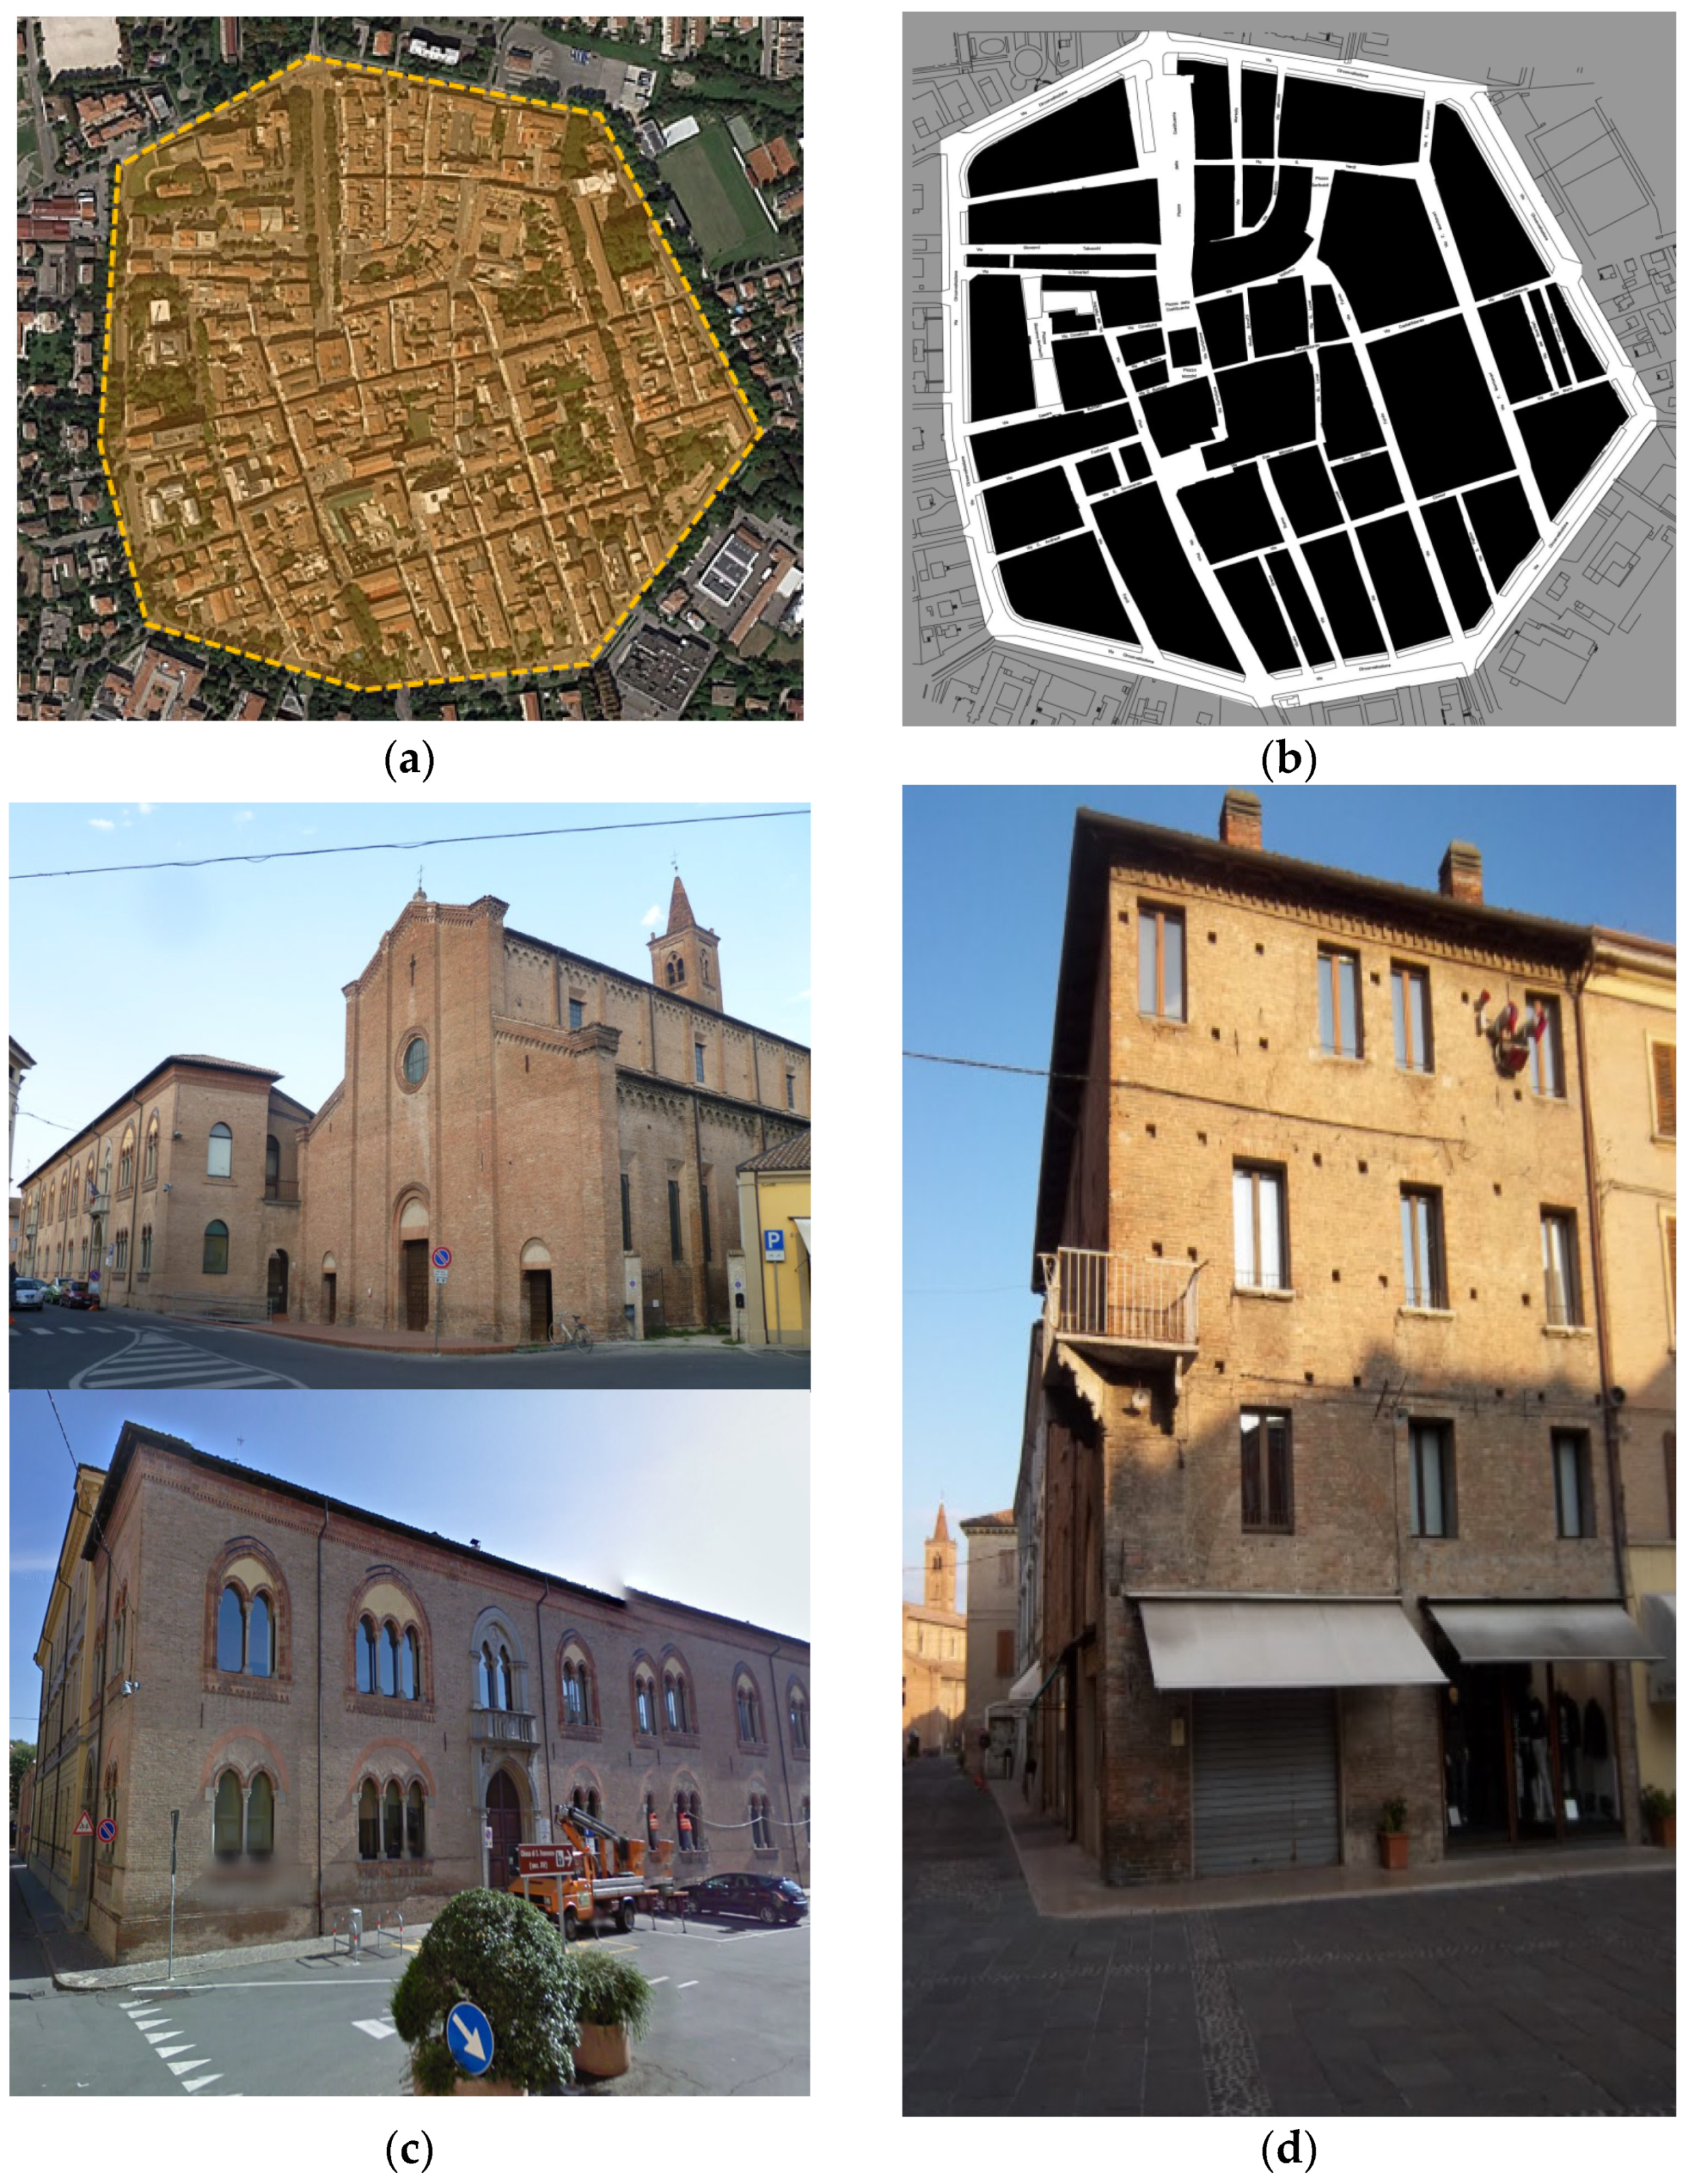
2.1. The Historical Centre of Mirandola
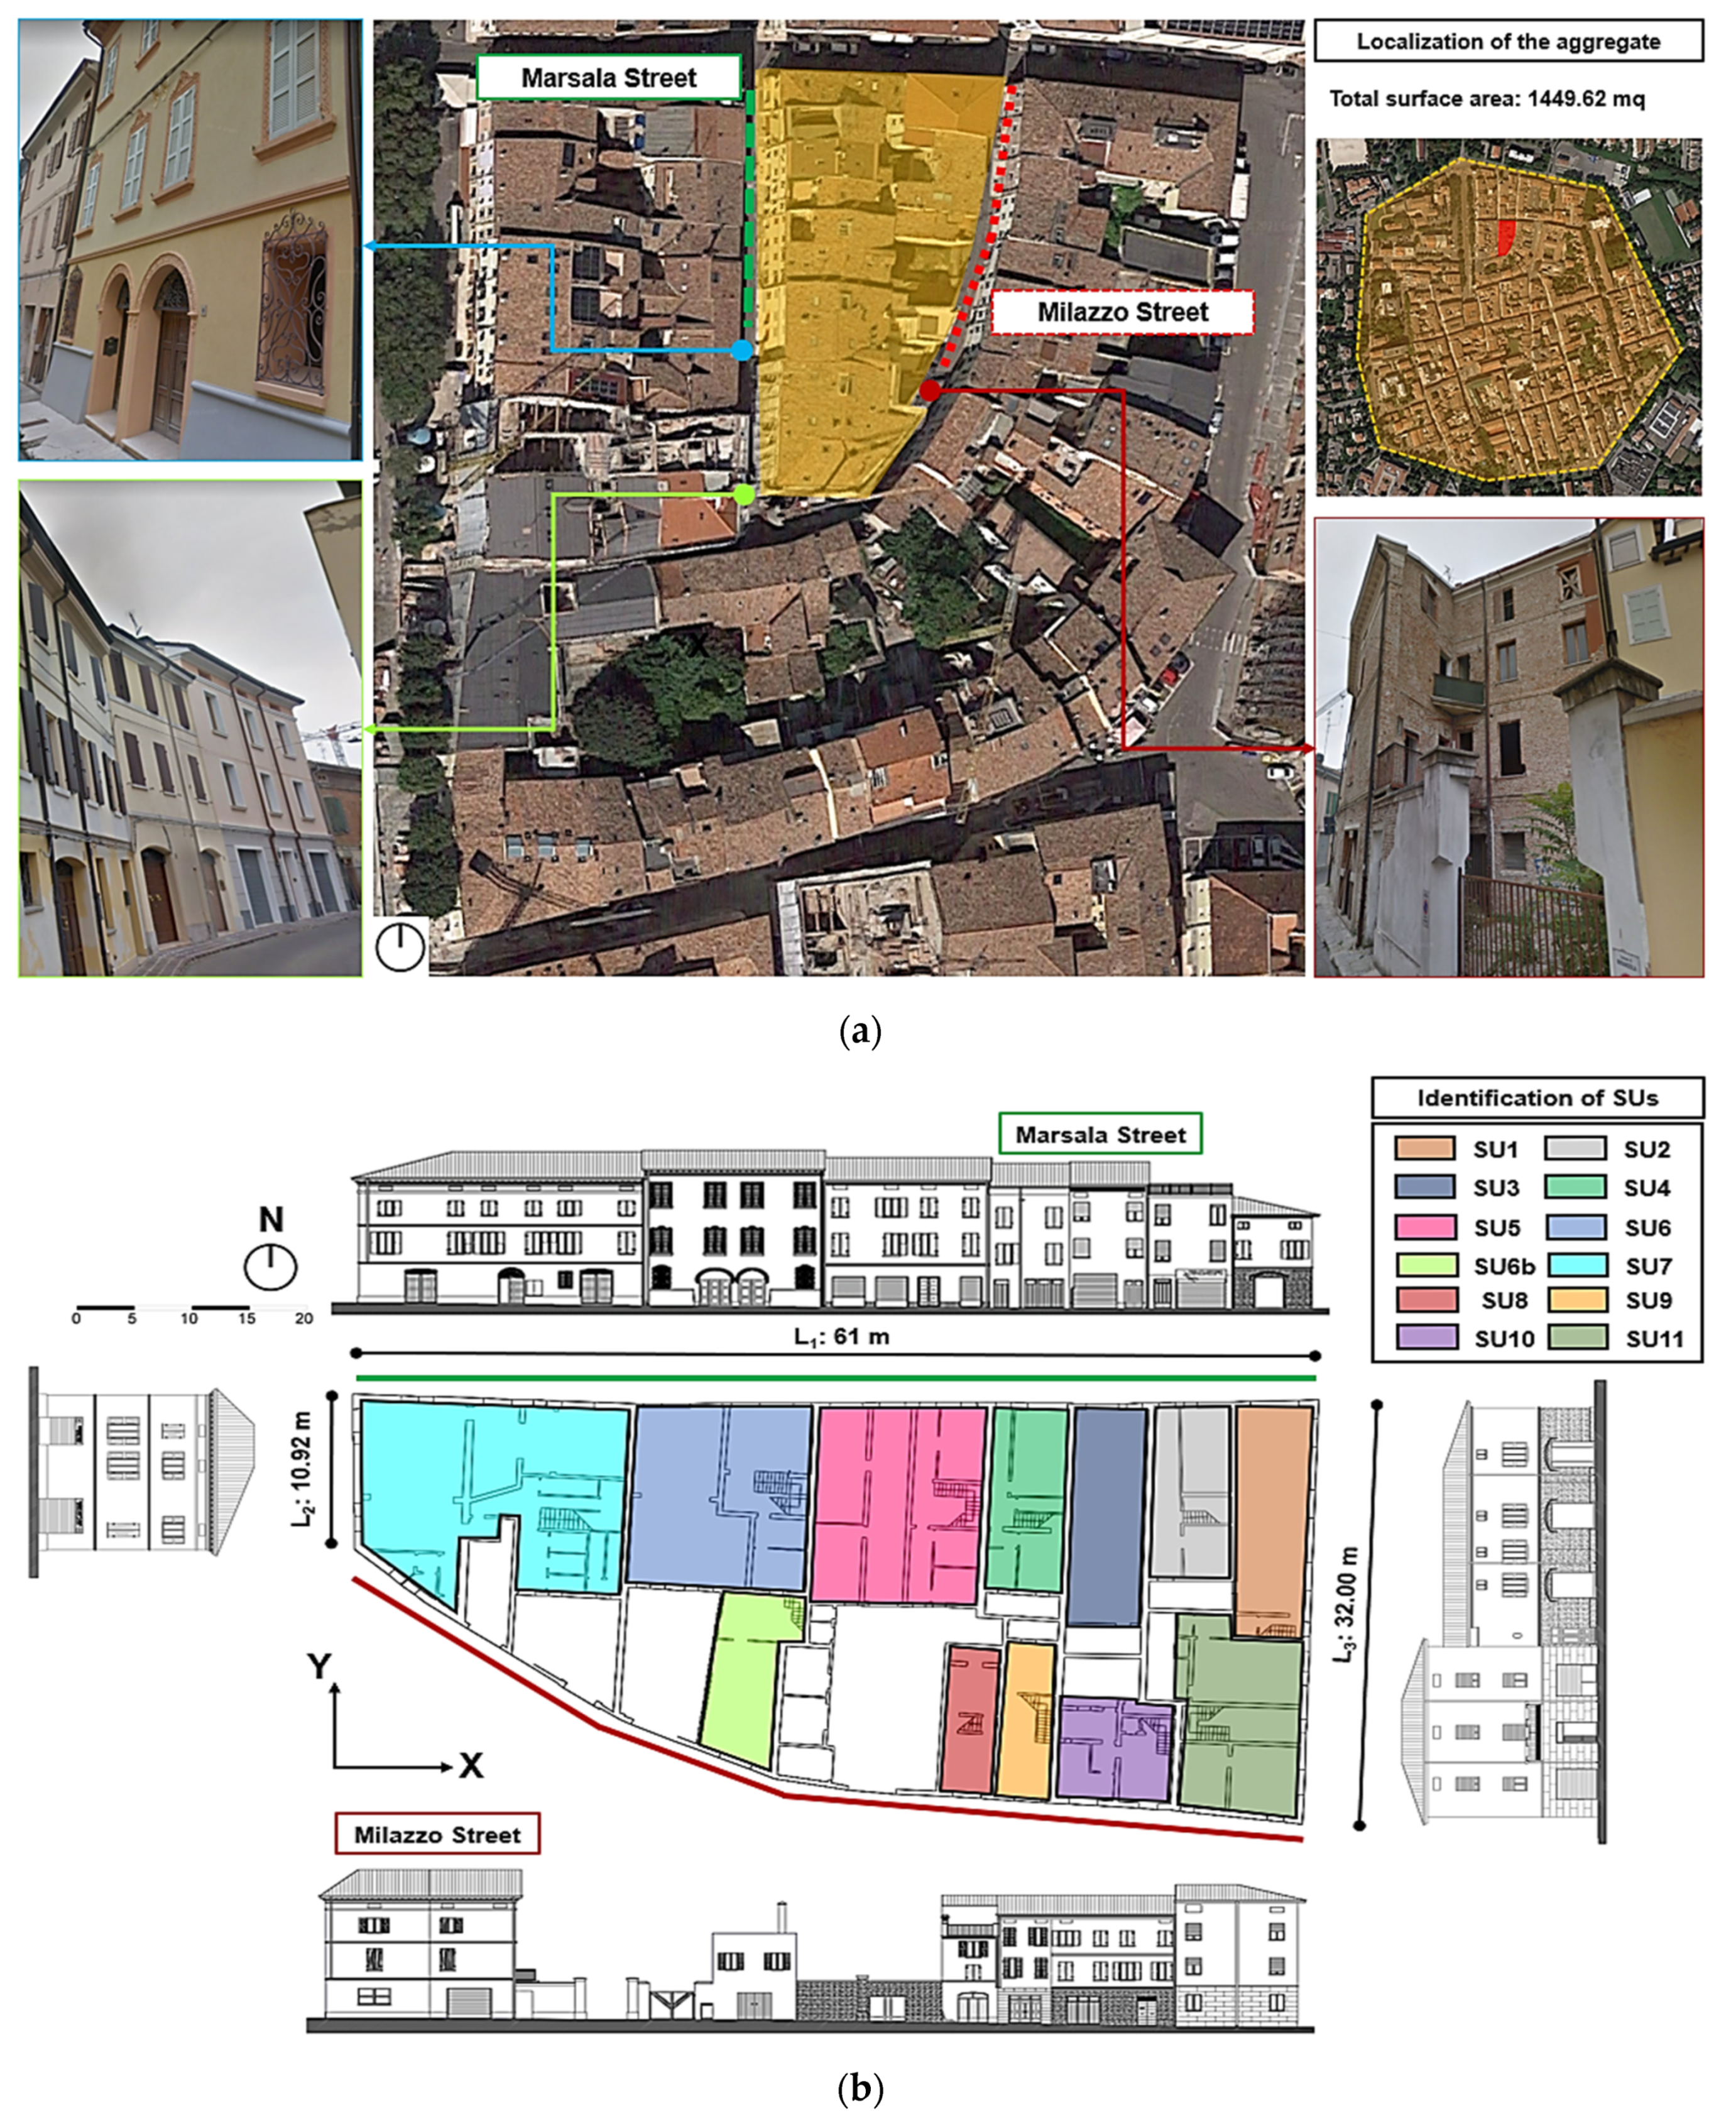
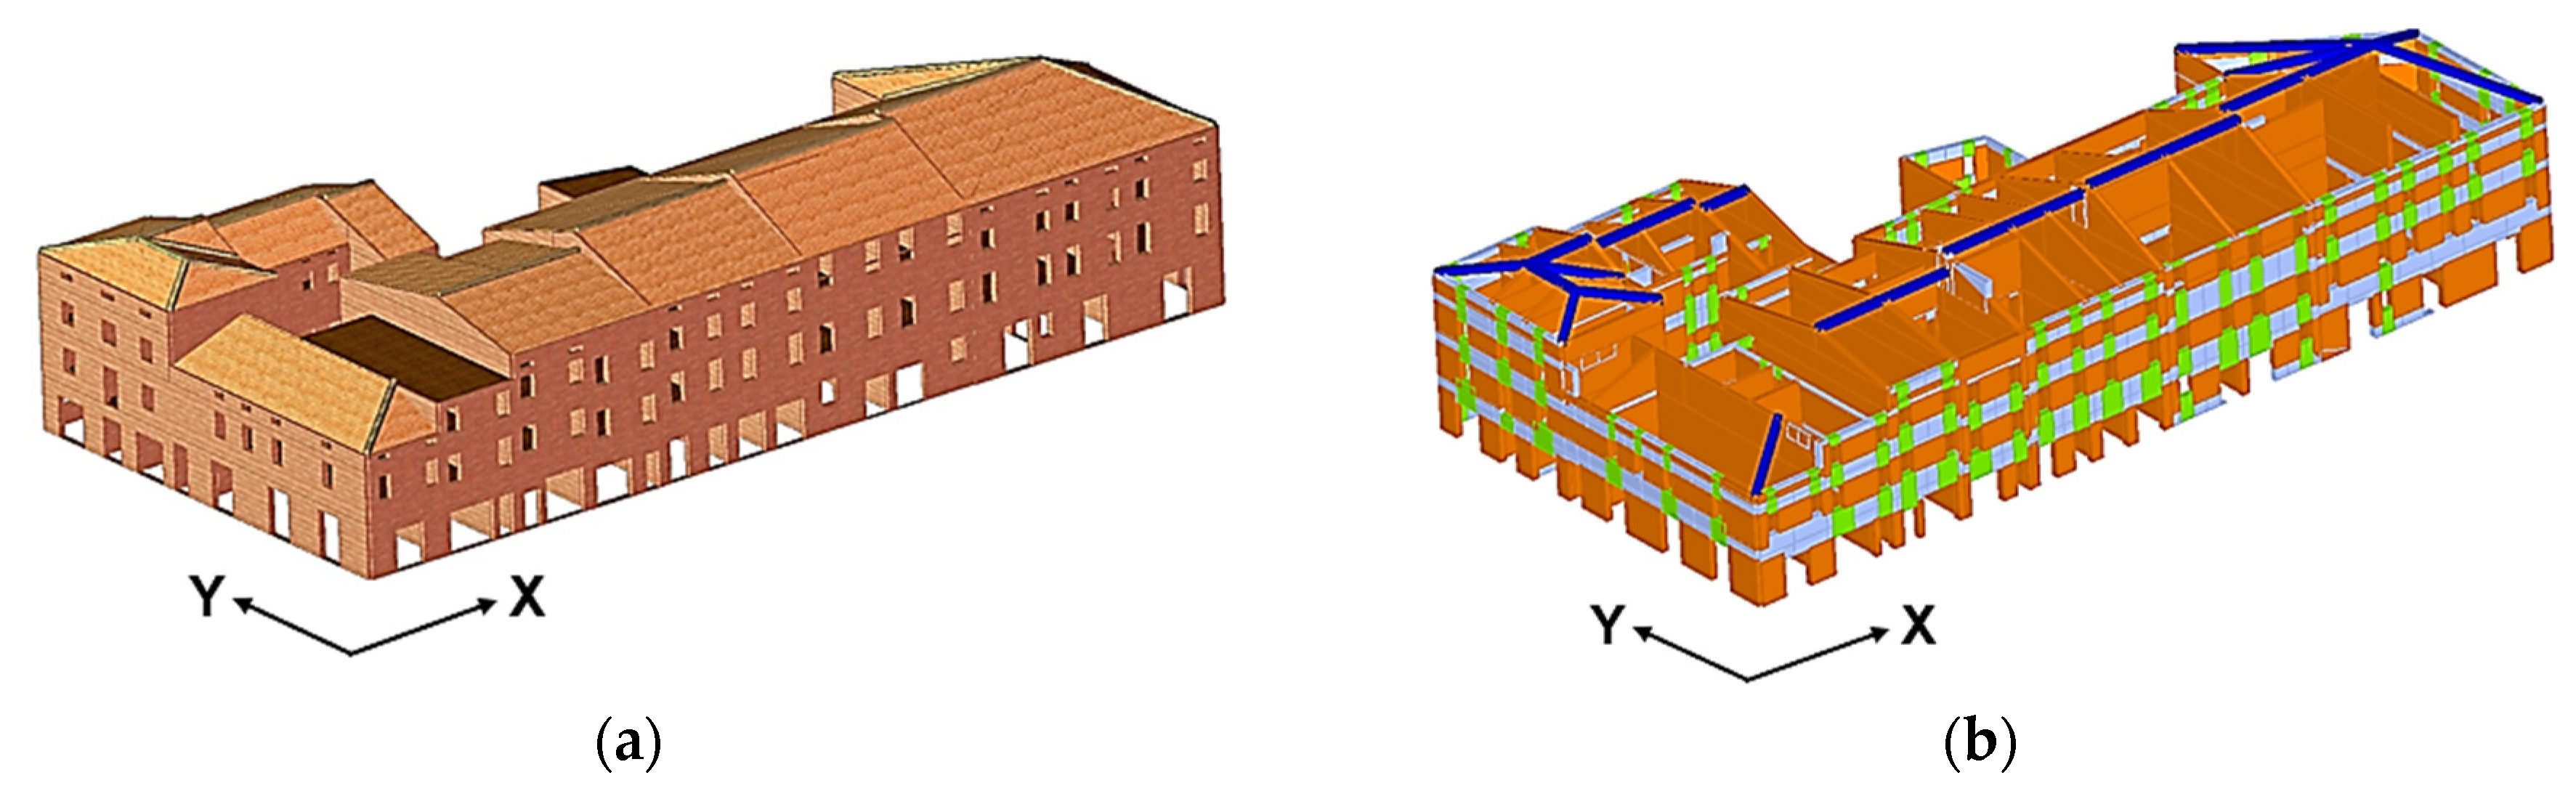
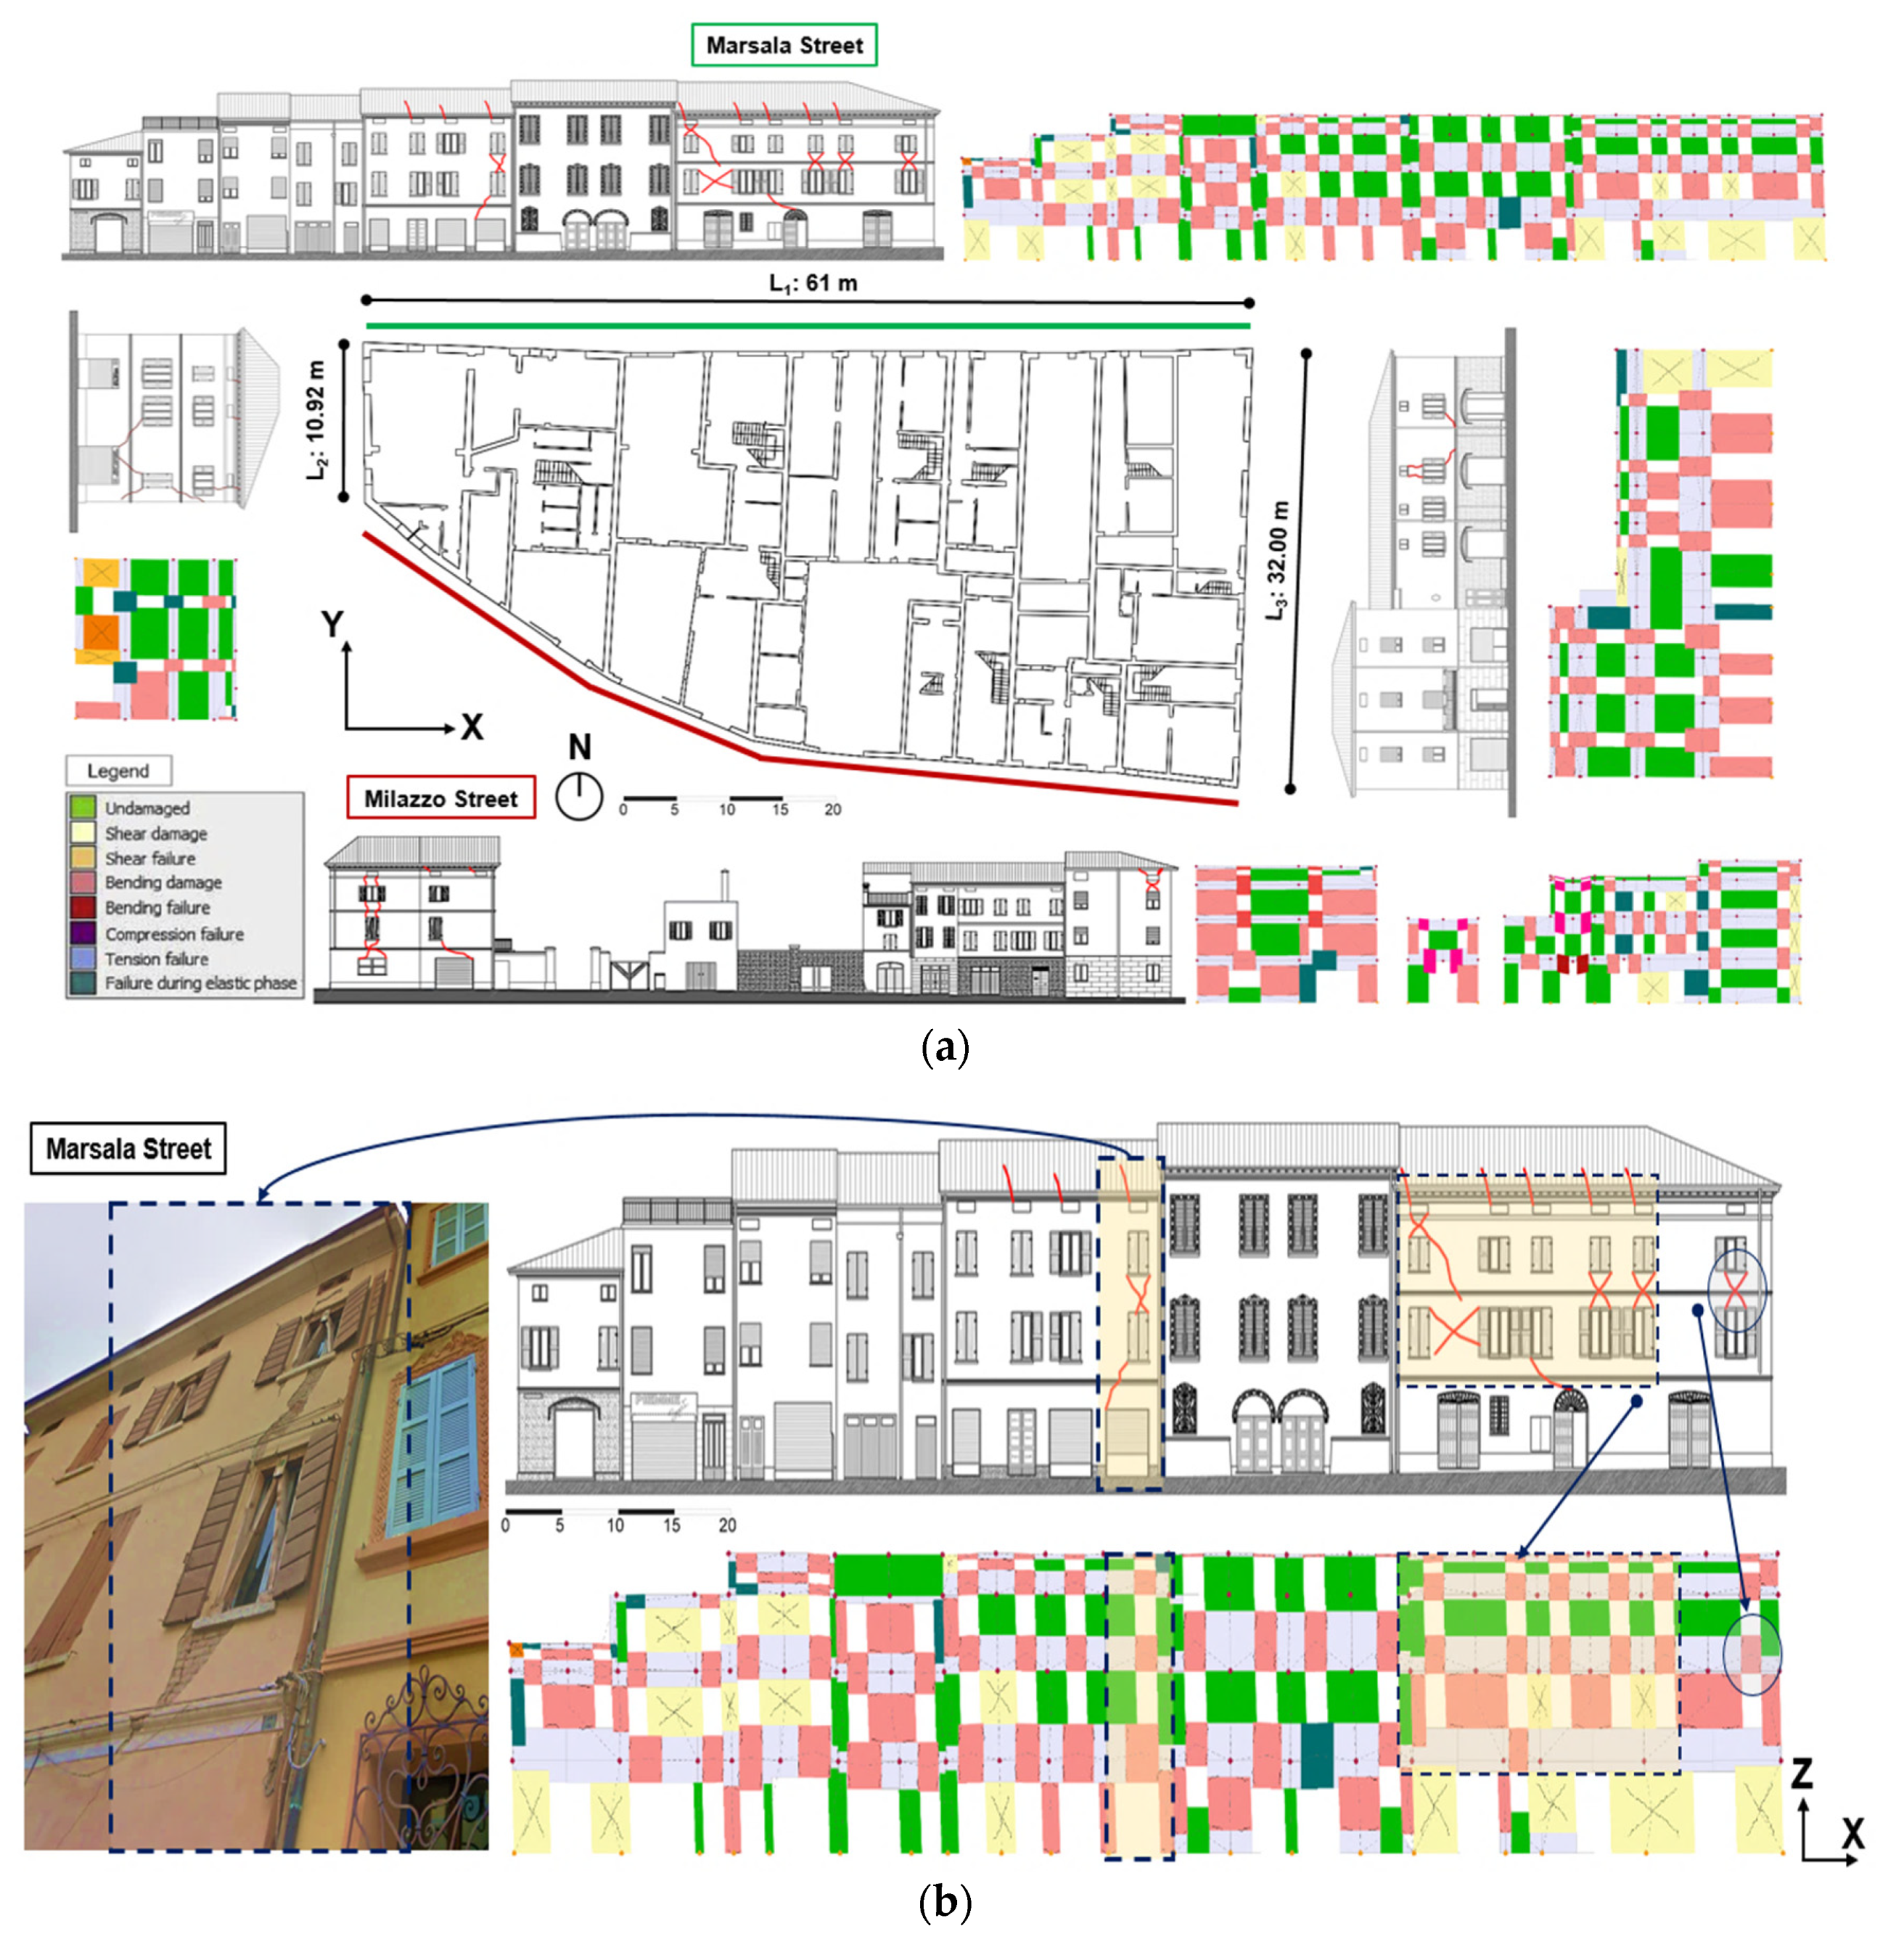
2.2. Main Features of the Case Study Building Compound
3. Ground Motion Selection
3.1. Seismological Structural Model
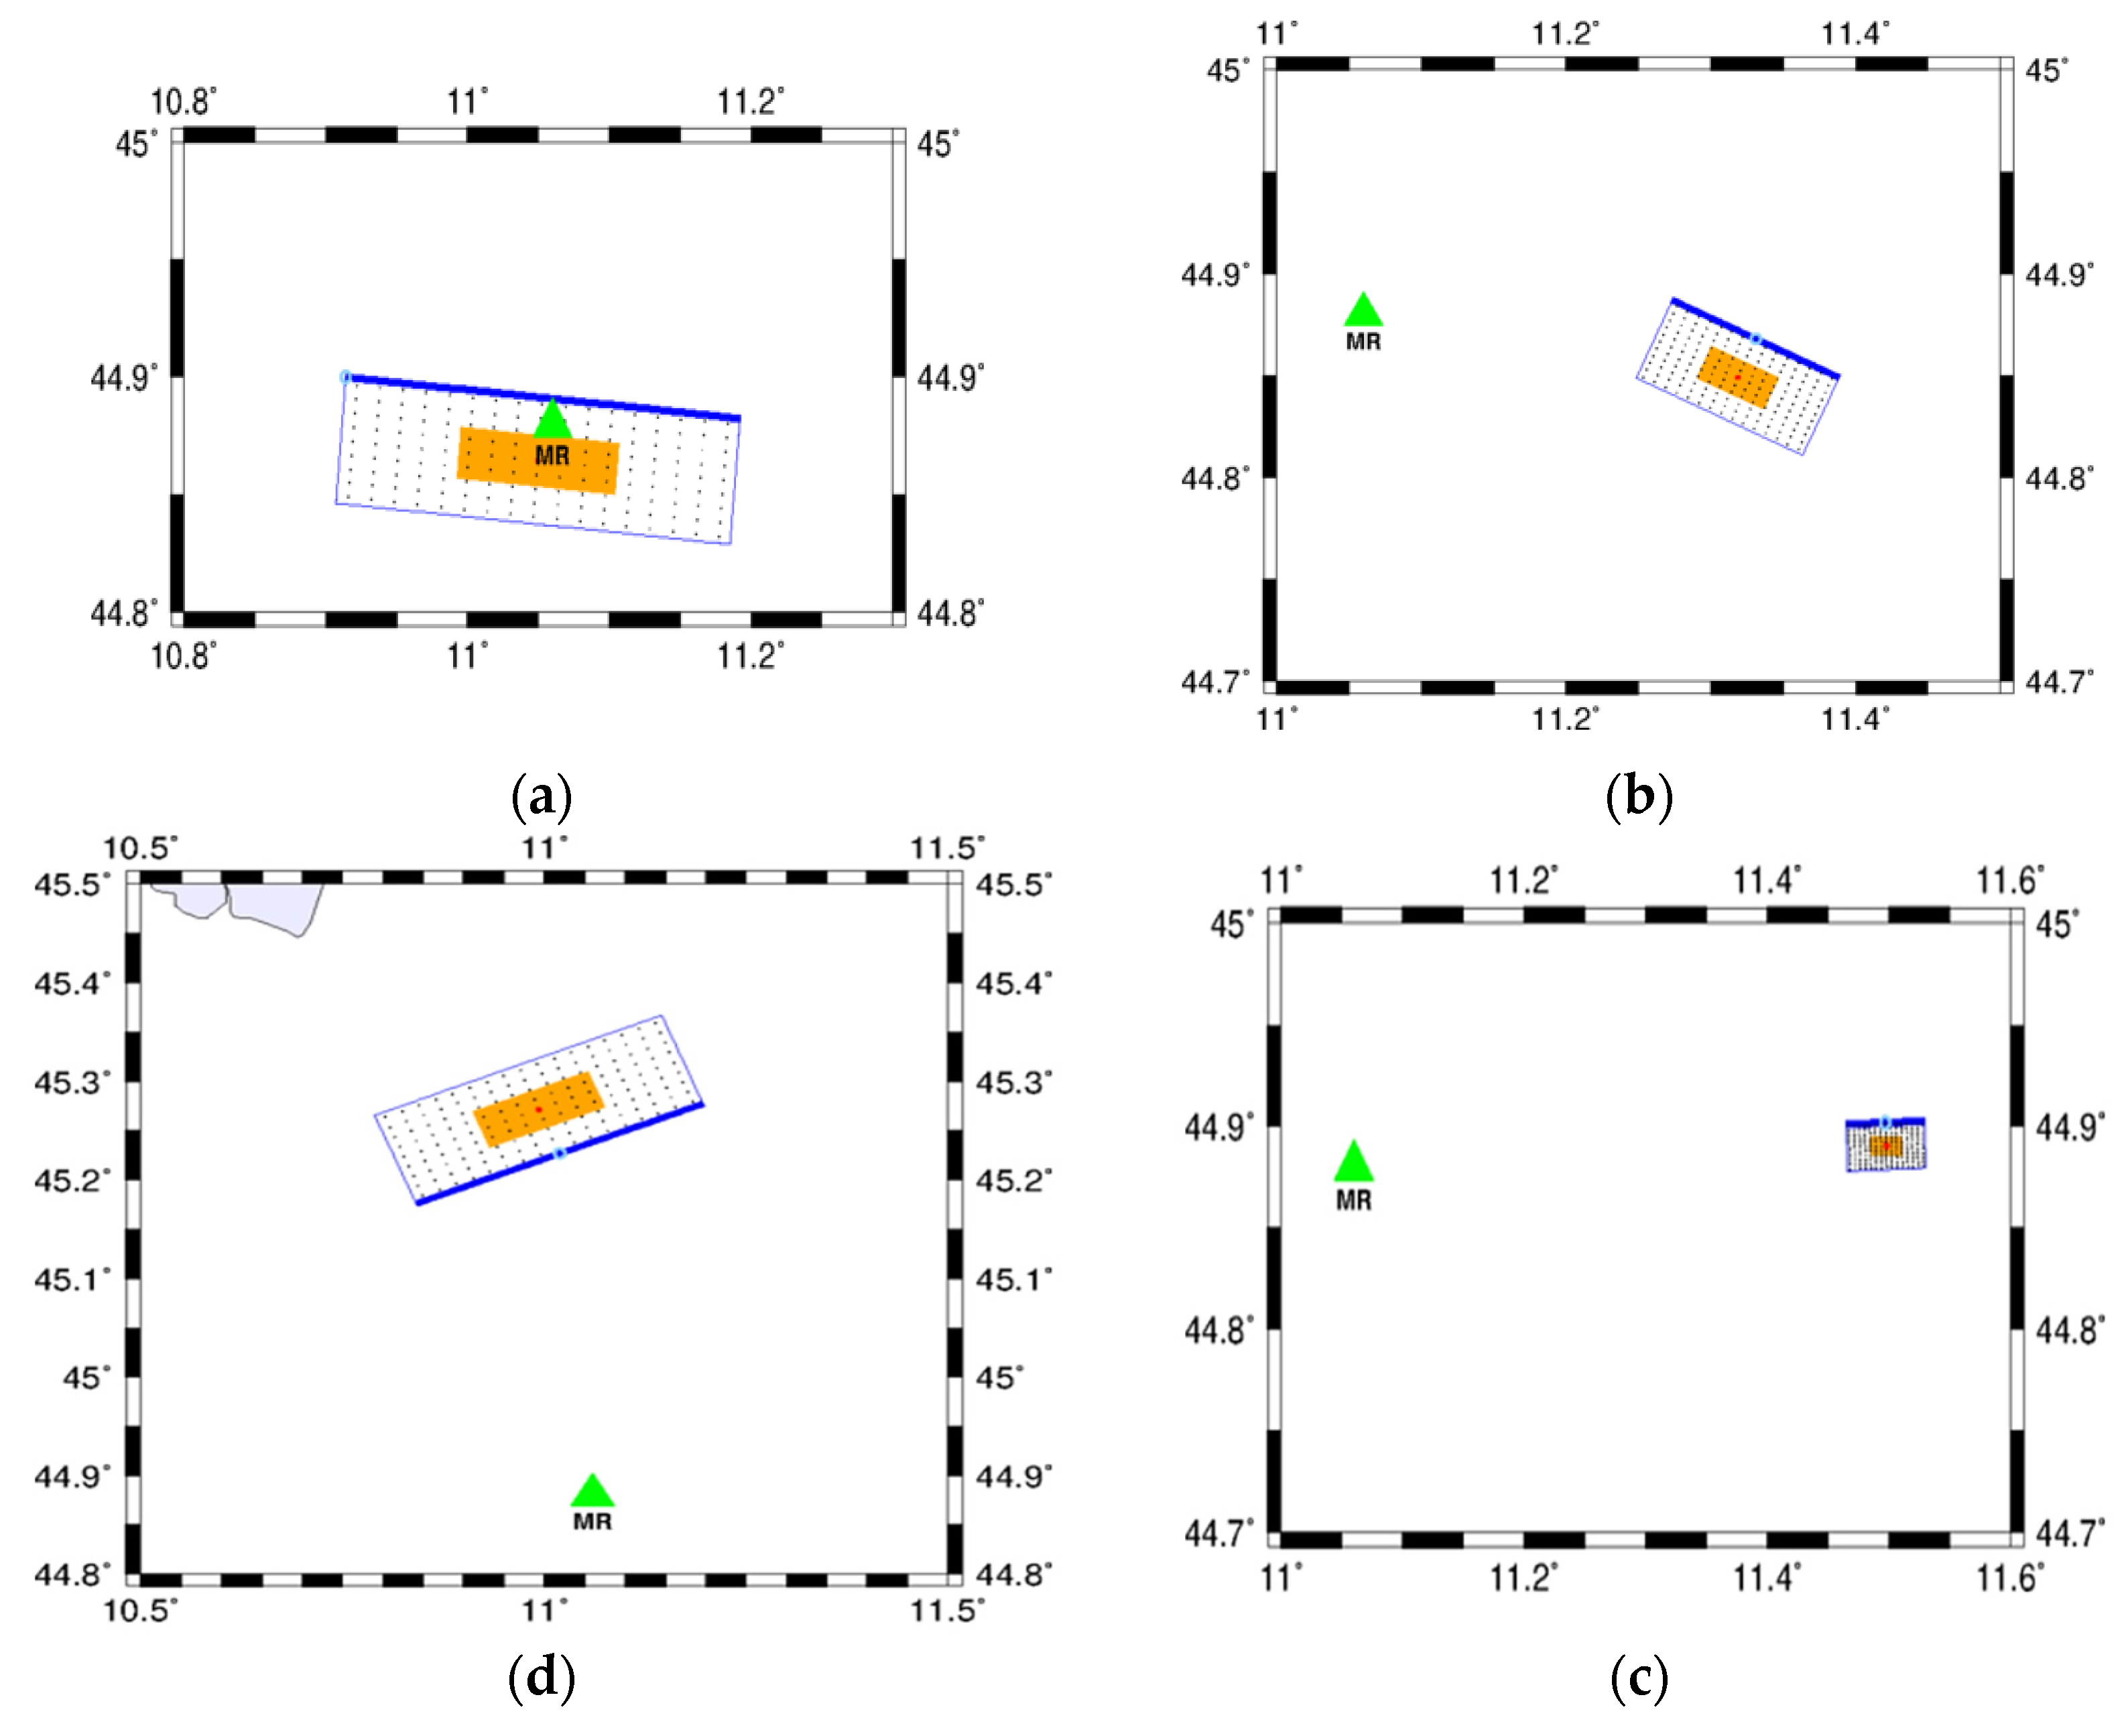
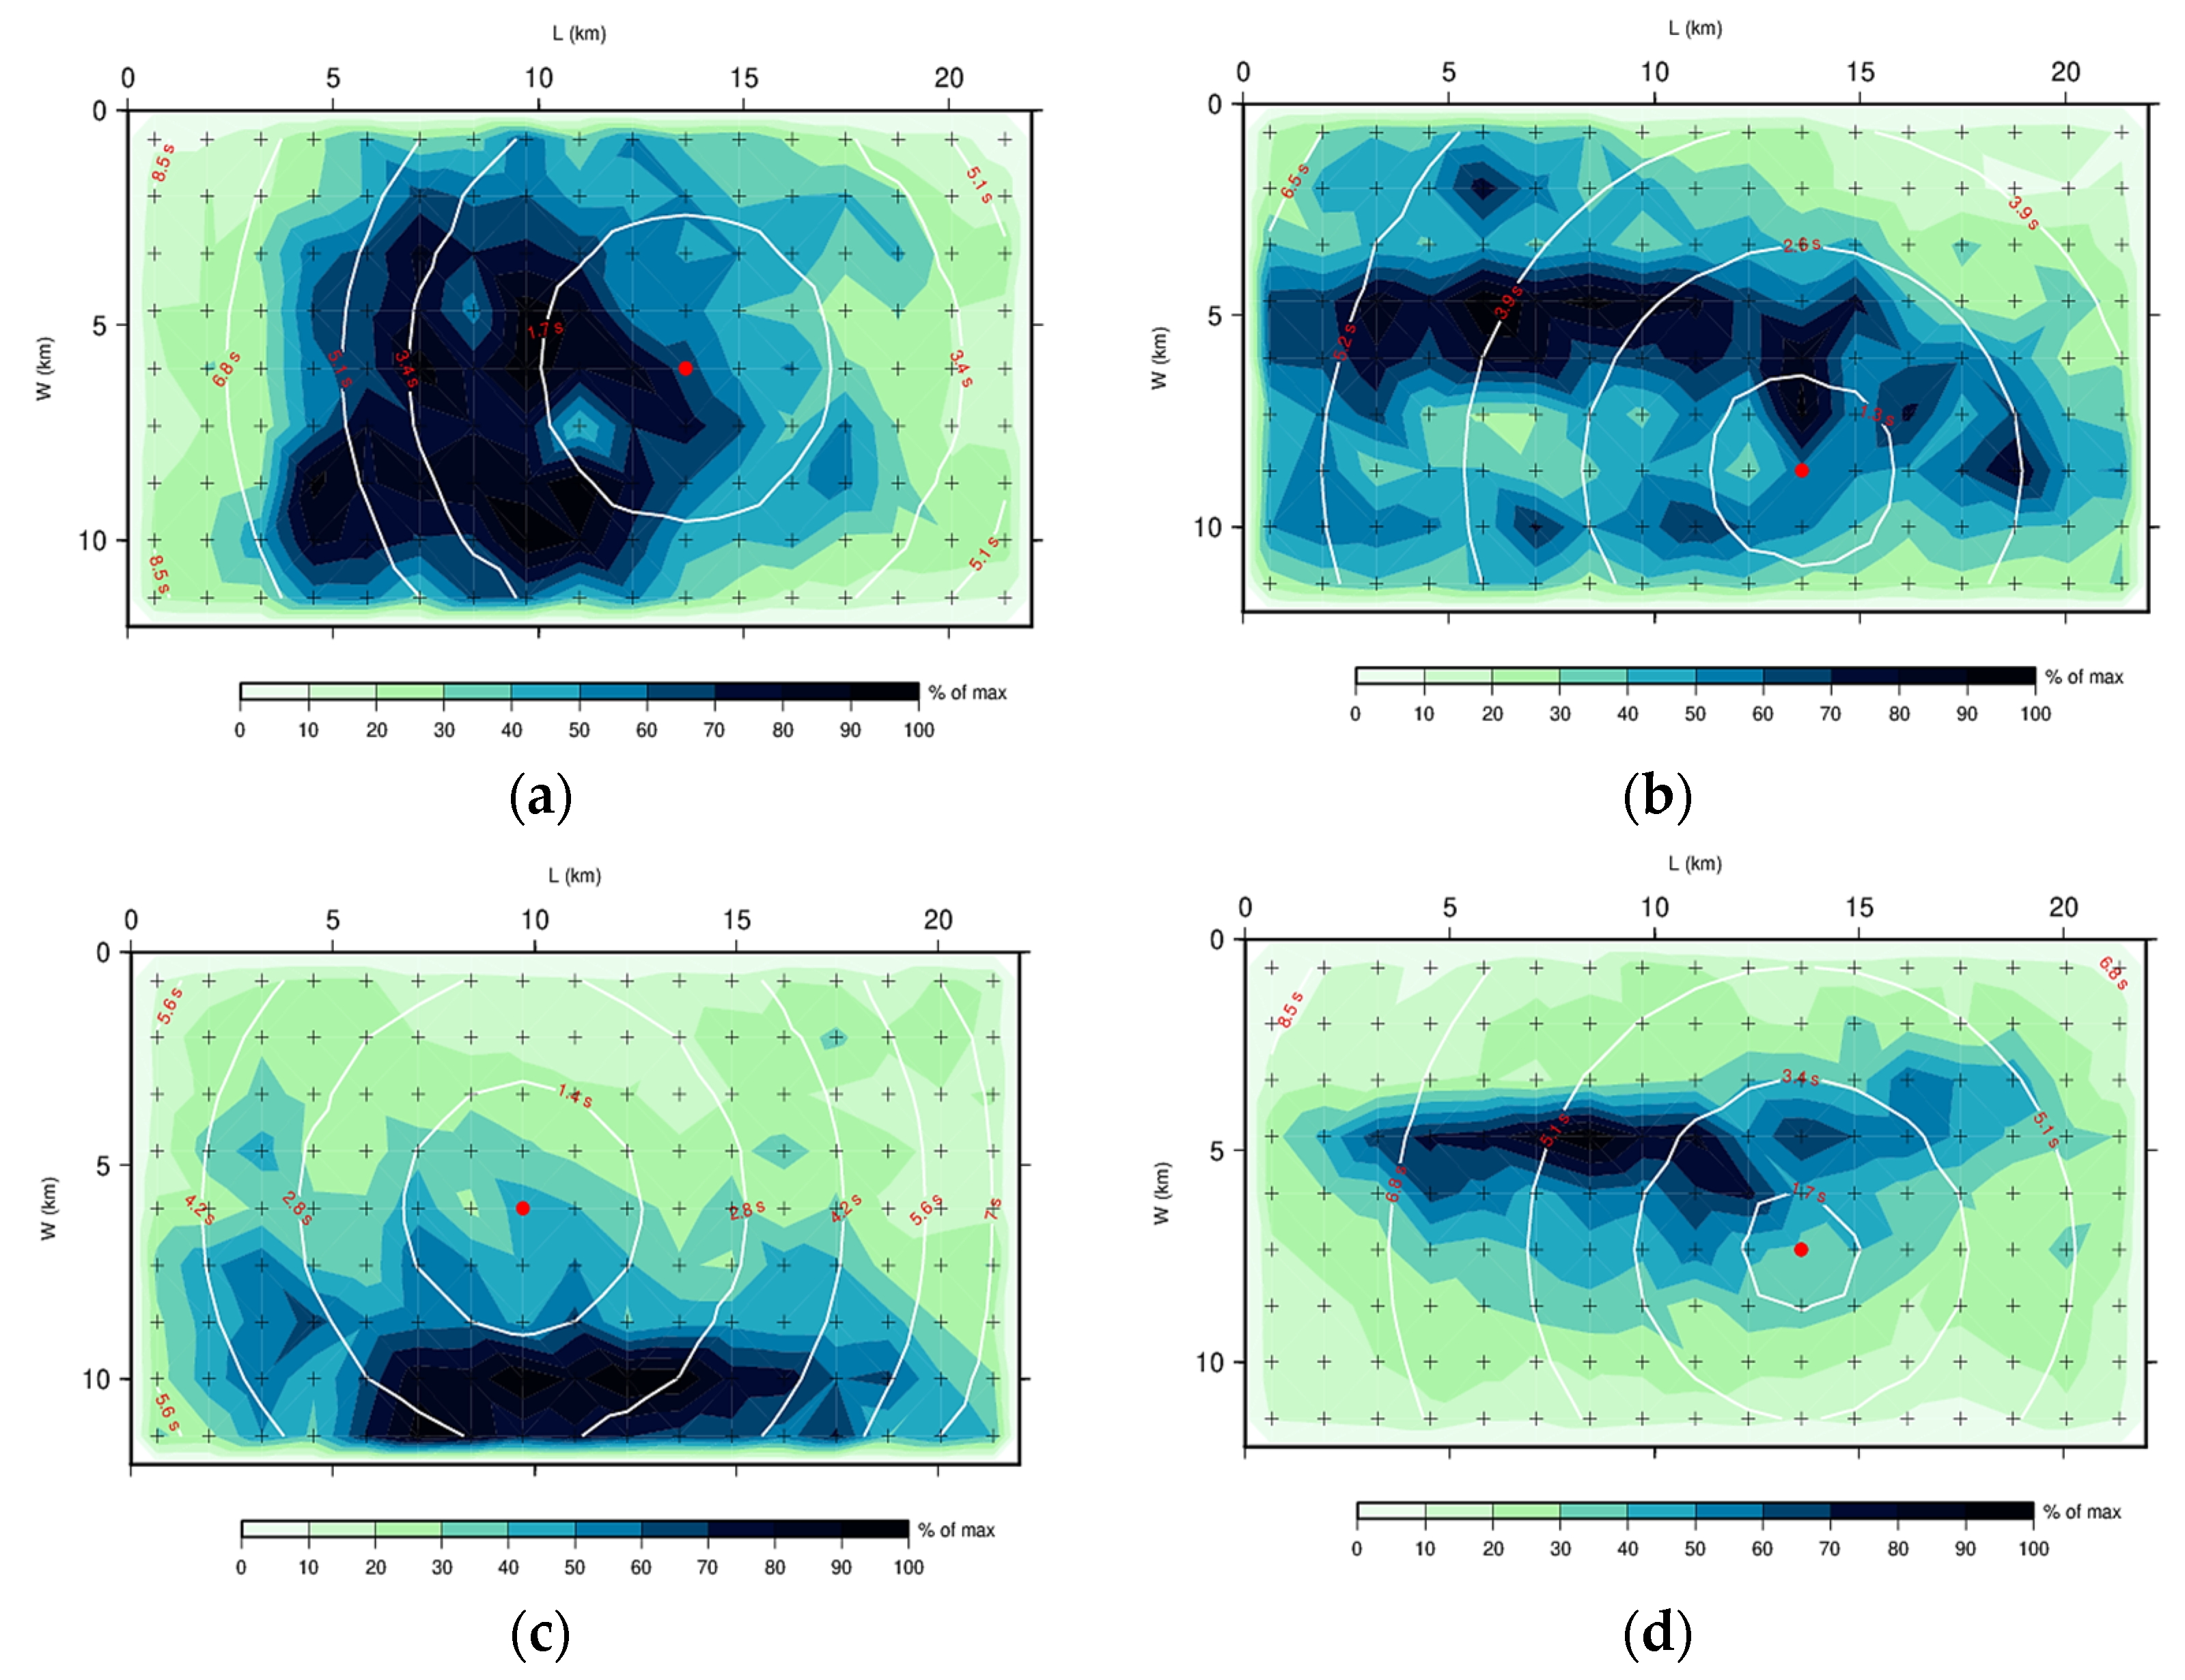
3.2. Fault Scenarios
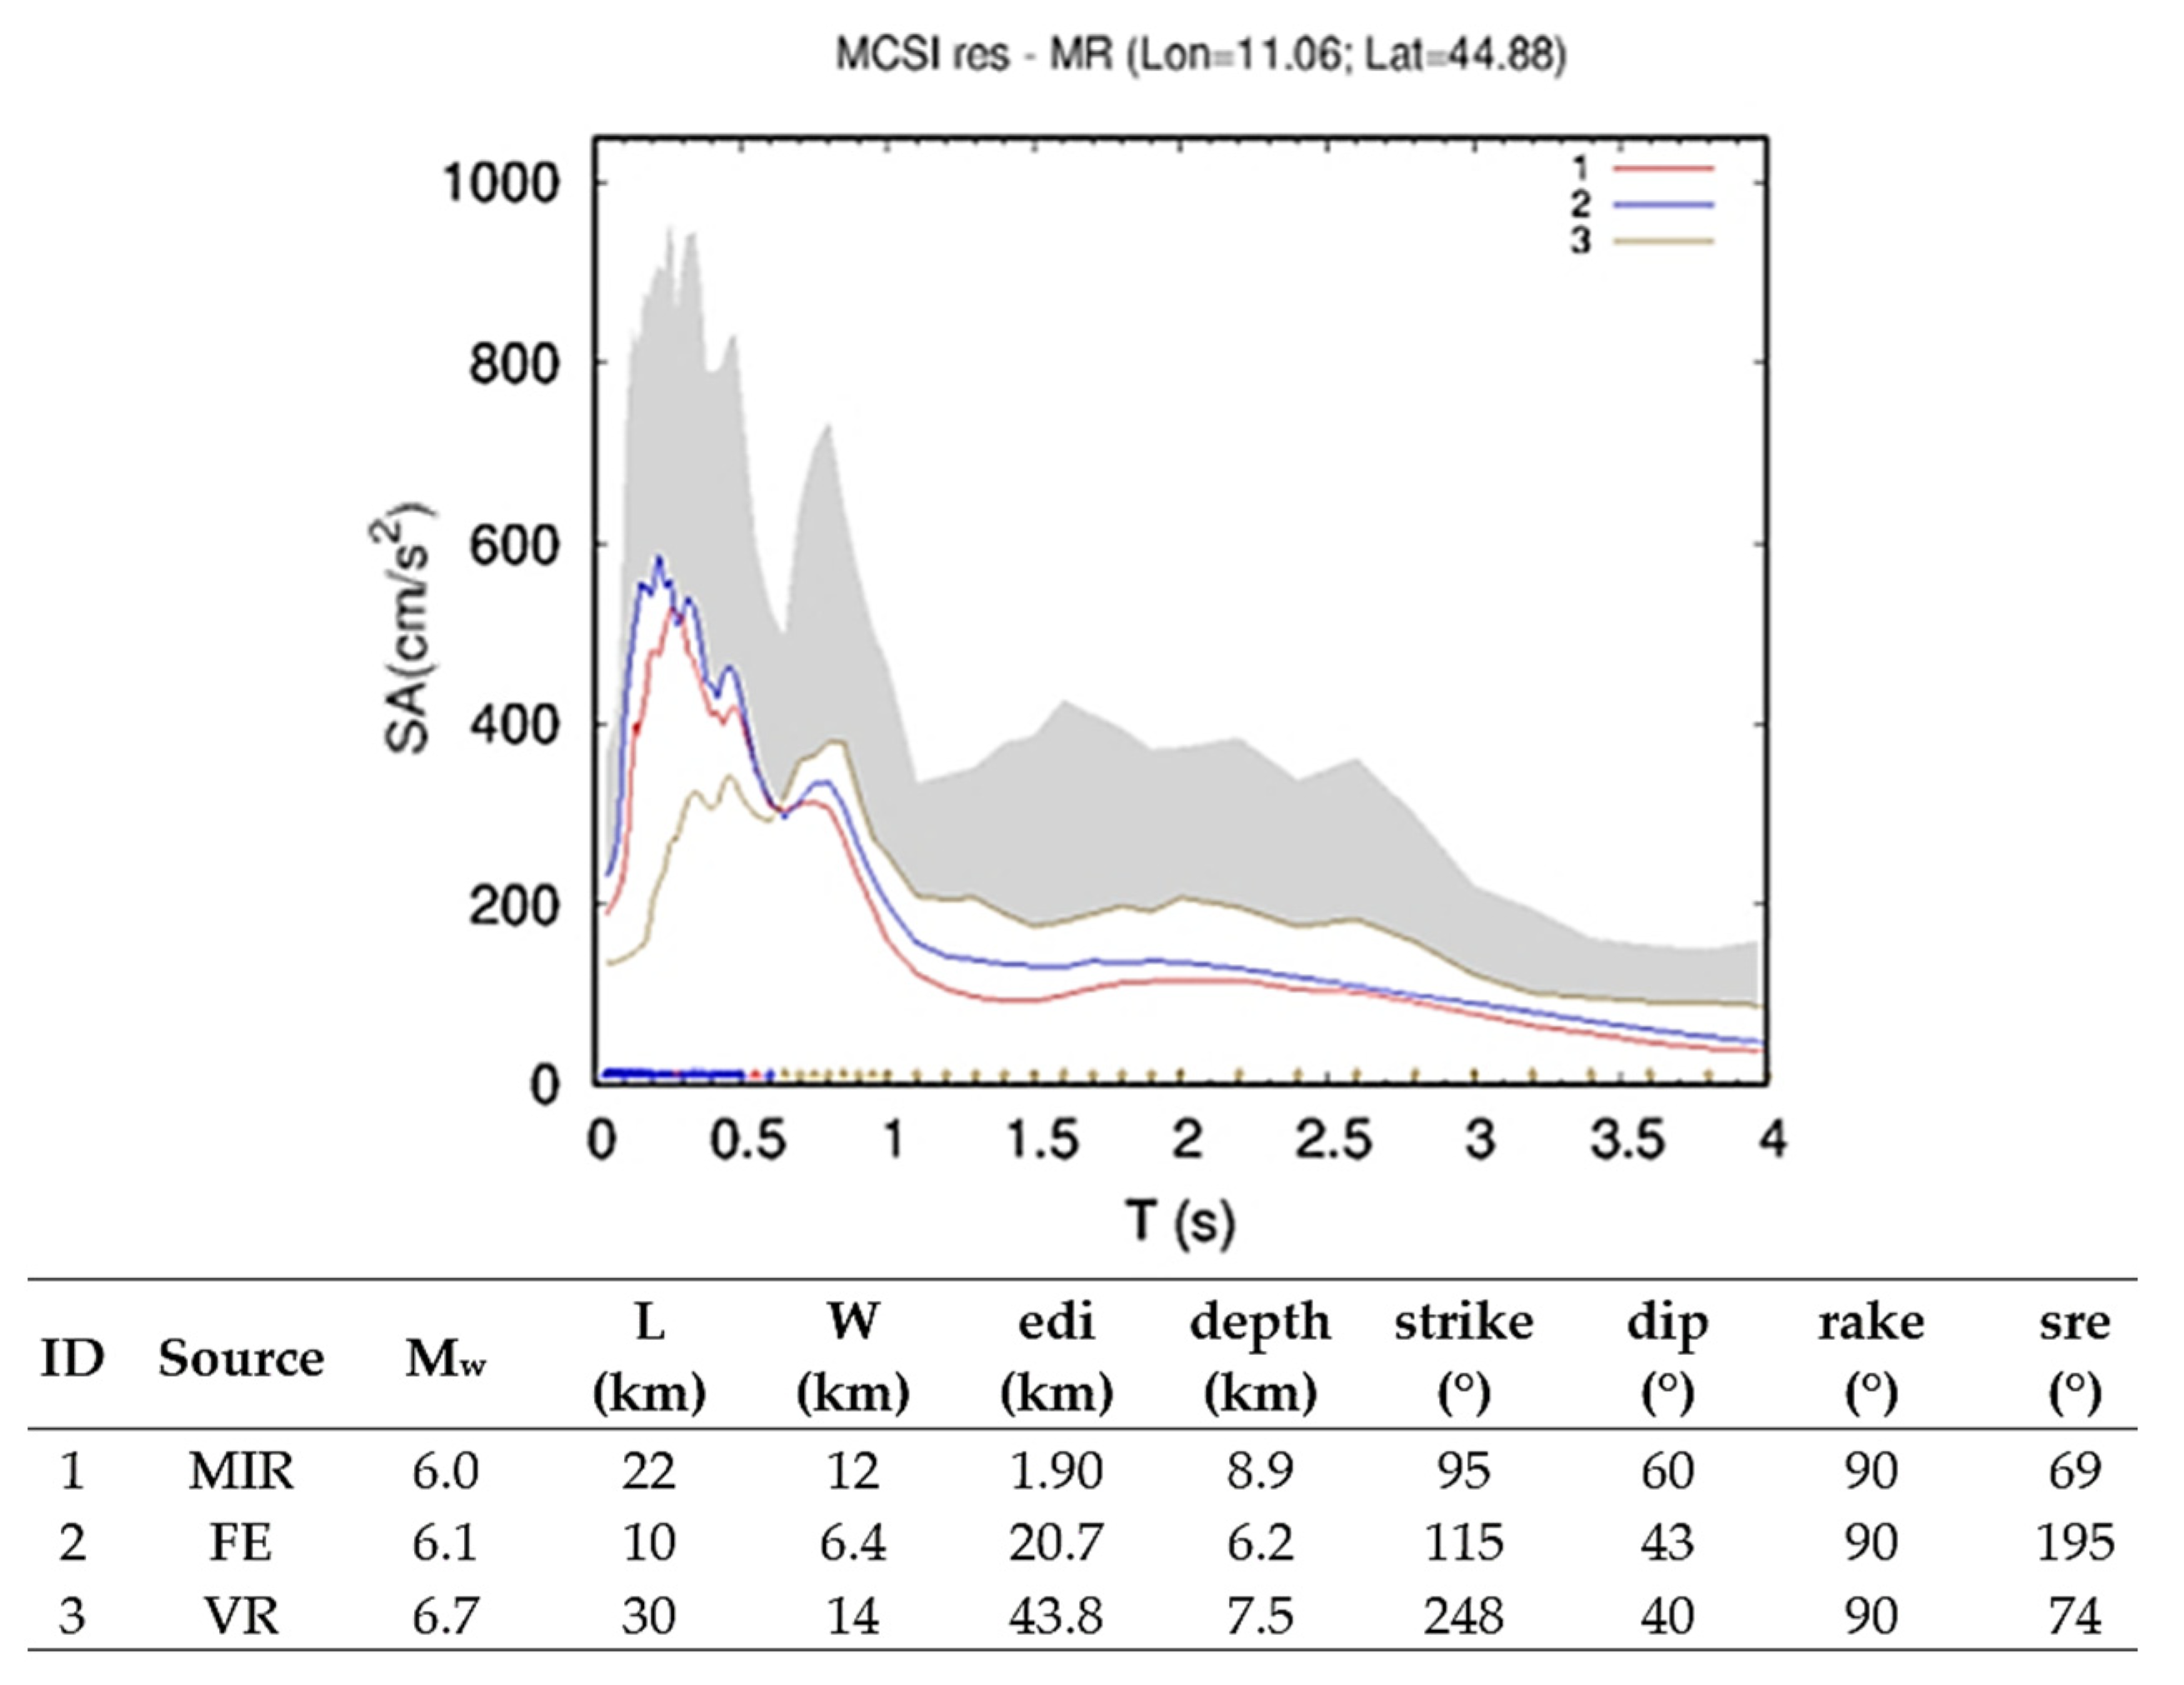
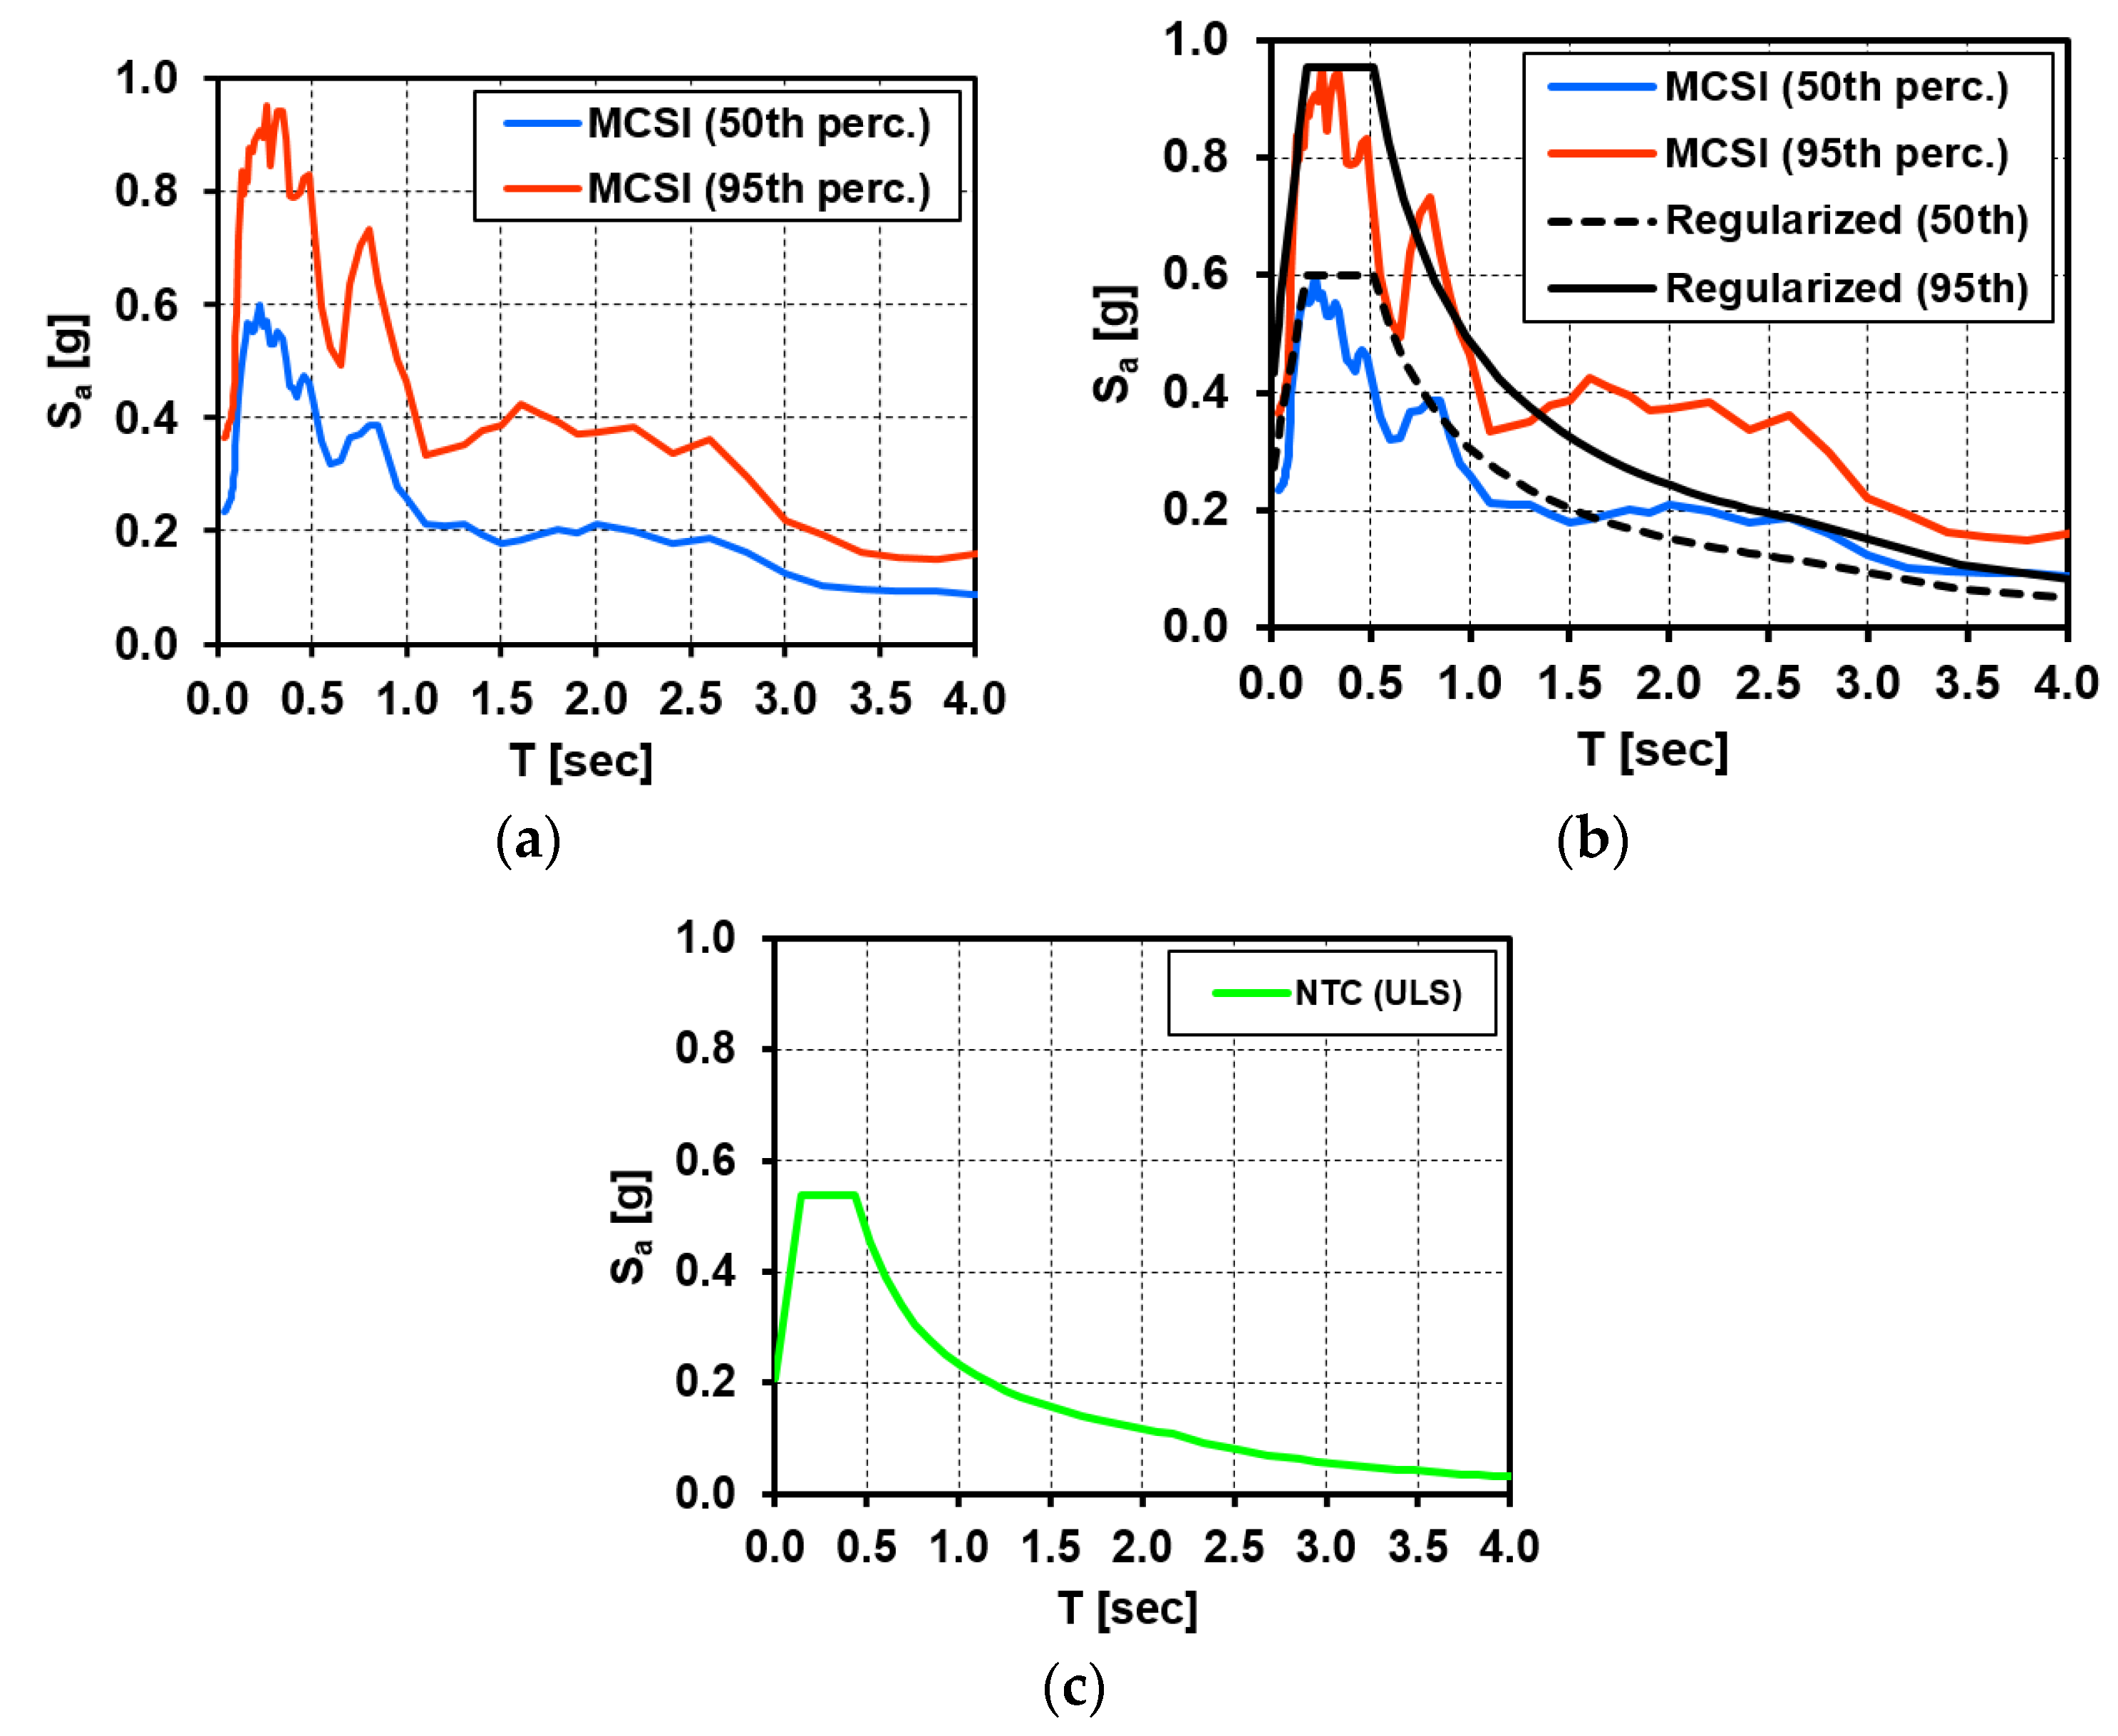
3.3. Maximum Credible Seismic Input (MCSI)
4. A Mechanical Vulnerability Assessment Model
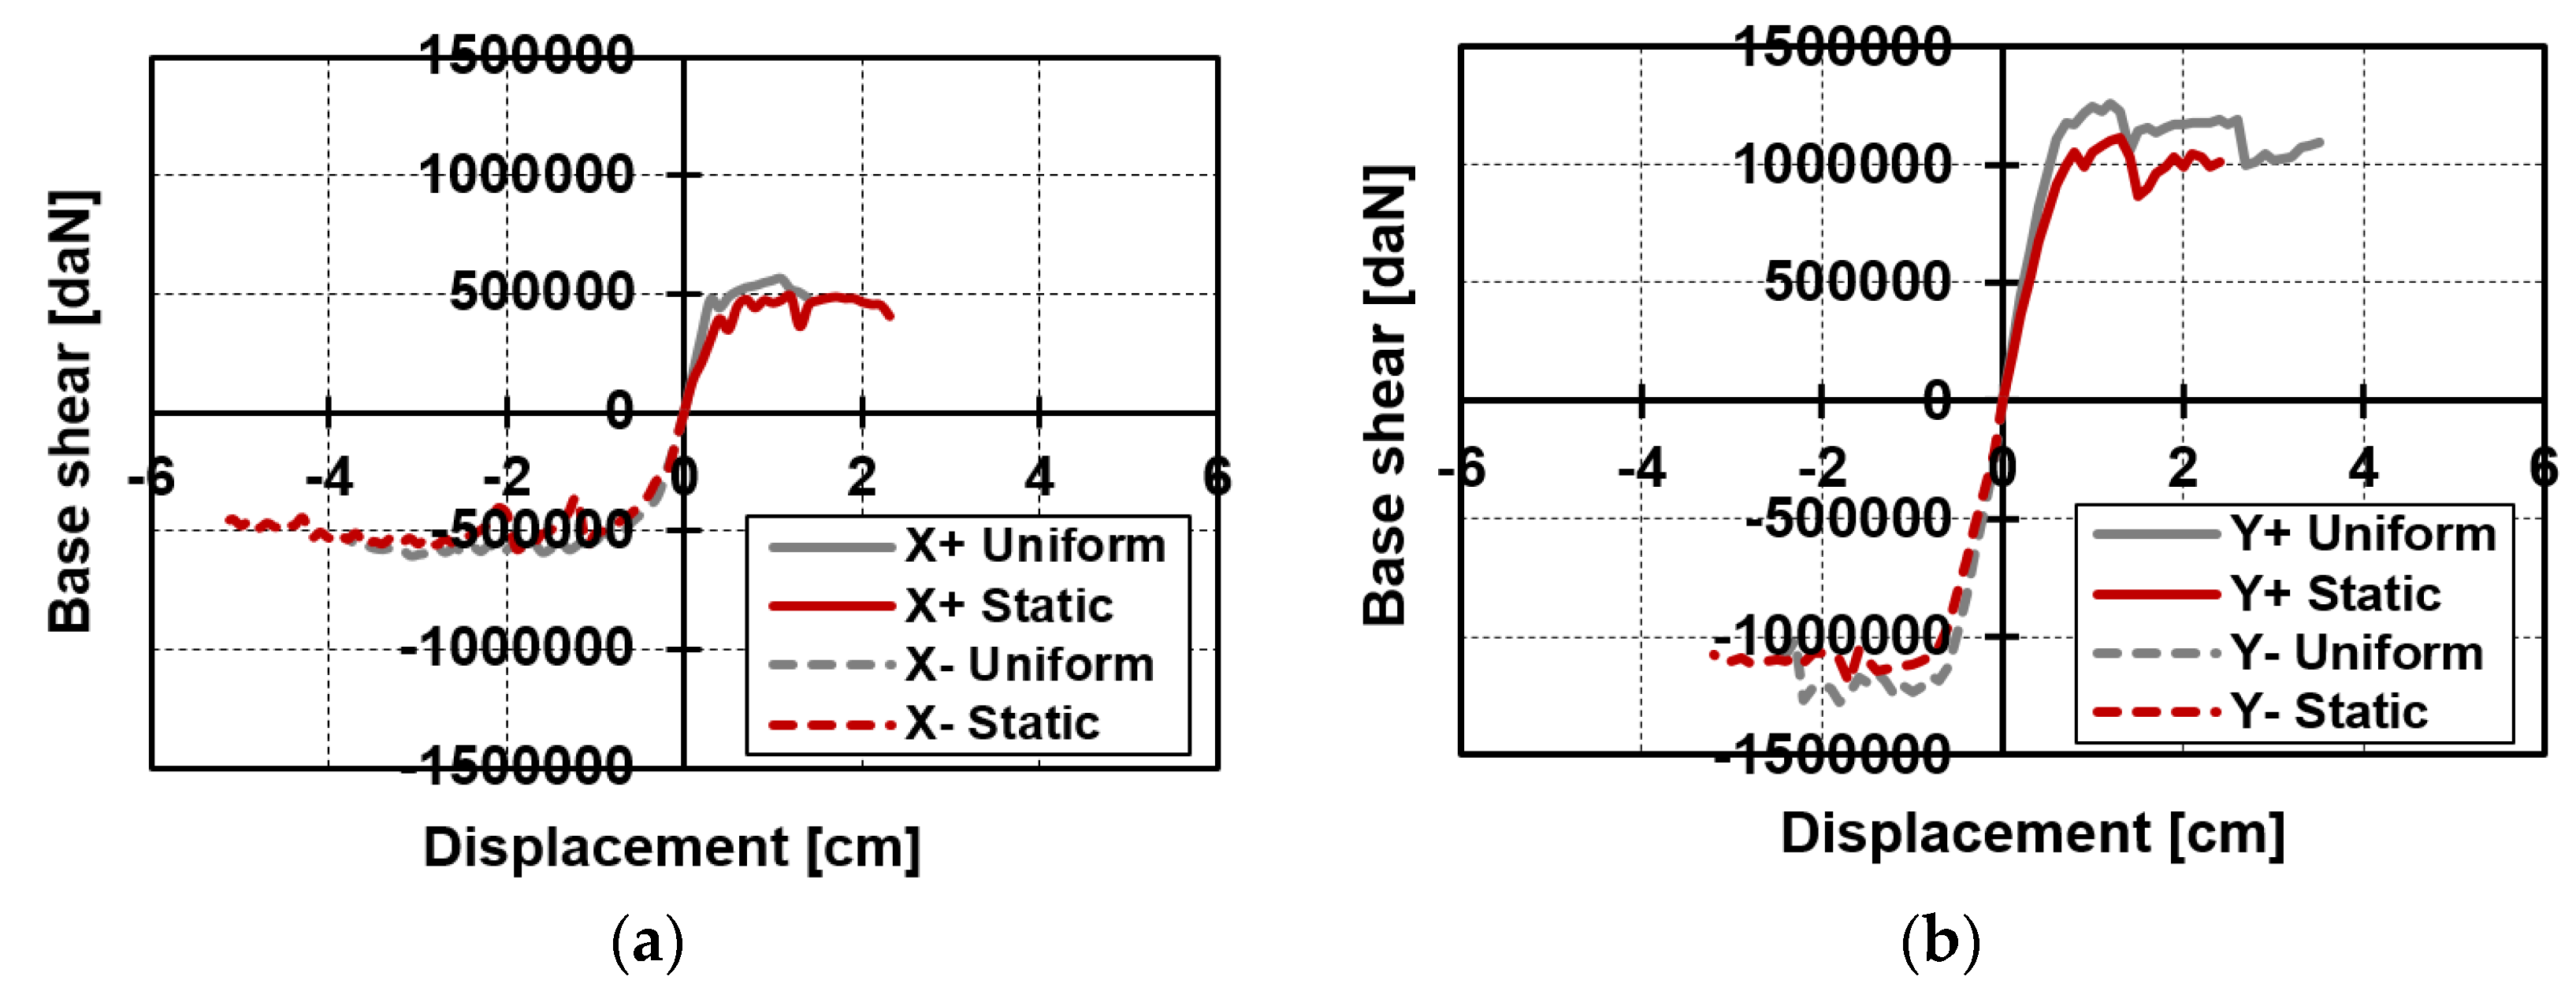
4.1. Global Behaviour of the Case Study Aggregate
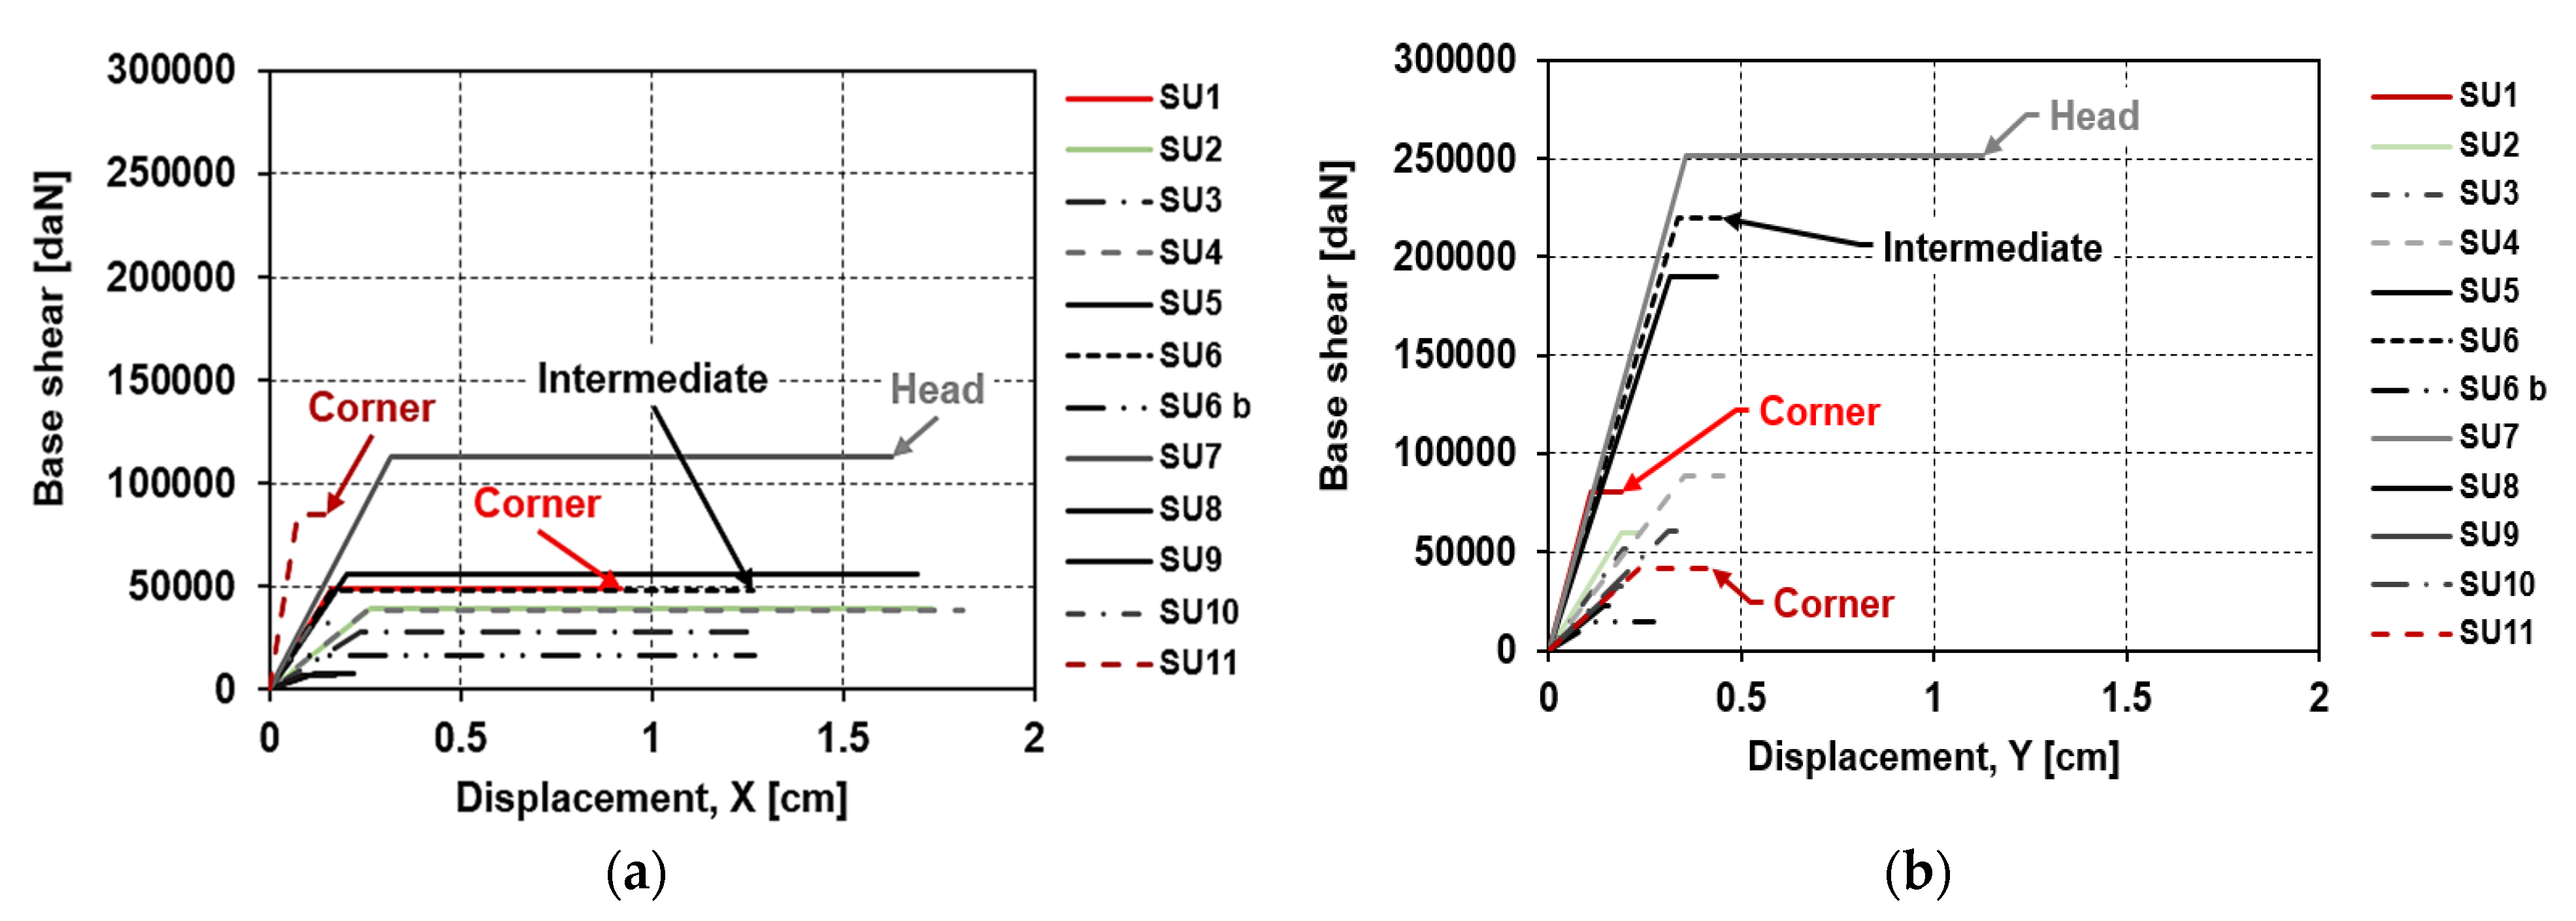
4.2. Capacity Response of Building Structural Units
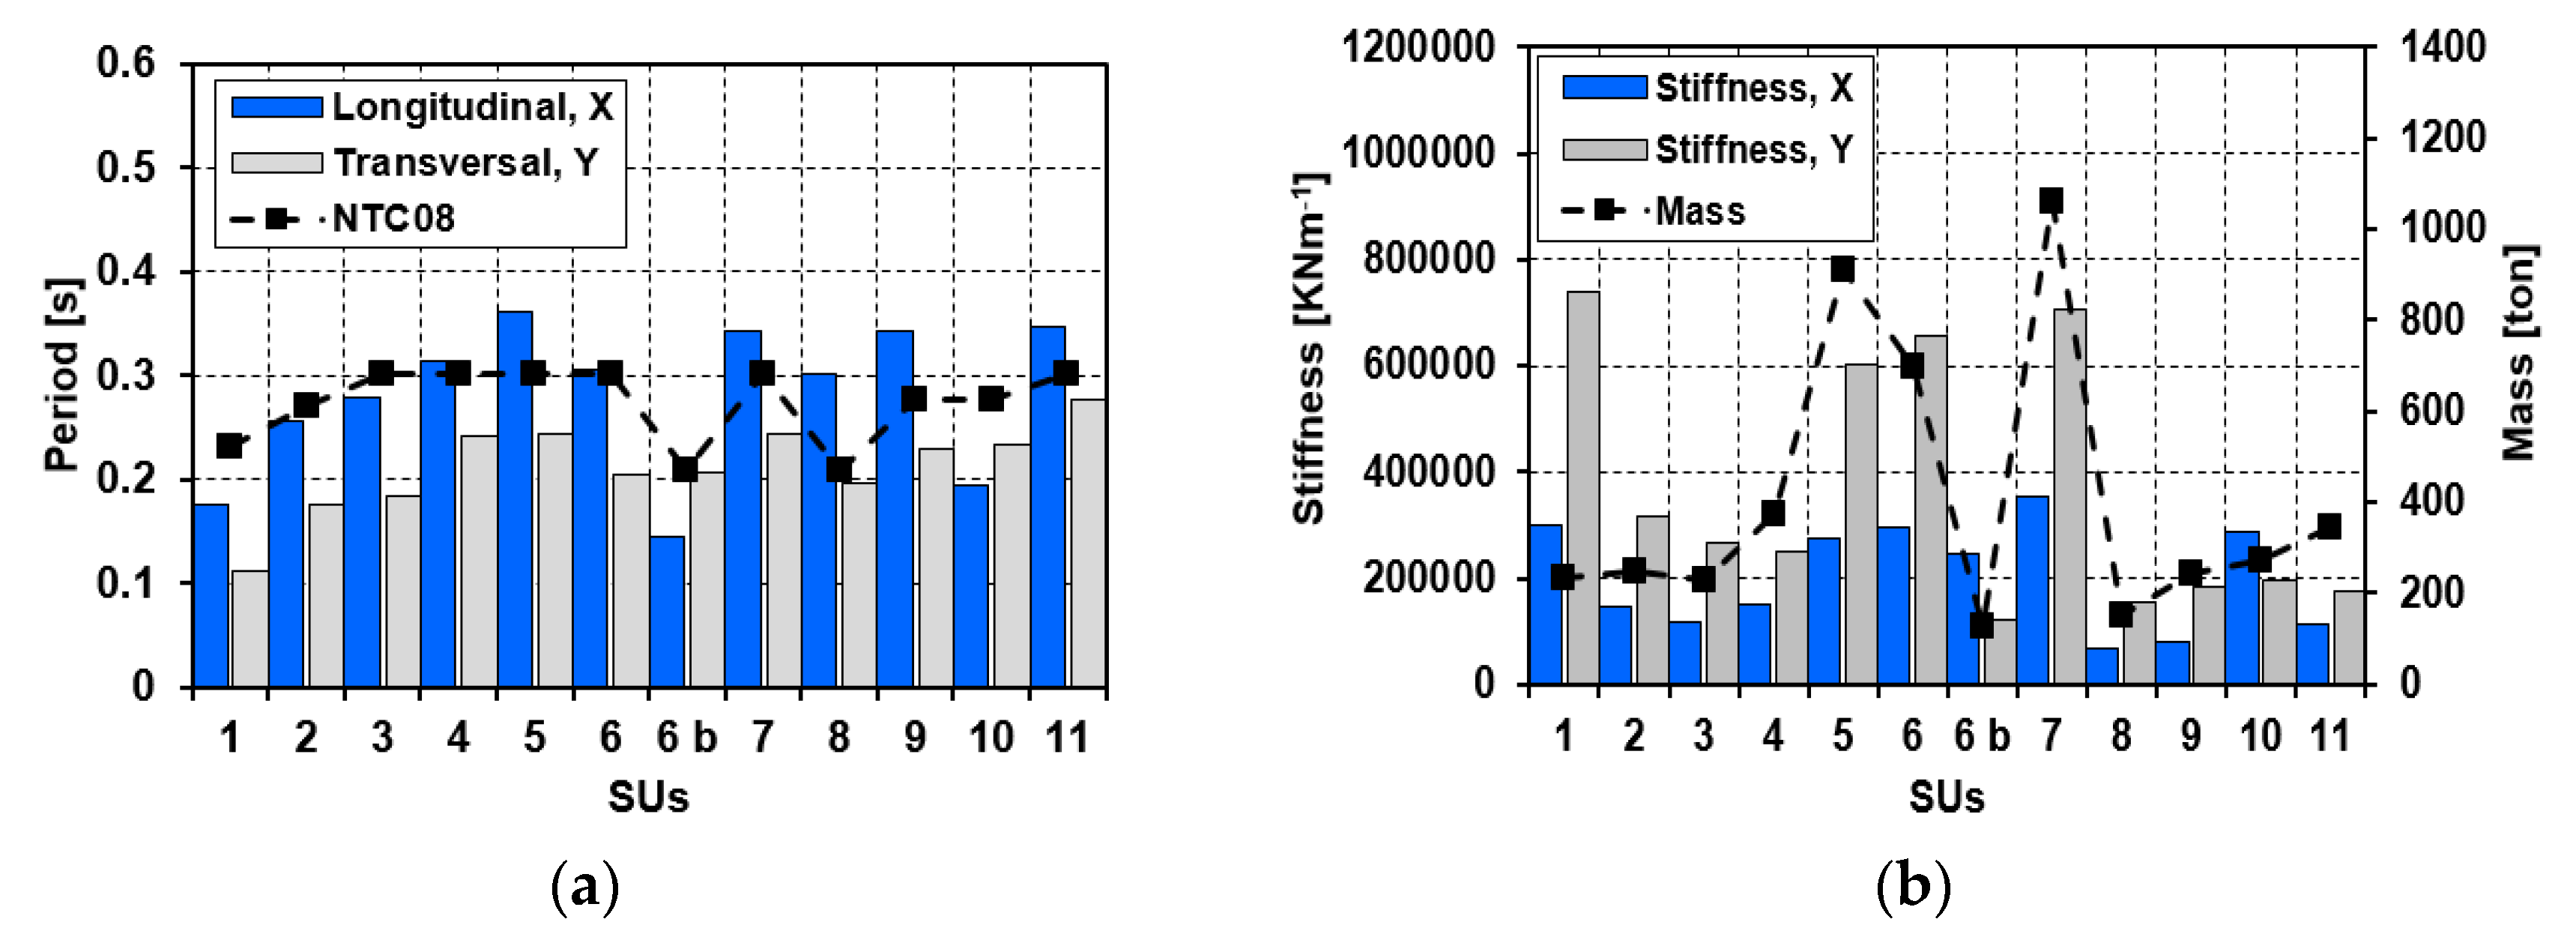
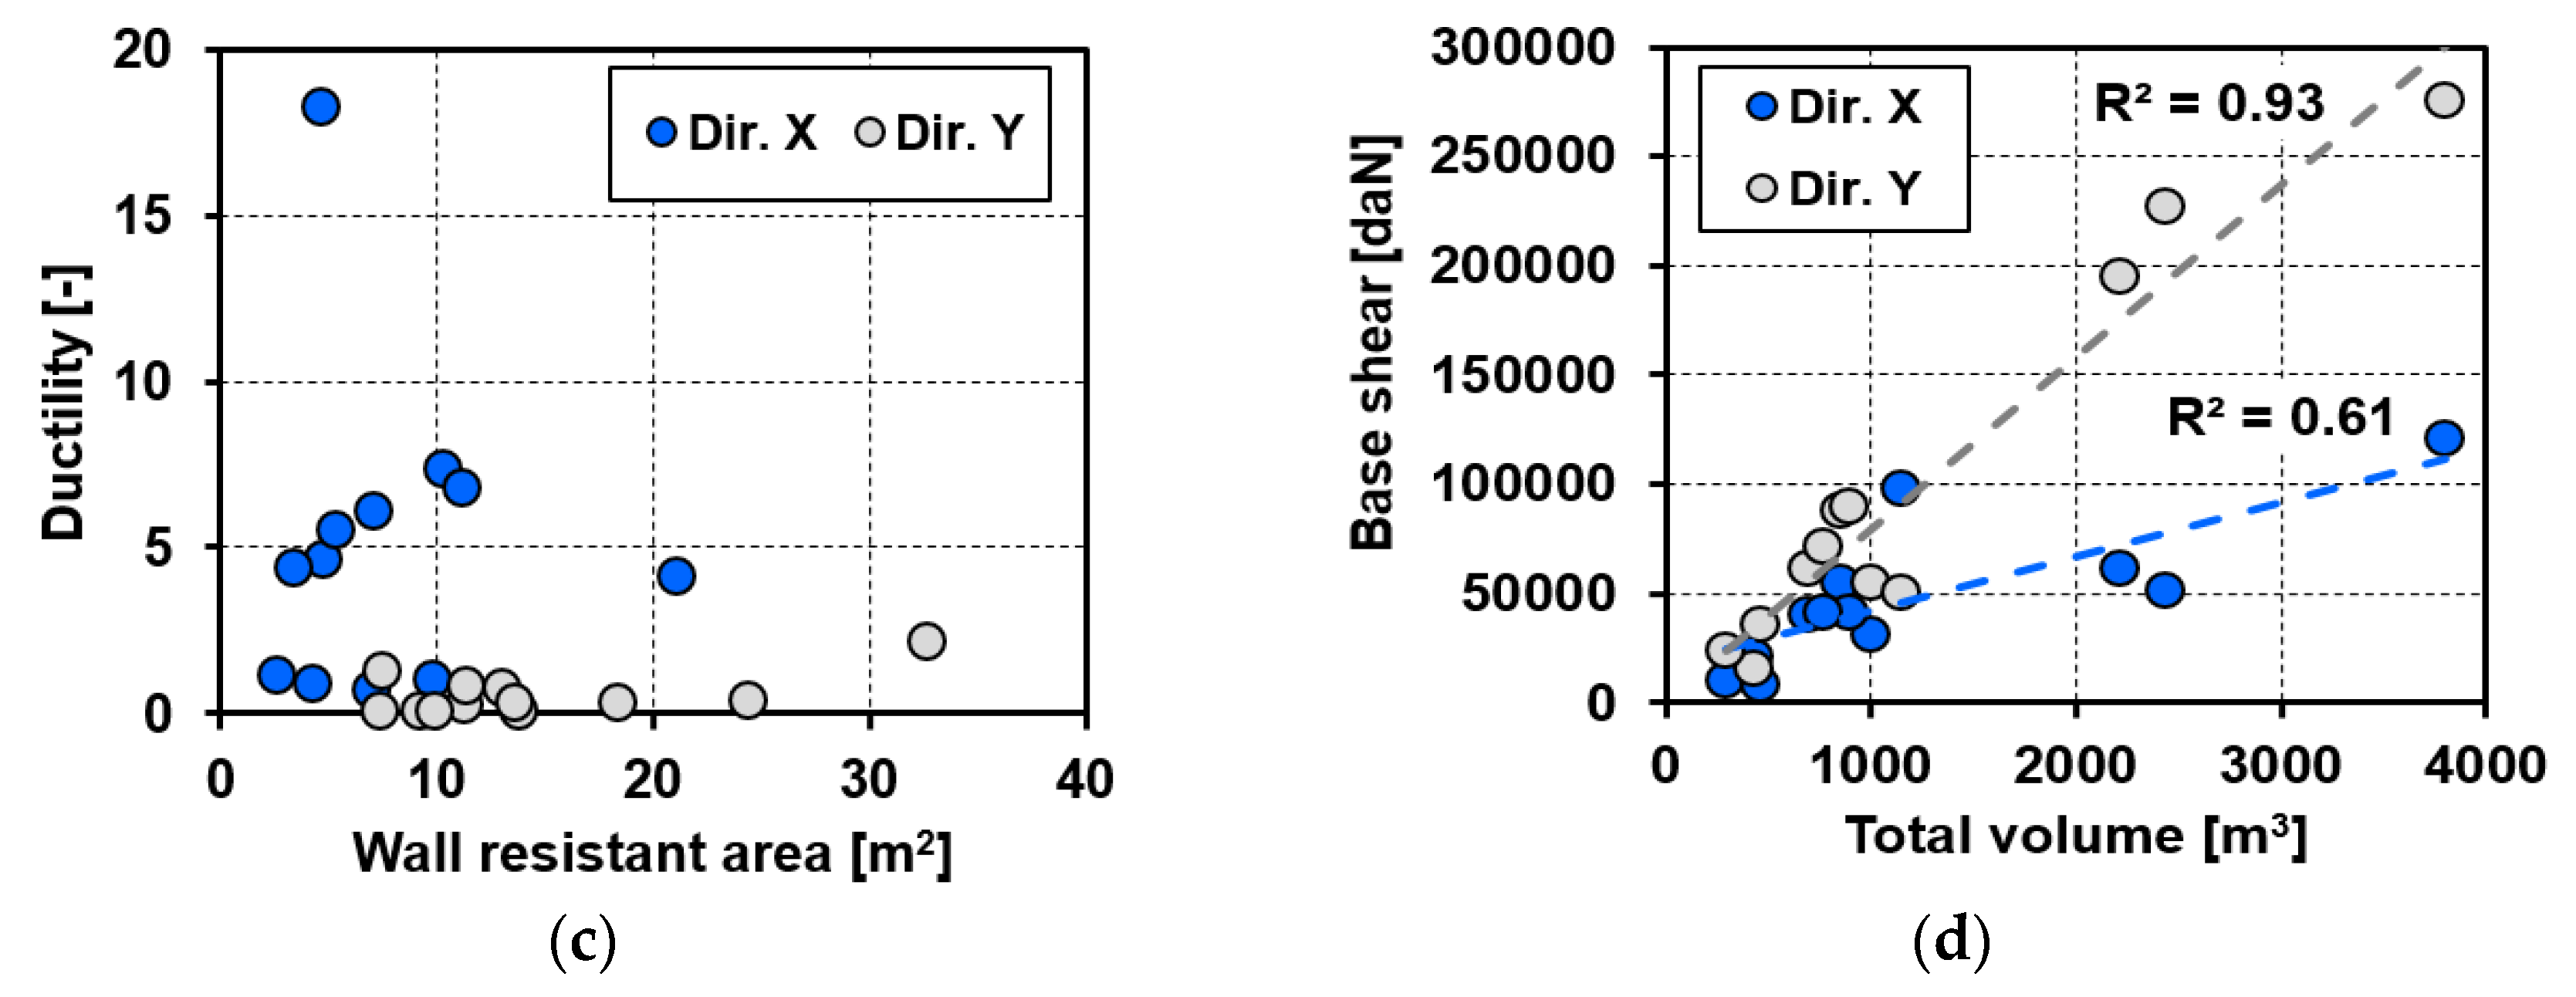
4.3. Analysis of the Capacity Parameters
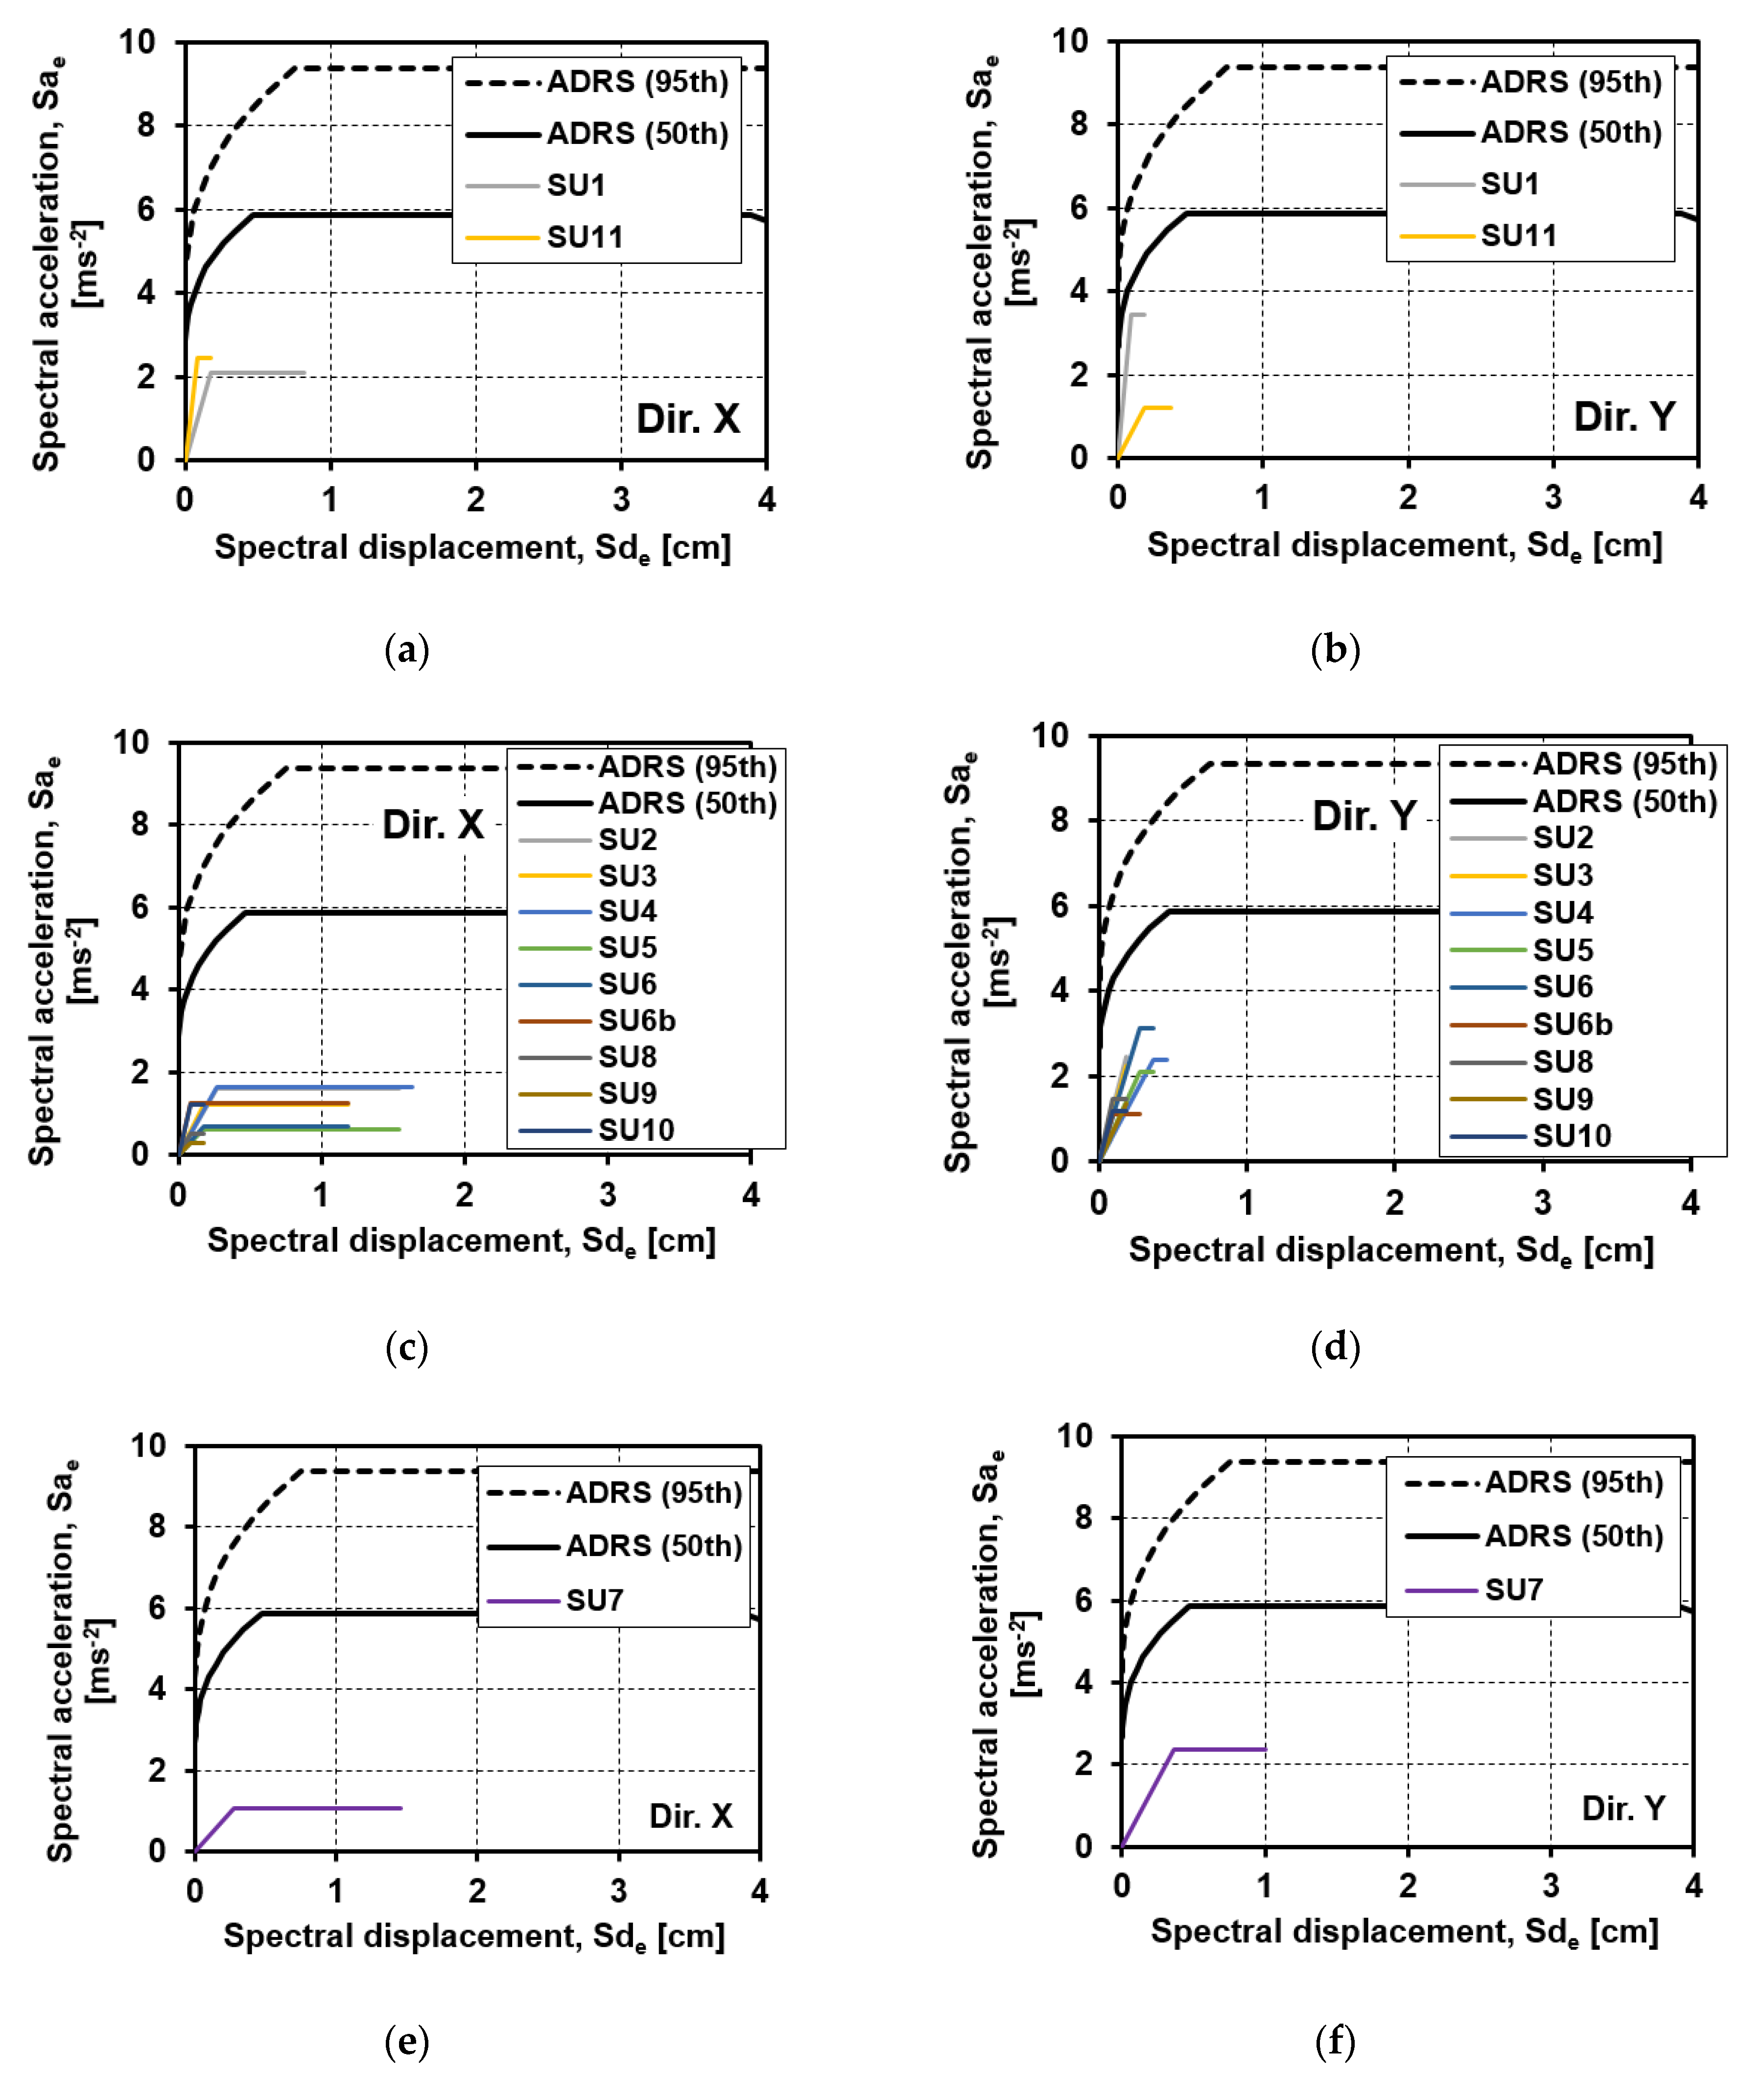
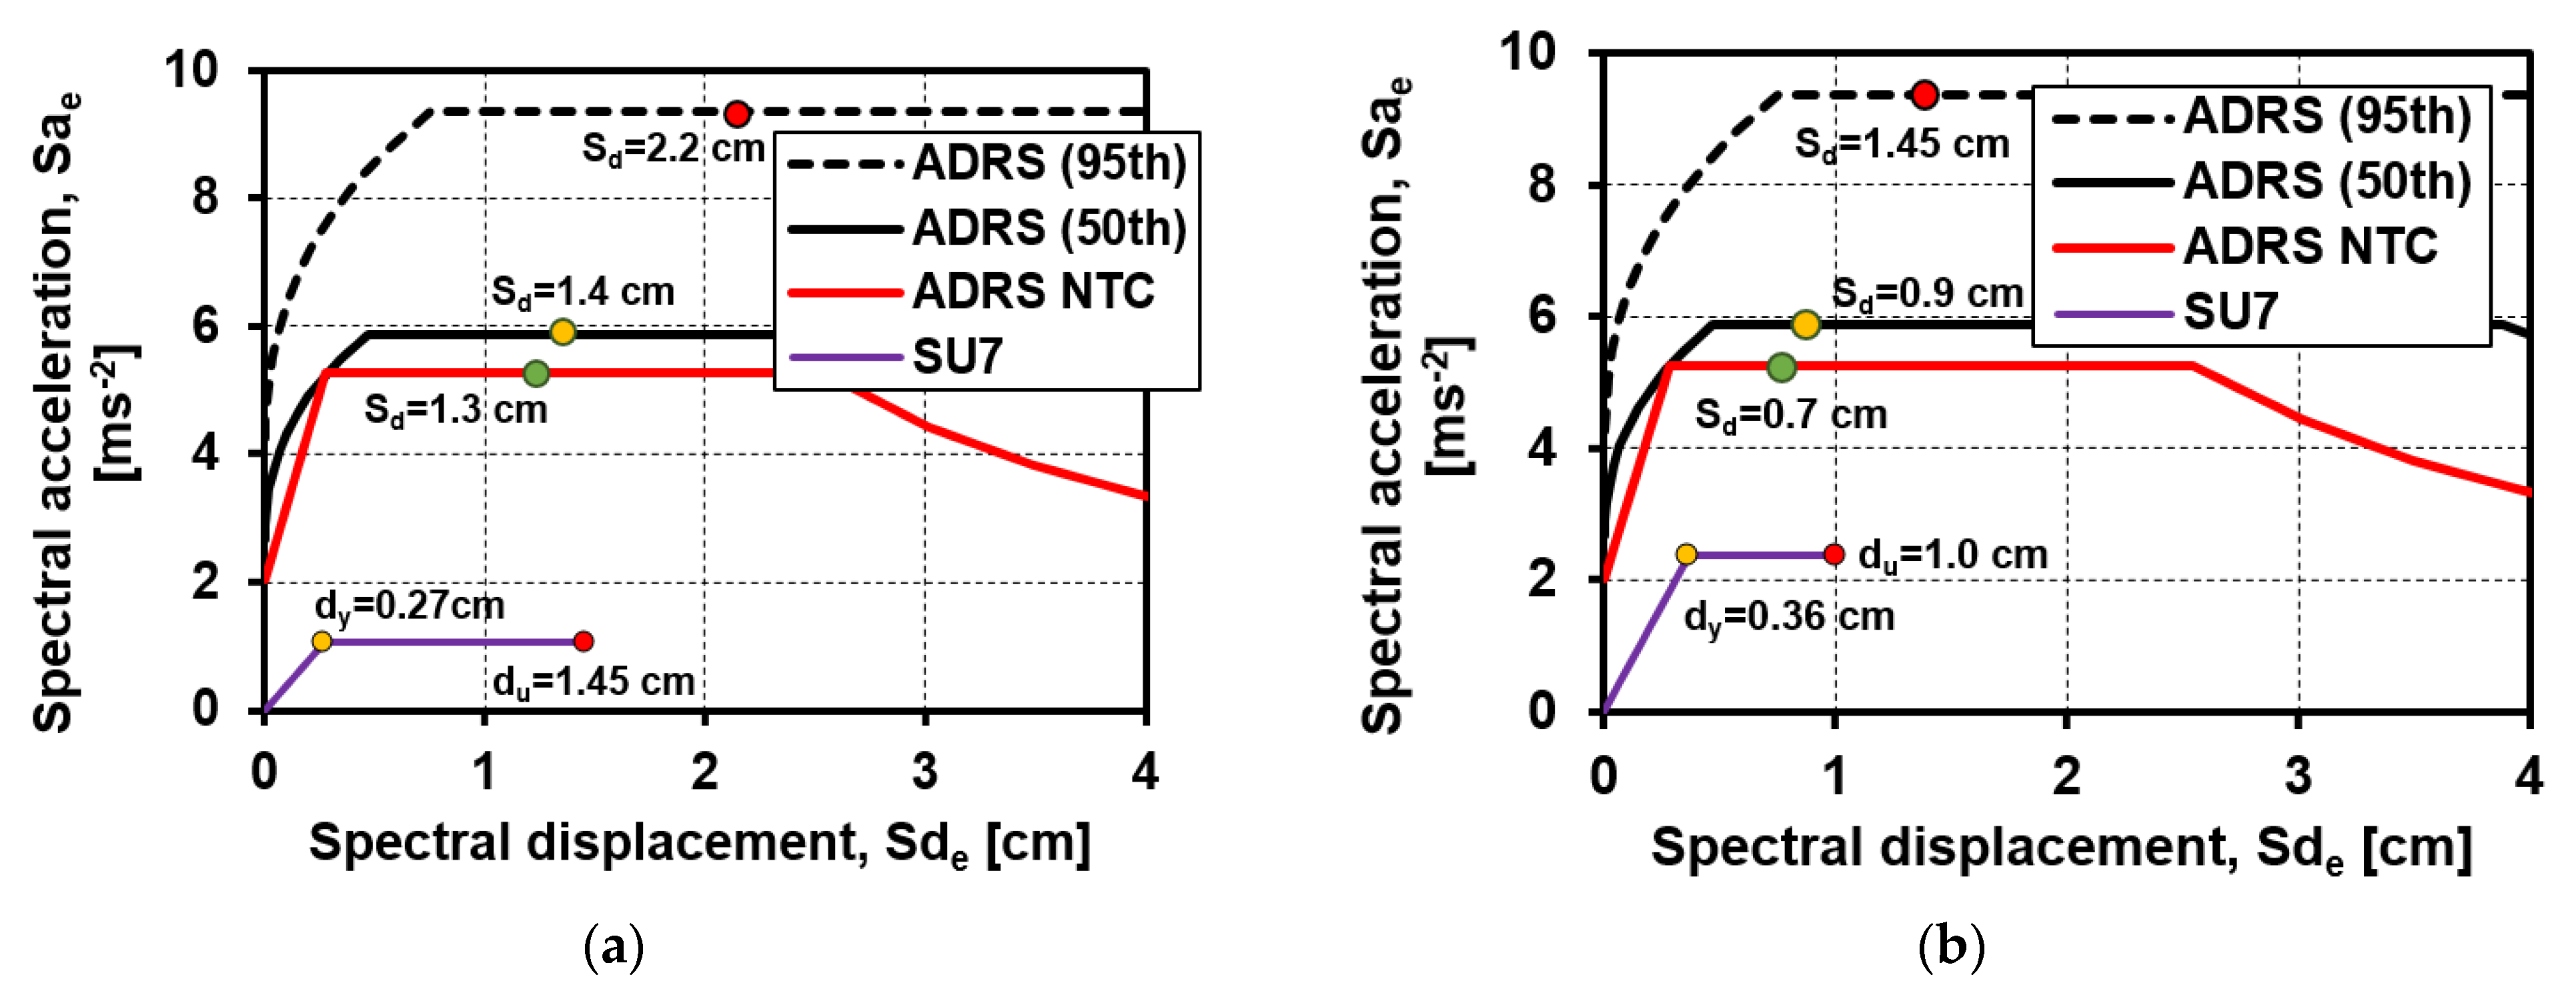
4.4. Vulnerability Assessment for the Bilinear Elasto-Plastic SUs Models
4.5. Fragility Assessment
5. Conclusions
Author Contributions
Funding
Data Availability Statement
Acknowledgments
Conflicts of Interest
References
- Dolce, M.; Prota, A.; Borzi, B.; da Porto, F.; Lagomarsino, S.; Magenes, G.; Moroni, C.; Penna, A.; Polese, M.; Speranza, E.; et al. Seismic risk assessment of residential buildings in Italy. Bull. Earthq. Eng. 2021, 19, 1–34. [Google Scholar] [CrossRef]
- da Porto, F.; Donà, M.; Rosti, A.; Rota, M.; Lagomarsino, S.; Cattari, S.; Borzi, B.; Onida, M.; De Gregorio, D.; Perelli, F.L.; et al. Comparative analysis of the fragility curves for Italian residential masonry and RC buildings. Bull. Earthq. Eng. 2021, 19, 1–44. [Google Scholar] [CrossRef]
- Lagomarsino, S.; Cattari, S.; Ottonelli, D. The heuristic vulnerability model: Fragility curves for masonry buildings. Bull. Earthq. Eng. 2021, 19, 3129–3163. [Google Scholar] [CrossRef]
- Masi, A.; Lagomarsino, S.; Dolce, M.; Manfredi, V.; Ottonelli, D. Towards the updated italian seismic risk assessment: Ex-posure and vulnerability modelling. Bull. Earthq. Eng. 2021, 19, 3253–3286. [Google Scholar] [CrossRef]
- Formisano, A.; Chieffo, N.; Vaiano, G. Seismic Vulnerability assessment and strengthening interventions of structural units of a typical clustered masonry building in the campania region of Italy. GeoHazards 2021, 2, 101–119. [Google Scholar] [CrossRef]
- Clementi, G.-E.F.; Formisano, A.; Milani, G.; Ubertini, F. Structural health monitoring of architectural heritage: From the past to the future advances. Int. J. Arch. Herit. 2021, 15, 1–4. [Google Scholar] [CrossRef]
- Grillanda, N.; Valente, M.; Milani, G. Adaptive NURBS based local failure analyses of retrofitted masonry aggregates. In AIP Conference Proceedings; AIP Publishing LLC: Melville, NY, USA, 2021; Volume 2343, p. 080003. [Google Scholar]
- Bernardini, C. Identification of Minimum Unit of Analsis for Seismic Performance Assessment of Masonry Buildings in Ag-gregate. Ph.D. Thesis, University of Florence, Florence, Italy, 2019. [Google Scholar]
- Battaglia, L.; Ferreira, T.M.; Lourenço, P.B. Seismic fragility assessment of masonry building aggregates: A case study in the old city Centre of Seixal, Portugal. Earthq. Eng. Struct. Dyn. 2021, 50, 1358–1377. [Google Scholar] [CrossRef]
- Chieffo, N.; Formisano, A.; Mochi, G.; Mosoarca, M. Seismic vulnerability assessment and simplified empirical formulation for predicting the vibration periods of structural units in aggregate configuration. Geosciences 2021, 11, 287. [Google Scholar] [CrossRef]
- Cima, V.; Tomei, V.; Grande, E.; Imbimbo, M. Seismic vulnerability of italian historical towns: The case of borgo san rocco. In Advances in Science and Technology; Trans Tech Publications Ltd.: Freienbach, Switzerland, 2021; Volume 109, pp. 1–7. [Google Scholar]
- Jiménez, B.; Saloustros, S.; Pelà, L. Seismic vulnerability index method for hybrid timber–masonry structures. Numerical calibration and application to the city of Valparaíso, Chile. J. Build. Eng. 2021, 44, 103185. [Google Scholar] [CrossRef]
- Angiolilli, M.; Lagomarsino, S.; Cattari, S.; Degli Abbati, S. Seismic fragility assessment of existing masonry buildings in ag-gregate. Eng. Struct. 2021, 247, 113218. [Google Scholar] [CrossRef]
- Leggieri, V.; Ruggieri, S.; Zagari, G.; Uva, G. Appraising seismic vulnerability of masonry aggregates through an automated mechanical-typological approach. Autom. Constr. 2021, 132, 103972. [Google Scholar] [CrossRef]
- Ruggieri, S.; Cardellicchio, A.; Leggieri, V.; Uva, G. Machine-learning based vulnerability analysis of existing buildings. Autom. Constr. 2021, 132, 103936. [Google Scholar] [CrossRef]
- Rapone, D.; Brando, G.; Spacone, E.; De Matteis, G. Seismic vulnerability assessment of historic centers: Description of a pre-dictive method and application to the case study of scanno (Abruzzi, Italy). Int. J. Archit. Herit. 2018, 12, 7–8. [Google Scholar] [CrossRef]
- Roca, P.; Cervera, M.; Gariup, G.; Pelà, L. Structural analysis of masonry historical constructions. Classical and advanced approaches. Arch. Comput. Methods Eng. 2010, 17, 299–325. [Google Scholar] [CrossRef] [Green Version]
- Ferrante, A.; Giordano, E.; Clementi, F.; Milani, G.; Formisano, A. FE vs. DE modeling for the nonlinear dynamics of a historic church in central Italy. Geosciences 2021, 11, 189. [Google Scholar] [CrossRef]
- Ferrante, A.; Schiavoni, M.; Bianconi, F.; Milani, G.; Clementi, F. Influence of stereotomy on discrete approaches applied to an ancient church in Muccia, Italy. J. Eng. Mech. 2021, 147, 04021103. [Google Scholar] [CrossRef]
- Salachoris, G.P.; Magagnini, E.; Clementi, F. Mechanical characterization of “Scaglia Rossa” stone masonry through exper-imental and numerical analyses. Constr. Build. Mater. 2021, 303, 124572. [Google Scholar] [CrossRef]
- Anderson, J.G.; Cotton, F.; Bindi, D. A ground motion based procedure to identify the earthquakes that are the most relevant for probabilistic seismic hazard analysis. Earthq. Spectra 2021, 37, 762–788. [Google Scholar] [CrossRef]
- Rodríguez-Castellanos, A.; Ruiz, S.E.; Bojórquez, E.; Reyes-Salazar, A. Influence of spectral acceleration correlation models on conditional mean spectra and probabilistic seismic hazard analysis. Earthq. Eng. Struct. Dyn. 2021, 50, 309–328. [Google Scholar] [CrossRef]
- Ordaz, M.; Salgado-Gálvez, M.A.; Giraldo, S. R-CRISIS: 35 years of continuous developments and improvements for proba-bilistic seismic hazard analysis. Bull. Earthq. Eng. 2021, 19, 2797–2816. [Google Scholar] [CrossRef]
- Dávalos, H.; Miranda, E. A ground motion prediction model for average spectral acceleration. J. Earthq. Eng. 2021, 25, 319–342. [Google Scholar] [CrossRef]
- Romanelli, F.; Altin, G.; Indirli, M. Spreading NDSHA application from Italy to other areas. In Earthquakes and Sustainable Infrastructure; Elsevier BV: Amsterdam, The Netherlands, 2022; pp. 175–194. [Google Scholar]
- Brandmayr, E.; Vaccari, F.; Panza, G.F. Neo-deterministic seismic hazard assessment of Corsica-Sardinia block. Rend. Lincei. Sci. Fis. E Nat. 2021, 1–10. [Google Scholar] [CrossRef]
- D’Ayala, D.; Meslem, A.; Vamvatsikos, D.; Porter, K.; Rossetto, T.; Silva, V. Guidelines for Analytical Vulnerability Assessment-Low/Mid-Rise. GEM Tech. Rep. 2014. Available online: https://storage.globalquakemodel.org/resources/publications/ (accessed on 20 October 2021).
- Barnaba, M. Physics-Based Seismic Input for Engineering Design and Risk Assessment. Ph.D. Thesis, University of Trieste, Trieste, Italy, 22 October 2021. [Google Scholar]
- Panza, G.F.; Vaccari, F.; Romanelli, F.; Amadio, C.; Fasan, M.; Magrin, A. A seismological and engineering perspective on the 2016 Central Italy earthquakes. Int. J. Earthq. Impact Eng. 2016, 1, 395. [Google Scholar] [CrossRef] [Green Version]
- Ricchiuto, F. Strategie Valutative Della Vulnerabilità Sismica Degli Aggregati Edilizi in Relazione Alla Caratterizzazione Costruttiva: Risultanze Delle Analisi Sugli Aggregati Dell’Intero Centro Storico Di Mirandola; University of Bologna: Bologna, Italy, 2013. (In Italian) [Google Scholar]
- Formisano, A.; Mochi, G.; Chieffo, N. Empirical and mechanical analysis methods for seismic vulnerability assessment of clustered buildings of historical centres: A case study. In Proceedings of the 8th International Conference on Computational Methods in Structural Dynamic Analysis and Its Application to Performance-Based Earthquake Engineering, Athens, Greece, 28–30 June 2021. [Google Scholar] [CrossRef]
- Ministry of Infrastructure and Transport. Updating Technical Standards for Construction; Official Gazette: Rome, Italy, 2018. (In Italian) [Google Scholar]
- Vamvatsikos, D.; Cornell, C.A. The Incremental Dynamic Analysis and Its Application to Performance-Based Earthquake Engineering. In Proceedings of the 12th European Conference on Earthquake Engineering, London, UK, 9–13 September 2002; p. 479. [Google Scholar]
- Lantada, N.; Pujades, L.G.; Barbat, A.H. Vulnerability index and capacity spectrum based methods for urban seismic risk evaluation. A comparison. Nat. Hazards 2008, 51, 501–524. [Google Scholar] [CrossRef]
- Vaccari, F.; Magrin, A. A user-friendly approach to NDSHA computations. In Earthquakes and Sustainable Infrastructure; Elsevier BV: Amsterdam, The Netherlands, 2022; pp. 215–237. ISBN 978-0-12-823503-4. [Google Scholar]
- Magrin, A.; Gusev, A.A.; Romanelli, F.; Vaccari, F.; Panza, G.F. Broadband NDSHA computations and earthquake ground motion observations for the Italian territory. Int. J. Earthq. Impact Eng. 2016, 1, 131. [Google Scholar] [CrossRef]
- Panza, G.F.; Romanelli, F.; Vaccari, F. Seismic wave propagation in laterally heterogeneous anelastic media: Theory and ap-plications to seismic zonation. In Advances in Geophysics; Dmowska, R., Saltzman, B., Eds.; Elsevier: Amsterdam, The Netherlands, 2001; Volume 43, pp. 1–95. [Google Scholar]
- Pavlov, V.M. Matrix impedance in the problem of the calculation of synthetic seismograms for a layered-homogeneous isotropic elastic medium. Izv. Phys. Solid Earth 2009, 45, 850–860. [Google Scholar] [CrossRef]
- Italian Accelerometric Archive v3.1. Available online: http://itaca.mi.ingv.it/ItacaNet_31/#/home (accessed on 6 October 2021).
- Paolucci, R.; Mazzieri, I.; Smerzini, C. Anatomy of strong ground motion: Near-source records and three-dimensional physics-based numerical simulations of theMw6.0 2012 May 29 Po Plain earthquake, Italy. Geophys. J. Int. 2015, 203, 2001–2020. [Google Scholar] [CrossRef]
- Gusev, A.A. Broadband kinematic stochastic simulation of an earthquake source: A refined procedure for application in seismic hazard studies. Pure Appl. Geophys. 2010, 168, 155–200. [Google Scholar] [CrossRef]
- Fasan, M.; Magrin, A.; Amadio, C.; Panza, G.F.; Romanelli, F.; Vaccari, F.; Noè, S. A possible revision of the current seismic design process to overcome the limitations of standard probabilistic seismic input definition. In Proceedings of the 16th World Conference on Earthquake, 16WCEE 2017, Santiago, Chile, 9–13 January 2017; p. 12. [Google Scholar]
- Rugarli, P.; Amadio, C.; Peresan, A.; Fasan, M.; Vaccari, F.; Magrin, A.; Romanelli, F.; Panza, G.F. Neo-Deterministic Scenario-Earthquake Accelerograms and Spectra: A NDSHA approach to seismic analysis. In Engineering Dynamics and Vibrations: Recent Developments; Jia, J., Paik, J.K., Eds.; CRC Press: Boca Raton, FL, USA, 2018; pp. 187–241. [Google Scholar]
- Database of Individual Seismogenic Sources, V. 3.0. Available online: http://diss.rm.ingv.it/diss/ (accessed on 6 October 2021).
- Vannoli, P.; Burrato, P.; Valensise, G. The seismotectonics of the Po Plain (Northern Italy): Tectonic diversity in a blind faulting domain. Pure Appl. Geophys. 2015, 172, 1105–1142. [Google Scholar] [CrossRef] [Green Version]
- Guidoboni, E.; Ferrari, G.; Mariotti, D.; Comastri, A.; Tarabusi, G.; Valensise, G. Catalogue of Strong Earthquakes in Italy (461 B.C.-1997) and Mediterranean Area (760 B.C.-1500). CFTI4Med. 2007. Available online: http://storing.ingv.it/cfti/cfti5/html/info_EN.html (accessed on 20 October 2021).
- Mantovani, E.; Viti, M.; Babbucci, D.; Tamburelli, C.; Vannucchi, A.; Baglione, M.; D’Intinosante, V.; Cenni, N. Stima Aggiornata della Pericolosità Sismica in Toscana e aree Circostanti; Universitas Studiorum: Milan, Italy, 2018; ISBN 978-88-336-9014-8. [Google Scholar]
- De Natale, G.; Petrazzuoli, S.; Romanelli, F.; Troise, C.; Vaccari, F.; Somma, R.; Peresan, A.; Panza, G.F. Seismic risk mitigation at Ischia island (Naples, Southern Italy): An innovative approach to mitigate catastrophic scenarios. Eng. Geol. 2019, 261, 105285. [Google Scholar] [CrossRef]
- STA DATA. 3Muri-Seismic Calculation of Masonry Structures; STA DATA Srl: Turin, Italy. Available online: https://www.3muri.com/documenti/brochure/en/3Muri10.9.0_ENG.pdf (accessed on 20 October 2021).
- EN 1998-3. Eurocode 8: Design of structures for earthquake resistance. In Part 3: Assessment and Retrofitting of Buildings; CEN: Bruxelles, Belgium, 2004; pp. 1–97. [Google Scholar]
- Chieffo, N. Seismic Vulnerability Assessment of Historical Masonry Building under Near-Field Earthquake. Ph.D. Thesis, Politehnica University of Timisoara, Romania, Balkans, 27 August 2021. [Google Scholar]
- Grünthal, G. The European macroseismic scale 1992: (up-dated MSK-scale). In Cahiers du Centre Européen de Géodyna-Mique et de Séismologie 7; Centre Européen de Géodynamique et de Séismologie: Luxembourg, 1998; p. 99. [Google Scholar]
- Hadzima-Nyarko, M.; Morić, D.; Pavić, G.; Mišetić, V. Spectral functions of damage index (DI) for masonry buildings with flexible floors. Teh. Vjesn. 2018, 25, 181–187. [Google Scholar] [CrossRef] [Green Version]
- Chieffo, N.; Formisano, A. Comparative seismic assessment methods for masonry building aggregates: A case study. Front. Built Environ. 2019, 5, 123. [Google Scholar] [CrossRef]
- Chieffo, N.; Clementi, F.; Formisano, A.; Lenci, S. Comparative fragility methods for seismic assessment of masonry buildings located in Muccia (Italy). J. Build. Eng. 2019, 25, 100813. [Google Scholar] [CrossRef]
- Hassan, H.M.; Fasan, M.; Sayed, M.A.; Romanelli, F.; ElGabry, M.N.; Vaccari, F.; Hamed, A. Site-specific ground motion modeling for a historical Cairo site as a step towards computation of seismic input at cultural heritage sites. Eng. Geol. 2020, 268, 105524. [Google Scholar] [CrossRef]
- Fajfar, P.; Fischinger, M. N2-A Method for Non-Linear Seismic Analysis of Regular Buildings. In Proceedings of the Ninth World Conference in Earthquake Engineering, Tokyo, Japan, 2–9 August 1988; Volume 5, pp. 111–116. [Google Scholar]
- Mosoarca, M.; Onescu, I.; Onescu, E.; Azap, B.; Chieffo, N.; Szitar-Sirbu, M. Seismic vulnerability assessment for the historical areas of the Timisoara city, Romania. Eng. Fail. Anal. 2019, 101, 86–112. [Google Scholar] [CrossRef]
- Mosoarca, M.; Onescu, I.; Onescu, E.; Anastasiadis, A. Seismic vulnerability assessment methodology for historic masonry buildings in the near-field areas. Eng. Fail. Anal. 2020, 115, 104662. [Google Scholar] [CrossRef]
- Cattari, S.; Lagomarsino, S.; Ottonelli, D. Fragility curves for masonry buildings from empirical and analytical models. In Proceedings of the 2nd Conference on Earthquake Engineering and Seismology, Istanbul, Turkey, 25–29 August 2014; pp. 25–29. [Google Scholar]
- Mouroux, P.; Le Brun, B. RISK-UE project: An advanced approach to earthquake risk scenarios with application to different european towns. In Assessing and Managing Earthquake Risk; Springer: Berlin/Heidelberg, Germany, 2008; pp. 479–508. [Google Scholar]


| Mechanical Properties | ||
|---|---|---|
| Average compressive strength | fm | 2.60 Nmm−2 |
| Average shear strength | fv0 | 0.13 Nmm−2 |
| Young modulus | E | 1500 Nmm−2 |
| Shear elasticity modulus | G | 600 Nmm−2 |
| Dead weight | W | 18 KNm−3 |
| ID | Source | Mw | L (km) | W (km) | edi (km) | Depth (km) | Strike (°) | Dip (°) | Rake (°) | Sre (°) |
|---|---|---|---|---|---|---|---|---|---|---|
| 1 | MIR | 6.0 | 22 | 12 | 1.90 | 8.9 | 95 | 60 | 90 | 69 |
| 2 | FE | 6.1 | 10 | 6.4 | 20.7 | 6.2 | 115 | 43 | 90 | 195 |
| 3 | VR | 6.7 | 30 | 14 | 43.8 | 7.5 | 248 | 40 | 90 | 74 |
| 4 | FR | 5.5 | 5.1 | 4.0 | 34.6 | 2.9 | 88 | 50 | 90 | 179 |
| DI | Damage Description | Damage Grade EMS-98 | |
|---|---|---|---|
| 0 < DI < 0.3 | Null | D0 | |
| 0.3 < DI < 0.6 | Slight | D1 | |
| 0.6 < DI < 0.8 | Moderate | D2 | |
| 0.8 < DI < 1.0 | Near-Collapse | D3 | |
| 1.0 < DI | Collapse | D4-D5 | |
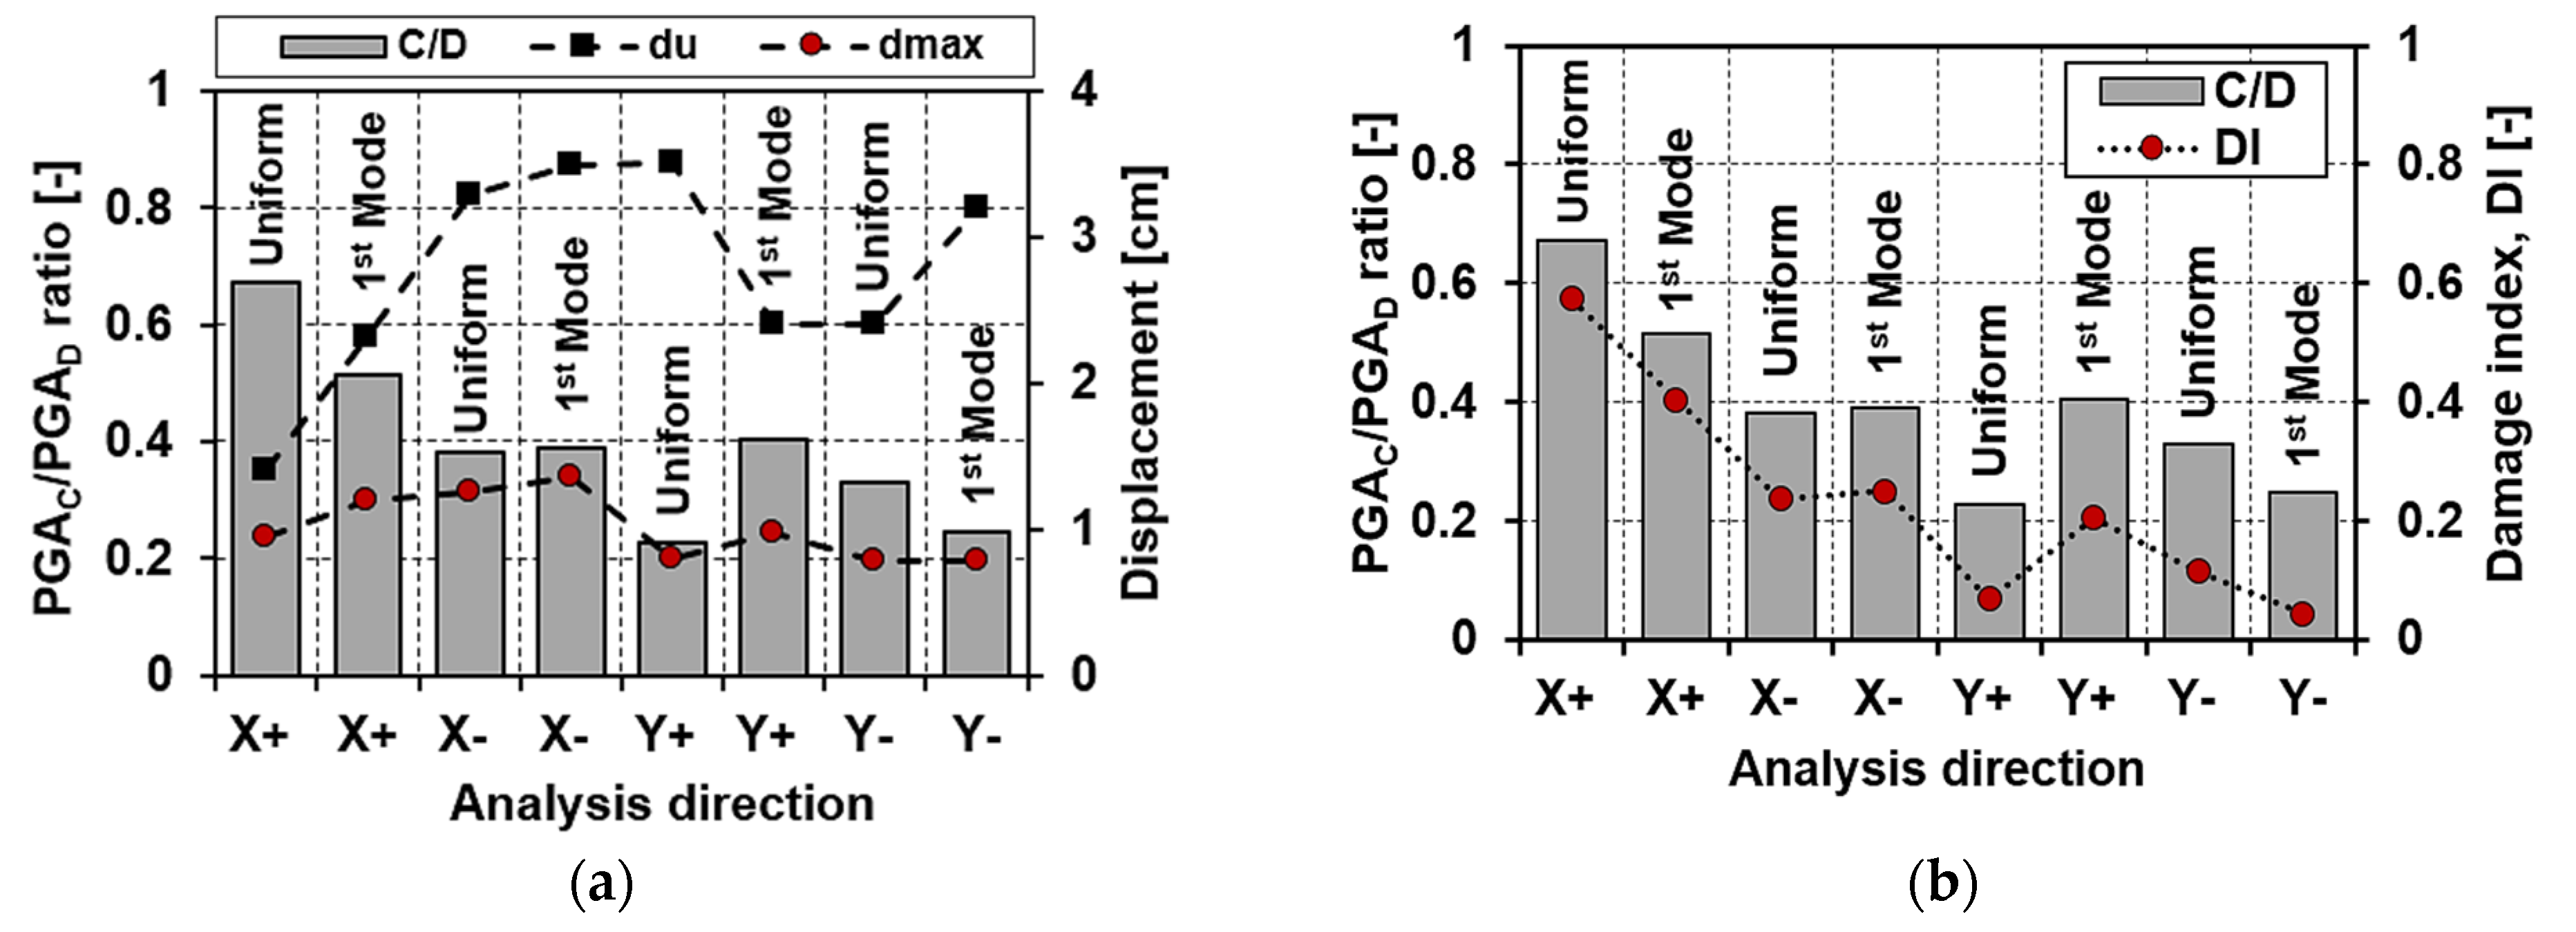
| Force Distribution | PGAC/PGAD | DI | EMS-98 |
| [-] | [-] | ||
| X+ (Uniform) | 0.7 | 0.6 | D2 |
| X- (1st Mode) | 0.5 | 0.4 | D1 |
| X- (Uniform) | 0.4 | 0.2 | D0 |
| X- (1st Mode) | 0.4 | 0.3 | D1 |
| Y+ (Uniform) | 0.2 | 0.1 | D0 |
| Y+ (1st Mode) | 0.4 | 0.2 | D0 |
| Y- (Uniform) | 0.3 | 0.1 | D0 |
| Y- (1st Mode) | 0.2 | 0.0 | D0 |
| Position | SUs ID | Dir. X | Dir. Y | ||||
|---|---|---|---|---|---|---|---|
| dy [cm] | du [cm] | Fmax [daN] | dy [cm] | du [cm] | Fmax [daN] | ||
| Corner | 1 | 0.2 | 0.9 | 49,120 | 0.1 | 0.2 | 80,529 |
| Intermediate | 2 | 0.3 | 1.7 | 39,175 | 0.2 | 0.2 | 60,121 |
| Intermediate | 3 | 0.2 | 1.3 | 27,625 | 0.2 | 0.2 | 51,357 |
| Intermediate | 4 | 0.3 | 1.8 | 38,578 | 0.4 | 0.5 | 88,310 |
| Intermediate | 5 | 0.2 | 1.7 | 56,030 | 0.3 | 0.4 | 190,361 |
| Intermediate | 6 | 0.2 | 1.3 | 48,122 | 0.3 | 0.4 | 219,884 |
| Intermediate | 6b | 0.1 | 1.3 | 16,133 | 0.1 | 0.3 | 14,598 |
| Head | 7 | 0.3 | 1.6 | 112,831 | 0.4 | 1.1 | 251,410 |
| Intermediate | 8 | 0.1 | 0.2 | 7694 | 0.1 | 0.2 | 22,418 |
| Intermediate | 9 | 0.1 | 0.2 | 6615 | 0.2 | 0.2 | 32,505 |
| Intermediate | 10 | 0.1 | 0.2 | 32,723 | 0.3 | 0.3 | 60,920 |
| Corner | 11 | 0.1 | 0.2 | 84,476 | 0.2 | 0.4 | 41,891 |
| Damage Levels DSi | ||
|---|---|---|
| D1 | 0.7·dy | Slight |
| D2 | 1.5·dy | Moderate |
| D3 | 0.5·(dy + du) | Near Collapse |
| D4-D5 | du | Collapse |
| Standard deviation β | ||
| 0.45·ln(µ) |
Publisher’s Note: MDPI stays neutral with regard to jurisdictional claims in published maps and institutional affiliations. |
© 2021 by the authors. Licensee MDPI, Basel, Switzerland. This article is an open access article distributed under the terms and conditions of the Creative Commons Attribution (CC BY) license (https://creativecommons.org/licenses/by/4.0/).
Share and Cite
Chieffo, N.; Fasan, M.; Romanelli, F.; Formisano, A.; Mochi, G. Physics-Based Ground Motion Simulations for the Prediction of the Seismic Vulnerability of Masonry Building Compounds in Mirandola (Italy). Buildings 2021, 11, 667. https://doi.org/10.3390/buildings11120667
Chieffo N, Fasan M, Romanelli F, Formisano A, Mochi G. Physics-Based Ground Motion Simulations for the Prediction of the Seismic Vulnerability of Masonry Building Compounds in Mirandola (Italy). Buildings. 2021; 11(12):667. https://doi.org/10.3390/buildings11120667
Chicago/Turabian StyleChieffo, Nicola, Marco Fasan, Fabio Romanelli, Antonio Formisano, and Giovanni Mochi. 2021. "Physics-Based Ground Motion Simulations for the Prediction of the Seismic Vulnerability of Masonry Building Compounds in Mirandola (Italy)" Buildings 11, no. 12: 667. https://doi.org/10.3390/buildings11120667