Article

The Journal Buildings: A Bibliometric Analysis (2011–2021)

1
Business School, Sichuan University, Chengdu 610064, China
2
Department of Construction Management and Real Estate, Vilnius Gediminas Technical University, Sauletekio al. 11, LT-10223 Vilnius, Lithuania
3
Institute of Sustainable Construction, Vilnius Gediminas Technical University, Sauletekio al. 11, LT-10223 Vilnius, Lithuania
*
Author to whom correspondence should be addressed.
Buildings 2022, 12(1), 37; https://doi.org/10.3390/buildings12010037
Submission received: 19 November 2021 / Revised: 22 December 2021 / Accepted: 26 December 2021 / Published: 2 January 2022
(This article belongs to the Special Issue Buildings: 10th Anniversary)

Abstract

:
The journal Buildings was launched in 2011 and is dedicated to promoting advancements in building science, building engineering and architecture. Motivated by its 10th anniversary in 2021, this study aims to develop a bibliometric analysis of the publications of the journal between April 2011 and October 2021. This work analyzes bibliometric performance indicators, such as publication and citation structures, the most cited articles and the leading authors, institutions and countries/regions. Science mappings based on indicators such as the most commonly used keywords, citation and co-citation, and collaboration are also developed for further analysis. In doing so, the work uses the Scopus database to collect data and Bibliometrix to conduct the research. The results show the strong growth of Buildings over time and that researchers from all over the world are attracted by the journal.

1. Introduction

Buildings is an international journal in the fields of building science, building engineering and architecture. Prof. Chimay J. Anumba, the founding editor, created the journal in 2011 [1]. Between 2011 and 2018, Buildings was published as a quarterly journal. In 2017, Prof. David Arditi became the editor-in-chief and in the next year, the journal increased the number of issues and began to publish every month. Today, the journal is well recognized in the scientific community. It is indexed in Scopus (Elsevier) and the Science Citation Index Expanded (SCIE) of Web of Science (Clarivate Analytics). According to the Journal Citation Reports (JCR) of the Web of Science, the journal’s 2020 impact factor was 2.648, ranking 32nd of 66 journals in the category of Construction & Building Technology and 61st of 136 in Engineering, Civil. This was the first time that Buildings received an impact factor.
Recently, Buildings is celebrating its 10th anniversary. Inspired by this event, the main aim of this paper is to provide a thorough bibliometric analysis of the journal from the last ten years. A bibliometric performance analysis of Buildings is carried out based on key factors, such as the publication and citation structures, the most cited papers, and the leading authors, institutions and countries/regions. To map the bibliographic data graphically, this work uses a wide range of indicators including bibliographic coupling [2], co-citation [3], co-occurrence of keywords and collaboration. To this end, this work uses the Scopus database and Bibliometrix [4] to collect and analyze the bibliographic material.
Note that in the literature, it has become the norm to develop bibliometric research since it provides scholars with realistic and objective statistics and analysis, enabling researchers to build a comprehensive knowledge and understanding of the research field. The different application fields of bibliometric analysis include civil engineering and management [5], automation in construction [6], energy [7], road and bridge engineering [8], transport [9], etc. Particularly, it is interesting to publish special issues or papers to celebrate the significant anniversary of a journal. A key example is that in 2015, Knowledge-Based Systems published a bibliometric analysis of its scientific content to celebrate its 25th birthday [10]. Many other journals have published special issues or papers to celebrate their anniversaries, such as International Journal of Systems Science [11] and Information Sciences [12].
This paper is organized as follows: Section 2 presents the bibliometric methods used in this paper. Section 3 provides the bibliometric performance analysis. The science mapping analysis of Buildings is carried out in Section 4. Finally, Section 5 gives a short description of the main findings and conclusions of the paper.

2. Bibliometric Methods

The term bibliometrics was first created by Paul Otlet [13] in 1934 and further defined by Broadus [14] as “the quantitative study of physical published units, or of bibliographic units, or of the surrogates for either”. Bibliometrics is valued as an important and useful approach to analyze academic research outputs and deal with overwhelming volumes of information [15]. Several decades ago, it was difficult for researchers to collect and classify complex bibliometric data due to the lack of efficient technology or software. However, thanks to the rapid development of science and technology, different bibliometric tools and software are available now to assist scholars in conducting their research [16].
In this paper, the bibliometric data come from Scopus, one of the world’s leading academic databases. Scopus covers more than 80 million documents and 17 million author profiles. The search covered the period from April 2011 to October 2021 using “Buildings” as the source title. Note that there was another journal with the same name between 1996 and 2002 and it is not included within the scope of this research. A total of 1466 articles shown as the results were considered (1542 articles have been published in Buildings so far, but the other 76 documents were omitted since they were not directly available in Scopus).
The authors used Bibliometrix to collect and analyze the dataset and develop the graphical visualization. This unique tool was developed in R language by Aria and Cuccurullo [
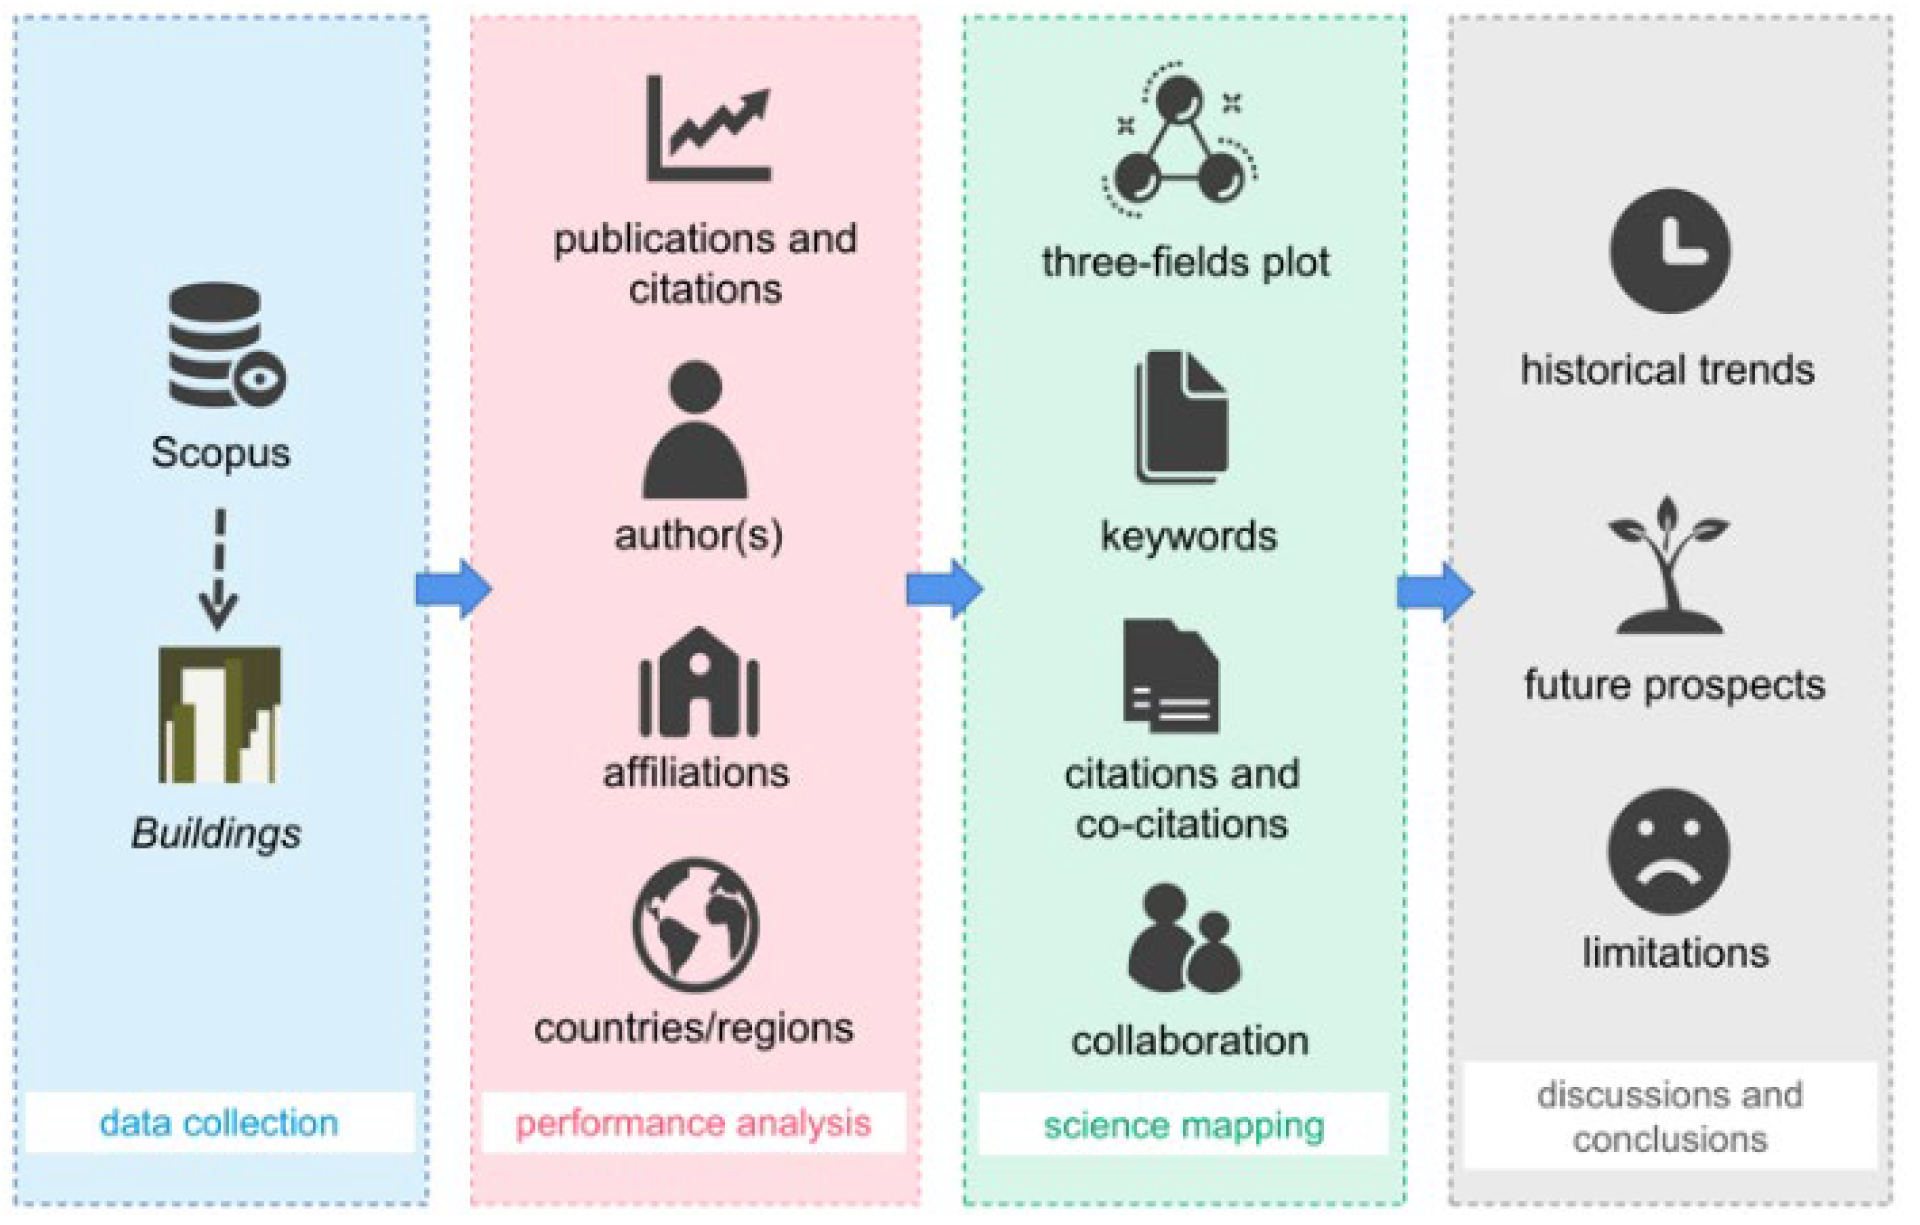
4] in 2017. To conduct this study using a bibliometric method, several bibliometric indicators from different perspectives were considered. As for bibliometric performance analysis, we analyzed the journal’s annual publications, citation structure and the most cited papers, as well as the leading authors, institutions and countries/regions. As for science mapping analysis in Section 4, we analyzed the keywords of the articles published in Buildings and describe studies based on citations, co-citations and collaborations. The whole process of bibliometric analysis of the journal is illustrated in Figure 1.

3. Bibliometric Performance Analysis of Buildings

In this section, several performance indicators including the publication and citation structure, the most cited papers and the leading authors, institutions and countries/regions are used.

3.1. Structure of Publications and Citations

Buildings published its first volume with one issue in 2011 and expanded to contain four issues in the next year. In 2018, the journal adopted a monthly publication schedule and since then it has published 12 issues per year. The distribution of publications and citations up to October 2021 is shown in Table 1. Additionally, several citation thresholds are included to provide a better overview.
Until 2016, the journal published a small number of papers per year. In 2017, more than twice as many articles as the previous year were published. This change reflects the growing popularity of Buildings in the scientific community. In 2020, the journal published its 1000th paper, which marked a new milestone. Between 2011 and 2016, the pattern of citations received per year was variable, reaching peaks of 1124 citations in 2015. Then, the number of citations remained around 1600 from 2017 to 2019 and decreased significantly after 2019. This phenomenon in the two last years (2020 and 2021) may be caused by the citation time-window [11], so citations may pick up in the following years. Note that 1.09% of papers receive more than 50 citations and 7.84% more than 20. A proportion of 38.06% of documents have more than five citations and 75.78% get at least one citation. It can be observed that once articles are a few years old, there are very few uncited articles in Buildings. This result shows that Buildings is a high-quality and widely recognized journal. Next, let us consider the most cited papers published in the journal. Note that research articles and review articles are divided and the results are summarized in Table 2 and Table 3, respectively.
Note that in the case of a tie in the number of citations, the youngest paper appears first. The most cited research article was published by Akadiri, P.O., Chinyio, E.A. and Olomolaiye, P.O. in 2012, with 181 citations. This paper proposed a framework based on the sustainable triple bottom line principle, including resource conservation, cost efficiency and design for human adaptation [17]. This paper is the only one that has received more than one hundred citations. Considering the indicator of citations per year, it can be found that Al-Kodmany, K. comes first. Prof. Al-Kodmany delivered a review on a vertical farm and analyzed its developments and implications for a vertical city [18]. Although this research was published only three years ago, it has received more than 70 citations, indicating the widespread interest in vertical farms.

3.2. Leading Authors, Institutions and Countries/Regions

This section reviews the most contributing authors, originating institutions and countries/regions based on published papers in Buildings.
First, the 20 most productive authors are shown in Table 4. To provide a better overview, several other bibliometric indicators including author Scopus ID, countries/regions, the number of citations and the cites per paper ratio are also considered. The table ranks the data based on the number of publications and, in the case of a tie, according to the number of citations. We can highlight that Dr. Sepasgozar, Prof. Al-Kodmany, Prof. Bedon and Dr. Zhang are the most productive authors in the journal. Dr. Sepasgozar published 14 scholarly papers in Buildings concerning digital technology applications, such as three-dimensional printing [19], digital twin [20] and additive manufacturing applications [21]. Prof. Al-Kodmany conducted research mainly on the sustainability of tall buildings [22,23,24], vertical farms [18] and vertical cities [25]. Note that Prof. Al-Kodmany and Bedon were the winners of the “Buildings 2018 Best Paper Awards” and “Buildings 2020 Young Investigator Awards”, respectively. As Prof. Bedon and Dr. Zhang have only started publishing papers in Buildings in recent years, their citations are relatively low compared to other leading authors.
Another interesting issue to analyze is the most productive affiliations of the journal. For this purpose, Table 5 presents the 20 most productive affiliations. As in the previous table, other indicators are also included to provide a better overview. The University of New South Wales clearly obtains the first position with 46 articles, followed by the University of Naples Federico II and the Norwegian University of Science and Technology. It is interesting to note that even though the University of Naples Federico II has published only about half as many articles as the University of New South Wales, it has a higher citation rate. Furthermore, the University of Naples Federico II and Norwegian University of Science and Technology have published almost the same number of papers, but the former has the leading number of citations.
Finally, the most productive countries/regions are shown as follows in Table 6 and Figure 2. Globally, Italy dominates the list with nearly twice the number of papers than the USA, which is in second place. Australia comes in third, with 105 total papers. Note that in Table 2 and Table 3, the majority of productive authors and institutions are from Italy and Australia, so there is no doubt that these countries rank high. Furthermore, Italy is the only country that has published more than 200 papers and has more than 2000 citations. From the indicator of MCP/MRP, we can conclude that countries such as Italy, Australia and United Kingdom have a strong willingness to cooperate with other countries/regions.

4. Science Mapping Analysis of Buildings

This section developed a science mapping based on key factors including keywords, citation/co-citation and collaboration.

4.1. Analysis of Keywords

To begin with, we analyzed the author keywords occurring in the journal and their frequency, thematic map, growths, trends, and thematic evolution. Note that author keywords sum up the issues involved in an article and author preferences [26].
Figure 3 depicts a word cloud to show the 50 most frequent author keywords in papers in Buildings. The size of words demonstrates the word’s frequency of occurrence. It is not surprising to find that the keyword “sustainability” is in the center of the graph, followed by “energy efficiency” and “thermal comfort”. “Buildings”, “bim” (Building Information Modeling) and “construction” also show their importance. “Climate change” has been a hot topic in recent years, especially in fields such as architecture and the environment. Other building performance parameters, such as “durability” and “natural ventilation”, are also commonly utilized.
Then, to get further understanding, Figure 4 depicts a thematic map of author keywords. A thematic map allows the visualization of four different typologies of themes based on two dimensions, i.e., density and centrality. Density is the strength of internal ties among all the keywords that are used to describe the research theme, while centrality is the strength of external ties to other themes by exploiting the authors’ keyword field [27]. The upper-right quadrant called motor themes has clusters that are vital and well-developed in Buildings. In this quadrant, Cluster 1 includes “lean construction”, “refurbishment”, “embodied energy”, “project management” and “case study”. The position of Cluster 1 indicates its highest density among these keywords and its above-average importance. The upper-left quadrant called niche themes has clusters that are well-developed but not vital for the domain. From this quadrant, Cluster 1 includes “reinforced concrete”, “cultural heritage”, “pushover analysis”, “seismic assessment” and “masonry”, while Cluster 2 includes “durability”, “concrete”, “building envelope”, “compressive strength” and “fly ash”, and the third one includes “facility management” and “machine learning”. Due to the close position of Cluster 1 and Cluster 2, we can argue that both of them are well developed but not the most vital for the domain. It is evident that Cluster 3 indicates its lowest importance in this map. The lower-left quadrant called emerging or declining themes has clusters with lower centrality as well as density in Buildings. The only cluster in this quadrant includes “optimization”, “residential buildings”, “energy performance” and “genetic algorithm”. Finally, the lower-right quadrant called basic themes has clusters that are crucial for the domain but not well-developed or clusters that are cornerstones of the domain. In this quadrant, Cluster 1 includes “buildings”, “climate change”, “energy”, “comfort” and “energy saving” and the second one includes “building information modeling”, “construction”, “productivity” and “retrofitting”. It is obvious that some of them are basic concepts, such as “buildings”, “construction” and so on. Some others, such as “climate change” and “energy saving”, are important and need more attention.
Another interesting issue to consider is the annual growth of the top 10 keywords. Figure 5 demonstrates the evolution clearly from 2011 to 2021. On the whole, every keyword increased yearly, and this phenomenon also shows the sustained and steady development of Buildings. From the details, it is striking that “energy efficiency”, “thermal comfort” and “sustainability” have remained the top three occurrences in the past decade. “Buildings”, with a sharp increase in the curve, has emerged as the fourth most common occurrence since 2016. “BIM” has maintained a high growth rate since 2018; it emerged as the sixth most common keyword in 2021 while its occurrence was very low before 2018. Although “durability” consistently had the fewest occurrences, it has seen a significant increase after 2019, and we can assume that it will continue to grow in the future.
A further interesting issue is to analyze the trending topics in Buildings. Figure 6 depicts the top topics based on the keyword occurrences that have been continuously studied since 2011. As noted, on the right side of the figure, the topic frequency from 10 to 50 is demonstrated by the blue-filled circle, and the larger the circle, the higher the frequency. The topic “energy” was the only popular topic in the early years of Buildings. Then, in 2016 and 2017, some other topics such as “climate change”, “simulation” and “energy efficiency” began to receive scholars’ attention in Buildings. In 2016, “simulation” attracted more attention than “energy”. Next, in 2017, “optimization”, “sustainability” and “buildings” appeared in the trending topics list and continued to maintain scholars’ attention. It is noticeable that “sustainability” and “construction” became the most two significant topics in 2019 and surpassed “energy efficiency” and “thermal comfort”, which were most popular in 2018. However, from 2020 to 2021, “concrete”, “cultural heritage”, “durability” and “construction industry” have been focal points. Moreover, we can predict that these newly popular topics will continue to receive more attention in Buildings.
Last but not least, in order to analyze the thematic evolution of the journal, we developed a Sankey diagram, shown in Figure 7. A Sankey diagram is used to show how different themes are connected and have developed in the past [28]. Each box in the map denotes a theme, and the size of boxes is proportional to the frequency of the theme’s occurrences [29]. The flows connect each box showing the evolution traces of the theme, and the thicker the connecting line, the higher the linkage of the two themes.
From an overall perspective, it can be found that as time goes by, themes in Buildings are becoming increasingly diverse, probably because more and more scholars from different fields are attracted to the journal. It is noticeable that “energy efficiency” first appeared in 2011–2014, was further developed in the following four years, and continued to draw attention in the final time zone 2019–2021. Furthermore, this topic was the most popular one between 2015 and 2018. Some objective indicators, such as “optimization”, “sustainability” and “thermal comfort”, have only started to flourish in recent years. This result reflects the state-of-the-art of the journal.

4.2. Analysis of Three-Fields Plot

The three-fields plot embedded in the Bibliometrix tool allows us to understand the complete bibliometric research in one figure and exhibit proportionality among the content [27]. Figure 8 shows the most active 15 countries/regions in Buildings in the left field, keywords that these countries/regions are using in the middle field, and the main journal sources in the right field. From the middle field, we find that the scholars in Buildings focus more on “energy efficiency”, “thermal comfort”, “sustainability”, “buildings” and “construction”. This field reveals hot topics that scholars should pay closer attention to. These results are the same as in Figure 3. Note that “energy efficiency” and “thermal comfort” are prevalent in Energy and Buildings, whereas “thermal comfort” is more prevalent in Build and Environment. Furthermore, it is obvious from the right field that Energy and Buildings and Building and Environment are playing the most significant roles as major sources in Buildings. From the left field, it is noticed that the United Kingdom, Italy, the USA and Australia have the largest number of publications in Buildings and cover most research areas, and this result is consistent with our previous analyses.

4.3. Analysis of Citations and Co-Citations

We next created a historiograph of Buildings. Figure 9 shows the chronological map based on the most relevant citations. Each flow in the same color identifies a direct citation and signifies a concept and its historical development. The nodes in the flows are core documents with high citations (both local citations and global citations are taken into account). The largest citation stream is in blue, starting with the research of Vinokurov, M. in 2018 [30] and 2019 [31]. This path provides several new insights on the efficiency, economy and climate implications of the energy solutions. Note that as the most cited author in this figure, Fargnoli, M. is also marked in blue. He proposed two novel methods based on Preliminary Human Safety Assessment (PHSA) [32] and BIM [33] in order to enhance occupational safety in the construction industry. The second largest citation stream is in red, starting in 2019 and further developing in 2021. These papers in red provide insights into and analysis of seismic vulnerability [34], seismic assessment [35] and nonlinear static procedures [36]. Other citation streams all contain only a few nodes. From the diversity of colors in this map, we can conclude that Buildings covers a wide range of research topics and applications.
Then, we looked into the co-citations of journals regarding documents published in Buildings. A co-citation of journals occurs when two documents from different journals receive a citation from the same third document [3]. Fifty journals are shown in Figure 10. The colored circles and lines represent the journals and their co-linkages with other journals, respectively. At the same time, the size of the circle represents the citation weight [37]. We can intuitively see that this map is divided into three clusters with different colors. It is obvious that the three biggest circles in this colorful map are Energy and Buildings in green, Building and Environment in green and Buildings in blue. Therefore, these three journals have the largest number of citations and the broadest network. The blue Buildings circle links with journals such as Sustainability and Automation in Construction, and they form a blue cluster together. As for the green cluster, Energy and Buildings has co-citations with Automation in Construction, Energies and other green circles. Similarly, the formation of the red cluster is based on the same theory. However, the red cluster has fewer citations and linkages than the other two clusters.

4.4. Analysis of Collaboration

Figure 11 depicts the collaboration network of institutions in Buildings. The colored circles and lines represent the institutions and their collaborations with other institutions, respectively. This map is divided into seven clusters with different colors. By querying the countries or regions where these institutions belong, it is not difficult to find that almost all the institutions in the same cluster come from the same country or region. For instance, Moscow Automobile and Road Construction University, Far Eastern Federal University, Belgorod State Technological University and Peter the Great Saint-Petersburg Polytechnic University are all located in Russia. Similarly, the institutions in the red cluster come from Australia, the pink from France, the yellow from Canada and the blue from Italy. However, the green cluster contains the University of New South Wales from Australia and Universidade Federal do Rio de Janeiro from Brazil, and the brown cluster contains the Central University of Technology from South Africa and Leeds Beckett University from the United Kingdom.
Buildings has a massive international collaboration, which contributes to the global academic exchange. The international collaboration network identifies how countries and regions are related in the journal. Figure 12 shows results at the geographic level, and Figure 13 shows these in detail. In Figure 12, the shade of countries/regions and the thickness of lines represents the number and the proportion of their collaborations, respectively. Not surprisingly, the most active area is the European sector. We can observe that China and Australia demonstrate the strongest cooperative tie with each other. In Figure 13, the size of countries/regions represents the number of their collaborations, and the larger the circle, the more cooperative partners they have. The thickness of lines indicates the closeness of the collaboration of countries/regions. Italy has the widest range of cooperative partners, followed by the United Kingdom, Australia, the USA and China. These five countries are high-yield countries. Furthermore, it can be observed that China, the USA and Australia have a strong connection with each other, and their willingness to cooperate with each other is evident.

5. Discussions and Conclusions

Buildings was first published 10 years ago in 2011. Motivated by its 10th anniversary, this study presents a bibliometric analysis of publications in the journal between 2011 and 2021. This work adopts two bibliometric methods: performance analysis and science mapping [38].
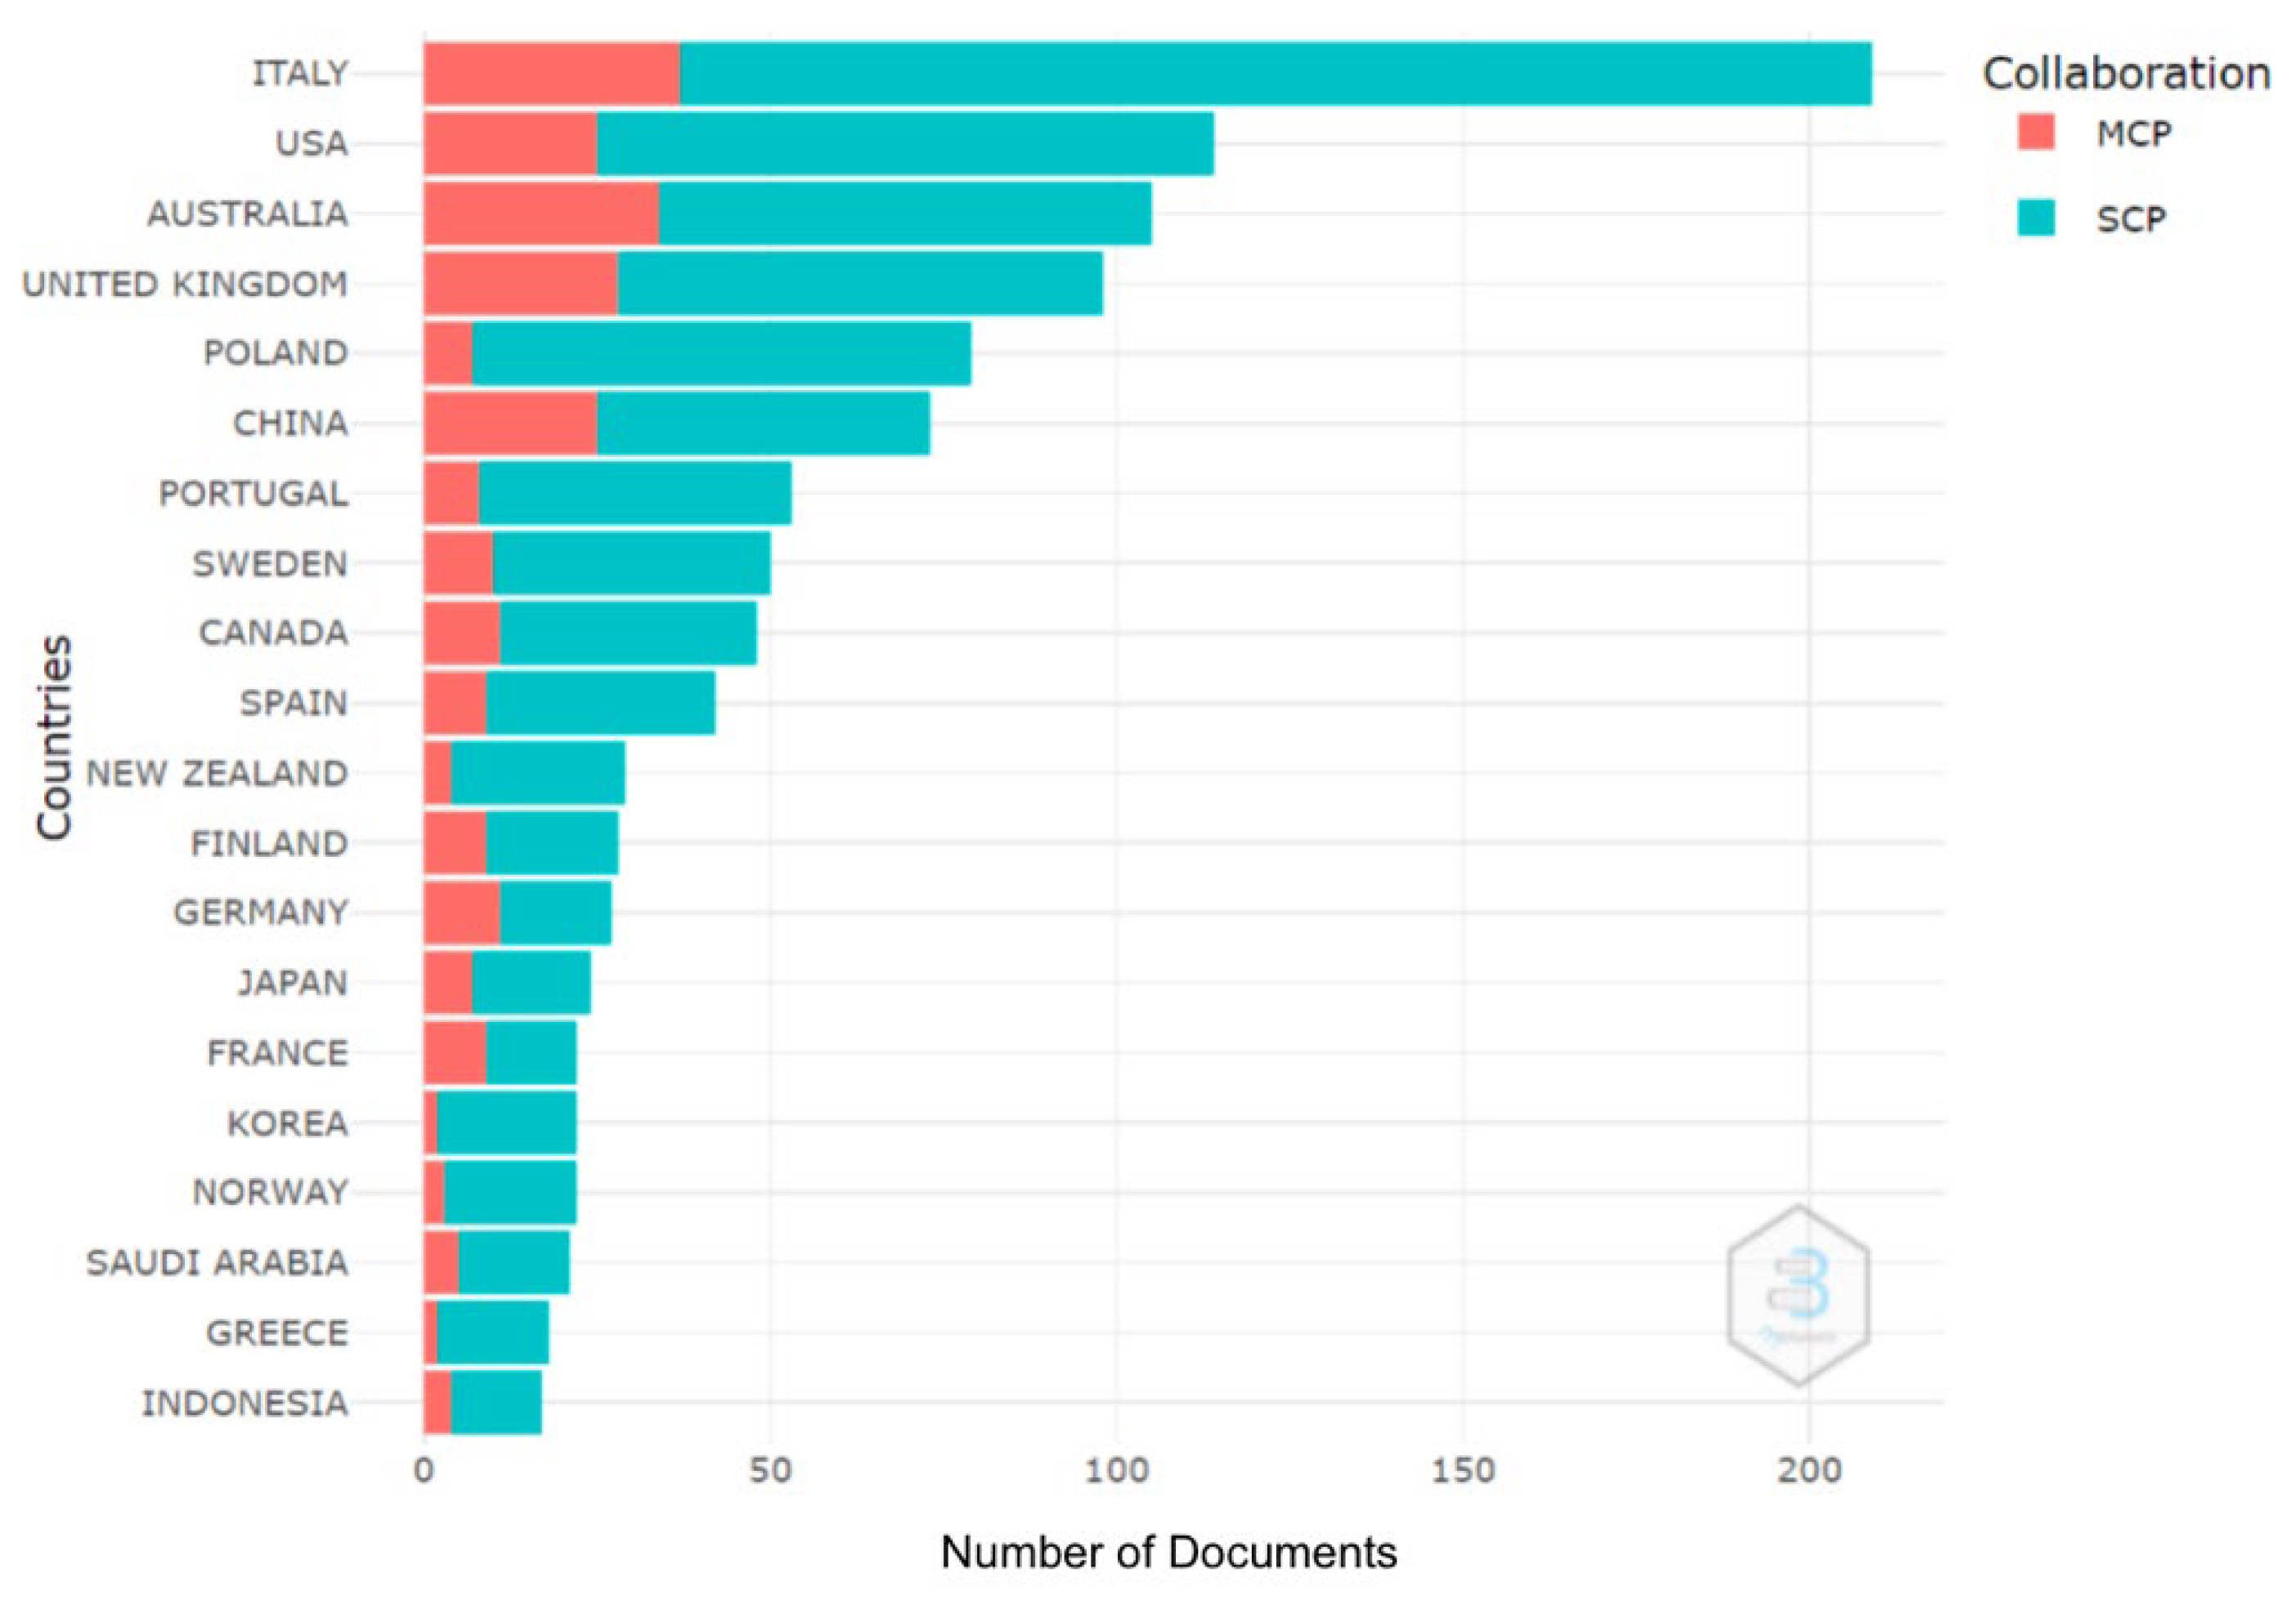
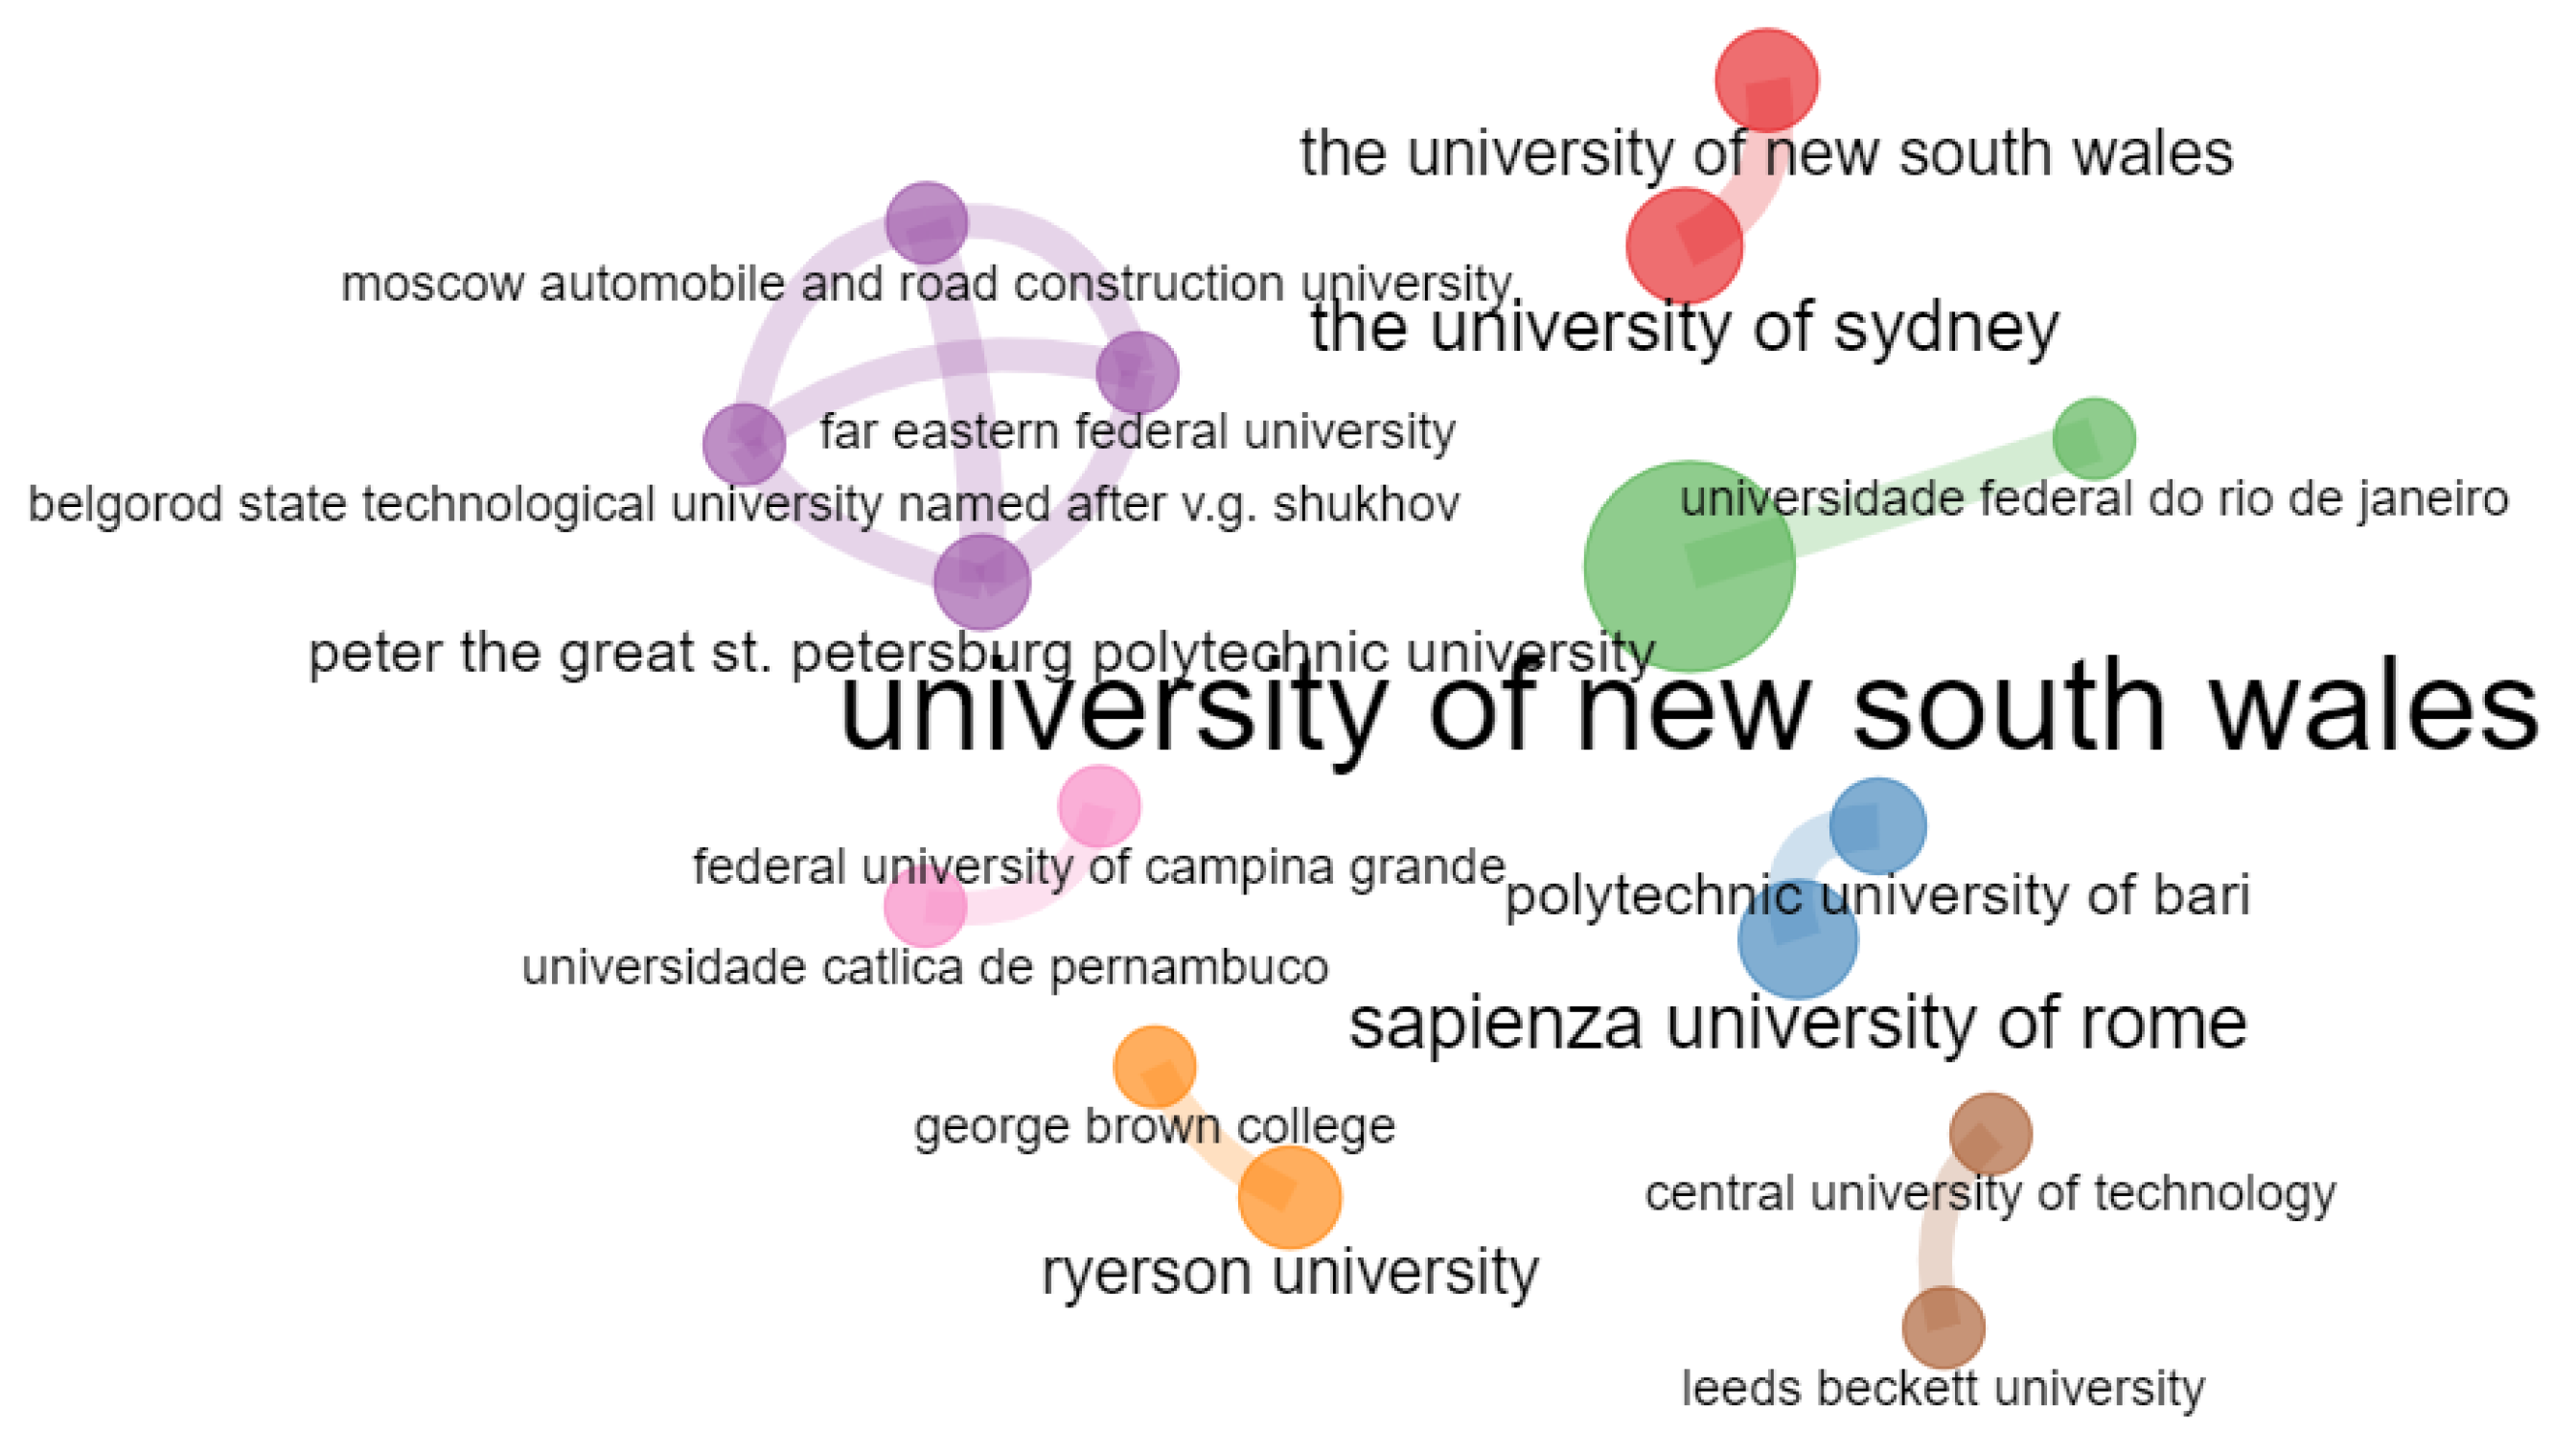
Regarding performance analysis, the research first identified the publication and citation structure of the journal. The results show the strong growth of Buildings throughout time. Up to now, the journal has published more than one thousand documents and is widely acknowledged by scholars all over the world. The most cited paper, entitled “Design of A Sustainable Building: A Conceptual Framework for Implementing Sustainability in the Building Sector”, was written by Akadiri, P.O., Chinyio, E.A. and Olomolaiye, P.O. in 2012. Then, this work reviewed the leading authors, institutions and countries/regions. The results indicate that Italy is the most productive country in Buildings, well above the results of the USA, which appears at the second position. The University of New South Wales, located in Australia, has been the most productive affiliation over the past 10 years with 46 publications and 345 citations in total. Looking at the most cited authors, we recognize the contributions of Sepasgozar, S.M.E. from Australia, Al-Kodmany, K. from the USA, Bedon, C. from Italy and Zhang, X. from Sweden. In this sense, it is clear that the journal is becoming very popular worldwide.
In order to delve deeper into the results, this work used science mapping in 
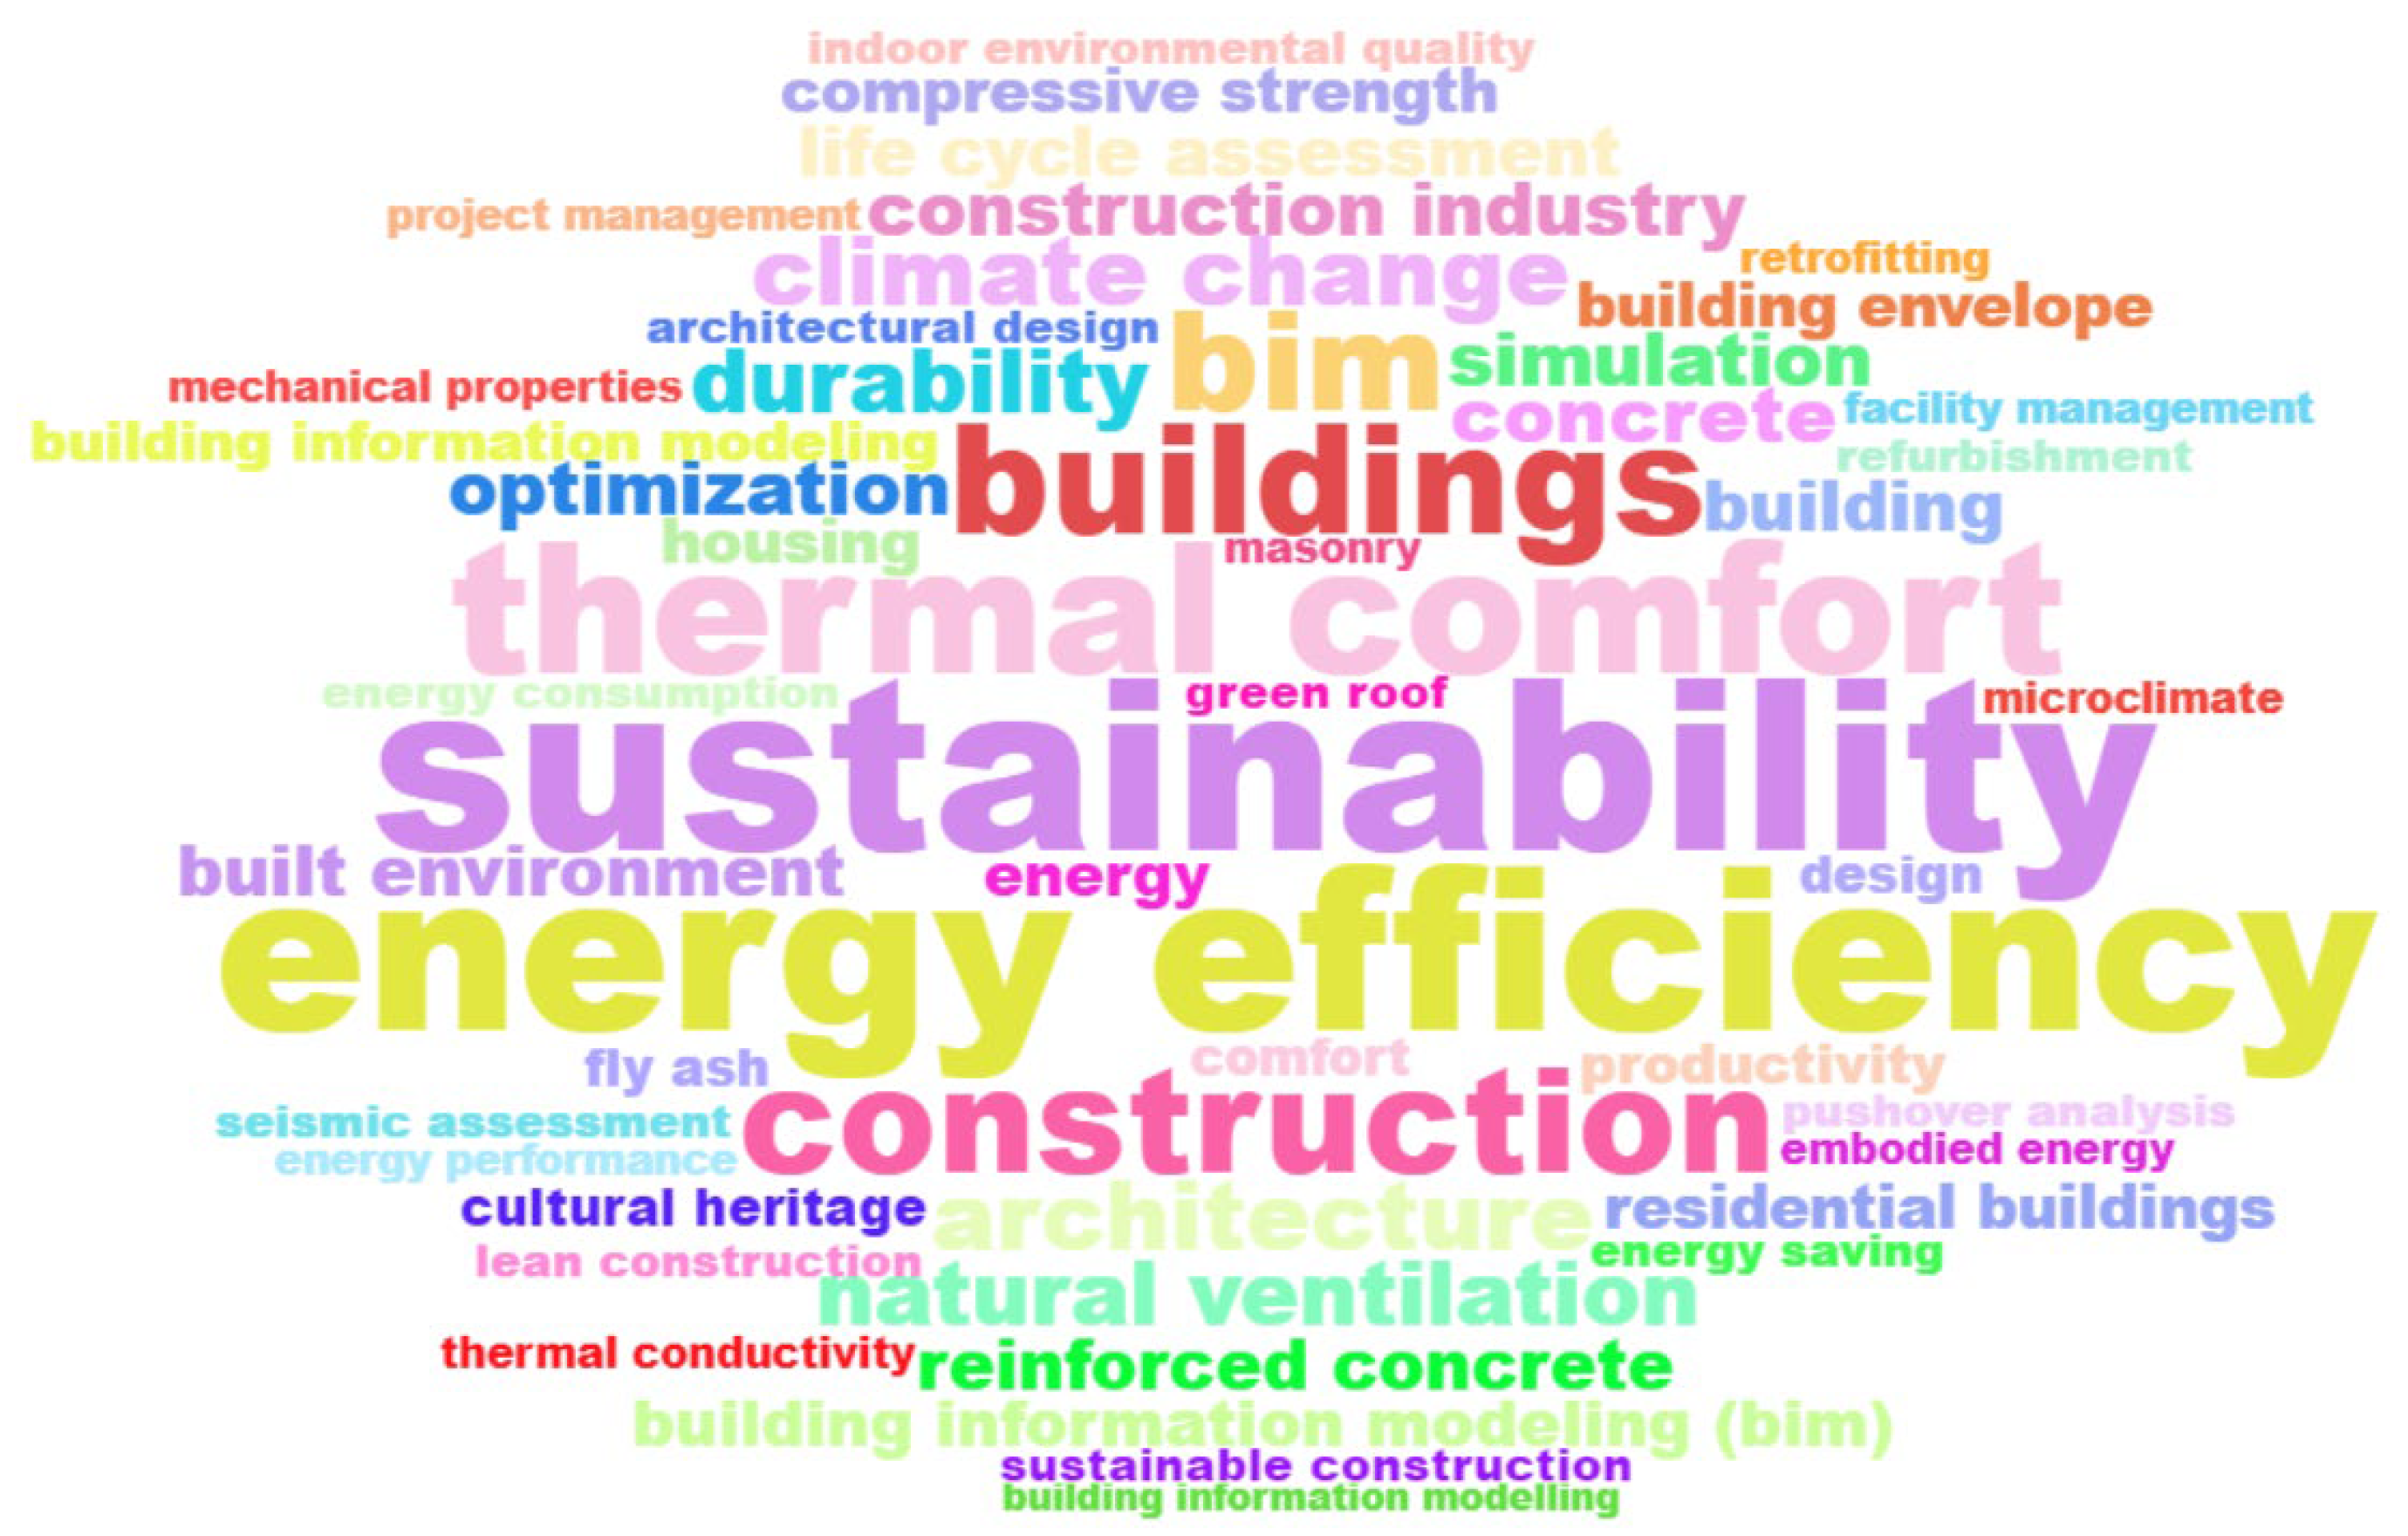
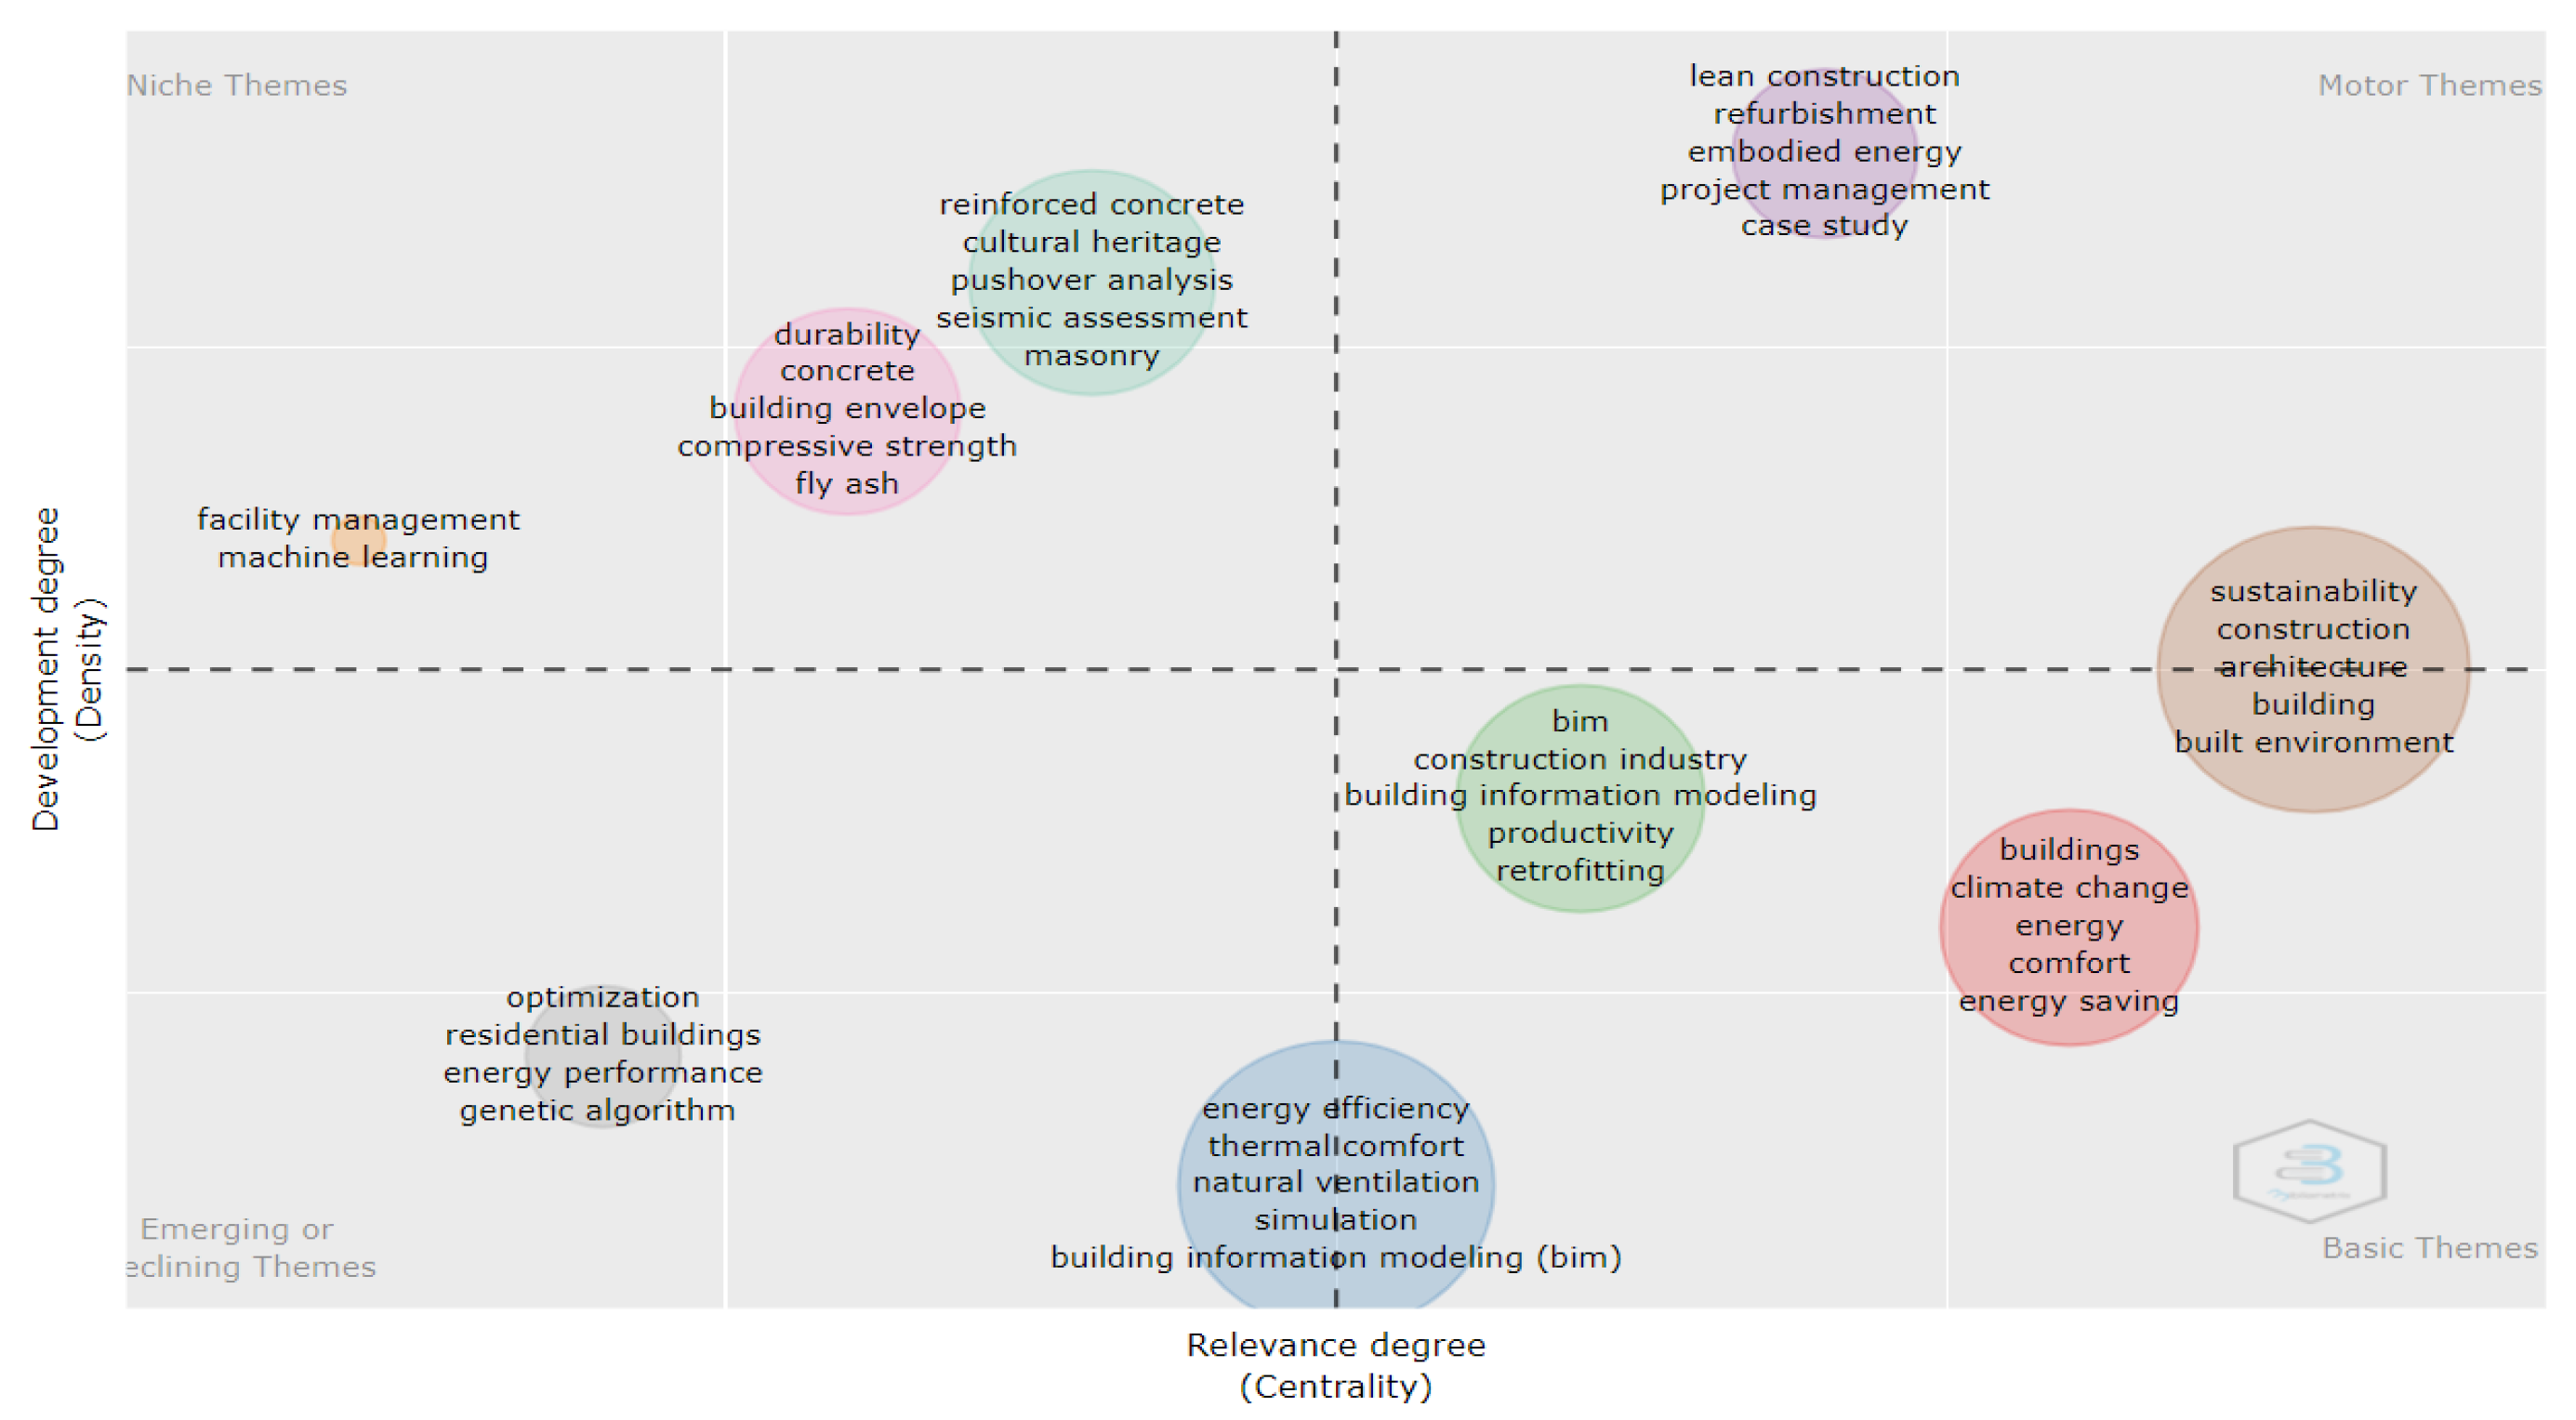
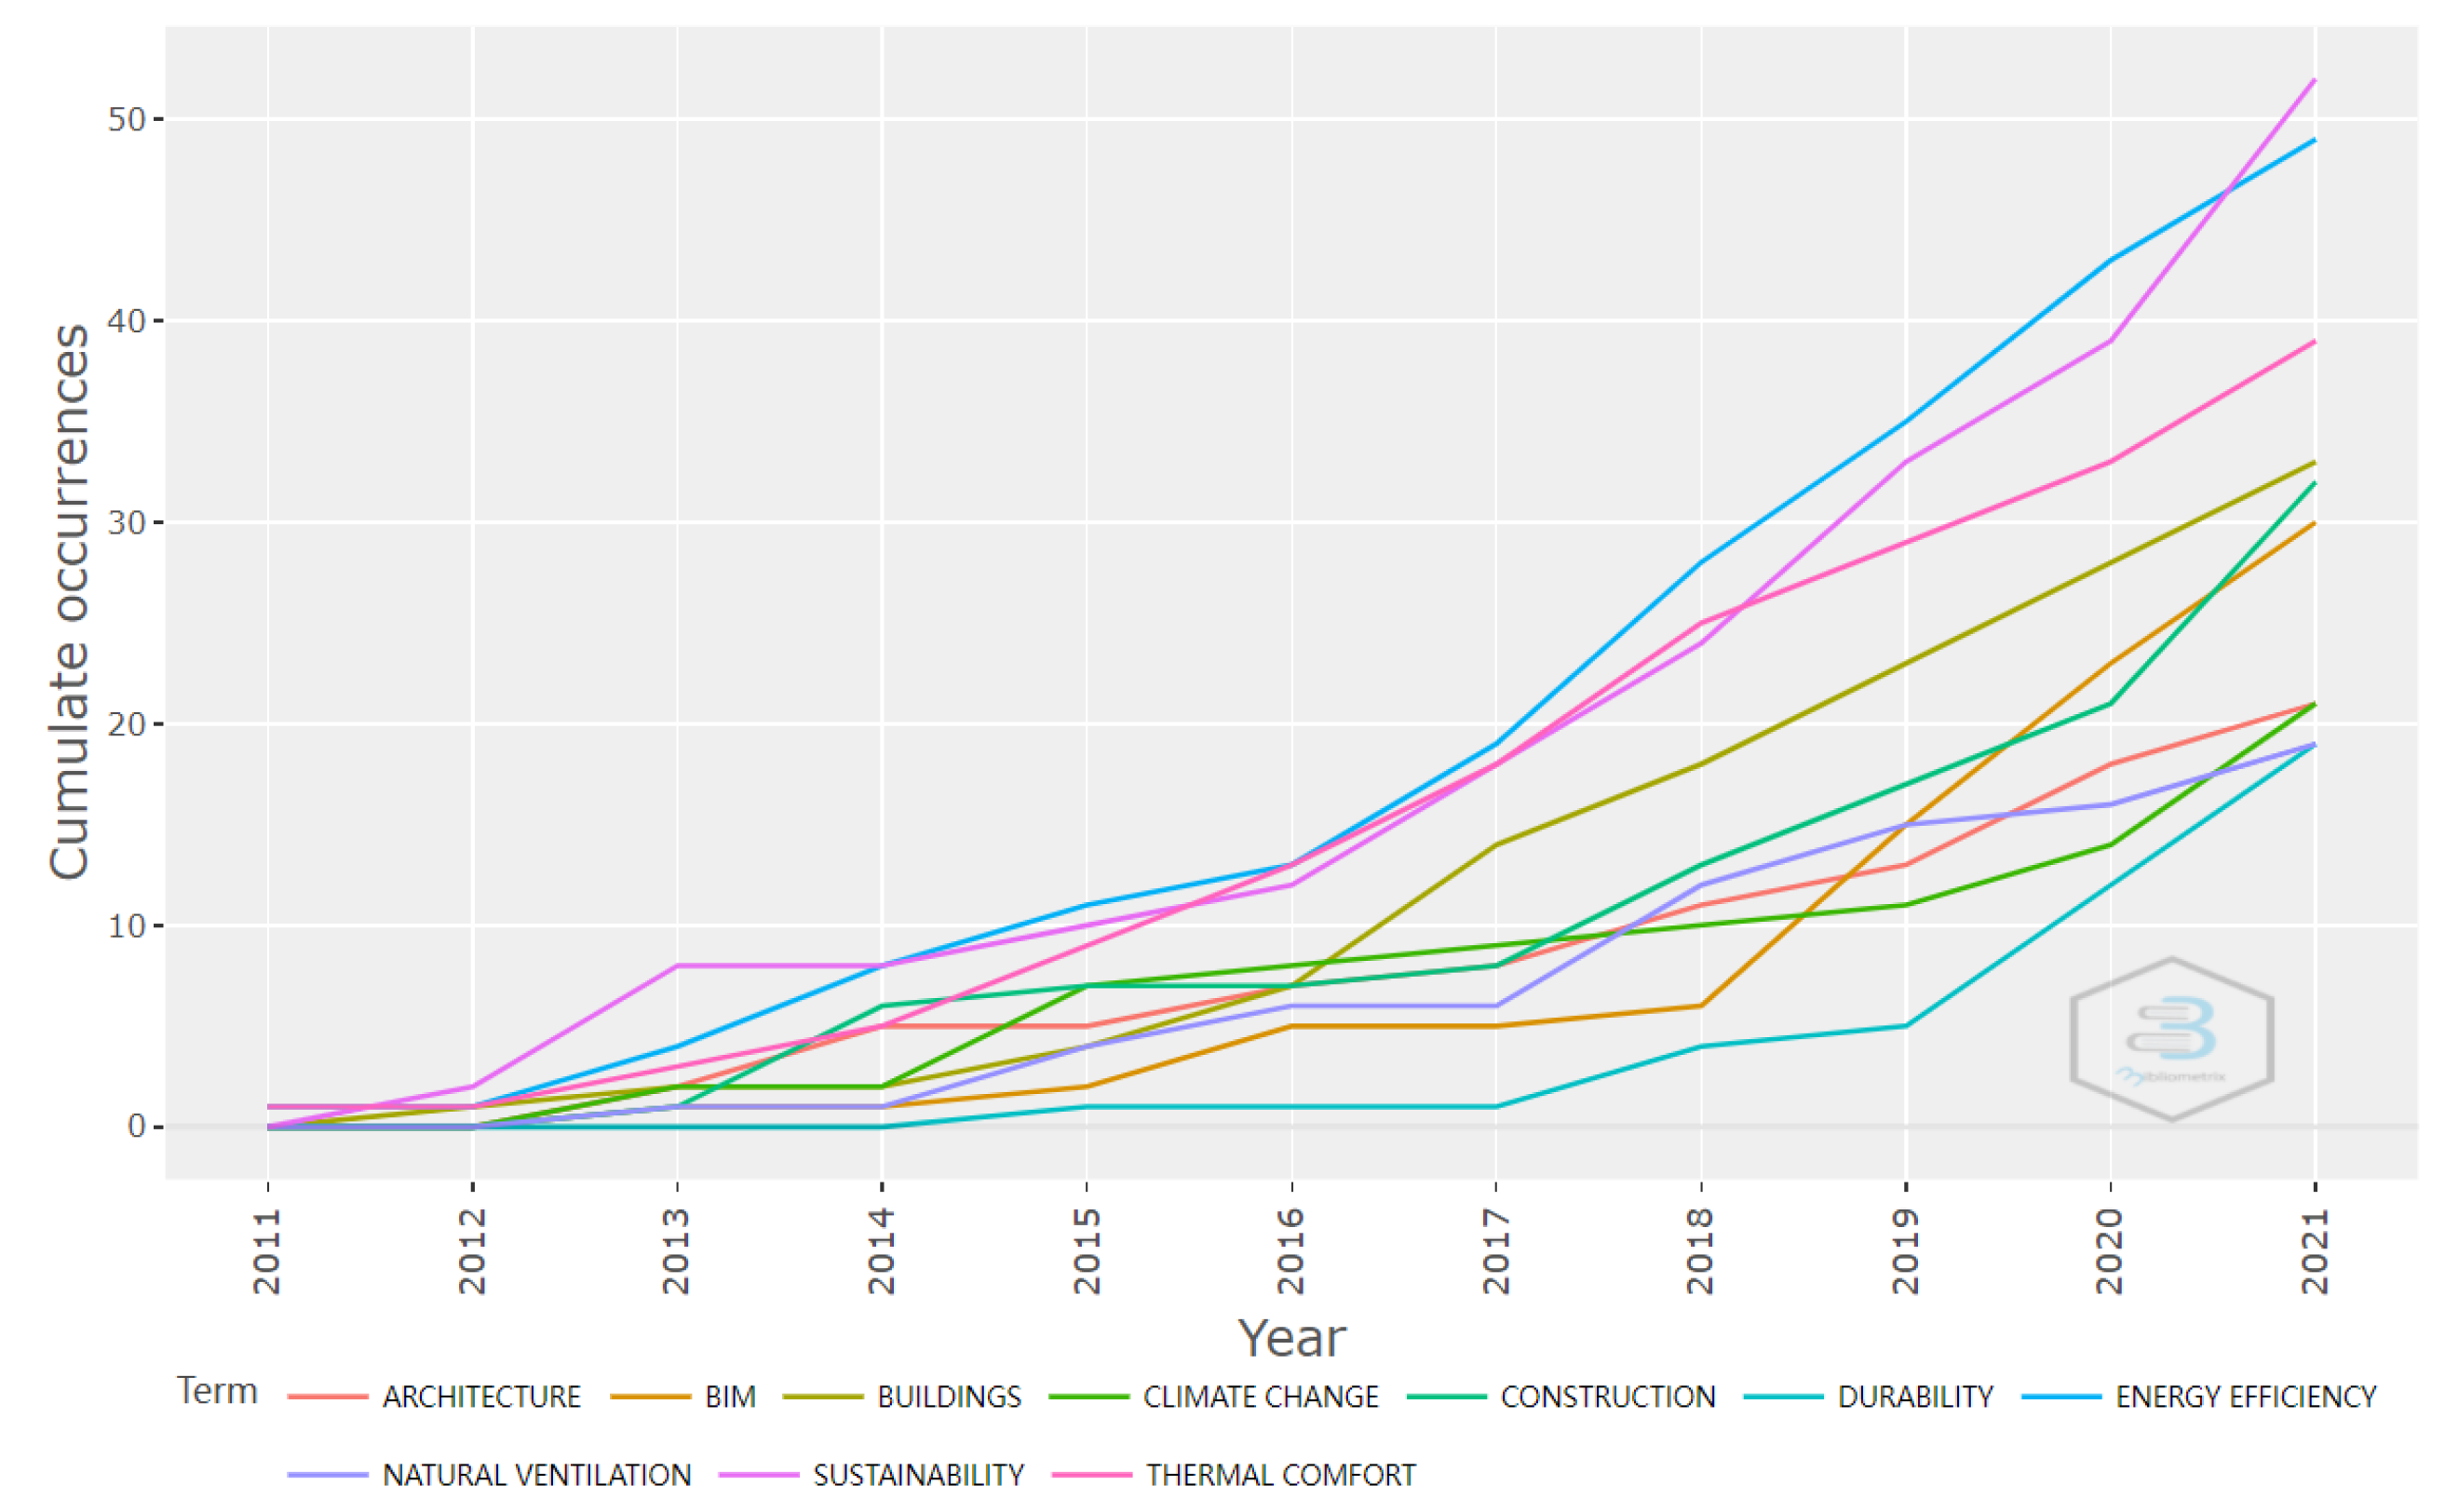
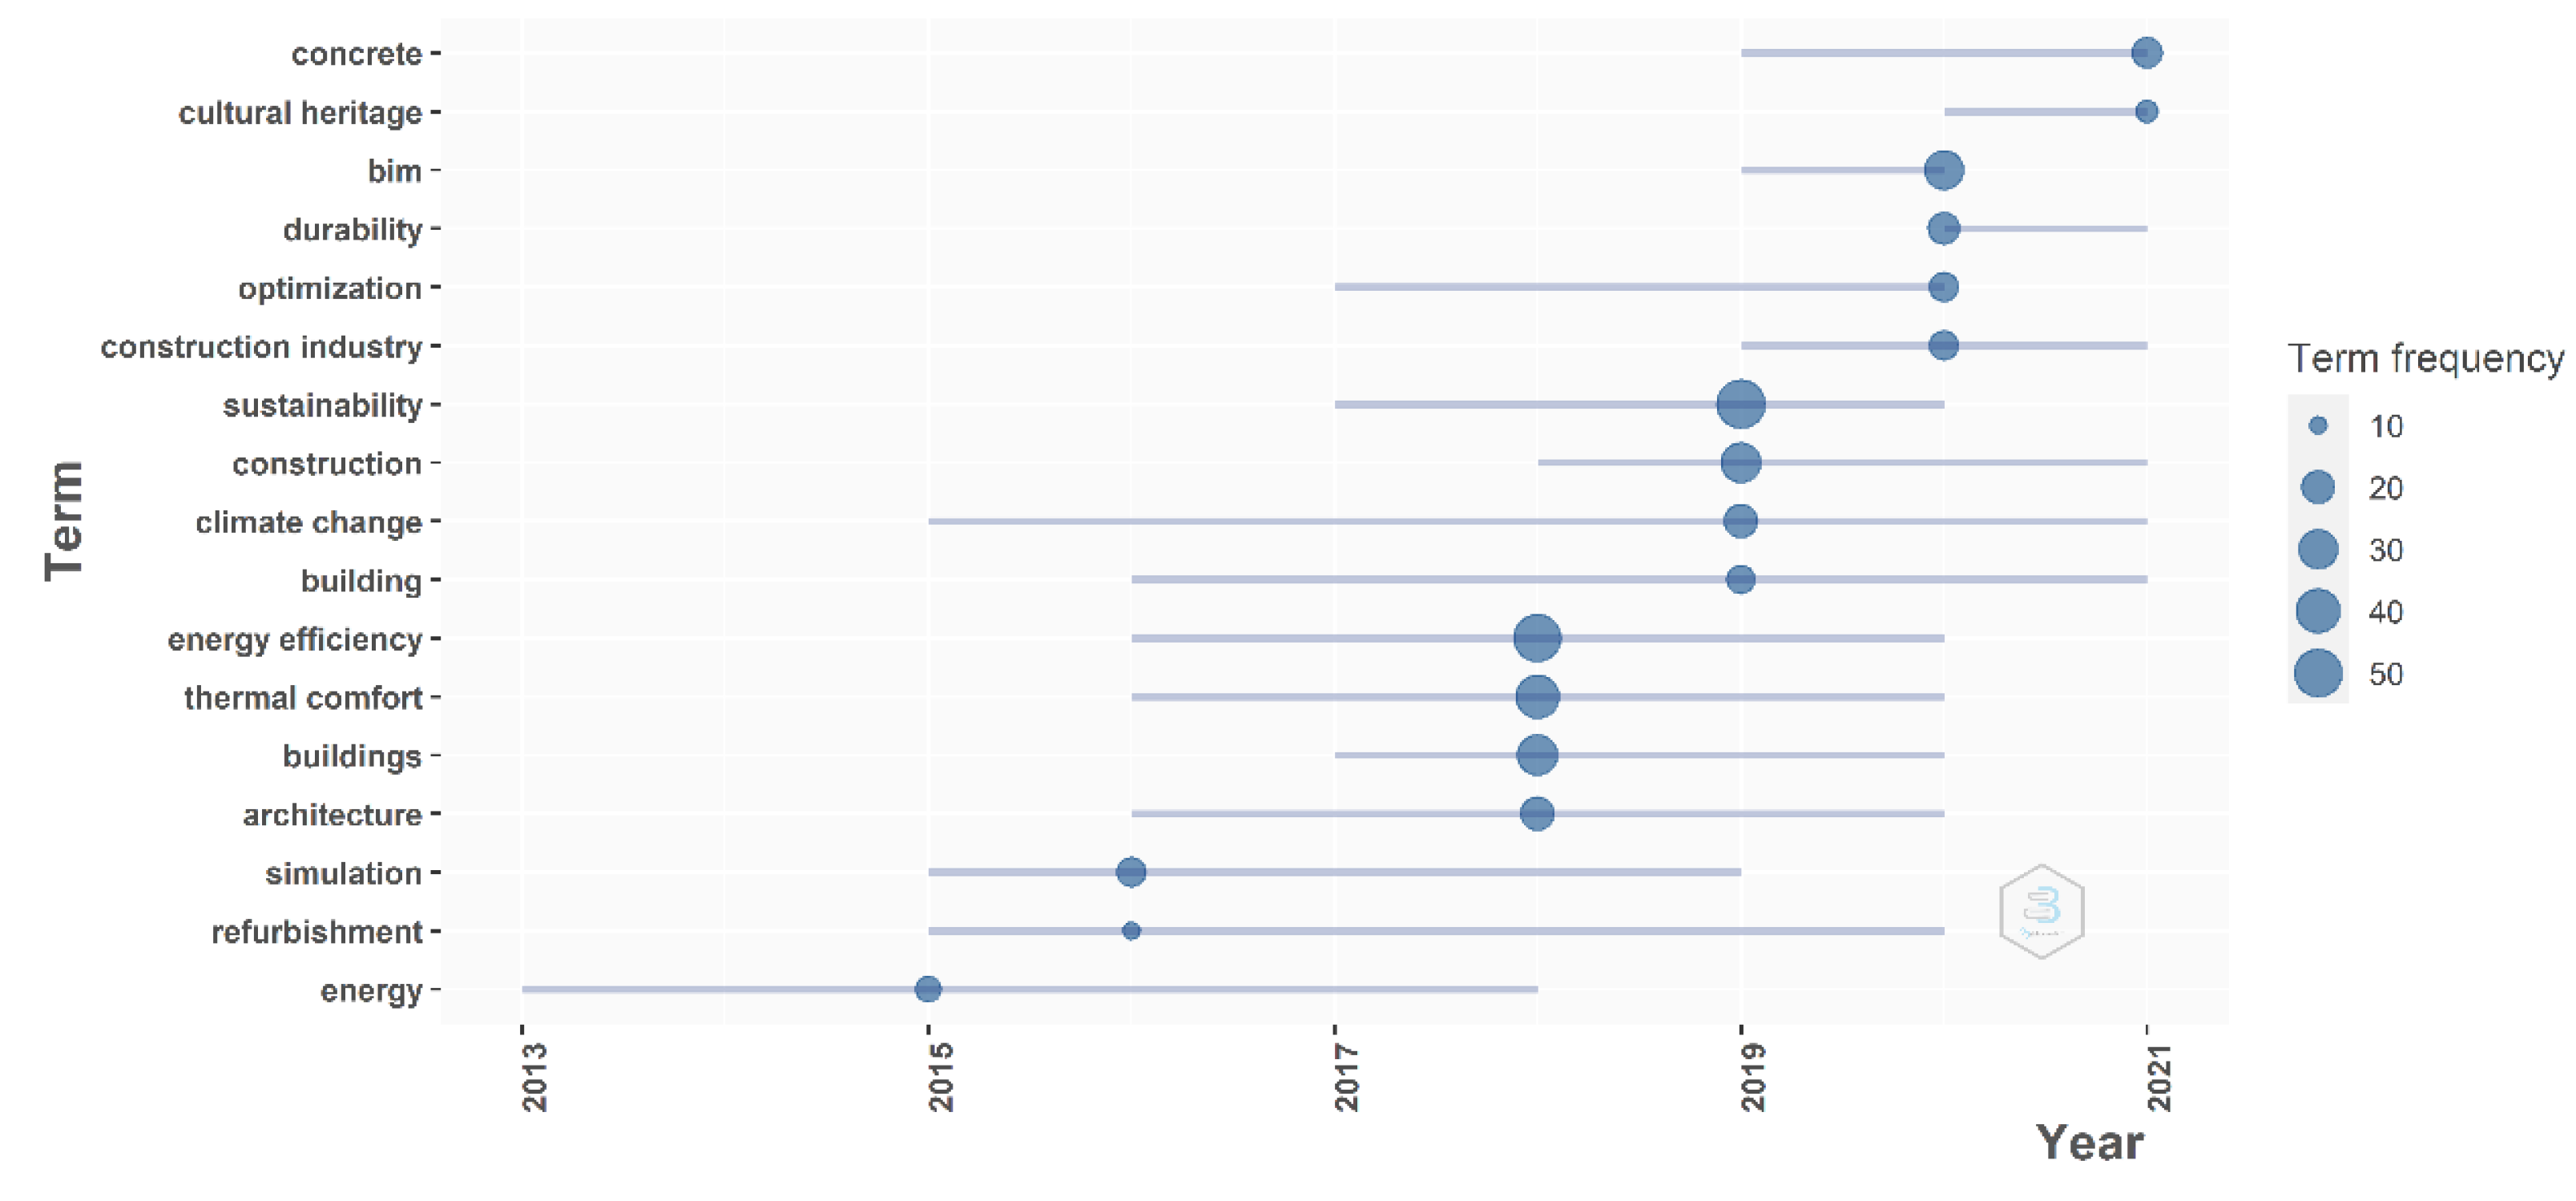
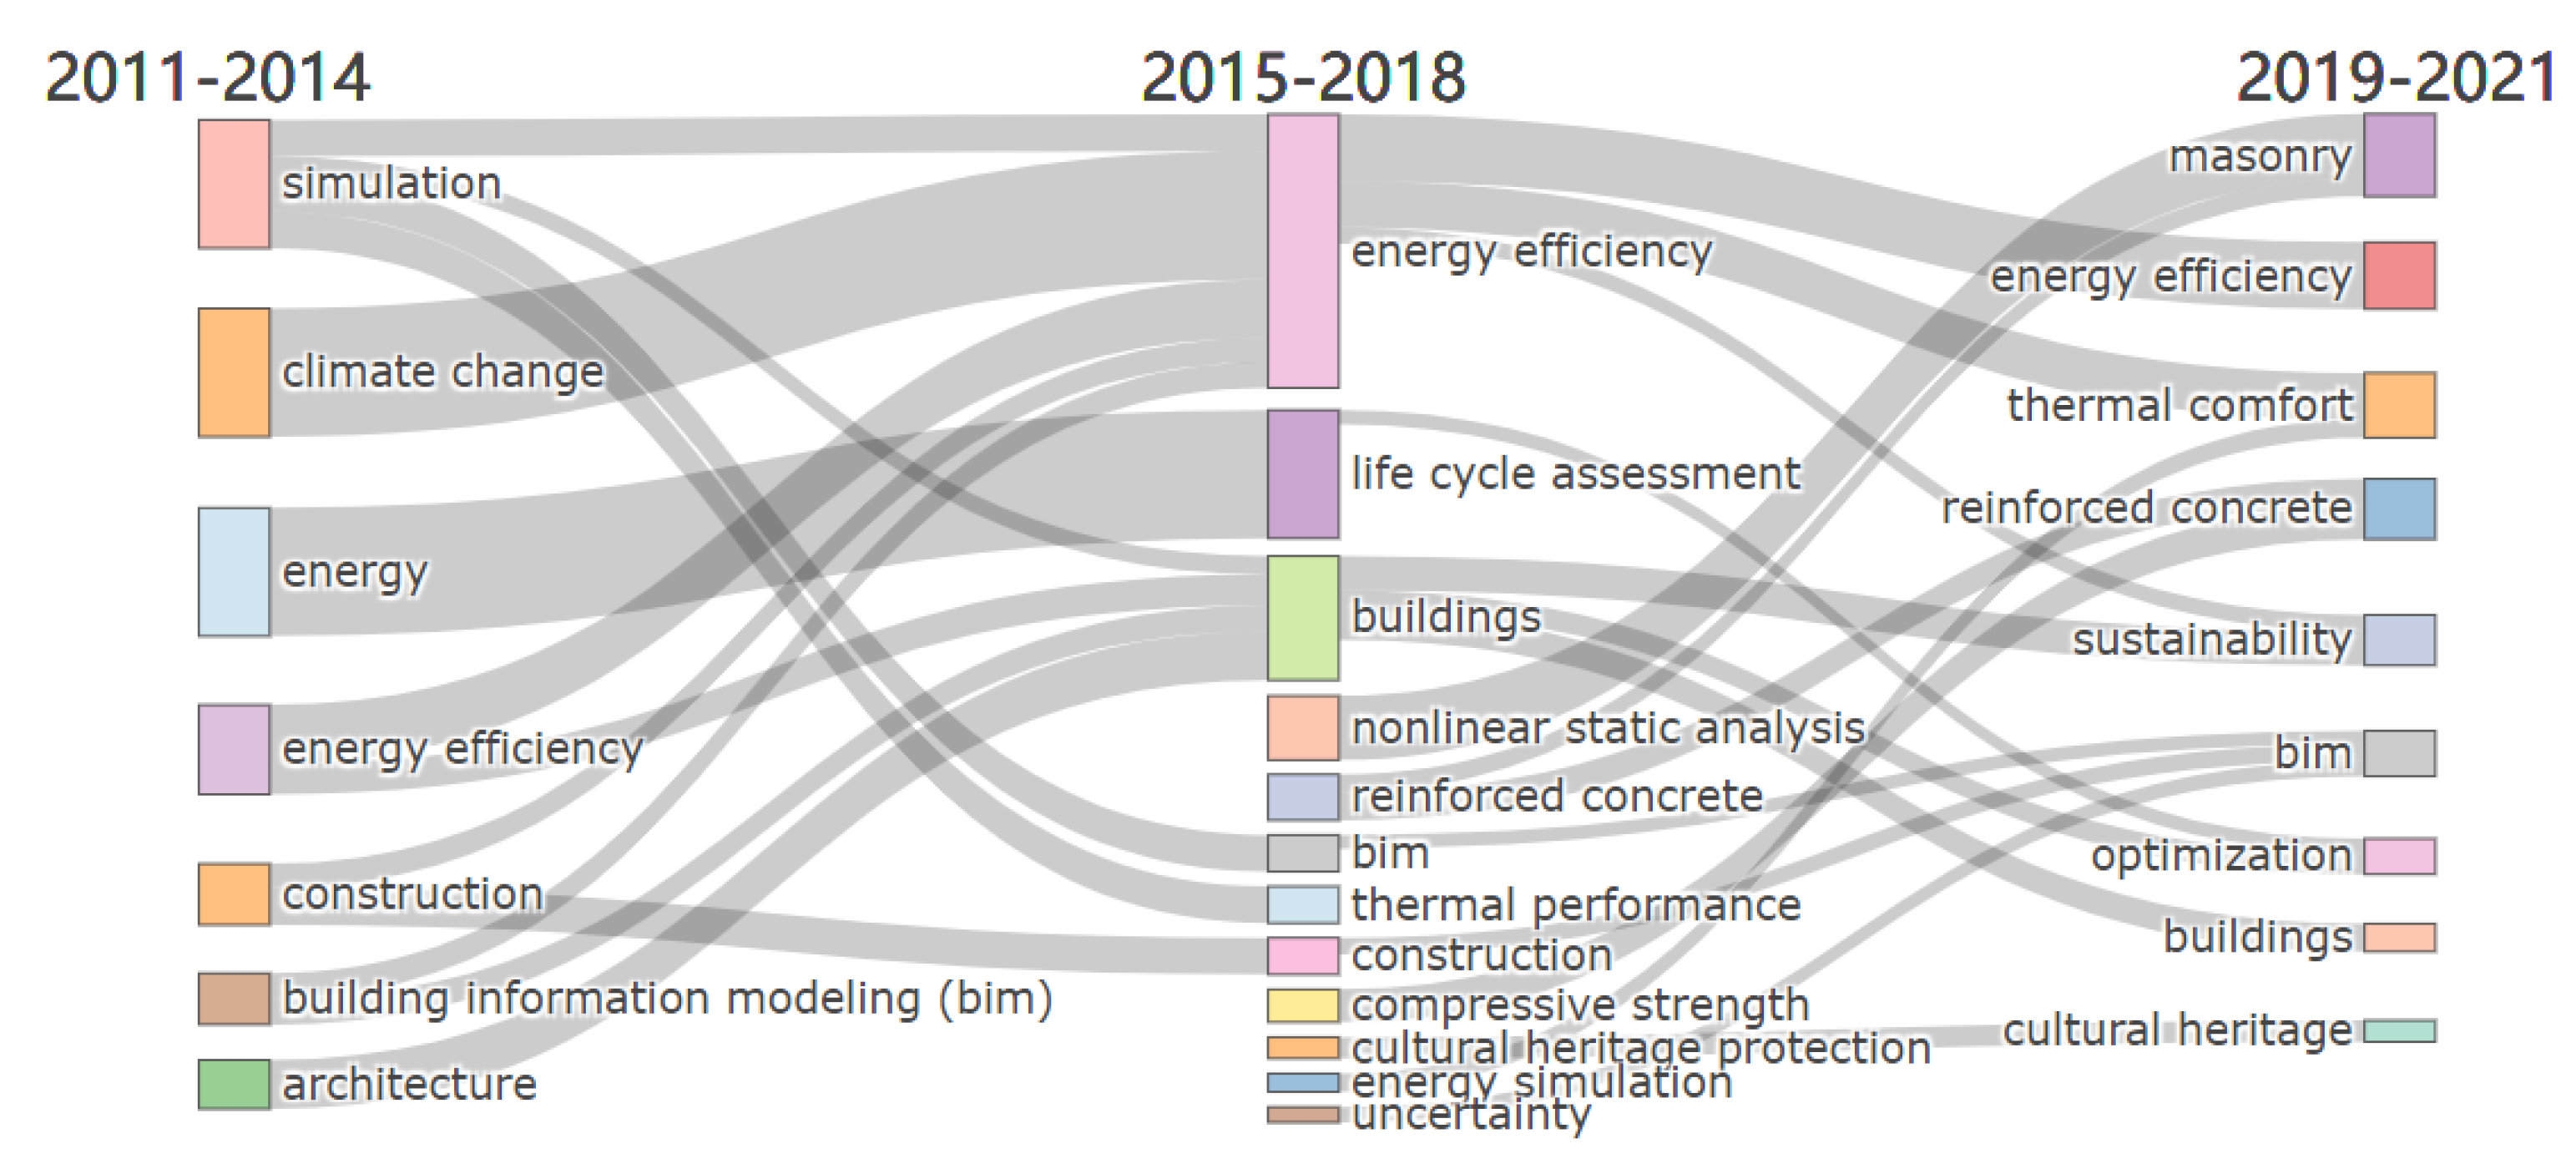
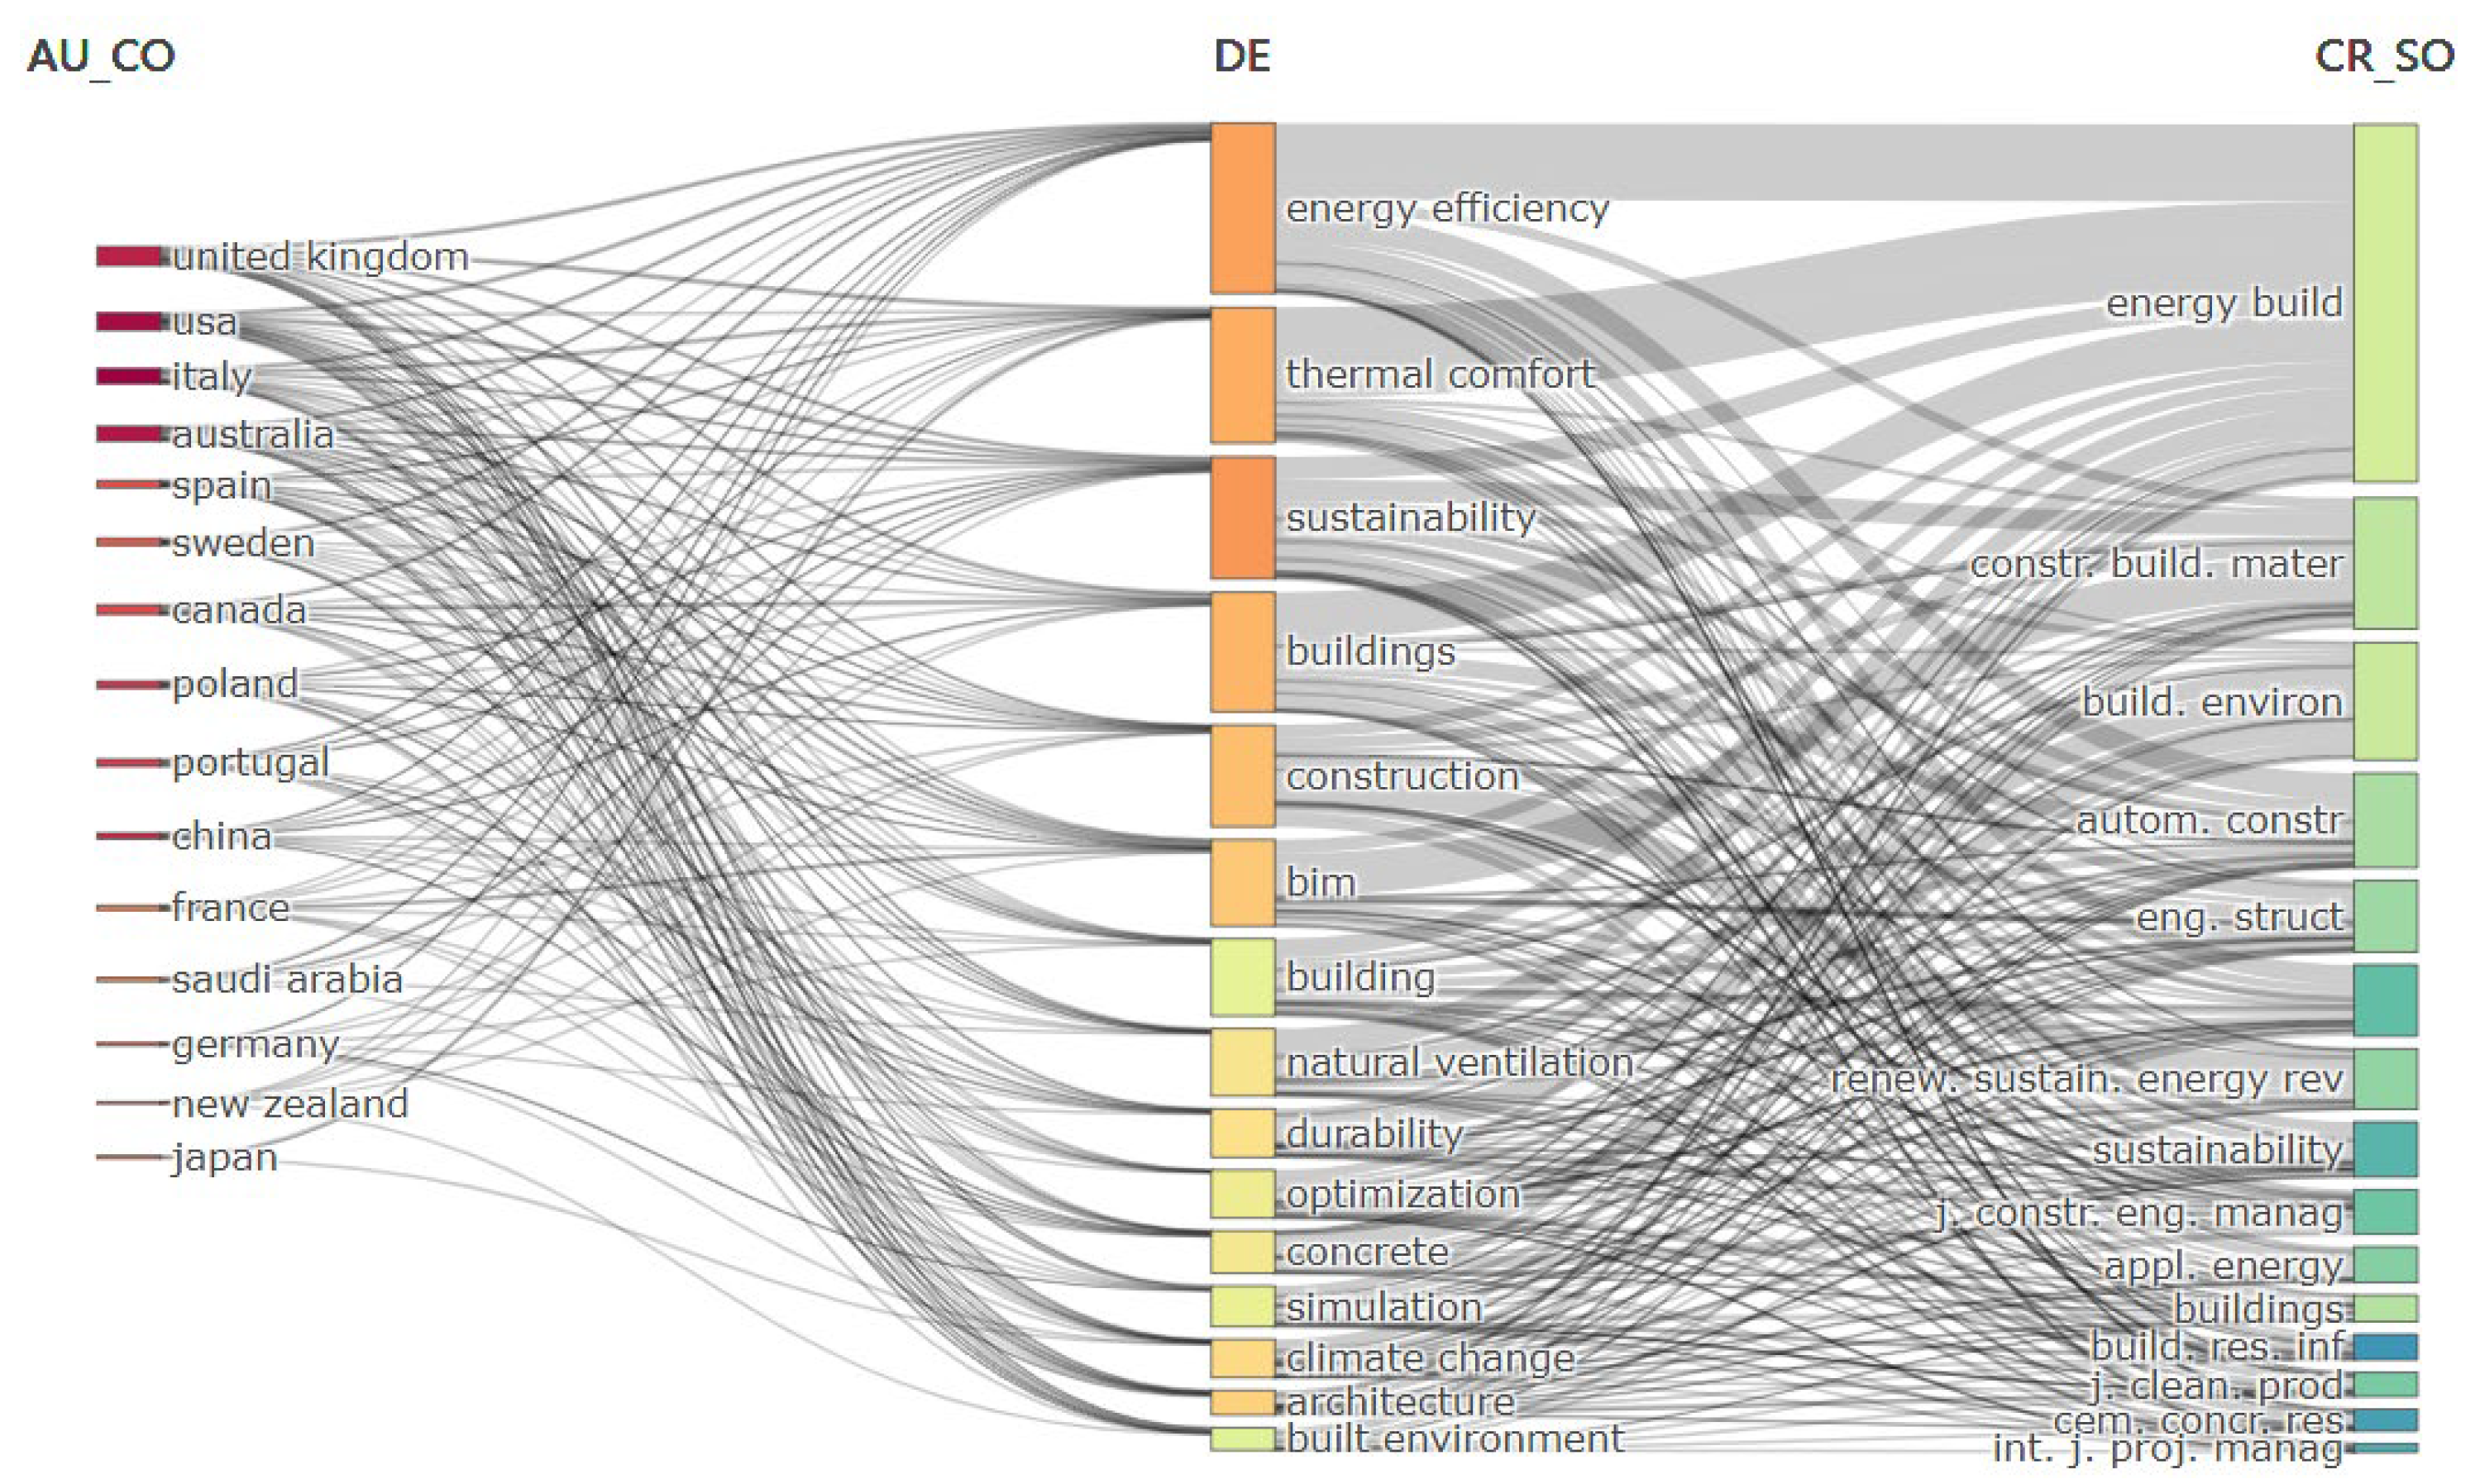
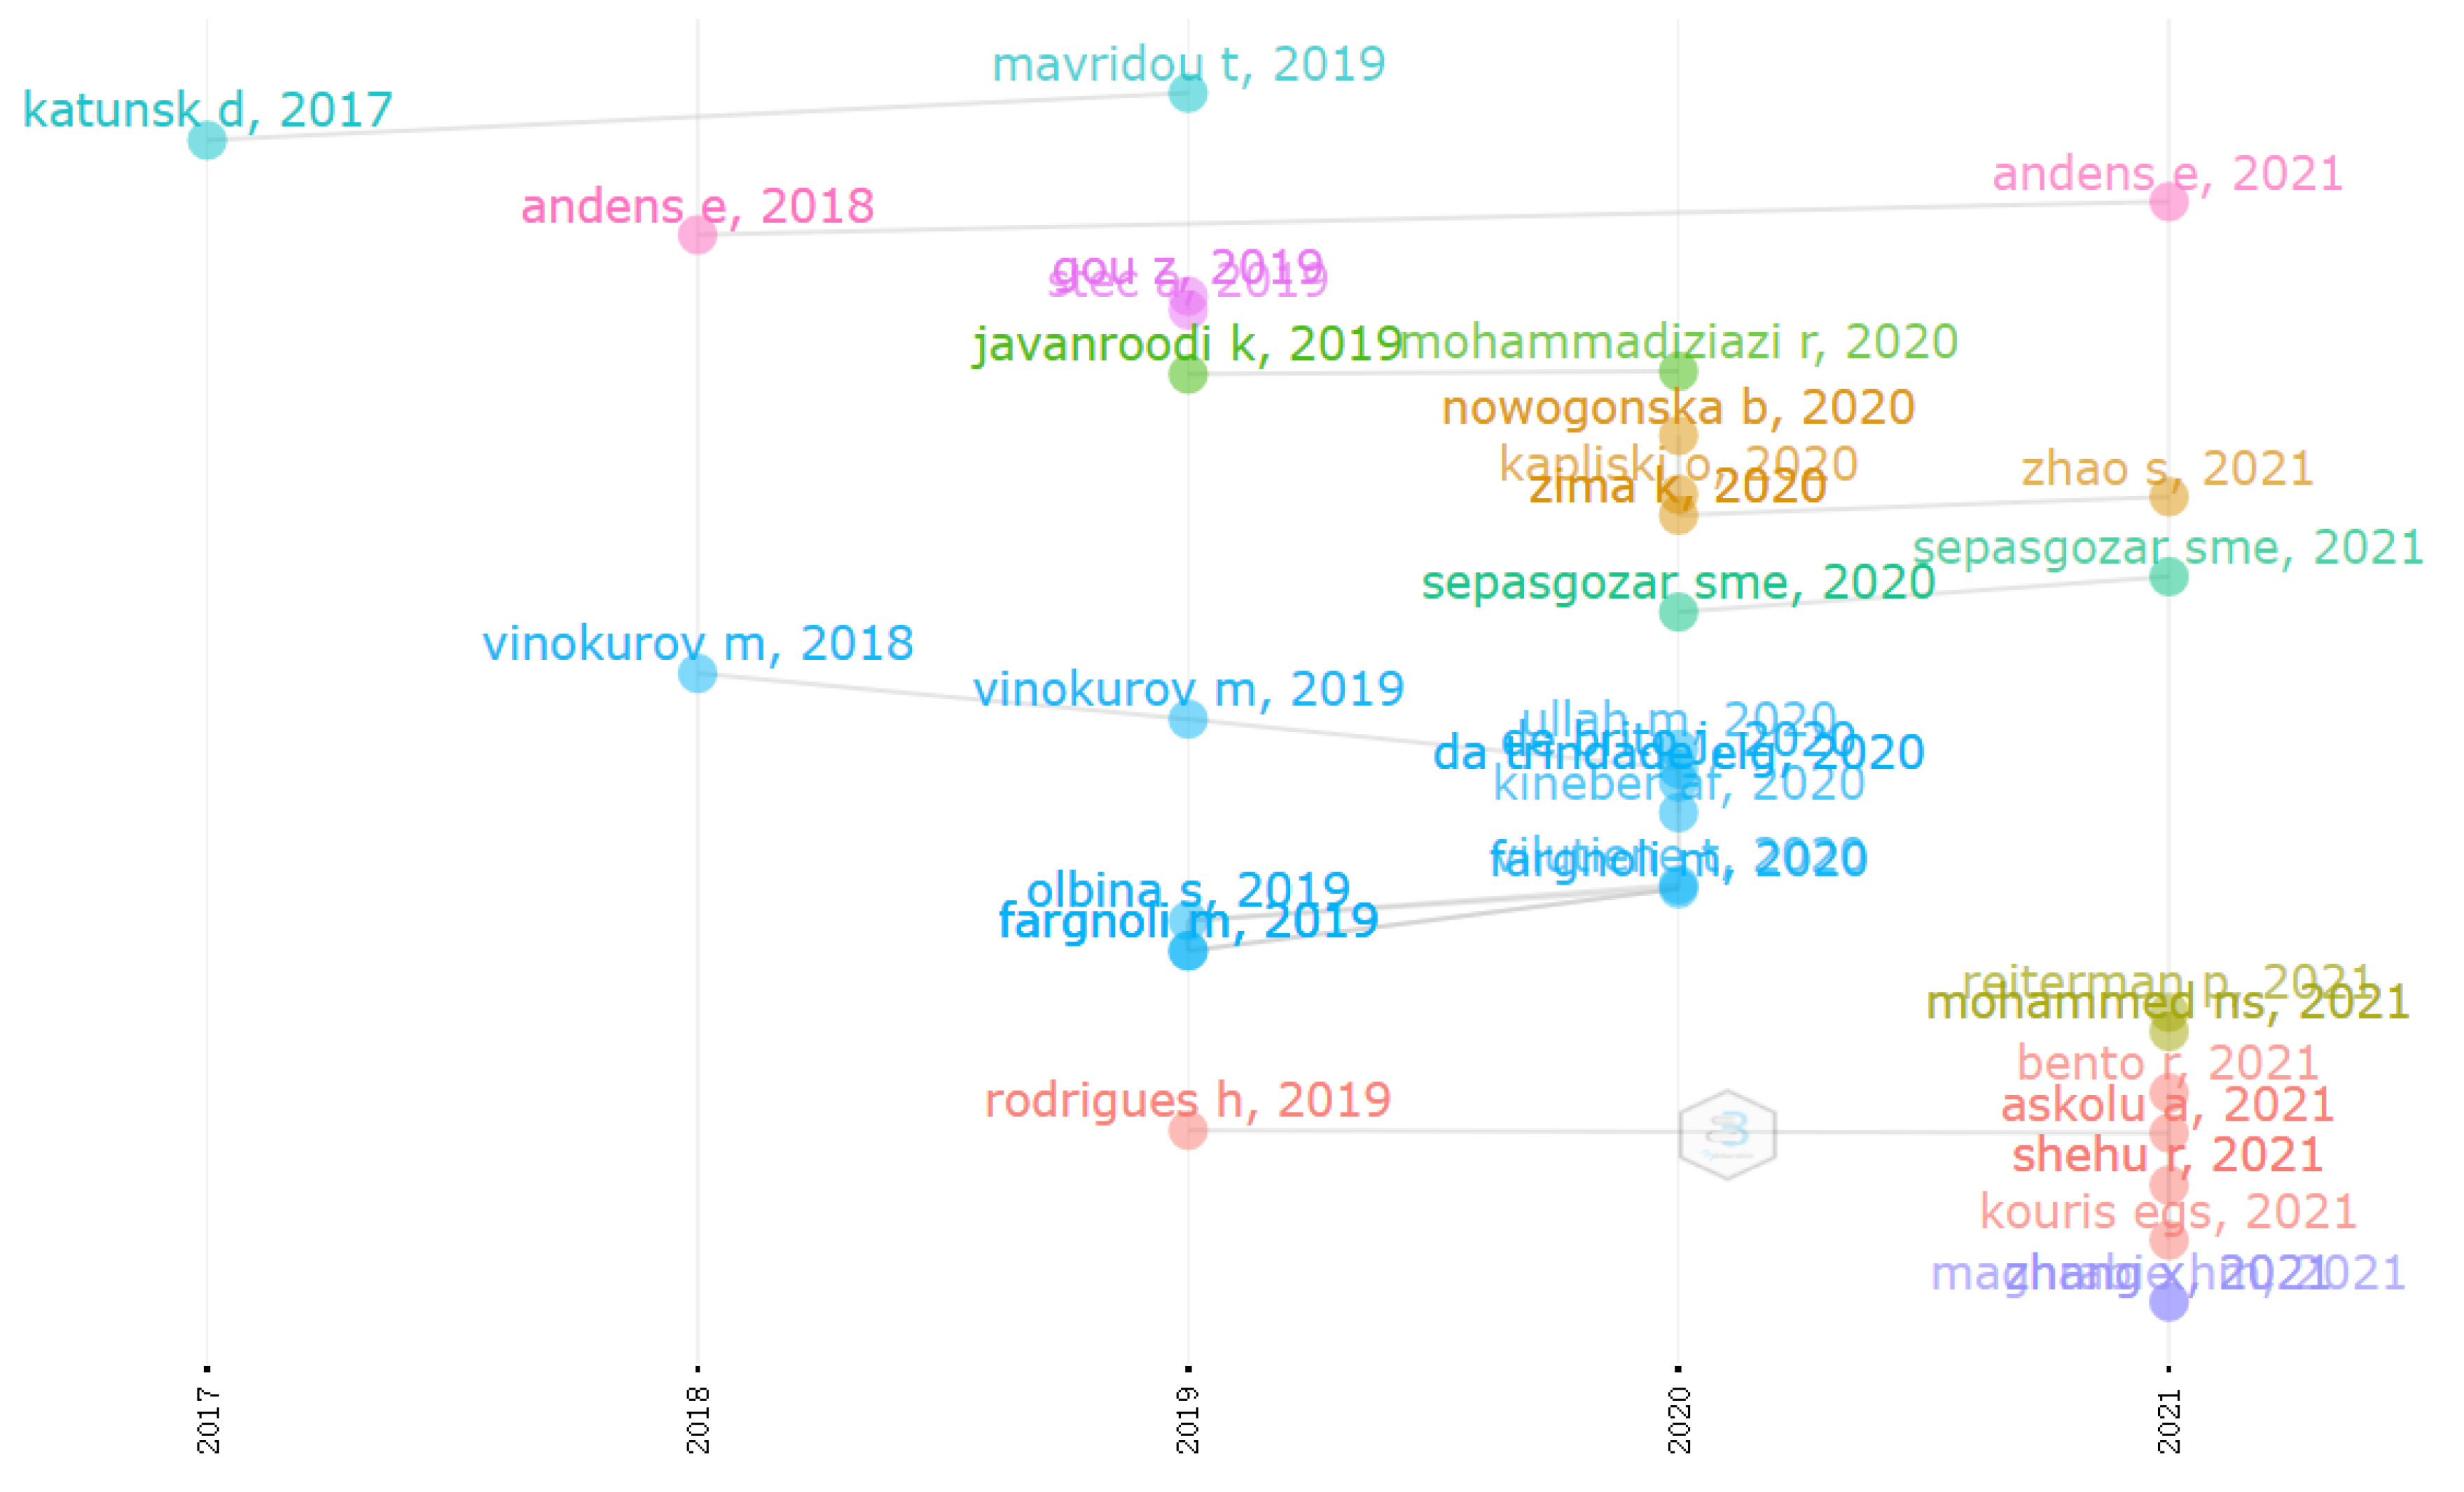
Section 4. This approach provides a more comprehensive visualization of the results. We considered author keywords, three-fields plot of institutions, keywords and main journal sources, citations, co-citations and collaboration. From the analysis of author keywords, we can conclude that the journal published more on the topics of “sustainability”, “energy efficiency” and “thermal comfort”. Between 2011 and 2014, scholars in Buildings published papers mainly about simulation, climate change and energy. However, in the following four years, “energy efficiency” became the most popular topic, followed by “life cycle assessment” and “buildings”. In the last three years, “masonry”, “energy efficiency” and “reinforced concrete” have attracted more attention from researchers. This result provides us with the developing trends of topics of the journal.
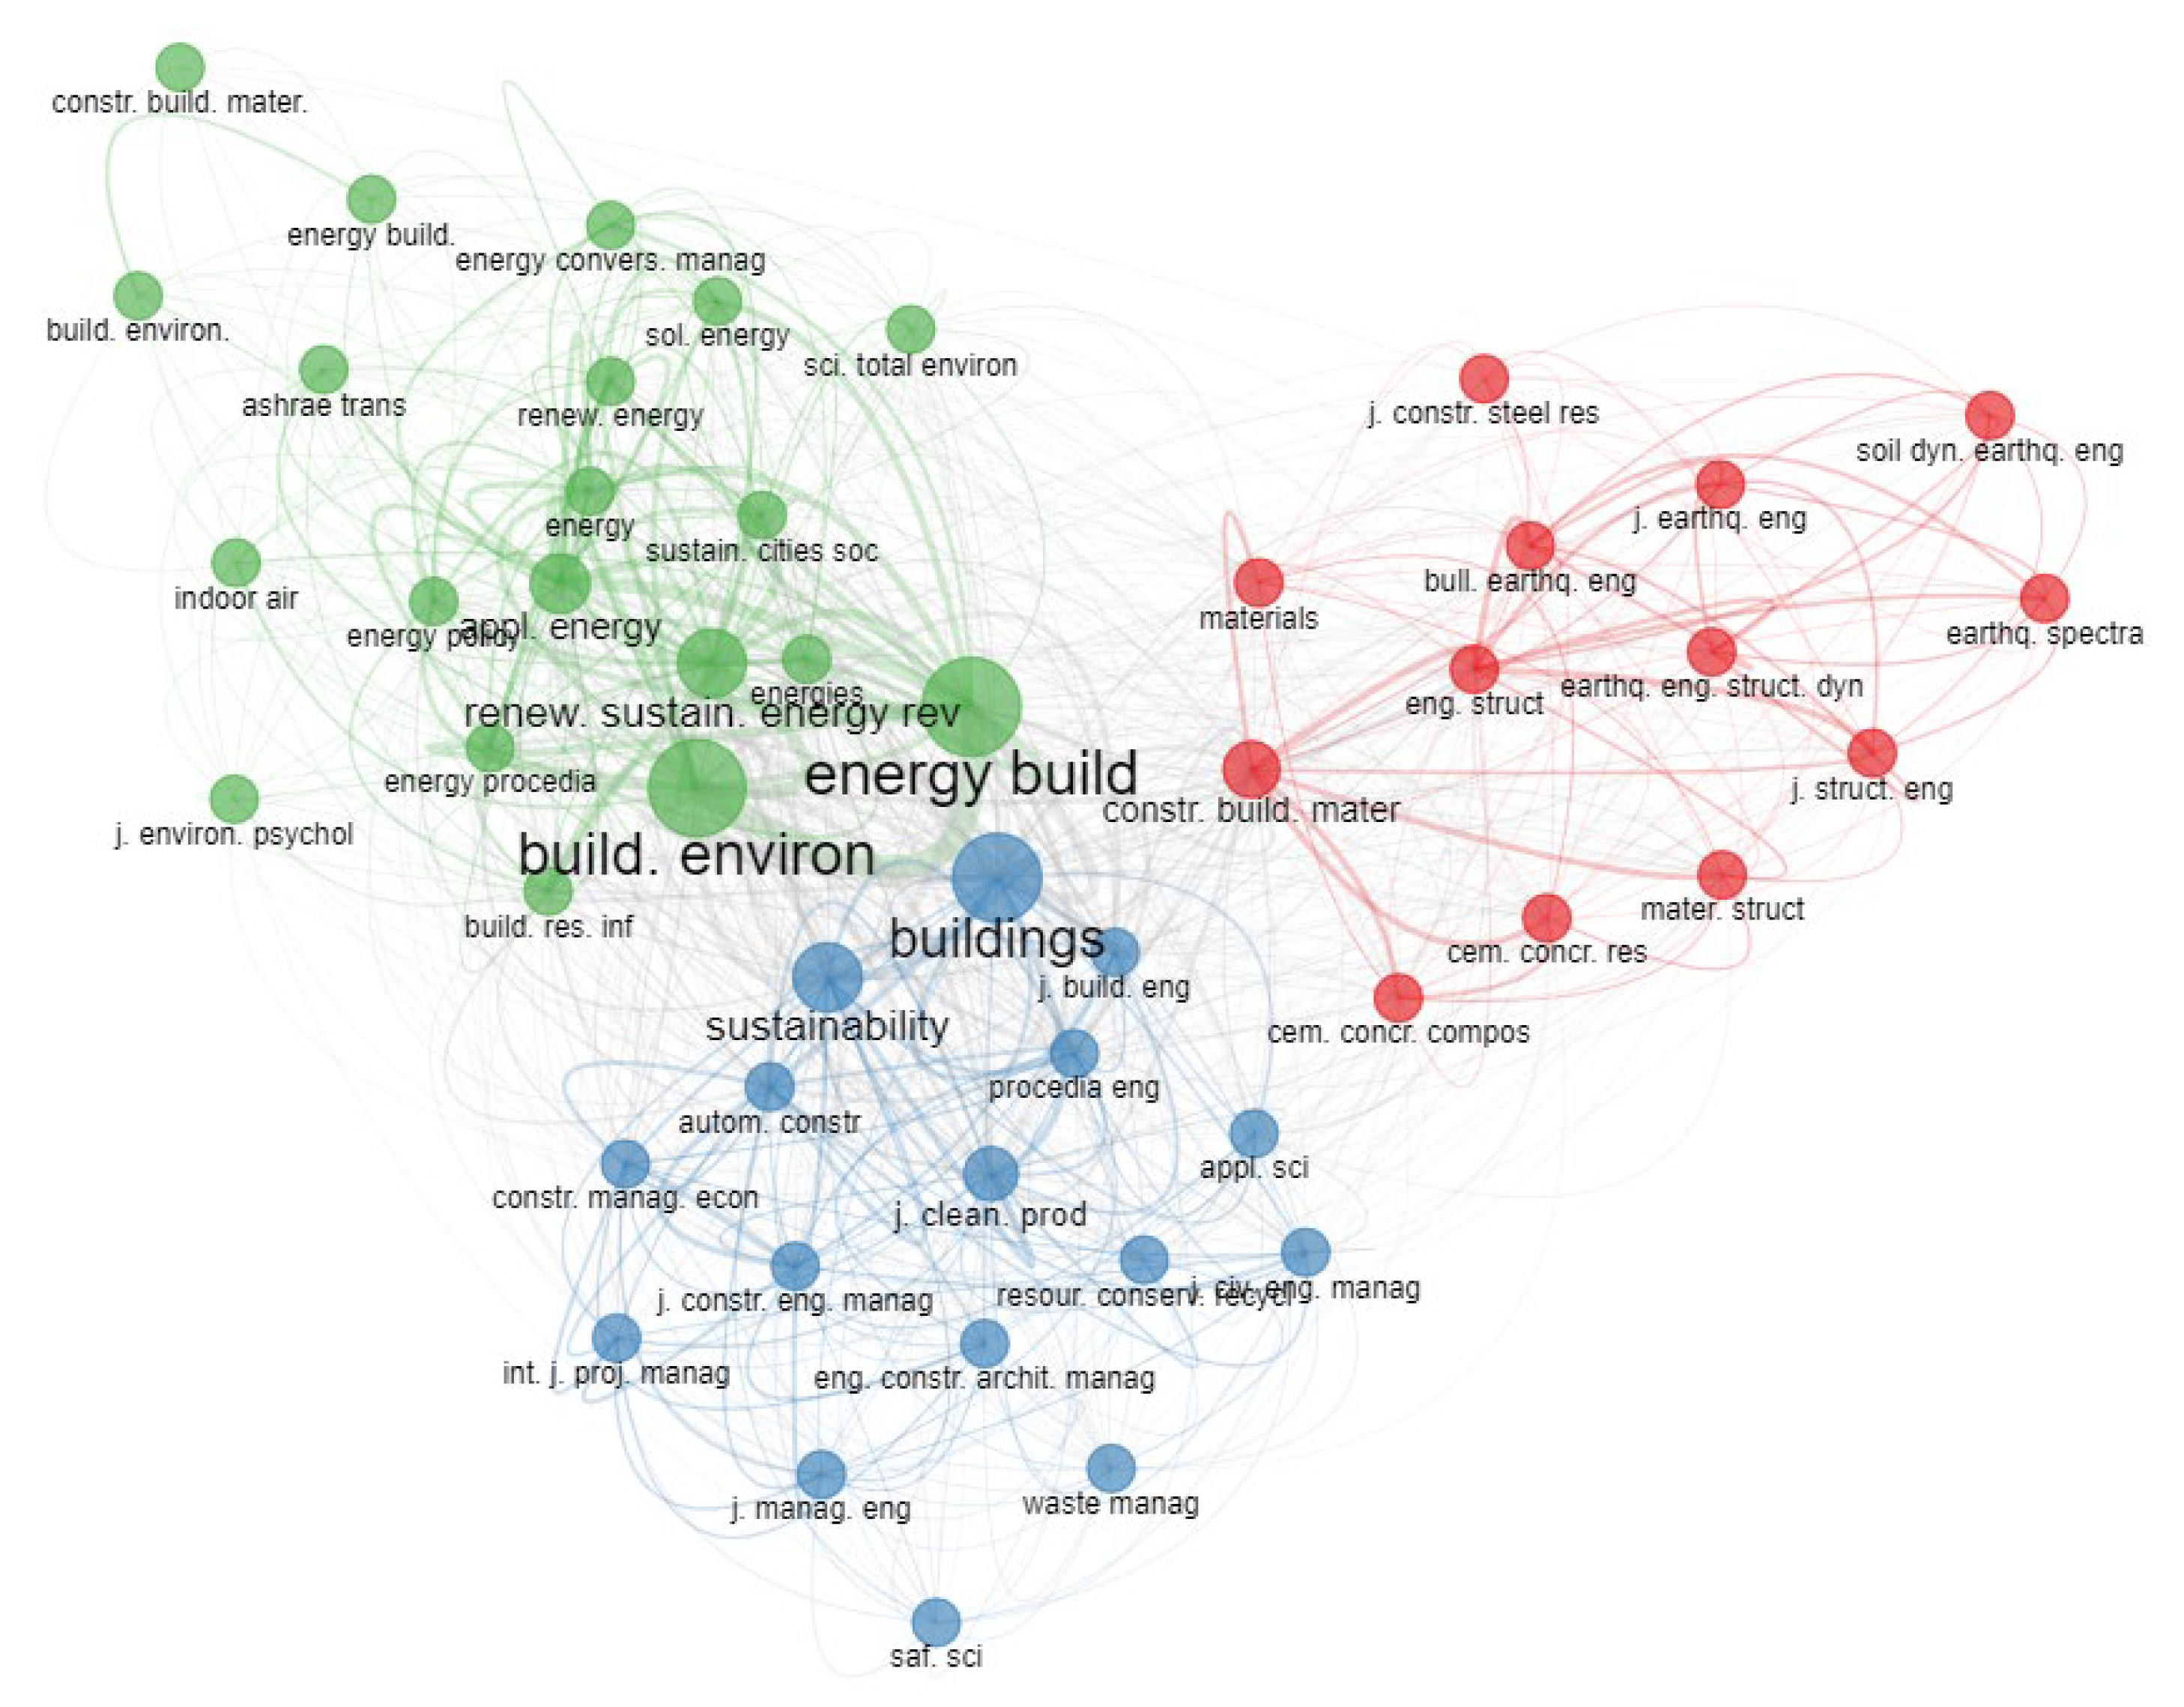
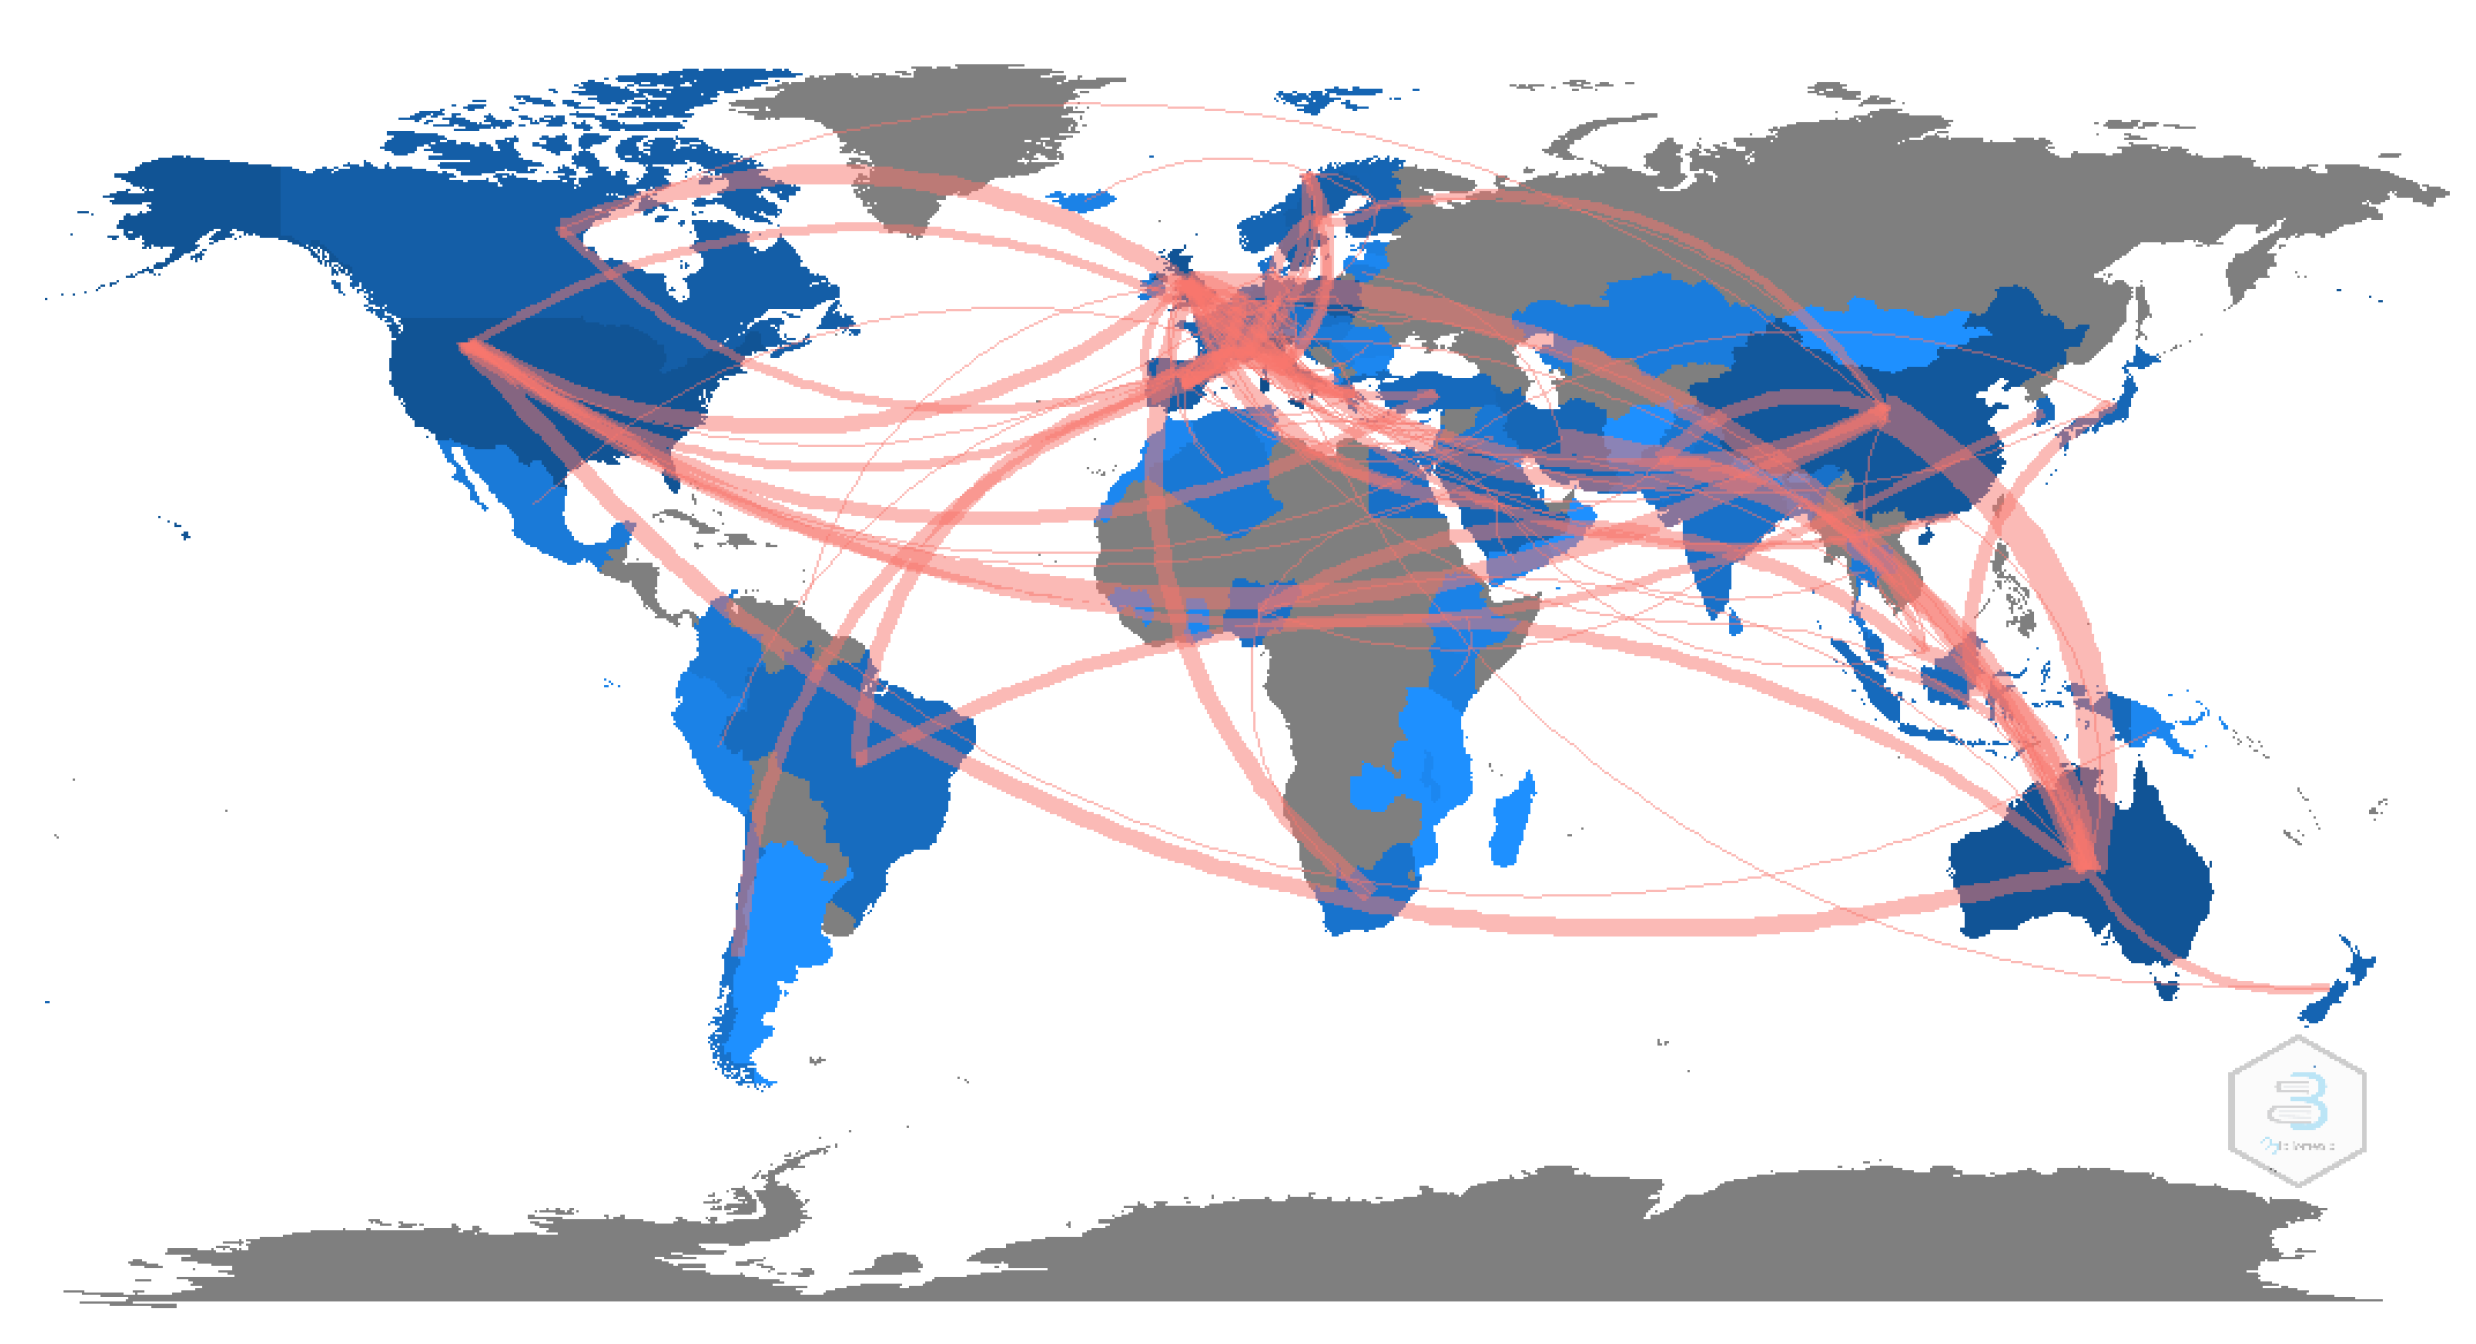
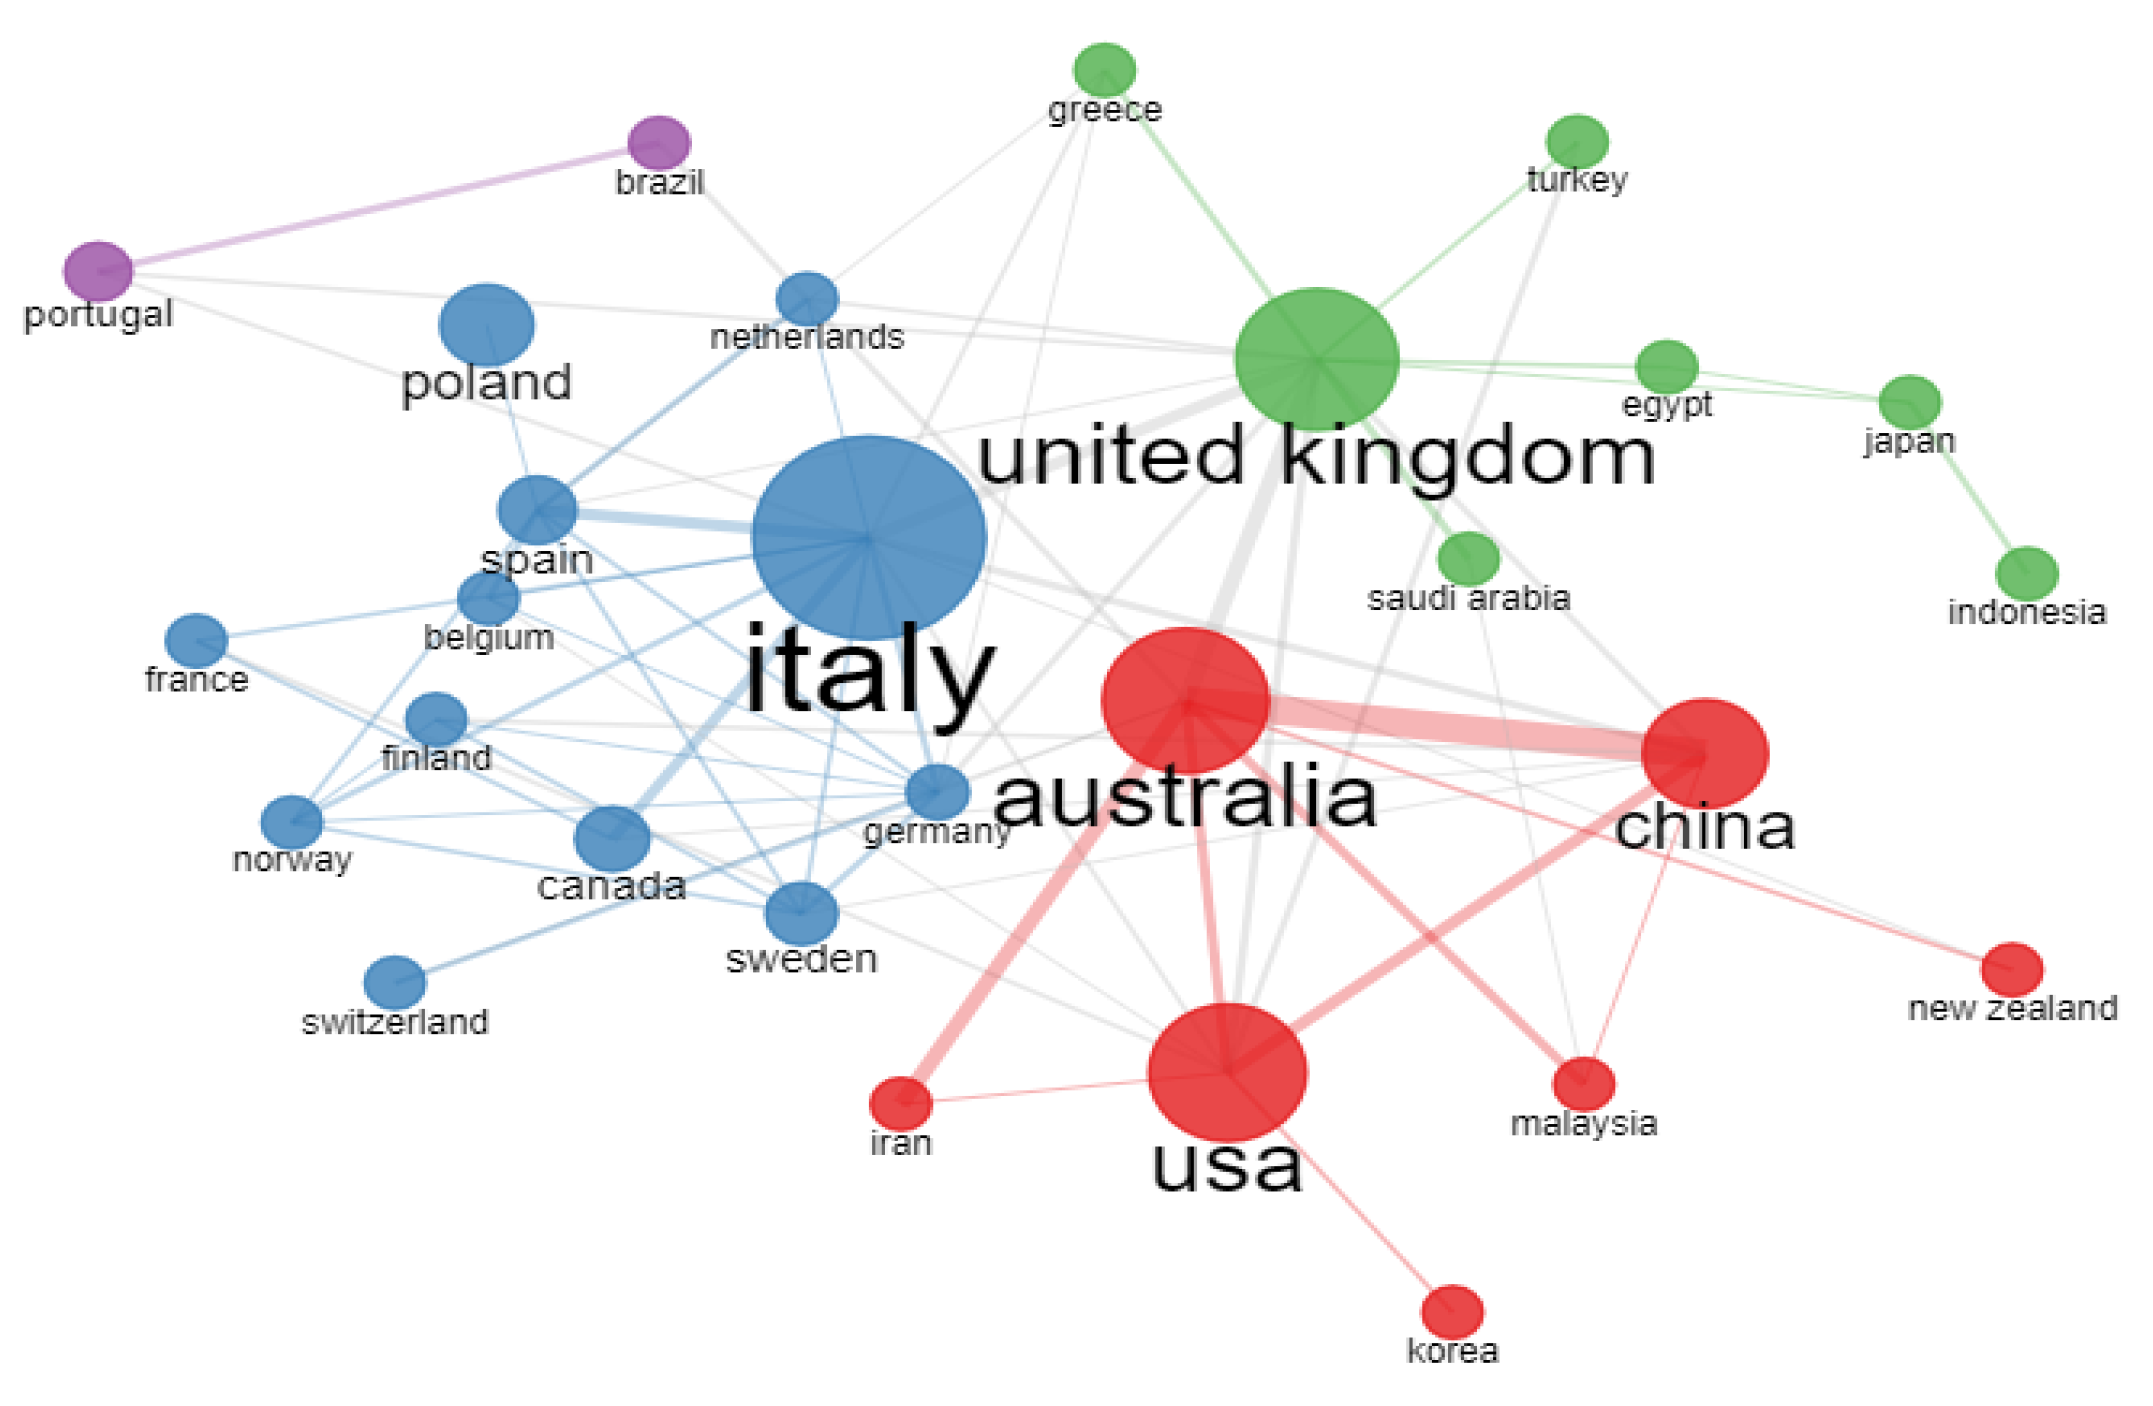
This journal is closely connected to other leading journals in the field, such as Energy and Buildings and Building and Environment. As for the collaboration network in Buildings, this study provides a knowledge domain map that identifies collaborative networks of researchers between journals and countries/regions. The results show that institutions from the same country or region work more closely together. Italy has the widest range of cooperative partners, followed by the United Kingdom, Australia, the USA and China. These five countries are high-yield countries.
This study is useful to scholars, publishers or others interested in building science, building engineering and architecture. It provides people with a comprehensive overview of Buildings from the past ten years using a bibliometric method and also forms a base for initiating further study in this area. For example, it is worth noting that hot topics such as energy efficiency, cultural heritage and climate change may continue to attract attention. Furthermore, through the previous analysis, we can predict that the journal will be acknowledged by more and more people over the world in the future. The number of publications and citations will likely continue to increase, and the research topics in the journal may become increasingly various and in-depth. There is no doubt that Buildings will continue to provide a platform for the expression and dissemination of ideas and strengthen cooperation among authors, institutions and countries/regions, as well as build a bridge between academia and industry.
Furthermore, there are some gaps the journal should pay attention to. For example, with the increase in publications, the diversity of research directions and fields has increased, too. The journal should maintain a quality/quantity balance and also emphasize on the depth and contribution of articles. Furthermore, Buildings runs special issues to create collections of papers on specific topics, but the classification of special issues can be further refined and become more innovative. It is also advisable for the journal to take some measures, such as organizing academic events, to encourage scholars and promote the development of academia.
This study provides a full description of Buildings but also presents some limitations. Since the data were collected from the Scopus database, the limitations of this database may also apply to this study. For instance, 76 documents are omitted since they are not directly available in Scopus, so some results may not be completely correct. Another limitation is that although the work uses a wide range of indicators in order to provide a comprehensive overview from different perspectives, we have to acknowledge that the work is not perfect and there are some missing perspectives we did not take into consideration. Future research should make improvements in these two directions to provide better research.

Author Contributions

Conceptualization, Z.X. (Zhiwen Xiao) and Y.Q.; methodology, Z.X. (Zhiwen Xiao); software, Z.X. (Zhiwen Xiao) and Y.Q.; validation, Z.X. (Zeshui Xu), J.A. and E.K.Z.; resources, Z.X. (Zeshui Xu); data curation, Z.X. (Zeshui Xu); writing—original draft preparation, Z.X. (Zhiwen Xiao) and Y.Q.; writing—review and editing, Z.X. (Zeshui Xu), J.A. and E.K.Z.; visualization, Z.X. (Zhiwen Xiao) and Y.Q.; supervision, Z.X. (Zeshui Xu), J.A. and E.K.Z.; project administration, Z.X. (Zeshui Xu), J.A. and E.K.Z.; funding acquisition, Z.X. (Zeshui Xu). All authors have read and agreed to the published version of the manuscript.

Funding

The work was supported by the National Natural Science Foundation of China (Nos. 72071135 and 71771155).

Data Availability Statement

The data presented in this study are available on request from the corresponding author.

Conflicts of Interest

The authors declare no conflict of interest.

References

  1. Anumba, C.J. Buildings: An open access journal for the built environment. Buildings 2011, 1, 1–3. [Google Scholar] [CrossRef] [Green Version]
  2. Kessler, M.M. Bibliographic coupling between scientific papers. Am. Doc. 1963, 14, 10–25. [Google Scholar] [CrossRef]
  3. Small, H. Co-citation in the scientific literature: A new measure of the relationship between two documents. J. Am. Soc. Inf. Sci. 1973, 24, 265–269. [Google Scholar] [CrossRef]
  4. Aria, M.; Cuccurullo, C. Bibliometrix: An R-tool for comprehensive science mapping analysis. J. Informetr. 2017, 11, 959–975. [Google Scholar] [CrossRef]
  5. Yu, D.J.; Xu, Z.S.; Antuchevičienė, J. Bibliometric analysis of the Journal of Civil Engineering and Management between 2008 and 2018. J. Civ. Eng. Manag. 2019, 25, 402–410. [Google Scholar] [CrossRef]
  6. Tang, M.; Liao, H.; Yepes, V.; Laurinavičius, A.; Tupėnaitė, L. Quantifying and mapping the evolution of a leader journal in the field of civil engineering. J. Civ. Eng. Manag. 2021, 27, 100–116. [Google Scholar] [CrossRef]
  7. Novas, N.; Alcayde, A.; Robalo, I.; Manzano-Agugliaro, F.; Montoya, F.G. Energies and Its Worldwide Research. Energies 2020, 13, 6700. [Google Scholar] [CrossRef]
  8. Zhou, W.; Xu, Z.S.; Zavadskas, E.K.; Laurinavicius, A. The knowledge domain of the Baltic Journal of Road and Bridge Engineering between 2006 and 2019. Baltic J. Road Bridge Eng. 2020, 15, 1–30. [Google Scholar] [CrossRef]
  9. Wang, X.X.; Xu, Z.S.; Ge, Z.J.; Zavadskas, E.K.; Skačkauskas, P. An overview of a leader journal in the field of transport: A bibliometric analysis of “Computer-aided civil and infrastructure engineering” from 2000 to2019. Transport 2021, 35, 557–575. [Google Scholar] [CrossRef]
  10. Cobo, M.J.; Martínez, M.A.; Gutiérrez-Salcedo, M.; Fujita, H.; Herrera-Viedma, E. 25 years at Knowledge-Based Systems: A bibliometric analysis. Knowl. -Based Syst. 2015, 80, 3–13. [Google Scholar] [CrossRef]
  11. Wang, X.X.; Chang, Y.; Xu, Z.S.; Wang, Z.D.; Kadirkamanathan, V. 50 years of international journal of systems science: A review of the past and trends for the future. Int. J. Syst. Sci. 2021, 52, 1515–1538. [Google Scholar] [CrossRef]
  12. Yu, D.; Xu, Z.S.; Pedrycz, W.; Wang, W. Information sciences 1968–2016: A retrospective analysis with text mining and bibliometric. Inf. Sci. 2017, 418–419, 619–634. [Google Scholar] [CrossRef]
  13. Rousseau, R. Forgotten founder of bibliometrics. Nature 2014, 510, 218. [Google Scholar] [CrossRef] [PubMed]
  14. Broadus, R.N. Toward a definition of “bibliometrics”. Scientometrics 1987, 12, 373–379. [Google Scholar] [CrossRef]
  15. Merigó, J.M.; Cobo, M.J.; Laengle, S.; Rivas, D.; Herrera-Viedma, E. Twenty years of Soft Computing: A bibliometric overview. Soft Comput. 2019, 23, 1477–1497. [Google Scholar] [CrossRef]
  16. Cancino, C.; Merigó, J.M.; Coronado, F.; Dessouky, Y.; Dessouky, M. Forty years of Computers & Industrial Engineering: A bibliometric analysis. Comput. Ind. Eng. 2017, 113, 614–629. [Google Scholar] [CrossRef]
  17. Akadiri, P.O.; Chinyio, E.A.; Olomolaiye, P.O. Design of a sustainable building: A conceptual framework for implementing sustainability in the building sector. Buildings 2012, 2, 126–152. [Google Scholar] [CrossRef] [Green Version]
  18. Al-Kodmany, K. The Vertical Farm: A review of developments and implications for the vertical city. Buildings 2018, 8, 24. [Google Scholar] [CrossRef] [Green Version]
  19. Tahmasebinia, F.; Niemelä, M.; Ebrahimzadeh Sepasgozar, S.M.; Lai, T.Y.; Su, W.; Reddy, K.R.; Shirowzhan, S.; Sepasgozar, S.; Marroquin, F.A. Three-Dimensional printing using recycled high-density polyethylene: Technological challenges and future directions for construction. Buildings 2018, 8, 165. [Google Scholar] [CrossRef] [Green Version]
  20. Tahmasebinia, F.; Fogerty, D.; Wu, L.O.; Li, Z.; Sepasgozar, S.M.E.; Zhang, K.; Sepasgozar, S.; Marroquin, F.A. Numerical analysis of the creep and shrinkage experienced in the Sydney Opera House and the rise of digital twin as future monitoring technology. Buildings 2019, 9, 137. [Google Scholar] [CrossRef] [Green Version]
  21. Sepasgozar, S.M.E.; Shi, A.; Yang, L.; Shirowzhan, S.; Edwards, D.J. Additive manufacturing applications for Industry 4.0: A systematic critical review. Buildings 2020, 10, 231. [Google Scholar] [CrossRef]
  22. Al-Kodmany, K. Green retrofitting skyscrapers: A review. Buildings 2014, 4, 683–710. [Google Scholar] [CrossRef] [Green Version]
  23. Al-Kodmany, K. The sustainability of tall building developments: A conceptual framework. Buildings 2018, 8, 7. [Google Scholar] [CrossRef] [Green Version]
  24. Al-Kodmany, K. New Suburbanism: Sustainable spatial patterns of tall buildings. Buildings 2018, 8, 127. [Google Scholar] [CrossRef] [Green Version]
  25. Al-Kodmany, K. Sustainability and the 21st century vertical city: A review of design approaches of tall buildings. Buildings 2018, 8, 102. [Google Scholar] [CrossRef] [Green Version]
  26. Wang, L.; Wei, Y.M.; Brown, M.A. Global transition to low-carbon electricity: A bibliometric analysis. Appl. Energy 2017, 205, 57–68. [Google Scholar] [CrossRef]
  27. Mumu, J.R.; Tahmid, T.; Azad, M.d.A.K. Job satisfaction and intention to quit: A bibliometric review of work-family conflict and research agenda. Appl. Nurs. Res. 2021, 59, 151334. [Google Scholar] [CrossRef]
  28. Aria, M.; Misuraca, M.; Spano, M. Mapping the evolution of social research and data science on 30 years of Social Indicators Research. Soc. Indic. Res. 2020, 149, 803–831. [Google Scholar] [CrossRef]
  29. Srivastava, M. Mapping the influence of influencer marketing: A bibliometric analysis. Mark. Intell. Plan. 2021, 39, 979–1003. [Google Scholar] [CrossRef]
  30. Vinokurov, M.; Grönman, K.; Kosonen, A.; Luoranen, M.; Soukka, R. Updating the path to a carbon-neutral built environment—What should a single builder do. Buildings 2018, 8, 112. [Google Scholar] [CrossRef] [Green Version]
  31. Vinokurov, M.; Grönman, K.; Hammo, S.; Soukka, R.; Luoranen, M. Integrating energy efficiency into the municipal procurement process of buildings—Whose responsibility? Buildings 2019, 9, 45. [Google Scholar] [CrossRef] [Green Version]
  32. Fargnoli, M.; Lombardi, M. Preliminary Human Safety Assessment (PHSA) for the improvement of the behavioral aspects of safety climate in the construction industry. Buildings 2019, 9, 69. [Google Scholar] [CrossRef] [Green Version]
  33. Fargnoli, M.; Lombardi, M. Building Information Modelling (BIM) to enhance occupational safety in construction activities: Research trends emerging from one decade of studies. Buildings 2020, 10, 98. [Google Scholar] [CrossRef]
  34. Kouris, E.-G.S.; Kouris, L.-A.S.; Konstantinidis, A.A.; Kourkoulis, S.K.; Karayannis, C.G.; Aifantis, E.C. Stochastic dynamic analysis of cultural heritage towers up to collapse. Buildings 2021, 11, 296. [Google Scholar] [CrossRef]
  35. Shehu, R. Implementation of pushover analysis for seismic assessment of masonry towers: Issues and practical recommendations. Buildings 2021, 11, 71. [Google Scholar] [CrossRef]
  36. Aşıkoğlu, A.; Vasconcelos, G.; Lourenço, P.B. Overview on the nonlinear static procedures and performance-based approach on modern unreinforced masonry buildings with structural irregularity. Buildings 2021, 11, 147. [Google Scholar] [CrossRef]
  37. Guleria, D.; Kaur, G. Bibliometric analysis of ecopreneurship using VOSviewer and RStudio Bibliometrix, 1989–2019. Libr. Hi Tech. 2021, 39, 1001–1024, ahead-of-print. [Google Scholar] [CrossRef]
  38. Noyons, E.C.M.; Moed, H.F.; Luwel, M. Combining mapping and citation analysis for evaluative bibliometric purposes: A bibliometric study. J. Am. Soc. Inf. Sci. 1999, 50, 115–131. [Google Scholar] [CrossRef]
Figure 1. The process of bibliometric analysis.
Buildings 12 00037 g001
Figure 2. Most productive countries/regions.
Buildings 12 00037 g002
Figure 3. Word cloud of keywords.
Buildings 12 00037 g003
Figure 4. Thematic map of keywords.
Buildings 12 00037 g004
Figure 5. Growth of the top 10 keywords.
Buildings 12 00037 g005
Figure 6. Trending topics.
Buildings 12 00037 g006
Figure 7. Thematic evolution.
Buildings 12 00037 g007
Figure 8. Three-fields plot.
Buildings 12 00037 g008
Figure 9. Historical direct citation network.
Buildings 12 00037 g009
Figure 10. Co-citation network of journals.
Buildings 12 00037 g010
Figure 11. Collaboration network of institutions.
Buildings 12 00037 g011
Figure 12. An overview of cooperation between countries/regions.
Buildings 12 00037 g012
Figure 13. Collaboration network of countries/regions.
Buildings 12 00037 g013
Table 1. Annual publication and citation structure.
YearTPTC≥50≥20≥10≥5≥1
201121300111
201227764412152127
20133940716142638
20144755119182843
2015751124320385572
20165150005223949
201712116954316496121
2018187163821861110177
2019237168411466121224
2020246731001455205
20214343070026154
Total14669414161153155581111
%100.00% 1.09%7.84%21.49%38.06%75.78%
Abbreviations: TP and TC = Total papers and citations; ≥50, ≥20, ≥10, ≥5, ≥1 = Number of papers with equal or more than 50, 20, 10, 5 and 1 citation(s).
Table 2. Most cited papers (research articles).
RTCTitleAuthor/sYearC/Y
1181Design of A Sustainable Building: A Conceptual Framework for Implementing Sustainability in the Building SectorAkadiri, P.O.; Chinyio, E.A.; Olomolaiye, P.O. 201218.10
294A Comparative Cradle-to-Gate Life Cycle Assessment of Mid-Rise Office Building Construction Alternatives: Laminated Timber or Reinforced ConcreteRobertson, A.B.; Lam, F.C.F.; Cole, R.J.20129.40
365Fatigue-Prone Details in Steel BridgesHaghani, R.; Al-Emrani, M.; Heshmati, M.20126.50
463Rethinking Design and Urban Planning for the Cities of the FutureSaaty, T.L.; De Paola, P.201712.60
560A Thermal Simulation Tool for Building and Its Interoperability through the Building Information Modeling (BIM) PlatformBahar, Y.N.; Pere, C.; Landrieu, J.; Nicolle, C.20136.67
655Rocking and Kinematic Approaches for Rigid Block Analysis of Masonry Walls: State of the Art and Recent DevelopmentsCasapulla, C.; Giresini, L.; Lourenço, P.B.201711.00
754Adaptive Thermal Comfort in Japanese Houses during the Summer Season: Behavioral Adaptation and the Effect of HumidityRijal, H.B.; Humphreys, M.; Nicol, F.20157.71
852A Production Model for Construction: A Theoretical FrameworkAntunes, R.; Gonzalez, V.20157.43
950Strategies for Applying the Circular Economy to Prefabricated BuildingsMinunno, R.; O’Grady, T.; Morrison, G.M.; Gruner, R.L.201812.50
1049Seismic Analysis of Historic Masonry Buildings: The Vicarious Palace in Pescia (Italy)Betti, M.; Galano, L.20124.90
1148Daylight Design of Office Buildings: Optimisation of External Solar Shadings by Using Combined Simulation MethodsGonzález, J.; Fiorito, F.20156.86
1248Building Information Modelling for Smart Built EnvironmentsZhang, J.; Seet, B.-C.; Lie, T.T.20156.86
1347Life Cycle Assessment (LCA) of Different Kinds of Concrete Containing Waste for Sustainable ConstructionColangelo, F.; Forcina, A.; Farina, I.; Petrillo, A.201811.75
1446Material Efficiency of Building ConstructionRuuska, A.; Häkkinen, T.20145.75
1543Economic-Environmental Indicators to Support Investment Decisions: A Focus on the Buildings’ End-of-Life StageFregonara, E.; Giordano, R.; Ferrando, D.G.; Pattono, S.20178.60
1643BIM Guidelines Inform Facilities Management Databases: A Case Study over TimeKensek, K. 20156.14
1742Integrating Simplified and Full Life Cycle Approaches in Decision Making for Building Energy Refurbishment: Benefits and BarriersOregi, X.; Hernandez, P.; Gazulla, C.; Isasa, M.20156.00
1841Rooftop PV Potential in the Residential Sector of the Kingdom of Saudi ArabiaKhan, M.M.A.; Asif, M.; Stach, E.20178.20
1941Using Genetic Algorithms for Real Estate AppraisalsDel Giudice, V.; De Paola, P.; Forte, F.20178.20
2039Energy and Economic Evaluation of Green Roofs for Residential Buildings in Hot-Humid ClimatesMahmoud, A.S.; Asif, M.; Hassanain, M.A.; Babsail, M.O.; Sanni-Anibire, M.O.20177.80
Table 3. Most cited papers (review articles).
RTCTitleAuthor/sYearC/Y
198A Review of Seismic Isolation for Buildings: Historical Development and Research NeedsWarn, G.P.; Ryan, K.L.20129.80
289Self-Centering Seismic Lateral Force Resisting Systems: High Performance Structures for the City of TomorrowChancellor, N.B.; Eatherton, M.R.; Roke, D.A.; Akbaş, T.201411.16
383The Vertical Farm: A Review of Developments and Implications for the Vertical CityAl-Kodmany, K.201820.75
465A Review of Psychological Literature on the Health and Wellbeing Benefits of Biophilic DesignGillis, K.; Gatersleben, B.20159.29
560Performance Review of Prefabricated Building Systems and Future Research in AustraliaNavaratnam, S.; Ngo, T.; Gunawardena, T.; Henderson, D.201920.00
658Estimation and Minimization of Embodied Carbon of Buildings: A ReviewAkbarnezhad, A.; Xiao, J.201711.60
751PCMs for Residential Building Applications: A Short Review Focused on Disadvantages and Proposals for Future DevelopmentBland, A.; Khzouz, M.; Statheros, T.; Gkanas, E.I.201710.20
849Recent Progress in Daytime Radiative Cooling: Is It the Air Conditioner of the Future?Santamouris, M.; Feng, J.201812.25
932A Scientometric Review and Metasynthesis of Building Information Modelling (BIM) Research in AfricaSaka, A.B.; Chan, D.W.M.201910.67
1032Blockchain and Building Information Modeling (BIM): Review and Applications in Post-Disaster RecoveryNawari, N.O.; Ravindran, S.201910.67
Table 4. Most productive authors.
RAuthorScopus IDCountry/RegionTPTCTC/TP
1Sepasgozar, S.M.E.55924332100Australia1422416.00
2Al-Kodmany, K.6603005886USA919121.22
3Bedon, C.57217221032Italy9546.00
4Zhang, X.57209625490Sweden9242.67
5Iannace, G.6506458238Italy89311.63
6Kvande, T.6504559094Norway8637.88
7Lafhaj, Z.6508004741France8313.88
8de Brito, J.7003285554Portugal8212.63
9Blanchet, P.7102260600Canada8202.50
10Trematerra, A.56016998400Italy7588.29
11Wang, C.C.57194027095Australia7243.43
12Silva, A.25959361900Portugal7111.57
13de Paola, P.56433637200Italy616227.00
14Lourenço, P.B.7004615647Portugal610116.83
15Shirowzhan, S.55923557900Australia66611.00
16Mojtahedi, M.57211244906Australia6599.83
17Sassu, M.6508376589Italy6569.33
18Ciaburro, G.55459296100Italy6477.83
19Edwards, D.J.7404086765United Kingdom6274.50
20Hammad, A.W.A.56430620200Australia6152.50
Table 5. Most productive affiliations.
RAffiliationsCountry/RegionTPTCTC/TP
1University of New South WalesAustralia463457.50
2University of Naples Federico IIItaly2436415.17
3Norwegian University of Science and TechnologyNorway231426.17
4University of MinhoPortugal201758.75
5Sapienza University of RomeItaly171388.12
6Curtin UniversityAustralia151379.13
7University of PisaItaly1418513.21
8Tongji UniversityChina131249.54
9The University of MelbourneAustralia131138.69
10The University of SydneyAustralia131078.23
11Ryerson UniversityCanada13987.54
12The Hong Kong Polytechnic UniversityChina13755.77
13Rzeszow University of TechnologyPoland13554.23
14Deakin UniversityAustralia13272.08
15Lund UniversitySweden12877.25
16Aalto UniversityFinland12695.75
17Delft University of TechnologyThe Netherlands12463.83
18University of FloridaUSA111029.27
19University of TriesteItaly11686.18
20Polytechnic University of BariItaly11615.55
Table 6. Most productive countries/regions.
RCountry/RegionTPSCP/SRPMCP/MRPTCTC/TP
1Italy2091723720859.98
2USA114892511189.81
3Australia10571347417.06
4United Kingdom9870289079.26
5Poland797272523.19
6China7348251532.10
7Portugal534582875.42
8Sweden5040103166.32
9Canada4837113517.31
10Spain423391914.55
11New Zealand292542498.59
12Finland281991665.93
13Germany2716111666.15
14Japan241771385.75
15France221392049.27
16Korea22202241.09
17Norway221931084.91
18Saudi Arabia211651547.33
19Greece18162633.50
20Indonesia171341388.12
Abbreviations: SCP/SRP = Single Country Production/Single Region Production; MCP/MRP = Multiple Country Production/Multiple Region Production.
Publisher’s Note: MDPI stays neutral with regard to jurisdictional claims in published maps and institutional affiliations.

