1. Introduction
In 2021, the United Nations Refugee Agency reported that there were currently 82.4 million people worldwide forcibly displaced, of which 20.7 million were refugees [
1]. Without any proper mitigation, the World Bank predicted that the number of climate migrants from Africa, Asia, Eastern Europe, the Pacific and Latin America could reach 216 million by 2050 due to global warming and climate change [
2].
Global warming, together with extreme climates, is arguably the most important contemporary issue facing humanity. Coupled with man-made conflicts, mass displacement of human populations is an urgent humanitarian crisis. In addition to food and water, sustainable temporary shelter for the displaced is a major component in providing short-term relief, in accordance with the United Nation Sustainable Development Goal of sustainable cities and communities (SDG 11).
Temporary shelter is generally defined as a shelter where displaced persons can reside temporarily for between six months and three years. In practical situations, residents often stay for a period of more than five years. Hence, the indoor thermal comfort of the temporary shelter needs to be properly considered in the design in order for residents to live comfortably and with dignity.
2. Literature Review
Various studies in the literature have examined the design, materials usage, cultural and social impacts, health influences, life-cycle analysis and indoor air quality of temporary shelters, as well as the associated cost decisions [
3,
4,
5,
6,
7,
8]. Manfield et al. [
9] examined the addition of liners to tents in order to improve their insulation in cold weather conditions. The results showed that the total heat lost could be reduced by half, although internal moisture build-up increased correspondingly. Furthermore, the usage of liners increased the tents’ total volume, logistically constraining their employment. Crawford et al. [
10] analyzed two curved tent prototypes using glass fiber insulation and a hydrophilic membrane, under weather conditions of −20 °C and with six occupants. The experimental results showed that the indoor temperature increased with height, reaching a maximum of 21 °C and 19 °C, respectively.
Huang et al. [
11] performed computational simulations based on a community of single-story prefab housing made of expandable polystyrene boards, to determine the influence of housing length on outdoor wind velocity. The results showed that in the summer, with parallel prevailing winds, the outdoor wind velocity was highest when the house length was longest with 12 rooms. Borge-Diez et al. [
12,
13] conducted a computational fluid dynamics analysis of a temporary shelter of 28 m
2 for ten occupants, using concrete as the building material. Among eight simulated cases, the configuration of open windows for natural ventilation, a cool roof to increase reflectivity and an open roof to improve stack ventilation were found to provide the best thermal comfort results.
Shinohara et al. [
14] conducted experiments and surveys to determine the thermal comfort of 19 temporary shelters in Minamisoma City after the Great East Japan Earthquake. Among the three types of temporary shelters (prefabricated with steel plate walls, prefabricated with ceramic panel walls and log houses), surveys showed that respondents were thermally comfortable in summer and winter for all three types. However, experimental data showed that the log houses achieved better thermal comfort than the prefabricated housing. Nguyen and Reiter [
15] determined an optimized model of a single-level low-cost dwelling with four occupants. A total of 21 design variables and 9 optimized models were determined, based on three locations: Hanoi, Danang and Ho Chi Minh City in Vietnam, using Fanger’s comfort model and adaptive comfort model. Fantozzi et al. [
16] analyzed a temporary shelter built from a modular steel frame and multi-layer stratified prefabricated walls under both summer and winter conditions, determining an optimized configuration of wall materials for thermal comfort.
Honma [
17] defined a theoretical model of the emergency temporary shelters in Rikuzentakata City, Japan, to determine the influence of air ventilation on moisture build-up. With a floor area of 29.16 m
2, 7 cases of temporary shelters with 83 leakage openings and 47 envelopes were analyzed. The results showed that the application of mechanical pressurized supply ventilation within the attic was most effective in reducing moisture build-up. Huang et al. [
18] conducted experiments in prefabricated temporary shelters established after the Wenchuan earthquake. The results showed that the interior air temperature reached 37.5 °C during the summer, with interior surface temperatures reaching 44.4 °C. These harsh living conditions are not suitable for long-term living. Kim et al. [
19] conducted experiments on a temporary shelter named the mobile energy shelter, which had a floor area of 31.5 m
2 and was located in Mu-ju, South Korea. Results showed that the ASHRAE thermal comfort zone was achieved for 60% and 80% of the day under natural conditions in the summer and winter, respectively.
Both Elrayies [
20] and Asfour [
21] considered the thermal performance of shipping containers used as temporary shelters. Without any external insulation, interior air temperatures reached over 44 °C in the afternoon, but with additional insulation, the interior air temperature could be lowered to 28 °C. However, this would significantly increase the construction load and mobility of these temporary shelters.
Albadra et al. [
22] investigated living conditions at Azraq and Zaatari refugee camps in Jordan. The results showed that the interior air temperature of a temporary shelter reached 40.0 °C in the summer, and the authors concluded that the thermal comfort of temporary shelters needs to be further evaluated in order for the tens of millions of residents to be lodged with dignity. Distefano et al. [
23] examined temporary shelters constructed from alveolar corrugated cardboard panels under Mediterranean summer climatic conditions. The results showed that an average exterior air temperature of 30 °C produced an average interior air temperature ranging from 38 °C to 40 °C. Thapa et al. [
24] examined 855 different temporary shelters after the Nepal earthquake. As most of the temporary shelters were made of zinc or tarpaulin sheets with low thermal resistance, the interior air temperature tended to be two to five degrees higher than the ambient air temperature. Surveys were conducted, and residents confirmed that interior conditions were too hot in summer and too cold in winter.
Similarly, Thapa et al. [
25] examined six different types of temporary shelters during the winter in Nepal. During the night, the mean interior and exterior air temperatures were 10.3 °C and 7.6 °C, respectively. Furthermore, about half of the time, interior air temperatures were below the acceptable value of 11 °C, confirming the harsh living conditions. D’Orazio and Maracchini [
26] conducted experiments to determine the thermal characterization of a temporary shelter made from reinforced EPS panels. Interior air temperatures reaching 33 °C were observed during the hot afternoons, and the night-time temperatures were significantly 10 °C higher than the ambient temperature of 15 °C. Park et al. [
27] examined a flexible modular temporary shelter under various climatic conditions. The results showed that airtightness was poor, and artificial heating and cooling were required to maintain thermal comfort. This showed that naturally ventilated and thermally comfortable temporary shelters are currently still not achieved, and this is therefore an area for continued research. Moreno-Sierra et al. [
28] simulated the thermal performance of a temporary shelter using ceramic bricks, concrete, super board panels, mixed plastic and concrete blocks, 100% recycled plastic (PET) and textile fiber in the climates of a Caribbean island, an inland-mountain location and a tropical humid coastal region. With an exterior air temperature of 32 °C during the summer, the results showed that plastic PET bricks achieved better indoor thermal comfort.
In general, detailed examination of temporary shelters for displaced refugees and survivors of disasters in terms of thermal comfort were lacking, under different climate conditions and in different seasons. Preliminary feedback from disaster sites showed that most temporary shelters faced the issue of poor indoor thermal comfort, being too hot in summer and too cold in winter. This paper aims to examine in detail the interior thermal comfort of a temporary shelter constructed from polycarbonate boards and steel frames, under the subtropical climatic conditions of Taiwan’s summer, to serve as a baseline for future modification of thermally comfortable lightweight temporary shelters.
3. Materials and Methods
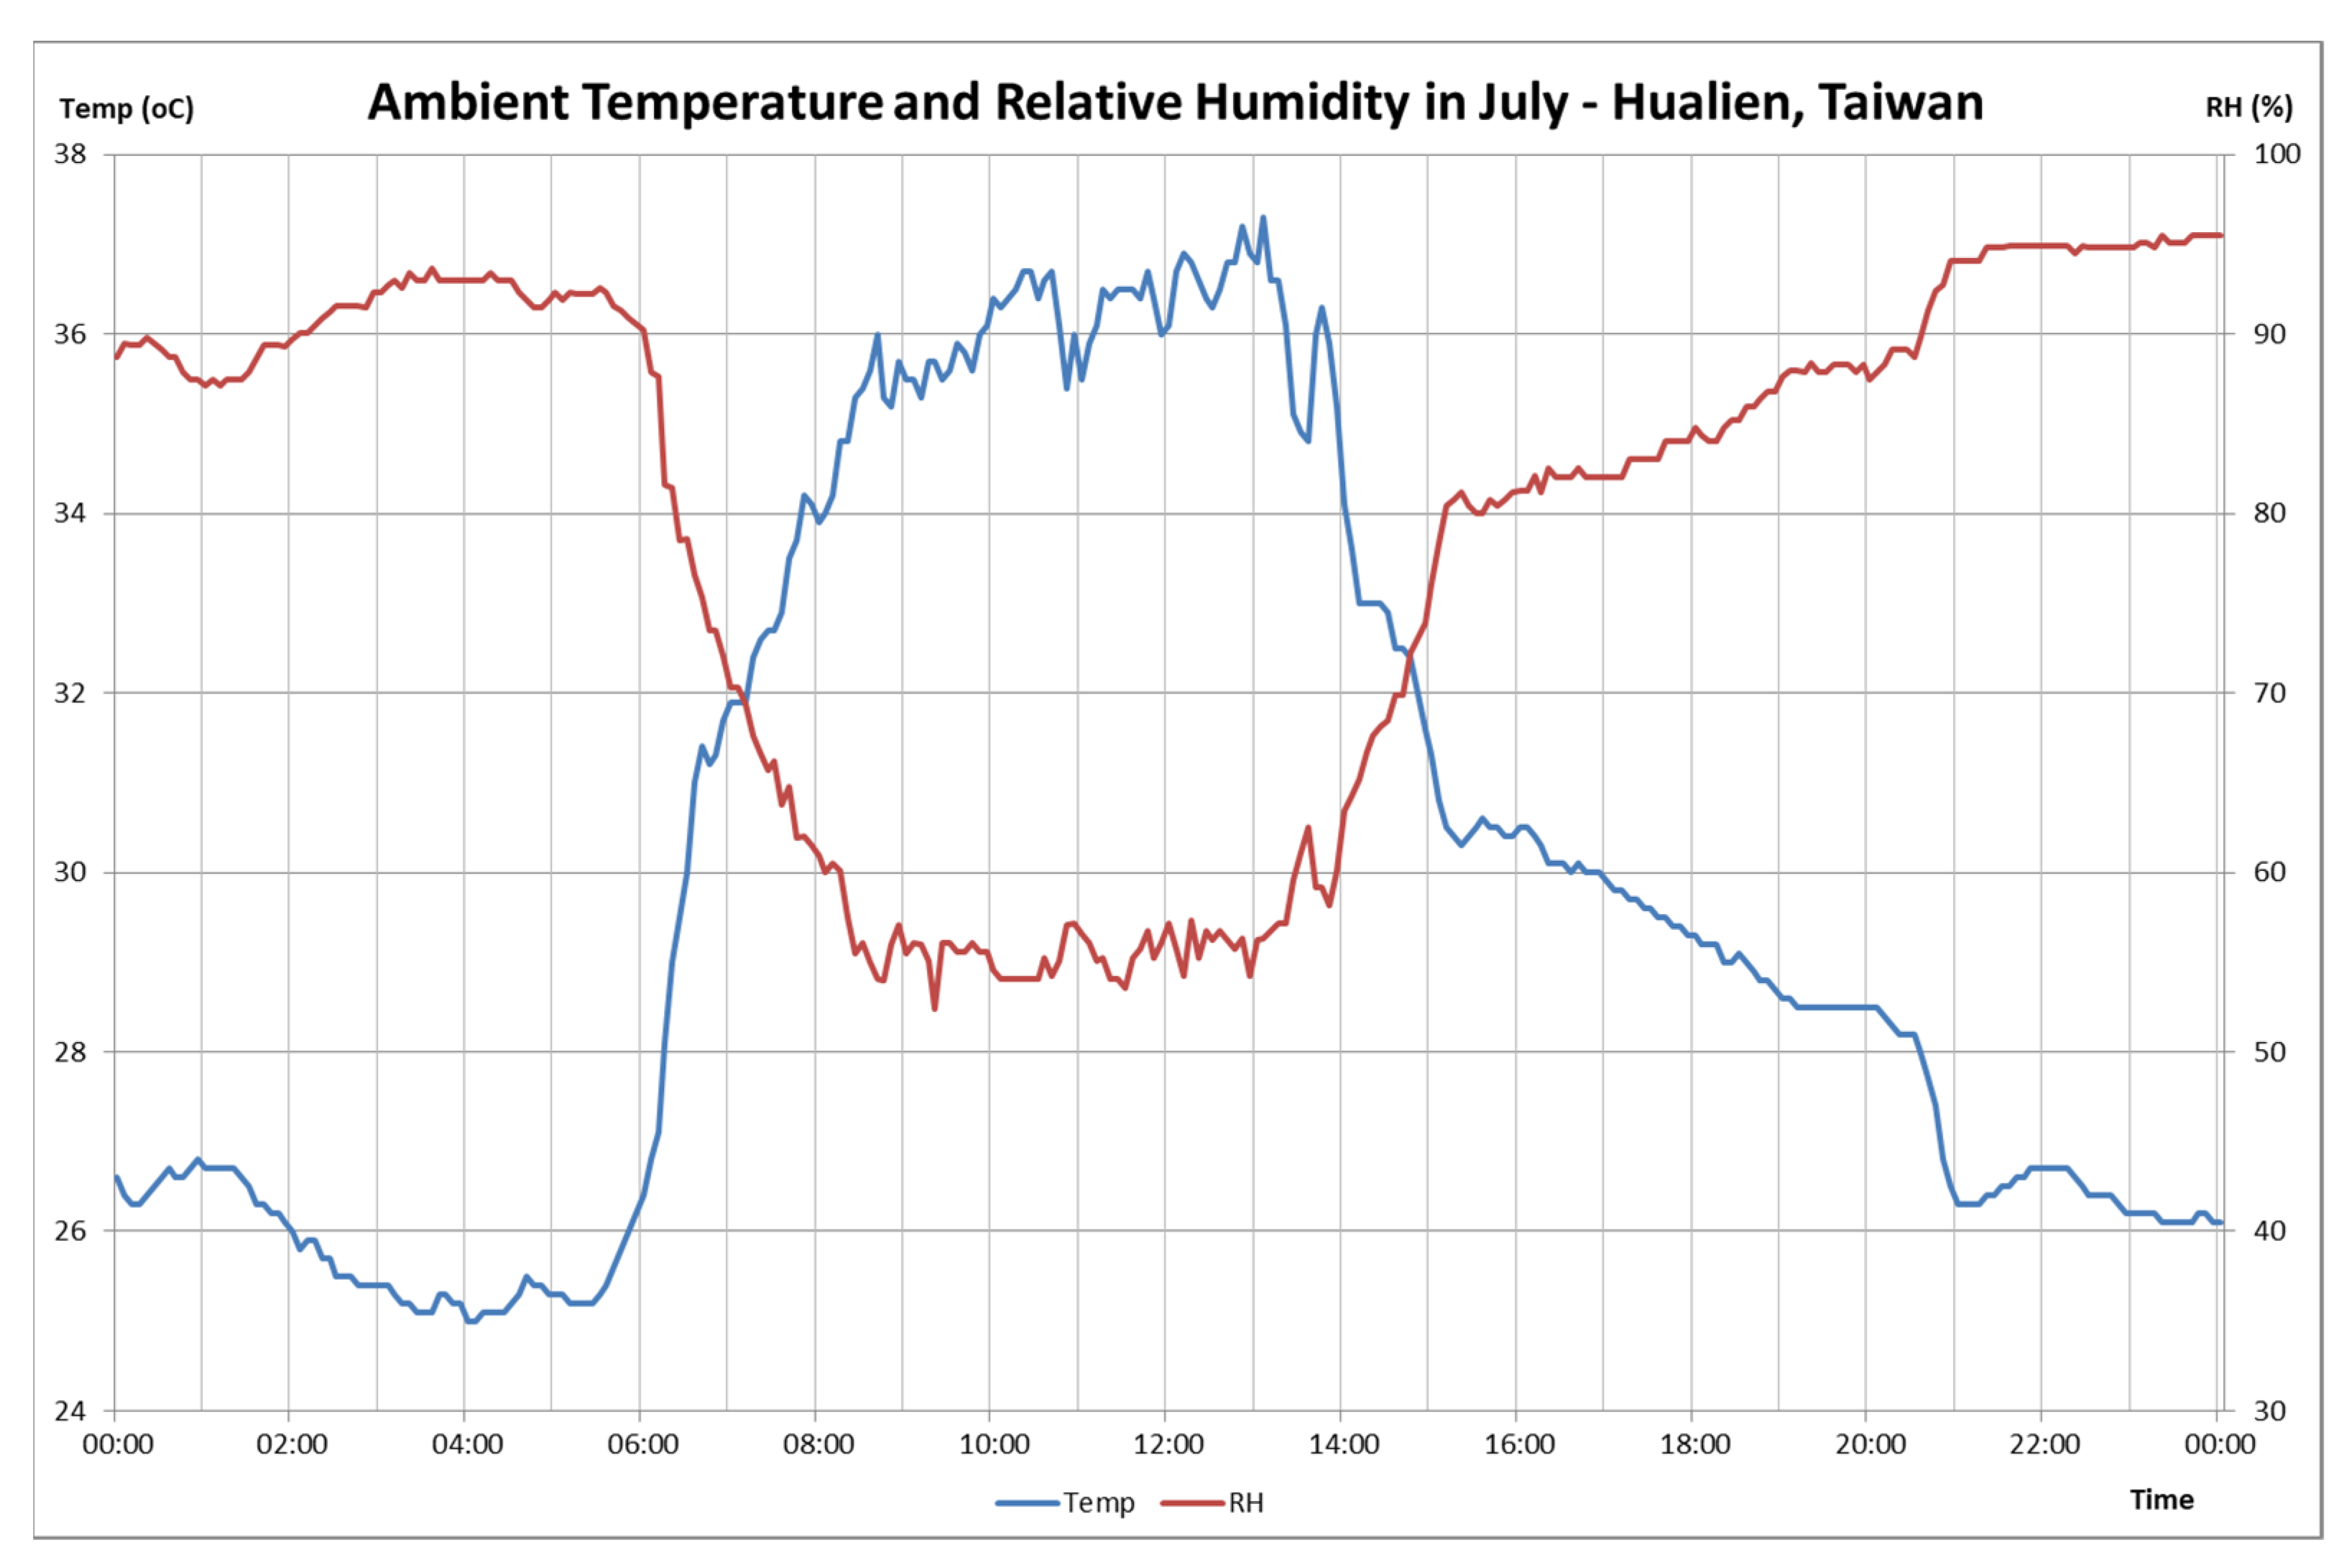
Under subtropical climatic conditions, Taiwan’s summer occurs between May and October, with typical outdoor air temperatures reaching a high of 37 °C at noon and a low of 25 °C during the early morning between 04:00 and 05:00. Relative humidity ranged from 80% RH to 100% RH during the night and 50% RH to 70% RH in the afternoon, as shown in
Figure 1. However, with global warming, the summer temperatures of Taiwan have been steadily increasing, reaching 39.7 °C in Taipei [
29] in recent years. The examination of thermal comfort in temporary shelters, against this backdrop of an extreme climate, could serve to ensure that residents can survive comfortably in the event of climate-induced disasters.
The indoor thermal comfort of the analyzed temporary shelter was determined according to the predicted mean vote (PMV) and predicted percentage dissatisfied (PPD), as shown in Equations (1) and (2), respectively, using the CBE Thermal Comfort Tool [
30] defined by ASHRAE 55-2017 [
31] and a moderate expectancy factor of 0.8, in accordance with non-air-conditioned buildings [
32]. The range of acceptable thermal comfort is defined by PMV values ranging between −0.85 and 0.85, with a PPD of 20%.
M: metabolic rate,
L: thermal load.
3.1. Dimensions of Temporary Shelters
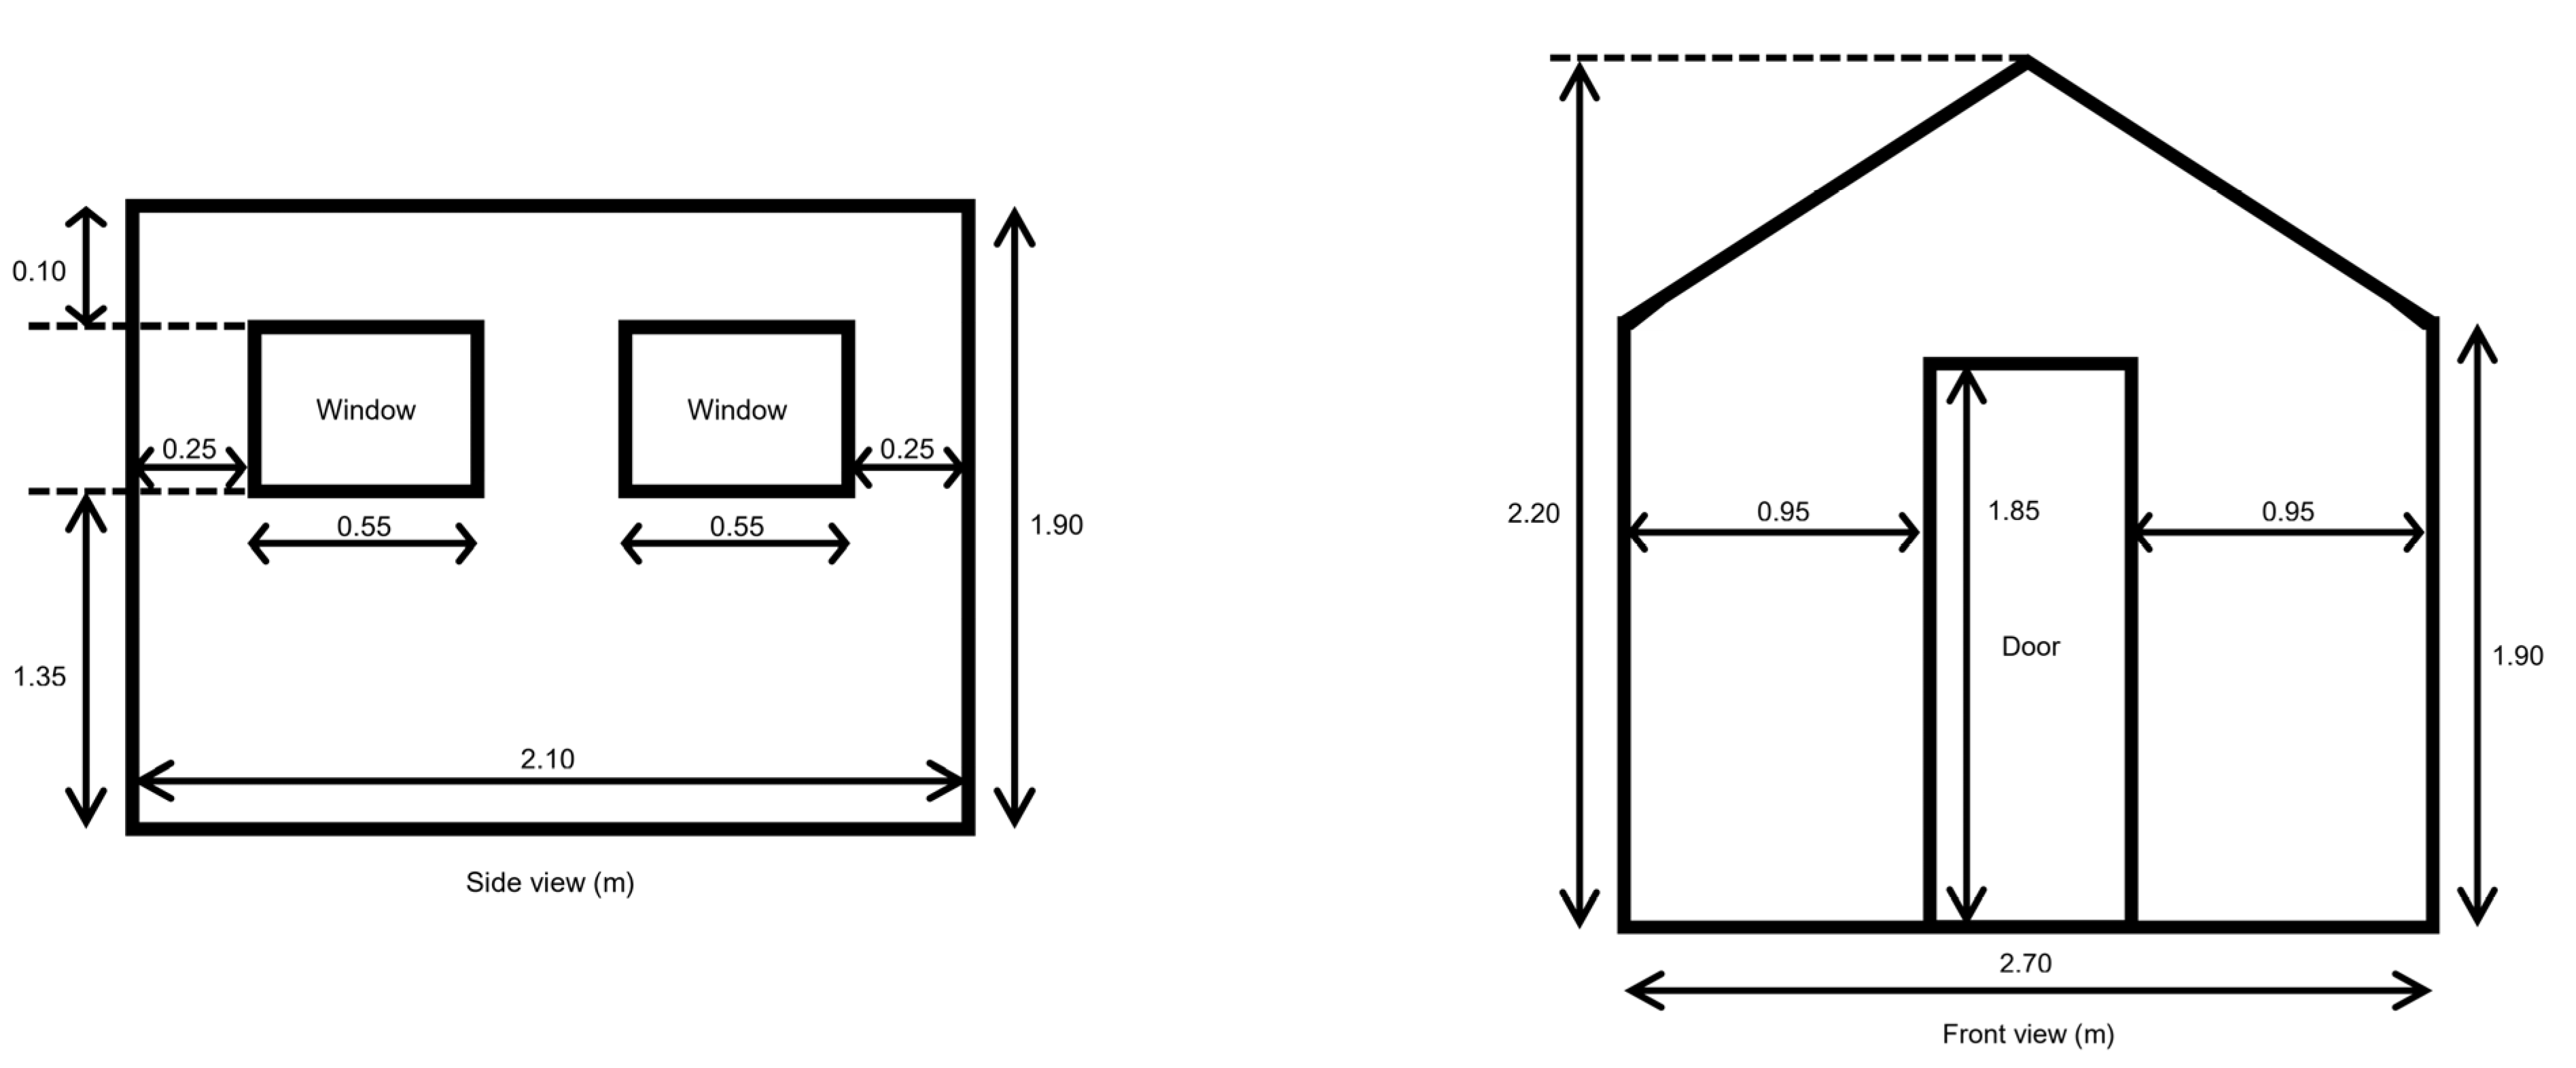
The temporary shelter (standard configuration) under examination measured 2.10 m in length and 2.70 m in width, with a height of 1.90 m and 2.20 m at its edge and mid-section respectively, giving a total volume of 11.62 m
3. Two top hung windows were placed on each of the sidewalls and a door opened in the front. All dimensions are given in
Figure 2.
The temporary shelter under test was situated in Hualien, Taiwan during the months of June and July. During the summer, Hualien experiences a tropical climate with temperatures ranging from 24 °C to 36 °C. Relative humidity ranges from 40% RH to 80% RH, with a wind speed of 0.5 m/s to 1.5 m/s. As the solar path during Taiwan’s summers tilts towards the south, the temporary shelter was situated facing 30 degrees southwest to avoid the morning sun. There was no direct solar radiation within the interior and the mean radiant temperature was assumed to be the same as the air temperature [
33,
34].
The temporary shelter (including door and windows) was assembled using polypropylene board with a thickness of 0.01 m, a density of 150 kg/m2, a specific heat capacity of 1680 J/kg·K and a thermal conductivity of 0.2 W/m·K. The temporary shelter’s thermal comfort was compared with tents typically distributed during disaster relief. The tent used for comparison had a similar volume, with almost negligible thermal mass, and hence tended to heat up or cool down rapidly, making it almost thermally impossible to stay in during the hot afternoons or cold nights. As canvas degrades rapidly under exposure, tents stay intact for hardly more than a year.
3.2. Experimental Configurations
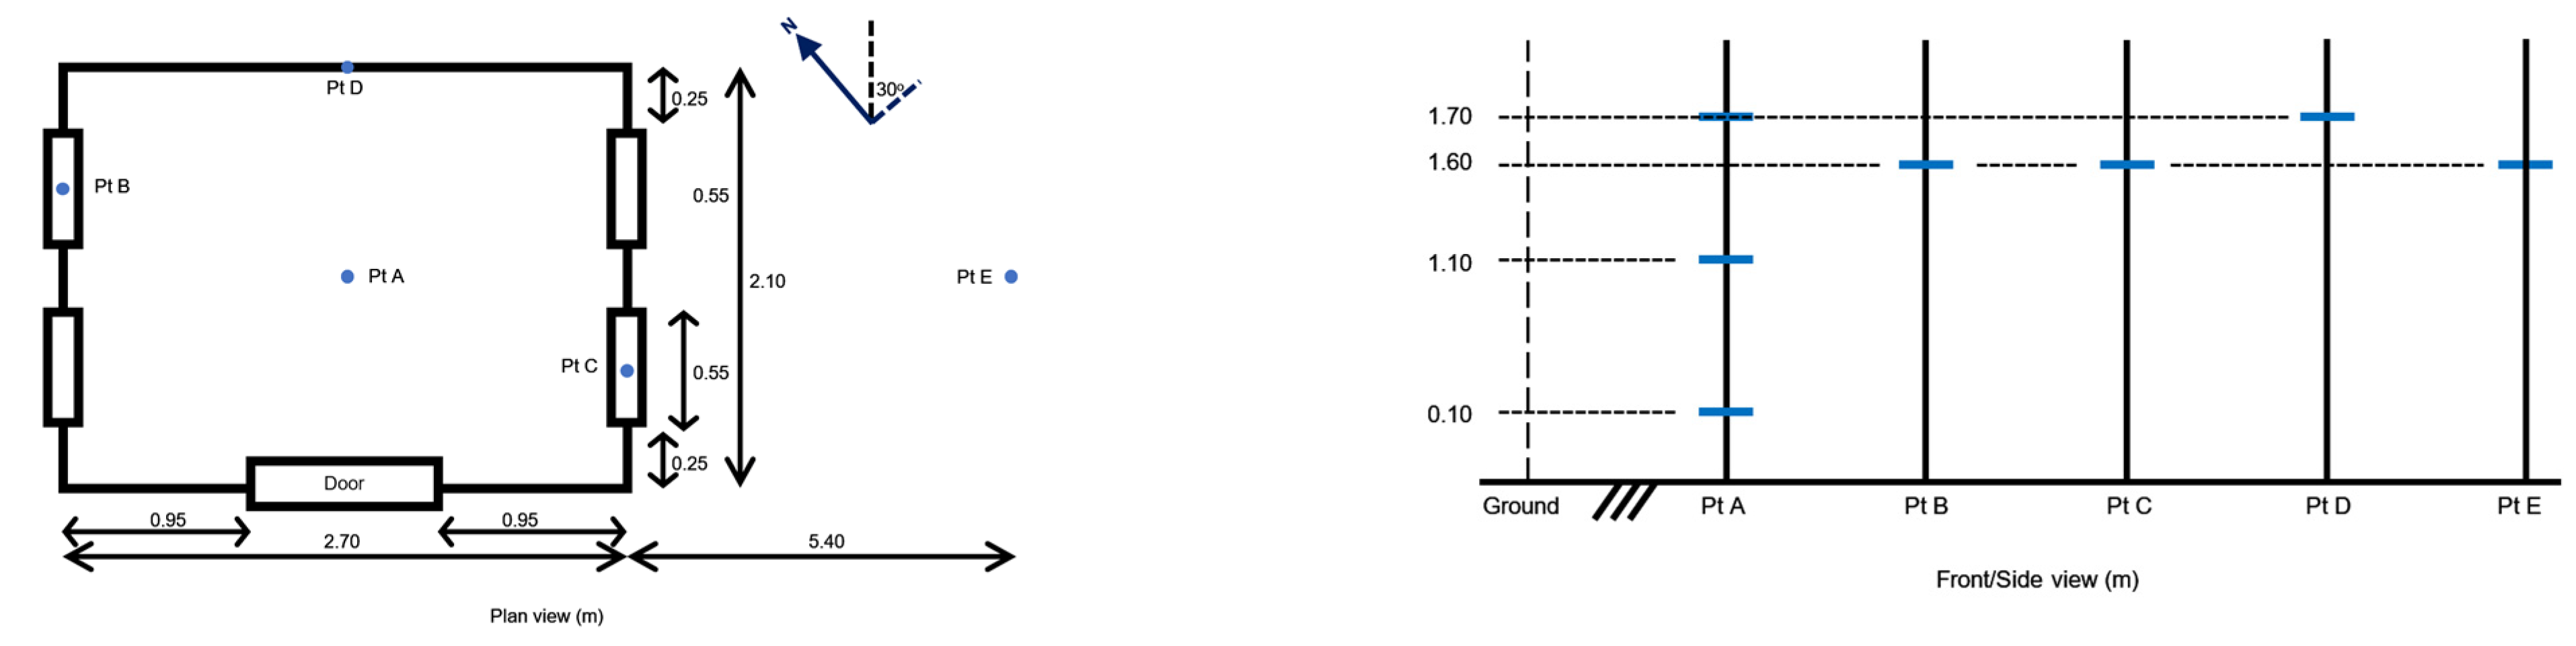
Elitech RC-4 temperature and humidity data loggers with a temperature accuracy of ±1.0 °C and resolution of 0.1 °C, along with relative humidity accuracy of ±3% RH and resolution of 0.1% RH, were used to measure temperatures and relative humidity values, respectively. Extech hot wire anemometers, with an accuracy of ±5% and resolution of 0.01 m/s, were used for indoor air-speed measurements. These sensors were periodically calibrated under a common indoor temperature, relative humidity and air speed, giving measurement errors of ±0.5 °C, ±1% RH and ±0.05 m/s, respectively. The equipment was secured on customized stands and placed at various positions above the ground, as seen in
Figure 3.
At Point A, readings were taken at the occupant’s ankle level (0.10 m), sitting level (1.10 m) and standing level (1.70 m) at the center of the temporary shelter. At Points B and C, readings were taken at the center of each window on the sidewalls. At Point D, readings were taken at the back wall, while at Point E, ambient outdoor readings were taken at a distance twice the width of the temporary shelter. All four windows and the door were kept open.
The indoor thermal comfort analysis and ambient readings (at Point E) were analyzed at four-hourly intervals (00:00, 04:00, 08:00, 12:00, 16:00 and 20:00) as readings vary throughout the day. Data were collected at intervals of five minutes and averaged over a period of one hour; for example, the average value at 04:00 was calculated from the 13 values collected from 03:30 to 04:30.
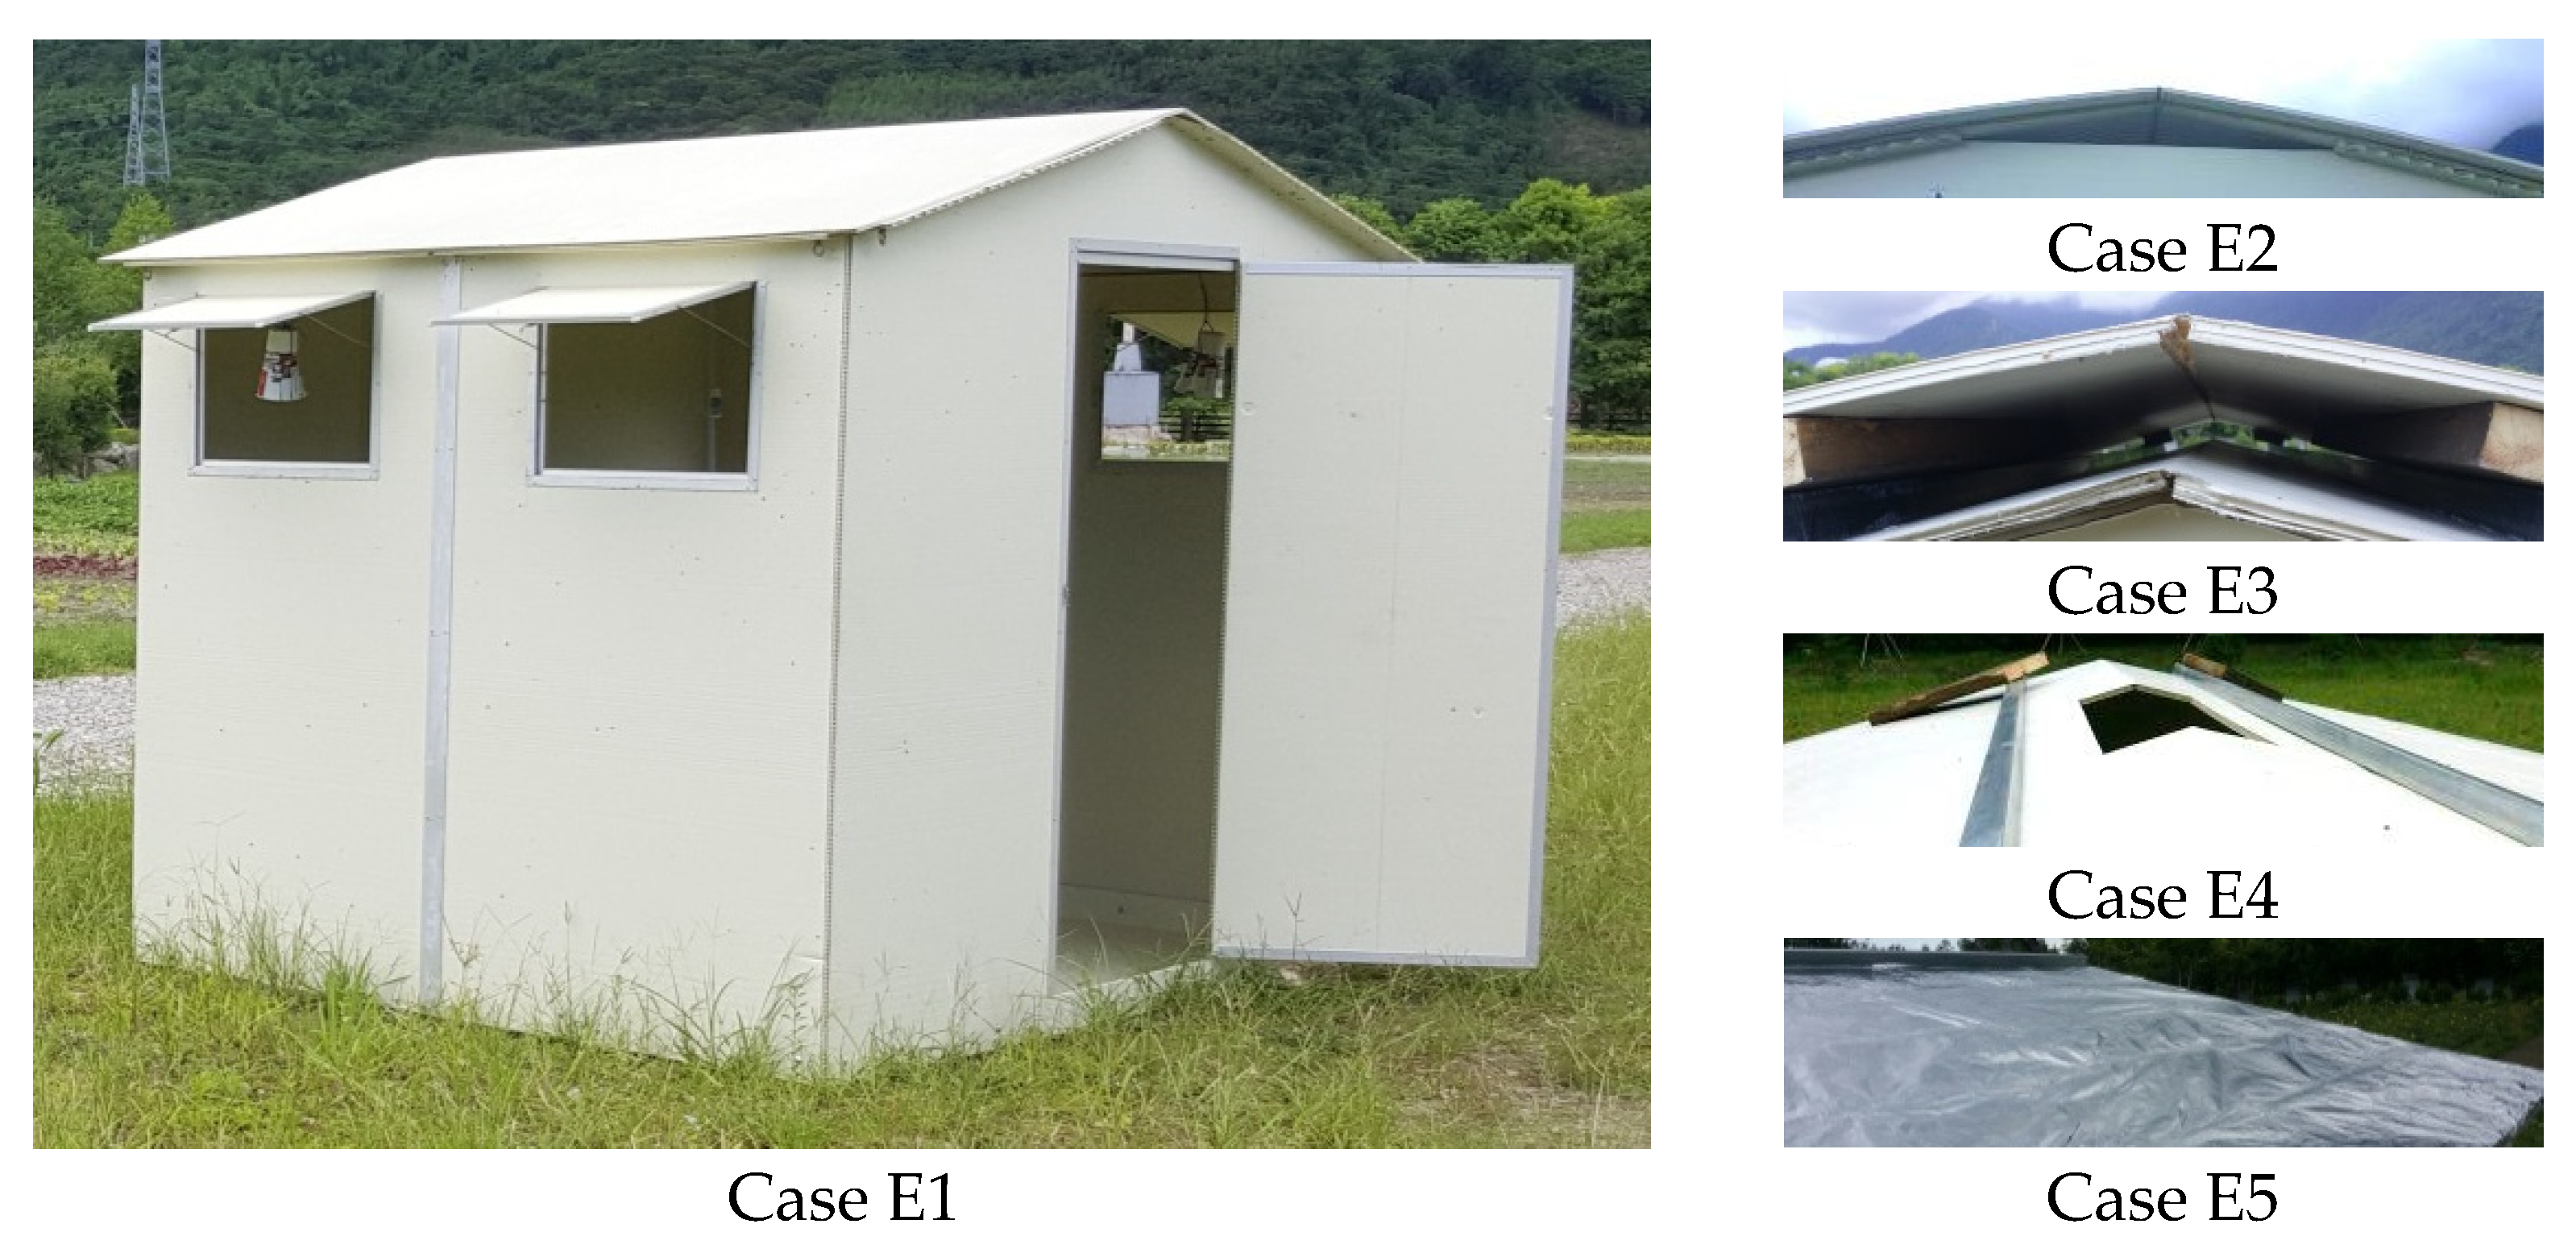
Most of the experimental data were acquired under the standard configuration. However, several different configurations were also examined, as shown
Table 1 and
Figure 4, in an attempt to improve the thermal comfort. To improve air movement using stack ventilation, in Case E2, a triangular opening measuring 0.10 m in height and 0.90 m in width was installed just below the roof on both the front and back walls. To improve roof insulation, in Case E3, two layers of roofing were employed with an air gap of 0.10 m. To improve air movement using stack ventilation, in Case E4, a rectangular opening of 6.00 m
2 was directly installed in the middle of the roof. Finally, in Case E5, the outer roof surface was covered with a reflective layer to improve insulation by reducing heat transfer from radiation.
3.3. Computational Configurations
As experimental configurations of the temporary shelter were time-consuming and limited by availability of equipment, the CFD software Fluent 2020 R2 [
35] was employed for further in-depth study of thermal comfort. The steady-state Navier–Stokes and energy equations were solved numerically using the pressure-based solver, the k-epsilon standard turbulence model and a standard wall function. The boundary conditions were determined from the experimental data.
The standard configuration (Case C1/E1) was first solved numerically, as a verification of the computational model. Next, several different configurations were further examined, as shown in
Table 2. In Case C2, the influence of keeping the door opened or closed was examined. Case C3 acted as the computational model for Case E3, while in Case C4, the effect of directly installing a fan at the window, providing a mechanical air speed of 1.5 m/s, was examined. Finally, in Case C5, the effect of closing one of the two windows on the sidewalls, creating a diagonal cross flow, was investigated.
4. Results and Discussions
4.1. Comparison between Tent and Standard Configuration
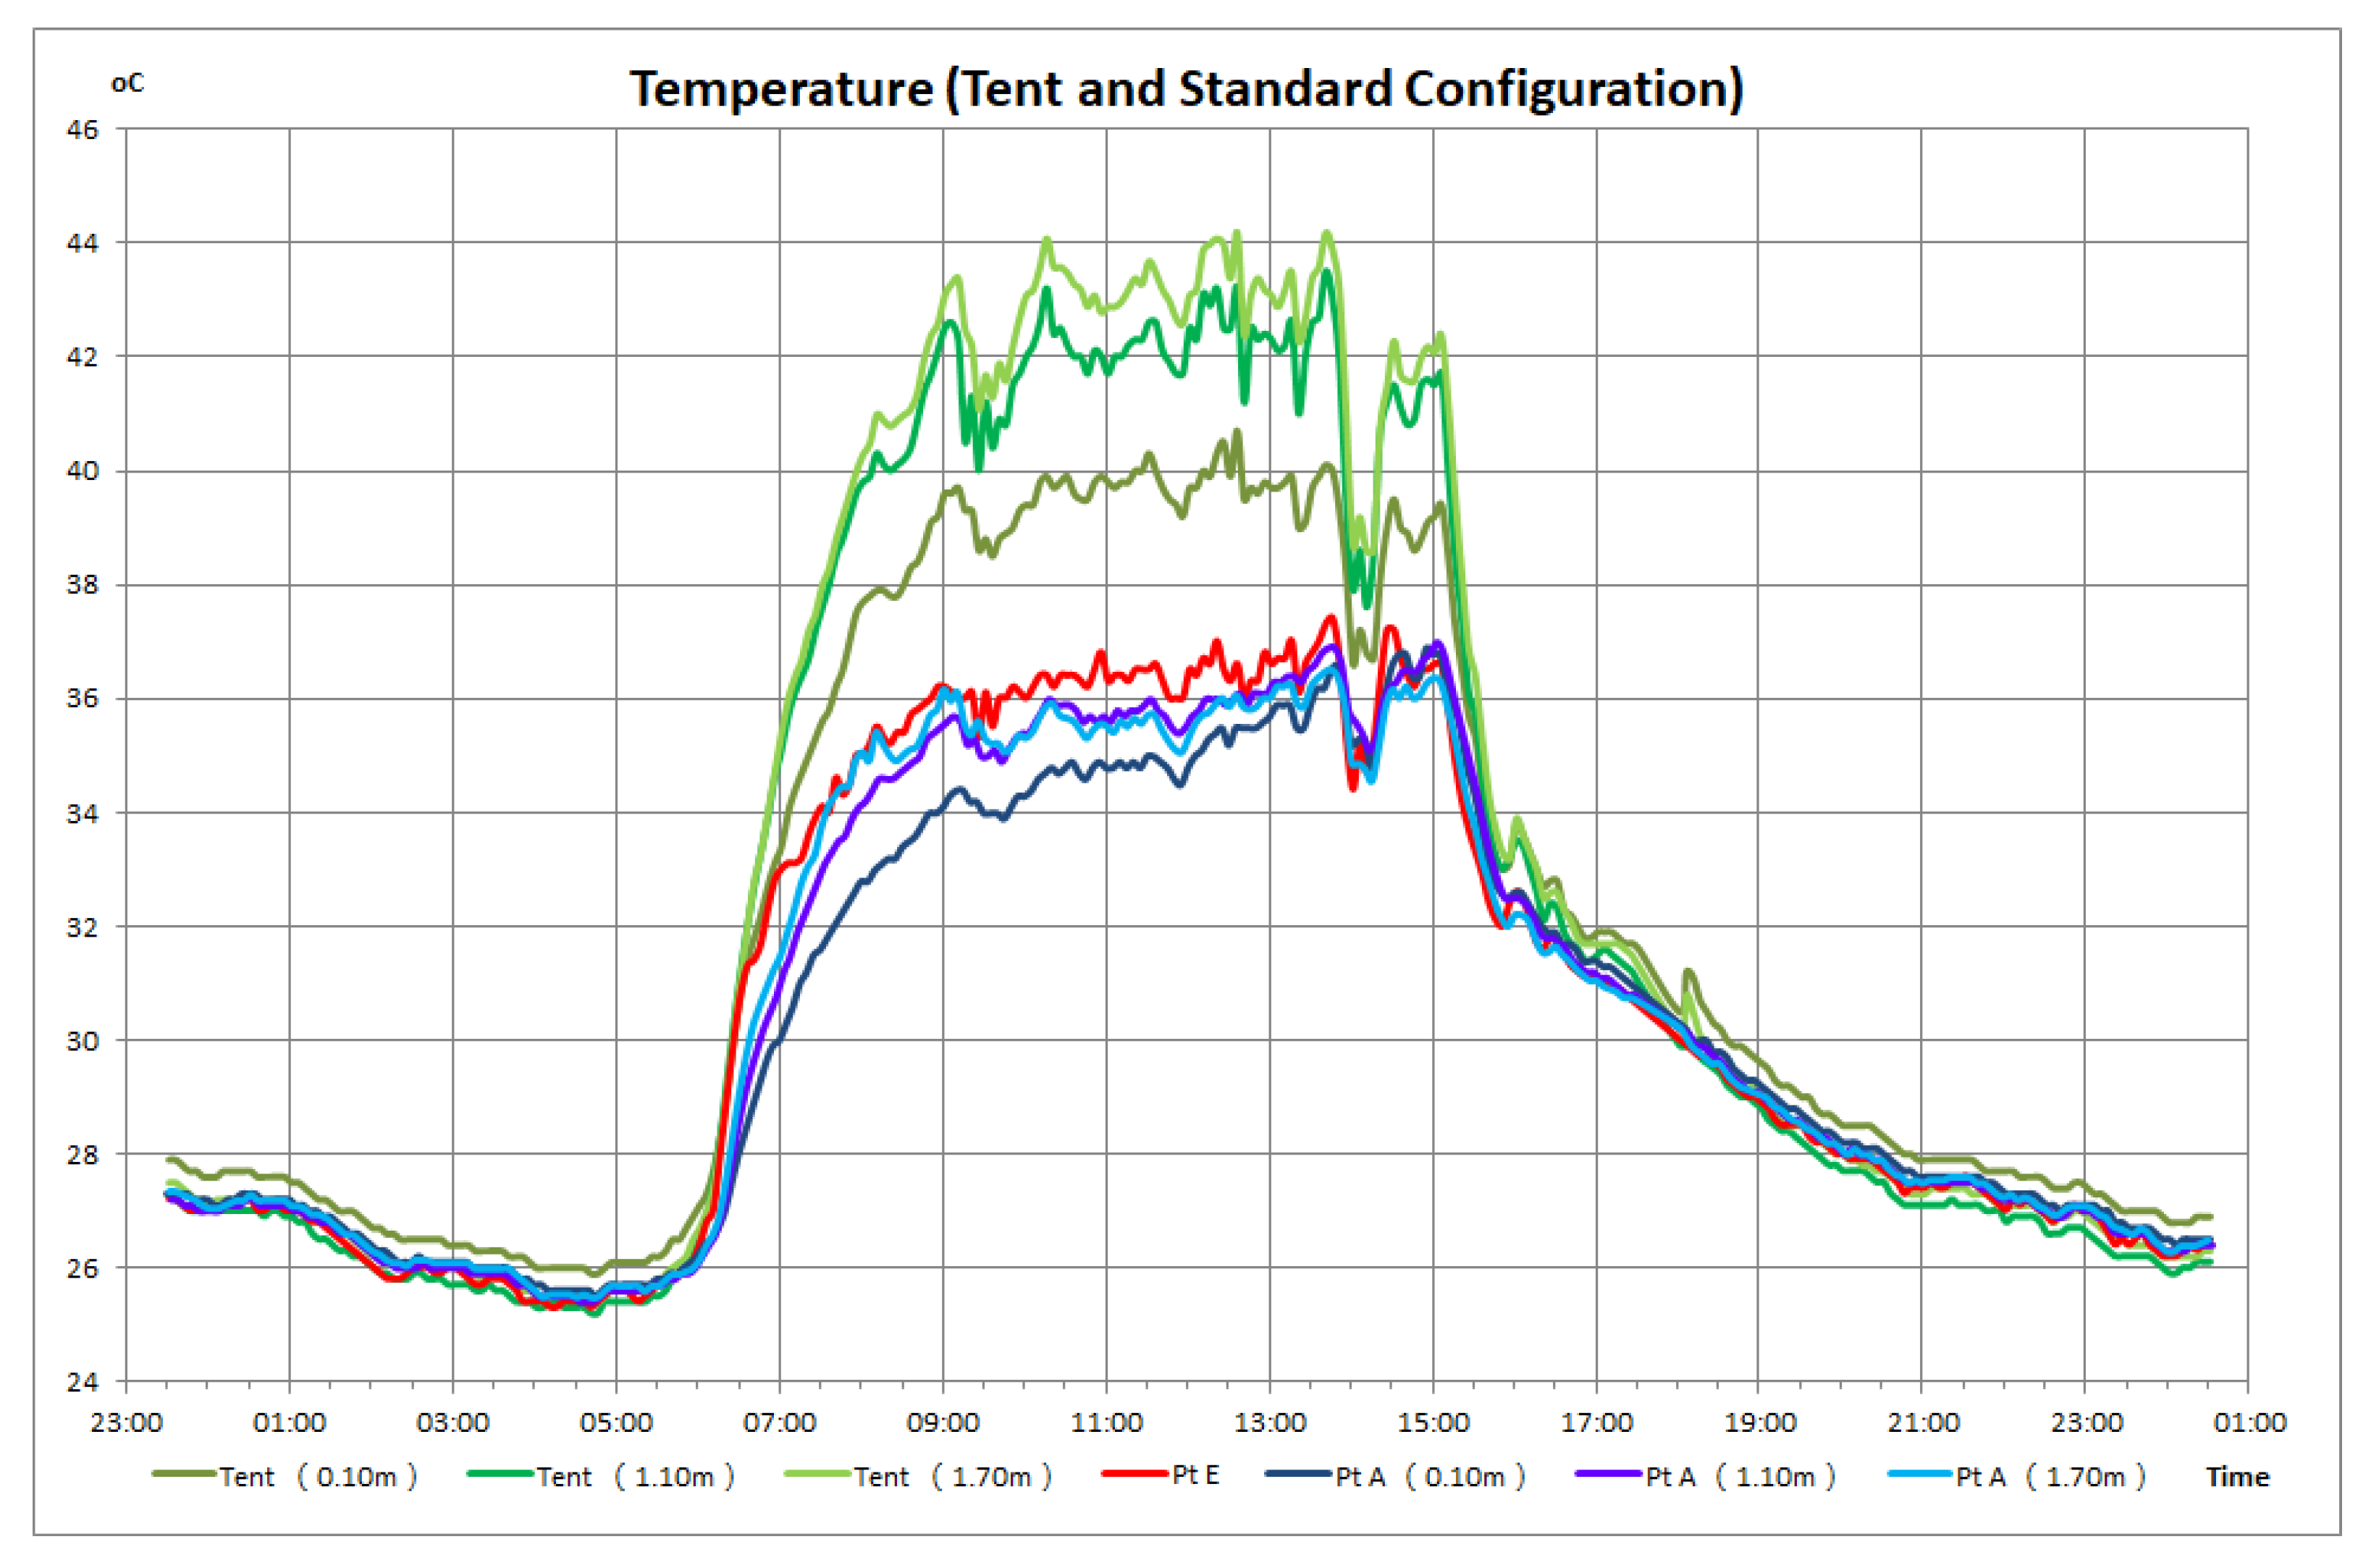
The air temperatures of the temporary shelter (standard configuration, E1) and tent during a typical hot summer day are shown in
Figure 5. Generally, the trend of air temperatures followed that of the ambient air temperature. The air temperatures of both the tent and standard configuration were similar to the ambient air temperature during the period from the late afternoon (after 16:00) into the early morning (before 06:00), reaching its lowest at 04:45, at a temperature of 25.2 °C.
During the daytime, air temperatures of the tent and standard configuration started to increase and diverge. The ambient air temperature during the time period 09:30 to 14:30 ranged between 34.4 °C and 37.4 °C, reaching a maximum of 37.4 °C at 13:34. Air temperatures in the tent increased significantly, reaching a maximum of 44.2 °C at 13:40, at the central position 1.70 m above the ground. The sudden drop in temperature across all readings between 14:00 and 14:30 was due to passing cloud cover. The results obtained are similar to the published results of Cornaro et al. [
36]. On average, during the time period 09:30 to 14:30, air temperatures in the tent at positions 0.10 m, 1.10 m and 1.70 m above the ground were 3.1 °C, 5.5 °C and 6.0 °C higher, respectively, than the average ambient air temperature of 36.3 °C.
However, the air temperature in the standard configuration at Point A was generally lower than the ambient air temperature, reaching a minimum of 33.9 °C at 09:45 at Point A (0.10 m). The air temperatures of the standard configuration at Point A (1.10 m) and Point A (1.70 m) above the ground were similar and were 0.6 °C higher than at Point A (0.10 m). On average, during the time period 09:30 to 14:30, air temperatures in the standard configuration at Point A (0.10 m), Point A (1.10 m) and Point A (1.70 m) were 1.2 °C, 0.5 °C and 0.7 °C lower, respectively, than the average ambient air temperature of 36.3 °C. At 12:00, at Point A (1.10 m), the air temperature of the standard configuration averaged 35.6 °C, within the published ranges of 33.0 °C to 37.5 °C [
18,
26] but much lower than the reported ranges of 40.0 °C to 44.0 °C [
21,
22].
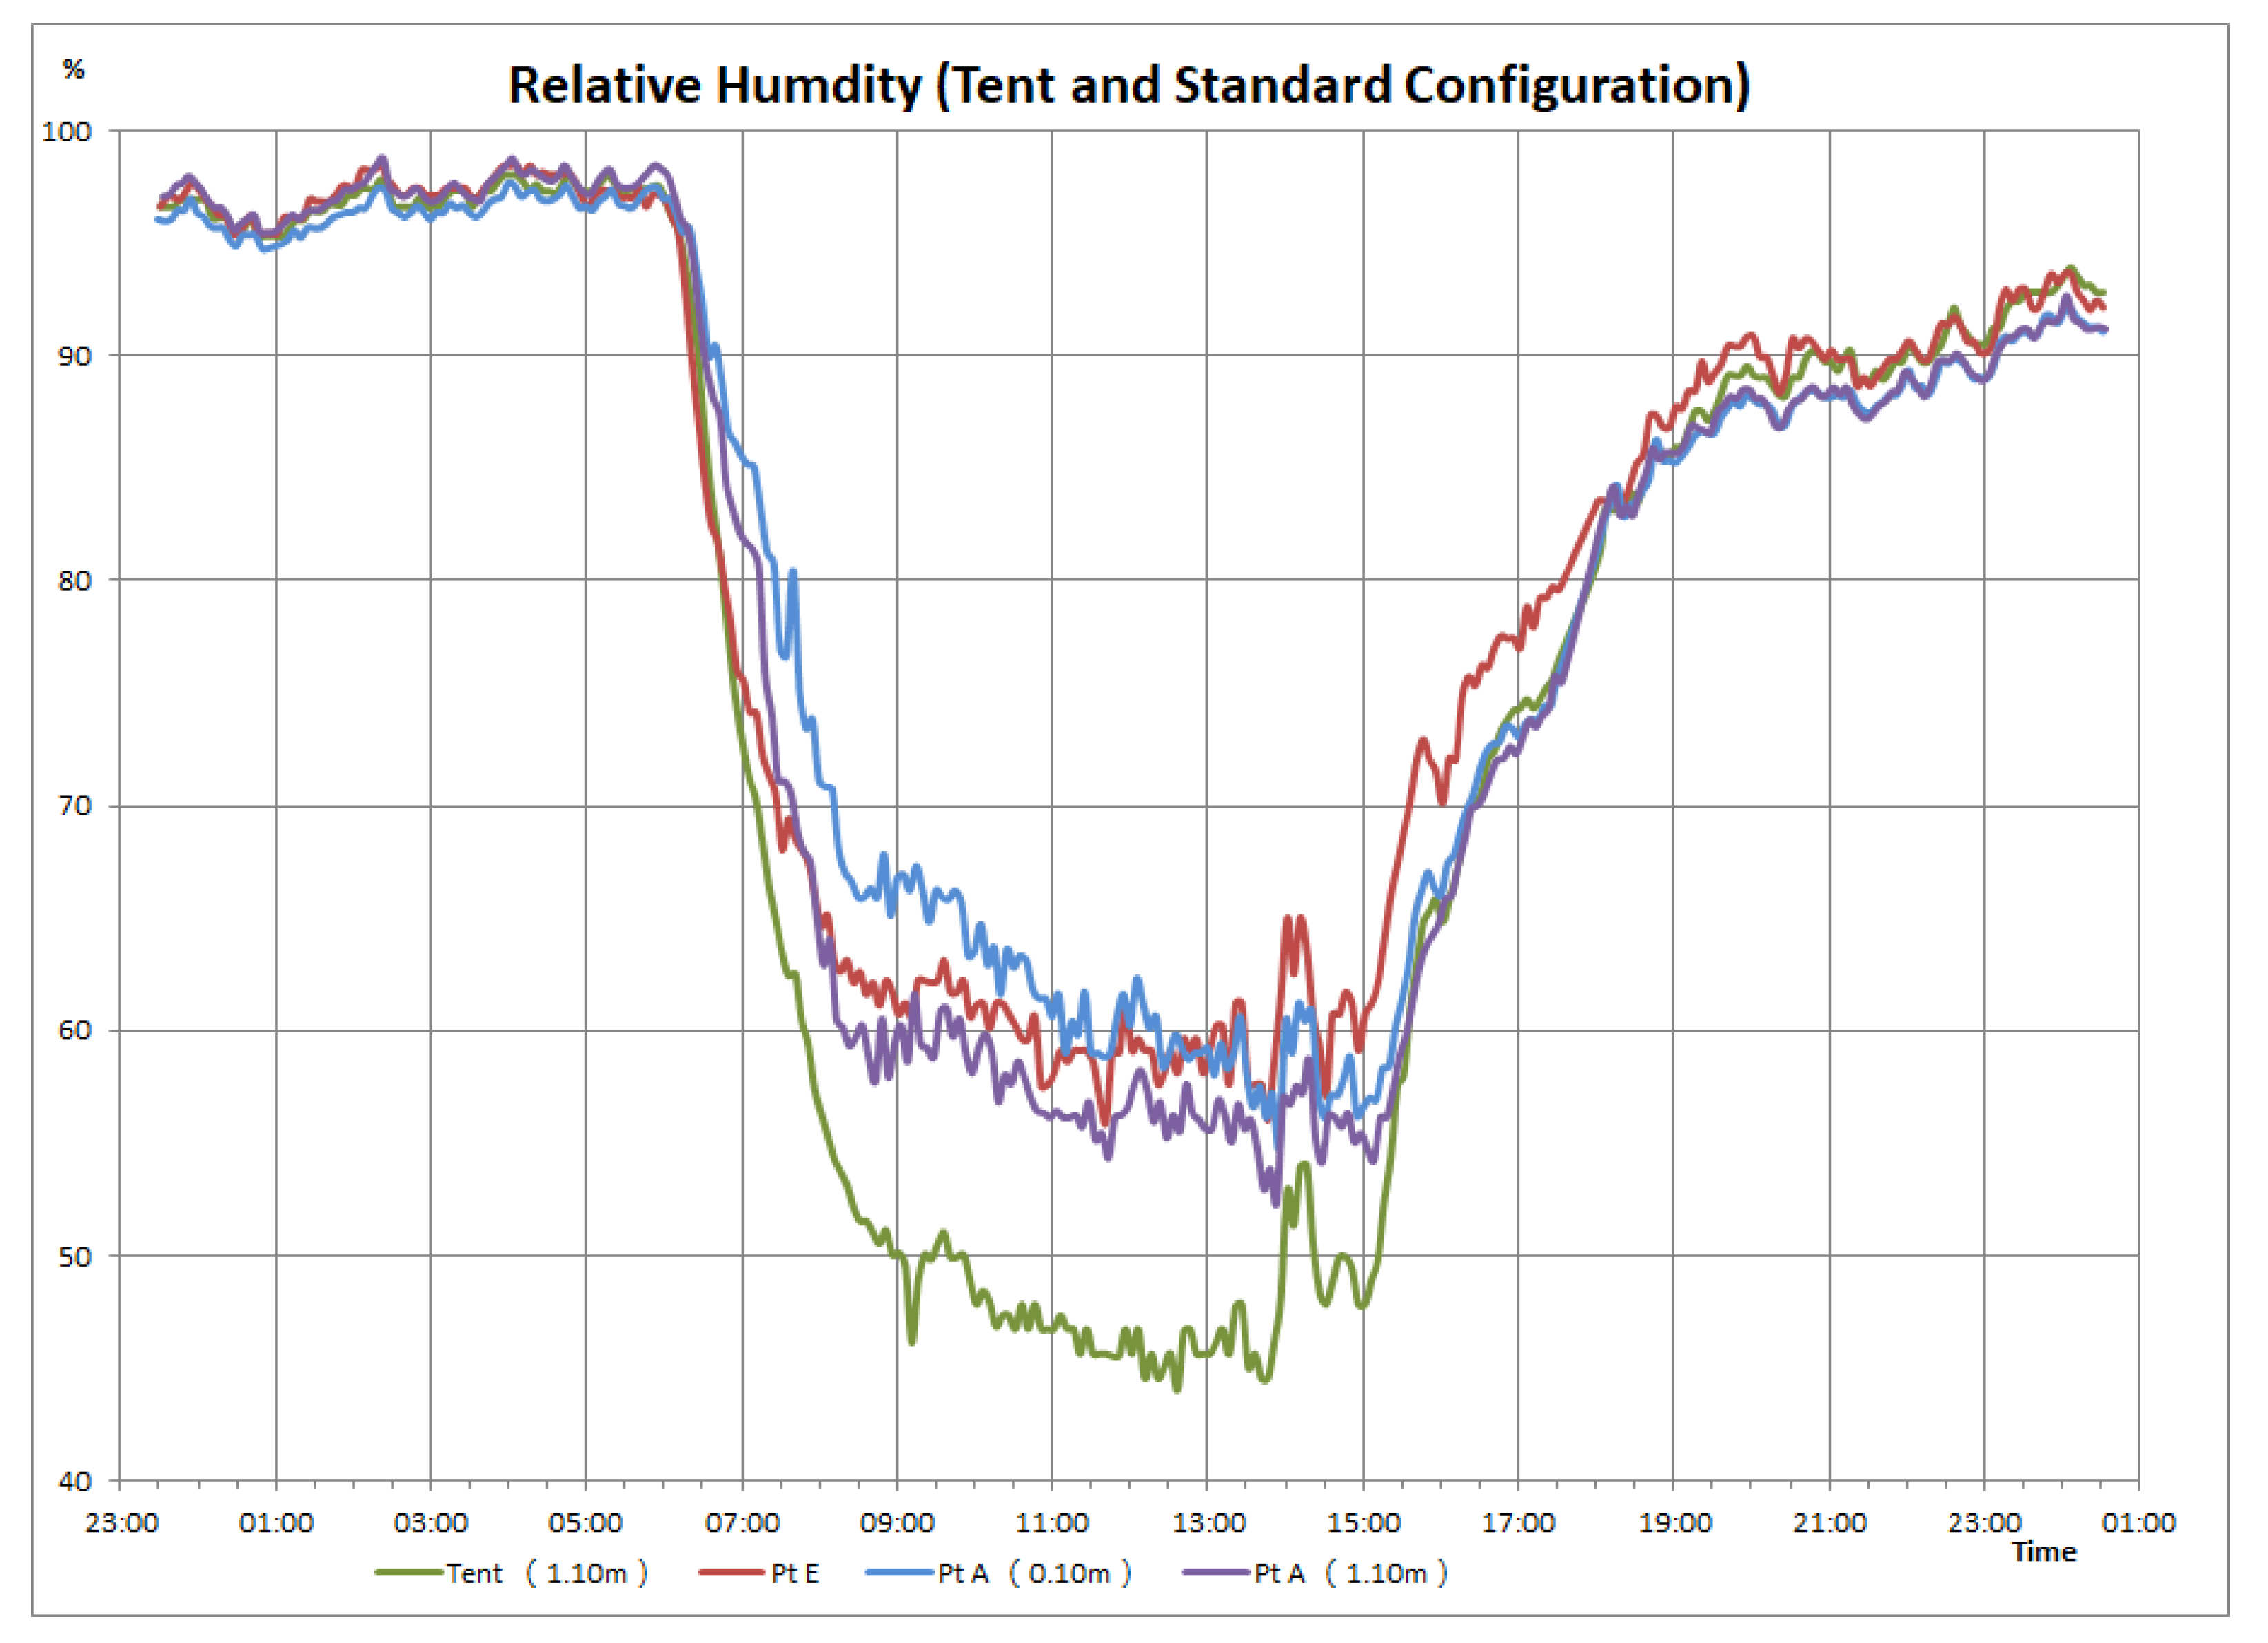
The tent’s and standard configuration’s relative humidity values during a typical hot summer day are shown in
Figure 6. The relative humidity values of both the tent and the standard configuration were similar to the ambient value during the period from the evening (after 19:00) into the early morning (before 06:00). During the day, the tent’s relative humidity and that of the standard configuration started to decrease and diverge. The ambient relative humidity during the time period 09:30 to 14:30 ranged between 55.9% RH and 65.0% RH, reaching a minimum of 55.9% RH at 11:40. The sudden increase in relative humidity across all readings between 14:00 and 14:30 was due to passing cloud cover.
The tent’s relative humidity decreased significantly, reaching a minimum of 44.0% RH at 12:35, at a position 1.10 m above the ground. On average, during the time period 09:30 to 14:30, the tent’s relative humidity at a position 1.10 m above the ground was 12.5% RH lower than the average ambient relative humidity of 59.7% RH. However, the relative humidity of the standard configuration at Point A was generally similar to that of the ambient. The relative humidity at Point A (0.10 m) was slightly higher due to the moisture from the ground, while the values at Point A (1.10 m) were slightly lower. On average, during the time period 09:30 to 14:30, the relative humidity values of the standard configuration at Point A (0.10 m) and Point A (1.10 m) above the ground were 0.8% RH higher and 3.0% RH lower, respectively, than the average ambient of 59.7% RH.
As seen in
Table 3, the ambient air speed averaged 0.90 m/s, while air speed within the tent averaged 0.10 m/s. For the standard configuration, the interior air speed was much higher at the windows (Point B and Point C) reaching 0.50 m/s, while at Point A (0.10 m) and Point A (1.10 m) readings were 0.15 m/s and 0.20 m/s, respectively. Point D, near the back wall registered zero air speed.
The PMV and PPD for the tent and standard configuration at various times of the day were calculated and averaged. For the standard configuration, as the air temperature and relative humidity were similar for Point A (1.10 m) and Point A (1.70 m), only data from Point A (1.10 m) were analyzed for thermal comfort. The metabolic rate was specified for seated and reading/writing activities, with a value of 1.0 met, while the clothing level was that of typical summer attire (i.e., short-sleeved shirt and walking shorts), and therefore a value of 0.36 clo was used, according to ASHARE recommendations [
31].
In
Table 4 and
Table 5, during the night-time (00:00, 04:00 and 20:00), the PMV and PPD values were within the ranges of acceptable thermal comfort. There were two instances (Point E and Point C at 04:00) where the thermal environment was too cold, which could be easily overcome by wearing warmer clothing (e.g., increasing the clothing level from 0.36 clo to 0.61 clo).
During the daytime (08:00, 12:00 and 16:00), the PMV and PPD values at various locations were outside the ranges of acceptable thermal comfort. Furthermore, analysis showed that in the hot afternoon, the PMV and PPD values of the tent at 1.10 m above the ground were the highest, reflecting the highest degree of thermal discomfort, followed by Point A (0.10 m) and Point A (1.10 m) in the standard configuration, while Point B and Point C in the standard configuration had the lowest values due to the cooling effects of the wind. Due to thermal build-up around the interior wall, the PMV and PPD values of Point D reached their highest at 08:00.
4.2. Examination of Various Experimental Configurations
As air temperatures at Point A (1.10 m) and Point A (1.70 m) were similar, readings at Point A (0.10 m) and Point A (1.10 m) during the hottest period (between 09:30 and 14:30) were compared among the various experimental configurations. The results in
Table 6 show that performances in Case E4 and Case E5 were poorer compared to Case E1, while the performance in Case E2 was similar, and in Case E3 it was improved at Point A (1.10 m).
Results showed that the reflective roof layer in Case E5 prevented heat from escaping through the insulated roof and contributed to interior thermal build-up. In Case E4, although thermal convection was achieved through the opening in the middle of the roof, direct sunlight was allowed to enter the interior and caused extensive thermal build-up, with the air temperature at Point A (1.10 m) reaching 37.0 °C, 1.1 °C higher than the ambient temperature.
In Case E3, where a double layer of roof was applied, the air temperature at Point A (1.10 m) improved significantly, reaching a temperature of 35.9 °C, a drop of 0.8 °C compared to the ambient air temperature of 36.7 °C. This showed that thermal conduction (insulation) performed better in preventing heat from entering. In Case E2, triangular openings were installed just below the roof on the front and back walls, in an attempt to allow stack ventilation to occur. However, thermal performance did not improve significantly, showing that the height of 2.20 m was not enough to induce stack ventilation. In addition, the openings allowed heat to enter and weakened the overall performance.
A metabolic rate of 1.0 met and clothing level of 0.36 clo were used, assuming seated and reading/writing activity, dressed in typical summer attire of short-sleeved shirt and walking shorts, according to ASHRAE recommendations [
31]. Together with the average air speed in
Table 3, the PMV and PPD values for the tent and all five cases of the experimental configurations were determined, as listed in
Table 7. Although PMV values for the tent were much higher compared with the similar values among the five cases of the experimental configurations, thermal discomfort was experienced in the tent and all five cases of the experimental configurations.
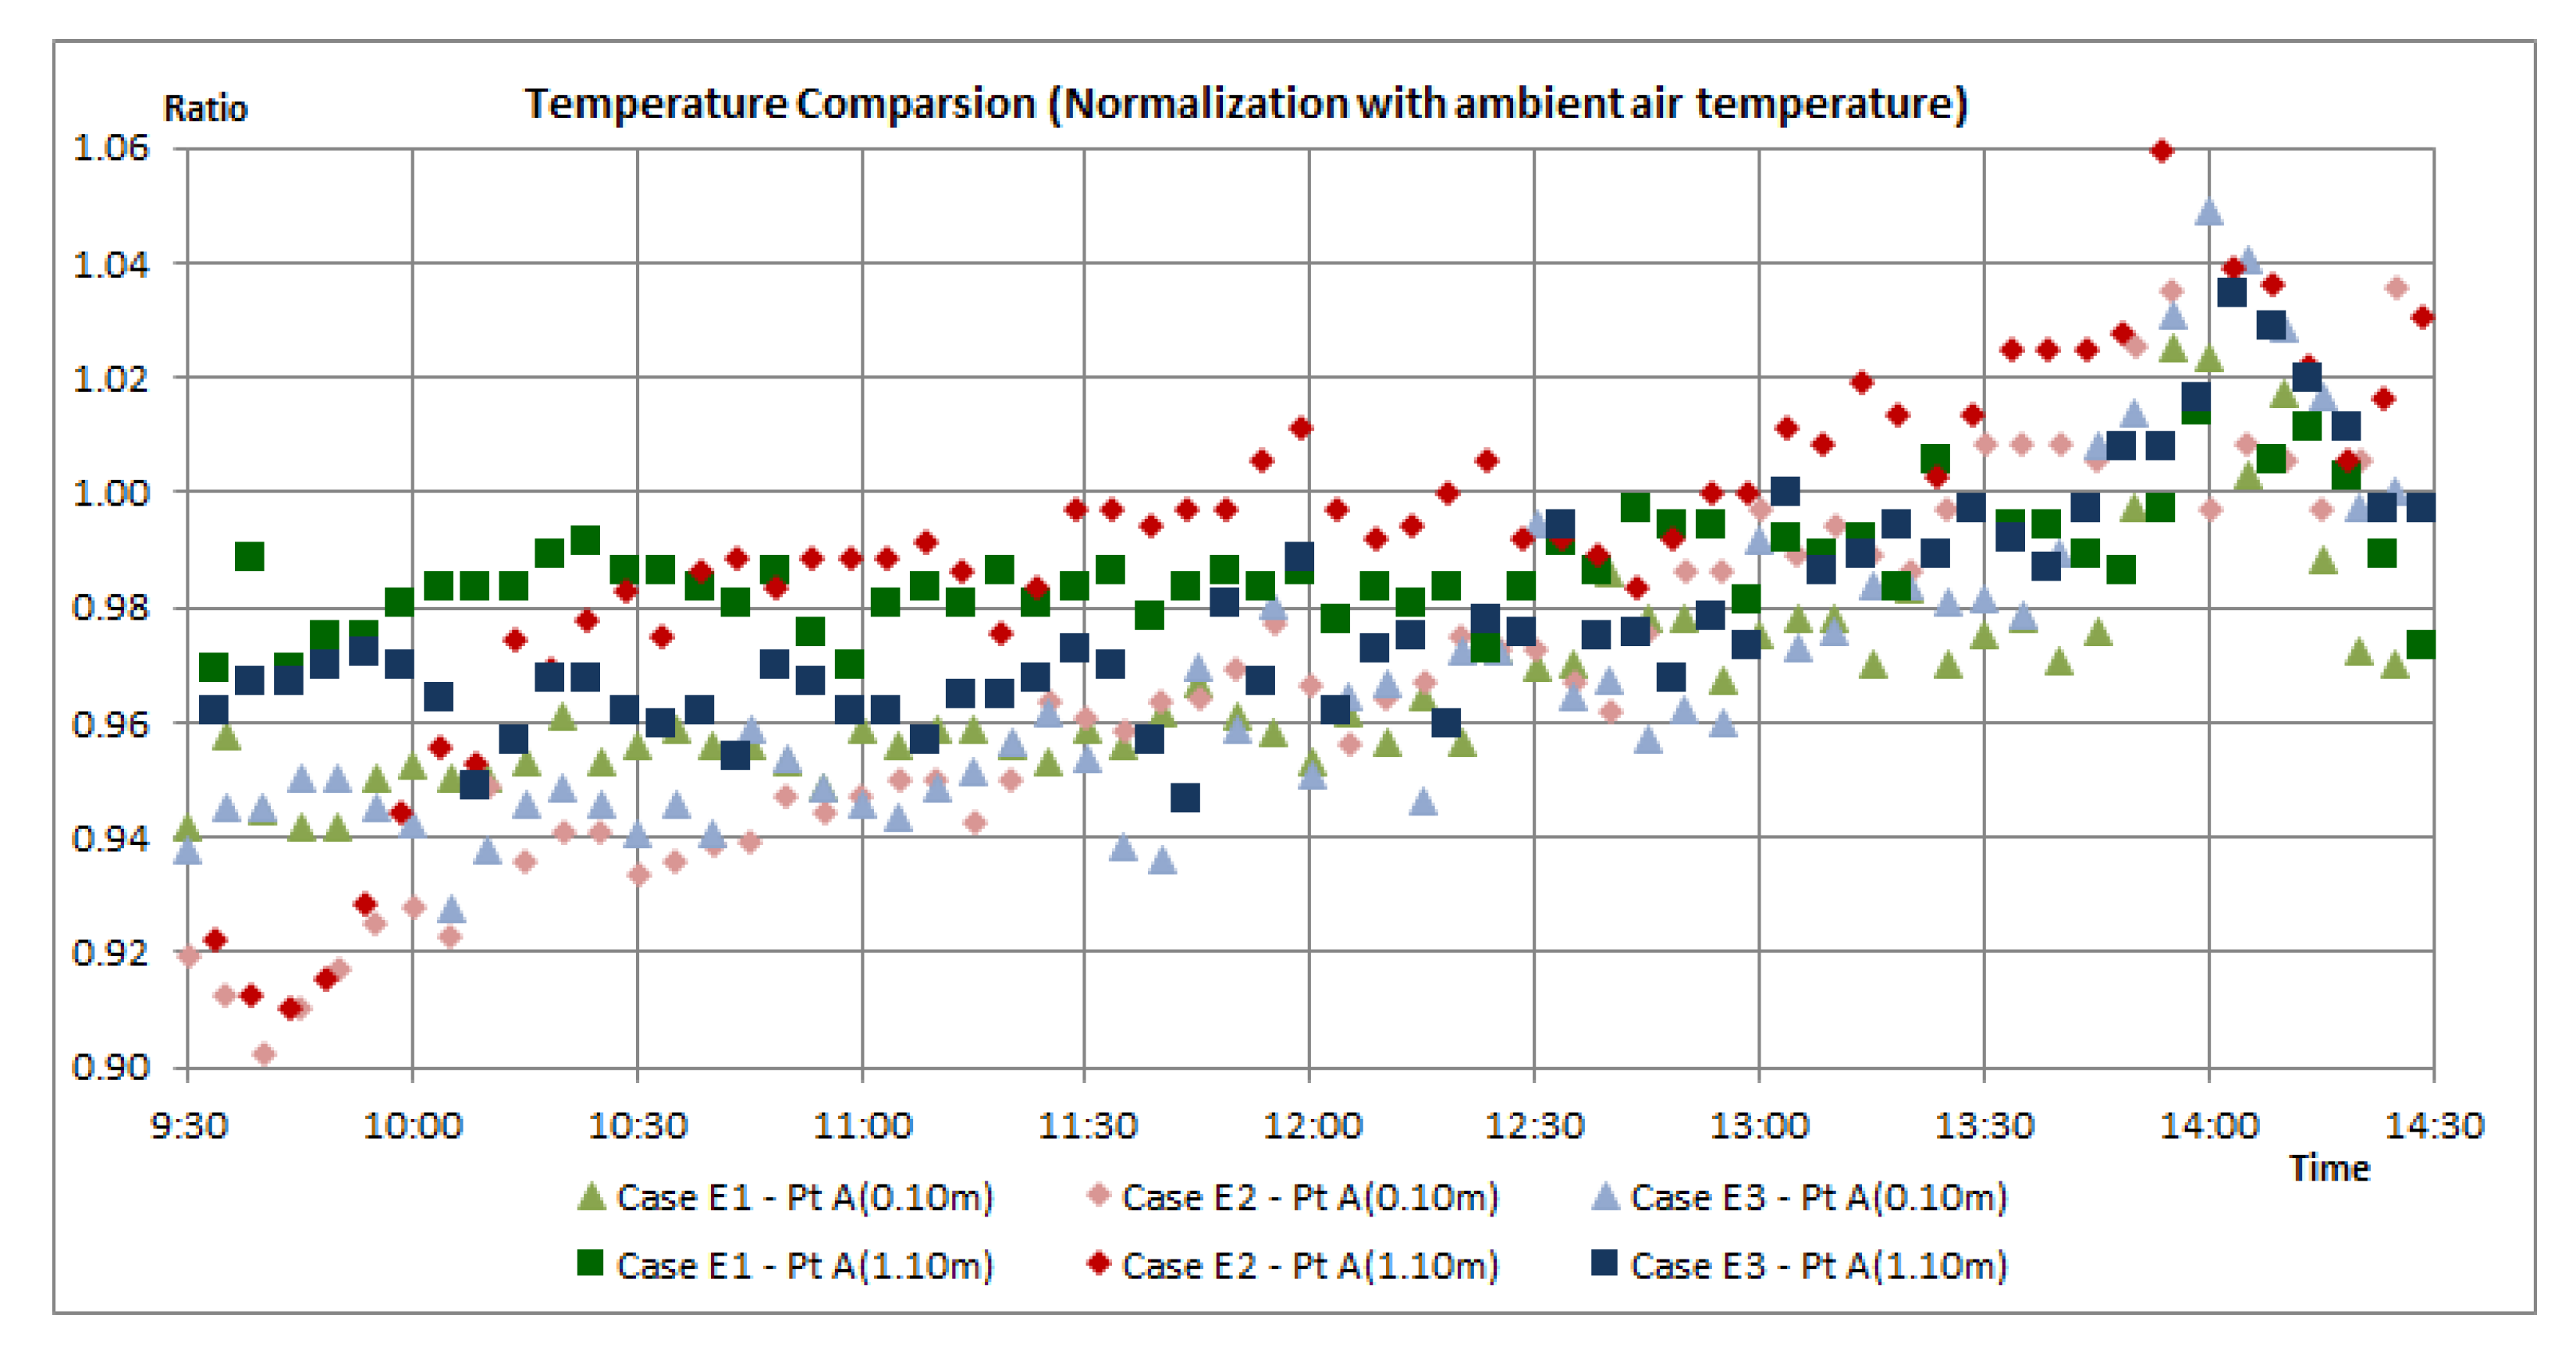
As seen in
Figure 7, after normalization using the respective ambient air temperatures, the air temperature at Point A (0.10 m) was similar for Case E1, Case E2 and Case E3. However, the air temperature in Case E3 outperformed Case E1 at Point A (1.10 m), while the temperature in Case E2 was higher than the ambient. This showed that thermal conduction had a greater significance than thermal convection.
4.3. Examination of Various Computational Configurations
From the findings in the various experimental configurations, the combination of thermal insulation (conduction) with the interaction of wind, while not sacrificing ease of installation, seemed the best direction for further research. As the construction of various designs of temporary shelters was time-consuming and heavily dependent on manpower, computational simulations were performed.
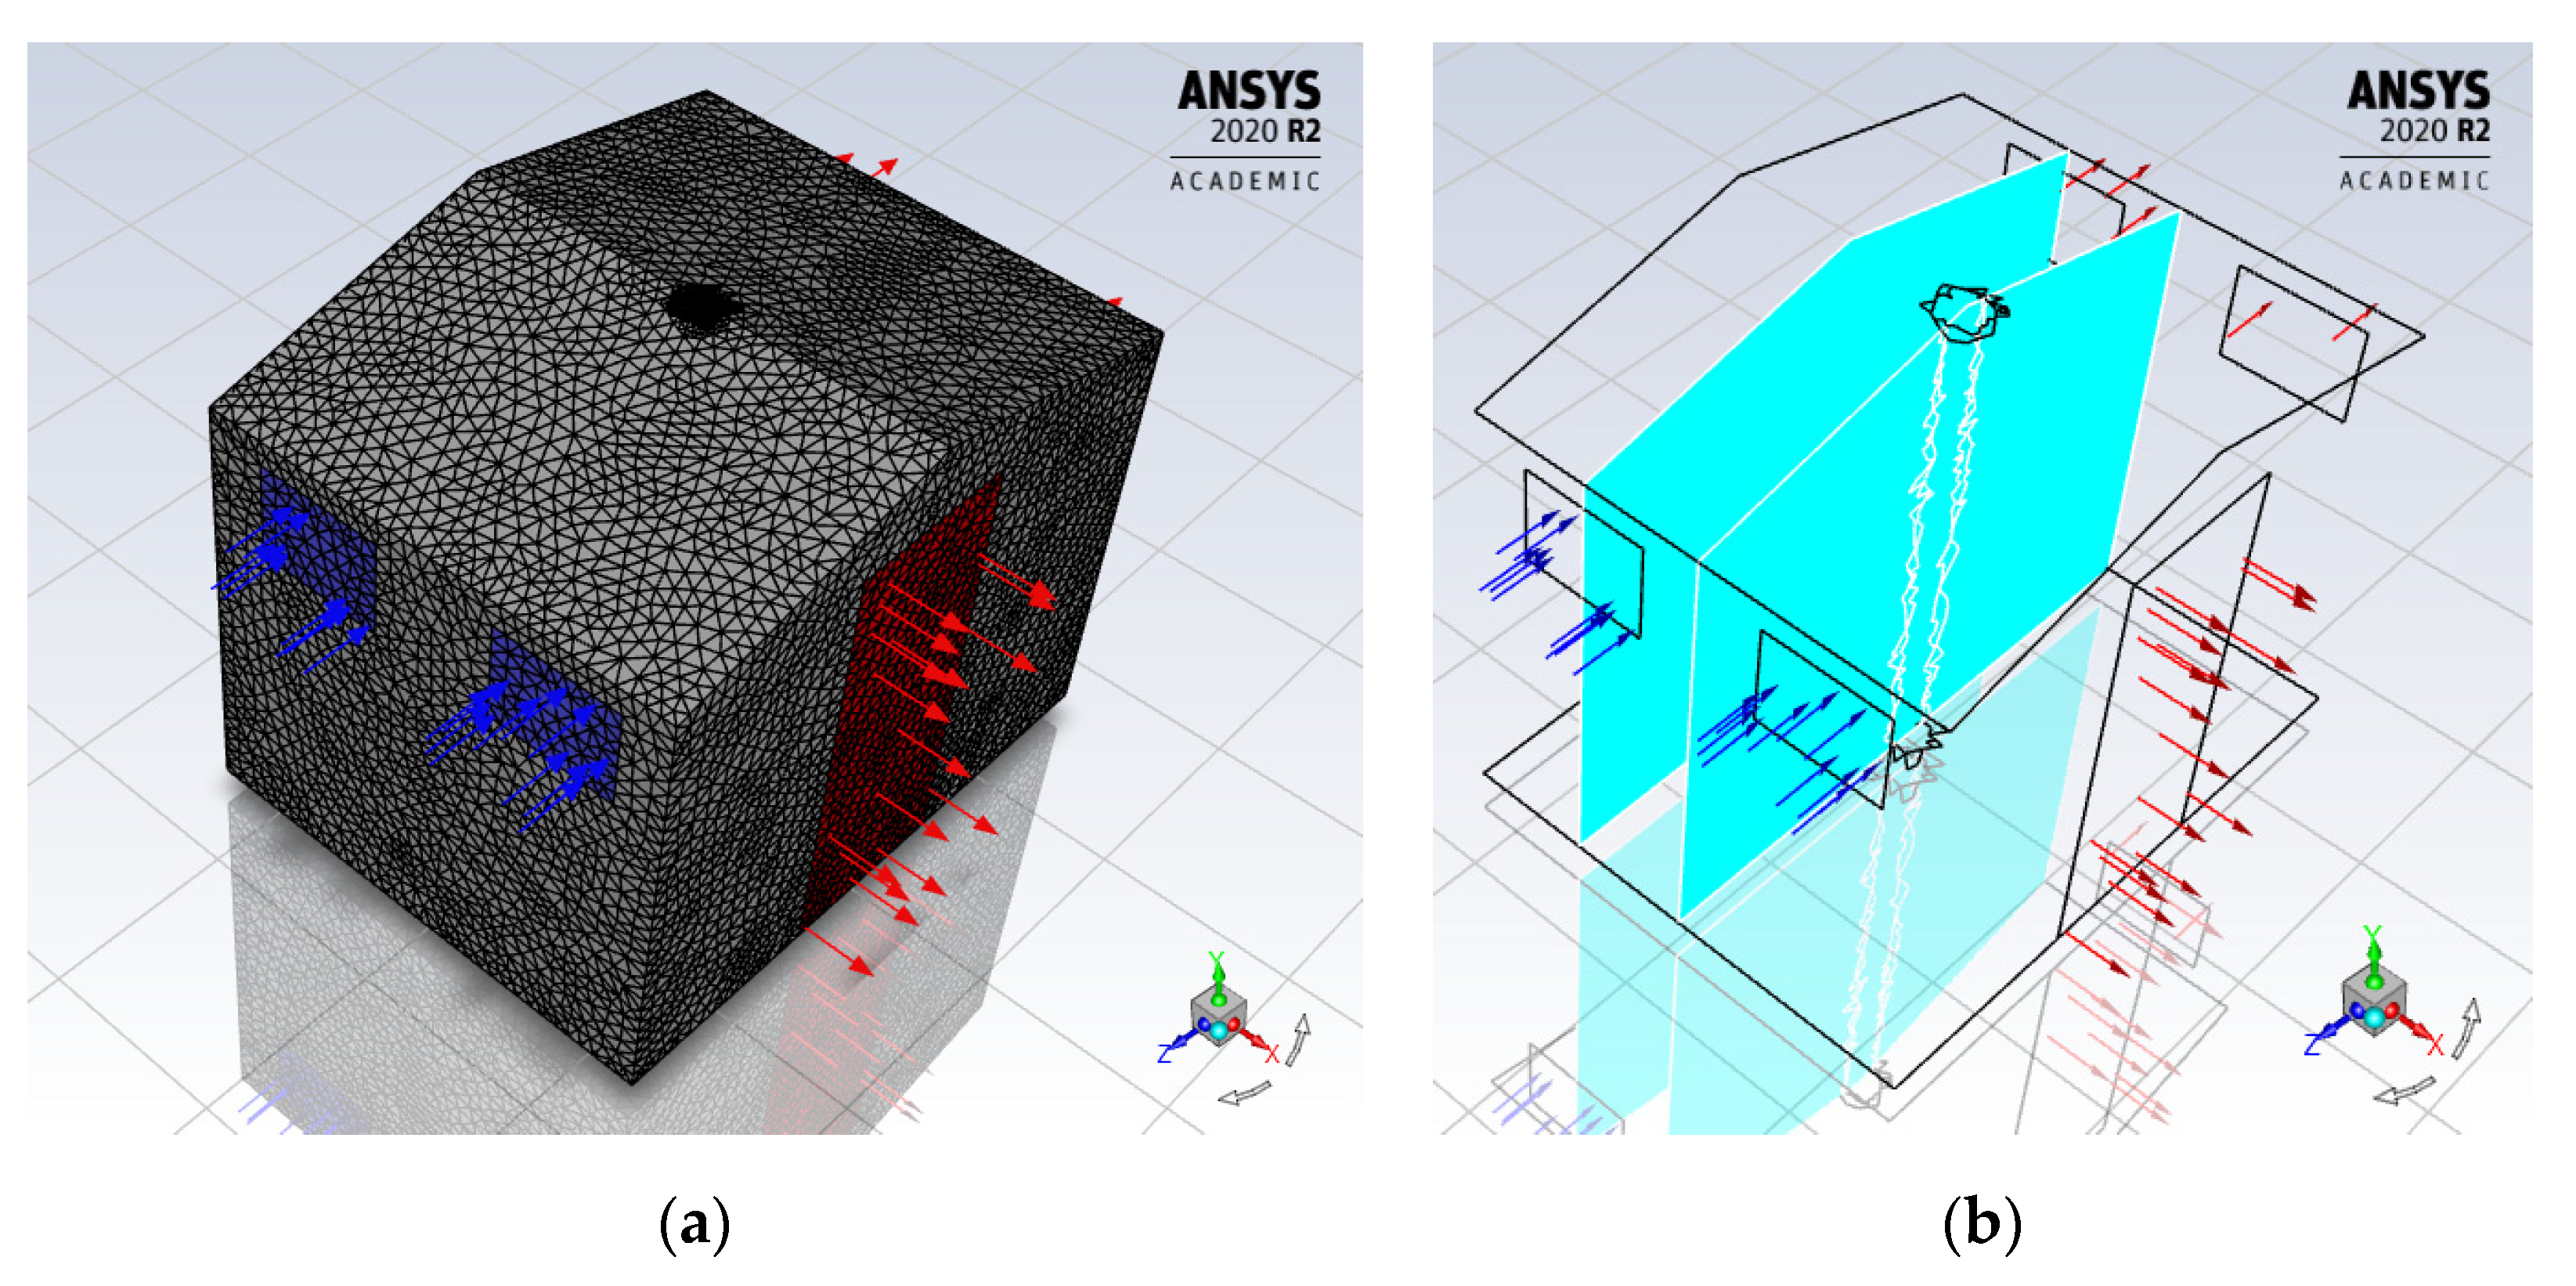
The computational model (Case C1) of the standard configuration (Case E1) during the hot afternoon (between 11:00 and 13:00) was established, as shown in
Figure 8, and solved according to the computational methodology described. Windows on a particular sidewall were specified as computational inlets, while windows on the opposite sidewall and the open door were specified as computational pressure outlets. An air speed of 0.53 m/s and a temperature of 31.7 °C at the windows (Point B), together with a heat flux of 200 W/m
2 flowing into the temporary shelter through the roof, were specified according to the experimental data. The ambient air temperature was 36.5 °C. In
Table 8, grid independency was achieved after two rounds of grid adaptions, where the percentage differences in mass flow rate and heat transfer rate reached four orders and three orders of magnitude, respectively.
In
Table 8, the air temperatures of the standard configuration at Point A (0.10 m), Point A (1.10 m) and Point A (1.70 m) for both the computational model (Case C1) and the experimental model (Case E1) were of the same magnitude and exhibited a similar trend. The air speeds of the standard configuration at Point A (0.10 m) and Point A (1.10 m) were of the same magnitude and within an acceptable range; differences in values may be due to measurement errors or simplification of the computational model. Paired t-tests for the five values of air temperature and air speed were carried out, giving values that fell into the critical range, and therefore the null hypothesis that the means of experimental and computational data are equal to each other was accepted. Hence, the experimental and computational results can be considered to be similar.
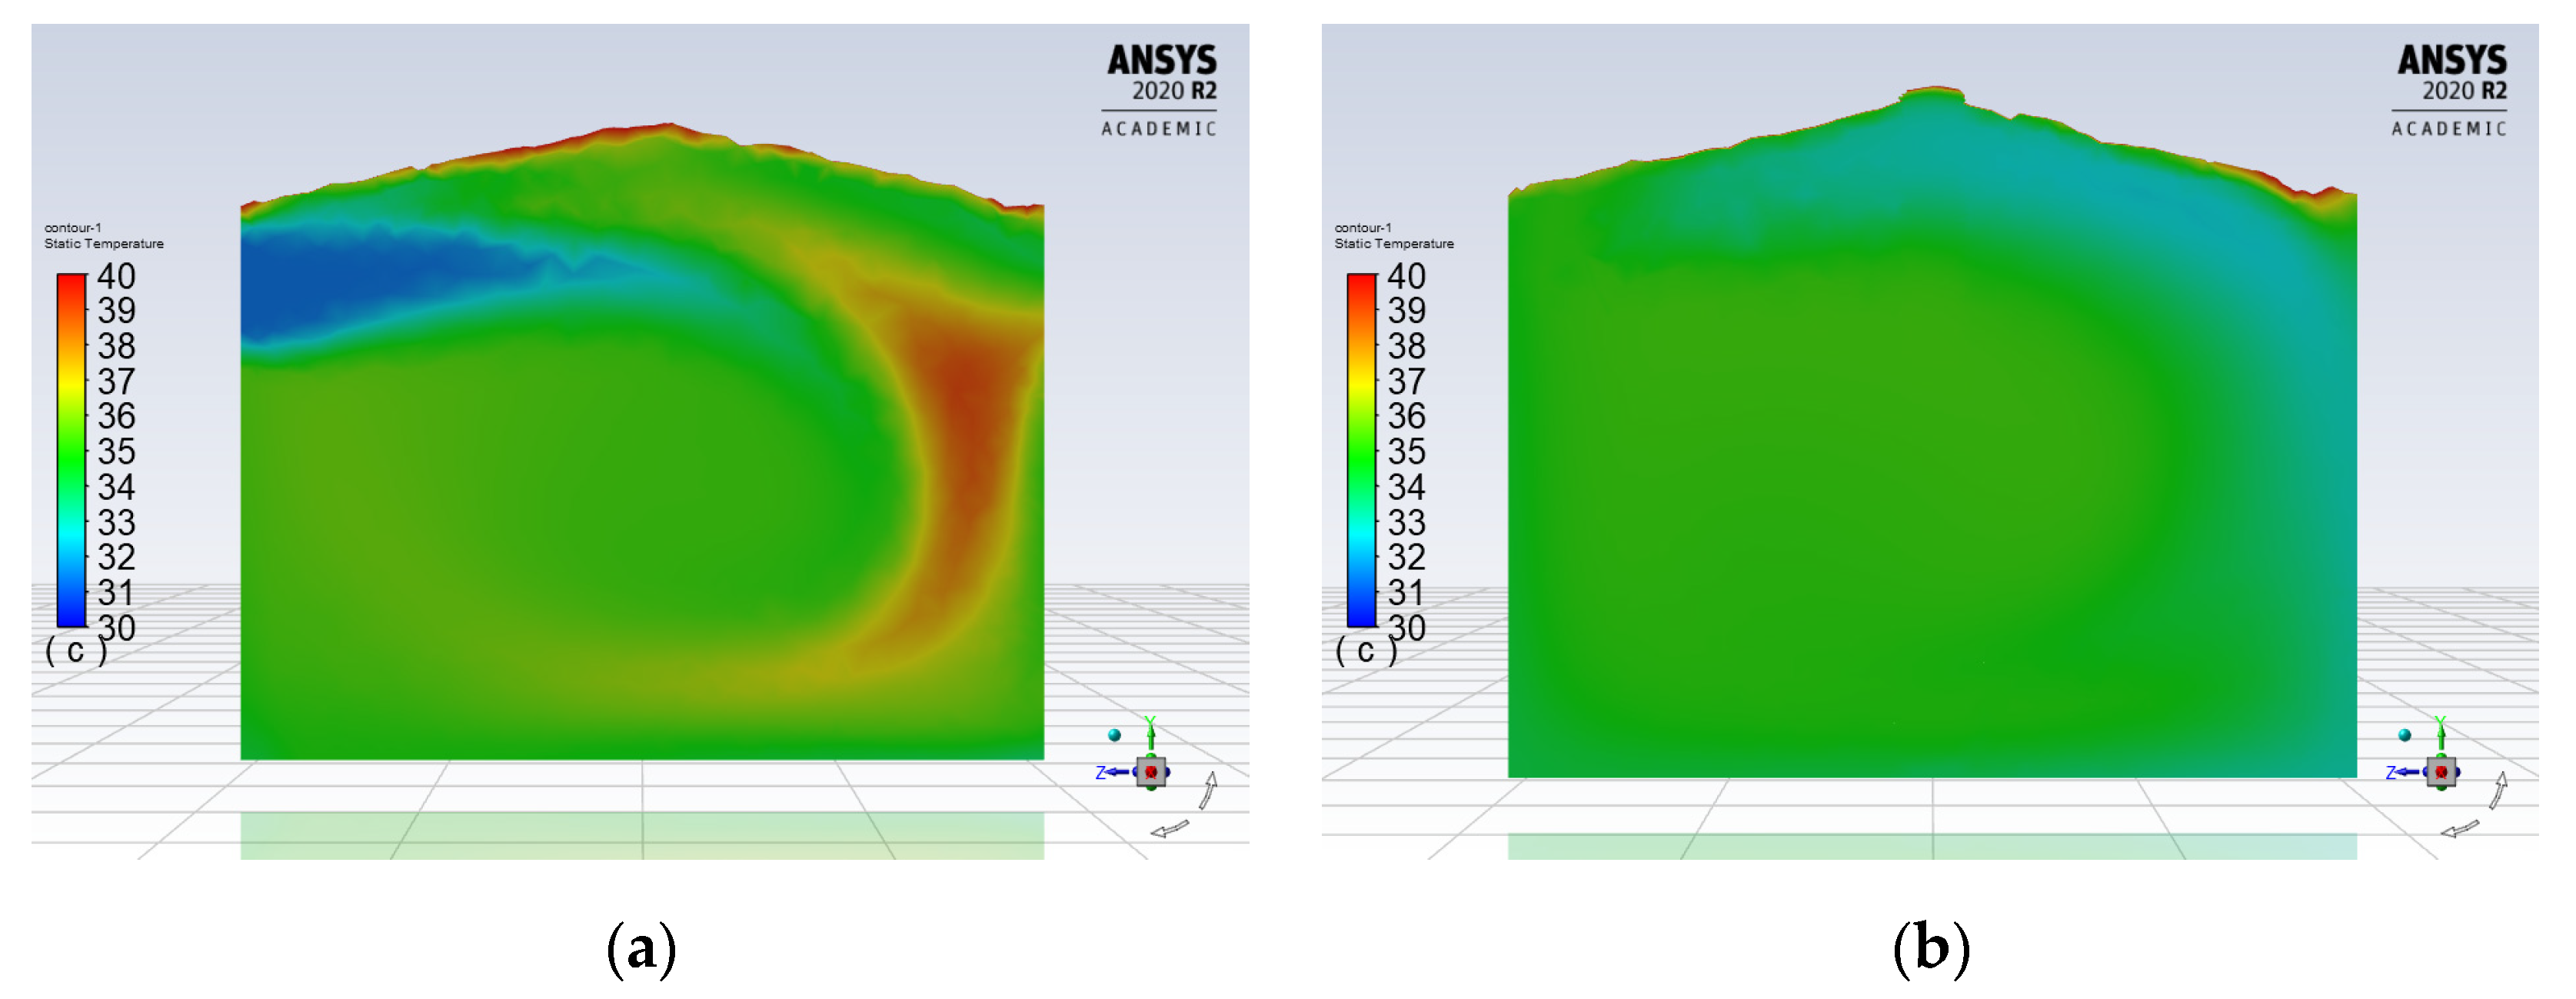
In
Figure 9, heat entered the temporary shelter through the windows at the sidewall by convection and through the roof by conduction, before escaping from the windows in the opposite sidewall and the door. Within the interior, the air temperature was cooler at the window inlets and hotter at the window outlets and along the roof. However, within the interior, especially along the vertical line of Point A, the temperature generally remained uniform at around 35.0 °C. In
Table 8, the amount of heat entering from window inlets was twice as high as heat entering from the roof, showing that the status of windows and door (opened or closed) had a greater impact on thermal comfort.
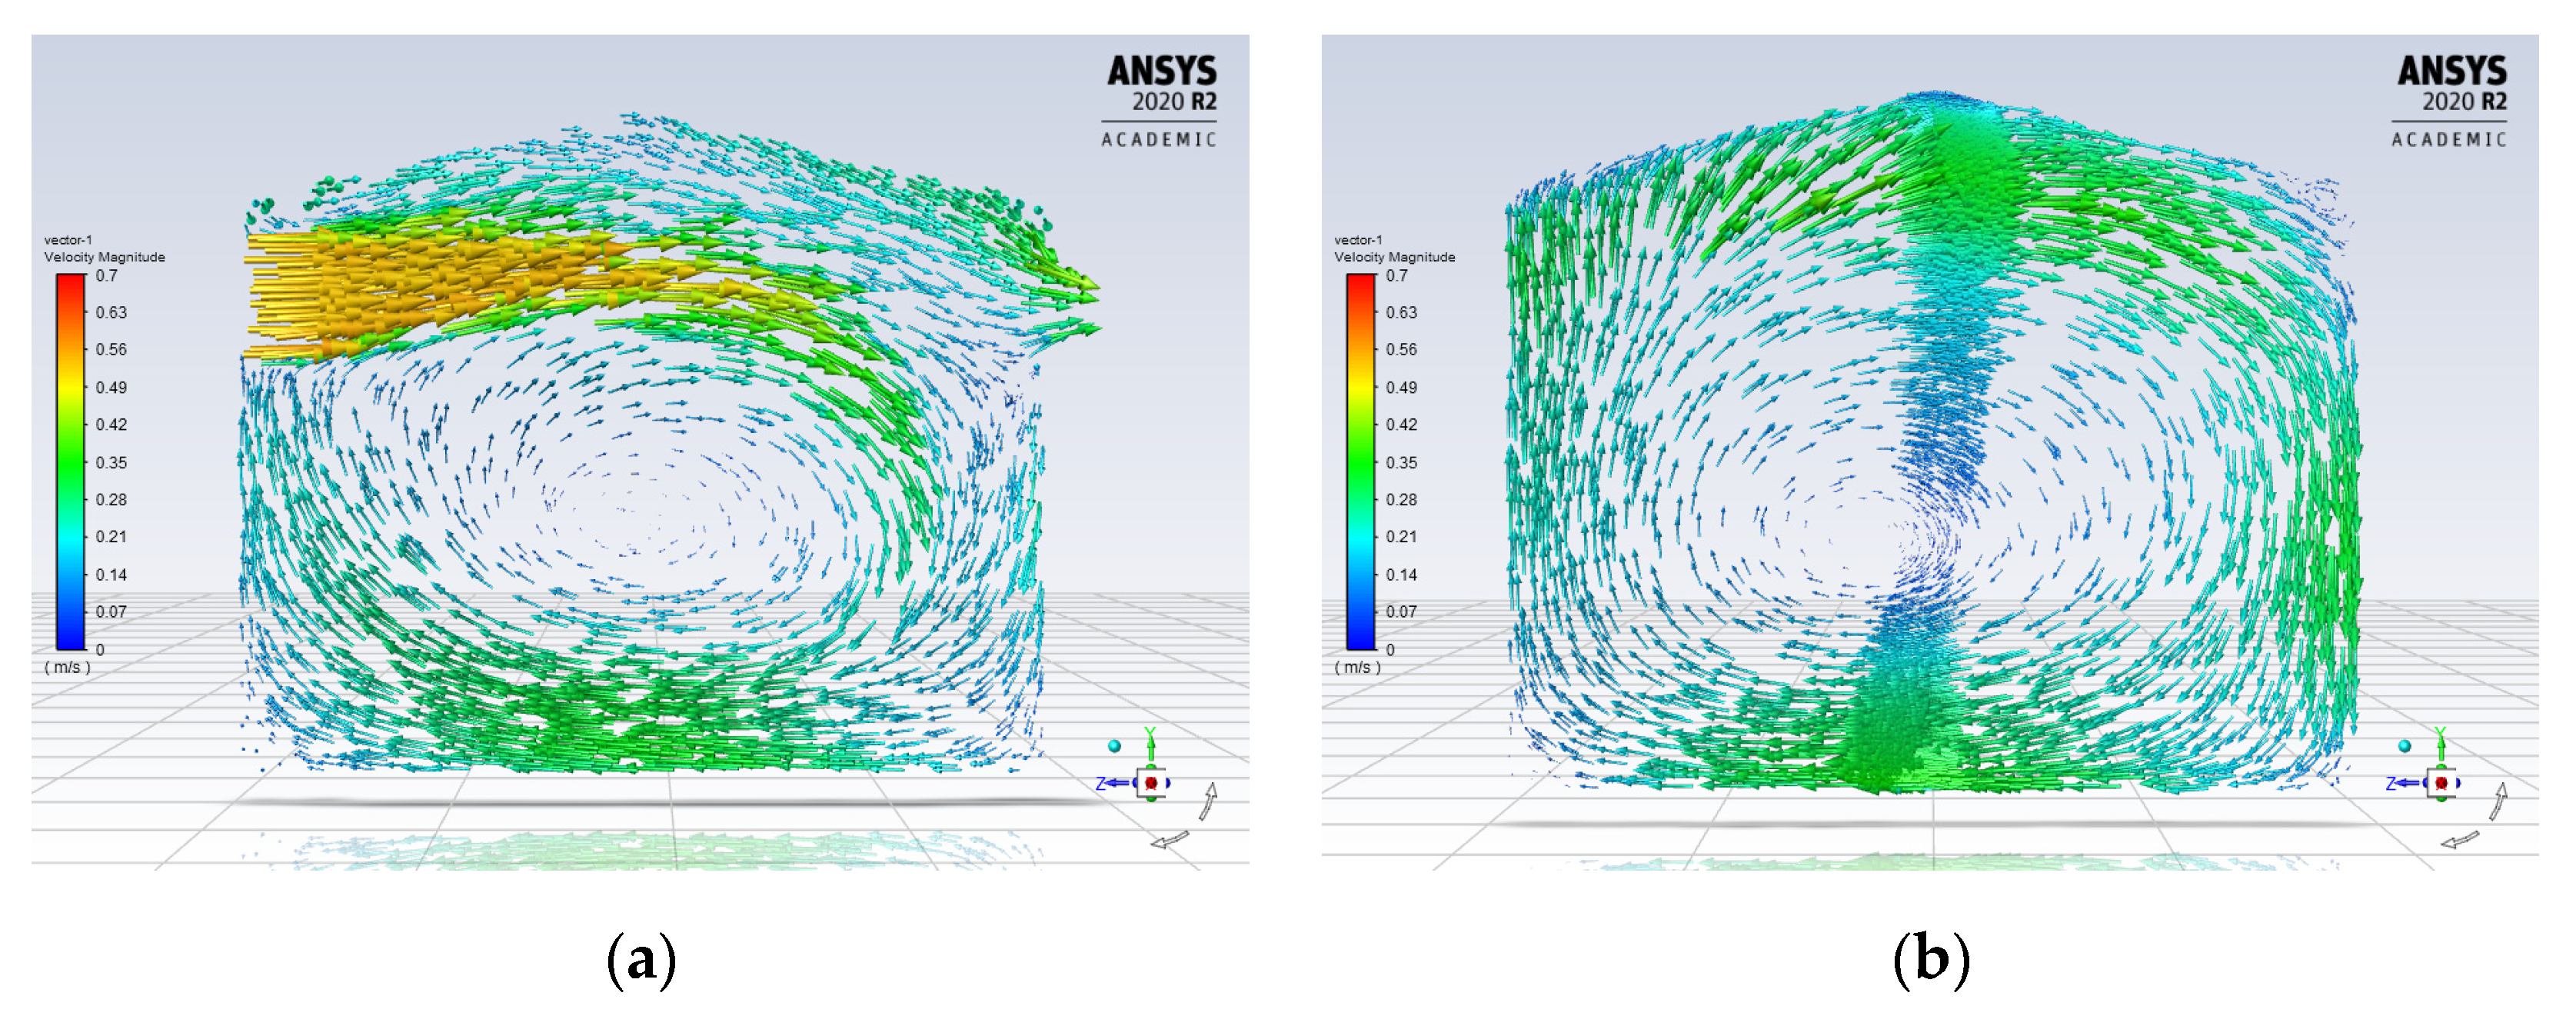
In
Figure 10, air speed was generally higher near the windows and door and almost zero near the walls, roof and floor. Inside, air moved in a circular flow, indicating a relatively higher air speed near the floor and roof and a lower air speed at mid-height positions.
Due to the ease of parameterization of the computational model, a further four computational configurations were analyzed. All computational configurations underwent two rounds of grid adaptions, achieving convergence after 800 to 1000 iterations. Using a metabolic rate of 1.0 met, a clothing level of 0.36 clo and relative humidity of 60% RH, the PMV and PPD values are shown in
Table 9. In order to reduce the amount of heat entering by convection, in Case C2 and Case C5, the effects of keeping the door and windows (diagonal cross flow) closed, respectively, were examined. For Case C3, the computational model of Case E3, we attempted to understand the reason why it performed best among the experimental configurations. For Case C4, we tried to improve the air speed by modelling the presence of a mechanical fan with an air speed of 1.5 m/s installed at the window inlets.
Case C4 had the best performance, showing that increasing the air speed was the key to improving thermal comfort. The computational results indeed verified the experimental conclusion that Case C3 performed better than Case C1. As the amount of heat entering the temporary shelter through the windows was almost twice as high as that entering through the roof, Case C2 and Case C5 performed better than Case C3, suggesting that closing the windows or door is a simpler alternative to thickening the roof. The performance of Case C5 was similar to that of the standard configuration (Case C1), while Case C2 performed slightly better, proving that closing the door was a better alternative to closing the windows, due to its larger cross-sectional area.
As Case C4 was the best performer among all the computational configurations, further combinations of computational configurations were attempted. Combining Case C4 and Case C2, by closing the door, caused the air temperature and speed to drop at Point A (0.10 m) and Point A (1.10 m) but increase at Point A (1.70 m). Thermal comfort remained the same at Point A (0.10 m), was improved at Point A (1.10 m) and was reduced at Point A (1.70 m). Combining Case C4 and Case C5, the closing of windows caused the air temperature and air speed to drop at Point A (0.10 m) and Point A (1.10 m); however, at Point A (1.70 m) the air temperature dropped but the speed increased. Thermal comfort was improved at Point A (0.10 m) and Point A (1.70 m) but was worse at Point A (1.10 m). A combination of all three computational configurations, namely, Case C4, Case C2 and Case C5, produced the best results, where all air temperatures and speeds dropped at Point A (0.10 m), Point A (1.10 m) and Point A (1.70 m), and the thermal comfort was improved at all three locations.
4.4. Examination of Proposed Optimal Configuration
From the findings of the various computational configurations, the combination of closing the door and one window at each sidewall creating a diagonal cross flow, while installing a mechanical fan at the window inlet to increase the air speed, was proposed as the optimal configuration. A window fan, measuring 0.45 m by 0.45 m, with an average speed of 2.75 m/s and a maximum speed of 6.00 m/s, was selected.
The results in
Table 10 show that comparing the experimental results from the optimal configuration with the experimental standard configuration, the air temperature dropped by 0.7 °C to 1.4 °C, while the air speed increased by 0.21 m/s to 0.63 m/s. Furthermore, thermal comfort improved significantly, with PPD values for the standard configuration ranging from 90% to 99% and decreasing to 46% to 55% for the optimal configuration.
5. Conclusions
The comparison of air temperature, relative humidity, air speed and thermal comfort between a tent and a standard configuration could be summarized as an inverse relationship between air temperature and relative humidity. The higher the air temperature, the drier the air. Air temperature within the tent was higher compared to the standard configuration, but the relative humidity was lower. Air temperature in the standard configuration was slightly lower than the ambient, while the tent’s air temperature was much higher. The results showed that the tent’s air temperature was 5.5 °C higher than the ambient, while the air temperature of the standard configuration was 0.5 °C lower than the ambient. In the standard configuration, air temperature was lower at Point A (0.10 m), while no significant differences were detected between the air temperatures at Point A (1.10 m) and Point A (1.70 m). The relative humidity within the tent was significantly lower compared to the ambient, while the relative humidity of the standard configuration was similar to that of the ambient. Although the air speeds in both the tent and the standard configuration were lower than the ambient, the air speed in the tent was lower than in the standard configuration. In the standard configuration, the air speed was higher near the windows. In terms of thermal comfort, although the standard configuration performed much better than the tent, neither the tent nor the standard configuration was thermally suitable for occupants.
In terms of air temperature, Case E3 (a temporary shelter with a double layer of roofing) outperformed the rest of the experimental configurations, while all experimental configurations performed better than the tent. In terms of thermal comfort, all experimental configurations had similar and lower PMV and PPD values compared to those of the tent, although the tent and all five cases of experimental configurations were still thermally uncomfortable.
After verification of the computational model (Case C1 and Case E1), various other computational configurations were analyzed. The results showed that increasing the air speed at a window inlet (Case C4) significantly improved thermal comfort, as air temperature on average dropped by 3.4 °C compared to the ambient and air speed reached 0.56 m/s, on average.
Further analysis showed that a combination of Case C2, Case C4 and Case C5 (closing the door and one window at each sidewall creating a diagonal cross flow, while installing a mechanical fan) was the optimal configuration, and this was verified using experimental data. With a window air speed of 2.75 m/s, the experimental results showed that the air temperatures in the optimal configuration were on average 1.1 °C lower than in the standard configuration, while the air speed was 0.38 m/s higher. On average, the PMV and PPD values for the optimal configuration were 1.49 and 50, respectively, and this was a significant improvement over those of the standard configuration, which were 2.69 and 95, respectively.
It is important to note that the effects of the occupants’ behavior (metabolic rate and clothing insulation were assumed constant) and surrounding environments (for example, shading from trees or strong ambient wind) were not taken into consideration in the current research. Various configurations of the temporary shelter were also constrained by the need to keep it lightweight and relatively easy to assemble. Further research may be conducted in the future on a cluster of temporary shelters with actual residents, to better understand the influences on occupants and environments.


