1. Introduction
In Canada, 19% of national energy use comes from the residential and commercial building sectors, with as much as 80% of a building’s energy demands attributed to space and water heating which are primarily generated using fossil fuels [
1]. Energy use in buildings is the fourth highest source of greenhouse gas emissions in Canada, emitting 74.2 Mt CO
2e in 2016 [
2]. Reductions in energy use as a result of improved thermal efficiency can lead to lower greenhouse gas emissions and global warming potential over the operational lifespan of the building [
3,
4]. To reduce the greenhouse gas emissions of new construction in Canada, the Pan-Canadian Framework on Clean Growth and Climate Change, which was introduced in 2017, states that all new construction must be built Net-Zero energy ready beginning in 2030 [
5]. To meet this target, the construction of new buildings must incorporate thermally efficient building envelope assemblies that lead to low annual space conditioning demands.
The Wood Innovation Research Laboratory (WIRL) was completed in July of 2018 by the University of Northern British Columbia (UNBC) and is located in Prince George, British Columbia, Canada in Climate Zone 6B with 4720 HDD under cold-dry conditions (ASHRAE 90.1-2010) [
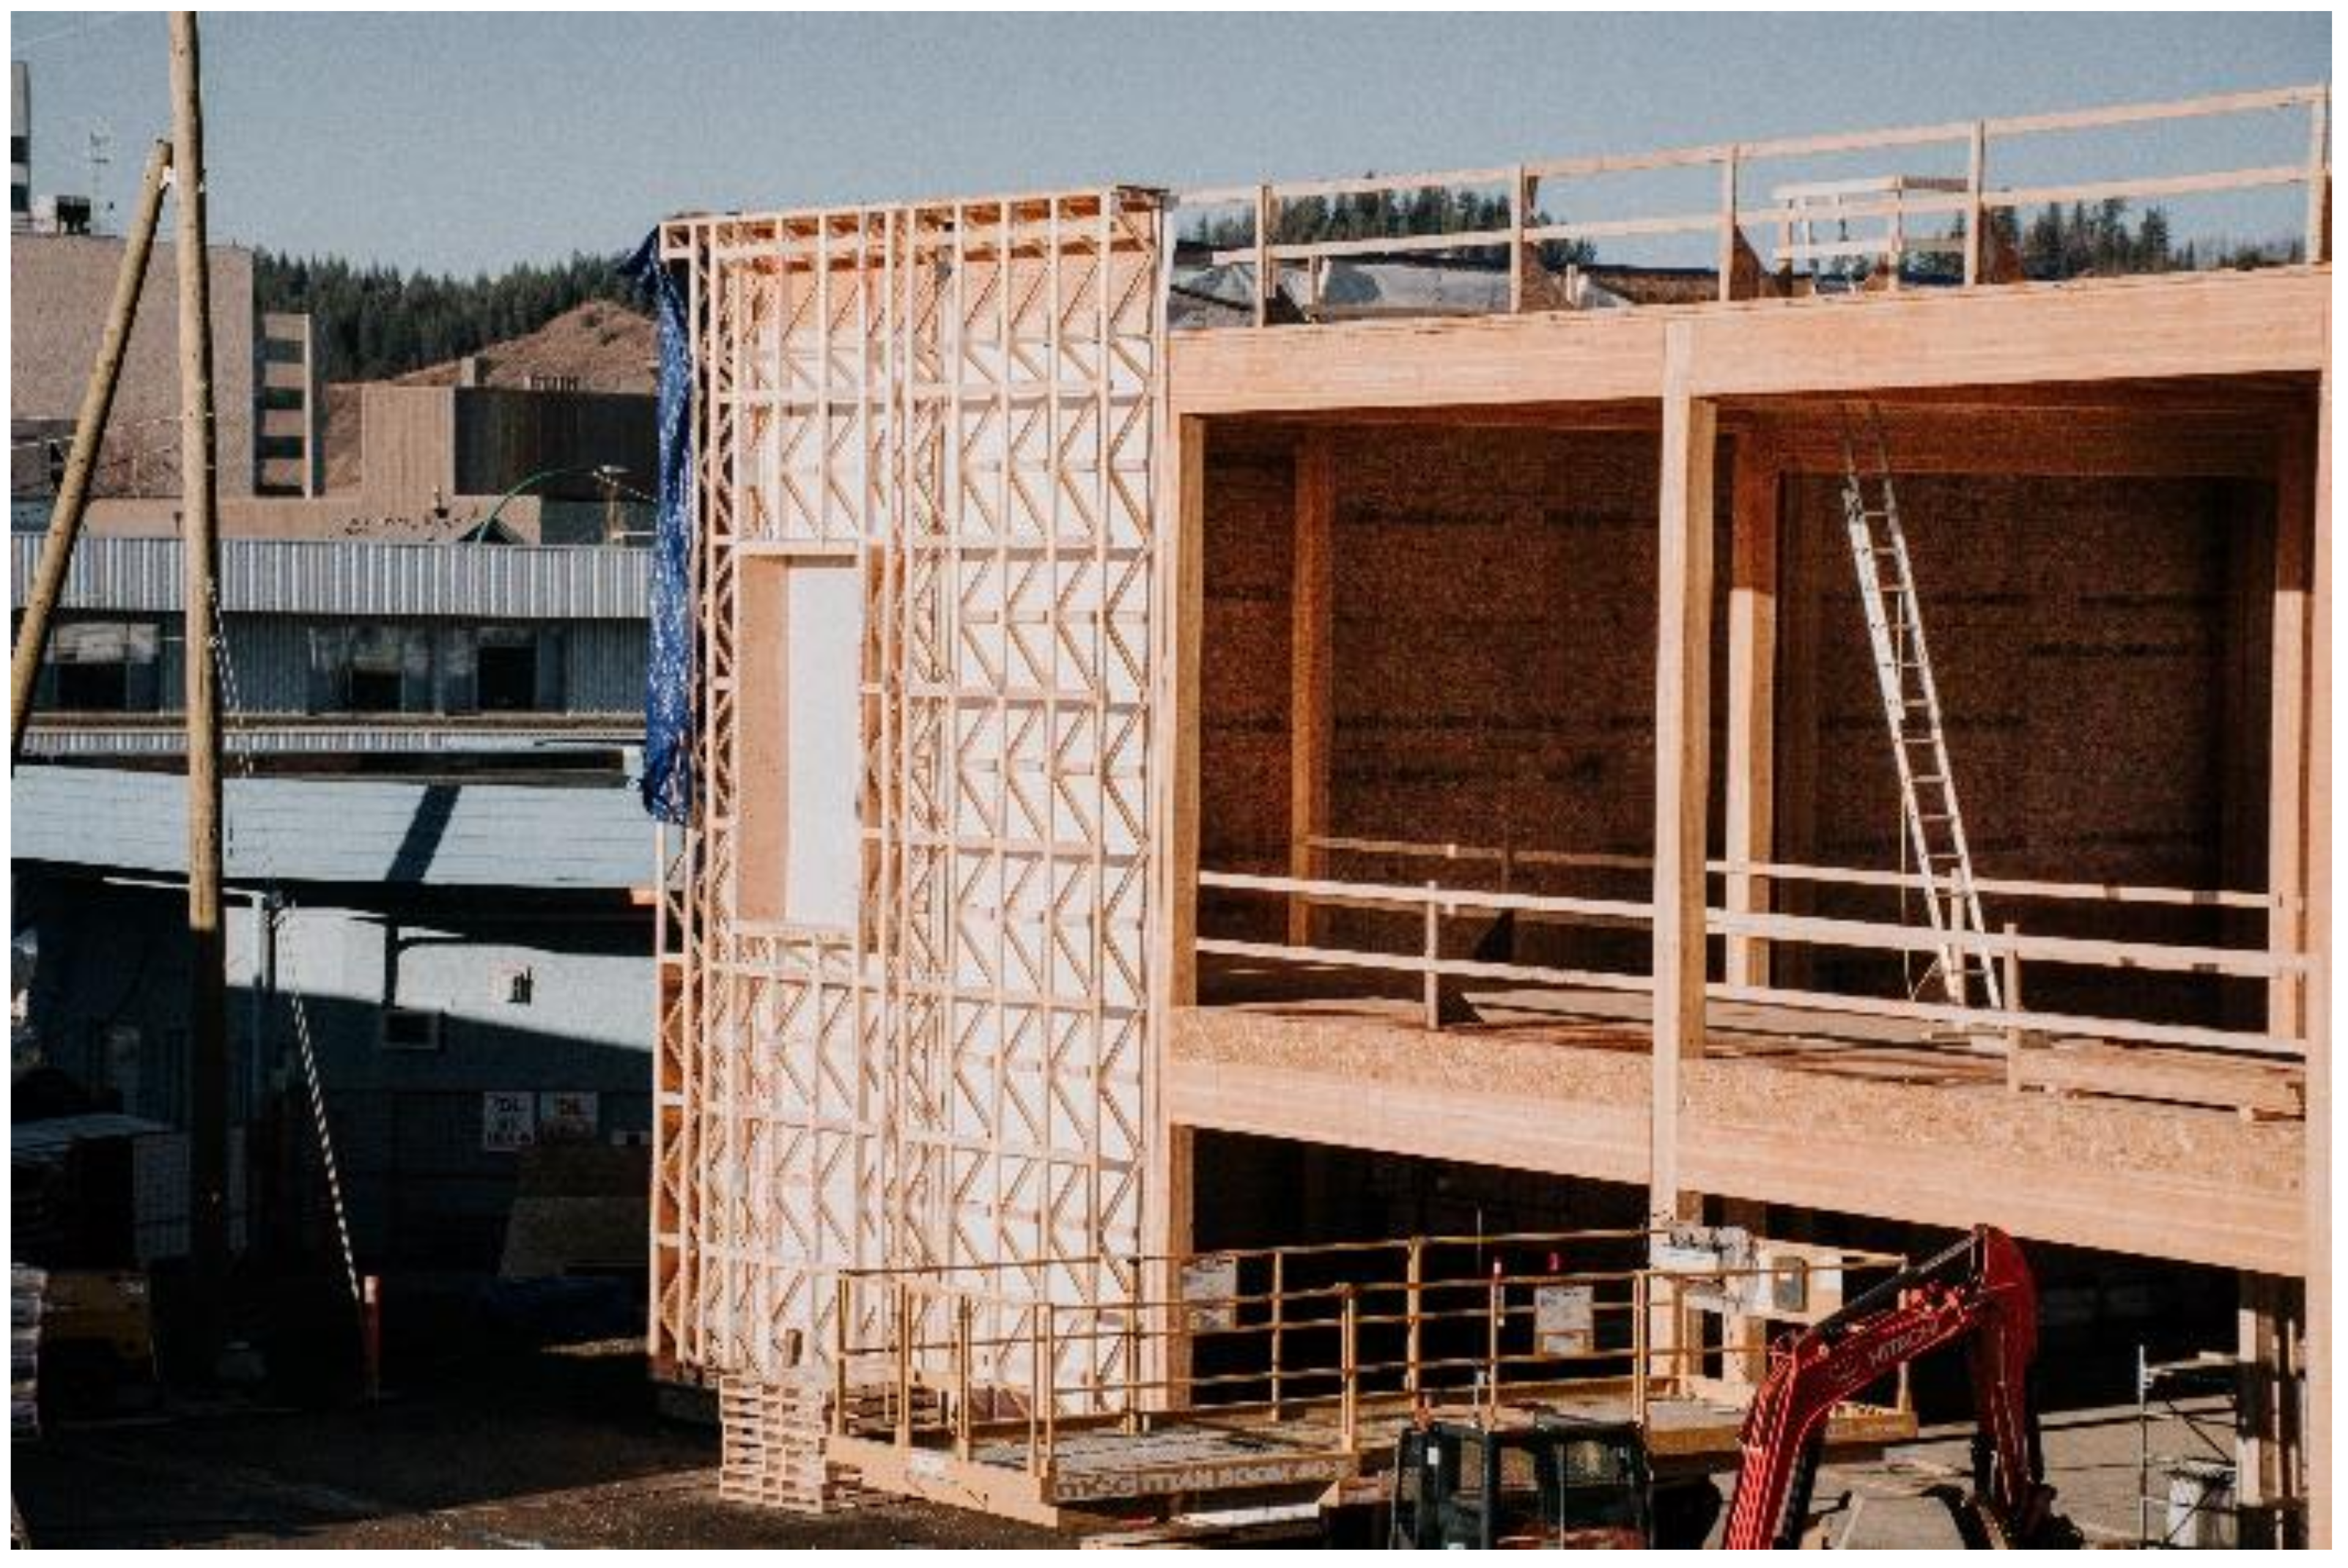
6]. Constructed to provide students and faculty of the Integrated Wood Design Program with a facility that can accommodate research and testing in the field of mass timber engineering and sustainability, the WIRL was built using a glulaminated posts and beam structural system and locally sourced ceiling and wall truss assemblies (
Figure 1). The building consists of one large two-bay laboratory space and several smaller offices and auxiliary rooms distributed between the first floor and a second-floor mezzanine. The building measures 10 m in height and sits on top of a 31 m × 31 m concrete raft slab. Large shipments and deliveries can be received through an overhead bay door.
To reduce the space heating and cooling demands of the WIRL, the University designed and constructed the building to meet the International Passive House Standard, which sets upper limits on the airtightness, annual heating demand and total primary energy use of a building based on the conditioned floor area of the proposed design. To meet the low heating demand requirements, envelope assemblies with U-values below 0.15 W/m
2K must be utilized for opaque wall and ceiling assemblies, with lower values recommended for buildings located in cold climates. In addition, an airtightness of 0.60 ACH @50Pa or less must be achieved. The Passive House Institute, which administers the International Passive House Certification program, states that a building constructed to the International Passive House standard allows for space heating and cooling related energy savings of up to 90% compared with typical building stock and over 75% compared to average new builds [
7].
To help meet the low thermal energy demand requirements of the certification program for the cold-dry climate in which the building is located a unique vertical truss assembly was constructed for the exterior walls of the WIRL building, which measures 533 mm deep and has a calculated U-value of 0.079 W/m2K (RSI 12.66). The roof assembly was constructed with an exterior insulated flat truss assembly measuring 659 mm thick and a U-value of 0.057 W/m2K (RSI 17.54). The U-values for all assemblies were calculated using the Passive House Planning Software (PHPP) and verified by a building certifier recognized by the International Passive House Institute. Upon completion of the building, a final airtightness value of 0.07 ACH @50Pa was measured as a result of both a pressurization and depressurization test, a North American record for buildings certified under the International Passive House program. Based on the final building design model and test results, the WIRL was deemed to have met all International Passive House requirements and certification was achieved. As the first industrial facility in Canada built to the International Passive House standard, the WIRL building provides a unique opportunity to investigate the long-term hygrothermal performance of a building utilizing a thick-wall assembly and low envelope air leakage rate. The analysis of the hygrothermal performance of the exterior wall assembly under future global warming climate scenarios for different locations across Canada may provide insight into the advantages and disadvantages of using the assembly to meet low-energy use building requirements in different climatic conditions. Due to the exterior climatic conditions in which the building was constructed, the thickness of the wall assemblies used in the WIRL building may provide new insight into the hygrothermal behavior of thick-wall assemblies in cold-dry climates.
Investigation on the hygrothermal performance of lightweight assemblies has previously been carried out for low-energy buildings, including those seeking the International Passive House Standard certification. Long-term hygrothermal performance behavior of split-insulation exterior assemblies in an occupied house fulfilling the passive house standard under natural climatic and usage conditions in Southern Poland [
8]. The hygrothermal performance of eight wall assemblies with a maximum thickness of 400 mm was measured through temperature and relative humidity sensors installed in the assemblies over a four-year period. Results were used to validate models of the assemblies created using the WUFI
® Plus software. As a result of the temperature and RH values collected over the four-year period, the researchers conclude that the permissible maximum moisture content in the wood and wood-based materials was not exceeded in any of the investigated constructions. Additionally, the theoretical calculations performed with WUFI
® Plus showed good agreement with measured temperature and humidity patterns in most assemblies. The risk of mould growth using the VTT mould growth index was analyzed for split-insulation exterior wall assemblies measuring approximately 370 mm thick (U-value 0.110 W/m
2K) using both in-situ and numerical simulations [
9]. Results showed unfavorable mould-growth index values (maximum 5.86) for the interior side of the exterior cladding material (untreated outdoor wooden cladding) as a result of boundary conditions and material properties, but do not show any mould growth risk throughout the remainder of the envelope. The researchers conclude that in-situ hygrothermal performance observations allow for real-time mould growth risk assessment, while numerical simulations provide for predicted future growth risk assessment under more severe climatic scenarios. A comparative study of highly insulated split-wall and thick-wall assemblies with a maximum depth of 295 mm found that the moisture content of the exterior sheathing in thick-wall assemblies was higher than that in split-wall assemblies during a simulated air leakage period with a constant flow rate of 0.315 L/s, however the calculated mold growth index using the VTT mould growth index is less than one for the monitoring period and less than three for a ten-year simulated period [
10].
As building envelope assemblies are constructed using greater levels of insulation to meet low energy-use requirements such as the International Passive House standard, the rate of heat transfer through the assembly is reduced, resulting in lower surface temperatures in the materials located towards the exterior side of the building envelope during the heating season in cold climates. As a result, there is an increase in drying time following wetting events and an increased risk for mould and decay fungi growth within the assembly [
11].
The thick-wall and split-insulation wall are two assembly designs which are used in the construction of low-energy use buildings in cold-climates. The thick-wall assembly utilizes a single cavity space to which insulation is added, with the depth of the cavity dependent on the construction approach and thermal performance requirements for the building. Split-insulation wall assemblies are constructed using a standard dimensional framing wall with additional insulation added to the exterior side of the assembly, commonly over the exterior sheathing.
Thick-wall assemblies constructed using a wood-framed cavity filled with hygroscopic insulation with no additional exterior insulation have been shown to have an increase in mould-growth potential compared to split-insulated wall assemblies when hygroscopic insulation is used or an increase in natural and forced convective air movement within the cavity occurs [
10,
12]. As the construction of low-energy use buildings increases to meet government-regulated thermal energy-use reductions in new construction, the need for hygrothermal assessments of high-performance envelope assemblies increases to reduce the risk of long-term durability concerns. Furthermore, critical analysis of predicted long-term hygrothermal behavior of high-performance assemblies must be undertaken using future climate scenarios to better understand long-term performance.
The purpose of this study is to investigate the measured hygrothermal performance of the WIRL building and the predicted performance of the thick-wall assembly used in the construction of the building under future global-warming climate scenarios in different climatic regions across Canada. To provide hygrothermal performance data of the WIRL building wall assemblies, a total of 36 humidity and temperature sensors were installed in the north and south walls during construction of the building. Data collected between 2018 and 2020 has been used to validate hygrothermal models created for the building using the WUFI
® Plus software package. Using the validated models, the predicted performance of the building in five major cities across Canada were created using future climate data obtained through the National Research Council of Canada [
13]. These climate files reflect the forecasted climate under global temperature rise scenarios of 2.0 °C and 3.5 °C. It is the intent of this research to investigate the predicted hygrothermal performance of the thick-wall exterior wall assembly design used in the WIRL building under these future climate scenarios to better understand the potential impacts of the use of this design for future high-performance building construction across Canada.
2. Materials and Methods
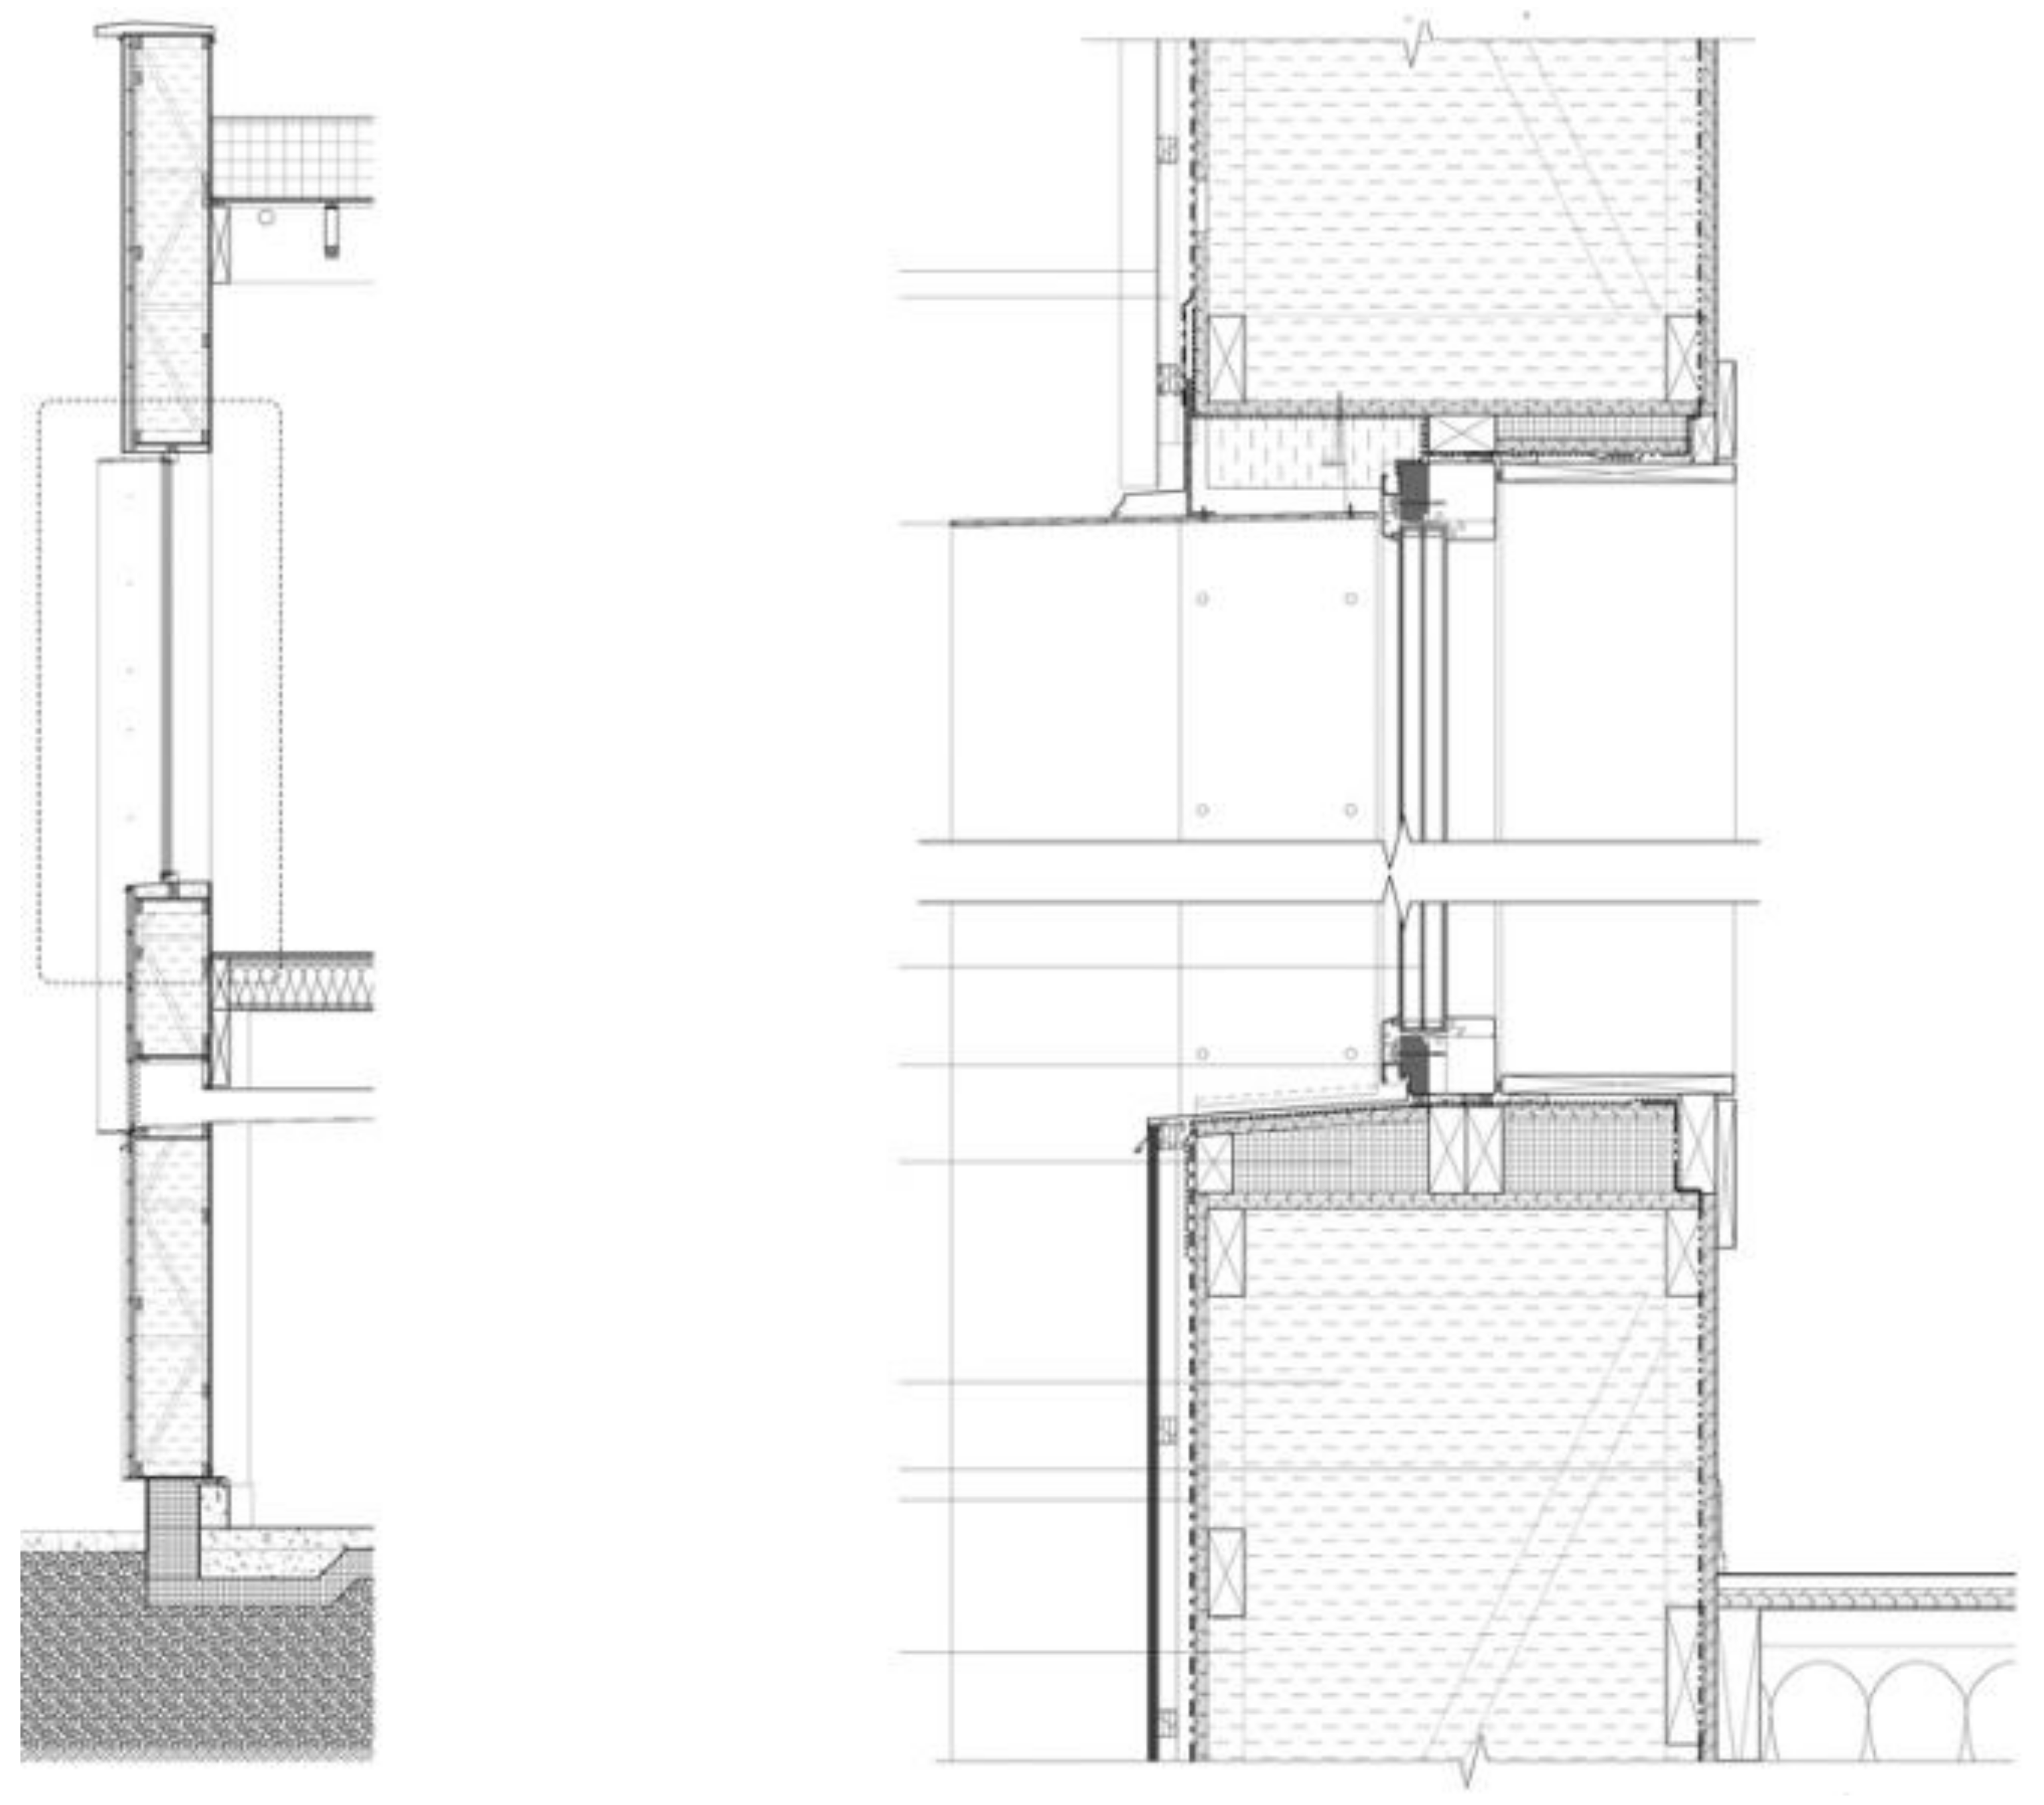
The exterior walls of the WIRL were constructed using 533 mm thick vertical truss panels (
Figure 2). The uninsulated panels were constructed off-site and included the vertical truss assembly, interior sheathing and a vapour diffusion resistant adaptable membrane which acted as the primary air-tight layer. Once on site, they were attached to the structural system. Relative humidity and temperature sensors were secured within the wall cavity before blown-in mineral fiber insulation was added from the exterior and the exterior sheathing and water-resistant barrier membrane layers installed.
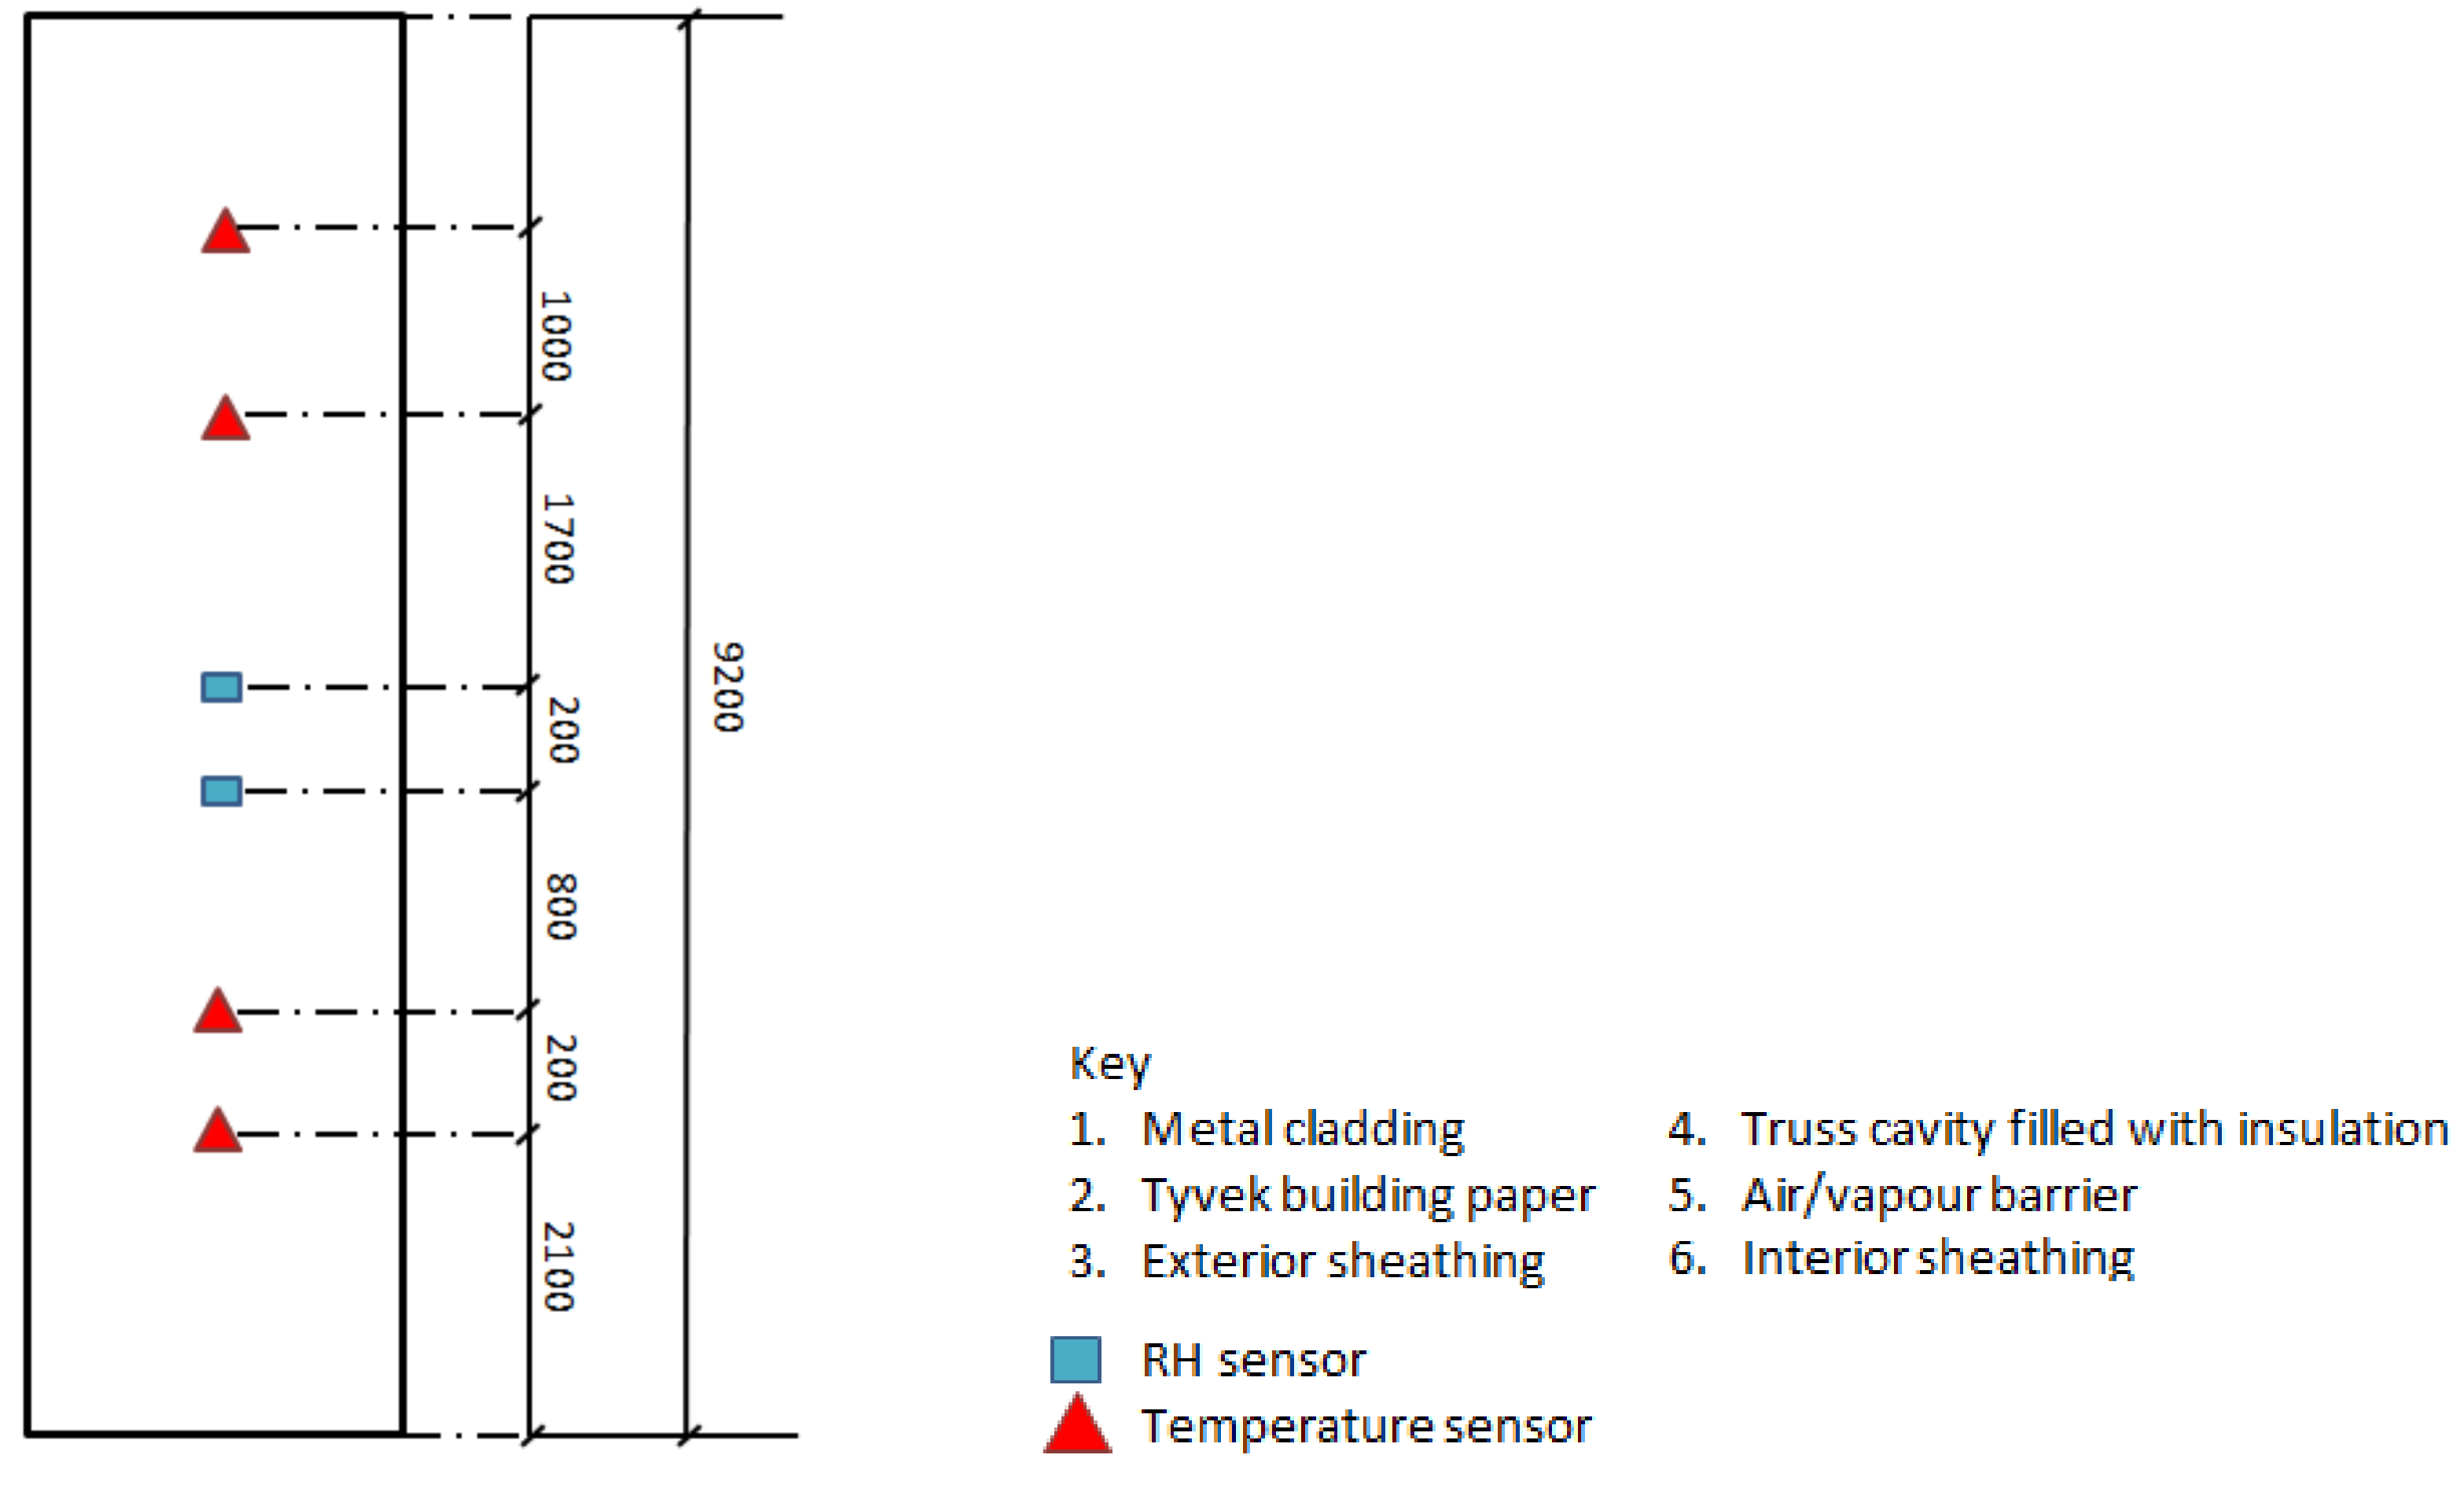
The sensor arrangements were integrated into the envelope as a series of six groups of three sensors that were distributed in one of the exterior wall panels on both the north and south wall façade of the building (
Figure 3). The wiring for all sensors was bundled and brought through the wall assembly where they were connected to a Raspberry Pi controller. The length of wire used to connect each sensor to the controller was increased so that it ran parallel to the isotherms and the influence of the thermal conductivity of the wire on the sensor was reduced. By installing multiple sensors of the same configuration in both the north and south wall assemblies, it was ensured that a certain amount of redundancy existed both for data verification and continued data collection. In addition, vertical humidity and temperature profiles for each wall could be analyzed.
All sensors were chosen in order to communicate with the Inter-Integrated Circuit (I 2C) bus on a Raspberry Pi 3 controller, which allows multiple slave devices to communicate with a master device via the same data pin. MCP9808 temperature (accuracy of +/− 0.25 °C, range −40 °C to +125 °C) and Sensiron SHT31-D relative humidity and temperature sensors (RH accuracy of +/− 2%, temperature accuracy of +/− 0.3 °C) were used for this study [
14].
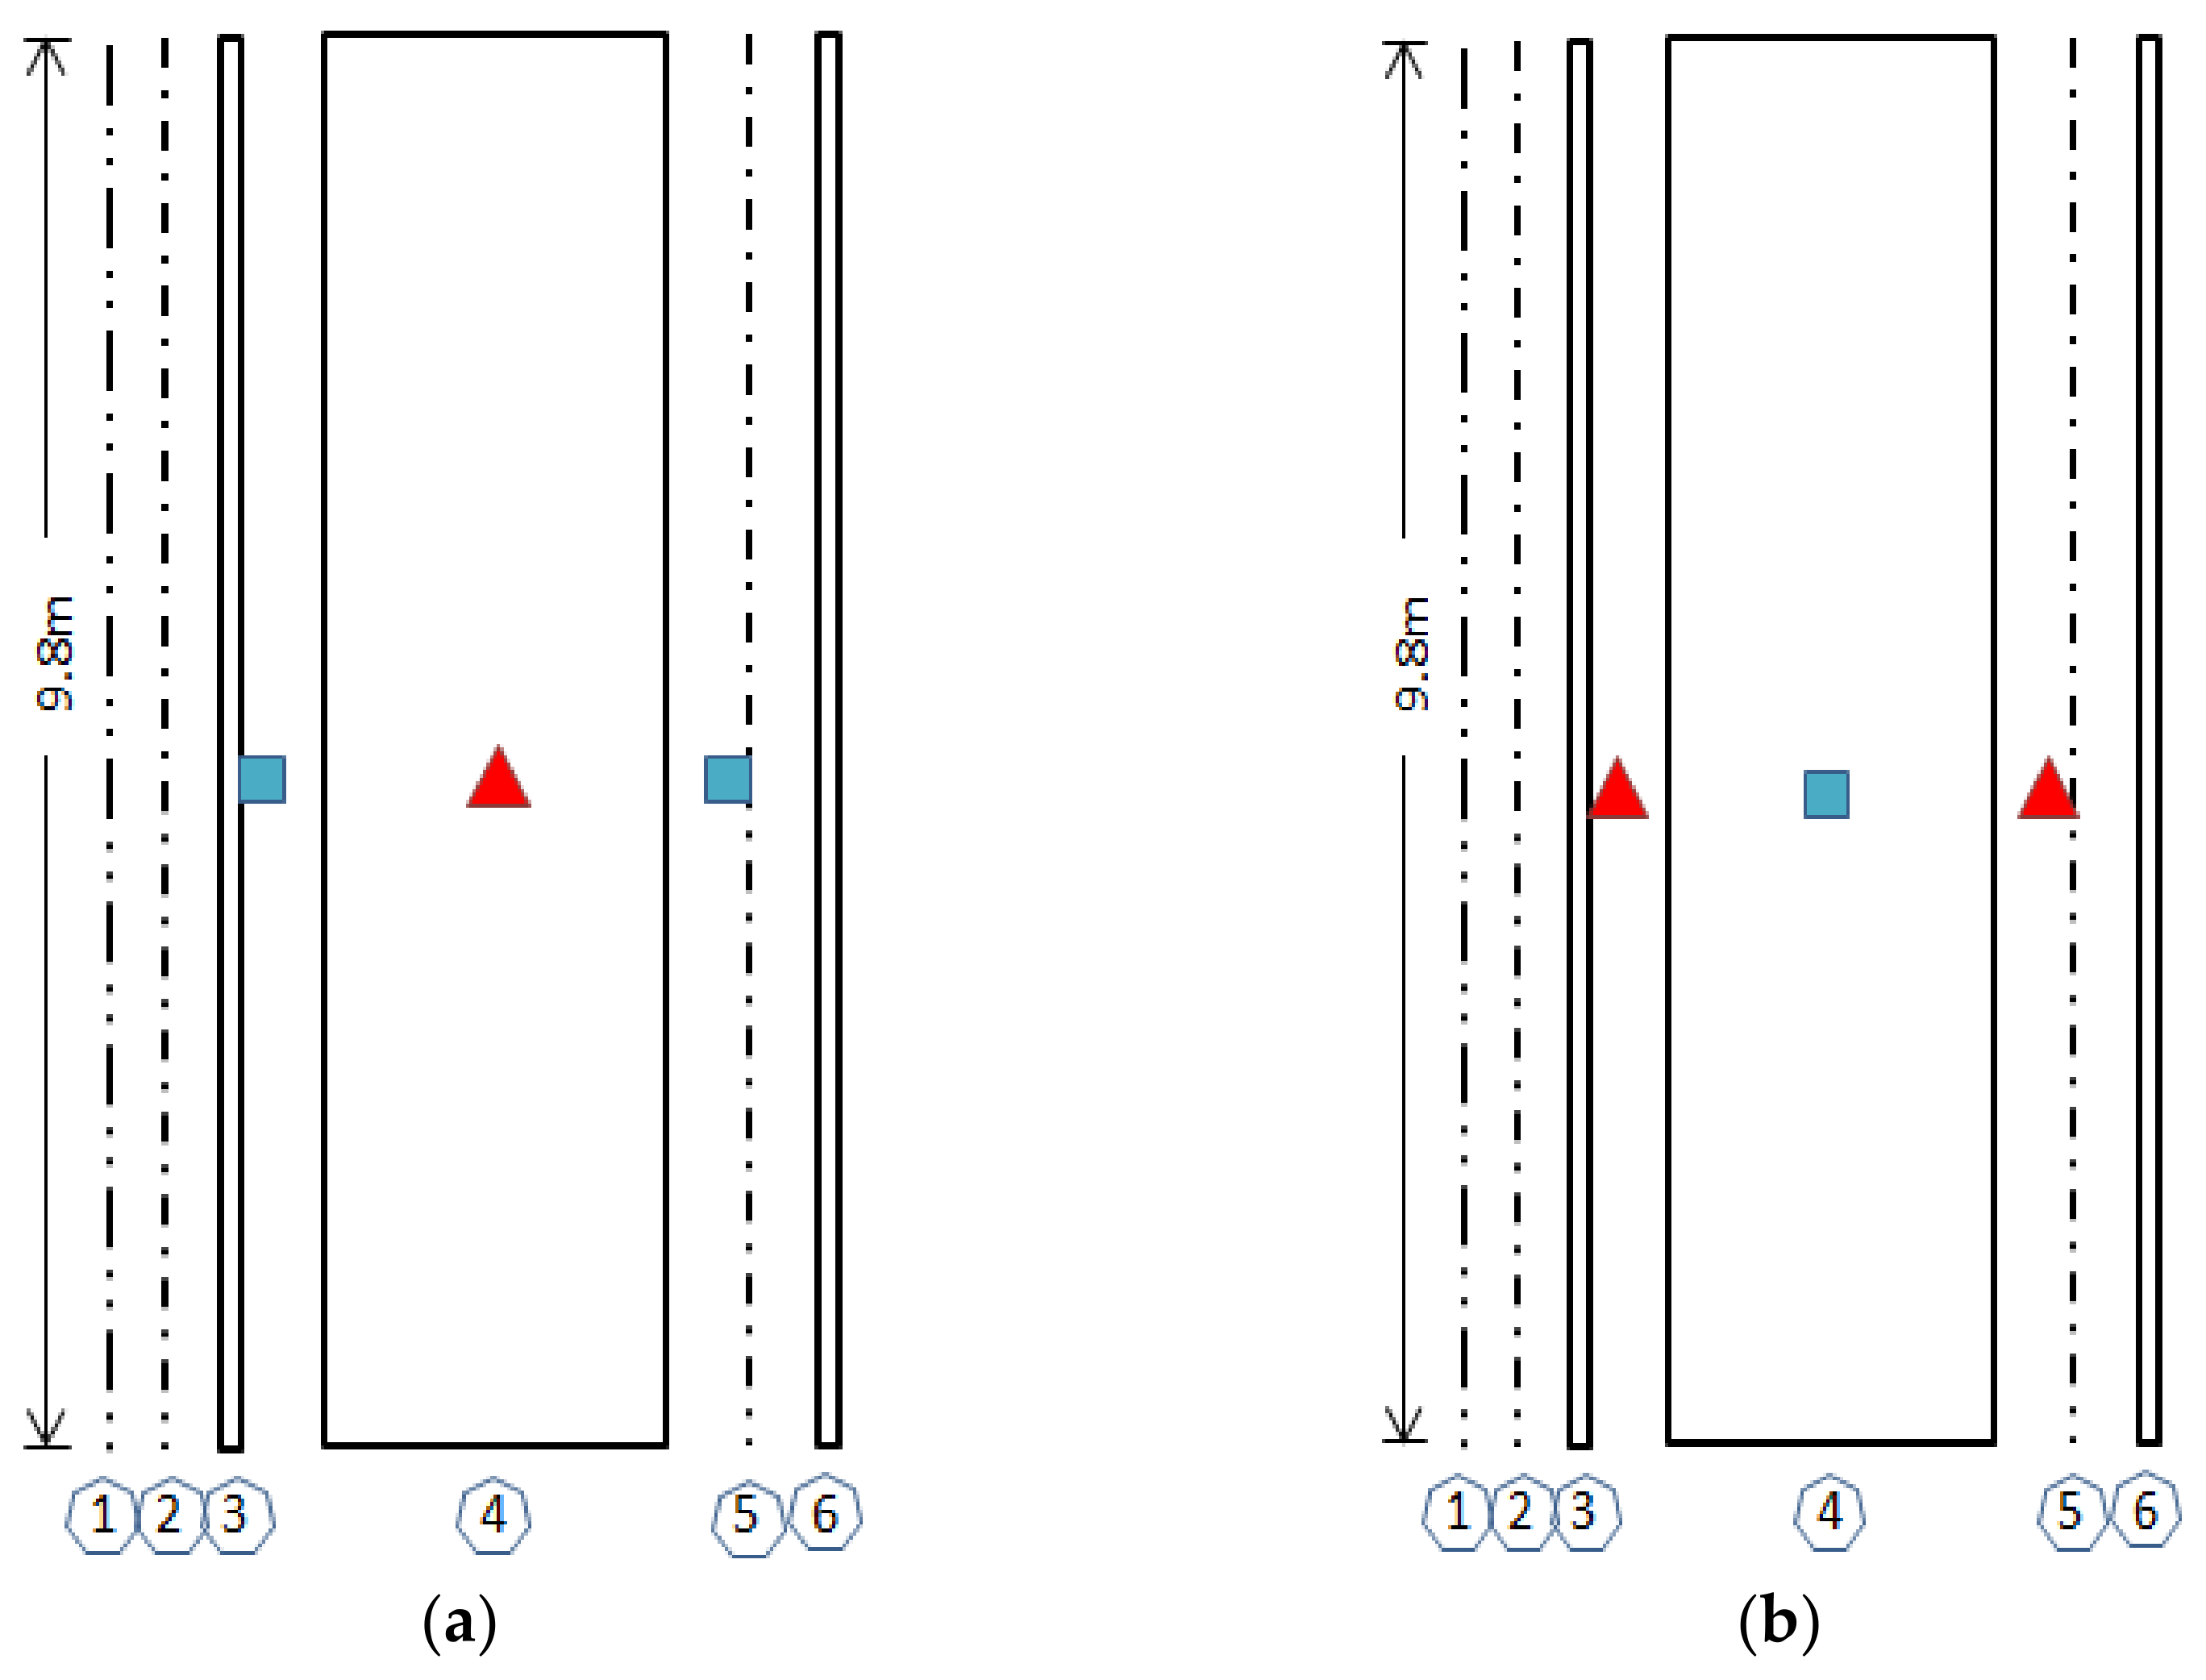
Four of the six sensor arrangements in each wall were configured with two temperature and one humidity sensor (N01, N02, N05 and N06, and S01, S02, S05 and S06) (
Figure 4a), and two arrangements were configured with two humidity and one temperature sensors (N03 and N04 and S03 and S04) (
Figure 4b). For configurations N01, N02, N05 and N06 and S01, S02, S05 and S06, the temperature sensors are located on the exterior face of the interior OSB sheathing layer and the interior face of the exterior OSB sheathing layer, with the humidity sensor located in the center of the insulated cavity. The two additional sensor arrangements, N03 and N04 and S03 and S04, were configured with two humidity sensors and one temperature sensor. Here, the two humidity sensors are located on the exterior face of the interior OSB sheathing layer and the interior face of the exterior OSB sheathing layer, with the temperature sensor located in the center of the insulated cavity.
Airtightness is an important part of building energy efficiency and the International Passive House certification program. Air leakage through discontinuities in the primary air barrier can account for 30% or more of a building’s heating and cooling costs [
15] and can lead to occupant discomfort and long-term durability issues when moisture is transported into wall and ceiling assemblies through the process of air leakage [
16,
17,
18]. To reduce heat loss from the building and encourage long-term durability, the Passive House certification program requires an airtightness value of 0.60 ACH @50Pa or less upon completion of the building. The airtightness of the building is measured through the blower door test using the EN13829 and Passive House testing protocol.
The WUFI
® Plus software package was used to create a hygrothermal model of the WIRL building using the known environmental conditions and assembly parameters at the start of the data collection period. By using the data collected from the exterior assembly sensors, the WUFI
® model could be validated and used to provide future hygrothermal models using alternative climatic data. The WUFI
® Plus software package allows users to create 3-D models of buildings and provides dynamic hygrothermal simulations for building assemblies in addition to indoor environment simulations. The parameters of the model were set to reflect the measured conditions within the building and the exterior assemblies at the start of the data collection period. A user-defined climate file was created using historical climate data collected from a local Environment Canada meteorological station [
19]. Because solar radiation data is not recorded at the meteorological station, data was derived from a TMY file obtained from the Canadian Weather Energy and Engineering Dataset (CWEEDS) [
20]. An air change rate of 0.14ACH @50Pa was set for the building airflow numerics to reflect the results of the second airtightness test performed on the building in 2019. The initial temperature and relative humidity in all exterior assembly components was set at 18 °C and 50%, respectively, and interior operational climate conditions set to 18 °C (min) and 25 °C (max) with a minimum relative humidity of 30% and maximum of 60%. Using the air-convection model [
21,
22], a 1 mm air layer was added to the interior face of the exterior OSB sheathing board in the north and south exterior wall assemblies with an air change rate of 2 ACH coupled to the indoor environment to simulate convective air movement up to the location of the air barrier system. Exterior OSB wetting as a result of rain-water ingress past the cladding and WRB layer was added to the exterior face of the exterior OSB based on data taken from [
22]. Fraction of adhering rain was set to 0.01% for exterior face of OSB. Adhering fraction of rain for assembly was left at 70% (0.7).
3. Results and Discussion
3.1. In-Situ Building Performance
Following completion of the building in July of 2018, the WIRL achieved a final airtightness rate of 0.07 ACH @50Pa. Areas of air leakage were identified and included small leakage points around penetrations through the wall assembly as well as around the perimeter of the overhead bay door. To measure what, if any changes had occurred to the airtight layer since construction was completed, a second follow up airtightness test was performed on 6 February 2019. The results are presented in
Table 1. As per testing protocol established under the International Passive House certification system, both a pressurization and depressurization test were completed to reflect all possible areas of leakage within the envelope.
3.2. Exterior Wall Performance
Following a review of the data collected by the six sensor arrangements installed in both the north and south walls, it was discovered that a significant reporting gap existed between April–December 2019 due to power failures and communication errors. In addition, reporting errors occurred in several of the sensors and sensor configurations in both wall assemblies. It was found that sensor configuration S01 had not transmitting data and no values had been recorded. Sensor configuration S05 transmitted data for two days, 19 July and 20 July 2018, before encountering a malfunction or error that resulted in no further data being reported. Sensor configuration N02 did not transmit any data after 23 January 2020. Additionally, the RH sensor located towards the exterior side of the assembly in configuration S03 did not transmit data after 12 January 2019. Of the twelve sensor groups installed in the north and south walls, nine continued to transmit data following the failure of the noted sensor groups with the exception of the exterior RH sensor in configuration S03. Although data transmission and sensor failures occurred, the installation of multiple sensors within both the north and south wall assemblies allowed for sufficient data collection and analysis of the hygrothermal behavior of the assemblies based on the data collected from the remaining sensors. A low level of uncertainty is attributed to the data collected from the north wall sensors that were used for the predicted performance under future climate scenarios as the data show trends consistent with those of thick-wall assemblies in cold climates [
23] and the predicted hygrothermal behavior using the WUFI
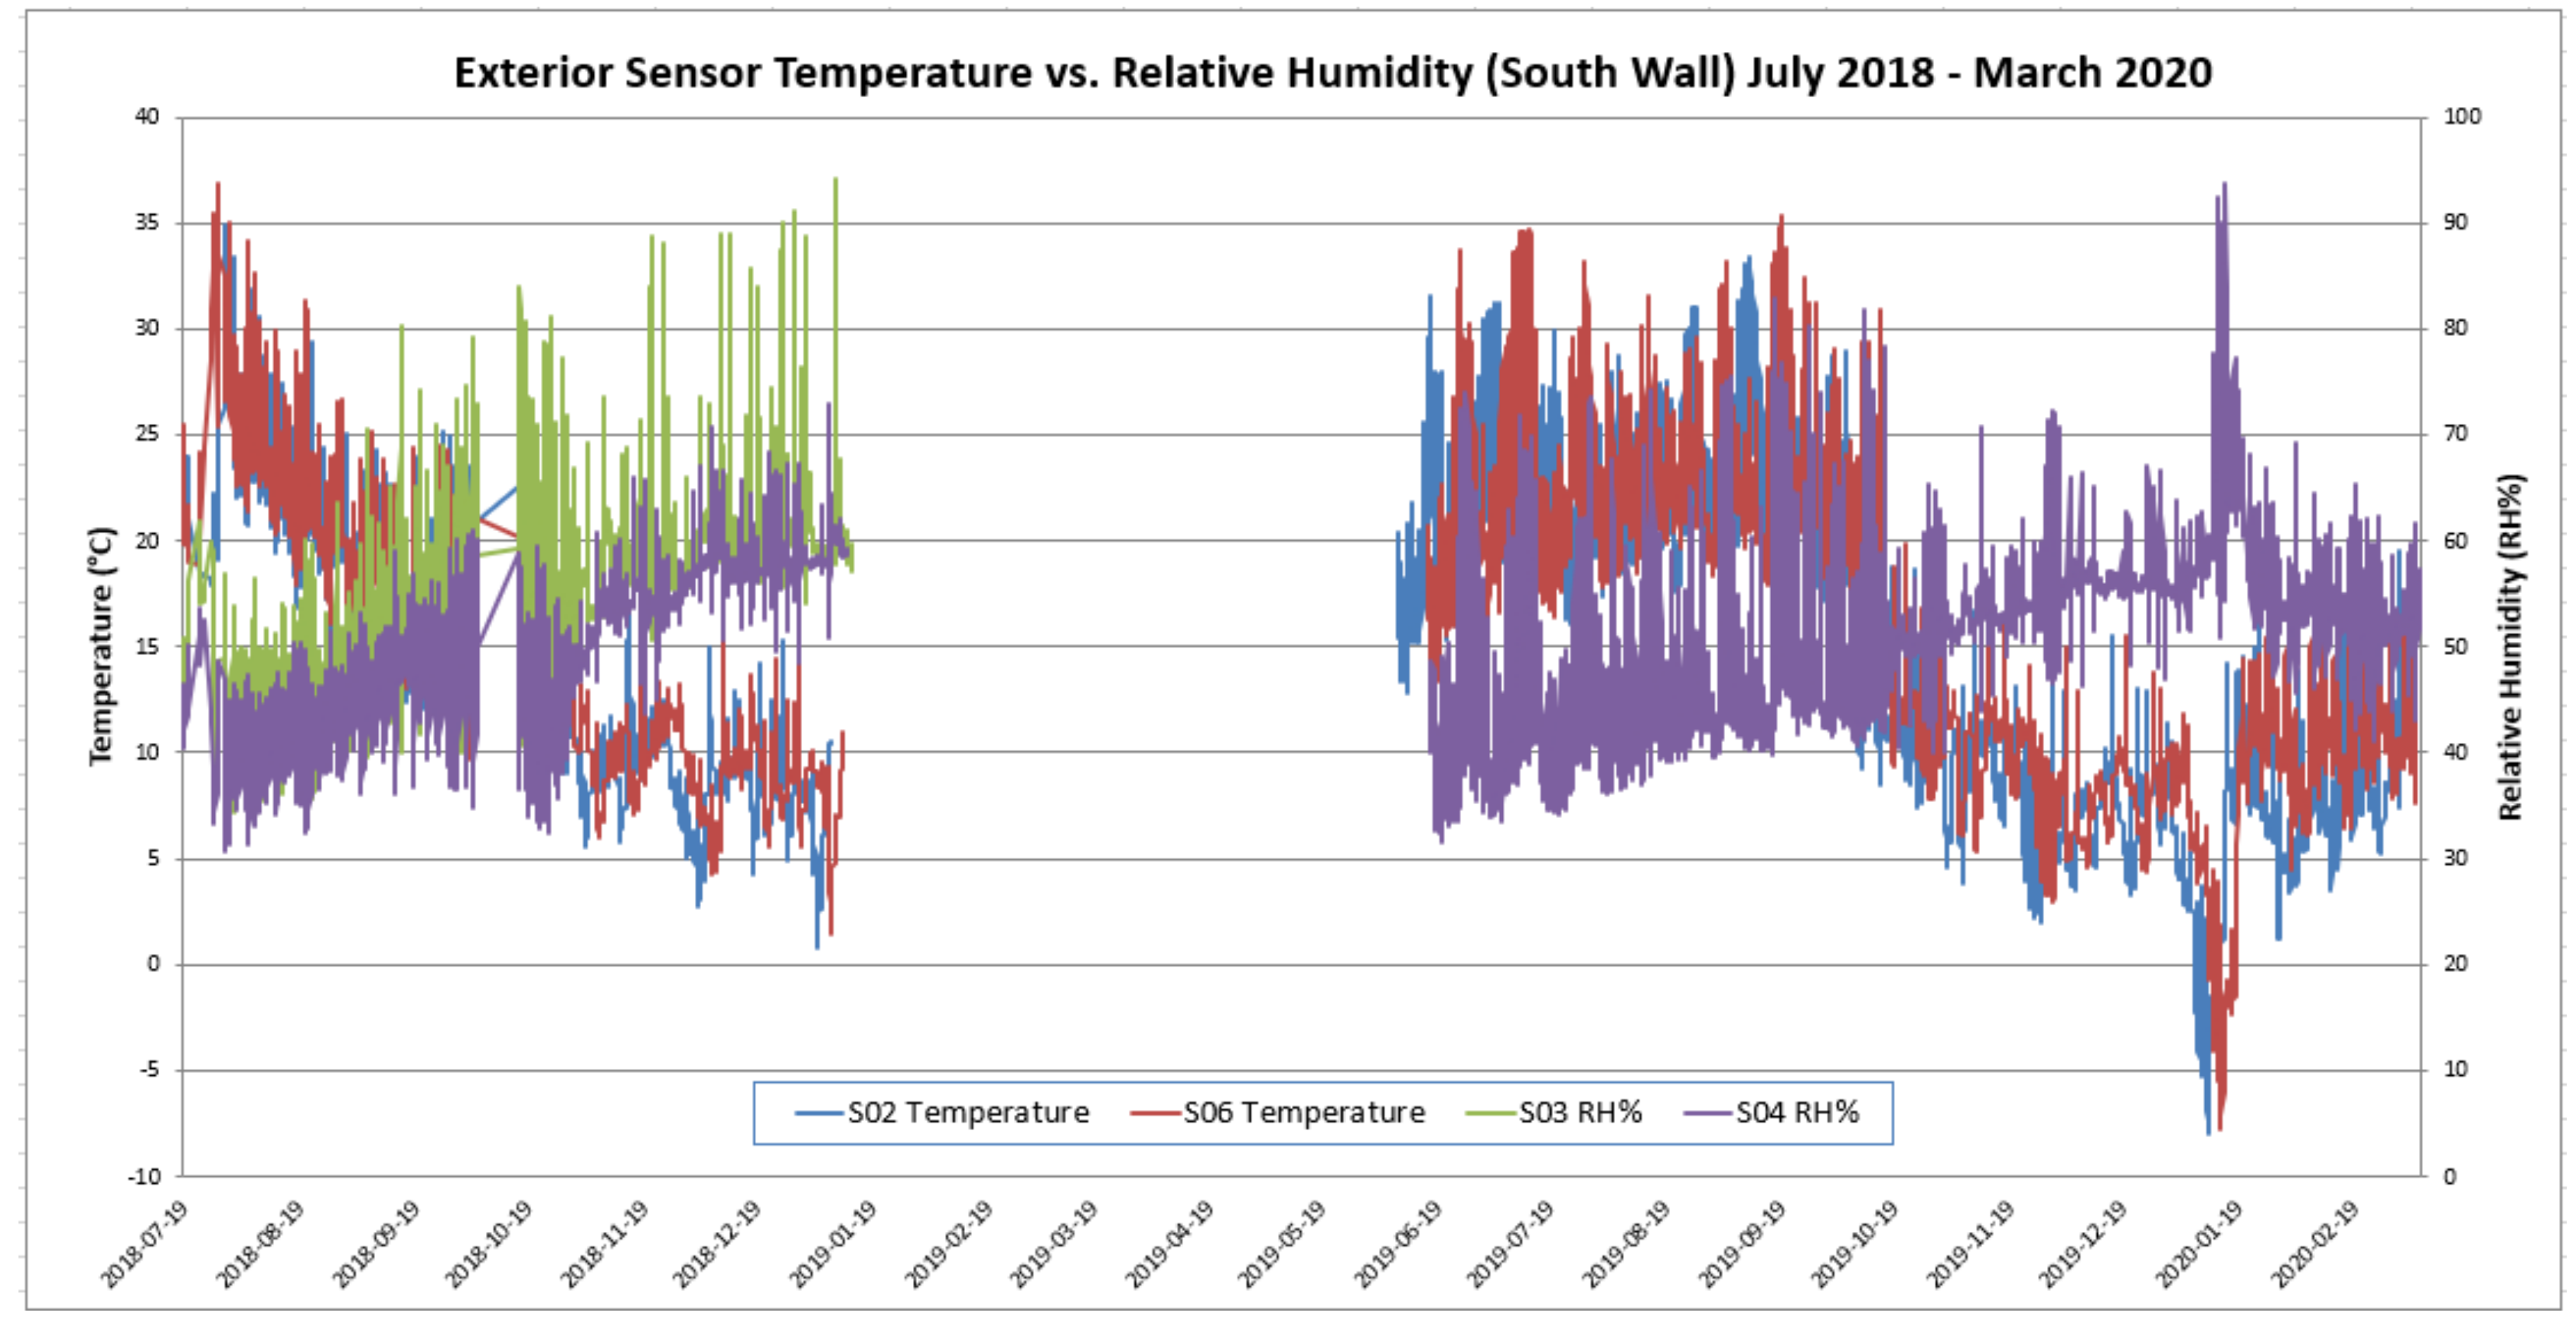
® Plus software. The data collected from the remaining six sensor arrangements showed that at no point during the data collection period of 18 July 2018, to 4 March 2020 was 100 percent relative humidity achieved in either the north or south wall assemblies. The maximum relative humidity values were recorded by the relative humidity sensors located on the interior face of the exterior OSB sheathing in sensor configuration N05 on 19 January 2020 at 09:34, with a value of 84.84%, and sensor configuration S03 on 7 January 2019 at 17:00 at 94.24%. The dates of these readings correspond to one of the coldest weather periods recorded during the data collection period.
Further review of the data recorded by the relative humidity sensor in sensor configuration S03 found that the reported values were not found to be consistent with the other values recorded by the sensors in the south wall (
Figure 5). For the date on which the highest RH value was recorded by the sensor, we expect a similar value from the sensor located in the same position in sensor configuration S04. On 7 January 2019, when the sensor in configuration S03 recorded an RH value of 94.24%, the sensor in the same position in configuration S04 recorded a RH value of 65.98%. An additional check of the RH sensors found in the center of the wall assembly in sensor configurations S02 and S06 for the same date and time show values of 68.52% and 51.13% RH, respectively.
Due to the inaccessibility of the sensor configuration within the wall assembly, the source of the discrepancy in the values recorded by the exterior RH sensor in configuration S03 is unknown. Given that the results from this sensor are not consistent with those reported by configurations S04, S02 and S06, the values reported were not included in further analysis.
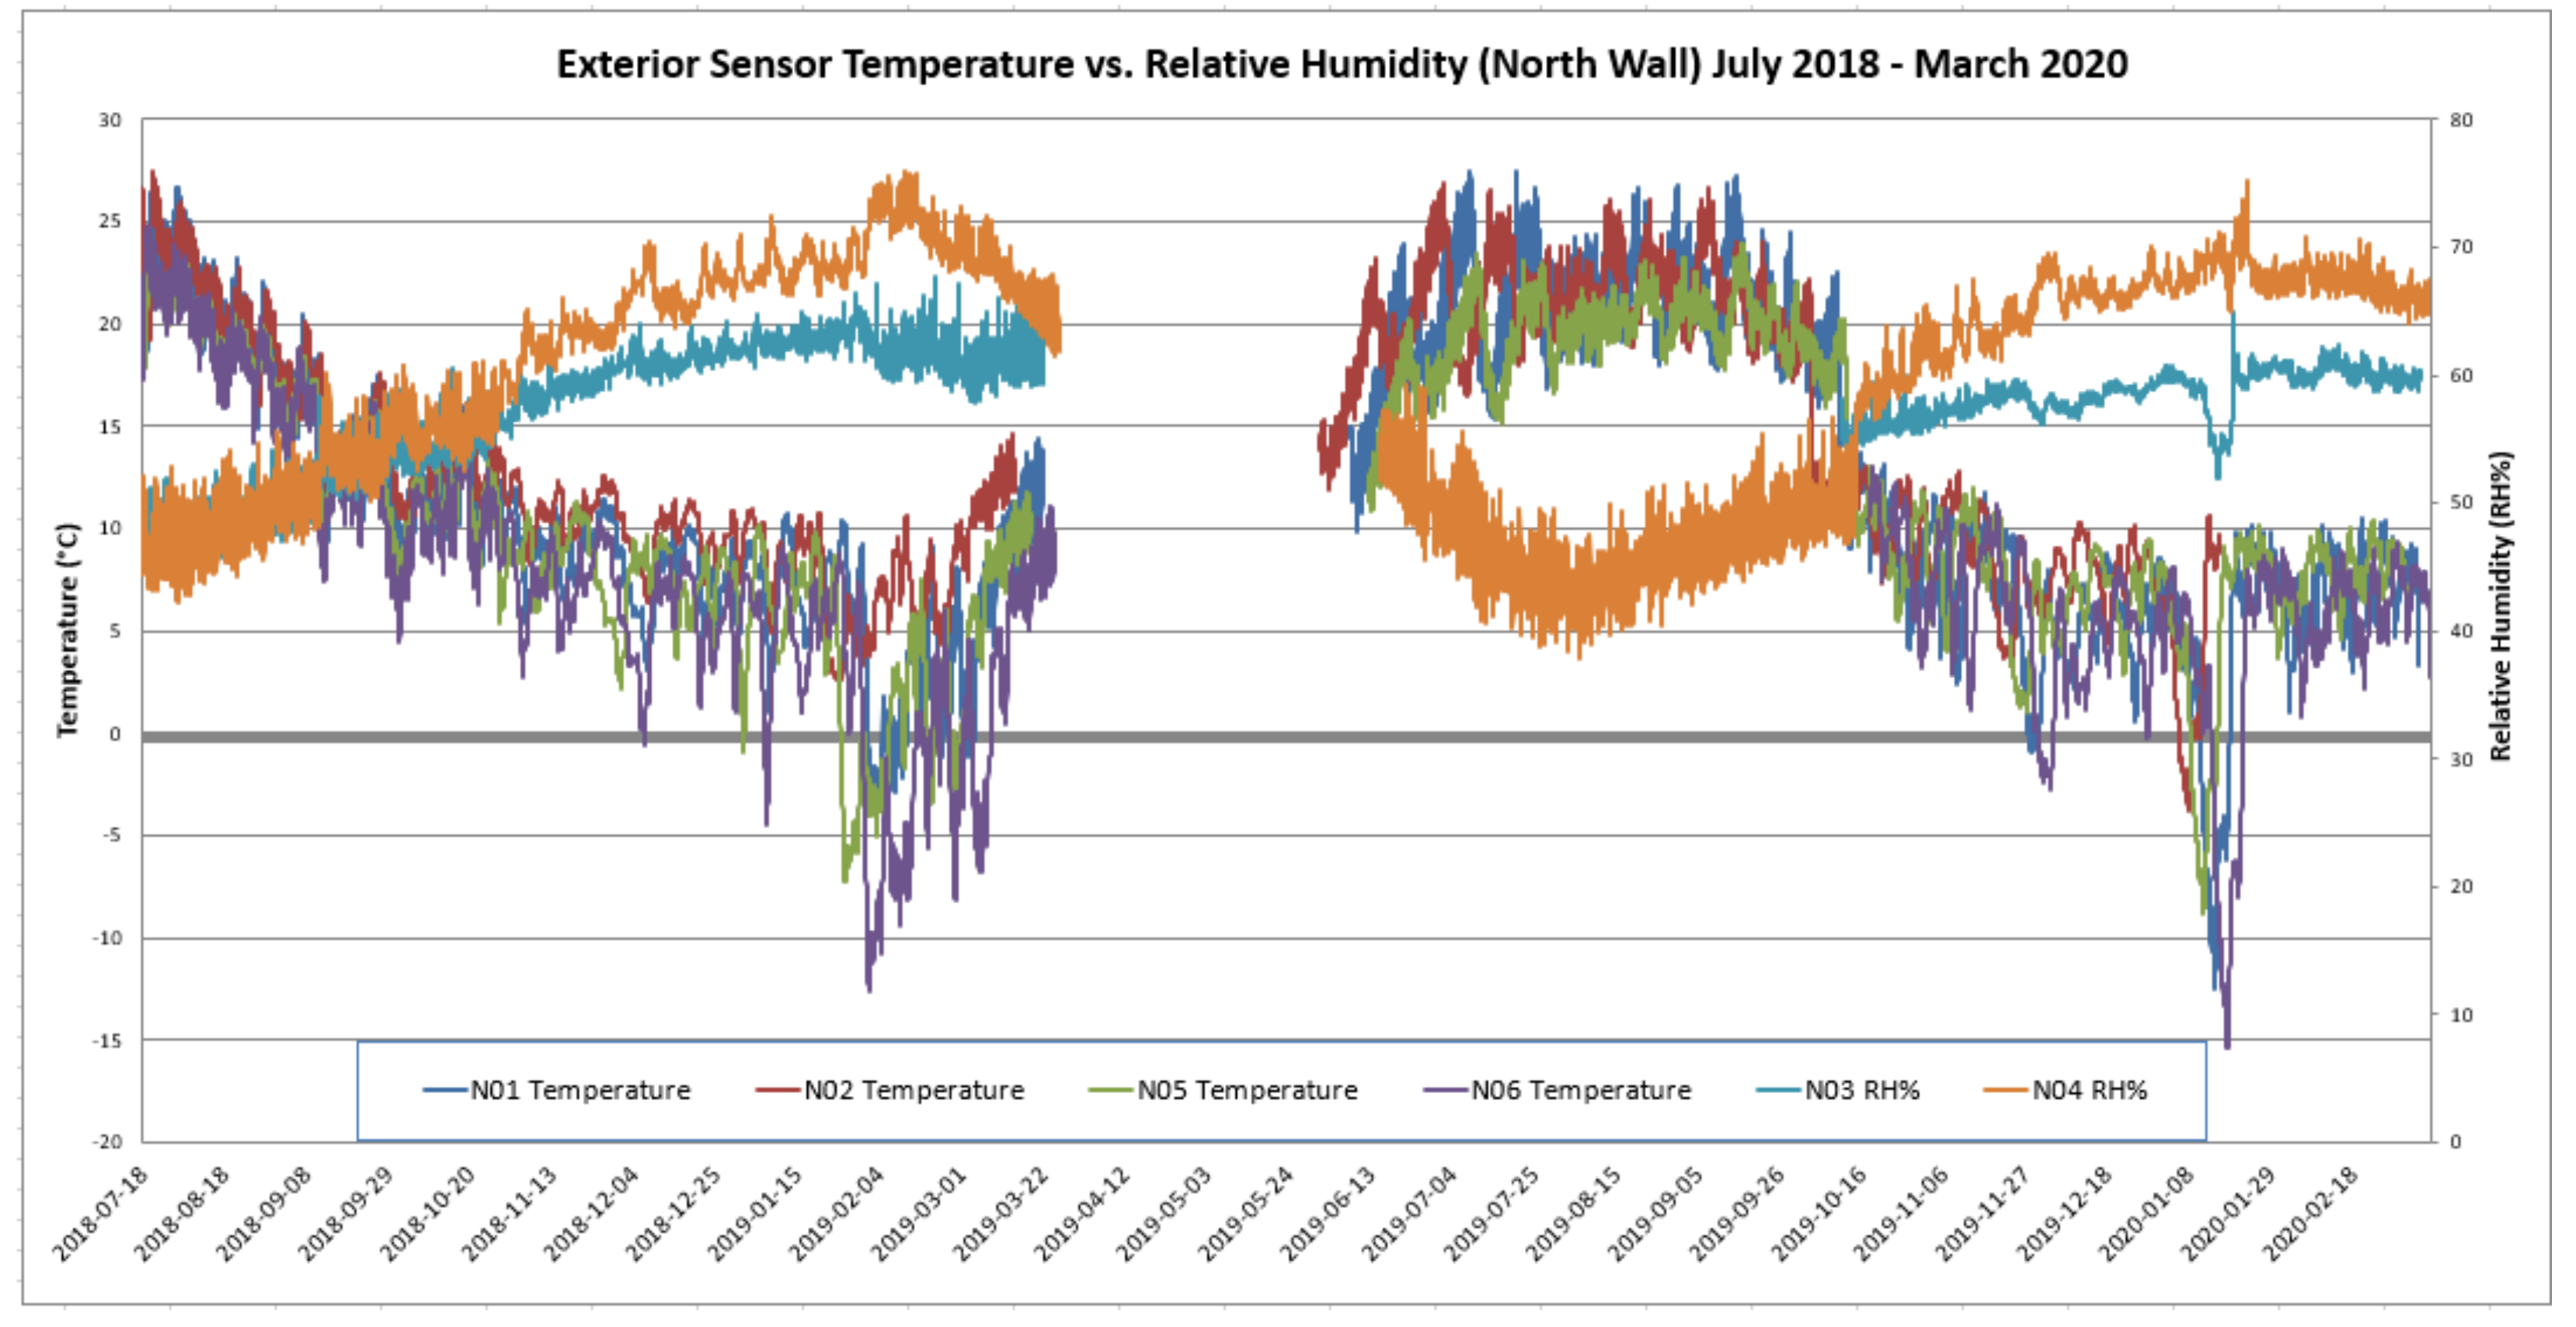
The values recorded by the temperature and relative humidity sensors located towards the exterior side of the assembly in the six north wall sensor configurations are shown in
Figure 6.
The values recorded by the sensors in both the south and north walls show that the temperature and relative humidity of the exterior side of the wall assembly are largely governed by the exterior air temperature, with large fluctuations recorded by the sensors in the south wall configurations due to solar heat gain on the building façade. The values recorded by the sensors located towards the interior side of the north and south walls, not shown here, show similar results, with the recorded values reflective of the interior climate conditions of the lab.
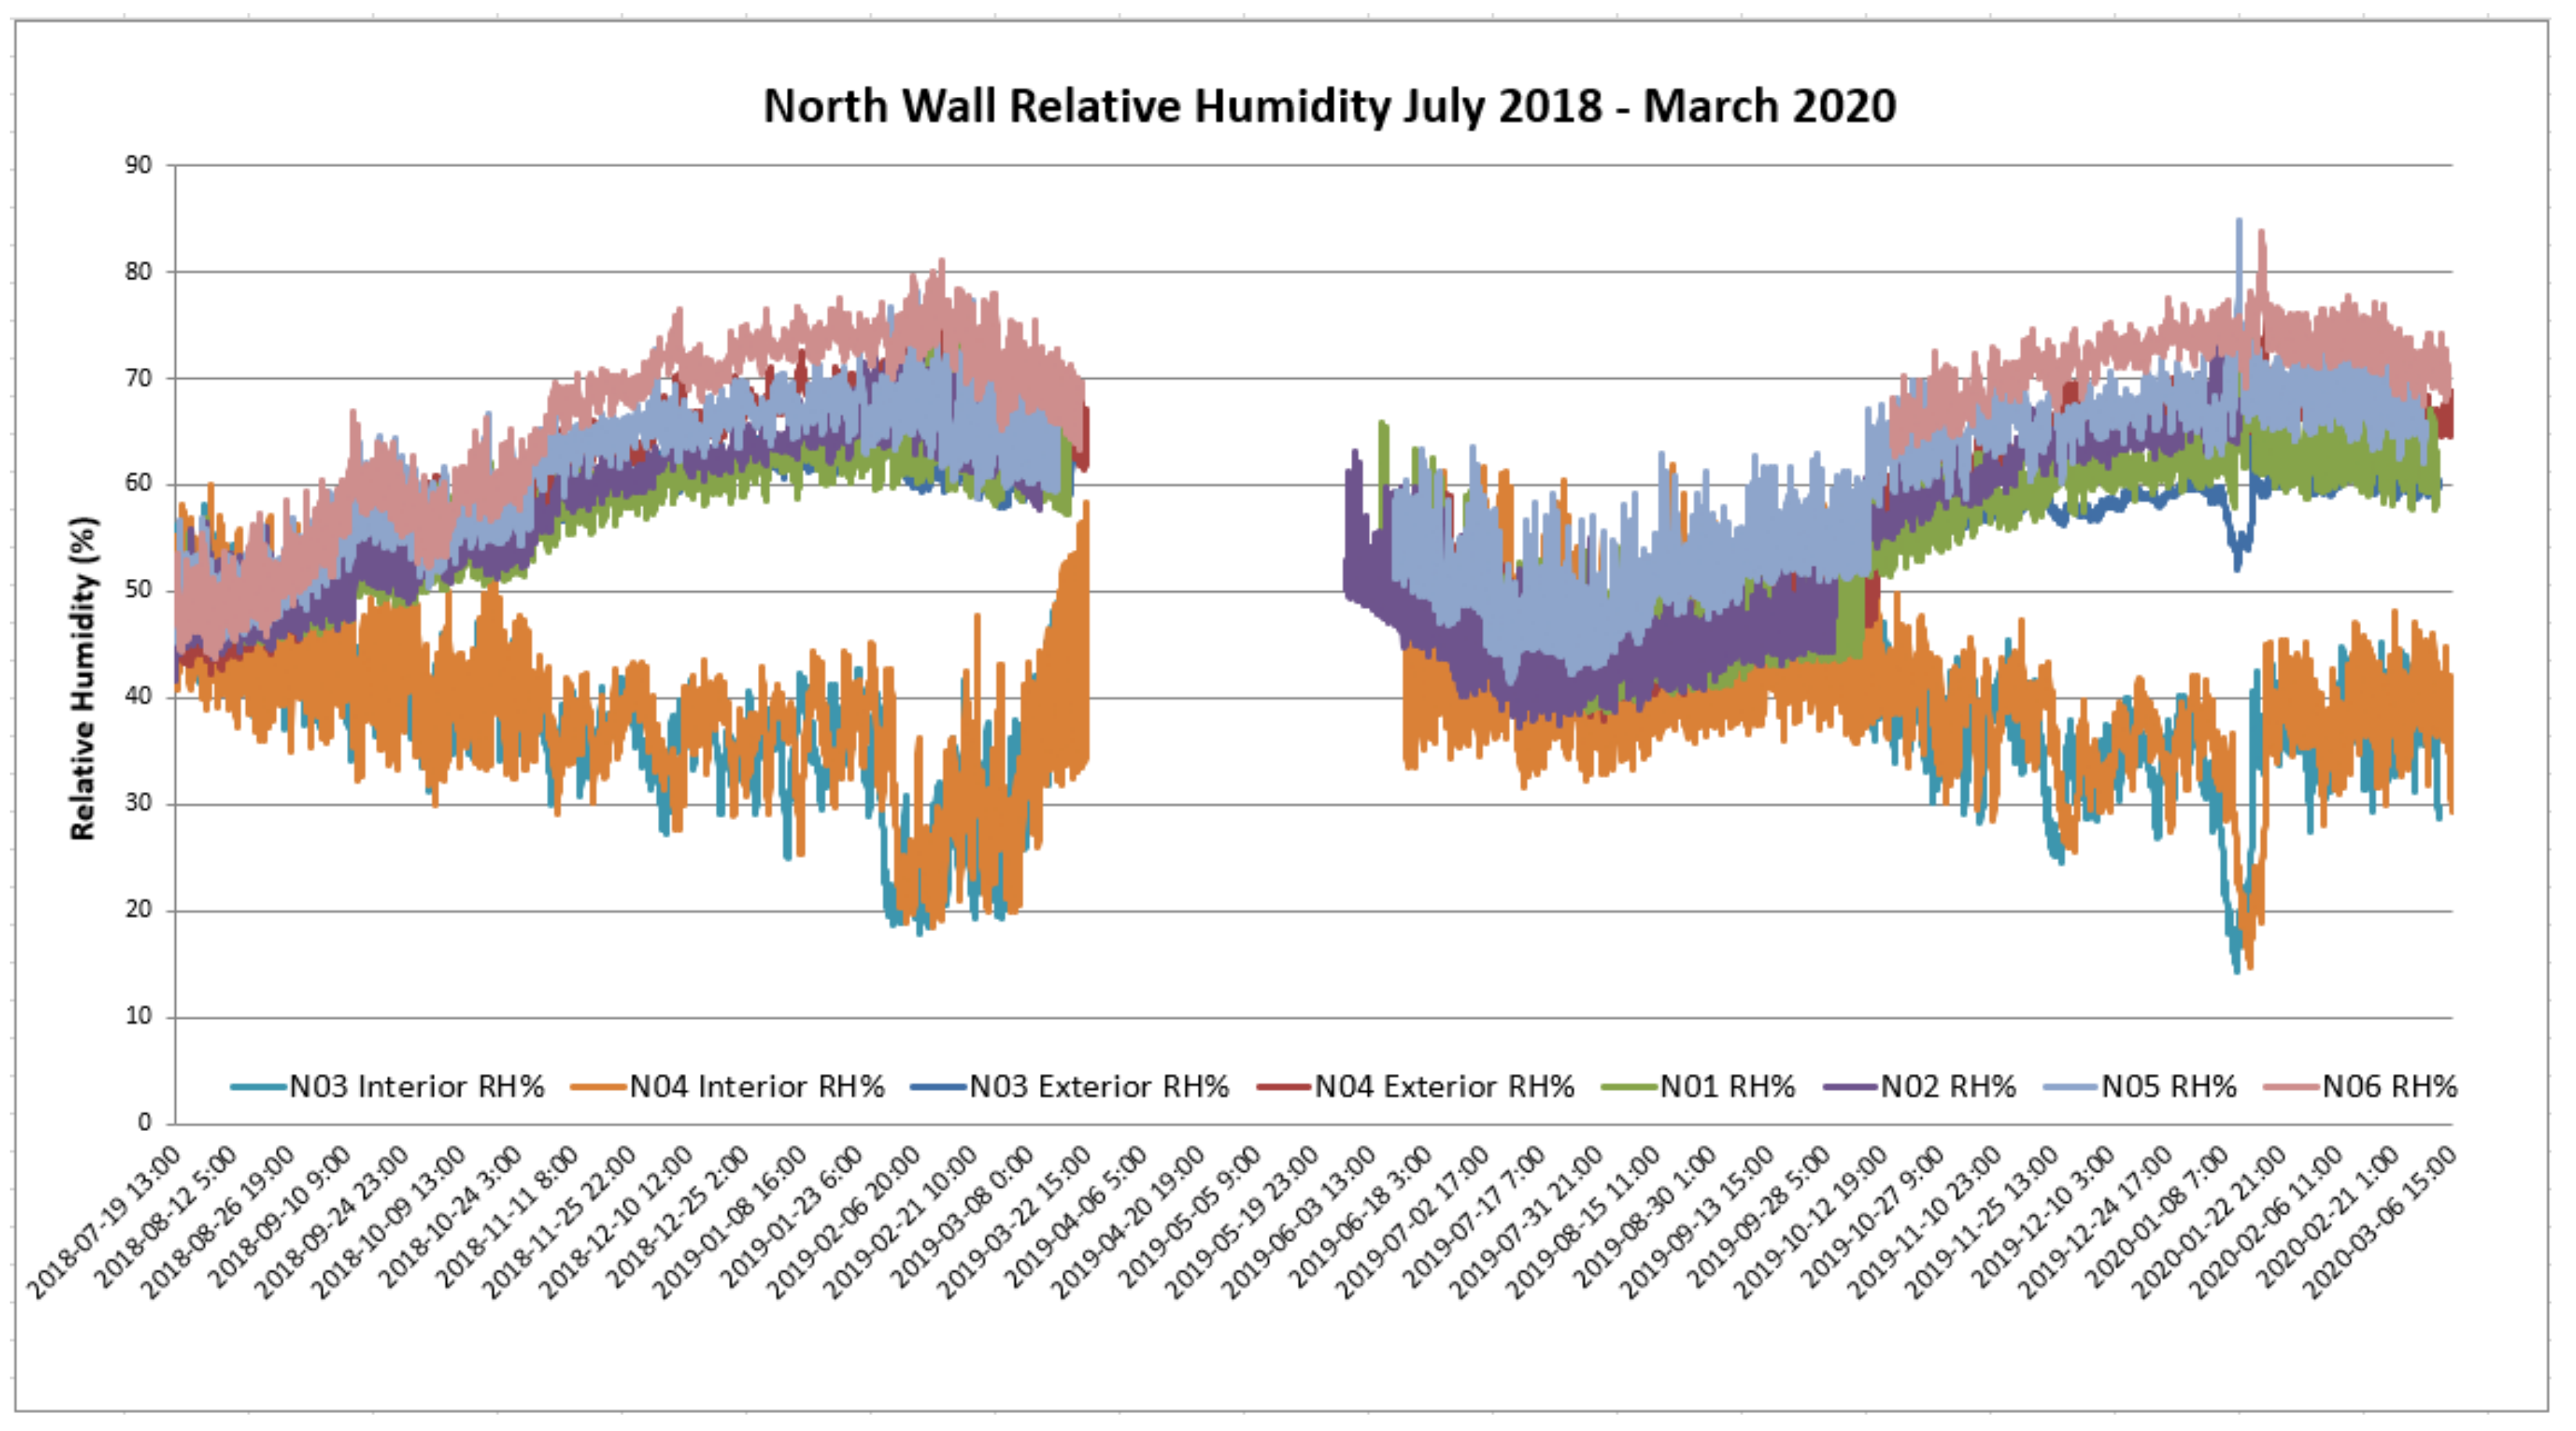
The relative humidity values measured by all sensors in configurations N01-N06 for the period of 18 July 2018–4 March 2020 are shown in
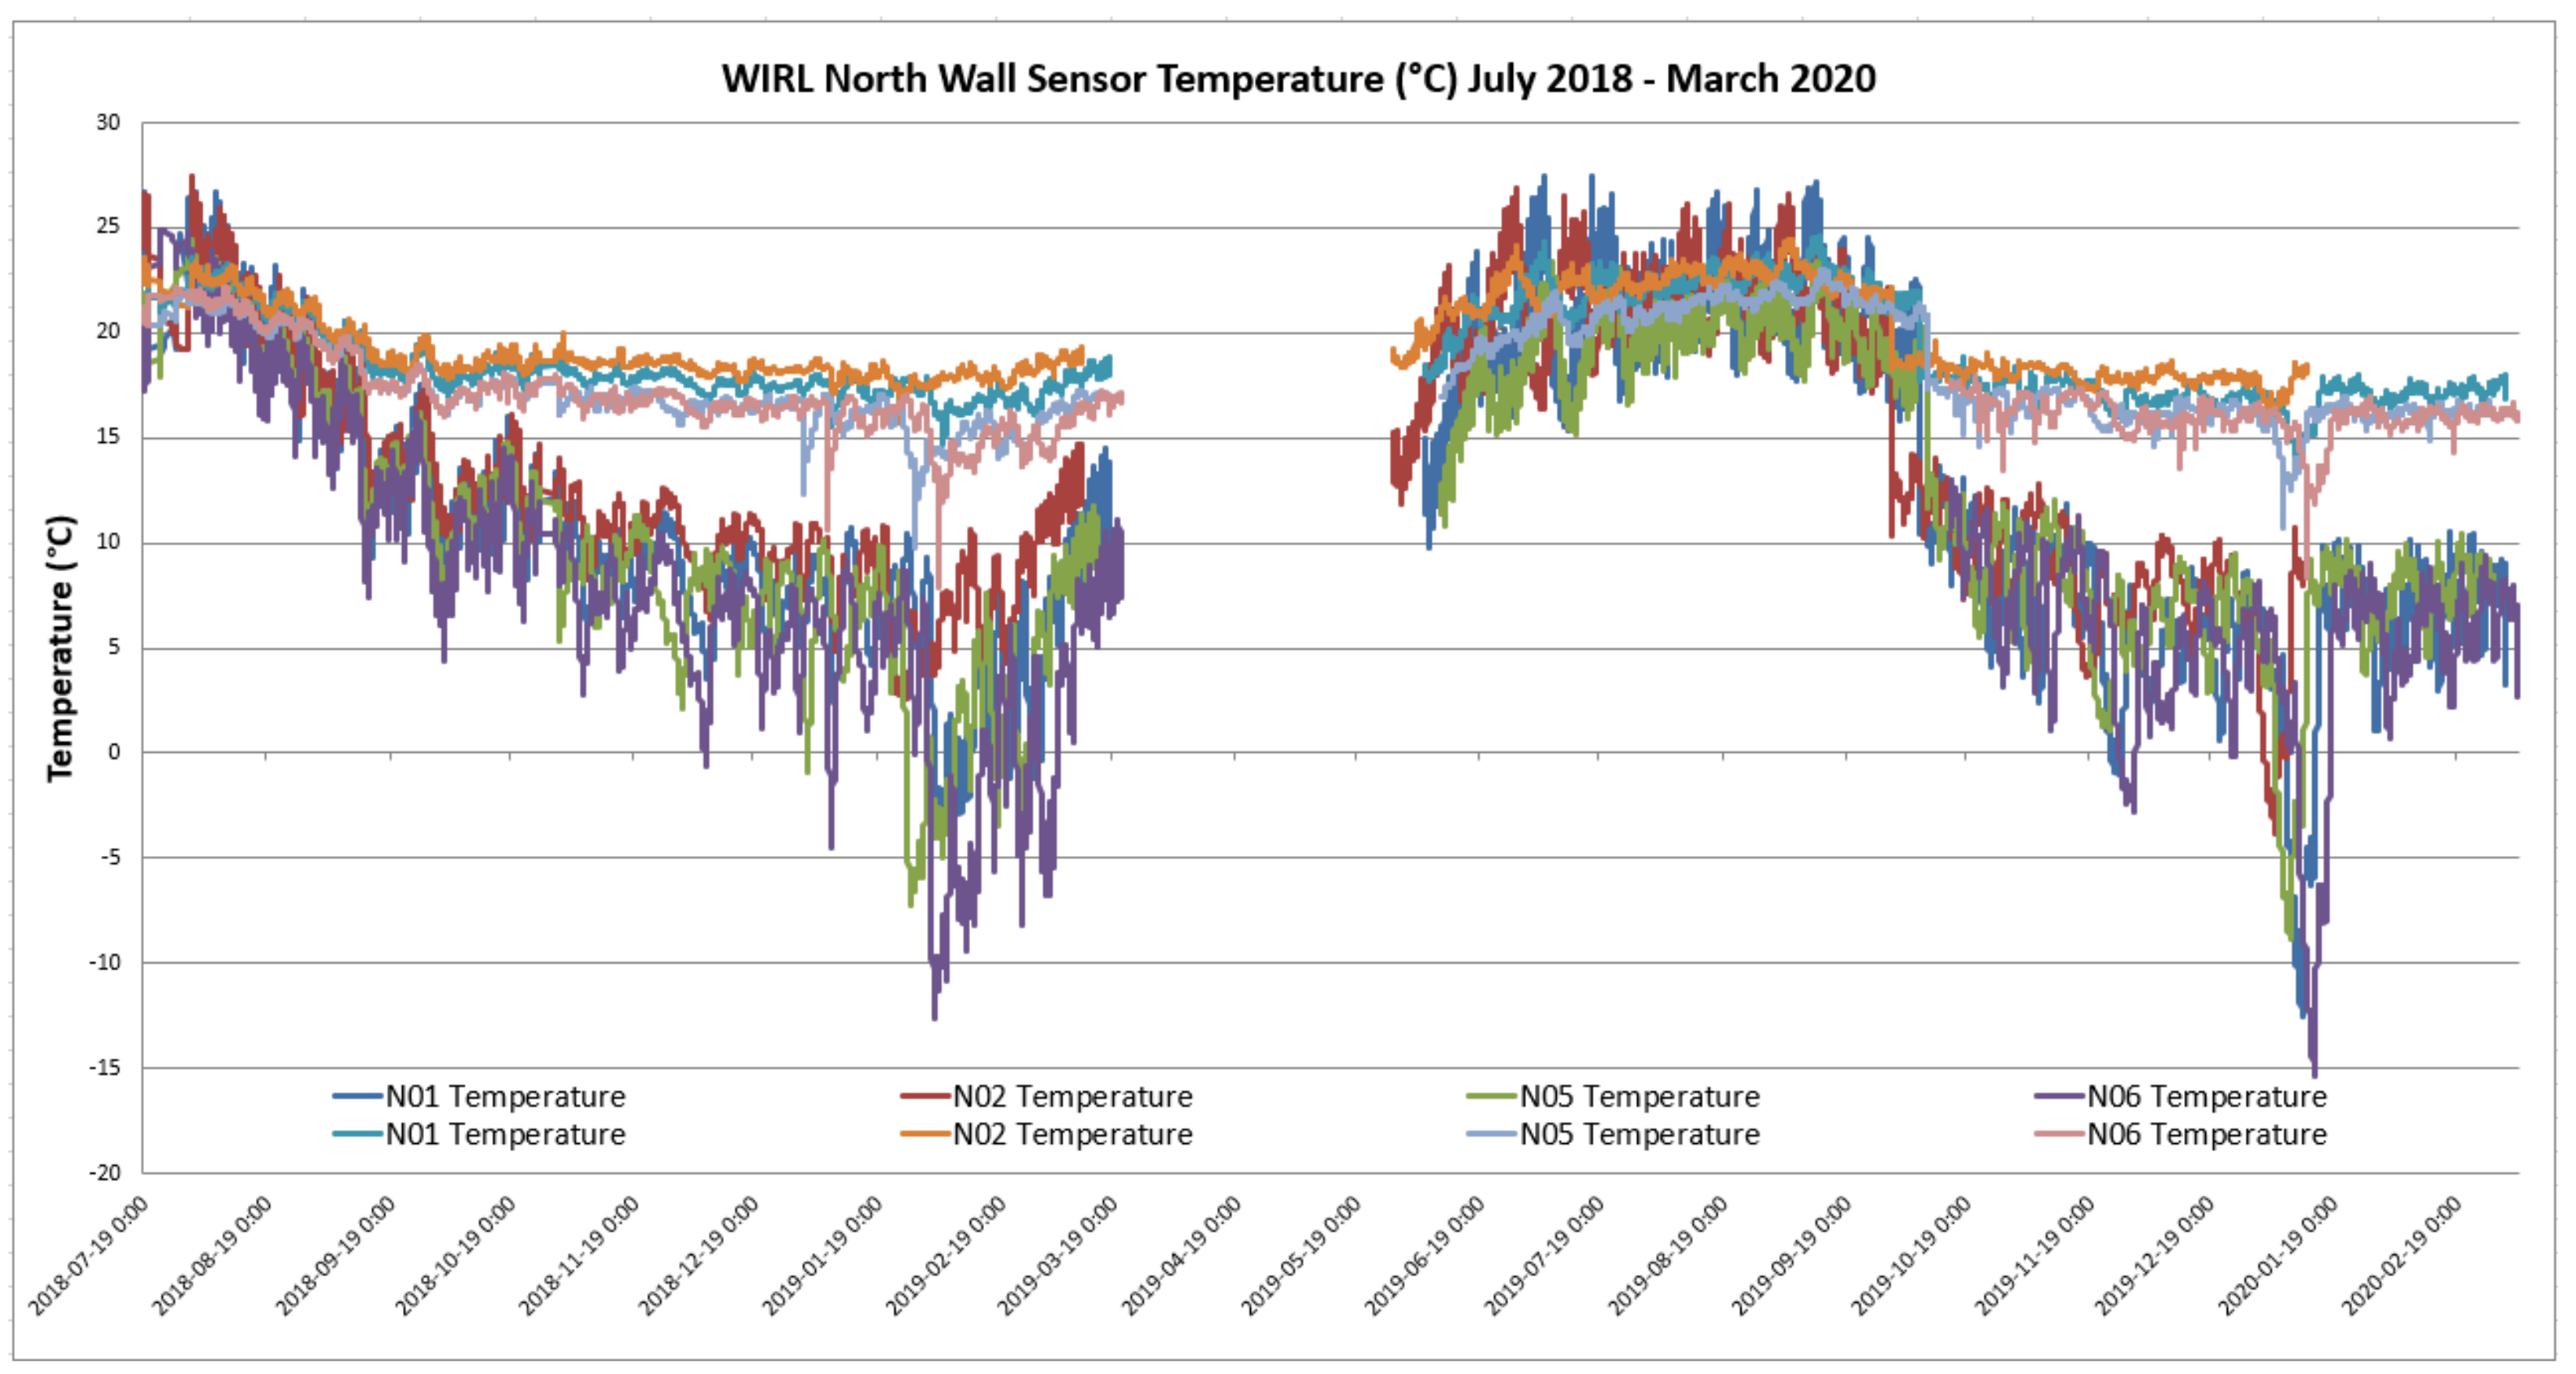
Figure 7. From the values measured by the sensors we can see that the relative humidity of the center of the wall closely follows the behavior of the exterior side of the assembly and is largely governed by the exterior air temperature. In addition, a stratification of the results can be seen, with higher relative humidity values recorded by the sensors at a lower position vertically in the wall. These results are also reflected in the temperature values recorded by the sensors in the north wall, shown in
Figure 8, with lower temperature values recorded by the sensors at a lower position in the assembly. This stratification of temperature and relative humidity may be due to a similar stratification of air temperature in the lab space adjacent to the assembly and subsequent conductive and radiant heat transfer, convective air movement within the wall assembly itself, or uneven moisture distribution within the assembly materials. As the initial moisture content of the envelope assembly materials was not taken and interior temperature sensors were not installed on the wall assemblies, conclusive evidence cannot be given as to the cause for these results.
3.3. Hygrothermal Modelling
The hygrothermal model completed for the WIRL building using the WUFI
® Plus software shows good agreement with the measured performance of the building’s north and south walls.
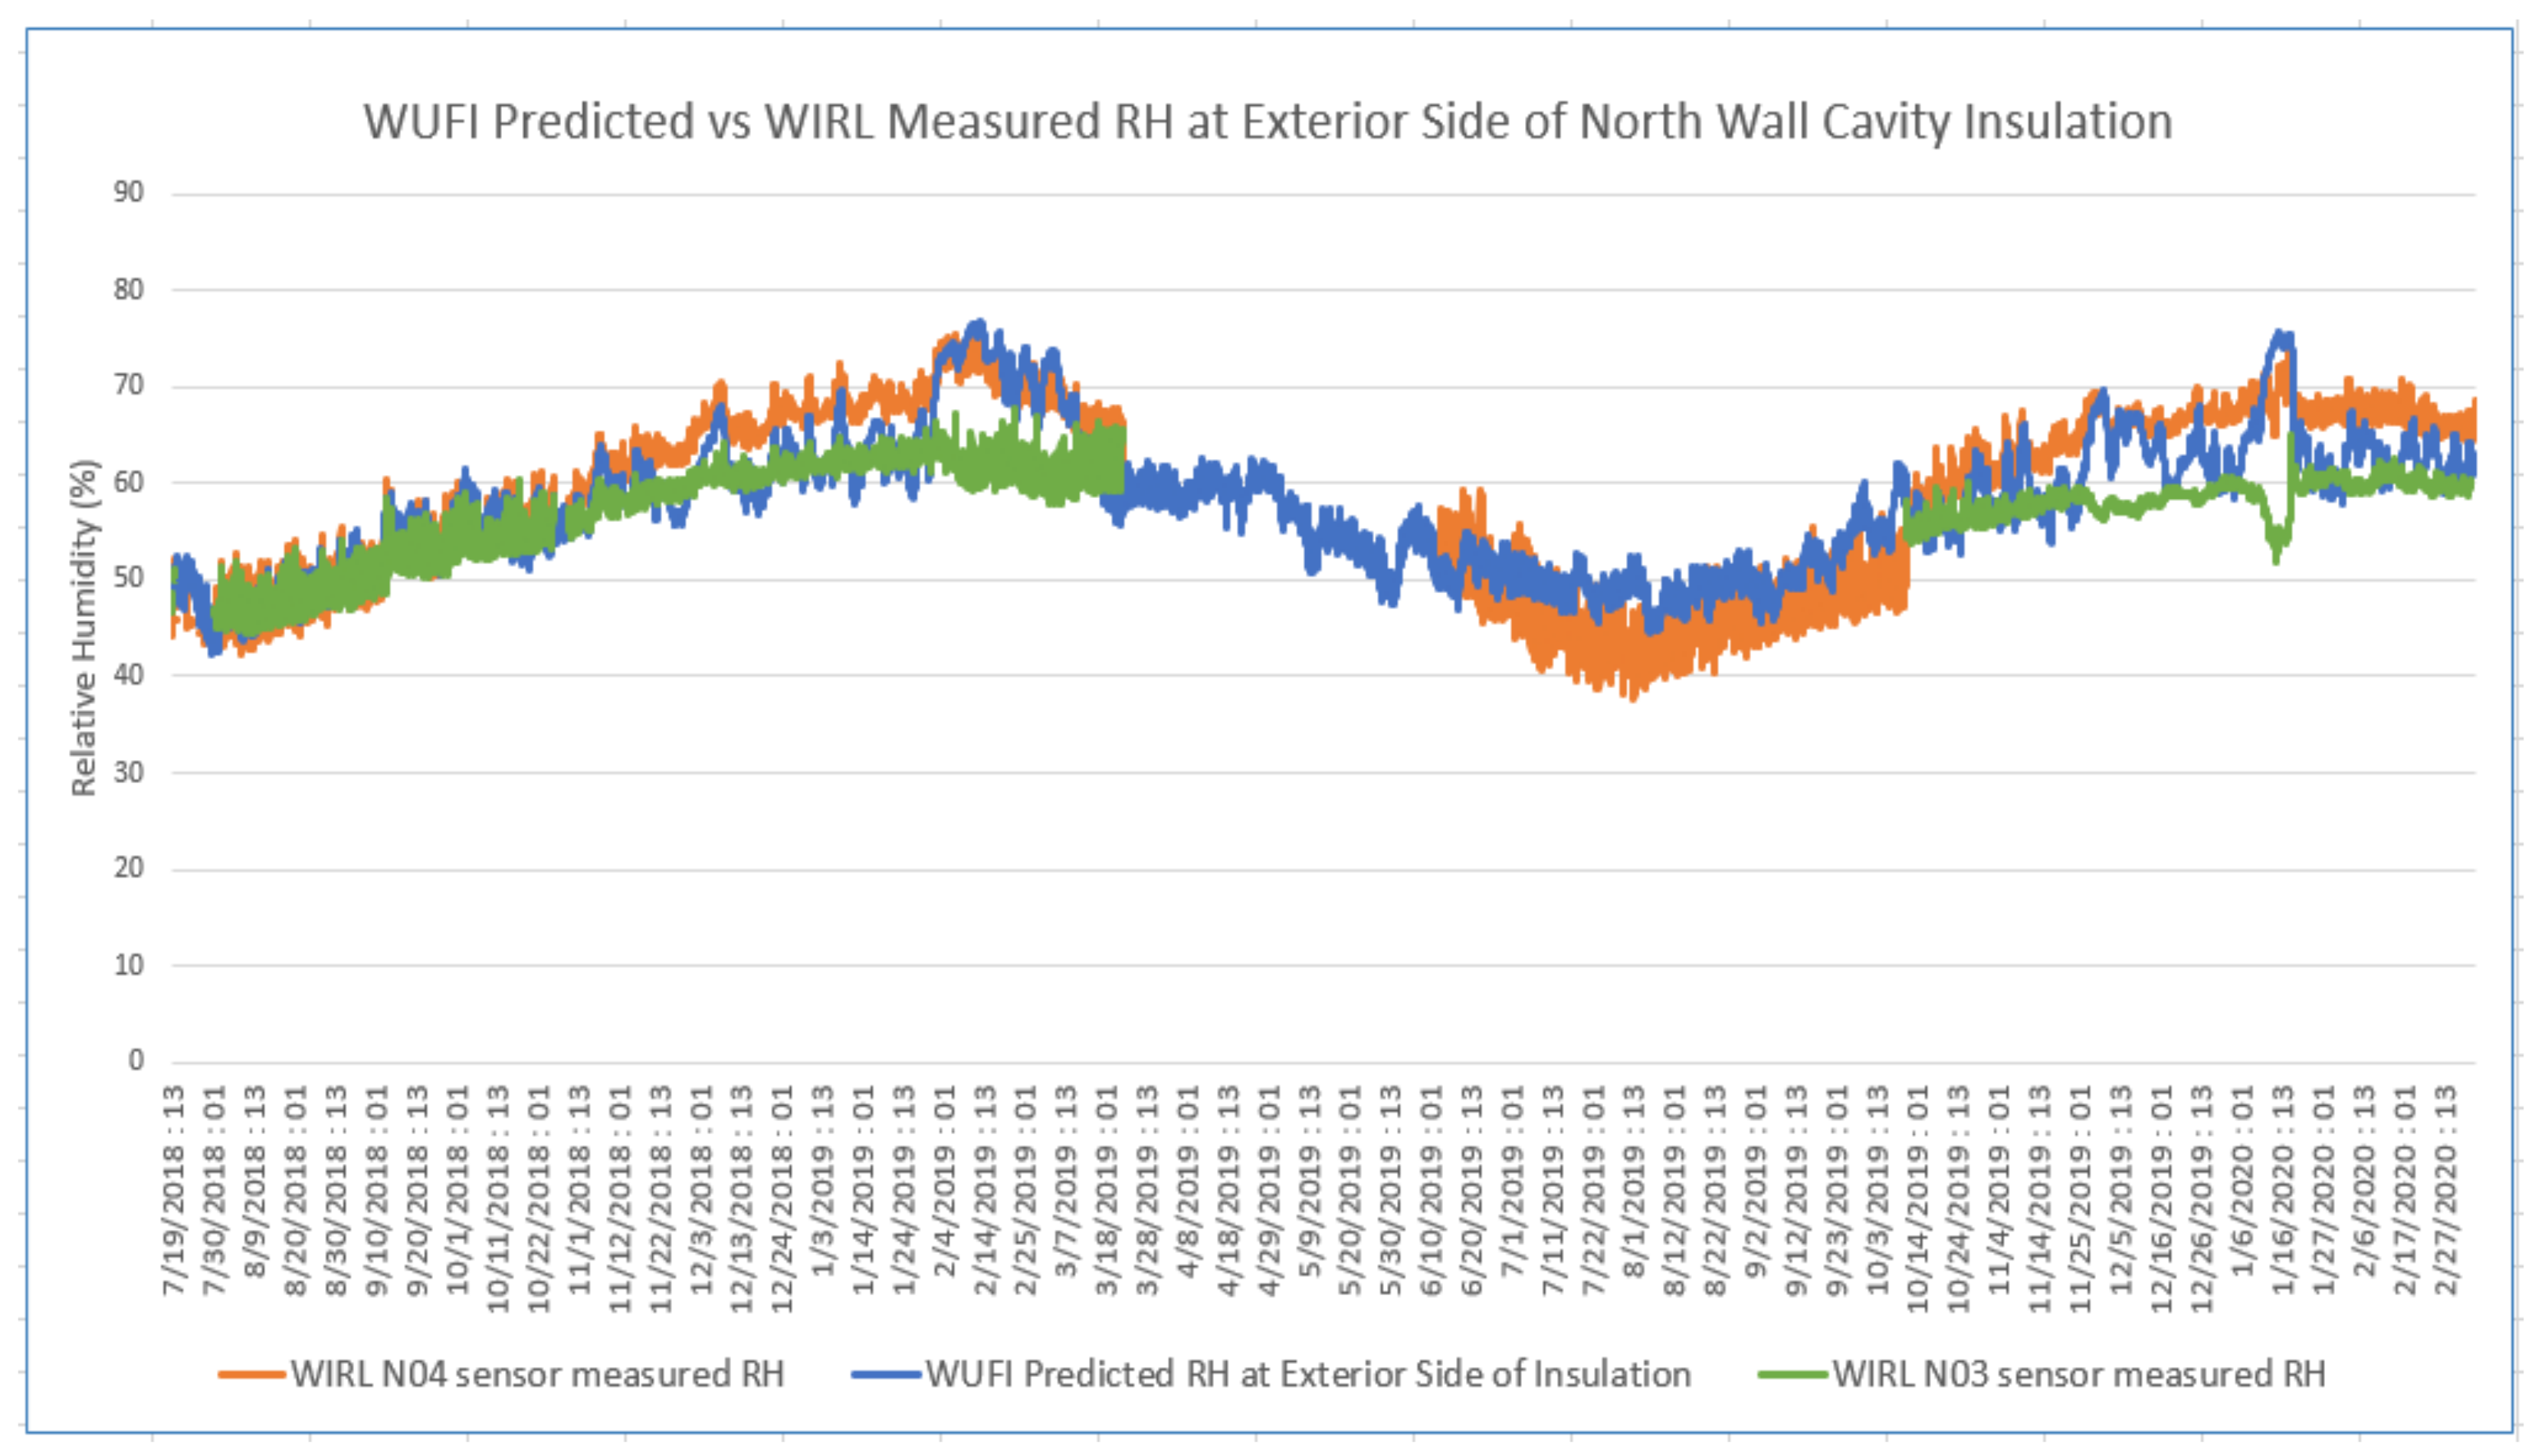
Figure 9 shows the predicted relative humidity at the inner surface of the exterior OSB of the WIRL walls compared to the relative humidity values recorded at this location by the exterior RH sensors in sensor configurations N03 and N04.
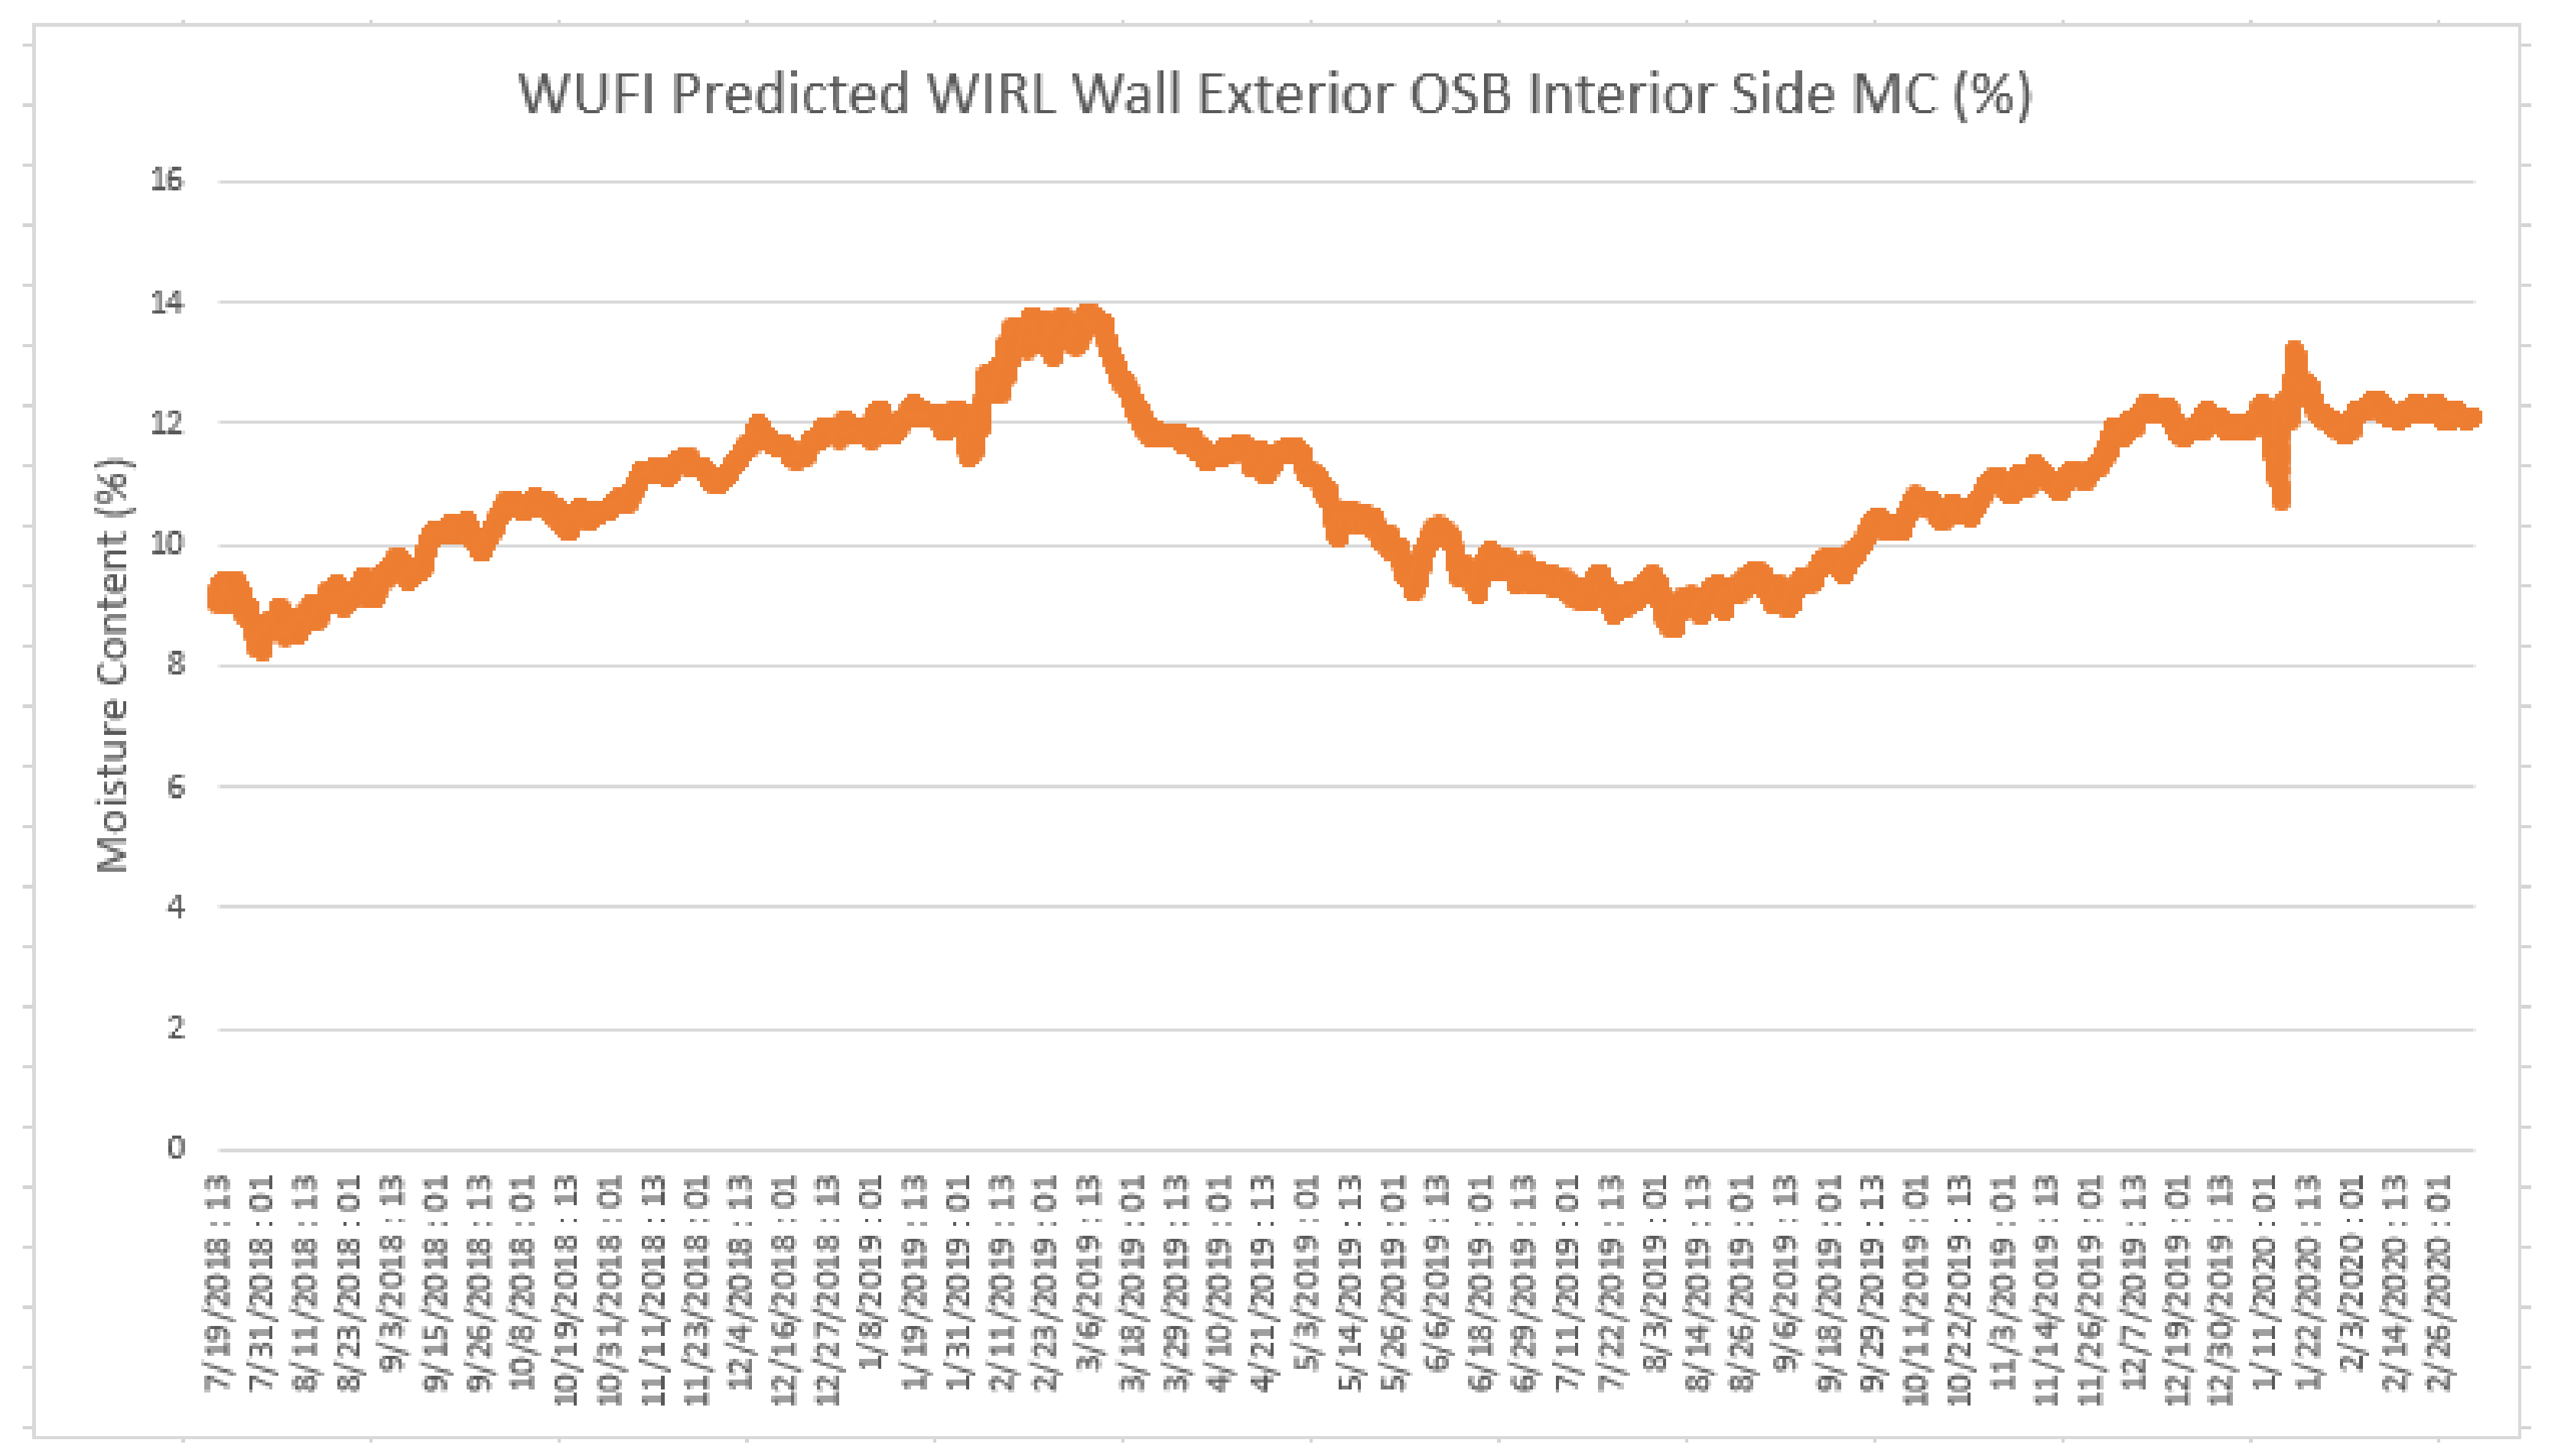
The corresponding predicted moisture content of the interior surface of the exterior OSB, expressed as a percentage, shows a favorable trend with seasonal variations but no cumulative increase over the modeled time period (
Figure 10). A maximum moisture content of 13.81% is calculated by WUFI
® during the first winter of the simulation period.
The results of the validated hygrothermal simulation completed for the data collection period were used to calculate the mould growth index for the interior face of the exterior sheathing in the north wall assembly using the WUFI
® Bio platform [
24]. WUFI
® Bio calculates mould growth risk based on the VTT model [
25], which derives a mould growth index value from one (some growth only visible with microscopy) to six (100% visual coverage observed) based on constant and transient temperature and relative humidity model outputs. A mould index value less than three is often used as a threshold value, with index values higher than three considered risky [
10,
21,
26]. Based on the calculated performance of the exterior north wall assembly, a mould index of zero is calculated (
Figure 11). These results demonstrate a favorable long-term performance of the WIRL building under the given parameters and indicate no long-term moisture accumulation leading to deterioration in the assembly.
Using the validated WUFI
® Plus model, hygrothermal performance models under historical and future climate scenarios were calculated using climate files obtained through the National Research Council of Canada [
13]. The datasets provided are based on CanESM2 large ensemble simulations that have been downscaled and bias-corrected with reference to observations [
27]. Hygrothermal models for this study were included for historic and projected future climate scenarios for the cities of Vancouver, Calgary, Winnipeg, Ottawa and St John’s and concurrent with 2.0 °C and 3.5 °C increases in global temperatures.
A total of 15 sets of projections for the historical and both of the future temperature rise scenarios were created by the National Research Council to capture internal climate variability of the climate systems. For this study, five projections were used for both global temperature- rise scenarios, and up to three projections were used for the historical climate scenarios. Both the historical and projected future climate datasets are given for a 30-year time period, with the historical dataset set between 1986–2016 and the projected future climate dataset 2034–2064. A review of the historical and future climate projection datasets found an increase in average annual temperature between 2.5–3.5 °C and 4.3–5.7 °C between the 2.0 °C and 3.5 °C global temperature increase scenarios and the historical climate dataset, respectively, for the five cities included in this study. Total precipitation over the 30-year dataset period between the historical and future climate scenarios shows an increase in total rainfall between 1.5–2.5 m and 2.5–4.0 m for the 2.0 °C and 3.5 °C future climate projections compared to the historical climate dataset across the five cities, respectively. The reported values for average annual relative humidity for each city show an increase between 0.50–2.0% and 1.5–2.5% for the 2.0 °C and 3.5 °C future climate projections above the historic values, respectively.
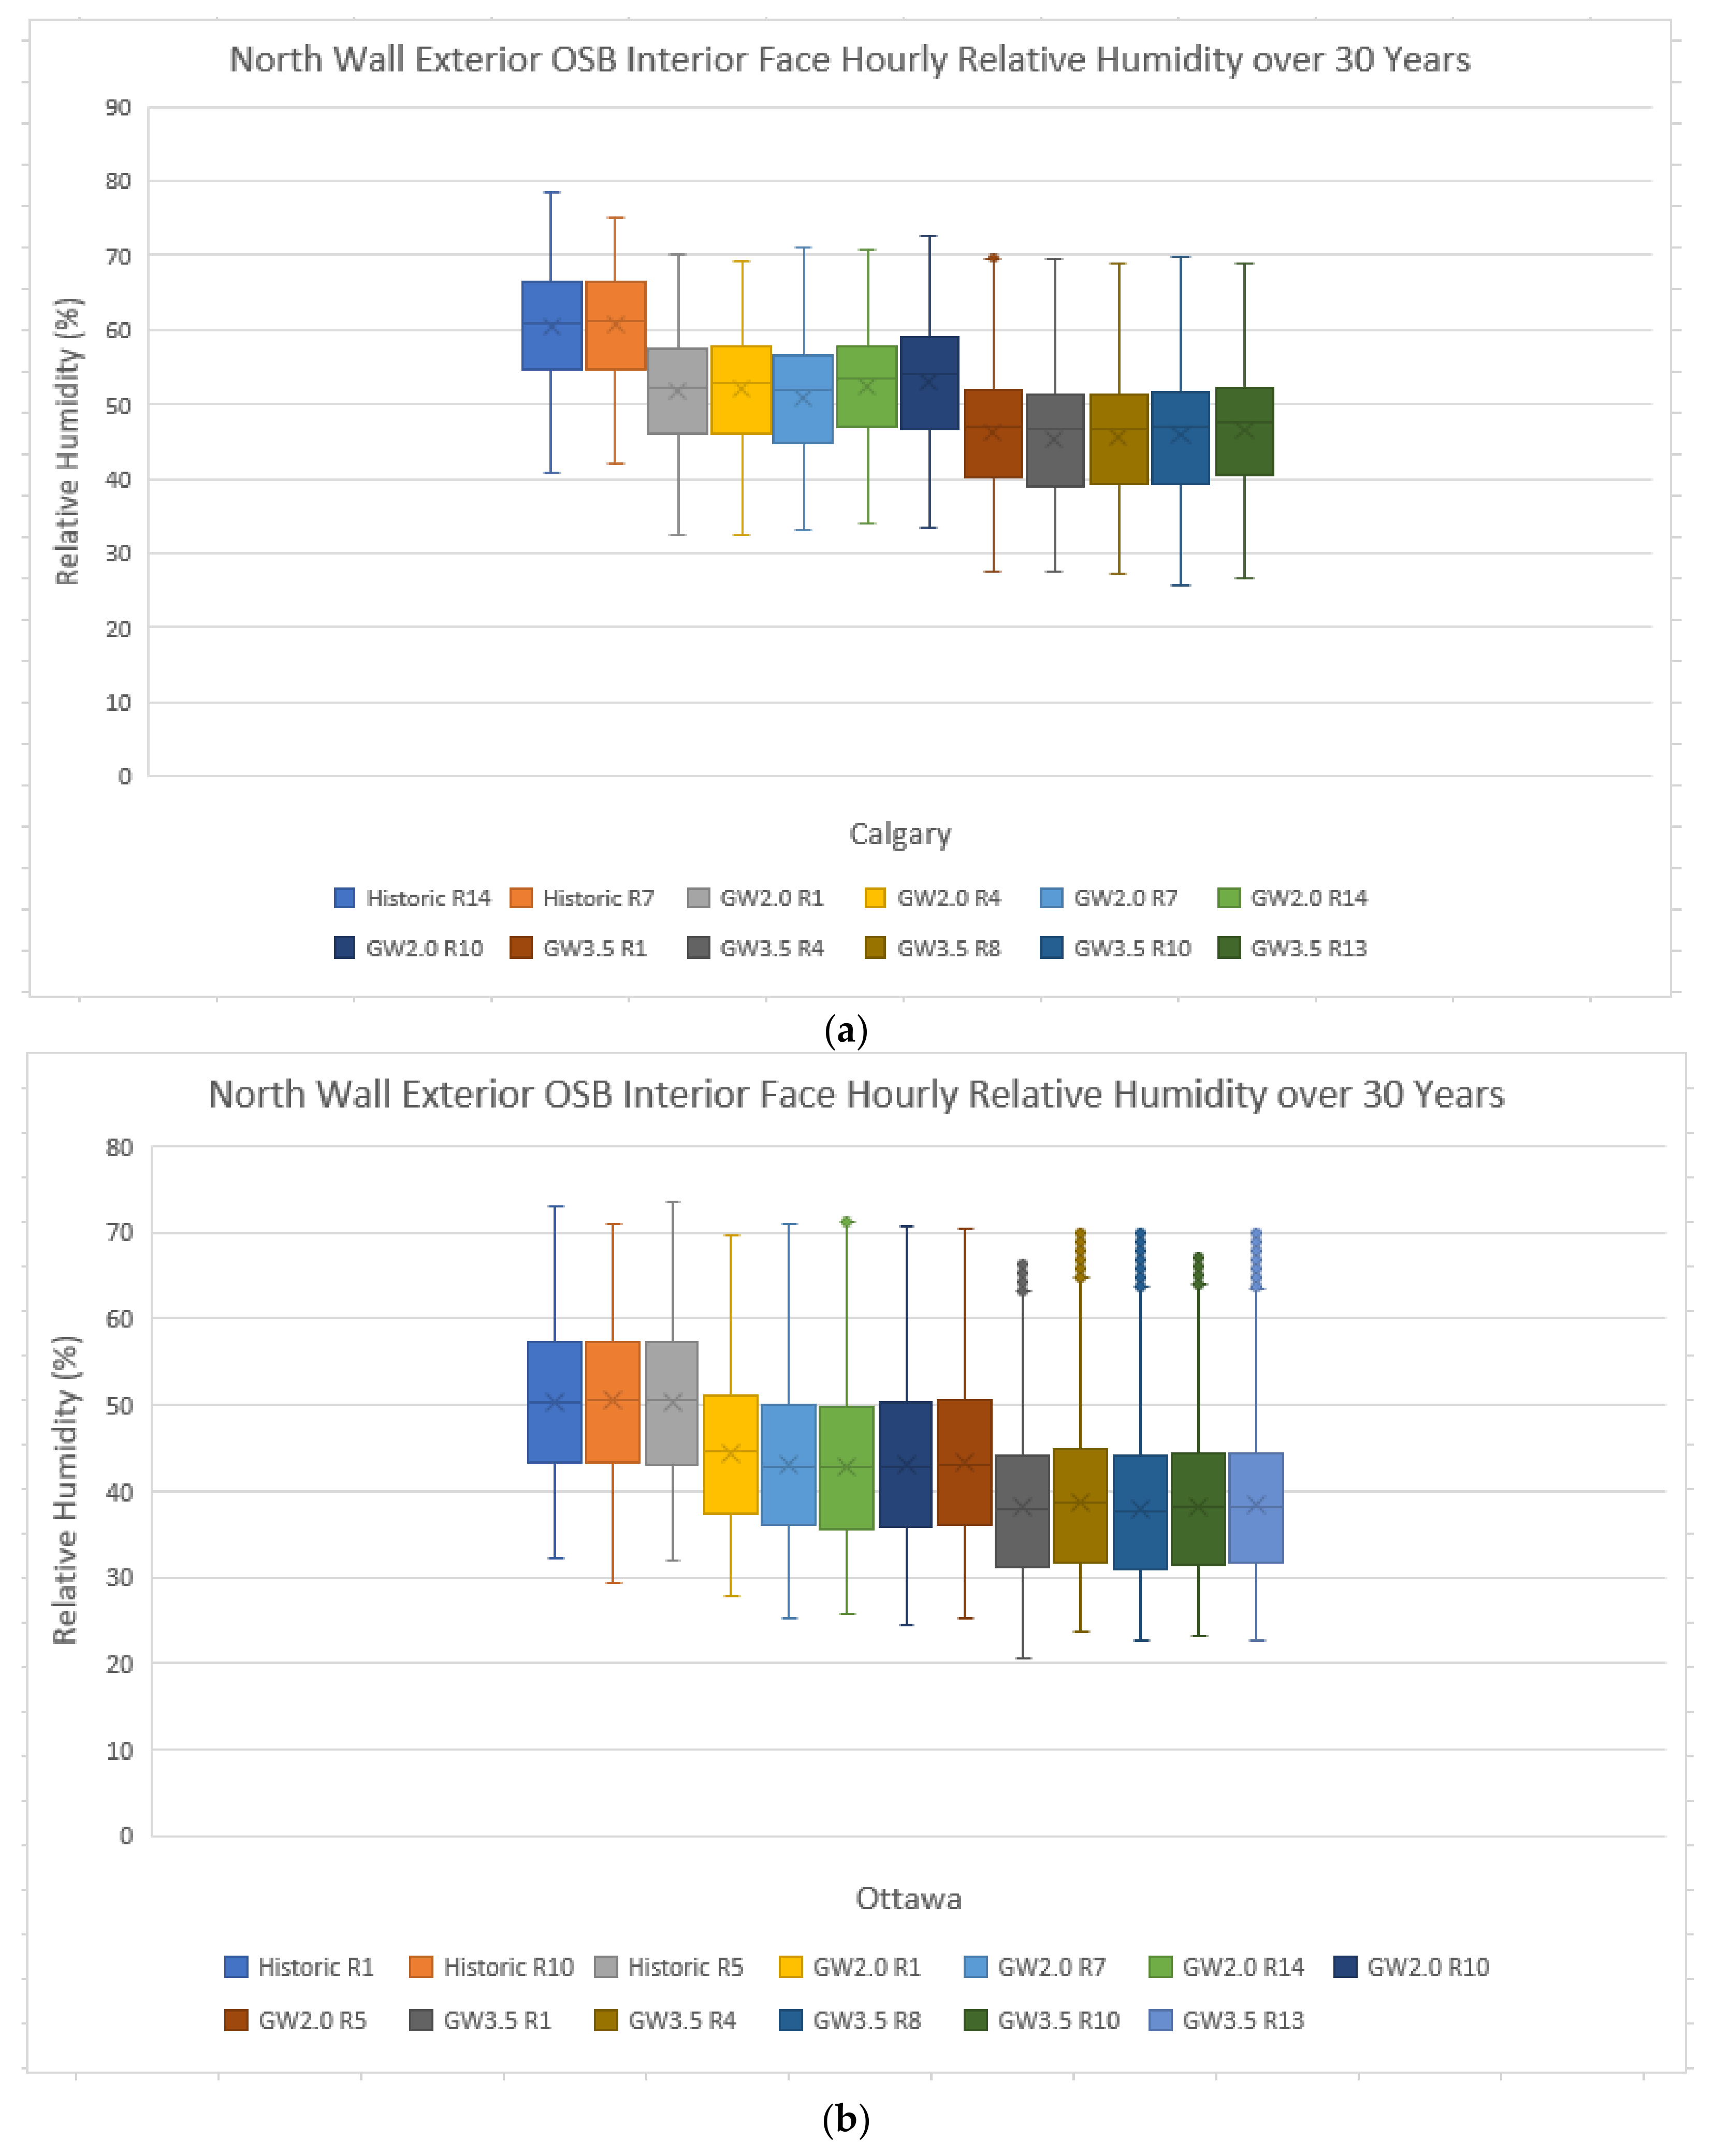
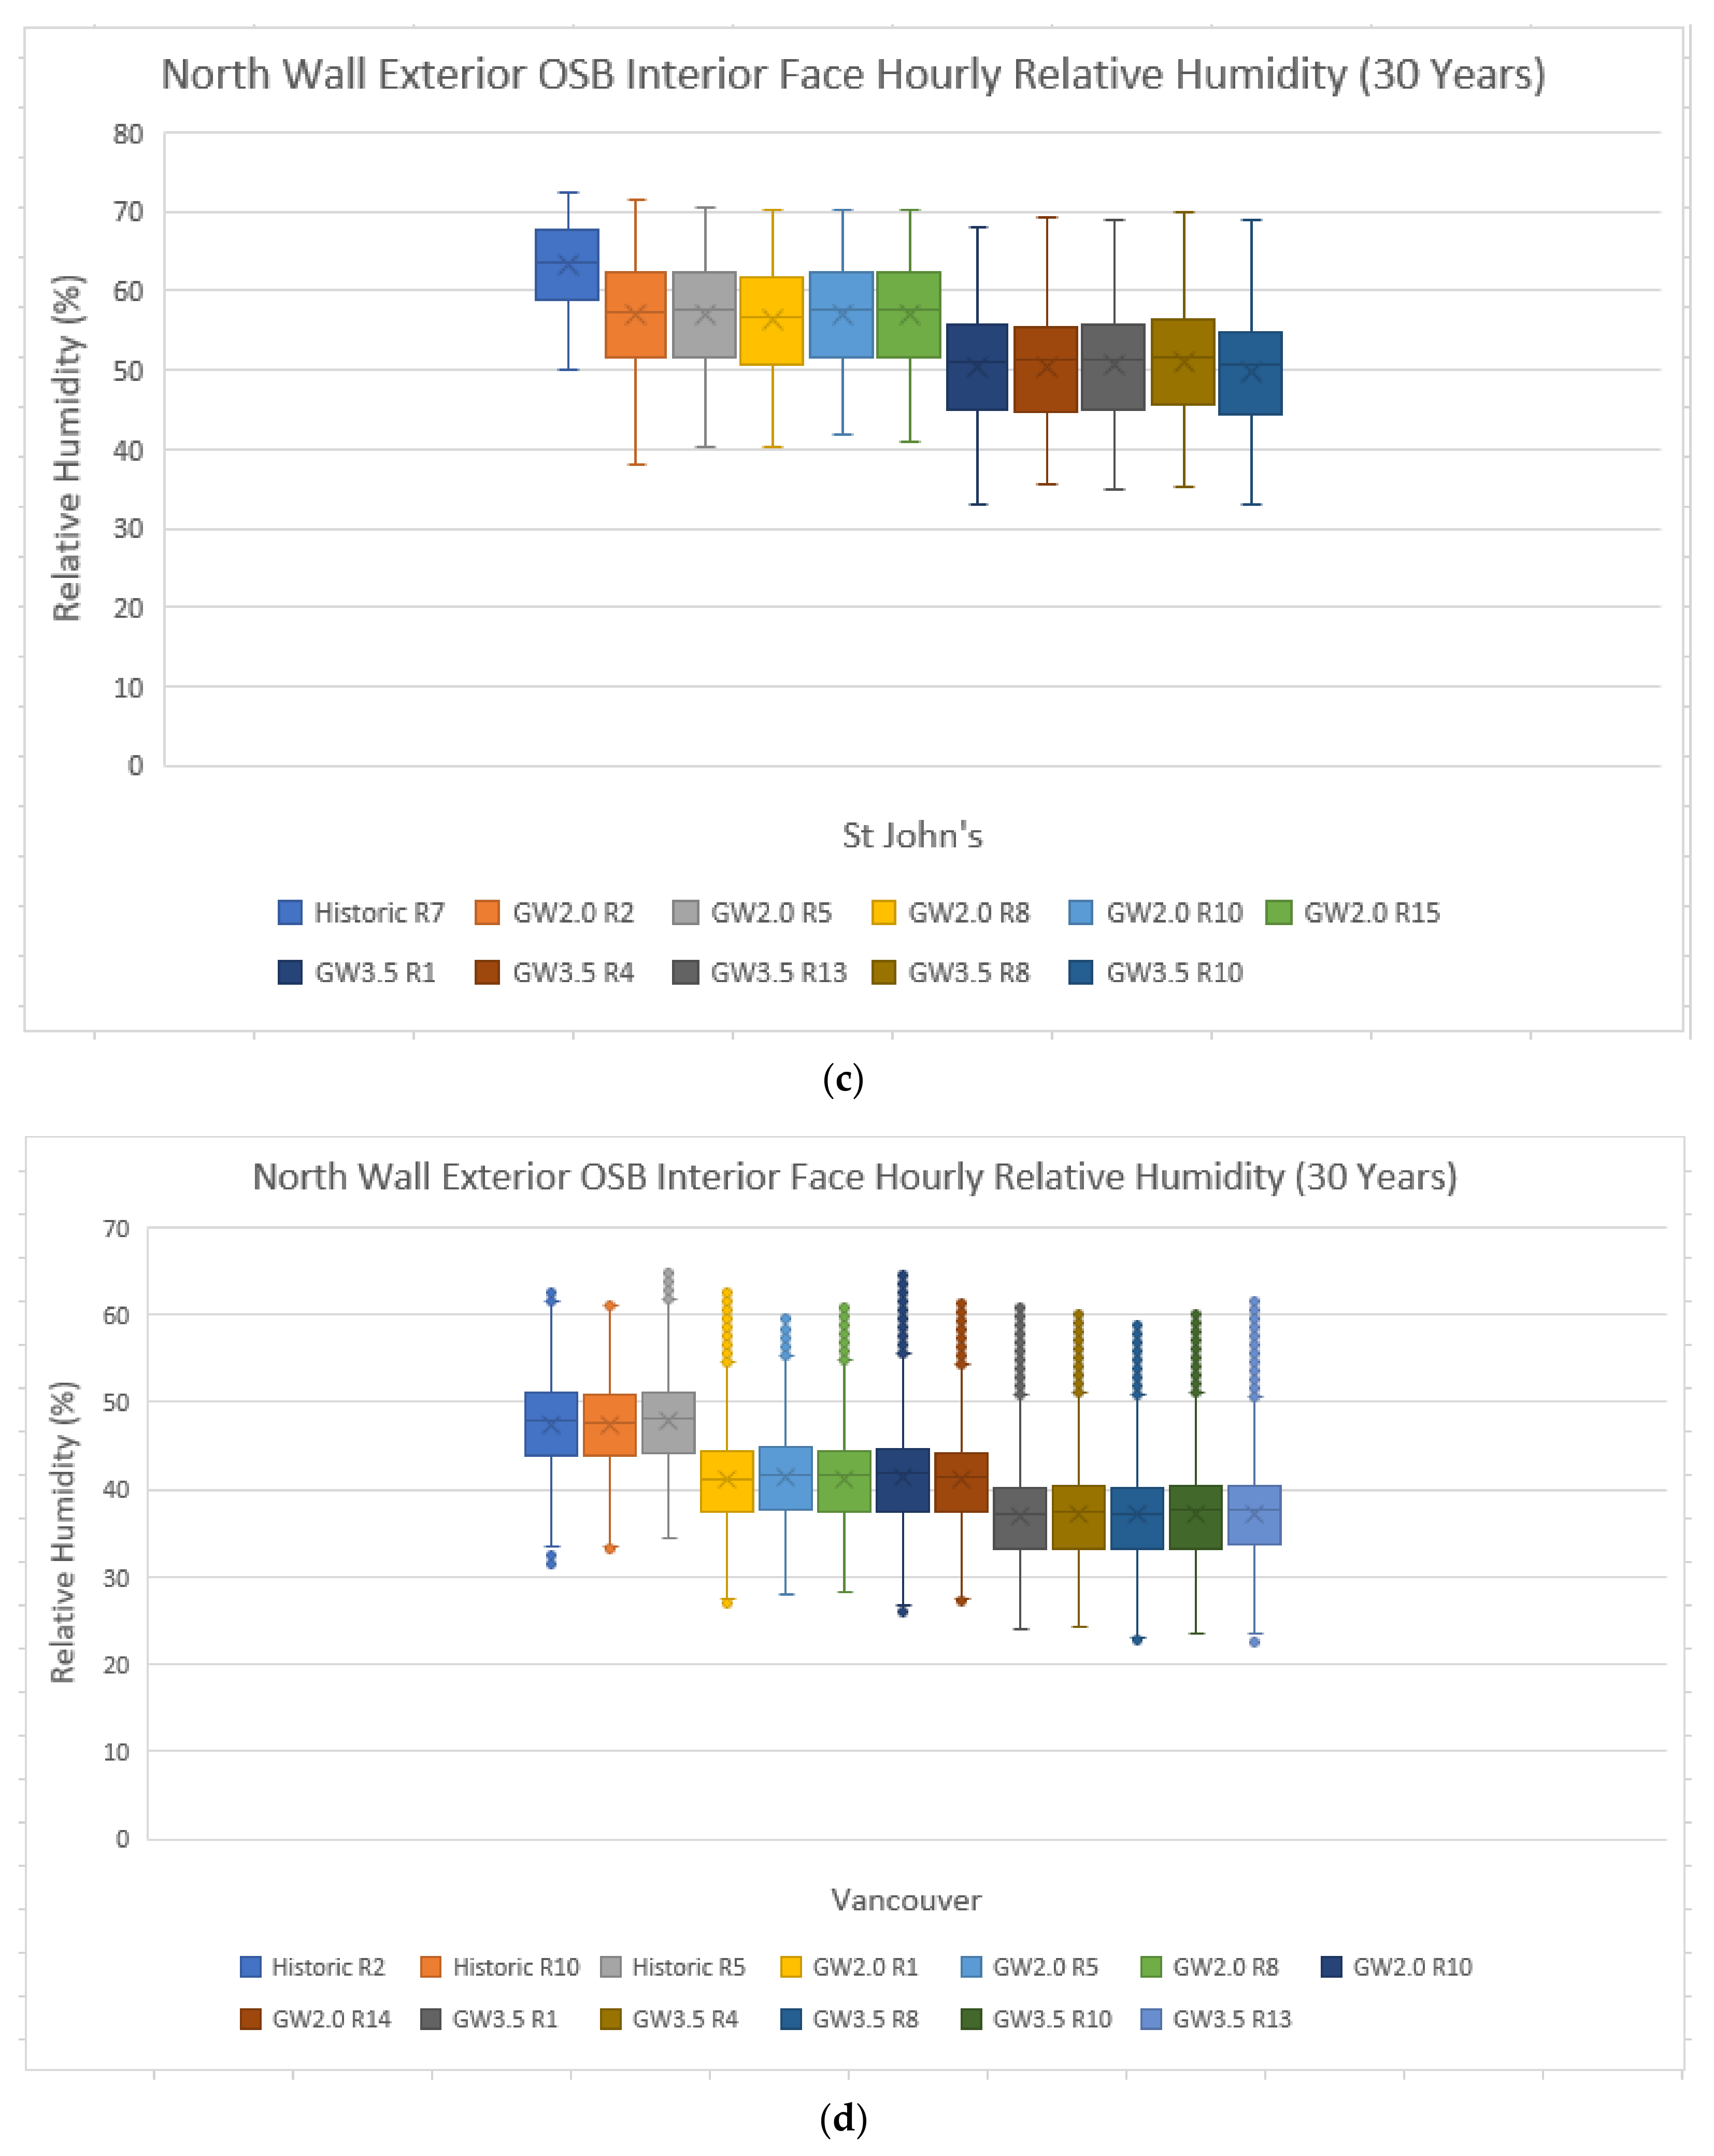
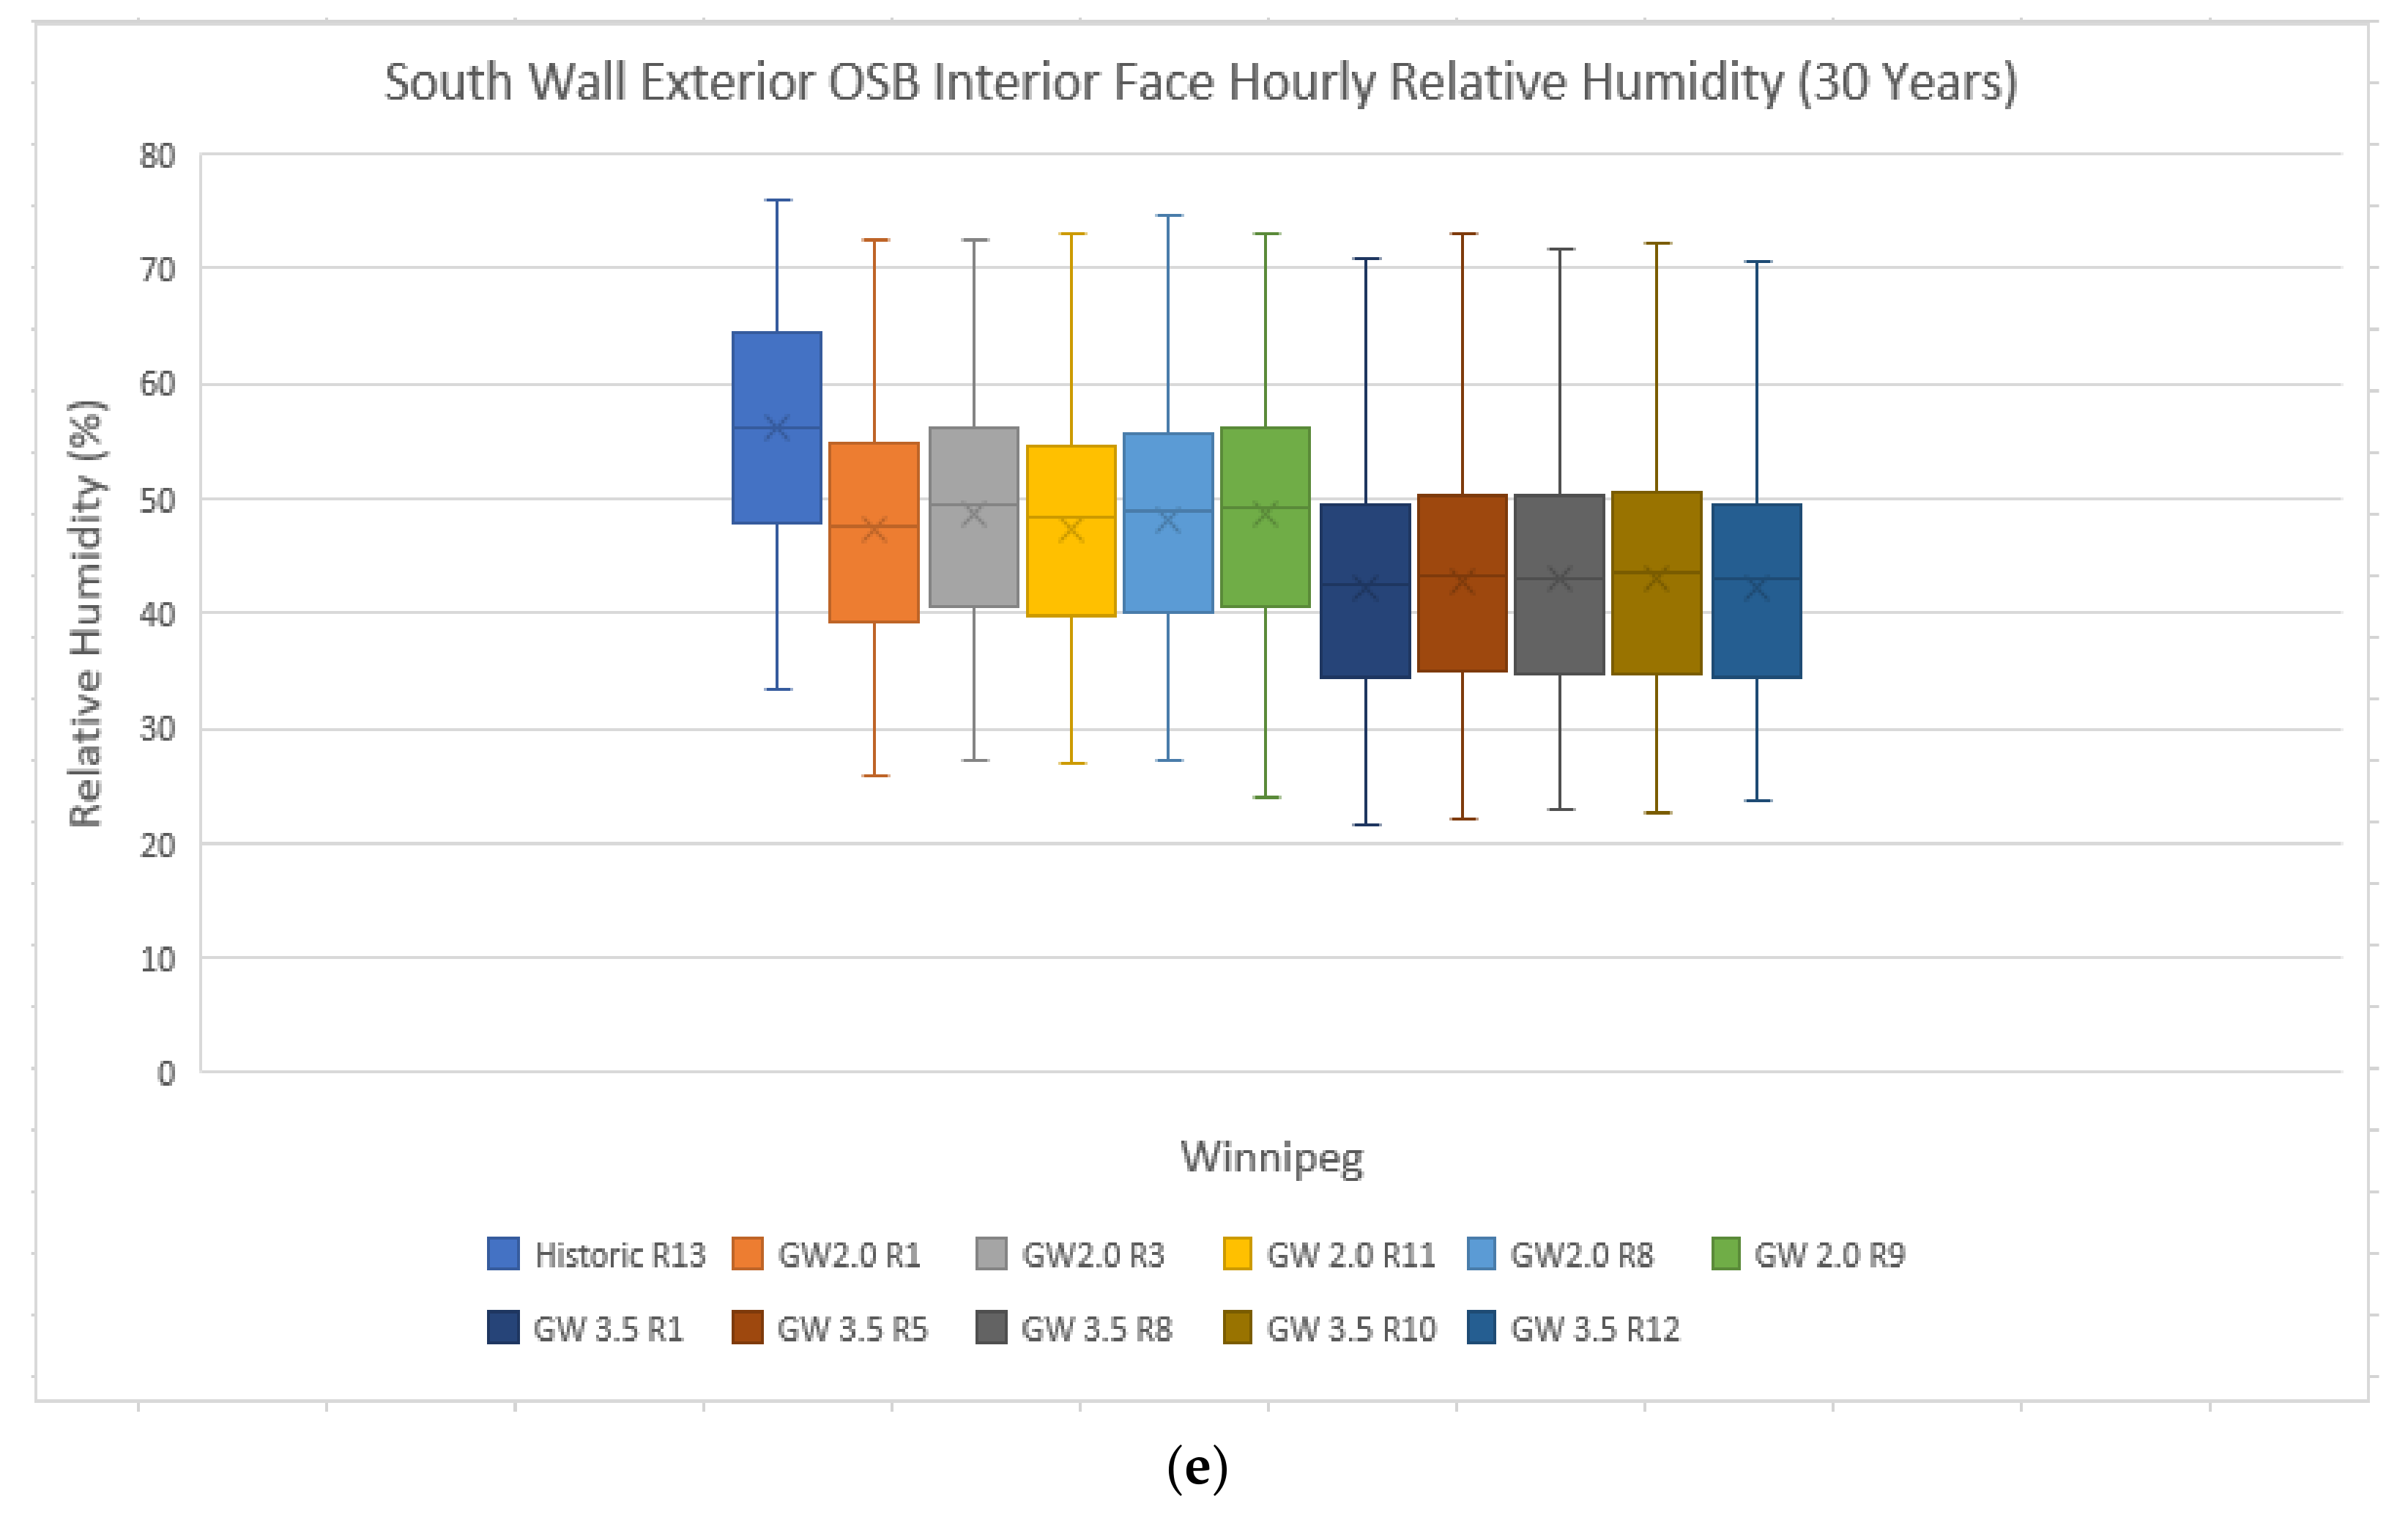
The results of the hygrothermal models for each of the five cities included in the study show favorable results for the performance of the WIRL exterior wall assemblies for each of the global temperature rise scenarios in comparison to the performance under the historical climate datasets. As a result of the 2.0 °C and 3.5 °C increases in global temperatures included in the projected future climate scenarios for each city, the surface temperature of the interior surface of the exterior OSB sheathing in the wall assembly, on average, is found to be warmer than in the historical climate scenarios, resulting in lower average relative humidity values.
The average recorded relative humidity values with outliers for each of the cities included in this study are shown in
Figure 12a–e. For all locations included in the study, the interior face of the exterior OSB sheathing in the north wall assembly resulted in the highest reported relative humidity values.
The use of an exterior air barrier system has been reported to result in an increased risk of water vapour condensation at the interior face of the exterior sheathing in thick-wall assemblies when low density (≤20 kg/m
3) hydrophobic insulation materials are used, or when insulation installation deficiencies exist in the wall assembly [
26]. Thick-wall assembly insulation material properties have also been reported to influence mould growth risk at the interior face of the exterior sheathing board, with hydroscopic insulation, such as cellulose, resulting in lower mould growth risk than assemblies insulated with hydrophobic insulation such as mineral wool or fiberglass [
21,
26]. In a 2016 report comparing the hygrothermal performance of thick-wall and split-insulated wall assemblies, Trainor et al. reported that the moisture content of the interior face of the exterior sheathing in split-insulation wall assemblies was lower than that in thick-wall assemblies under simulated air leakage from the interior environment as a result of warmer surface temperatures. When the assemblies experienced exterior wetting simulations, however, the split-insulated wall assemblies constructed using rigid-foam exterior insulation were found to have longer drying times than the thick-wall assemblies [
12].
Although an increase in precipitation has been reported for both projected future climate datasets for all locations included in this study [
28], there have been no reported incidences of wetting due to rainwater infiltration in the exterior wall assemblies of the WIRL, which is reflected in the measured and predicted performance of the assemblies. As a result, the increase in rainfall in the 2.0 °C and 3.5 °C global temperature increase scenarios is not found to result in an increase in relative humidity in the assemblies compared to those reported under the historic climate datasets.
The low air leakage rate and low incidence of exterior wetting in addition to the use of dense hydroscopic insulation within the thick-wall assembly of the WIRL building result in favorable predicted hygrothermal behavior using the WUFI® Plus software. The performance of this assembly in the five Canadian cities modeled under projected future climate scenarios shows good long-term hygrothermal performance with decreasing relative humidity values observed at the interior face of the exterior sheathing board as a result of global temperature increases.


