Article

A Numerical Study of the Stiffness and Strength of Cross-Laminated Timber Wall-to-Floor Connections under Compression Perpendicular to the Grain

1
Department of Building Technology, Linnaeus University, 351 95 Växjö, Sweden
2
Division of Structural Mechanics, Lund University, 221 00 Lund, Sweden
*
Author to whom correspondence should be addressed.
Buildings 2021, 11(10), 442; https://doi.org/10.3390/buildings11100442
Submission received: 9 August 2021 / Revised: 16 September 2021 / Accepted: 20 September 2021 / Published: 28 September 2021
(This article belongs to the Special Issue Timber Structures: Latest Developments, Challenges, and Perspectives)

Abstract

:
The use of cross-laminated timber (CLT) in multi-story buildings is increasing due to the potential of wood to reduce green house gas emissions and the high load-bearing capacity of CLT. Compression perpendicular to the grain (CPG) in CLT is an important design aspect, especially in multi-storied platform-type CLT buildings, where CPG stress develops in CLT floors due to loads from the roof or from upper floors. Here, CPG of CLT wall-to-floor connections are studied by means of finite element modeling with elasto-plastic material behavior based on a previously validated Quadratic multi-surface (QMS) failure criterion. Model predictions were first compared with experiments on CLT connections, before the model was used in a parameter study, to investigate the influence of wall and floor thicknesses, the annual ring pattern of the boards and the number of layers in the CLT elements. The finite element model agreed well with experimental findings. Connection stiffness was overestimated, while the strength was only slightly underestimated. The parameter study revealed that the wall thickness effect on the stiffness and strength of the connection was strongest for the practically most relevant wall thicknesses between 80 and about 160 mm. It also showed that an increasing floor thickness leads to higher stiffness and strength, due to the load dispersion effect. The increase was found to be stronger for smaller wall thicknesses. The influence of the annual ring orientation, or the pith location, was assessed as well and showed that boards cut closer to the pith yielded lower stiffness and strength. The findings of the parameter study were fitted with regression equations. Finally, a dimensionless ratio of the wall-to-floor thickness was used for deriving regression equations for stiffness and strength, as well as for load and stiffness increase factors, which could be used for the engineering design of CLT connections.

1. Introduction

The orthogonal orientations of timber lamellae in cross-laminated timber (CLT) enhance the load-bearing potential of timber as a structural wood-based product and provide a possibility of using timber as a two-dimensional load-bearing element. Due to the renewable and sustainable characteristics of timber and numerous advantages of building with CLT over solid wood and glued laminated timber (GLT), CLT became an alternative to non-renewable construction materials in multi-story buildings. Thus, CLT elements are widely used as floor and wall elements in structures. However, as a comparatively new engineered wood-based product, its load-bearing behavior, as a function of its layup and intrinsic material characteristics of wood, is not yet fully exploited for a more efficient production as well as for engineering design rules. Compression perpendicular to the grain (CPG) in CLT is one of the important aspects to investigate, considering the very low value of CPG of solid wood. In a multi-storied CLT building with traditional platform-type construction, CPG stress develops in CLT floors due to loads from the roof and from upper floors.
Timber, as a cylindrical orthotropic material, has very different moduli of elasticity and strengths in fiber and cross-fiber directions, and the material behaves differently depending on the type of loading. Compression in cross-grain direction, specifically in radial direction, generates high ductility with strength hardening. CPG strength of solid wood has large variability depending on the pith location of timber, annual ring orientations, stressed volume and depth of member, loading configurations and support conditions. All these parameters consequently affect the overall CPG behavior of CLT. Moreover, the cylindrical shape of the annual ring structure and the difference in material properties and strength in radial and tangential directions [1] cause, at the material scale, a combination of normal and shear stresses under compression in transverse plane. Therefore, the orthogonally placed timber layers in CLT give multi-axial and complex stress distributions under a globally applied compressive load.
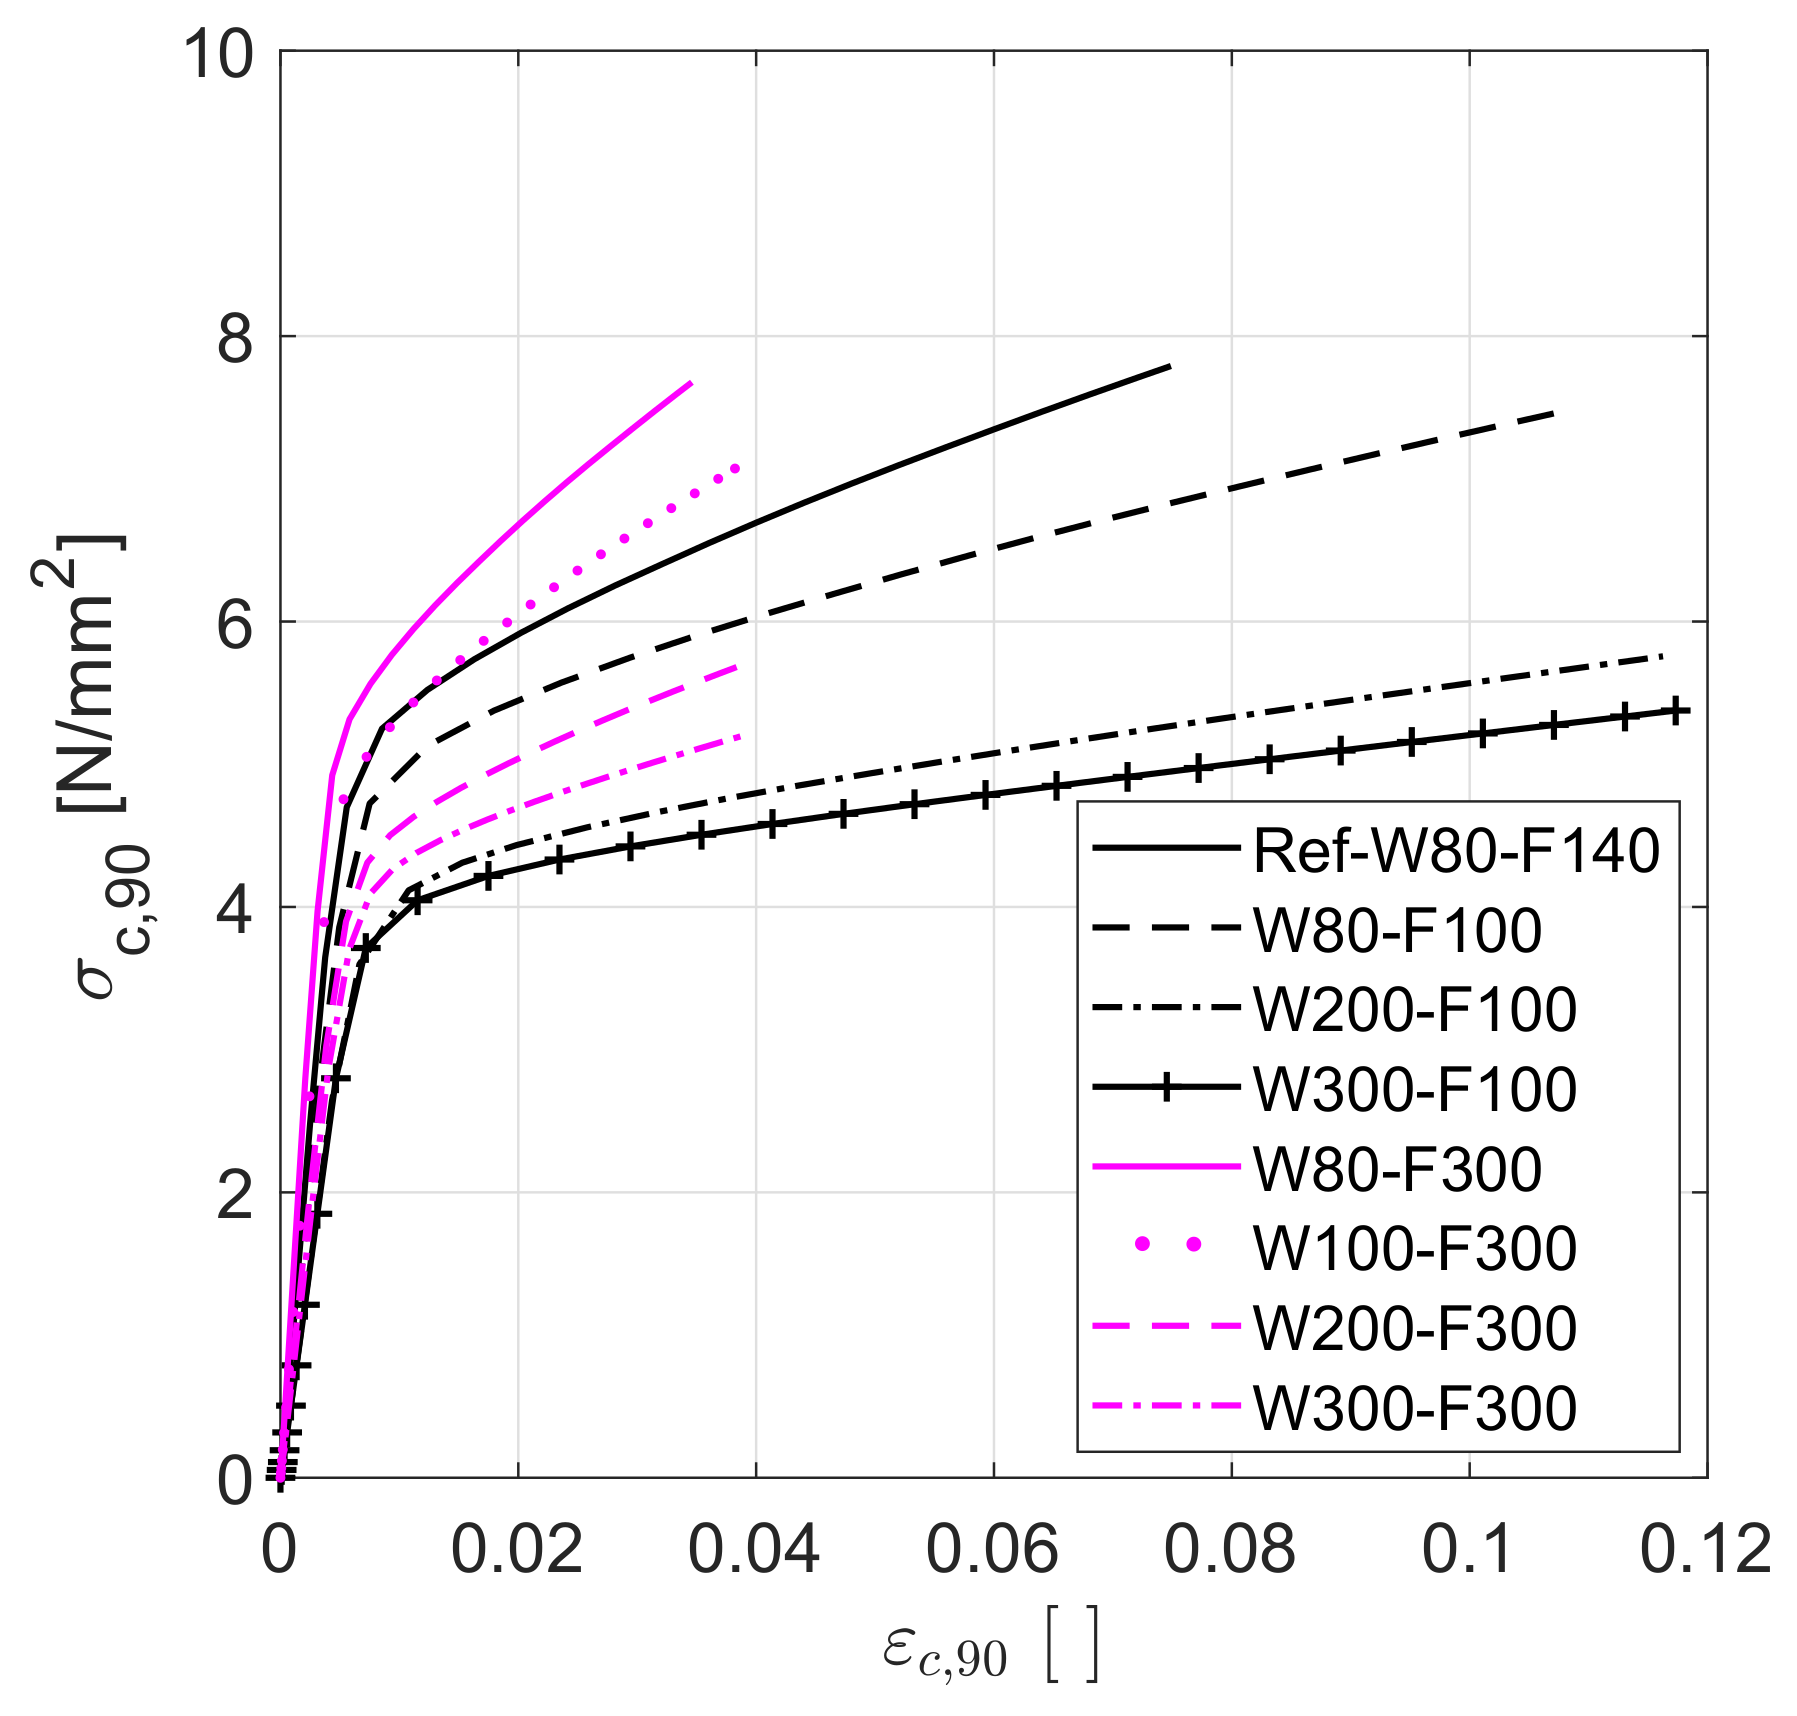
The paper aims at investigating the CPG behavior of CLT wall-to-floor connections by means of finite element modeling. Focus was given to investigating the connection’s compressive stiffness, strength and local strain distributions for different types of connections and two positions of the wall on the floor. The influence of the CLT deck outer layer’s fiber direction with respect to the wall’s orientation was also investigated. The load dispersion effect or unsupported length effect in CPG stiffness and strength in CLT was quantified and represented in terms of k c , 90 load and stiffness increase factors. Additionally, with the help of parametric models, the influence of wall and floor thickness, the position of piths in timber boards and the number of layers in walls and floors on connection stiffness and strength were investigated.
CPG of wood is an extensively studied research topic (see, e.g., [2] for a recent review) due to its importance in timber structures, its large variability and due to the need of harmonized test standards and procedures for calculating CPG stiffness, E c , 90 and strength, f c , 90 . Starting at the basic material properties, it is worth noting that, in case of a full-surface loaded specimen, the size of the specimen has an influence on CPG stiffness and strength of clear wood and wood-based products [3,4,5], cited in [2]. Bodig [4] mentioned surface roughness and non-parallelism of specimen edges as reasons for the dependence of stiffness and strength on specimen size. Brandner [5] reported an indicative increase in E c , 90 for increasing depth from compression tests on glued laminated timber (GLT) with a depth of 200 and 480 mm. In contrast to E c , 90 , no significant increase in f c , 90 was observed by Bodig [4] and Föppl [6]. However, Bogensperger [7] reported a slight decrease in stiffness and strength for increasing member depth from experiments on full-surface loaded CLT elements carried out by Salzmann [8].
In comparison to GLT, CLT exhibits higher compressive strength because the cross layers of CLT contribute to the load-carrying capacity by giving a reinforcing effect. This effect was shown by an experimental study by Halili [9], (cited in [2]), on GLT and CLT. In an experimental study on 5-layer CLT, a linear increase in E c , 90 as well as f c , 90 was observed by Ciampitti [10] for increasing surface area. He mentioned that local variability in timber, e.g., knots, cheeks, cracks as well as product characteristics such as gaps, orthogonal layups and stress release influence the stiffness and strength with specimen size.
Bogensperger [7] reported an extensive summary of E c , 90 and f c , 90 by compiling an analysis of previous experimental investigations on timber sill beams, GLT and CLT. The work included experimental findings by Halili [9] on CLT focusing on the influence of the number of layers and the ratio of neighboring layers on stiffness and strength of CLT for uniformly loaded prismatic specimens. An increase in strength and stiffness was reported for increasing number of layers (decreasing layer thickness), and increasing the ratio of longitudinal layers to cross layers. Mean values of E c , 90 from 346 N/mm 2 to 599 N/mm 2 and of f c , 90 from 2.77 N/mm 2 to 3.67 N/mm 2 were reported.
Hall [11], Hoffmeyer et al. [12], Farruggia and Perré [13], Shipsha and Berglund [14] and Akter et al. [15] investigated annual ring structure effects on CPG stiffness and strength. A recent numerical study by Akter et al. [15] confirmed the findings of Madsen et al. [16] and Hoffmeyer et al. [12] that CPG strength is lowest when the annual rings are orientated at 45 ° to the loading direction. Stiffness and strength in the radial direction were found to be higher than in the tangential direction. For Norway spruce clear wood, E R was found to be 50 to 100% higher than E T , while strength at 1.0% strain f c , R was only 7% higher than f c , T [1,12]. The material response was different under compression in radial and tangential directions [1,17]. Radial compression yielded a linear-elastic behavior followed by a stress-plateau region [18], while, comparatively, a non-linear elastic response with a stress peak due to the buckling of latewood layers prevailed under tangential compression. The difference in stiffness and strength in radial and tangential directions and the curvature of the annual rings can develop undesired stress, which can lead to early failure in wood products [12,19]. Hoffmeyer et al. [12] used a simple linear elastic finite element model to investigate the stress development in GLT under compression perpendicular to the grain. The model showed the development of tensile stress perpendicular to the grain, which caused premature failure of GLT under compression loading. The results were indicative and gave a rough idea of the stress levels. However, the author emphasized the importance of advanced material models to gain deeper insight into stress distributions.
Different types of material models for wood have been proposed for CPG loading situations. The consideration of orthotropic elasticity and elasto-plastic material behavior are most important for calculating stiffness and strength. The latter could also be affected by brittle failure of the material. Classical flow theory of plasticity using Hoffman [20] or Tsai and Wu [21] failure criteria can be used to represent the ductile behavior of wood under compression. Hill’s plasticity model [22], as an apparently simpler criterion, and often implemented in commercial finite element software, was shown to be unsuitable for wood because the difference in strength under tensile and compressive loading and the volumetric change of the material under plastic loading are not considered [15,23]. The single-surface criteria can be extended to multi-surface criteria by combining several single-surface limits [24,25,26,27] or by a so-called Quadratic multi-surface (QMS) failure criterion [28]. The latter is composed of several ellipsoidal surfaces and was shown suitable for predicting biaxial loading of wood in the radial-tangential plane of spruce clear wood [15]. Further types of material models used for investigating CPG, such as overlay models that combine elastic material model with a foam plasticity model to account for the plastic volume change [29], are reviewed in Akter et al. [15].
Loading and support conditions are important factors affecting CPG stiffness and strength of wood-based products. Blaß and Görlacher [30] showed that depth plays an important role in CPG strength in full-surface loading conditions, while in case of partial loading, protruding end distance is an important factor. Generally, a partially loaded timber element shows higher stiffness and strength than a fully loaded element due to the stress dispersion into the surrounding unloaded part of the specimen. Brandner [2] reported an extensive state of knowledge of the influence of unsupported length on CPG strength of timber and timber products. He referred to Graf [31] and Madsen et al. [32], mentioning that strength increases significantly with decreasing contact length in case of centrally loaded and discretely supported timber element.
Bleron et al. [33] reported higher CPG stiffness and strength values for increasing specimen’s length and depth from experimental tests on discretely supported Norway spruce GLT. Central or mid-position of the loading resulted in higher stiffness and strength than edge loading of specimens. This is a reason of stress dispersion, which is possible at both sides of the support in case of central loading, while stress dispersion is only possible at one side in case of edge loading. The same was confirmed by an experimental study of CLT by Hasuni et al. [34], by Kathem et al. [35] and by Akter et al. [15] for solid wood.
In a linear case, e.g., a sill on a continuous support, stress dispersion is possible in one direction only, namely in the length (or fiber) direction. In planar cases, e.g., CLT at wall or column supports, stress dispersion is possible in two directions. Serrano and Enquist [36] reported f c , 90 for CLT varying from 2.9 N/mm 2 to 5.8 N/mm 2 , from the experimental works by Kathem et al. [35] on uniformly loaded prismatic specimens and different positions of line load and supports. The lowest strength was found for line loading at the edge of CLT parallel to the fiber direction of the deck outer layer. Rolling shear failure and crushing of the extreme edge board due to non-edge gluing was the reason of this low strength. A simplified linear elastic finite element model was carried out to qualitatively understand the mechanical behavior of CPG of CLT. A good agreement of the deformed shape for uniformly loaded CLT was observed between the experiments and FE models. However, the need of a model considering material plasticity with damage initiation and crack propagation for the prediction of strength was emphasized.
In engineering design, the unloaded length effect and the corresponding load dispersion that leads to an increased strength are typically considered by a load increase factor, e.g., the k c , 90 factor of Eurocode 5 (EC5) [37]. The value of k c , 90 depends on the support length, protruding edge distance, member depth and the type of wood-based material, i.e., structural timber, GLT or CLT. Due to the effect of material layup and cross layers on the load dispersion in CLT, k c , 90 values can be considerably lower because there is less stress dispersion in CLT than in GLT or structural timber. For structural timber and GLT, various values of k c , 90 of up to 4.0, have been proposed by Riberholt [38]. Föppl [6] and Madsen et al. [16] suggested to limit k c , 90 to a maximum value of 3.0.
For CLT, depending on the position of the load, Bogensperger et al. [7] suggested values of 1.4 to 1.85. These values are based on a numerical study of experimental investigations by Salzmann [8]. Brandner [2] used stress dispersion angles for stress dispersion in parallel and perpendicular to the grain to calculate k c , 90 values (not only for strength but also for stiffness) based on tests by Ciampitti [10]. The variation of k c , 90 was large with values from 1.01 to 2.64 for f c , 90 and from 0.76 to 3.27 for E c , 90 , depending on loading and support conditions. Reasonably, continuously supported elements yielded higher k c , 90 than discretely supported elements. The lowest k c , 90 for strength was found for line load positioned on the edge of CLT. Due to the large variation of k c , 90 , the importance of considering the number of layers, the ratio of alternating layers and stress dispersion in both fiber and cross fiber directions were emphasized as key parameters for economic design.
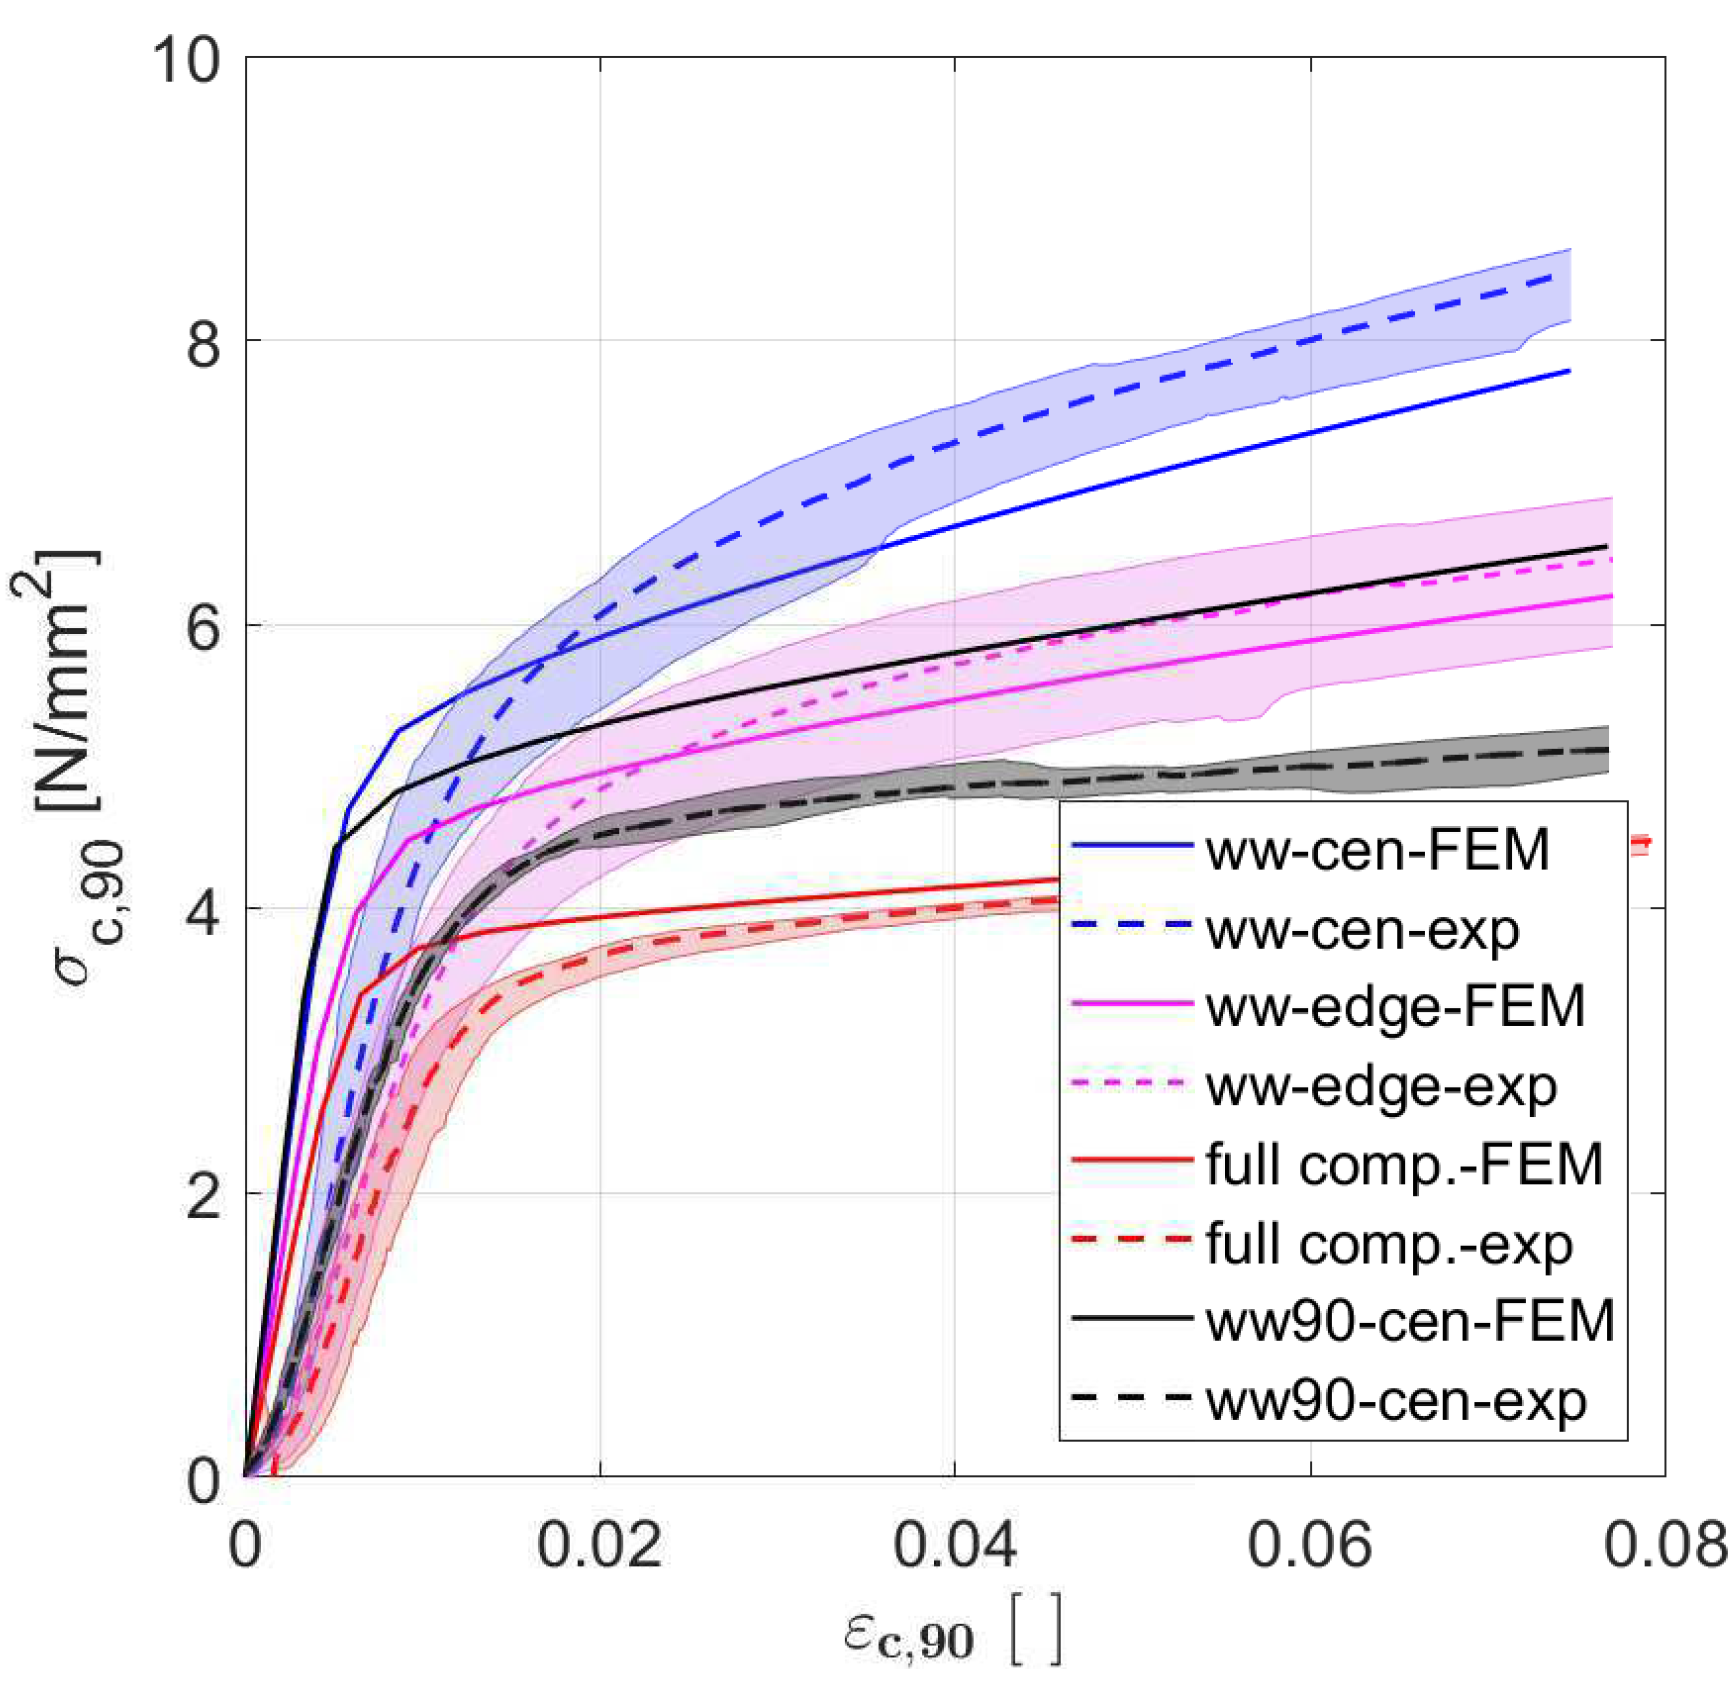
The dependence of CPG stiffness and strength of CLT on the positions of load and supports, the loaded area or contact area and the fiber direction in the outer layers of CLT with respect to load transmission direction were observed in a recent experimental study on CLT connections by Schweigler et al. [39]. That study, moreover, investigated the effects of screws and acoustic layers between wall and floor elements, which yielded increased and decreased stiffness and strength of about 60% and 70%, compared with the reference wood-to-wood connection, respectively.
Experimental data for more complex loading and support conditions with CPG as the main load transfer mechanism are scarce. A recent experimental study by Schweigler et al. [40] for non-uniform compressive stress in CLT, due to a moment loading of a steel support on the CLT surface, yielded even higher k c , 90 values of 2.73 to 3.22 for 3-layer 100 mm thick CLT elements.
Several of the above-mentioned studies emphasized the need of an enhanced understanding of the relationship between CLT material characteristics and its global behavior under CPG. The application of wood material models to numerically study the above-described stress dispersion effects in wood-based products under CPG has however not received the same attention as the development of material models for the local material behavior. Bogensperger et al. [7] used a linear elastic and orthotropic material model, where plasticity was only defined in radial direction, by an algorithm based on small-strain theory with linear hardening and an associated flow rule. Persson [29] used foam plasticity to investigate the reinforcement effect in CPG of GLT. The main limitation of the foam plasticity model was the consideration of material isotropy, which was dealt with by using an overlaid elastic model for the longitudinal direction. The outcome from the model showed good agreement with experiments and captured the plastic behavior of the GLT beam under CPG.
Here, we present a numerical model with the aim to study the influence of CLT elements and load and support characteristics on CPG in CLT. The elasto-plastic material model with a Quadratic multi-surface (QMS) criterion was previously validated on the material scale by comparison with biaxial experimental data in the radial-tangential plane of spruce clear wood [15]. Data from the experimental study by Schweigler et al. [39] on CLT will be used here for model validation on the structural scale before the model is used for parameter studies to derive relationships between CLT characteristics and stiffness and strength of CLT under CPG.

2. Materials and Methods

2.1. CLT Wall-to-Floor Connections

The behavior of cross-laminated timber (CLT) wall-to-floor connections under compression perpendicular to the grain (CPG) is studied here. This is a typical connection in platform-type timber buildings with different load and support conditions, depending on the position in the structure, at inner walls and at outer walls, respectively. The numerical investigations of CPG in CLT wall-to-floor connections in this study are based on a recent experimental analysis by Schweigler et al. [39], which is summarized in the following.
In the experimental study, CLT walls were used to apply a compressive load and to support the CLT floor. Three different types of connections, namely wood-to-wood connections (ww), connections with screws between the supporting wall and the floor (screw) and connections with acoustic layers between the walls and the floor (acoustic), were tested. Two fully threaded and 320 mm long screws with an outer diameter of 9 mm and an inner diameter of 5.9 mm (Rothoblass, VGS9320) were inserted between the floor and the supporting wall. The screws were placed at equal distances from the edges of the connection with a center-to-center distance between the screws of 120 or 80 mm depending on the width of the test specimens. Acoustic layers, 6 mm thick and 100 mm wide (Rothoblass, XYLOFON D82414), were used between the floor and the walls (see Figure 1).
For each type of connection, center (cen) and edge (edge) positions of the CLT walls were considered in order to study the influence of loading and supporting position on CPG stiffness and strength. In order to assess the so-called unloaded length effect, wood-to-wood connections were also tested with a floor length equal to the wall thickness (full comp.), which, in this study, represented the compressive behavior of the CLT product.
The influence of wall thickness, t w on the connection’s stiffness and strength was investigated by using two different wall thicknesses, namely 80 mm and 100 mm. A 5-layer CLT floor element with a thickness, t f , of 140 (40 + 20 + 20 + 20 + 40) mm was used in all test series. Due to the different wall thicknesses, slightly different floor lengths, l f , and floor width, b f , were used in the experimental setups (see Figure 1 and Table 1). The walls were made of 3-layer CLT with a thickness, t w , of 80 (20 + 40 + 20) mm and 5-layer CLT with a thickness of 100 (20 + 20 + 20 + 20 + 20) mm. The effects of the load introduction and transmission were investigated by not only using CLT but also steel bars with a width (contact width) of 80 mm and 100 mm for loading of the CLT floor. For all of the above-described tests, the outer layer of CLT floor elements was orientated along the floor length, with stress dispersion parallel to the grain in the outer CLT layers. The influence of the deck outer layer’s grain direction was investigated for ww connections, where the deck outer layer was orientated at 90 ° with the floor length, parallel to the walls (ww90-cen). A minimum of four specimens were tested for each above-mentioned configuration. In addition, four tests with t w = t f = 100 mm and ww-cen connection were performed to assess the influence of floor thickness. Detailed dimensions and notations are illustrated in Figure 1 and summarized in Table 1.
The industrially produced CLT elements with edge-glued lamellae were made of Norway spruce (Picea abies) timber of strength class C24 according to EN 338 [41]. The materials were stored at 65% relative humidity and 20 ° C before testing.
Experiments were realized in a hydraulic testing machine with a force capacity of 500 kN. The loading procedure consisted of two loading–unloading cycles. The tests were run until 30 mm machine displacement, or up to material or instability failure. Displacements were measured by using four LVDTs or potentiometers, one on each side of the wall, at front and back side of the wall floor connection. Full-field surface strains on the depth face of the CLT floor panel in the area between the two walls were measured by using a contact-free measuring device based on digital image correlation (DIC).

2.2. Finite Element Modeling of CPG in CLT

2.2.1. CLT Connection Geometry

The experimentally investigated CLT wall-to-floor connections described in Section 2.1 were modeled in a 3-dimensional environment, in the finite element software Abaqus [42]. CLT elements were modeled by considering timber boards with a width of 120 mm. The narrow and flat faces of the boards were connected with the surfaces of the adjacent boards by tie constraint in order to account for the narrow-face bonding of the lamellae. Contact modeling was applied between the CLT walls and the floor. Non-penetrating hard contact was used for the behavior in the normal direction, allowing separation after contact. Penalty friction with a frictional coefficient of 0.30, based on [43], was used for the tangential behavior. For loading and at the support, 3-dimensional deformable steel plates were modeled. The steel plates were connected with the CLT walls by surface-to-surface interaction as well. Boundary conditions were assigned according to the experimental setup such that the translations and rotations of the bottom steel plate were constrained, and the top steel plate was allowed to rotate while a displacement in the vertical direction was prescribed. A maximum displacement of 12 mm was applied to compare model predictions with the first part of the stress–strain curves from experiments. The symmetry of the connection in the width direction of the wall was used, and thus only 125 and 175 mm floor or wall width were modeled to reduce the computational cost.
The finite element mesh was created with 8-node linear brick elements (C3D8 in Abaqus CAE) and with a uniform element size of 8 mm. This mesh size was found suitable in terms of accuracy and computational cost, after a mesh size study, as shown in Table 2.
In the numerical model of connection tests with screws, due to modeling only one half of the test setup, one screw with an average effective diameter of 8 mm and with a length of 320 mm was considered. Kinematic coupling was used to connect the surfaces of the screw with the screw hole in the CLT element. Isotropic material properties with an E-modulus of 210,000 N/mm 2 and a Poisson’s ratio of 0.3 were assigned to the finite elements representing the screw.
In the numerical model of connection tests with acoustic layers, a 6 mm thick and 100 mm wide acoustic layer was modeled between the wall and floor elements. An E-modulus of 48 N/mm 2 and a Poisson’s ratio of 0.48 were considered as elastic material properties of the acoustic layer. The E-modulus was determined from compression tests on acoustic layers. Surface-to-surface interaction between the acoustic layers and the CLT elements were defined with a tangential frictional coefficient of 0.35 and hard contact in normal behavior.

2.2.2. Wood Material Properties

Orthotropic elasto-plastic material properties of timber were assigned in radial, tangential and longitudinal material directions by defining a cylindrical coordinate system for each timber board in the CLT elements. The pith location for the boards was defined at 30 mm below or above the bottom or top edge at the center position of each board. Due to this morphology, the wood material was predominantly loaded in radial compression in the center of the boards, while combined stress states with compression perpendicular to the grain and rolling shear occurred at the outer parts of the boards. The considered material properties of wood are shown in Table 3 and Table 4. The material properties in transverse directions were determined in biaxial experimental tests on Norway spruce clear wood in the radial(R)-tangential(T) plane [1], while the longitudinal properties were taken from literature [44]. It should be noted that clear wood properties are used here to model the overall behavior of a timber connection under CPG. There are characteristics in structural timber boards, such as knots, fiber deviations and other defects, which are not taken into account. For the investigated loading and support conditions on CPG, this is expected to be a conservative approach, since knots act as a reinforcement and strengthening under such loading conditions [45].

2.2.3. Elasto-Plastic Material Model

In the finite element model of the CLT connections, a Quadratic multi-surface (QMS) failure criterion was used to define the onset of plastic deformations. The material model accounts for basic requirements such as the consideration of linear elasticity, material orthotropy in the elastic and the plastic domain, differences in tensile and compressive strengths and volumetric change under plastic loading. The model was validated on the material scale of wood by comparison of model predictions with experimental data of Norway spruce clear wood under uniaxial and biaxial stress states in the RT plane [15]. The criterion is based on quadratic equations, creating several ellipsoid surfaces with their center at the origin of the stress space, which ensures continuity and smoothness of the surface [28]. In component form, the criterion reads as
σ R R f R 2 + σ T T f T 2 + σ L L f L 2 + σ R T f R T 2 + σ T L f T L 2 + σ R L f R L 2 = 1
where σ i i are normal stresses in material directions i, σ i j are shear stresses in the i j -planes, f i denotes normal strengths in the corresponding material directions, compressive or tensile depending on whether the corresponding normal stresses σ i i are smaller or greater than zero, and f i j denotes shear strengths in the i j -planes.
In matrix-vector notation, the elasto-plastic material behavior can be expressed as
σ T P σ σ y 2 = 0 ,
where σ y is the current normalized yield stress, which is equal to 1 in case of ideal plasticity. P is a diagonal matrix, containing the above-described yield strengths in the principal material directions, f i and f i j .
Hardening was defined by the following exponential functions that yielded a piecewise linear stress-plastic strain relationship
σ y = e ( k 1 λ ) for 0 < λ < λ 1
σ y = e ( k 1 λ 1 ) e ( k 2 ( λ λ 1 ) ) for λ 1 < λ
where λ is an internal variable and λ 1 was set equal to 0.4. The variables k 1 and k 2 define the slope of the stress-plastic strain curve and were set to 1.0 and 1.5, respectively.
The elasto-plastic material model was implemented in a user subroutine (UMAT) considering associated plasticity and small-strain theory.

2.3. Parametric Study of Influence Parameters

After comparison of model predictions with experimental results, the model was used to investigate the influence of wall and floor thickness, position of pith in timber boards and the number of layers in wall and floor elements on the overall connection stiffness and strength by means of parameter studies. As a reference condition, a wood-to-wood connection with a center position of the walls ww-cen, with dimensions of h w = 250 mm and l f = 735 mm, was chosen. Boundary conditions and loading, interaction properties, mesh size and element type were applied as described above.

2.3.1. Wall and Floor Thicknesses

Since stress dispersion in CPG depends on the geometry of the connected elements, the influence of wall and floor thicknesses is assessed. For this purpose, the wall and floor thicknesses were considered to vary between 80 mm to 300 mm and 100 mm to 300 mm, respectively, with width, b f = b w = 350 mm; see Figure 2a. Models for the limit cases of combination of maximum and minimum floor and wall thickness were created, W80-F100, W300-F100, W80-F300 and W300-F300. The first number indicates the wall thickness, and the second number indicates the floor thickness. Additional geometries for the trend in between these limits were considered by using the following combinations: W100-F100, W200-F100, W200-F140, W300-F140, W100-F300 and W200-F300. These combinations allowed to assess the influence of different wall-to-floor thickness ratios t w / t f , as well as the influence of the number and percentage of longitudinal layers for the same wall-to-floor ratio on the CPG stiffness and strength of CLT. The compositions of the CLT wall and floor elements were as follows: 80 mm (20 + 40 + 20 mm), 100 mm (20 + 20 + 20 + 20 + 20 mm), 140 mm (40 + 20 + 20 + 20 + 40 mm), 200 mm (40 + 40 + 40 + 40 + 40 mm) and 300 mm (2 × 40 + 30 + 2 × 40 + 30 + 2 × 40 mm). The pith location for the boards was defined at 30 mm below or above the bottom or top edge at the center position of each board.

2.3.2. Pith Locations and Annual Ring Orientations

The location of the pith in timber boards was shown to have an influence on the global load-displacement behavior of wood under CPG [15]. The growth ring structure of the boards cannot be controlled by the structural engineer, and thus, it might be difficult to include this characteristic in design rules. It is however of importance for the product performance, not only under compression perpendicular to the grain but also under bending, especially for short-span elements [46]. Its influence on the CPG stiffness and strength of CLT is investigated by considering three more possible pith locations, in addition to the pith location considered for comparison with experiments and in the study of the influence of wall and floor thicknesses. Wood-to-wood connection with a center position of the walls with dimensions of W80-F140-ww-cen was chosen as a reference condition. Boundary conditions and loading, interaction properties, mesh size and element type were applied as described above.
A more pronounced curvature of the annual rings in the boards was modeled by a pith location 10 mm below or above the bottom or top edge at the symmetry line of the boards (pith-10), while a curvature typical for side boards was represented by a pith location 50 mm below or above the bottom/top edge at the symmetry line of the boards (pith-50); see Figure 2b. In the latter case, loading is mainly in the radial direction with less shear stress than that of more pronounced annual ring curvatures. Another type of stress field occurs in boards with a diagonal annual ring orientation, which was considered by setting the pith at 50 mm below and 50 mm right/left sides of the symmetry line of the boards (pith-45deg). For all of the above-mentioned cases, all boards in the CLT elements had the same annual ring pattern. Finally, these patterns were randomly combined in the configuration pith-random.

2.3.3. Number of Layers and Lamella Thicknesses in Wall and Floor Elements

The influence of the number of layers and the thickness of layers in the CLT wall and floor elements on the CPG behavior was investigated for a reference condition of a wood-to-wood connection with center position of walls (ww-cen). 5-layer 100 (20 + 20 + 20 + 20 + 20) mm thick CLT walls and a 5-layer 140 (40 + 20 + 20 + 20 + 40) mm thick CLT floor (W100-F140) were considered as a reference composition. For this parameter study, 3-layer wall elements with a thickness of 100 (30 + 40 + 30) mm with a 5-layer 140 mm floor, as well as 5-layer walls with a 7-layer floor element with a thickness of 140 mm were modeled; see Figure 2c. In the latter case, all timber boards for wall and floor had a uniform thickness of 20 mm.

2.4. Data Evaluation and Calculation of Stiffness and Strength

The behavior of the CLT connections was assessed on a global scale as the reaction force, F c , 90 , due to a prescribed maximum displacement of 12 mm at the steel plate on top of the connection configuration to compare the model’s predictability of stiffness, strength and onset of plastic deformation with the experiments for moderate compressive strain of the floor. The results of the simulations and the experiments are presented in terms of stress vs. strain relationships. The nominal stress in the contact area between wall and floor, σ c , was calculated as the reaction force divided by the loaded contact surface, which was equal to the thickness of the wall, t w , times the width of the floor, b f . The relative displacement between the wall and the floor was evaluated at the top and bottom contact surfaces of the floor with the walls. Relating this displacement to the thickness of the floor, t f , yielded the nominal compressive strain in the connection, ε c .
The CPG stiffness, E c , 90 , F E M , and strength, f c , 90 , F E M , of the connection were calculated following the regulations according to EN 408 [47]. The slope of the line connecting the stress points of 10% and 40% of f c , 90 , F E M was defined as E c , 90 , F E M , and f c , 90 , F E M was determined as the intersecting stress point of the stress–strain curve with the offset line at 1.0% strain. The offset line is parallel to the line used for the calculation of E c , 90 , F E M . For the experiments, a slightly modified procedure to EN 408 was used in order to determine E c , 90 , e x p and f c , 90 , e x p (see Schweigler et al. [39]). Here, E c , 90 , e x p , calculated from the unloading part of the stress–strain curve is reported.
Finally, the load and stiffness increase factor, k c , 90 was calculated by comparing different load and support conditions. k c , 90 relates to the strength and stiffness of the reference configuration representing the CPG stiffness and strength of the wood-based product. Based on the design model adopted in Eurocode 5 [37], k c , 90 for strength was calculated from the relation given as
σ c , 90 = F c , 90 b w t w k c , 90 f c , 90 , r ,
which leads to
k c , 90 = σ c , 90 f c , 90 , r = F c , 90 f c , 90 , r b w t w ,
where F c , 90 is the reaction force corresponding to the strength following the procedure described above, b w is the width of the CLT wall or floor, t w is the thickness of the CLT wall and f c , 90 , r is the reference compressive strength of the CLT product. Here, the configuration full comp. was considered to represent the compressive strength of CLT. A mean value of all full comp. experiments was used for the calculation of experimentally determined k c , 90 , e x p values, and the modeling result of this configuration was used for the calculation of model-predicted k c , 90 , n u m .
In the similar way, k c , 90 for the CPG stiffness, E c , 90 was calculated by comparing with the mean E c , 90 of experiments and the model-predicted CPG stiffness of this configuration, respectively. The equation reads as
k c , 90 = E c , 90 E c , 90 , r ,
where E c , 90 , r is the reference stiffness of CLT in the full comp. configuration. The evaluation is carried out on a mean level since a deterministic model was applied in this study. Possible differences between k c , 90 determined from characteristics values (as used in engineering design) and from mean values were assessed in the experimental work [39].

3. Results and Discussions

3.1. Comparison of Model Predictions with Experiments

3.1.1. Stiffness and Strength

Validation of the finite element model rests on the comparison of model predictions with experimental data that include the effect of several influence parameters on CPG. General findings of the comparison, as summarized in Table 5 and illustrated in the correlation plot in Figure 3, are discussed first before the ability of the model to predict the effect of certain influence parameters is assessed.
The mean normalized absolute error of the model predictions of E c , 90 were 33.7% for series W80-F140 and 16.5% for series W100-F140 (see Figure 3a). In general, the numerical models gave about 25% higher stiffness than experiments. In the experiments, E c , 90 of CLT wall-to-floor connections was not only calculated from the loading path, but also from the unloading and reloading paths. The model, however, does not include any non-linearities in the contact areas, such as imperfections in the contact surfaces and local compliances; therefore, the first unloading stiffness of the FEM model is same as the loading stiffness; see Figure 4. Moreover, material properties of wood in the finite element model were determined from the first unloading path of experiments on clear wood [1]. For these reasons, the model-predicted stiffness was compared to the experimentally determined stiffness from the first unloading path.
A possible reason for the overestimation of the model is the stiffness in the contact area between the CLT walls and the floor. Dorn [48] and Iraola et al. [49] showed that the consideration of pressure over-closure relationships in the contact surfaces can lead to a better agreement between model and experiments. Another possible reason is that stiffness properties of clear wood from the peripheral part of the tree [1] were used in the model, while the local stiffness of CLT elements in the contact areas as well as the overall effective stiffness of the CLT elements could be lower due to growth irregularities and defects, such as cracks. The material in the model is, however, homogeneous and defect-free, and the connection is without geometrical imperfections.
The finite element model gave a good prediction but slightly underestimated CPG strength in the investigated connections, except for configuration ww90-cen (see Figure 3b). The mean normalized absolute error of the model predictions of f c , 90 was 6.9% for series W80-F140 and 4.9% for series W100-F140. The material strengths in radial-tangential directions were determined on clear wood specimens at an absolute strain of 1.0% [1] and therefore would have been higher if the 1.0% offset method according to EN 408 [47] would have been used. In addition, wood defects were not considered in the model but could lead to an increase in load-carrying capacity under the investigated loading conditions.
In the following, the results from the finite element model are compared with experiments in terms of nominal stress–strain curves, shown in Figure 5, Figure 6, Figure 7 and Figure 8, and in terms of CPG stiffness, E c , 90 , and strength, f c , 90 , of the connection, which are presented in Table 5. These parameters from the model and from experiments are further used to calculate k c , 90 values in order to assess the model’s ability to predict the load and stiffness increase factors.
The different types of connections (ww, screw and acoustic) are investigated for tests with W80-F140 cen, W80-F140 edge, W100-F140 cen and W100-F140 edge. Figure 5 shows the stress–strain curves of different types of connections in series W80-F140, with center and edge positions of walls, where solid lines represent results of the numerical models and dashed lines represent mean experimental results. The variation of stress level from the experiments is shown by the shaded area. The model results show the same trend as the experimental findings, namely that the connection with screws gave the highest resistance while the connection with acoustic layers yielded the lowest one for both cen and edge positions of the load. Stresses in the ww connection are in between the aforementioned two connection types. In general, the numerical models yielded a slightly lower strength and a higher stiffness than the experiments.
The finite element model-predicted strengths, f c , 90 , F E M of screw-cen, ww-cen and acoustic-cen connections were 6.24 N/mm 2 , 5.73 N/mm 2 and 5.40 N/mm 2 , while the corresponding strengths from the experiments, f c , 90 , e x p , were 6.96 N/mm 2 , 6.22 N/mm 2 and 5.61 N/mm 2 , respectively. f c , 90 , F E M of screw-edge, ww-edge and acoustic-edge connection were found to be 5.40 N/mm 2 , 4.85 N/mm 2 and 4.64 N/mm 2 , as compared to f c , 90 , e x p of 5.50 N/mm 2 , 5.07 N/mm 2 and 4.79 N/mm 2 . The model strength of screw connections was 9% higher than ww connections, which is in very good agreement with the experimental difference of 9–12%. Thus, the model predictions and experiments are well in line with earlier experiments; see also Gasparri et al. [50], which revealed a strength of about 12% higher for connections with screws. It should be noted that the position of the screws in relation to the fiber orientation in the CLT wall layers has a significant influence on f c , 90 . In the case of 80 mm thick CLT walls (W80-F140), the screw heads were loading the center layer of the wall perpendicular to the grain, while in 100 mm thick CLT walls (W100-F140), the screws were loading the center layer parallel to the grain. f c , 90 , F E M for W100-F140-screw-cen was 5–10% higher than f c , 90 , F E M for W80-F140-screw-cen. This finding is in agreement with experiments for edge position, where a higher strength was found for W100-F140 than for W80-F140. For center position of the CLT wall, however, this difference was not observed in the experiments. The model-predicted strength difference between ww and acoustic connections of 7–9% was well in line with the experimental findings of 6–10% as well.
Similar trends as regards the type of connection were also found in terms of stiffness, with the highest stiffness for screw and the lowest for acoustic connections. The relative model-predicted differences agree well with the experimentally determined difference of the unloading stiffness.
The mean stiffness of the full comp. configuration was 604 N/mm 2 as predicted by the numerical model, in comparison to 488 N/mm 2 determined in experiments from the unloading path, which was about 24% lower. The model-predicted stiffness was also higher than literature values. Bogensperger et al. [7] reported a mean value of 450 N/mm 2 based on a previous study on CPG in CLT. Brandner [2] reported a value of 391 N/mm 2 for mean CPG stiffness of CLT with a COV of 13.3% for prismatic specimen with a 150 × 150 mm 2 surface area. Gasparri et al. [50] reported even lower stiffness values, from 256 to 376 N/mm 2 , from a test setup similar to this study’s setup, with a floor size of 200 × 200 mm 2 , loaded and supported by CLT elements and steel plates. The differences in specimen size and the difference in loading and unloading stiffness in experiments could be the reasons for the high difference in stiffness with this study and the above-mentioned literature, where loading stiffness was considered. However, the experimental mean loading stiffness from W80-F140-full-comp. and W100-F140-full comp. of 315 MPa is well in line with the literature.
E c , 90 , F E M varied from 455 to 1152 N/mm 2 for center position and from 382 to 988 N/mm 2 for edge position of the walls for series W80-F140. The corresponding E c , 90 , e x p was 489 to 800 N/mm 2 for cen and 446 to 658 N/mm 2 for edge position.
The length effect, i.e., the effect of the loading and supporting conditions on CPG stiffness and load-carrying capacity, was well predicted with the model and corresponded well to experimental findings (Figure 6). For all connection types, cen position of the walls resulted in a higher load-carrying capacity than edge position of the walls, due to the lack of stress dispersion. full comp. showed the lowest stiffness and the lowest load-carrying capacity. However, the influence on stiffness and strength was higher in the experiments than in the models.
When comparing f c , 90 , F E M of 3.88 N/mm 2 , 4.85 N/mm 2 and 5.73 N/mm 2 for full comp., ww-edge and ww-cen, with f c , 90 , e x p of 3.66 N/mm 2 , 5.07 N/mm 2 and 6.22 N/mm 2 , it becomes obvious that the length effect is slightly underestimated by the model. f c , 90 , F E M values for center- and edge-loaded elements were in good agreement with the results by [36,50], while the mean f c , 90 , F E M for full comp., 3.84 N/mm 2 , was slightly higher than the mean value of 3.30 N/mm 2 found by Serrano and Enquist [36] and 3.33 N/mm 2 , as proposed by Bogensperger et al. [7]. Thus, different CLT thickness and loaded area, in addition to variations in material characteristics, could be the reason for the variation in CPG f c , 90 . The relative increase in E c , 90 , F E M from full comp. to ww-cen of about 63% was in good agreement with the experiments.
As regards the influence of the deck outer layer orientation on strength, the numerical model predicted a strength of about 12% higher for ww-cen than for ww90-cen compared with an increase of 36% found in the experiments. No effect of the deck outer layer orientation on the stiffness was predicted by the model, which is, however, in contradiction to the experiments, where a difference of about 37% was found. It seems that the model does not fully capture the influence of the fiber orientation on the stress dispersion in the CLT floor.
Almost no difference between CLT and steel bars as loading and support elements on the stiffness and strength of CPG of CLT was predicted by the model (see Table 5 and Figure 7). This corresponds well with the experiments in regard to strength. However, an 11–34% higher stiffness of steel bar loaded compared with CLT loaded CLT floor elements was found in the experiments. The model findings are in agreement with previous results by Gasparri et al. [50] and Brandner [2], who did not find significant differences in stiffness and strength due to different loading elements.
Finally, the findings related to the influence of CLT wall thickness for the same CLT floor thickness are illustrated in Figure 8. The finite element model predicted decreased stiffness and strength for increased wall thickness, which corresponds well to the experimental results and previous works [2,50]. This is a consequence of the stress dispersion, which has more influence and leads to a stronger increase of the stiffness and load-carrying capacity for smaller widths of load introduction elements. In other words, the length effect is lower for broader load introduction elements.

3.1.2. Load and Support Configuration Factor k c , 90

The above-described influence parameters lead to a higher stiffness and a higher strength of CLT connections compared with a pure compression test (full comp.) of CLT. In the engineering design of timber structures, this is accounted for by the magnification factor k c , 90 as a strength increase factor. A similar magnification factor can be calculated for the increase in stiffness, which is, however, not regulated in the design standards. In the design, k c , 90 , as a strength increase factor, is defined as the increase in characteristic strength, while here, k c , 90 is presented as a deterministic model-predicted increase in mean strength and stiffness. k c , 90 values were calculated based on the model-predicted mean f c , 90 equal to 3.84 N/mm 2 and mean E c , 90 equal to 604 N/mm 2 of connection W80-F140 and W100-F140. The findings are presented in Table 5 and illustrated in a correlation plot in Figure 9. Overall, a good agreement of the model with the experiments was found. Model-predicted k c , 90 for f c , 90 varies from 1.13 to 1.73, while the variation found in the experiments was slightly larger with values from 1.24 to 1.99. The underestimation of the k c , 90 for f c , 90 is a consequence of the slightly overestimated (reference) strength of the full compression setup and a slight underestimation of the unloaded length effect (cf. Figure 3b).
The above-mentioned values from the experiments and from the model are in good agreement with earlier proposed values in Bogensperger et al. [7], from 1.40 to 1.90, based on f c , 90 , k of 2.85 N/mm 2 ; see also [2]. Considering only the length effect in ww connections, the model-predicted k c , 90 values of 1.17 to 1.49 are slightly higher than the proposed range from 1.10 to 1.30, for 5-layer CLT in load transmission by Thiel and Brandner [51], based on f c , 90 , k of 3.0 N/mm 2 , and the even slightly higher experimental findings in this study. It is worth mentioning that Thiel and Brandner [51] used a load introduction bar with a thickness of 20 mm and that a smaller thickness is known to lead to higher strength increase, which could yield higher k c , 90 .
A good agreement was also found between the model-predicted k c , 90 for E c , 90 , with values from 0.76 to 1.90, with experimental values from 0.81 to 2.14. This k c , 90 for E c , 90 is related to the material and load dispersion effect. The value less than 1.0 was for acoustic , and the highest value was for screw connections. The model-predicted load transmission effect related k c , 90 for E c , 90 of ww connections from 1.12 to 1.67, which is higher than the value of 1.06 proposed by Brandner [2]. From the correlation plot in Figure 9, it can be seen that the model resulted in a higher deviation of stiffness prediction than strength prediction.

3.1.3. Local Strain Distribution in the CLT

Thanks to the experimentally determined surface strain fields, model predictions can also be compared on a local material scale rather than on the global stress–strain behavior, as discussed before. It should be noted that a simplified annual ring structure was assumed in the model and that the pith location in the test specimens could have been different. Thus, a quantitative comparison of the strains is not reasonable. Moreover, the elastic stiffness of the model is significantly higher than the experimental data, which was visible in more concentrated strains in the model, compared with the experimental data. In Figure 10, surface strains (in a global coordinate system and not in the local principal material orientations) for different types of ww connections are shown in order to assess similarities of the model with the experimental data. The numerical models yielded high strain concentration locally, at the contact surfaces between CLT walls and floor. This is a consequence of the difference in contact behavior between wall and floor surface in the experiments and as considered in the models. Interestingly, in both the experiments and the models, plastic strain started developing close to the bond lines between layers, which is distinctly visible in the experiments. The DIC strain development was found to be dependent on local material conditions such as cracks or gaps, weaker local parts and the existence of checks. Variations in the local stress distribution in the CLT floor under stiffer and weaker layers of the CLT walls were clearly visible in the models, while not so obvious in the experimental data. The numerical model for ww-edge connection yielded a very high strain concentration at the inside contact faces of walls and floor due to the uplifting of the free edge of CLT floor, which was not visible in DIC strain. The development of shear strain was noticed locally in the transverse layers in the experiments, while the models yielded a slightly higher concentration at the corners of the contact surfaces between wall and floor elements. The compressive strains in ww90-cen connections were found to be distributed over the two outer layers in the experiment, while in the model, more intensified compressive strains in an about 10 mm region under or above the CLT walls was found. This is one of the reasons for the large difference in E c , 90 between experiment and numerical model for the ww90-cen setup.

3.2. Parameter Study

3.2.1. Influence of Wall and Floor Thicknesses

The dependence of connection stiffness and strength on floor and wall thickness was investigated by means of a parameter study. A wood-to-wood connection with center position was studied for four different wall thicknesses, namely 80 mm, 100 mm, 200 mm and 300 mm, and three floor thicknesses, namely 100 mm, 140 mm and 300 mm. Figure 11 shows the stress–strain curve for different wall and floor thicknesses with the reference configuration. The results are presented in Table 6 in terms of E c , 90 , f c , 90 and k c , 90 , showing the dependence of stiffness and strength on the wall thickness and floor thickness. Figure 12a,b shows the dependence of stiffness and strength as a function of the wall thickness, for three different floor thicknesses, and Figure 12c,d shows the dependence on floor thickness for four wall thicknesses.
The results followed similar trends in variation of connection stiffness and strength depending on wall and floor thicknesses, as observed in the experimental investigation. Increasing wall thicknesses decreases stiffness and strength of the connection. The absolute decrease in stiffness is stronger for thicker floors, while the absolute decrease in strength is about the same for the three investigated floor thicknesses. The influence of wall thickness on stiffness and strength of the CLT connection is strongest for the practically most relevant wall thicknesses of 80 to about 160 mm, but decreases for larger wall thicknesses. This clearly shows that the relative increase due to stress dispersion is stronger for thinner walls than for thicker ones. E c , 90 varied from 855 to 1358 N/mm 2 for 80 mm wall thickness, while the variation was 603 to 725 N/mm 2 for 300 mm wall thickness. For the same geometries, the strengths varied from 5.35 to 6.26 N/mm 2 and from 4.21 to 4.55 N/mm 2 for 80 mm and 300 mm walls, respectively. The relationships for the different floor thicknesses can be described by the following exponential equation:
E c , 90 = a e b t w + c e d t w ,
where a , b , c and d are regression coefficients, given in Table 7.
Floor thickness has a positive influence on connection stiffness and strength. The stiffness increase is more pronounced for thinner walls. Strength, however, is only slightly increasing with floor thickness for all wall thicknesses. The relations between stiffness and strength with floor thickness were fitted with a power law equation, expressed as
E c , 90 = a t w b + c .
The regression coefficients a , b and c for the fitted curves are given in Table 8.
The above-described results clearly show the influence of wall and floor thickness on the stiffness and strength of the connection. Next, an attempt to combine the results is made by plotting the mechanical behavior as a function of the ratio of wall-to-floor thickness (t w /t f ). The results are presented in Figure 13.
There is a clear decreasing relationship for all parameters with increasing t w /t f from 0.27 to about 1.50. The parameter study gave a variation of E c , 90 between 603 and 1358 N/mm 2 while the variation of f c , 90 was between 4.21 and 6.25 N/mm 2 . The highest E c , 90 and f c , 90 were found for a t w /t f equal to 0.27 (W80-F300), with the thinnest wall and the thickest floor. The figures also show the variation of the parameters for the same t w / t f . For instance, for a ratio of 1, illustrated by t f = t w = 100 mm and t f = t w = 300 mm, the corresponding f c , 90 are 4.95 N/mm 2 and 4.55 N/mm 2 , which gives k c , 90 values of 1.28 to 1.18. It should be noted that the k c , 90 values are calculated for the reference stiffness and strength of a 140 mm floor element.
For engineering purposes, a regression equation for the parameter set could be derived by means of an exponential equation according to Equation (8) (see Figure 13) with t w /t f ratio. The regression coefficients a, b, c and d for the fitted curves for E c , 90 and f c , 90 are given in Table 9 and for k c , 90 in Table 10.

3.2.2. Influence of Pith Locations

The influence of the principal material orientation of the orthotropic material was investigated by changing the origin (pith) of the cylindrically orthotropic coordinate system, defining the orientation for each board. In the reference connection of W80-F140-ww-cen, the pith was 30 mm below the center of the lower edge of the board. Stress–strain relationships for different pith locations are shown in Figure 14a. It becomes obvious that a less curvature with a pith location farther away (pith-50) leads to a stiffer and stronger behavior than the reference state. This effect becomes even more pronounced for an even larger curvature of the principal material orientations for a pith location even closer to the edge of the board (pith-10). pith-50 resulted about 8% higher strength and 22% higher stiffness than pith-10. The material is mainly loaded in a radial compression for pith-50, while a more shear and tangential compression is present in pith-10. For a configuration that leads to even more shear stress in the boards (pith-45deg), stiffness and strength are very close to pith-10. For the investigated pith variations, k c , 90 values for stiffness and strength from 1.54 to 1.87 and from 1.43 to 1.54 were found. The above-described patterns were assigned similarly to all boards in the CLT elements. By combining these patterns in a random manner, a stress–strain relationship and a stiffness and strength in between the above-given limits were found; see Table 6.

3.2.3. Influence of Number of Layers

For a given pith location, the size of the boards affects the local stress state as well as the overall response of the connection. This effect was assessed by changing the number (and thus the thickness) of the CLT elements layers. The reference condition was W100-F140-ww-cen with 5 layers in the wall and the floor elements. Stress–strain relationships for different numbers of layers are shown in Figure 14b. The model considering 7 layers in the floor element resulted in lower stiffness and strength than the reference model with 5 layers. The strength was about 3% lower, and the stiffness was 5% lower. Reducing the number of layers in the wall to 3 layers increased the strength by about 2% and the stiffness by about 14% compared with the 5-layer reference wall. Thus, a decreasing strength and stiffness with increasing number of layers in the wall and the floor elements were observed. The trend of decreasing strength with increasing number of layers was also observed in the experiments of Halili [9]. However, an increased stiffness with increasing number of layers was found in those experiments, which is in contradiction to the numerical findings of this study.

4. Conclusions

A numerical study of CLT wall-to-floor connections under compression perpendicular to the grain loading was carried out by using an elasto-plastic material model based on a Quadratic multi-surface (QMS) failure criterion. The validation is laid on an experimental study. The results showed, in general, a good agreement between the model and the experimental findings. The finite element model overestimated stiffness by about 25% (the local contact behavior between the CLT elements is not considered in the model), while the strength was only slightly underestimated. Differences in stiffness and strength for different types of connections including wood-to-wood contact connections, connections with screws and connections with acoustic layers, were well predicted. Moreover, the model-predicted length effect, which describes the load dispersion in the CLT for different positions of the walls in the connection, agreed well with experimental findings and the corresponding load and stiffness increase factors, k c , 90 .
The model validation confirmed a decreasing stiffness and strength for increasing wall thickness. This is, despite the increasing force, an influence of the stress dispersion, which is stronger for smaller wall thicknesses. This was further assessed by a parameter study, where combinations of various wall and floor thicknesses were analyzed. The wall-thickness effect has the strongest influence for the practically most relevant wall thicknesses between 80 and about 160 mm, while it decreases with larger wall thicknesses. The parameter study also showed that an increasing floor thickness leads to higher stiffness and strength, due to the load dispersion effect. The increase was found to be stronger for smaller wall thicknesses. The influence of the annual ring orientation, or the pith location, was assessed as well and showed that boards with higher curvature of annual rings yielded lower stiffness and strength than a milder curvature of annual rings, i.e., when the pith is far away.
The findings of the parameter study were fitted with regression equations that capture the above-mentioned effects of wall and floor thicknesses. Finally, a dimensionless ratio of wall-to-floor thickness was used for deriving regression equations for stiffness and strength, as well as for load and stiffness increase factors, which could be used for the engineering design of CLT connections. The model provides new insight into structure–mechanical properties relationships of CLT that facilitate a CLT product design.

Author Contributions

Conceptualization, S.T.A., M.S. and T.K.B.; methodology, S.T.A. and M.S.; software, E.S.; validation, S.T.A. and M.S.; formal analysis, S.T.A. and M.S.; resources, T.K.B.; data curation, S.T.A. and M.S.; writing—original draft preparation, S.T.A.; writing—review and editing, M.S., E.S. and T.K.B.; visualization, S.T.A.; supervision, T.K.B.; funding acquisition, T.K.B. and E.S. All authors have read and agreed to the published version of the manuscript.

Funding

This research work was funded by the Swedish research council FORMAS through the project ‘Compression perpendicular to the grain in cross-laminated engineered wood-based products’ (2016-01086).

Conflicts of Interest

The authors declare no conflict of interest.

References

  1. Akter, S.T.; Bader, T.K. Experimental assessment of failure criteria for the interaction of normal stress perpendicular to the grain with rolling shear stress in Norway spruce clear wood. Eur. J. Wood Wood Prod. 2020, 78, 1105–1123. [Google Scholar] [CrossRef]
  2. Brandner, R. Cross laminated timber (CLT) in compression perpendicular to plane: Testing, properties, design and recommendations for harmonizing design provisions for structural timber products. Eng. Struct. 2018, 171, 944–960. [Google Scholar] [CrossRef]
  3. Kunesh, R. Strength and elastic properties of wood in transverse compression. For. Prod. J. 1968, 18, 65–72. [Google Scholar]
  4. Bodig, J. The peculiarity of compression of conifers in radial direction. For. Prod. J. 1963, 13, 438. [Google Scholar]
  5. Brandner, R.; Schickhofer, G.; Ruli, A.; Halili, Y. Leistungspotential von Brettschichtholz-Beanspruchung auf Längsdruck und Querdruck; Research Report; Institute of Timber Engineering and Wood Technology, Graz University of Technology: Graz, Austria, 2006. (In German) [Google Scholar]
  6. Föppl, A. Die Druckfestigkeit des Holzes in der Richtung quer zur Faser. Mitteilungen Des Mech.-Tech. Lab. Der Königlich Tech. Hochsch. München 1904, 29, 18. (In German) [Google Scholar]
  7. Bogensperger, T.; Augustin, M.; Schikhofer, G. Properties of CLT-panels exposed to compression perpendicular to their plane. In Proceedings of the International Council for Research and Innovation in Building and Construction, Working Commission W18–Timber Structures, Meeting 44, Alghero, Italy, 29 August–1 September 2011. [Google Scholar]
  8. Salzmann, C. Ermittlung von Querdruckkenngrößen für Brettsperrholz (BSP). Master’s Thesis, Institute of Timber Engineering and Wood Technology, Graz University of Technology, Graz, Austria, 2010. (In German). [Google Scholar]
  9. Halili, Y. Versuchstechnische Ermittlung von Querdruckkenngrößen für Brettsperrholz. Diploma Thesis, Institute of Timber Engineering and Wood Technology, Graz University of Technology, Graz, Austria, 2008. (In German). [Google Scholar]
  10. Ciampitti, A. Untersuchung Ausgewählter Einflussparameter auf die Querdruckkenngrößen von Brettsperrholz. Master’s Thesis, Institute of Timber Engineering and Wood Technology, Graz University of Technology, Graz, Austria, 2013. (In German). [Google Scholar]
  11. Hall, C. Behaviour of Wood under Compression Perpendicular to Grain Loading. Ph.D. Thesis, University of British Columbia, Vancouver, BC, Canada, 1980. [Google Scholar]
  12. Hoffmeyer, P.; Damkilde, L.; Pedersen, T. Structural timber and glulam in compression perpendicular to grain. Eur. J. Wood Wood Prod. 2000, 58, 73–80. [Google Scholar] [CrossRef]
  13. Farruggia, F.; Perré, P. Microscopic tensile tests in the transverse plane of earlywood and latewood parts of spruce. Wood Sci. Technol. 2000, 34, 65–82. [Google Scholar] [CrossRef]
  14. Shipsha, A.; Berglund, L.A. Shear coupling effects on stress and strain distributions in wood subjected to transverse compression. Compos. Sci. Technol. 2007, 67, 1362–1369. [Google Scholar] [CrossRef]
  15. Akter, S.T.; Serrano, E.; Bader, T.K. Numerical modelling of wood under combined loading of compression perpendicular to the grain and rolling shear. Eng. Struct. 2021, 244, 112800. [Google Scholar] [CrossRef]
  16. Madsen, B.; Hooley, R.; Hall, C. A design method for bearing stresses in wood. Can. J. Civ. Eng. 1982, 9, 338–349. [Google Scholar] [CrossRef]
  17. Tabarsa, T. Compression Perpendicular-to-Grain Behaviour of Wood. Ph.D. Thesis, The University of New Brunswick, Fredericton, NB, Canada, 1999. [Google Scholar]
  18. Bodig, J. A Study of the Mechanical Behavior of Wood in Transverse Compression; University of Washington: Seattle, WA, USA, 1963. [Google Scholar]
  19. Damkilde, L.; Hoffmeyer, P.; Pedersen, T.N. Compression strength perpendicular to grain of structural timber and glulam. In Proceedings of the International Council for Research and Innovation in Building and Construction, Working Commission W18–Timber Structures, Meeting 31, Savonlinna, Finland, 12–14 August 1998. [Google Scholar]
  20. Hoffman, O. The brittle strength of orthotropic materials. J. Compos. Mater. 1967, 1, 200–206. [Google Scholar] [CrossRef]
  21. Tsai, S.W.; Wu, E.M. A general theory of strength for anisotropic materials. J. Compos. Mater. 1971, 5, 58–80. [Google Scholar] [CrossRef]
  22. Hill, R. The Mathematical Theory of Plasticity; Oxford University Press: London, UK, 1950. [Google Scholar]
  23. Kasal, B.; Leichti, R.J. State of the art in multiaxial phenomenological failure criteria for wood members. Prog. Struct. Eng. Mater. 2005, 7, 3–13. [Google Scholar] [CrossRef]
  24. Eberhardsteiner, J. Mechanisches Verhalten von Fichtenholz: Experimentelle Bestimmung der biaxialen Festigkeitseigenschaften; Springer: Berlin/Heidelberg, Germany, 2013. (In German) [Google Scholar]
  25. Mackenzie-Helnwein, P.; Eberhardsteiner, J.; Mang, H.A. A multi-surface plasticity model for clear wood and its application to the finite element analysis of structural details. Comput. Mech. 2003, 31, 204–218. [Google Scholar] [CrossRef]
  26. Lukacevic, M.; Füssl, J.; Lampert, R. Failure mechanisms of clear wood identified at wood cell level by an approach based on the extended finite element method. Eng. Fract. Mech. 2015, 144, 158–175. [Google Scholar] [CrossRef]
  27. Lukacevic, M.; Lederer, W.; Füssl, J. A microstructure-based multisurface failure criterion for the description of brittle and ductile failure mechanisms of clear-wood. Eng. Fract. Mech. 2017, 176, 83–99. [Google Scholar] [CrossRef]
  28. Serrano, E. Notes on a Plasticity Model for Wood in Compression; Report TVSM-7167; Division of Structural Mechanics, Lund University: Lund, Sweden, 2020. [Google Scholar]
  29. Persson, J. Numerical Analysis of Compression Perpendicular to the Grain in Glulam Beams with and without Reinforcement. Master’s Thesis, Division of Structural Mechanics, Lund University, Lund, Sweden, 2011. [Google Scholar]
  30. Blaß, H.; Görlacher, R. Compression perpendicular to the grain. In Proceedings of the 8th World Conference on Timber Engineering (WCTE), Lahti, Finland, 14–17 June 2004; Volume 2, pp. 435–440. [Google Scholar]
  31. Graf, O. Beobachtungen über den Einfluss der Größe der Belastungsfläche auf die Widerstandsfähigkeit von Bauholz gegen Druckbelastung quer zur Faser. Der Bauing 1921, 18, 498–501. (In German) [Google Scholar]
  32. Madsen, B.; Leijten, A.; Gehri, E.; Mischler, A.; Jorissen, A. Behaviour of Timber Connections; Timber Engineering Ltd.: Vancouver, BC, Canada, 2000; ISBN 1-55056-738-1. [Google Scholar]
  33. Bleron, L.; Denaud, L.; Collet, R.; Marchal, R. Experimental study of locally loaded timber in compression perpendicular to the grain. Eur. J. Environ. Civ. Eng. Ed. Lavoisier 2011, 15, 357–366. [Google Scholar] [CrossRef] [Green Version]
  34. Hasuni, H.; Al-douri, K.; Hamodi, M. Compression Strength Perpendicular to Grain in Cross-Laminated Timber (CLT). Master’s Thesis, School of Technology and Design, Växjö University, Växjö, Sweden, 2009. [Google Scholar]
  35. Kathem, A.; Hussain, T.; Kamali, A. Compression Perpendicular to Grain in Timber–Bearing Strength for a Sill Plate. Master’s Thesis, Department of Building Technology, Linnaeus University, Växjö, Sweden, 2014. [Google Scholar]
  36. Serrano, E.; Enquist, B. Compression strength perpendicular to grain in cross-laminated timber (CLT). In Proceedings of the World Conference on Timber Engineering (WCTE), Riva del Garda, Italy, 20–24 June 2010. [Google Scholar]
  37. Eurocode 5: Design of Timber Structures-Part 1-1: General–Common Rules and Rules for Buildings; European Committee for Standardization, (CEN): Brussels, Belgium, 2004.
  38. Riberholt, H. Compression Perpendicular to the Grain. Documentation of the Strength. P–42239–1; report COWI; COWI: Copenhagen, Denmark, 2000.
  39. Schweigler, M.; Akter, S.T.; Sabaa, S.; Bader, T.K. An Experimental Study of Stiffness and Strength of Cross-Laminated Timber Wall-to-Floor Connections under Compression Perpendicular to the Grain. 2021; Manuscript in preparation for submission. [Google Scholar]
  40. Schweigler, M.; Akter, S.T.; Ncube, N.; Sabaa, S.; Johansson, T.; Bader, T.K. Non-uniform compressive loading of cross-laminated timber (CLT) perpendicular to the grain. In Proceedings of the World Conference on Timber Engineering (WCTE), Santiago, Chile, 9–12 August 2021. [Google Scholar]
  41. EN 338. Structural Timber—Strength Classes; European Committee for Standardization, (CEN): Brussels, Belgium, 2016. [Google Scholar]
  42. SIMULIA. Abaqus 2016. Documentation, Dassault Systèmes, Rhode Island. Available online: http://130.149.89.49:2080/v2016/books/usi/default.htm (accessed on 24 September 2021).
  43. McKenzie, W.; Karpovich, H. The frictional behaviour of wood. Wood Sci. Technol. 1968, 2, 139–152. [Google Scholar] [CrossRef]
  44. Danielsson, H.; Gustafsson, P.J. A three dimensional plasticity model for perpendicular to grain cohesive fracture in wood. Eng. Fract. Mech. 2013, 98, 137–152. [Google Scholar] [CrossRef]
  45. Foley, C. Modeling the Effects of Knots in Structural Timber. Ph.D. Thesis, Lund University, Lund, Sweden, 2003. [Google Scholar]
  46. Lindstam, G.; Larsson, B. Optimized Utilization of Raw Materials for Production of Cross Laminated Timber: Quality of Laminations and Its Effects on Mechanical Properties of Multi-Layer Panels. Master’s Thesis, Department of Building Technology, Linnaeus University, Växjö, Sweden, 2019. [Google Scholar]
  47. EN 408, Structural Timber and Glued Laminated Timber; Determination of Some Physical and Mechanical Properties; European Committee for Standardization, (CEN): Brussels, Belgium, 2010.
  48. Dorn, M. Investigations on the Serviceability Limit State of Dowel-Type Timber Connections. Ph.D. Thesis, Vienna University of Technology, Vienna, Austria, 2012. [Google Scholar]
  49. Iraola, B.; Cabrero, J.; Basterrechea-Arévalo, M.; Gracia, J. A geometrically defined stiffness contact for finite element models of wood joints. Eng. Struct. 2021, 235, 112062. [Google Scholar] [CrossRef]
  50. Gasparri, E.; Lam, F.; Liu, Y. Compression perpendicular to grain behavior for the design of a prefabricated CLT façade horizontal joint. In Proceedings of the World Conference on Timber Engineering (WCTE), Vienna, Austria, 22–25 August 2016. [Google Scholar]
  51. Thiel, A.; Brandner, R. ULS Design of CLT Elements–Basics and some Special Topics. In Proceedings of the Joint Conference of COST Actions FP1402 and FP1404 Cross Laminated Timber—A Competitive Wood Product for Visionary and Fire Safe Buildings, KTH Royal Institute of Technology, Division of Building Materials, Stockholm, Sweden, 10–11 March 2016. [Google Scholar]
Figure 1. CLT connection tests with different connection types and positions of load; (a) wood-to-wood connection, (b) connection with screws, (c) connection with acoustic layers, and (d) connection loaded and supported with steel bars.
Buildings 11 00442 g001
Figure 2. Parameter study of the influence of (a) wall and floor thicknesses, (b) pith location, and (c) number of layers.
Buildings 11 00442 g002
Figure 3. Correlation plot of (a) E c , 90 and (b) f c , 90 from FEM and experiment.
Buildings 11 00442 g003
Figure 4. Compression stress vs. strain curves for W100-F140-cen-ww from FEM and experiment with unloading and reloading paths.
Buildings 11 00442 g004
Figure 5. Compression stress vs. strain curves for center and edge positions of walls in series W80-F140 for (a) wood-to-wood contact (ww), (b) screw (screw), and (c) acoustic (acoustic) connections.
Buildings 11 00442 g005
Figure 6. Compression stress vs. strain curves for different loading and supporting positions and deck outer layer orientations for wood-to-wood contact in series W80-F140.
Buildings 11 00442 g006
Figure 7. Compression stress vs. strain curves for loading and supporting with (a) CLT walls and (b) steel plates in series W80-F140.
Buildings 11 00442 g007
Figure 8. Wall thickness effect: Compression stress vs. strain curves for center positions of walls in series (a) W80-F140 and (b) W100-F140.
Buildings 11 00442 g008
Figure 9. Correlation plot of (a) k c , 90 for E c , 90 and (b) k c , 90 for f c , 90 from FEM and experiment.
Buildings 11 00442 g009
Figure 10. Strain distributions from numerical model (left) and experiments (right) for W100-F140-ww-cen setup: (a) compressive strain and (b) shear strain; for W100-F140-ww-edge setup: (c) compressive strain and (d) shear strain; (e) compressive strain for W80-F140-ww90-cen and (f) W80-F140-full comp. at about 2.5 mm global displacement.
Buildings 11 00442 g010
Figure 11. Compressive stress vs. strain curves for the influence of wall and floor thicknesses.
Buildings 11 00442 g011
Figure 12. Influence of floor and wall thickness on connection stiffness, E c , 90 , and strength, f c , 90 ; (a) E c , 90 and (b) f c , 90 as a function of wall thickness, t w ; (c) E c , 90 and (d) f c , 90 as a function of floor thickness, t f .
Buildings 11 00442 g012
Figure 13. (a) E c , 90 and k c , 90 for E c , 90 and (b) f c , 90 and k c , 90 for f c , 90 as a function of wall-to-floor thickness, t w / t f .
Buildings 11 00442 g013
Figure 14. Compressive stress vs. strain curves for the influence of (a) pith locations and (b) number of layers in walls and floor.
Buildings 11 00442 g014
Table 1. Dimension of test specimens.
Connection Type/Load PositionWall Size (mm)Floor Size (mm)
b w h w t w l f b f t f
W80-F140-ww-cen35025080735350140
W80-F140-ww-edge35025080365350140
W80-F140-screw-cen35025080488350140
W80-F140-screw-edge35025080735350140
W80-F140-acoustic-cen35025080735350140
W80-F140-acoustic-edge35025080488350140
W80-F140-full comp.3502508080350140
W80-F140-ww90-cen35025080735350140
W80-F140-steel-cen350-80735350140
W80-F140-steel-edge350-80365350140
W100-F140-ww-cen250250100735250140
W100-F140-ww-edge250250100365250140
W100-F140-screw-cen250250100735250140
W100-F140-screw-cen250250100365250140
W100-F140-acoustic-cen250250100735250140
W100-F140-acoustic-edge250250100365250140
W100-F140-full comp.250250100100250140
W100-F140-steel-cen250-100735250140
W100-F140-steel-edge250-100365250140
W100-F100-ww-cen250250100735250100
Table 2. Mesh dependency study for W80-F140-ww-cen.
Mesh Size (mm)Element TypeNo. of ElementsRun Time (s) E c , 90 (N/mm 2 ) f c , 90 (N/mm 2 )
158-node linear brick735680710106.37
108-node linear brick28,440204910085.90
88-node linear brick56,304429210115.73
68-node linear brick118,65010,13810065.65
1520-node quadratic brick735611,5855635.10
1020-node quadratic brick26,13625,7309825.20
Table 3. Wood material’s elasticity properties for FE modeling.
E-Modulus (N/mm 2 )Poisson’s RatioShear Modulus (N/mm 2 )
E R E T E L ν RT ν RL ν TL G RT G RL G TL
83054512,0000.420.020.0255500550
Table 4. Wood material’s strength properties for FE modeling.
Comp. Strength (N/mm 2 )Tensile Strength (N/mm 2 )Shear Strength (N/mm 2 )
f c , R f c , T f c , L f t , R f t , T f t , L f v , RT f v , RL f v , TL
4.584.25502.753.28501.544.564.62
Table 5. Comparison of E c , 90 , f c , 90 , k c , 90 for f c , 90 , and k c , 90 for E c , 90 from experiments and finite element modeling.
Conn. Type E c , 90 (N/mm 2 ) f c , 90 (N/mm 2 ) k c , 90 for f c , 90 * k c , 90 for E c , 90 *
FEMExperimentFEMExperimentFEMExperimentFEMExperiment
W80-F140-ww-cen10117785.736.221.491.781.671.59
W80-F140-ww-edge7755584.855.071.261.451.291.14
W80-F140-ww90-cen10175665.154.551.341.301.681.16
W80-F140-full comp.6184843.883.661.011.051.020.99
W80-F140-screw-cen11528006.246.961.621.991.901.64
W80-F140-screw-edge9886585.405.501.401.571.631.35
W80-F140-acoustic-cen6394895.405.611.401.601.061.00
W80-F140-acoustic-edge5144464.644.791.211.370.850.91
W80-F140-steel-cen94810475.606.411.461.831.572.14
W80-F140-steel-edge7706894.805.091.251.451.271.41
W100-F140-ww-cen7876865.255.901.371.691.301.41
W100-F140-ww-edge6974804.514.581.171.311.150.98
W100-F140-full comp.5904913.813.330.990.950.981.00
W100-F140-screw-cen11187866.636.821.731.951.851.61
W100-F140-screw-edge9965895.975.801.551.661.651.21
W100-F140-acoustic-cen5085335.005.221.301.490.841.09
W100-F140-acoustic-edge4603974.354.331.131.240.760.81
W100-F140-steel-cen8687635.275.611.371.601.441.56
W100-F140-steel-edge7366274.524.541.171.301.221.28
W100-F100-ww-cen6805454.954.551.291.301.121.12
* Reference for k c , 90 is the mean value of W80-F140 and W100-F140.
Table 6. E c , 90 , f c , 90 , k c , 90 for f c , 90 and k c , 90 for E c , 90 —parameter study.
Conn. Specification E c , 90 (N/mm 2 ) f c , 90 (N/mm 2 ) k c , 90 for f c , 90 k c , 90 for E c , 90
W80-F100-ww-cen8555.351.391.41
W100-F100-ww-cen6804.951.281.12
W200-F100-ww-cen6134.331.121.01
W300-F100-ww-cen6034.211.101.0
W80-F140-ww-cen10115.731.491.67
W100-F140-ww-cen7875.251.361.30
W200-F140-ww-cen6854.571.191.13
W300-F140-ww-cen6034.211.101.09
W80-F300-ww-cen13586.251.622.25
W100-F300-ww-cen11065.721.491.83
W200-F300-ww-cen8114.861.261.34
W300-F300-ww-cen7264.551.181.20
pith-109305.501.431.54
pith-5011305.941.541.87
pith-45deg9855.511.431.63
pith-random9525.541.441.58
W100-F140-7layer7455.081.321.23
W100-3layer-F1408995.351.391.49
Table 7. Coefficients of regression curves shown in Figure 12a,b according to Equation (8) for E c , 90 , f c , 90 as a function of wall thickness, t w .
ParameterFloor Thicknessa (N/mm 2 )b (mm 1 )c (N/mm 2 )d (mm 1 )
E c , 90 100616.0−0.0160.431−7.070
140693.2−0.0400.606−6.956
300831.5−0.10615.67−3.766
f c , 90 1004.30−0.0180.102−2.537
1404.61−0.0460.053−3.227
3004.92−0.0610.075−2.997
Table 8. Coefficients of regression curves shown in Figure 12c,d according to Equation (9) for E c , 90 and f c , 90 as a function of floor thickness, t f .
ParameterFloor Thicknessa (N/mm 3 )bc (N/mm 2 )
E c , 90 80−16420−0.033114,950
10045.090.536148.4
140−4377−0.4781098
300−34,020−1.149774.6
f c , 90 80−95.98−0.9126.788
100−34.51−0.6880.431
140−177.2−1.1940.606
300−29.85−0.8664.764
Table 9. Coefficients of regression curves shown in Figure 13 according to Equation (8) for E c , 90 , f c , 90 as a function of wall-to-floor thickness ratio, t w / t f .
Parametera (N/mm 2 )bc (N/mm 2 )d
E c , 90 659.80−0.03838.65−2.581
f c , 90 4.23−0.0050.474−1.277
Table 10. Coefficients of regression curves shown in Figure 13 according to Equation (8) for k c , 90 for E c , 90 and k c , 90 for f c , 90 as a function of wall-to-floor thickness ratio, t w / t f .
Parameterabcd
k c , 90 for E c , 90 1.08−0.0350.065−2.573
k c , 90 for f c , 90 1.08−0.00460.140−1.213
Publisher’s Note: MDPI stays neutral with regard to jurisdictional claims in published maps and institutional affiliations.

