
Optimization of an Eco-Friendly Hydraulic Road Binders Comprising Clayey Dam Sediments and Ground Granulated Blast-Furnace Slag

 ,
,
Abstract
:1. Introduction
2. Materials and Methods
2.1. Cement
2.2. Ground Granulated Blast Furnace GGBS
2.3. Sand
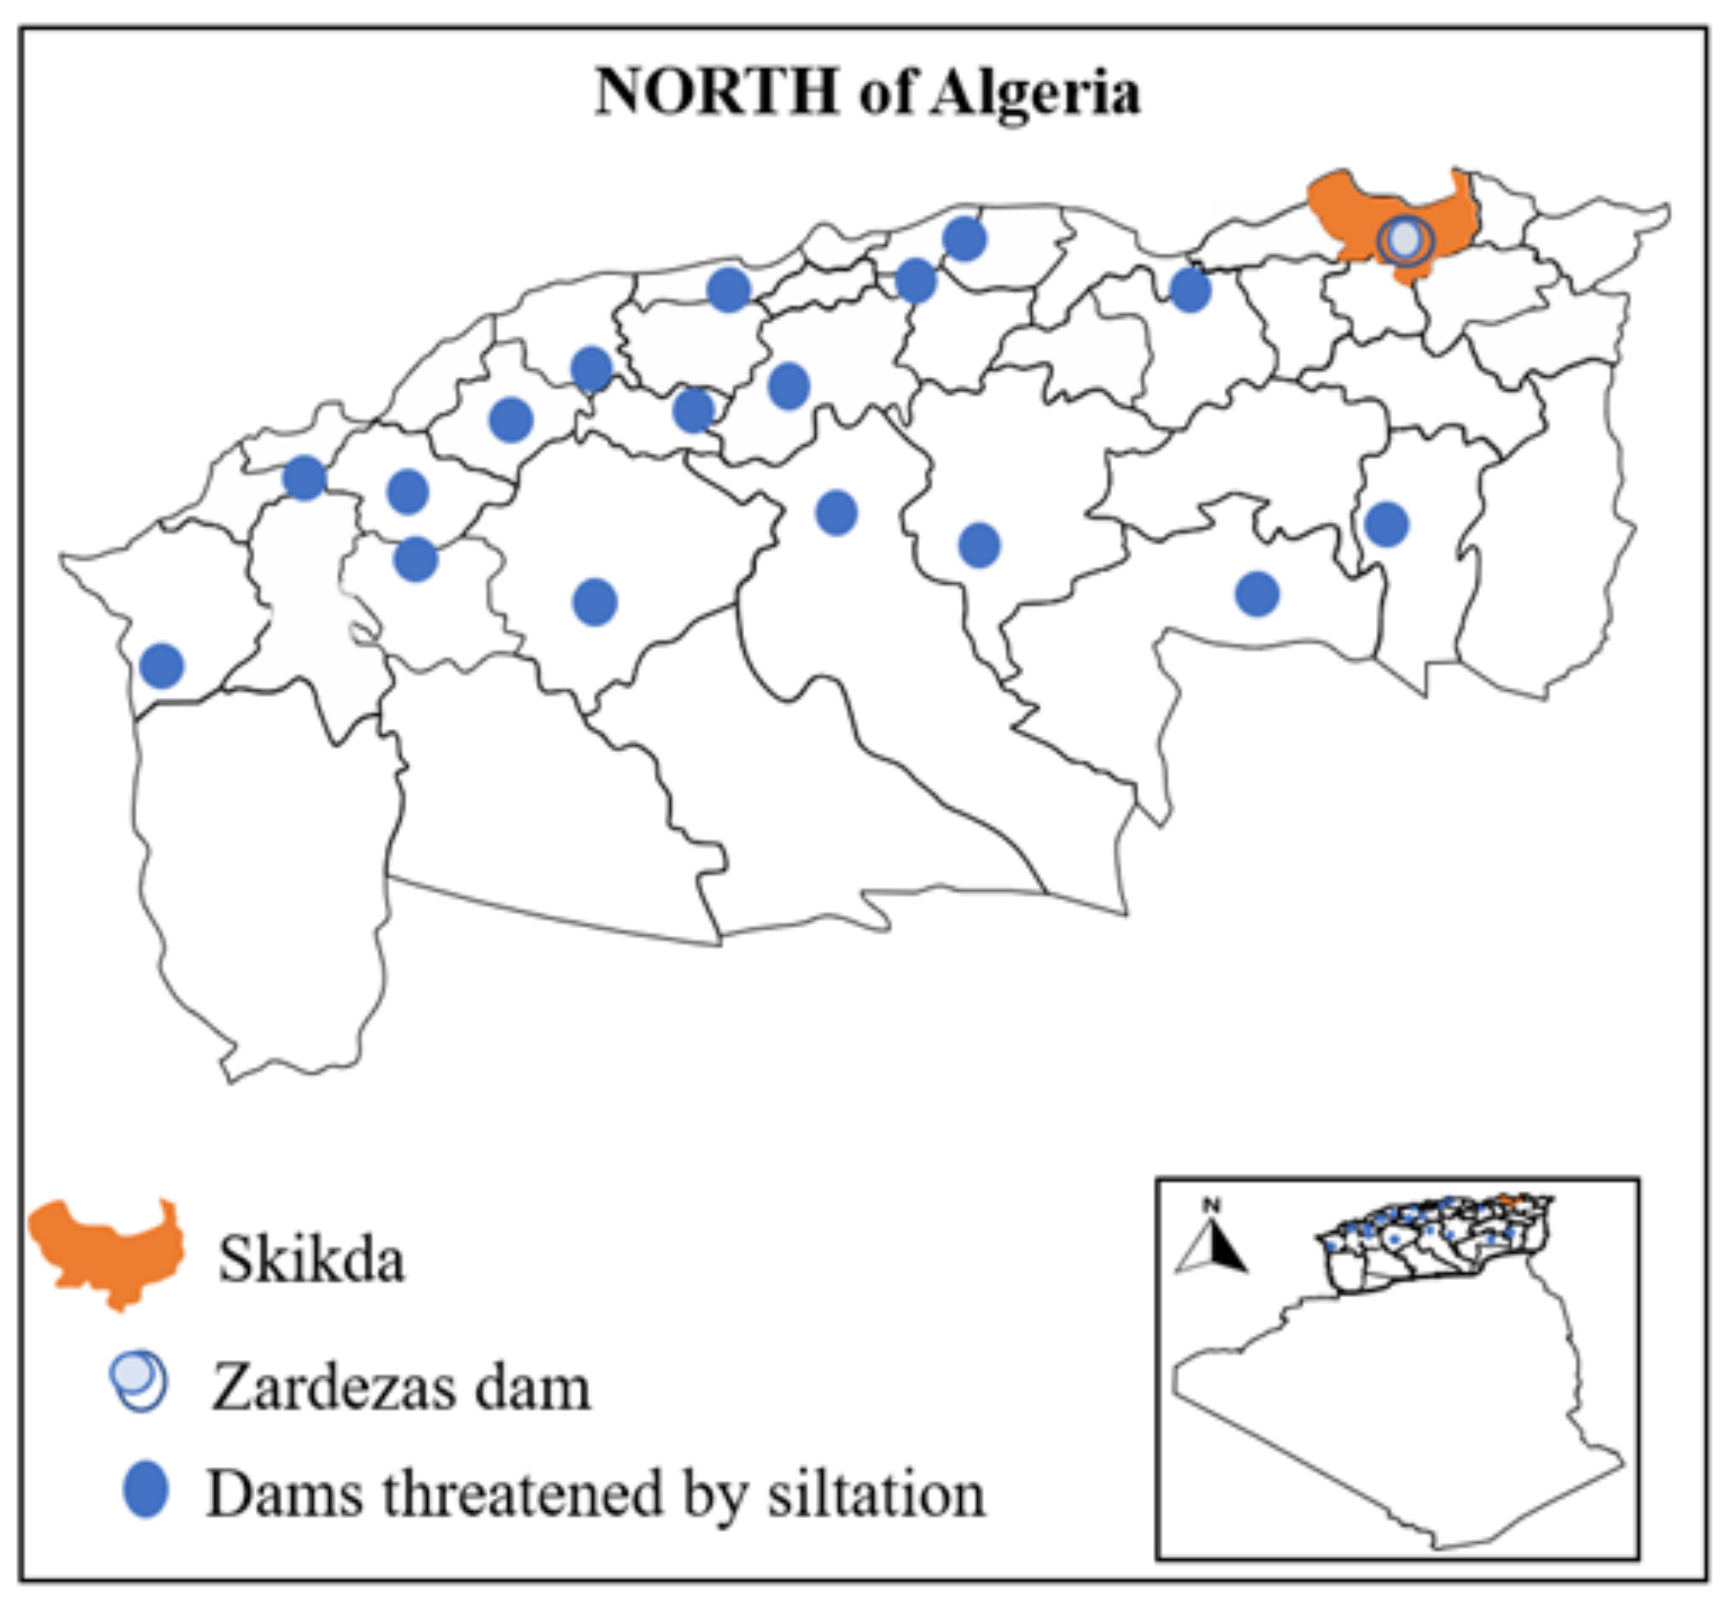
2.4. Raw Sediment Origin and Sampling
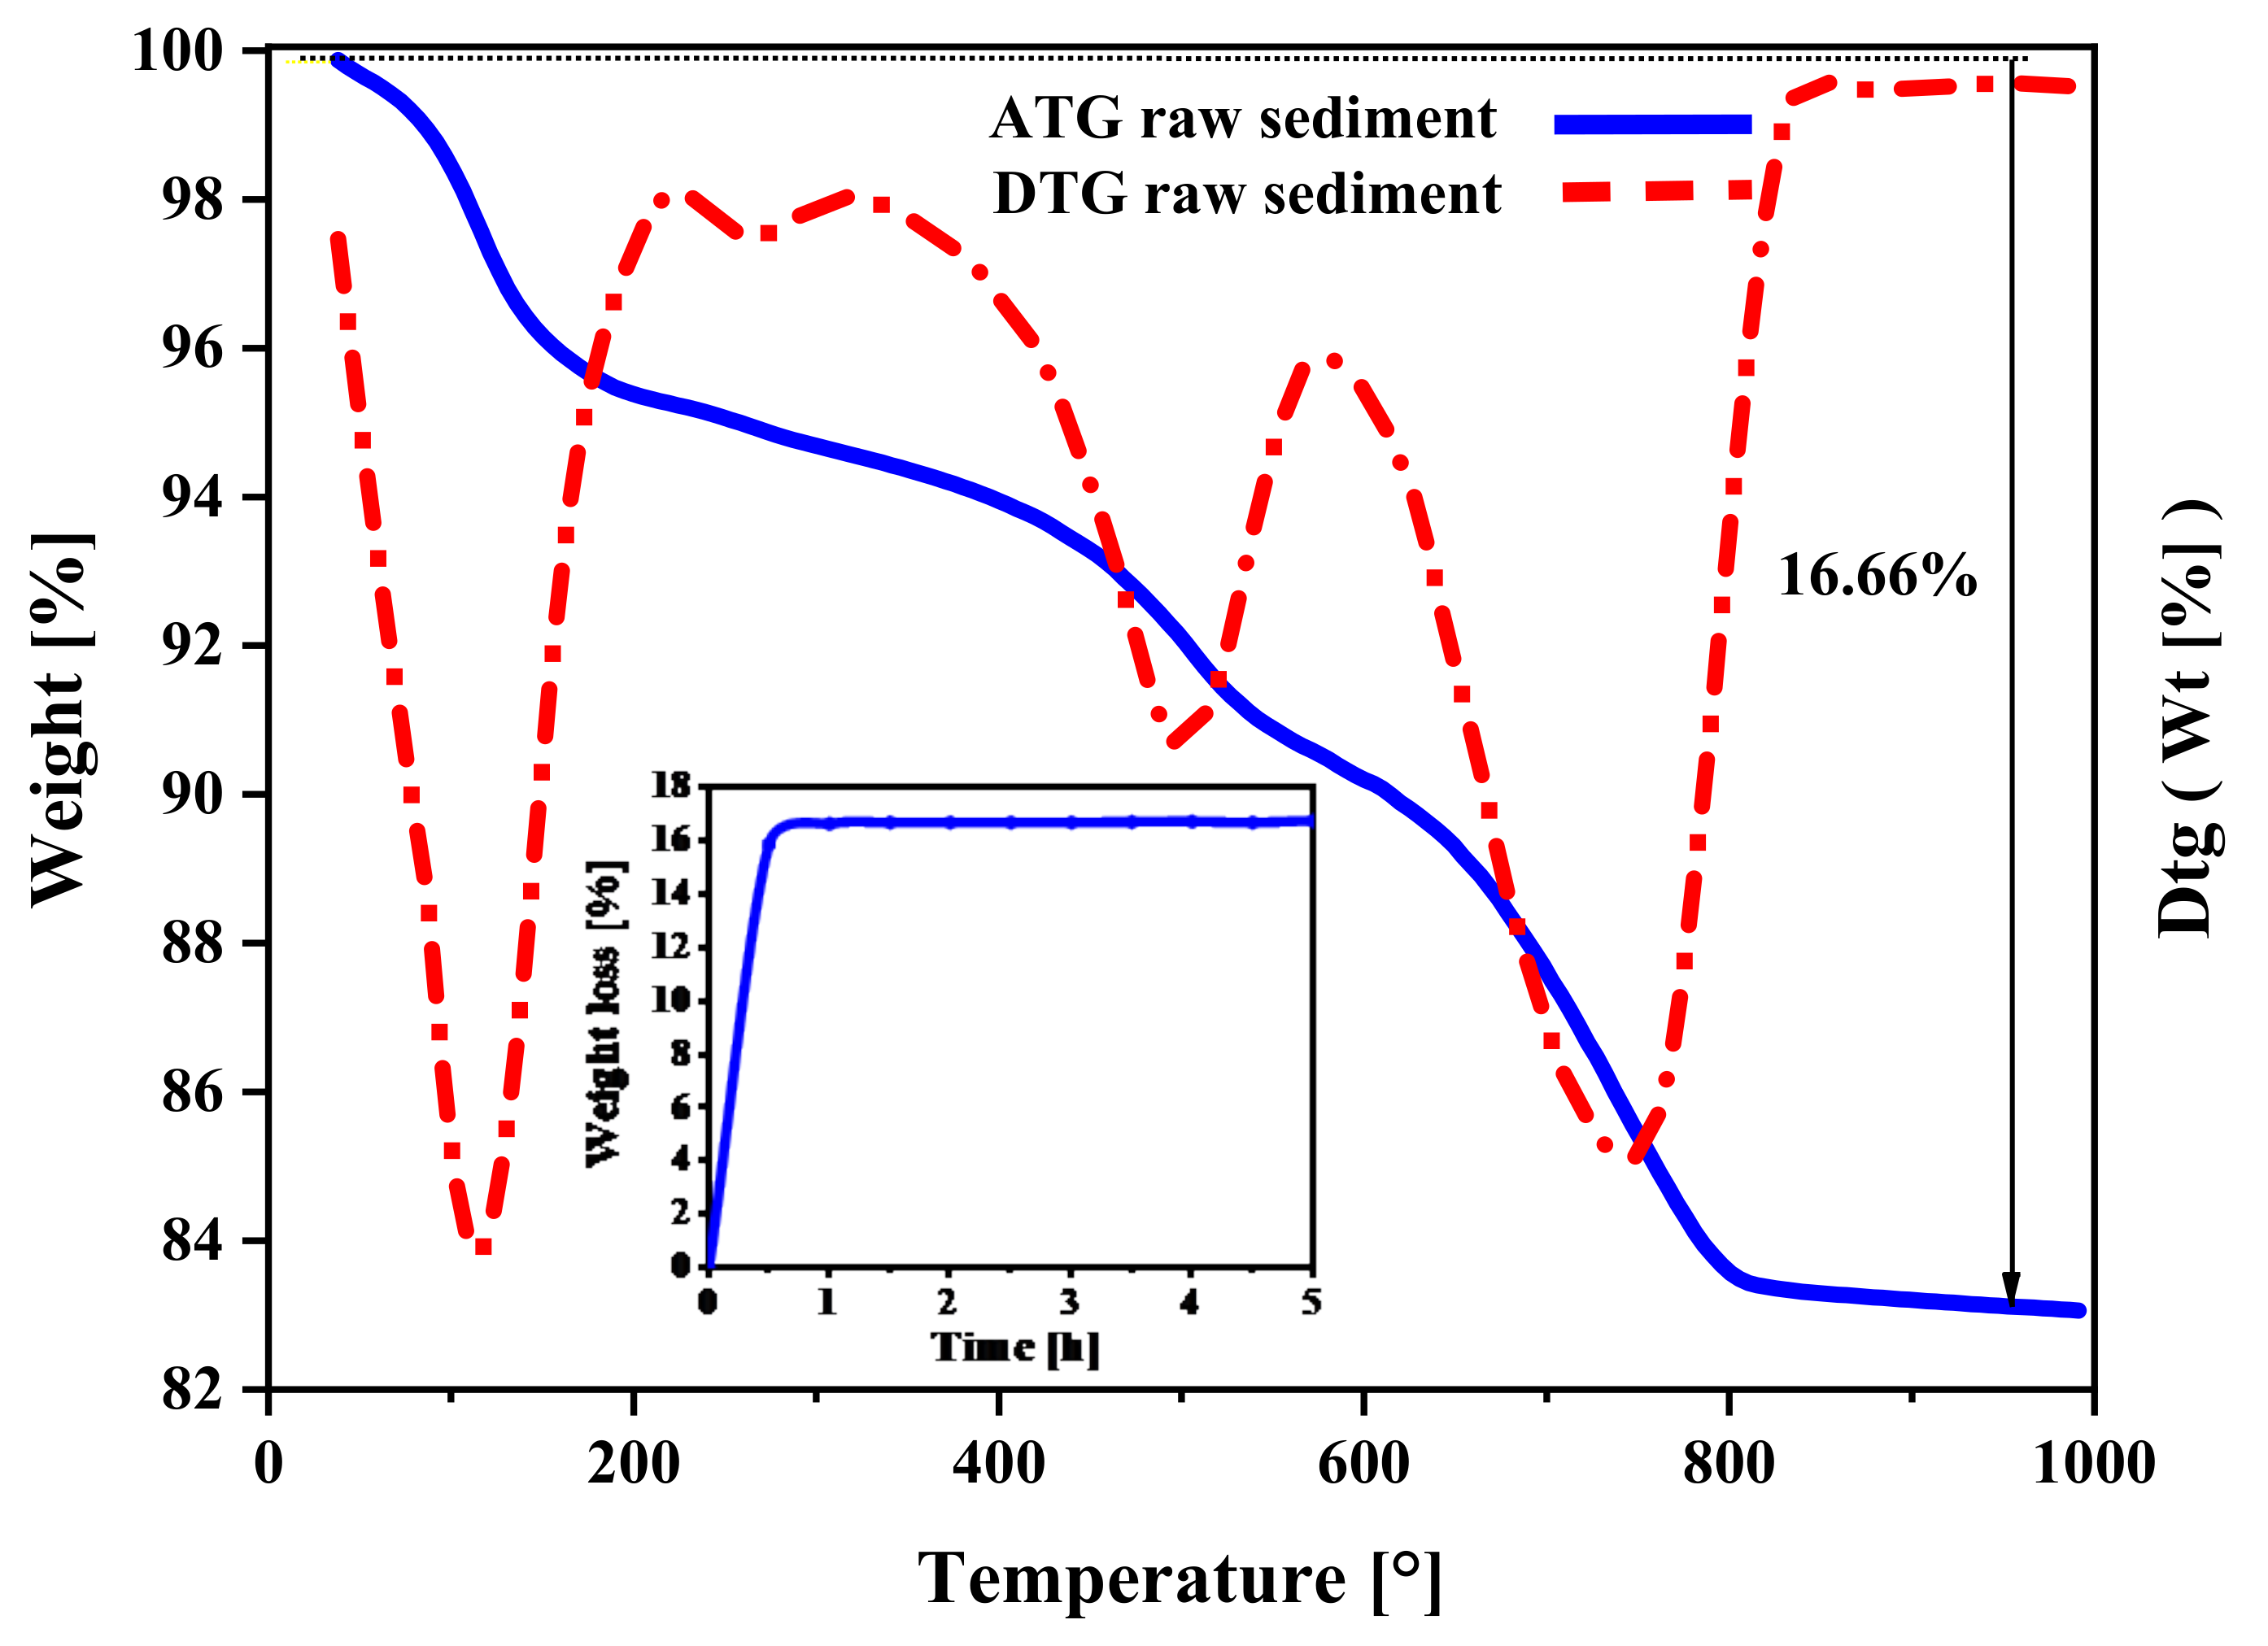
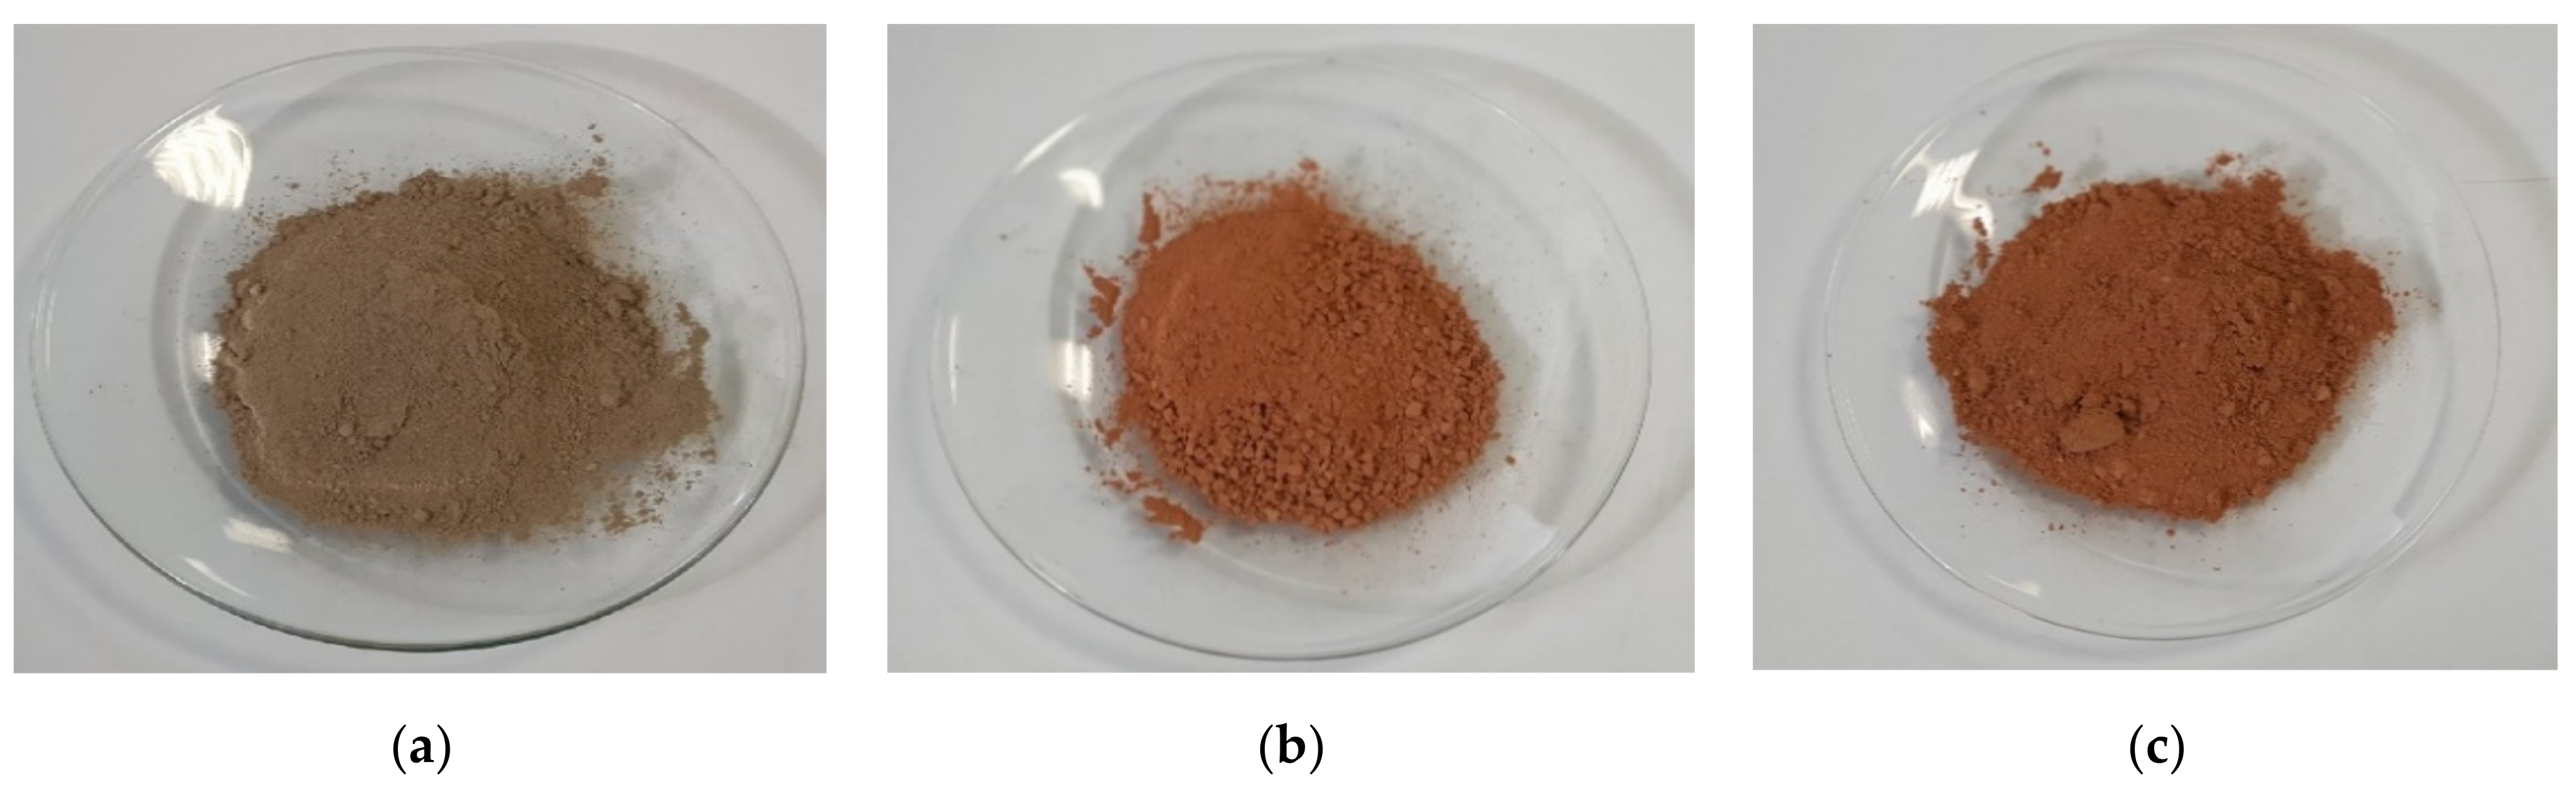
2.5. Optimization of the Thermal Activation/Treatment of Sediment
Characterization of Calcined Sediment
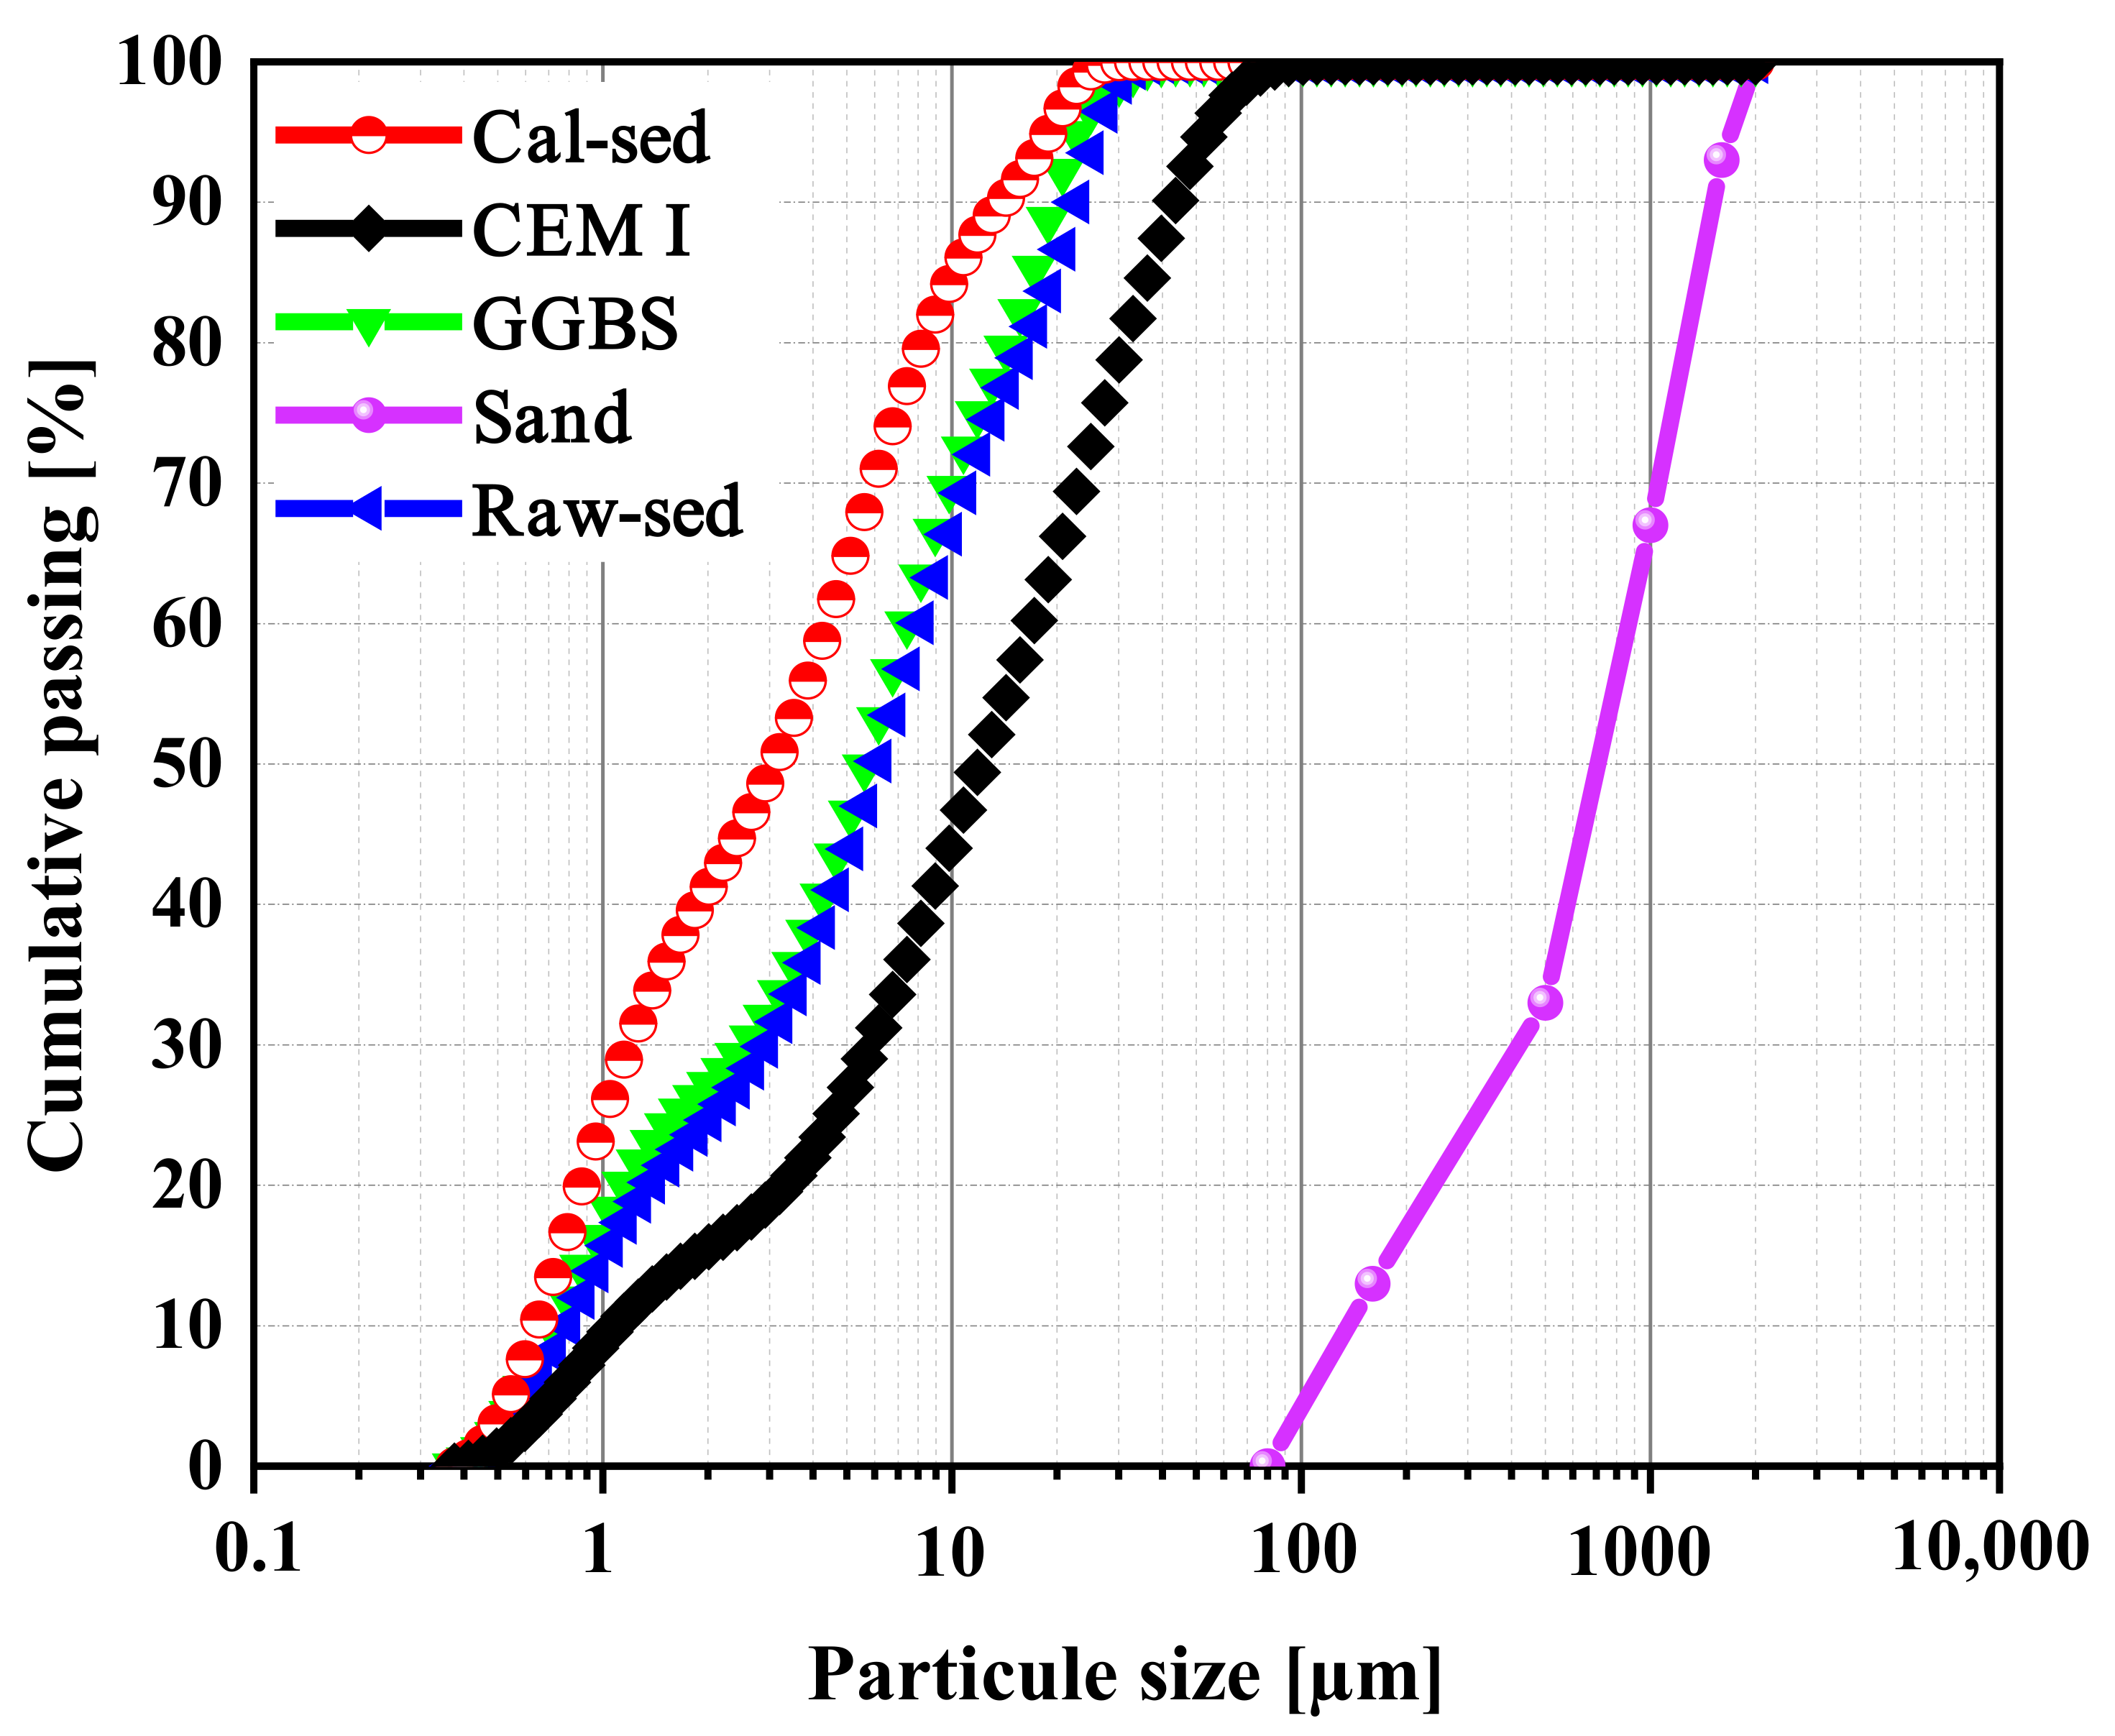
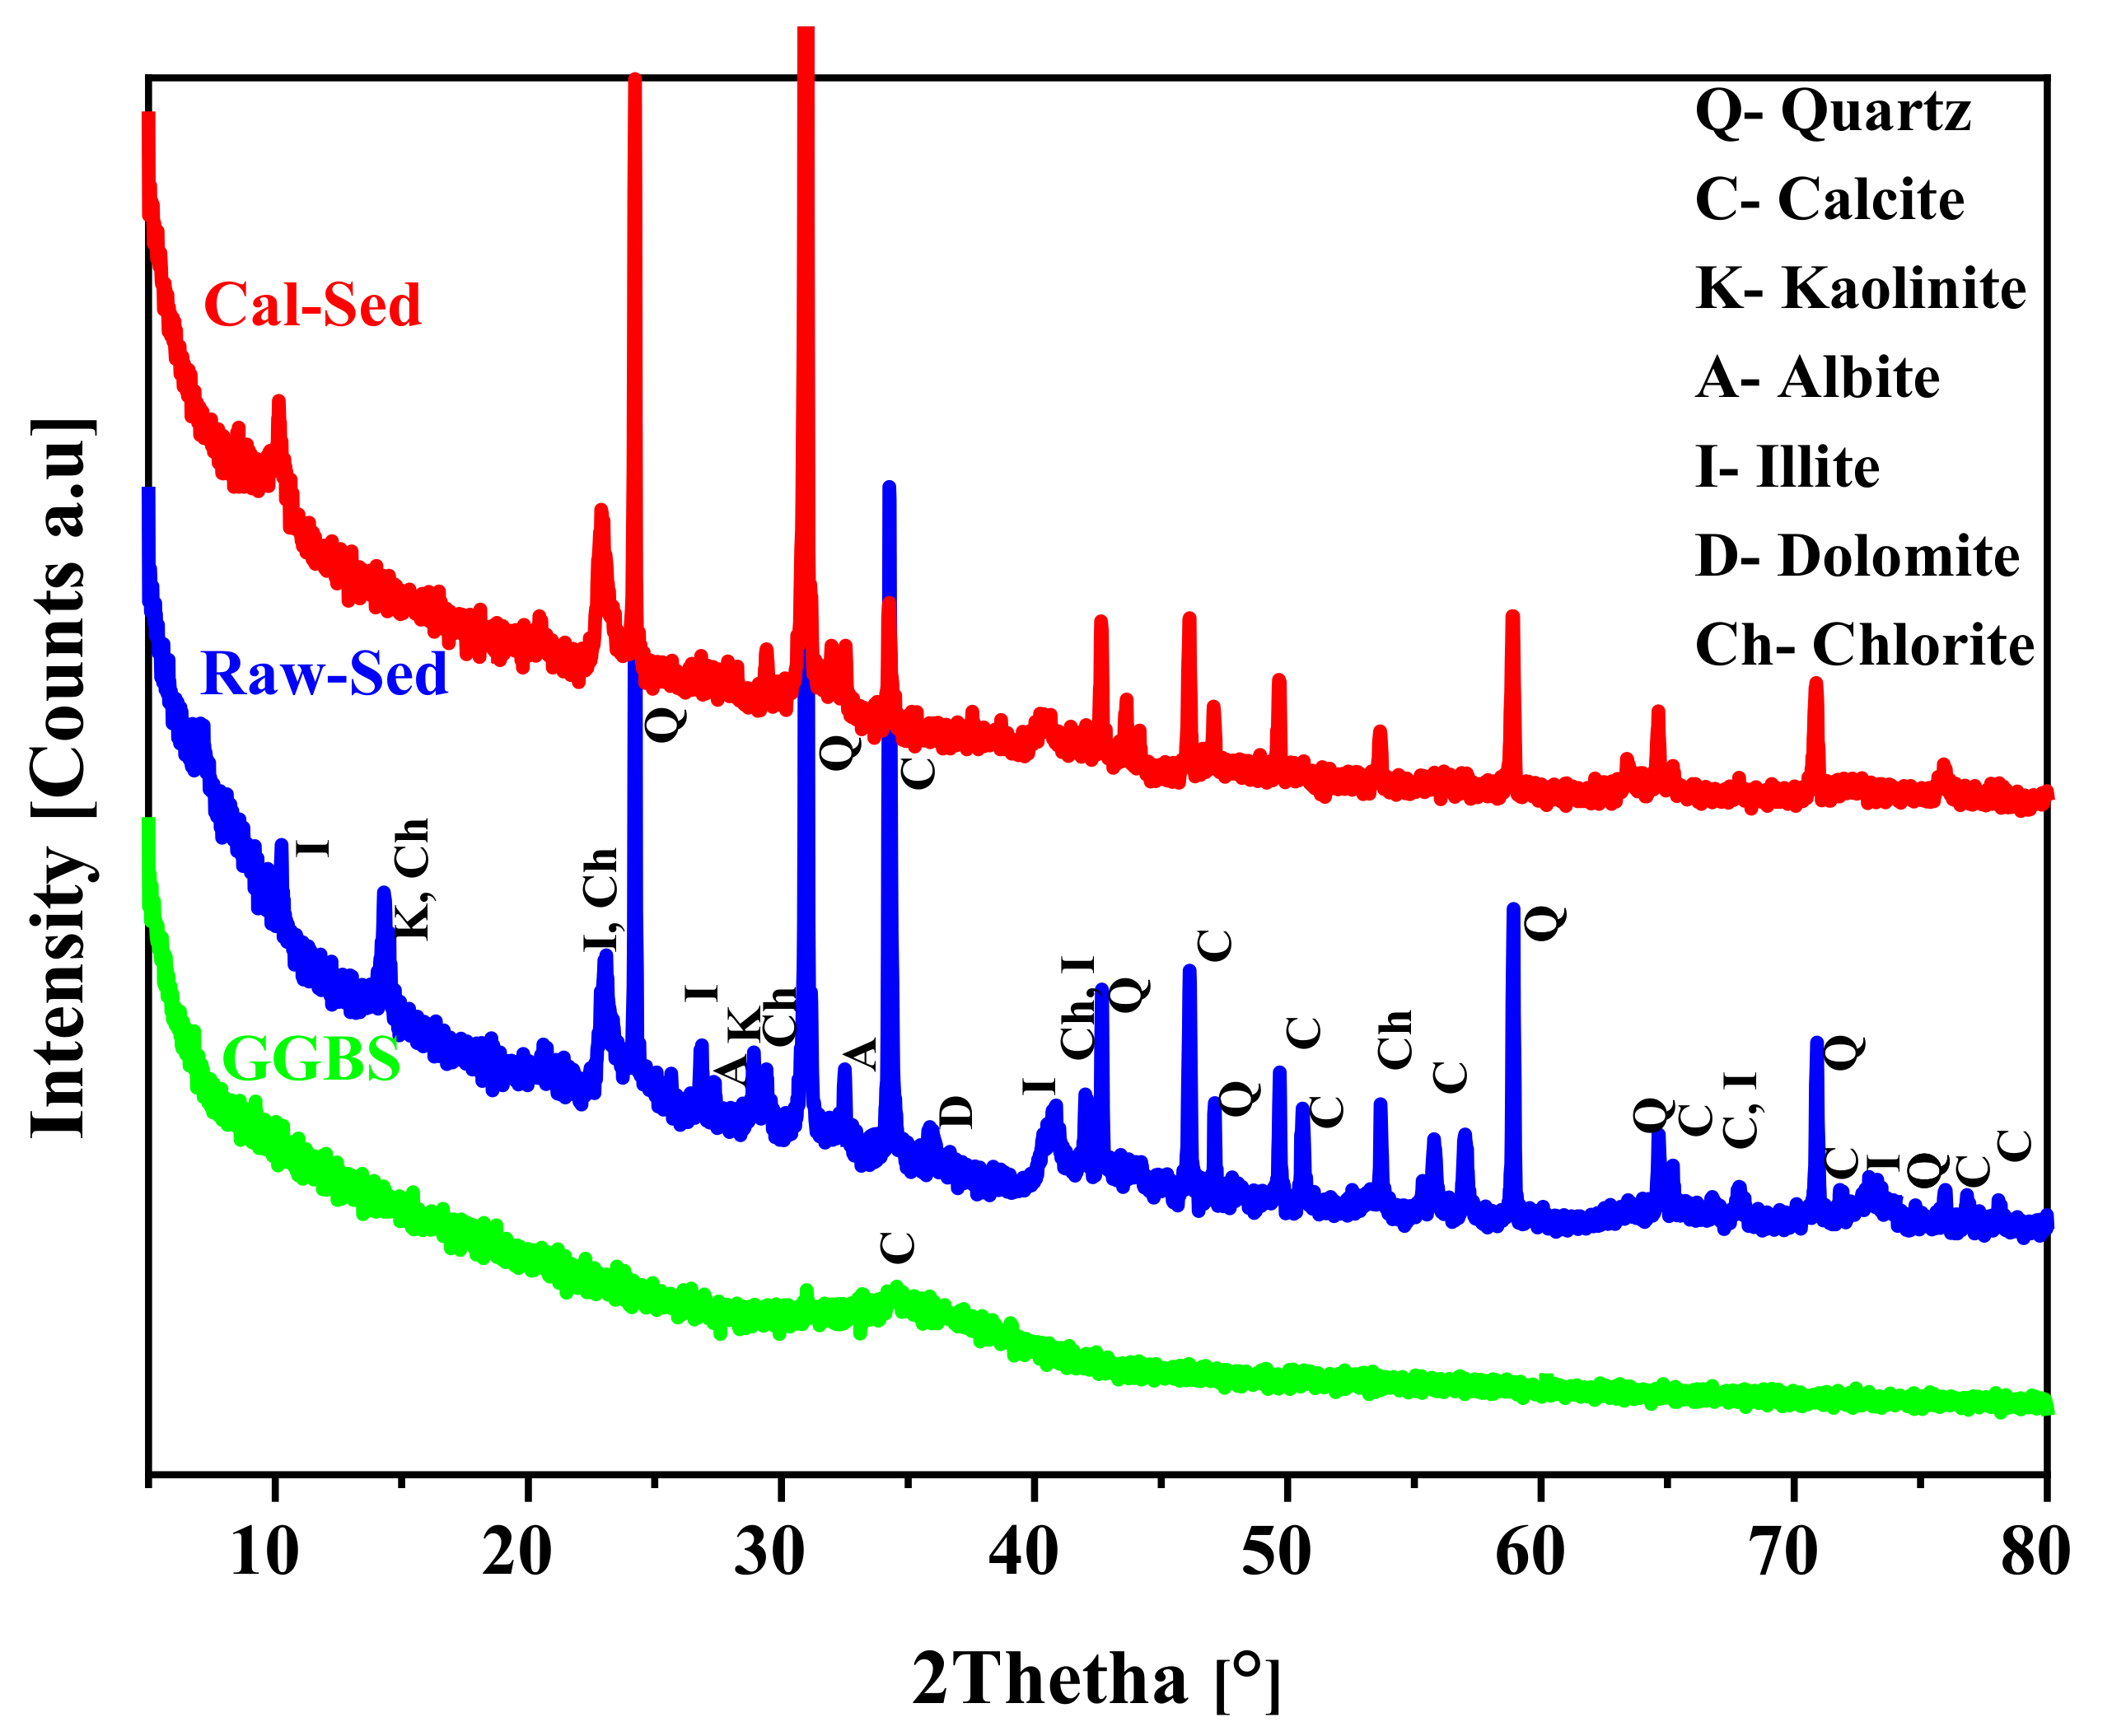
2.6. Chemical and Mineralogical Composition of Raw Sediment and Supplementary Material
2.7. Leaching Tests
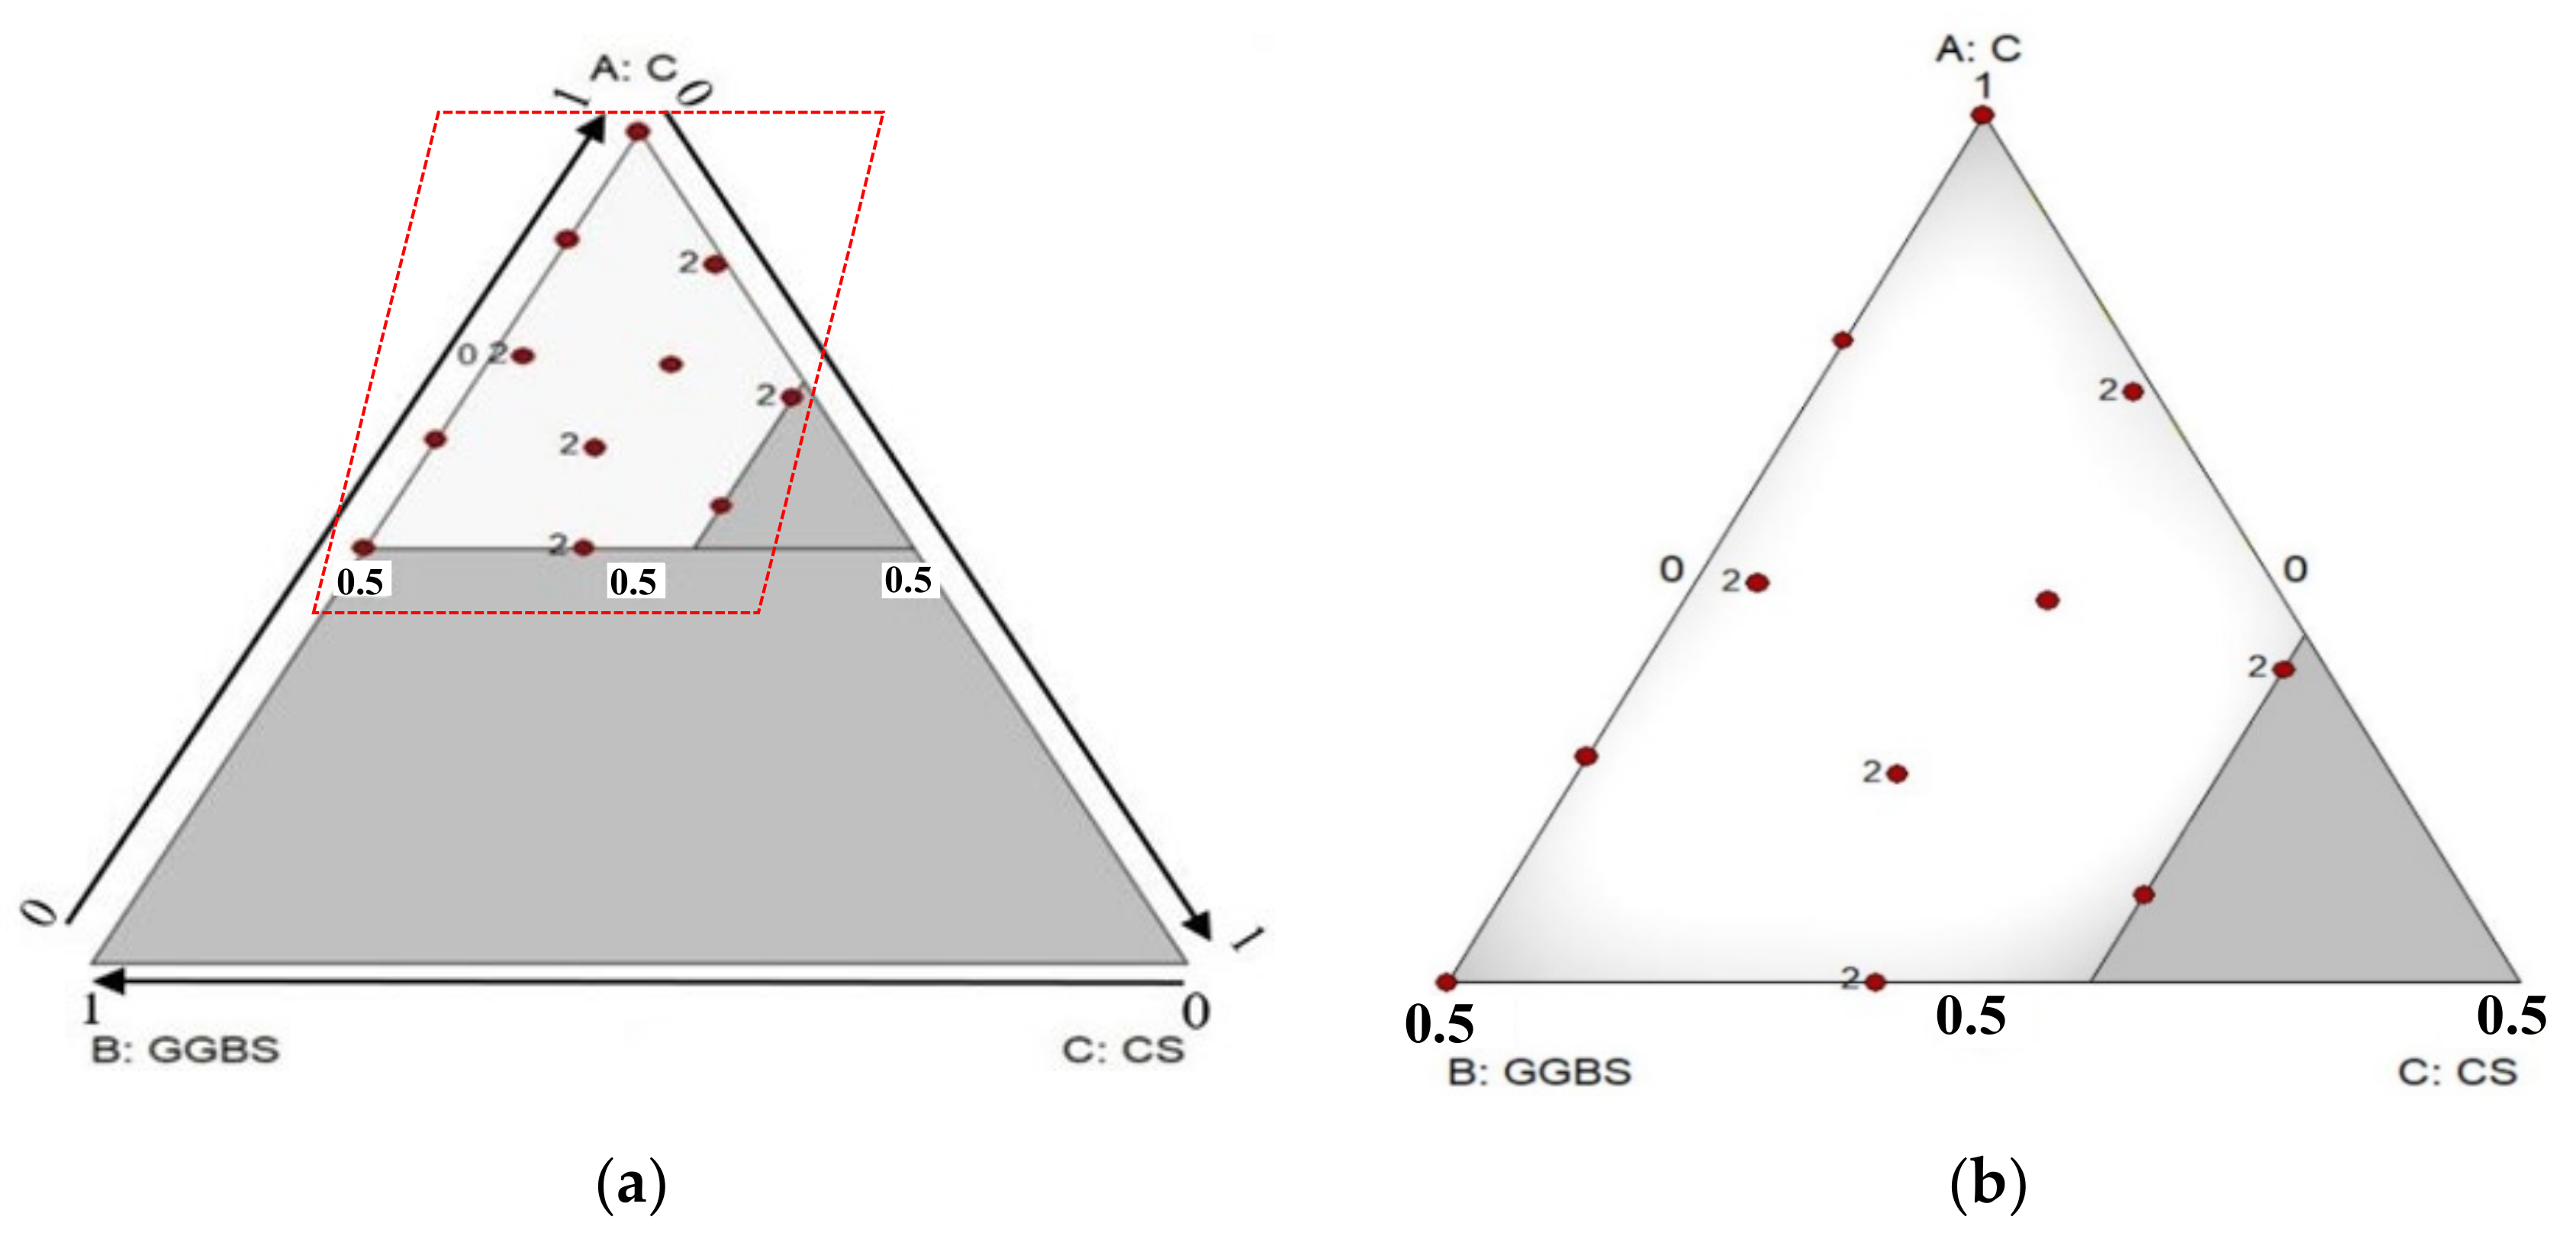
2.8. Mix Design
2.9. Testing Protocol
2.9.1. Specimen Sizes
2.9.2. Fresh Mortar Consistency
2.9.3. Setting Times
2.9.4. Soundness
2.9.5. Mechanical Strength
2.9.6. Mercury Intrusion Porosimetry (MIP)
2.9.7. Portlandite Quantification
(74 g/mol) (56 g/mol) (18 g/mol)
2.9.8. Scanning Electron Microscopy (SEM)
3. Results and Discussion
3.1. Validation of Predicted Models
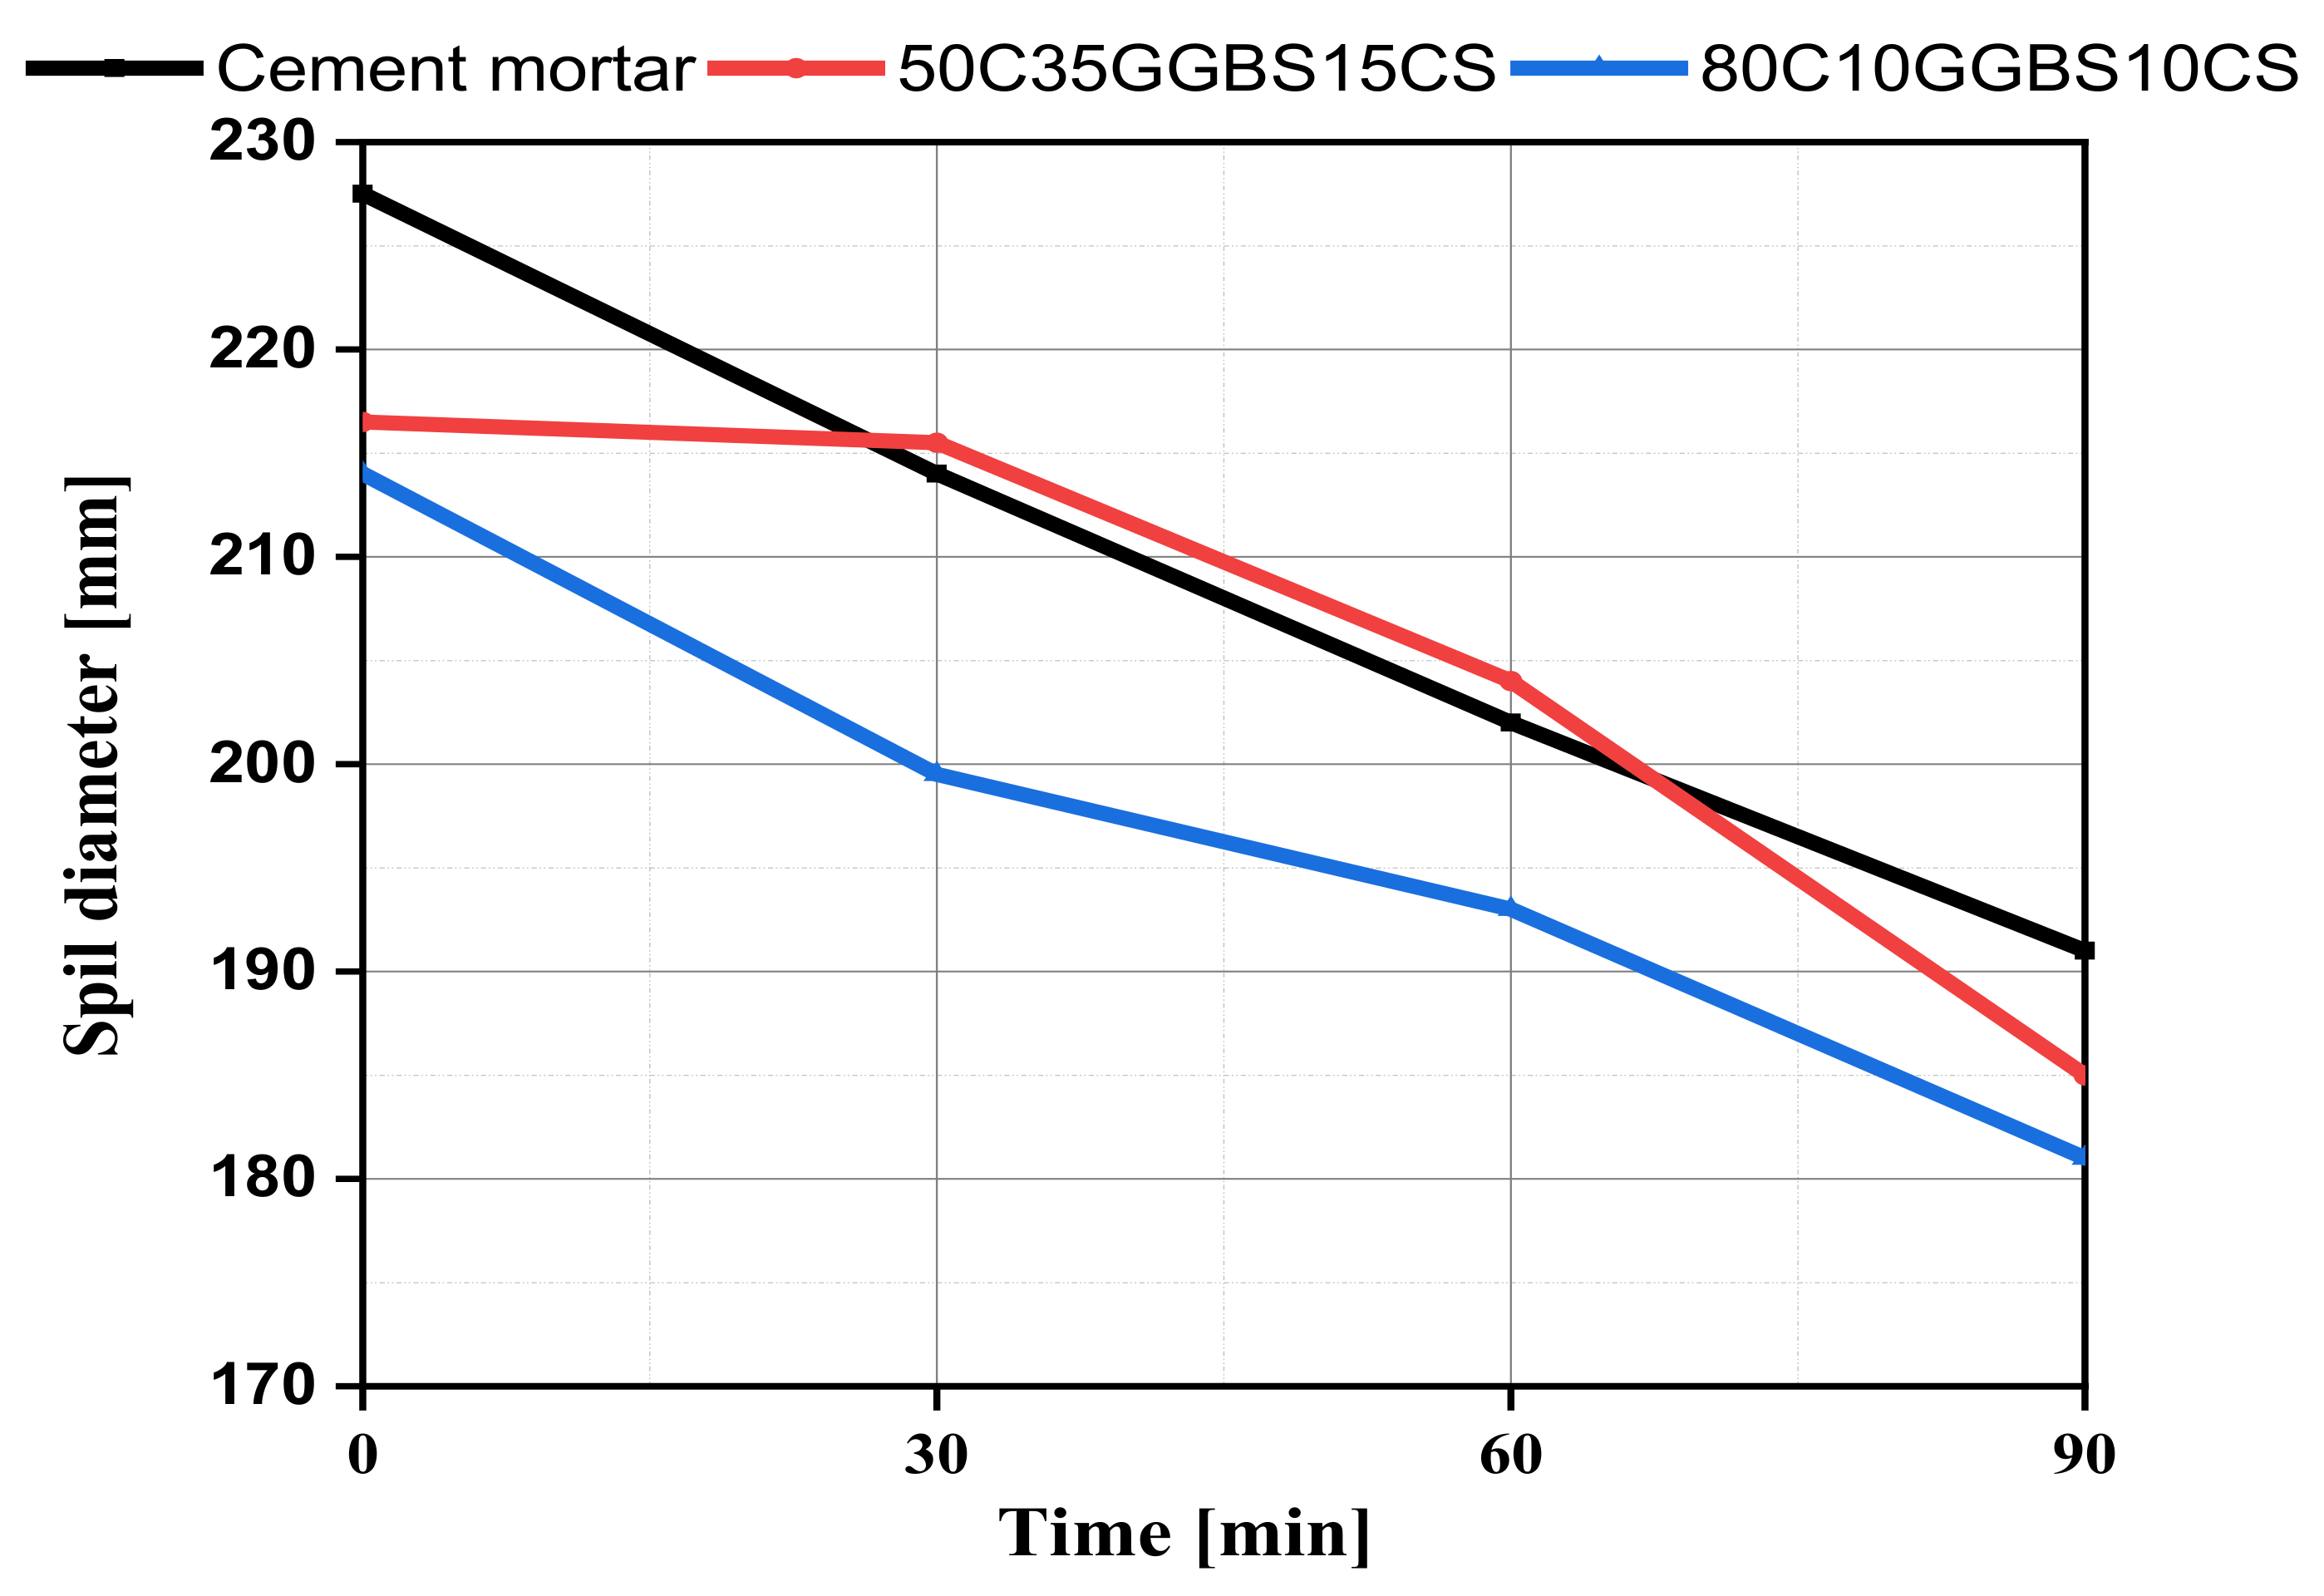
3.2. Fresh Mortar Consistency
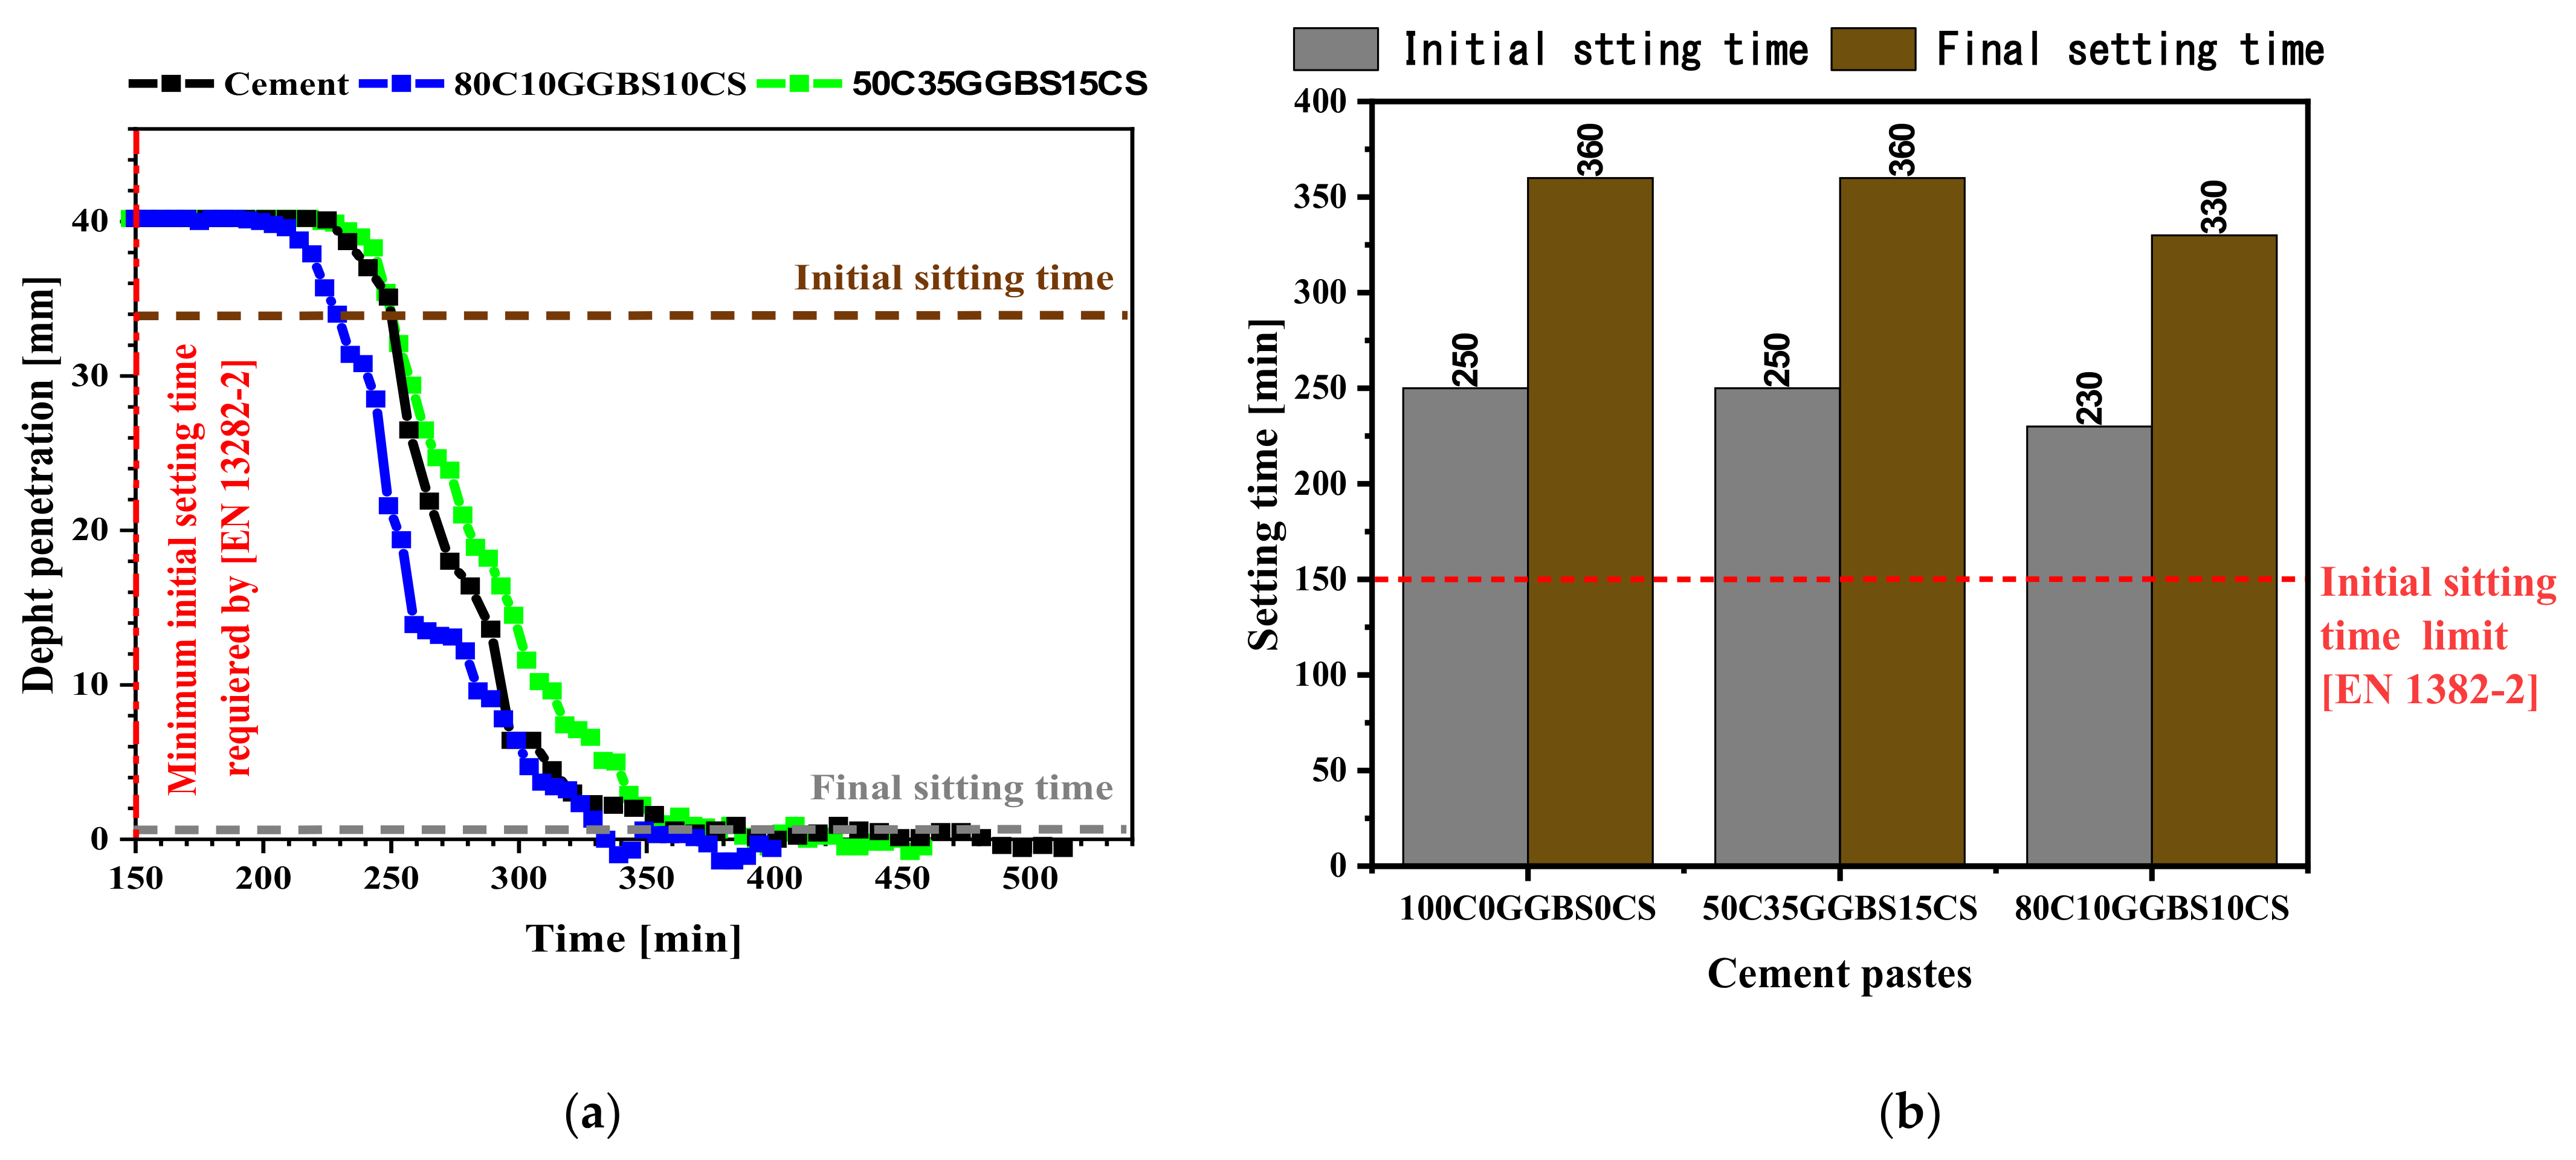
3.3. Initial and Final Setting Times
3.4. Fineness and SO3 Contents
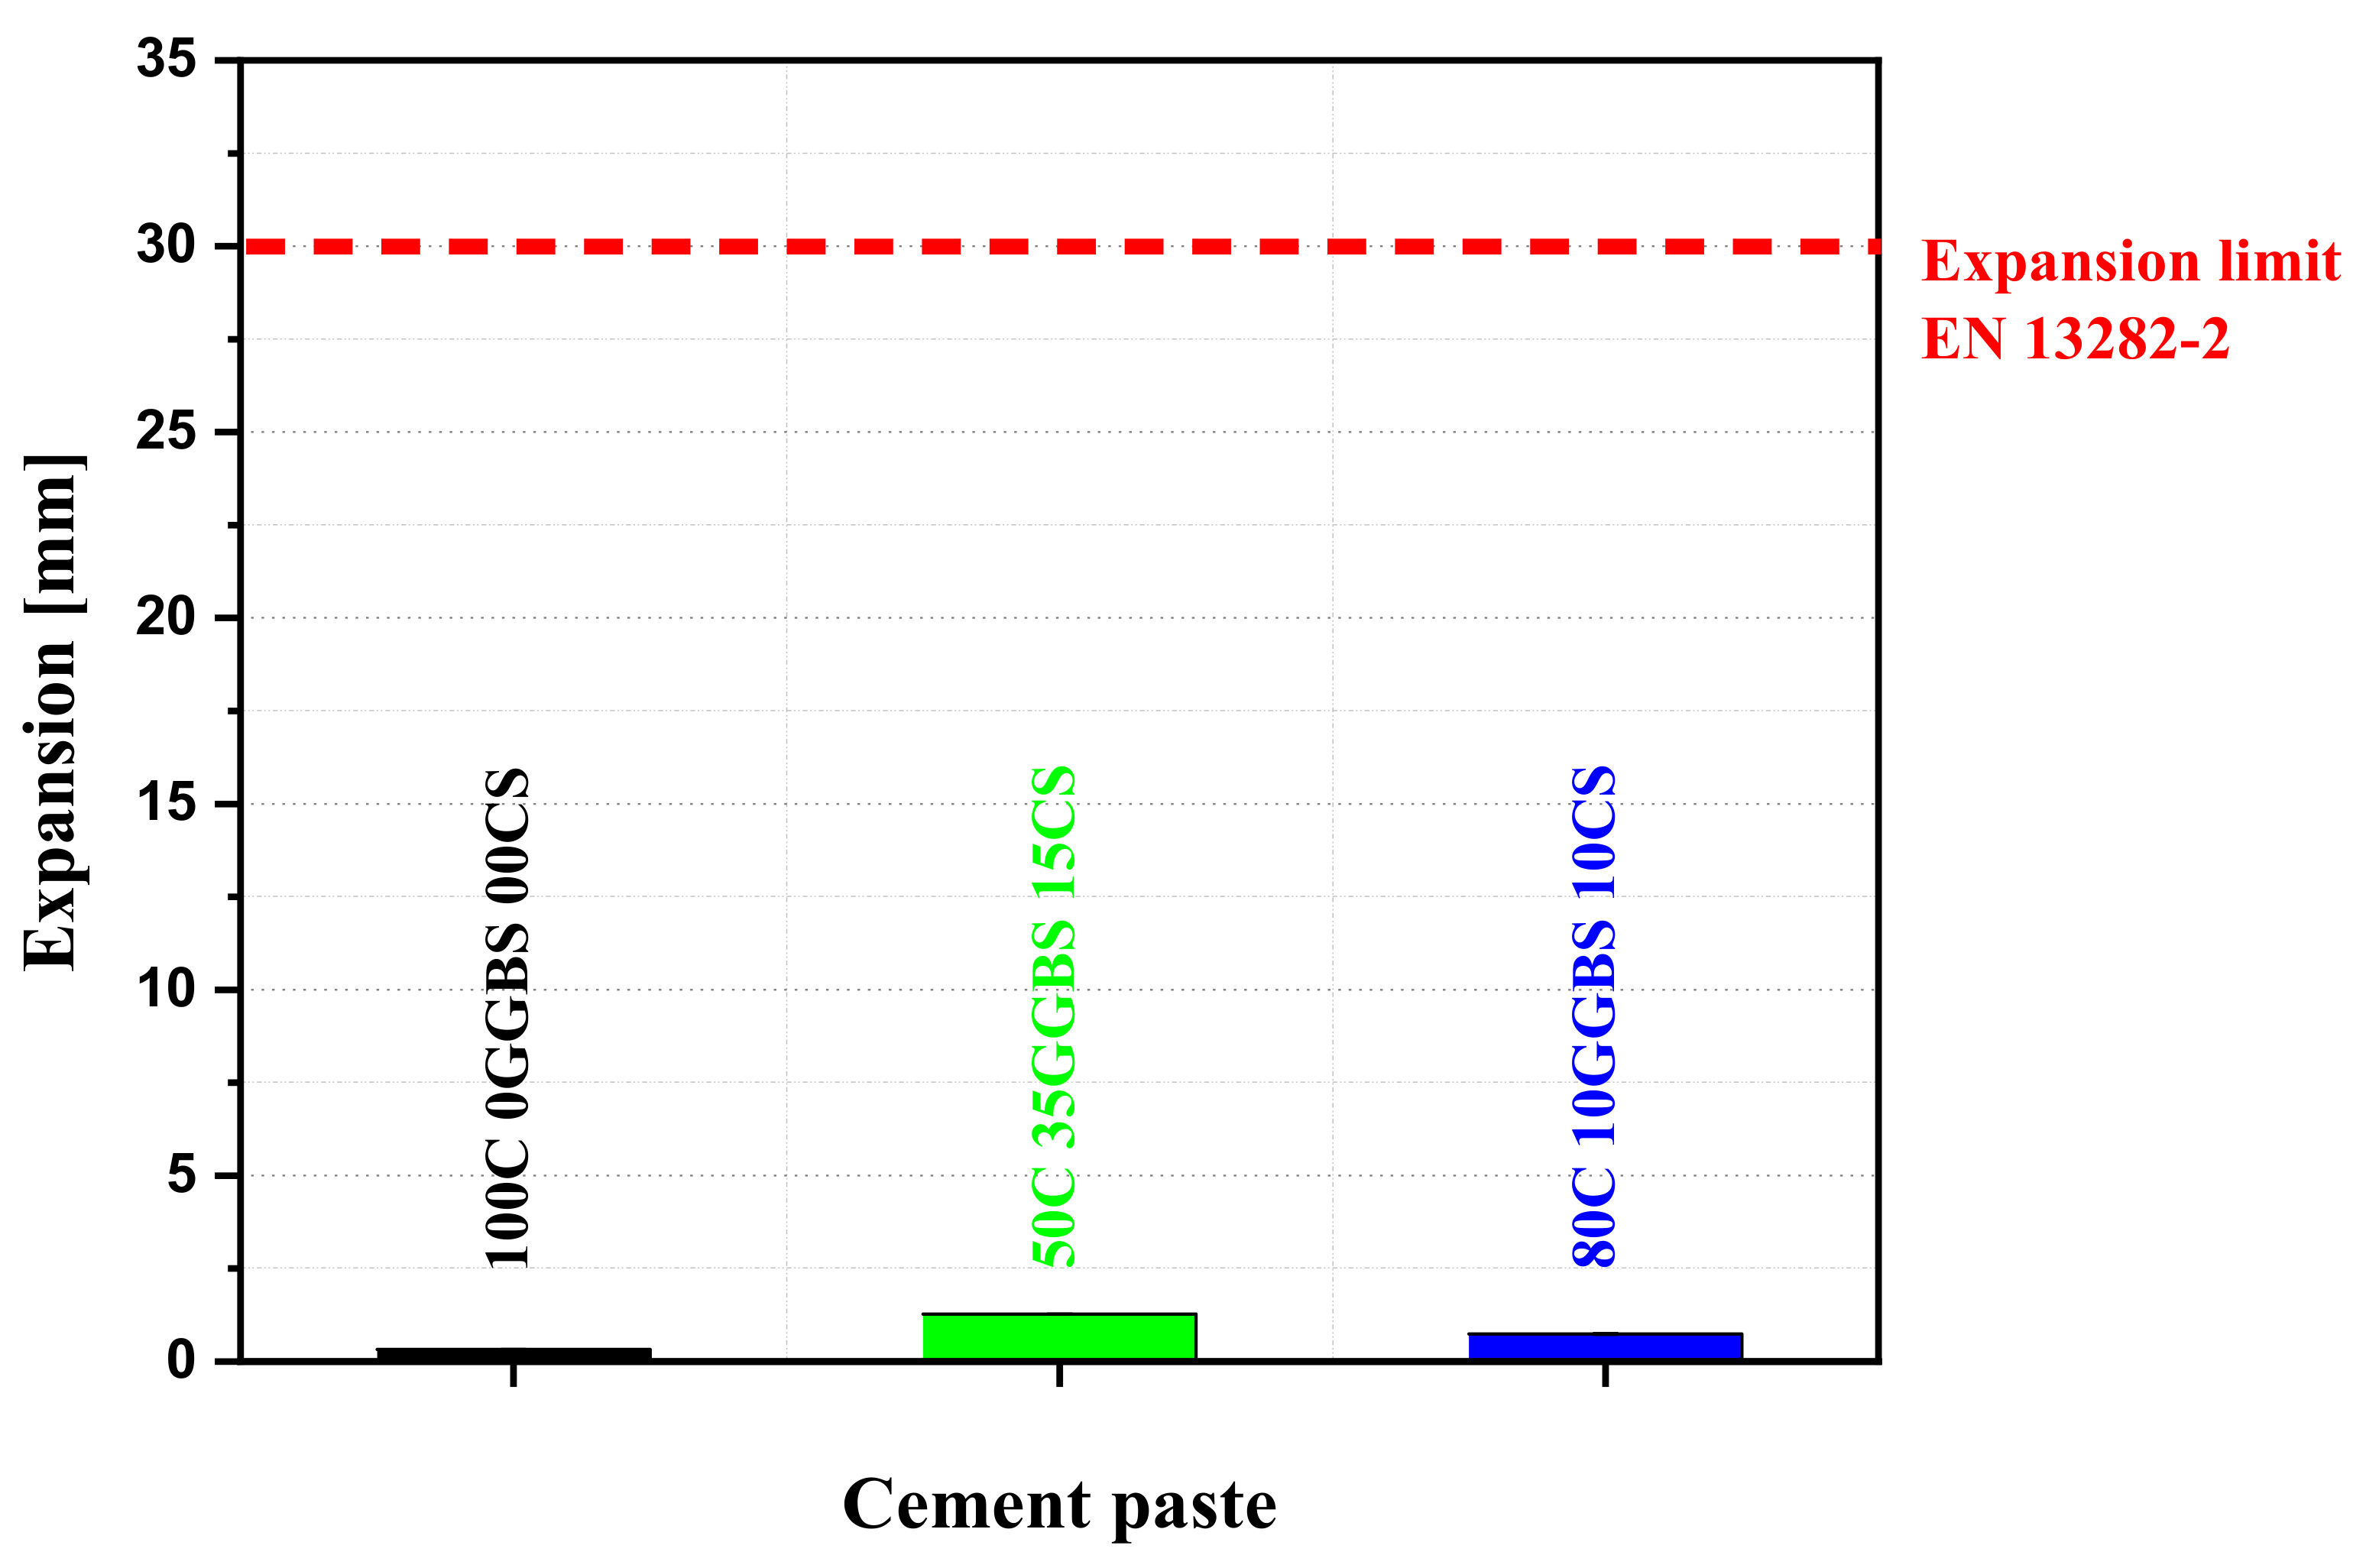
3.5. Binder Expansion
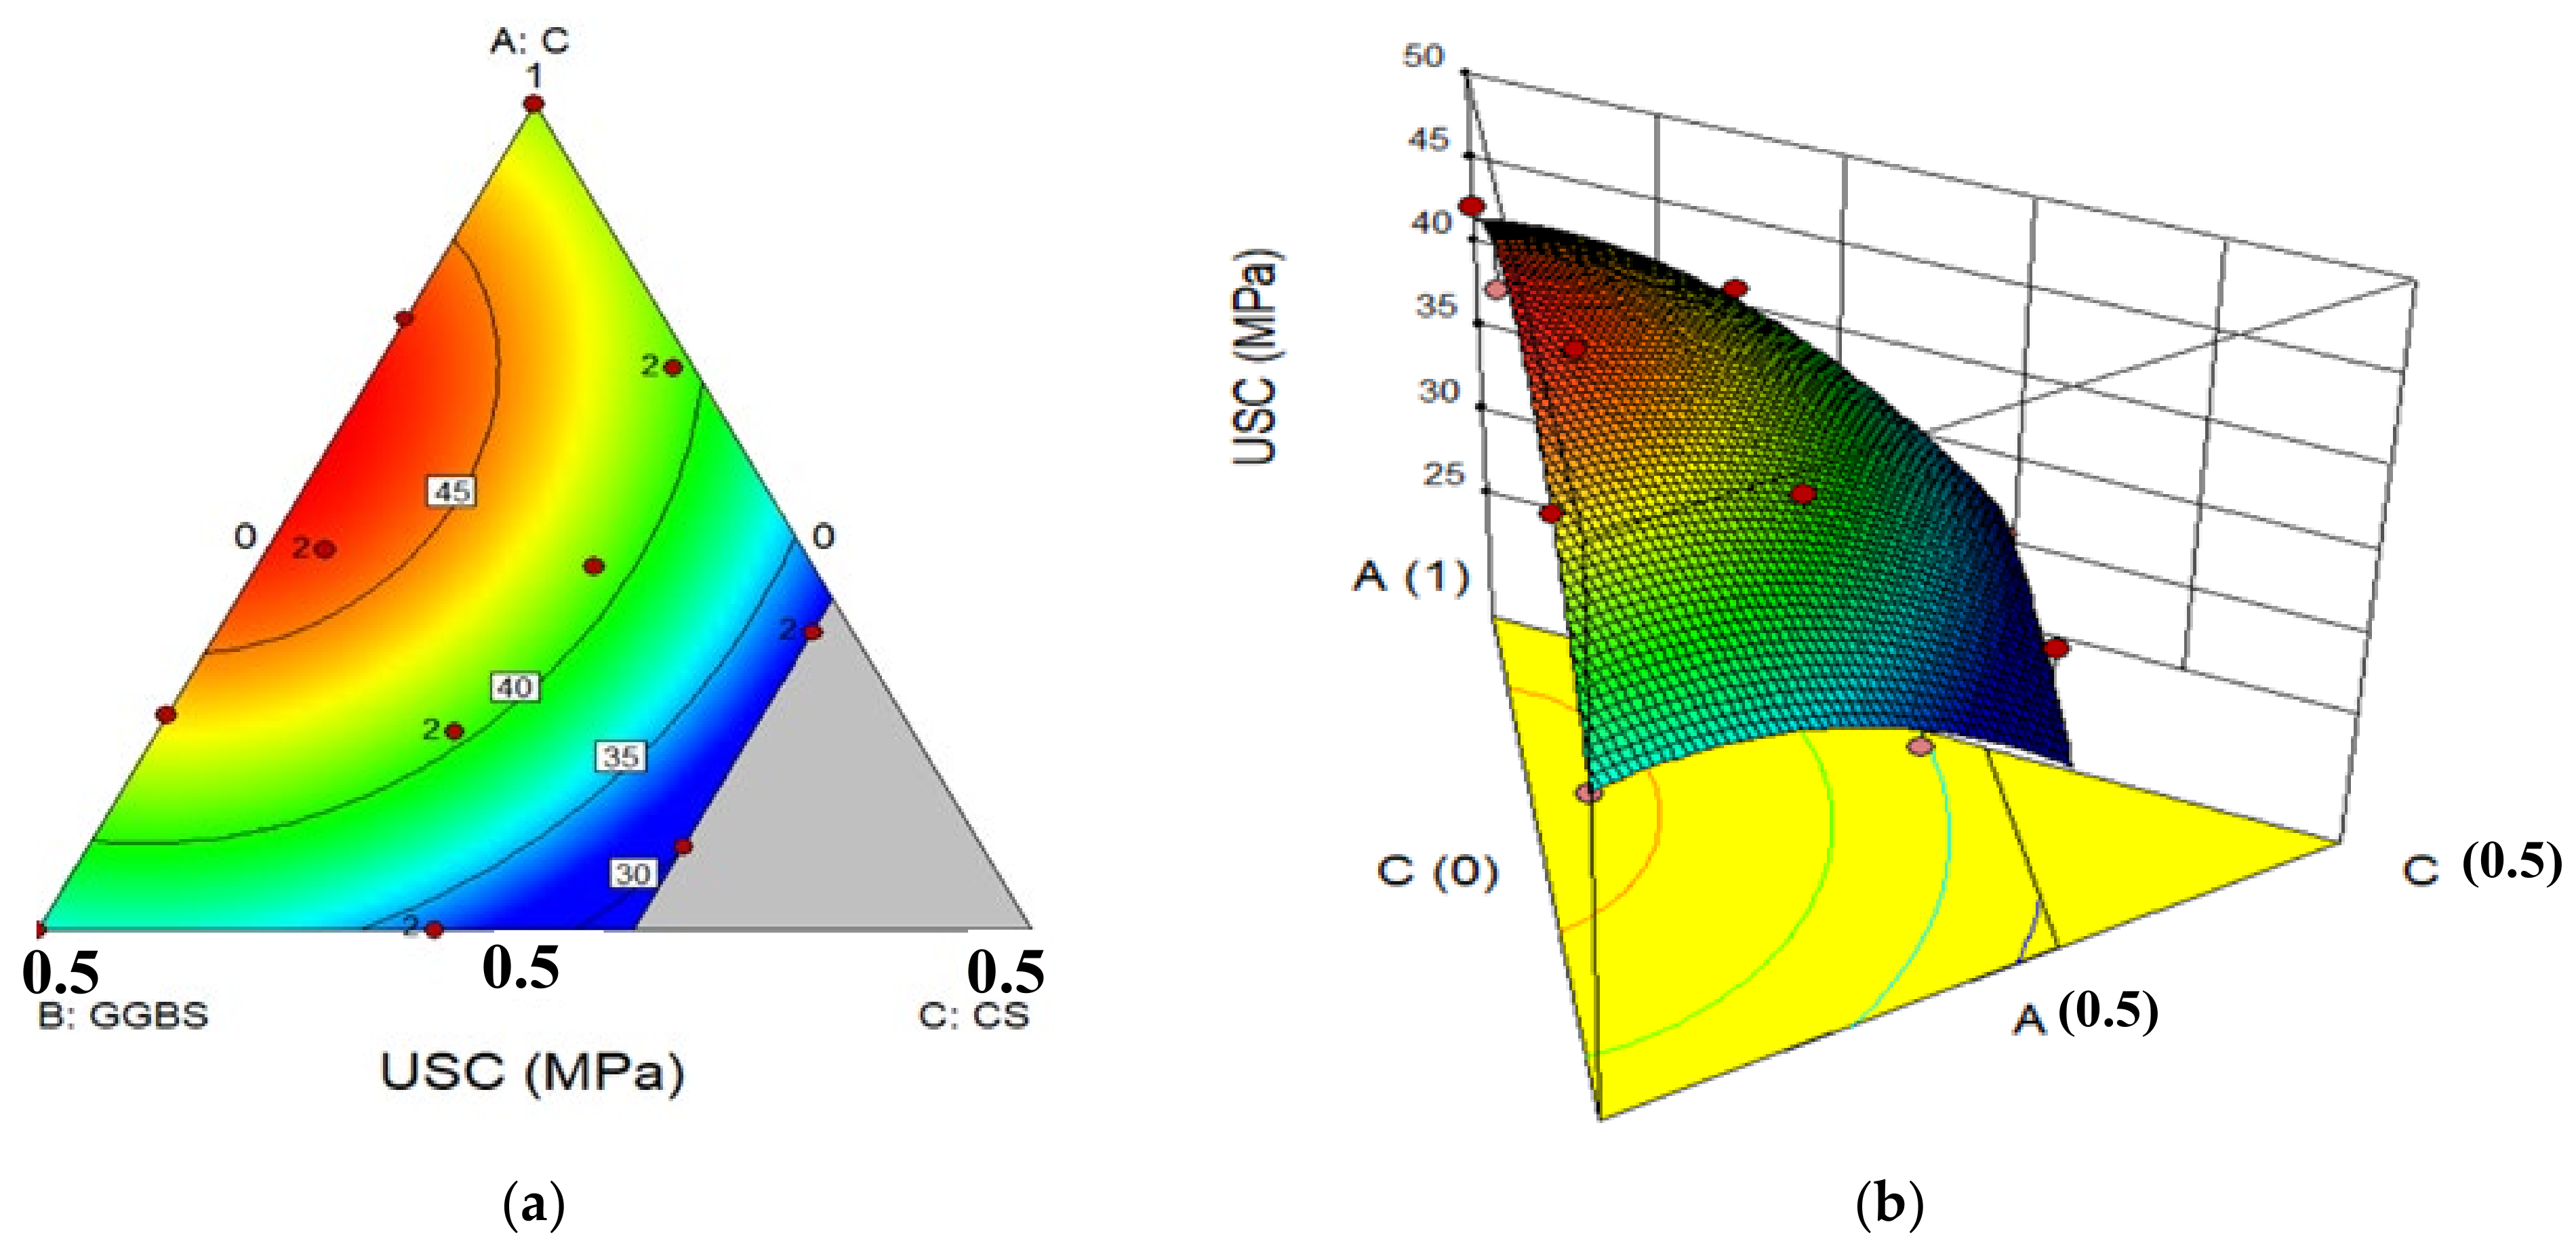
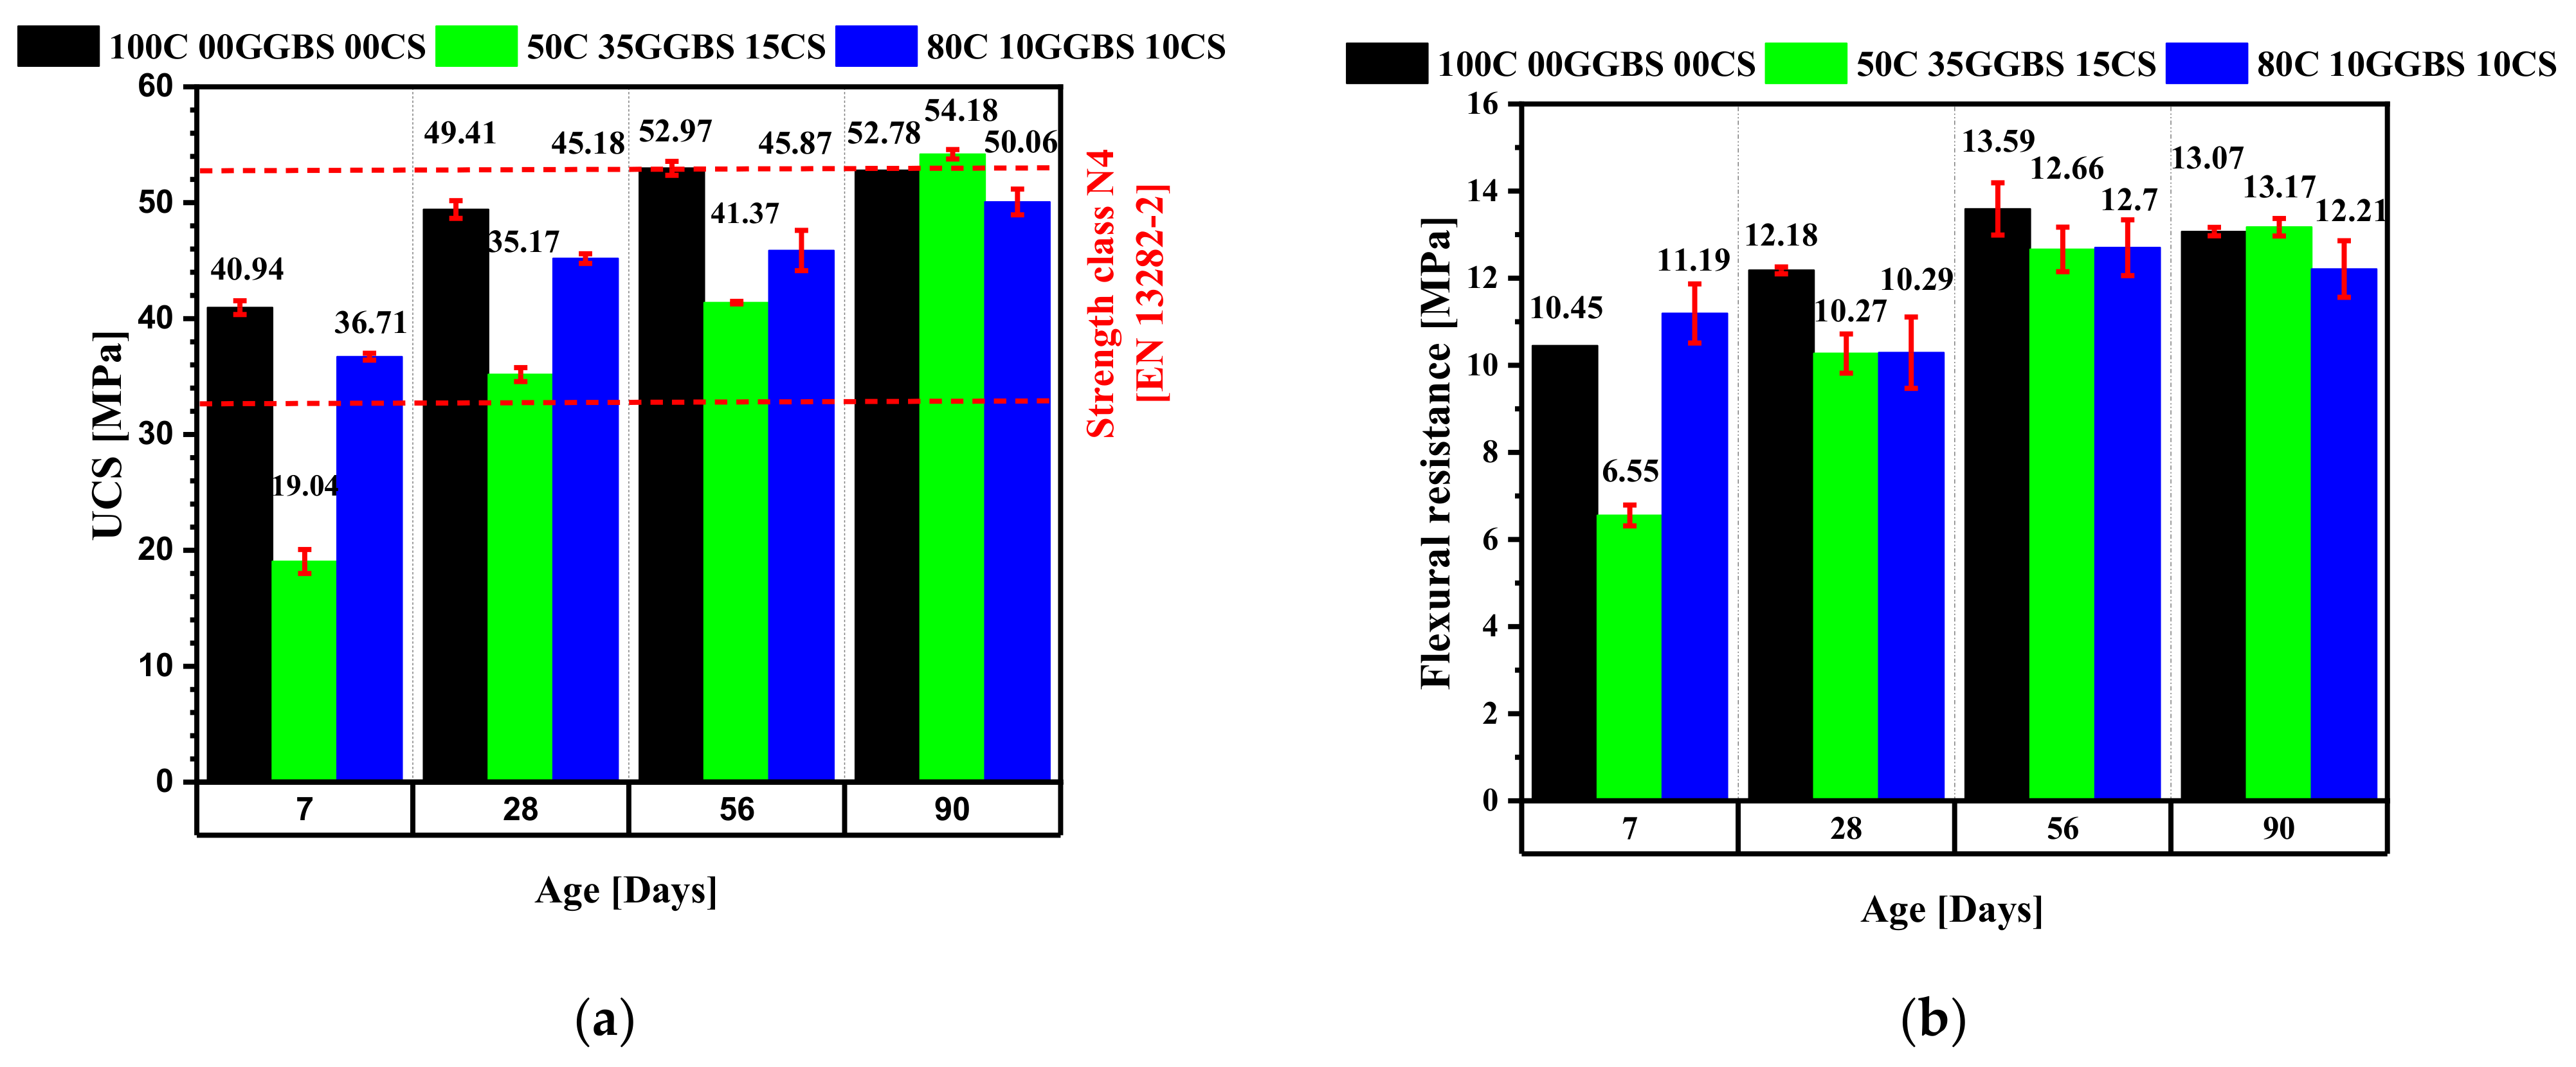
3.6. Compressive and Flexural Strengths
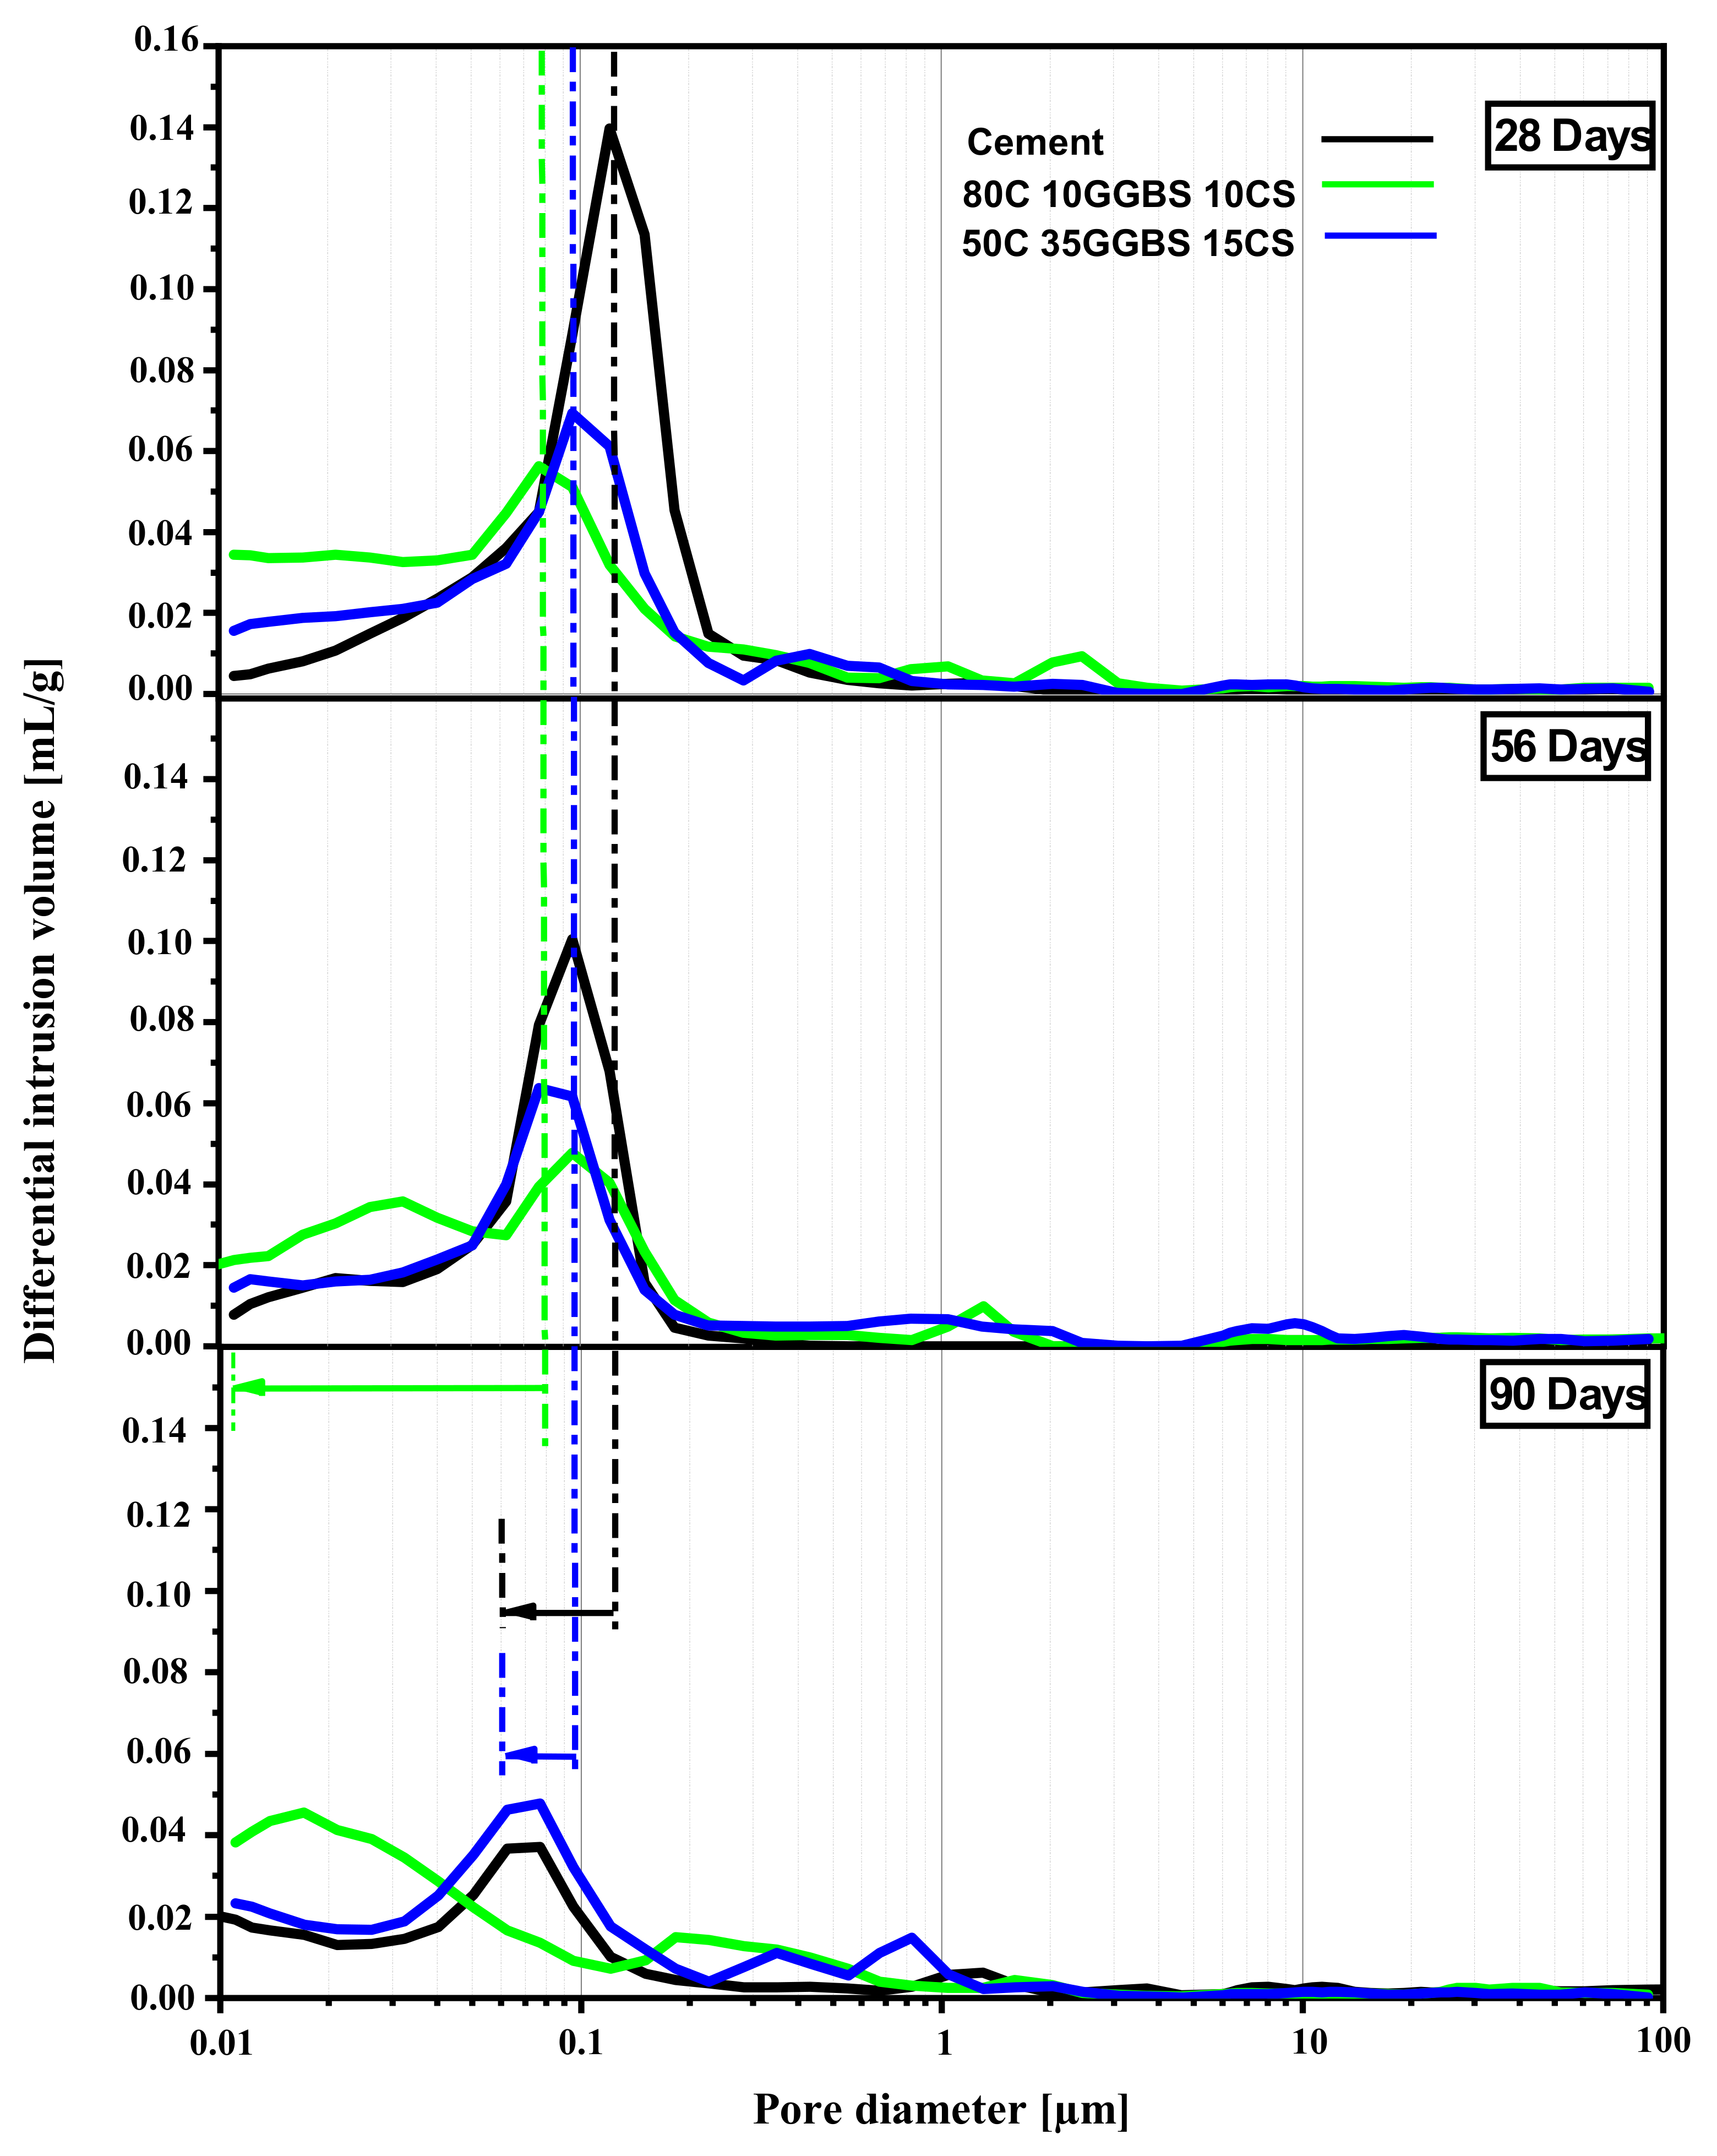
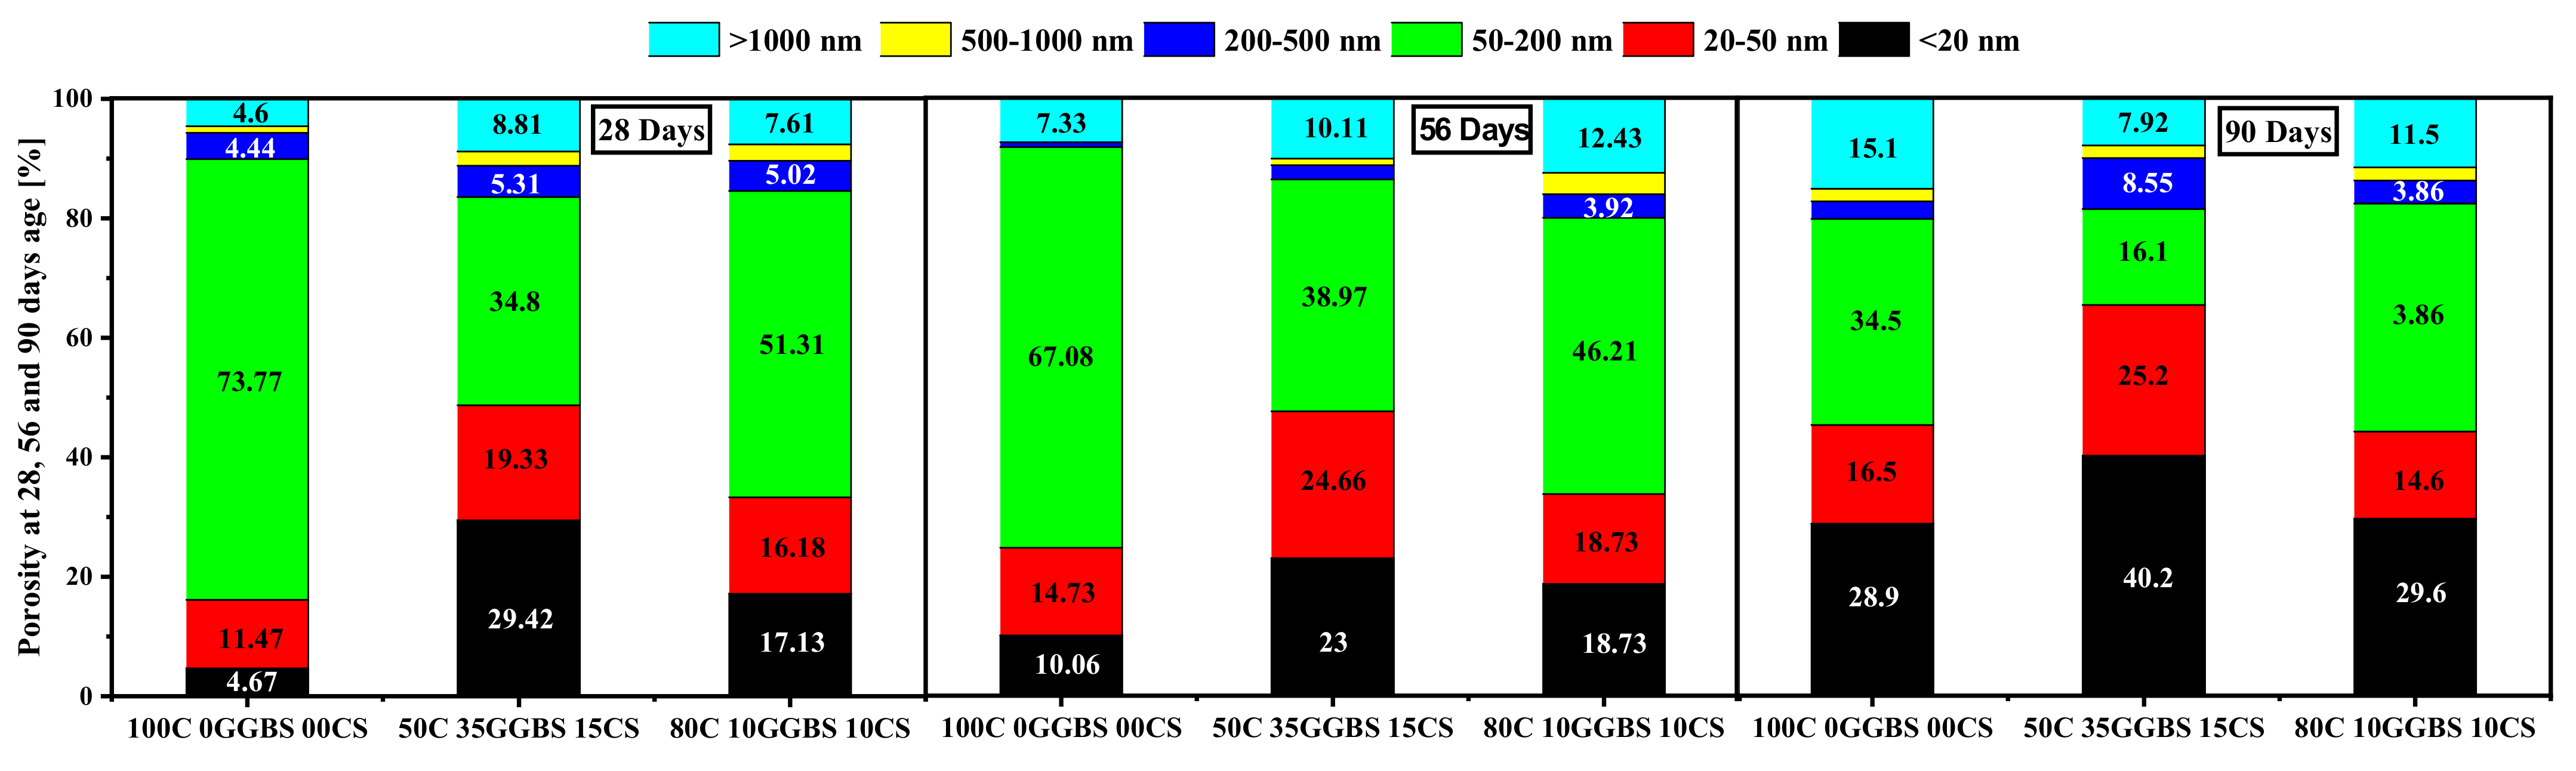
3.7. Mercury Intrusion Porosity (MIP)
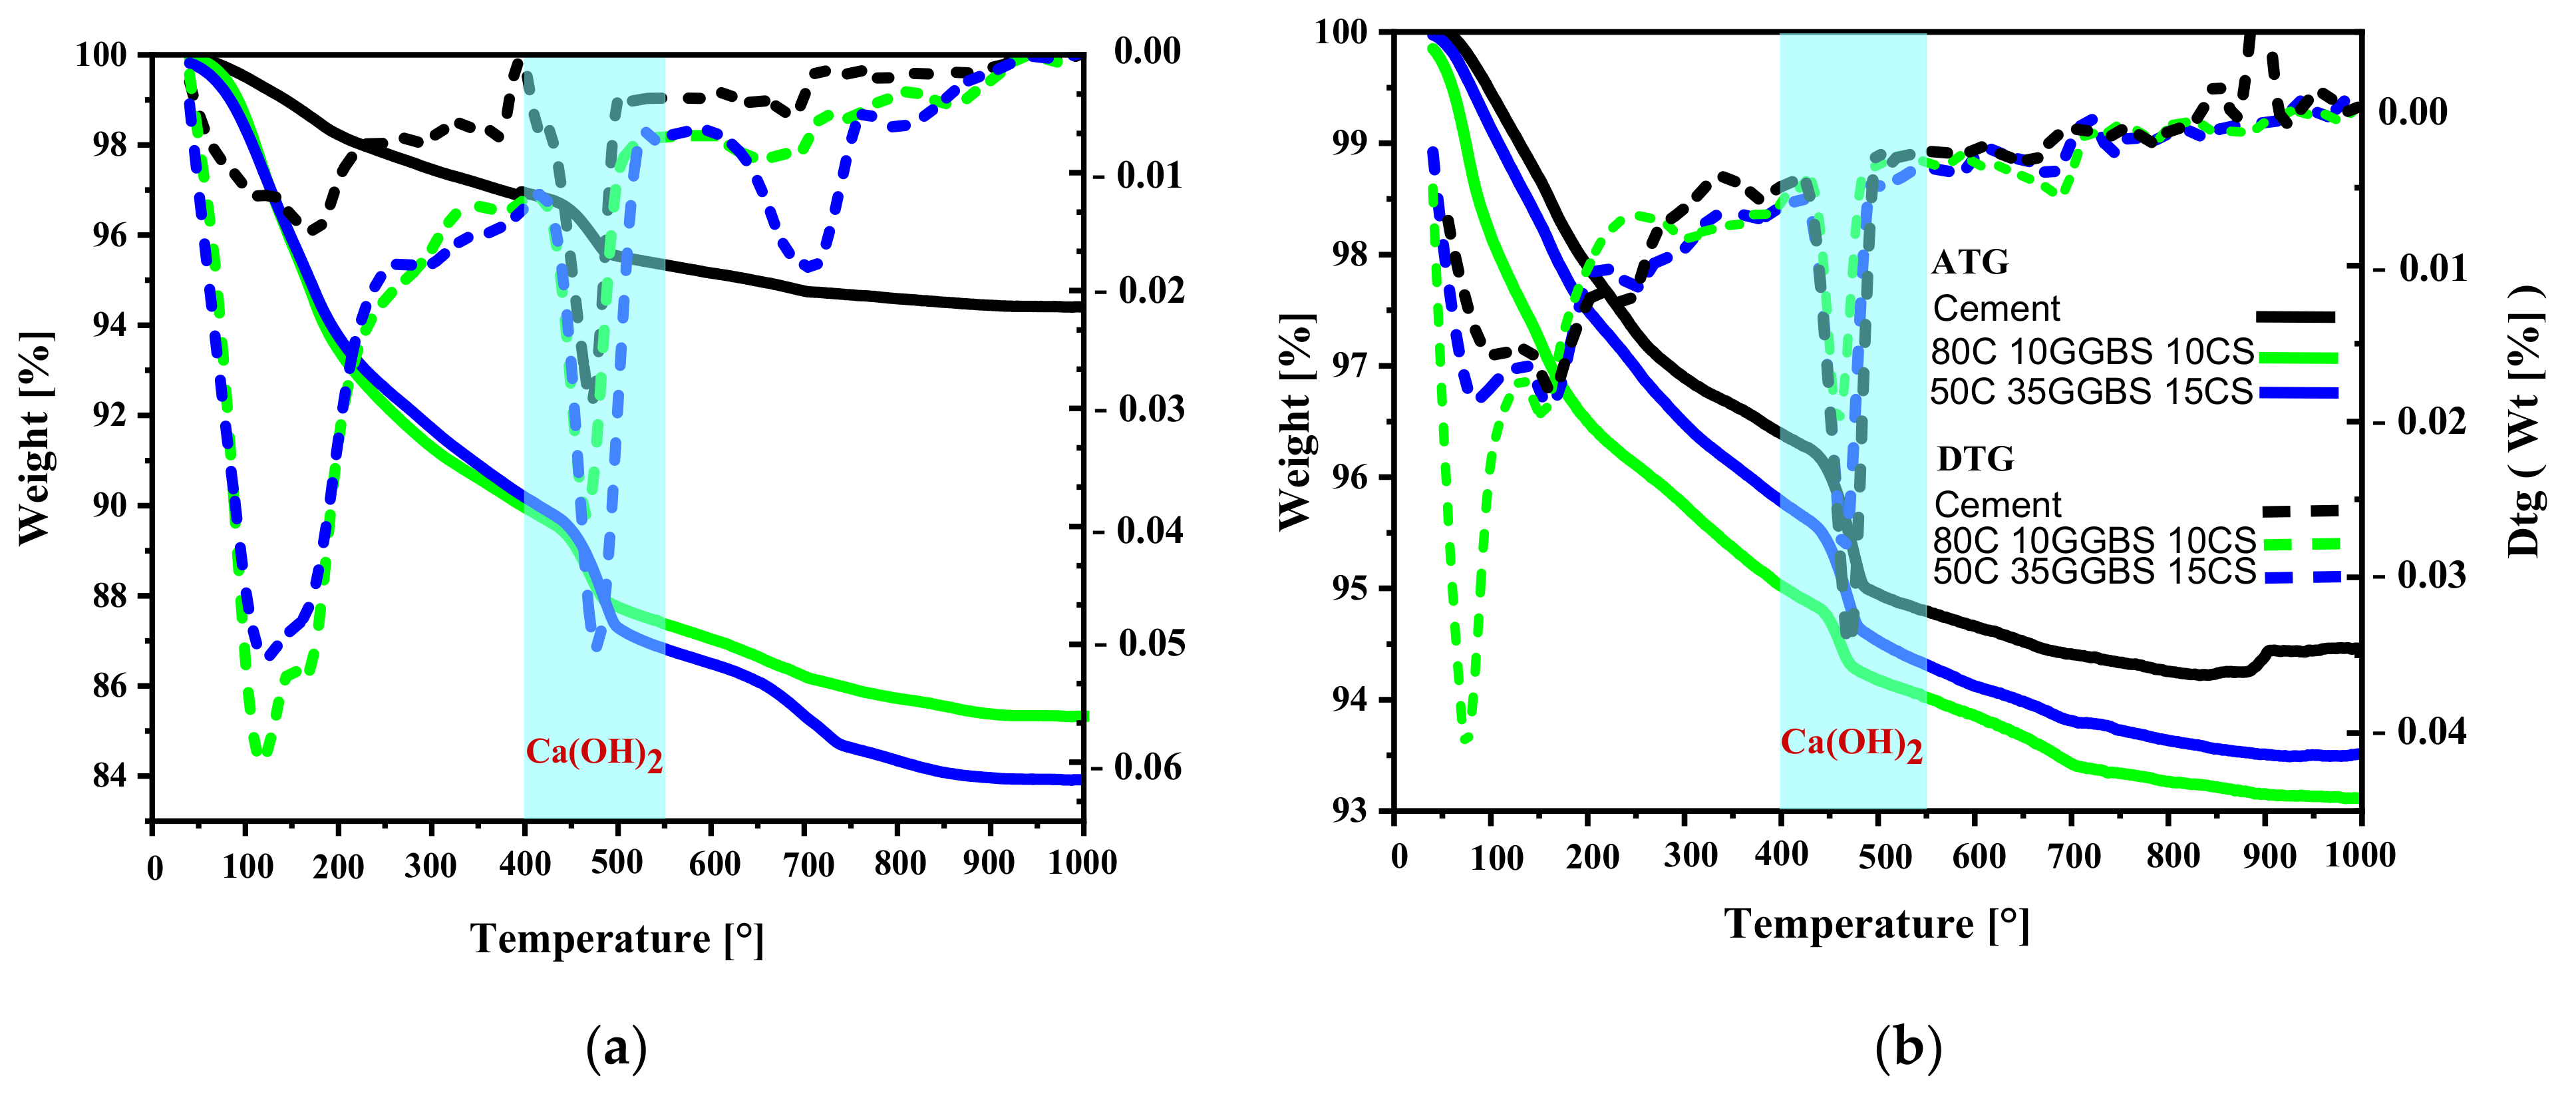
3.8. TG Quantification of Calcium Hydroxides
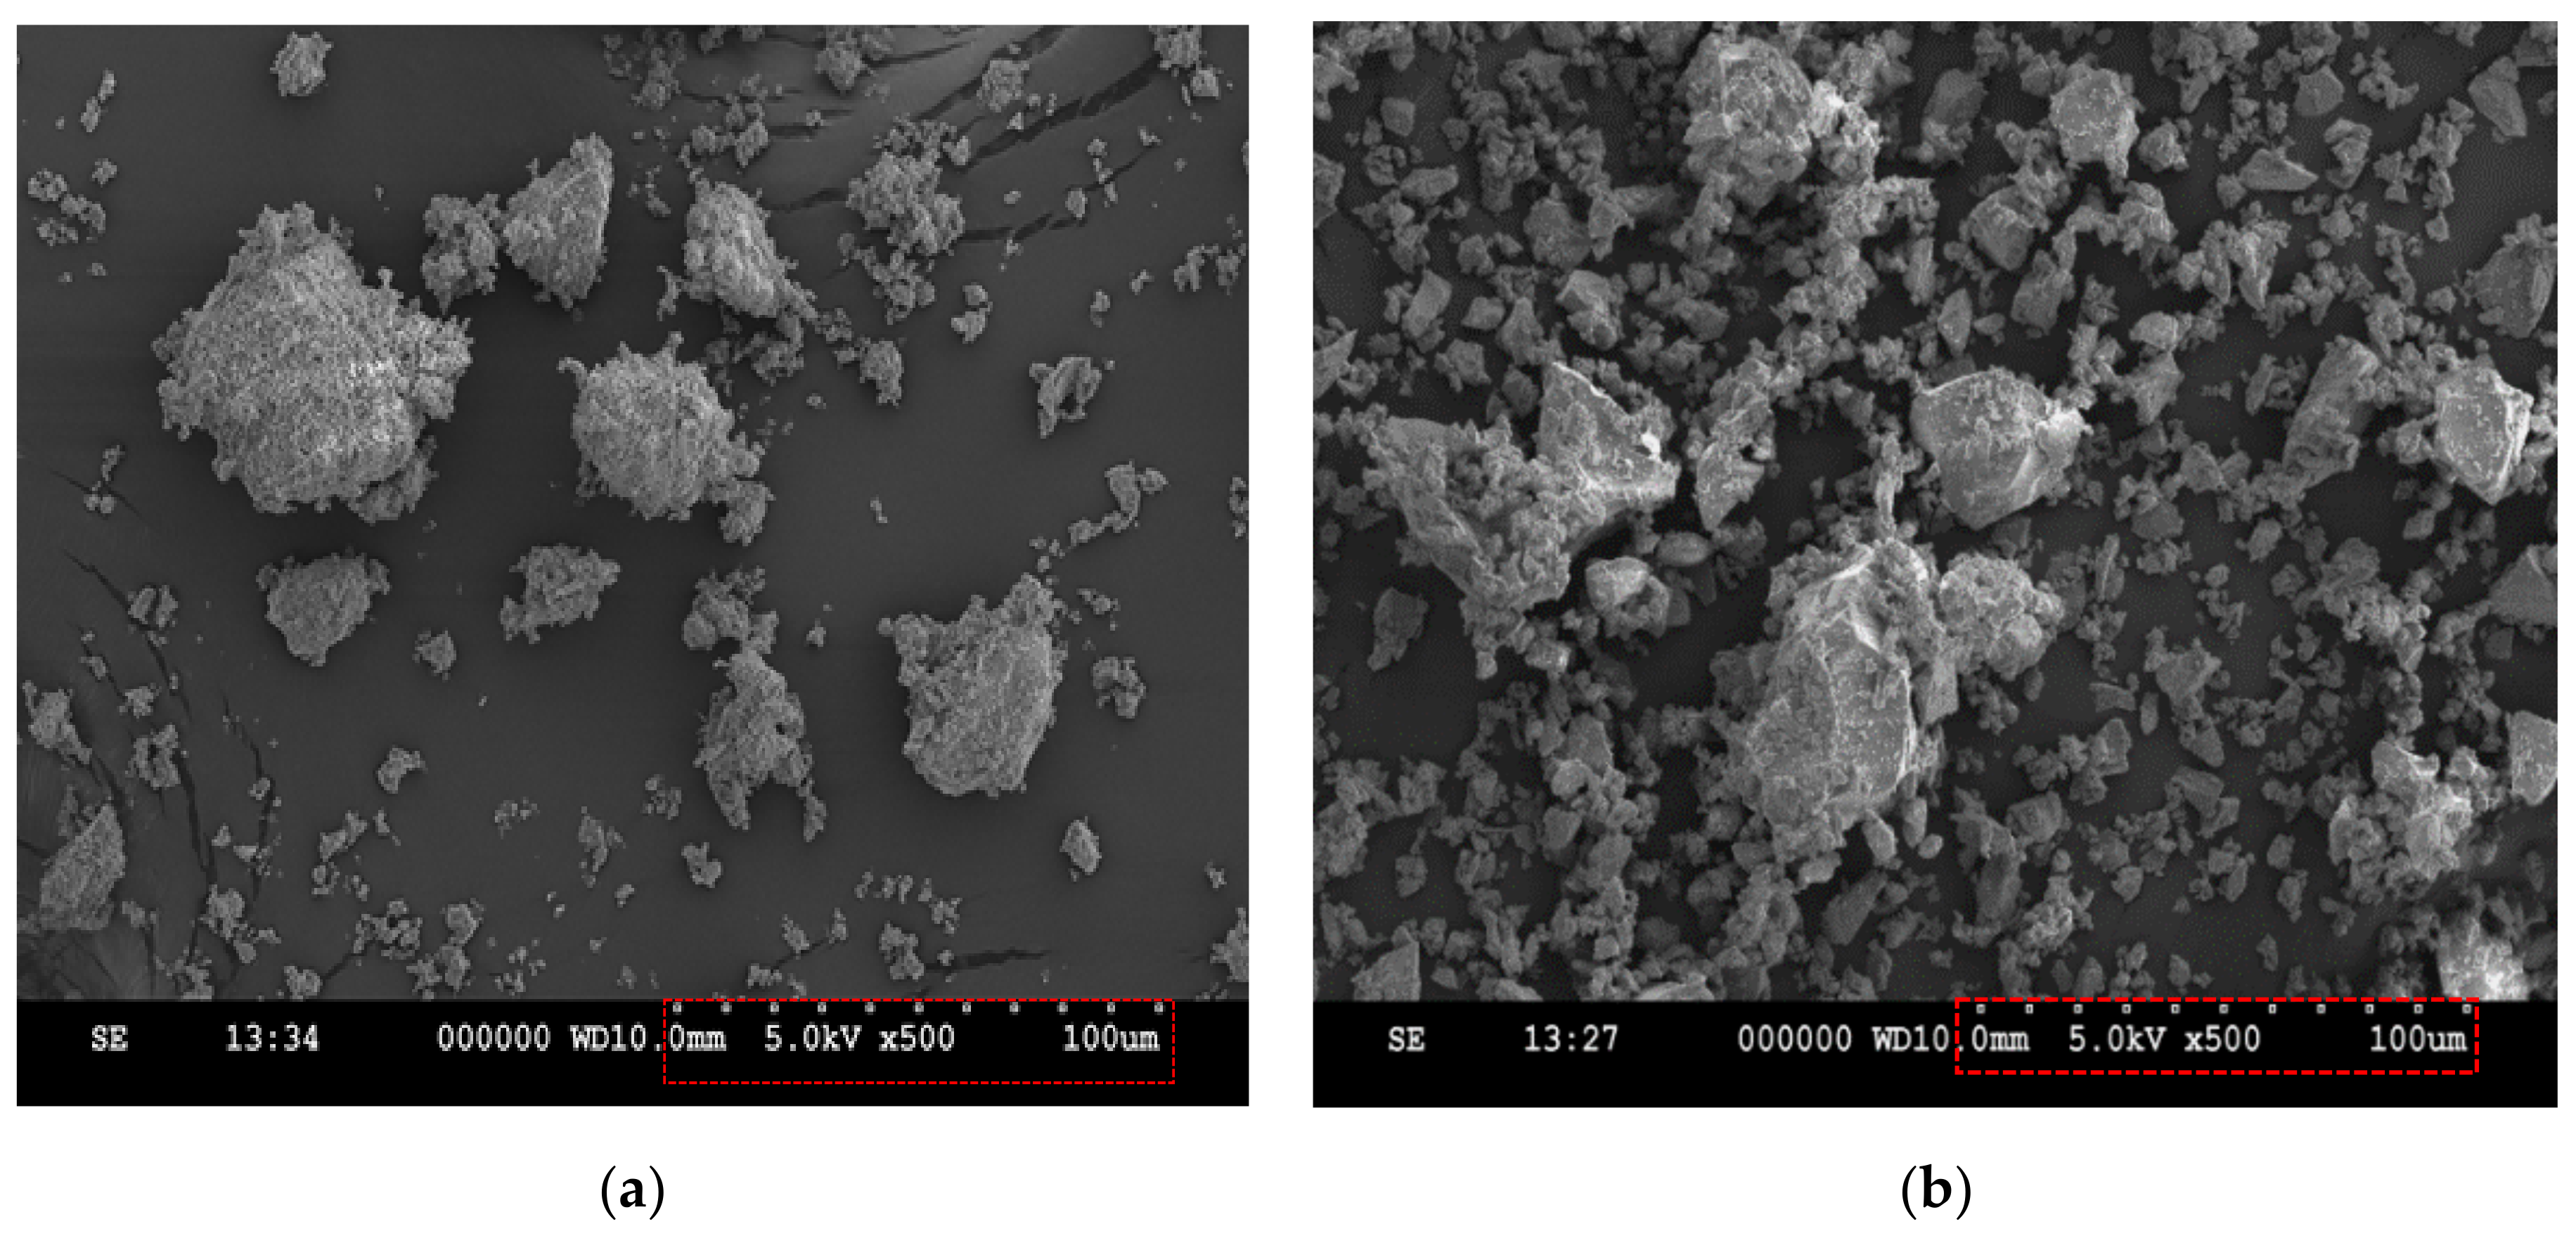
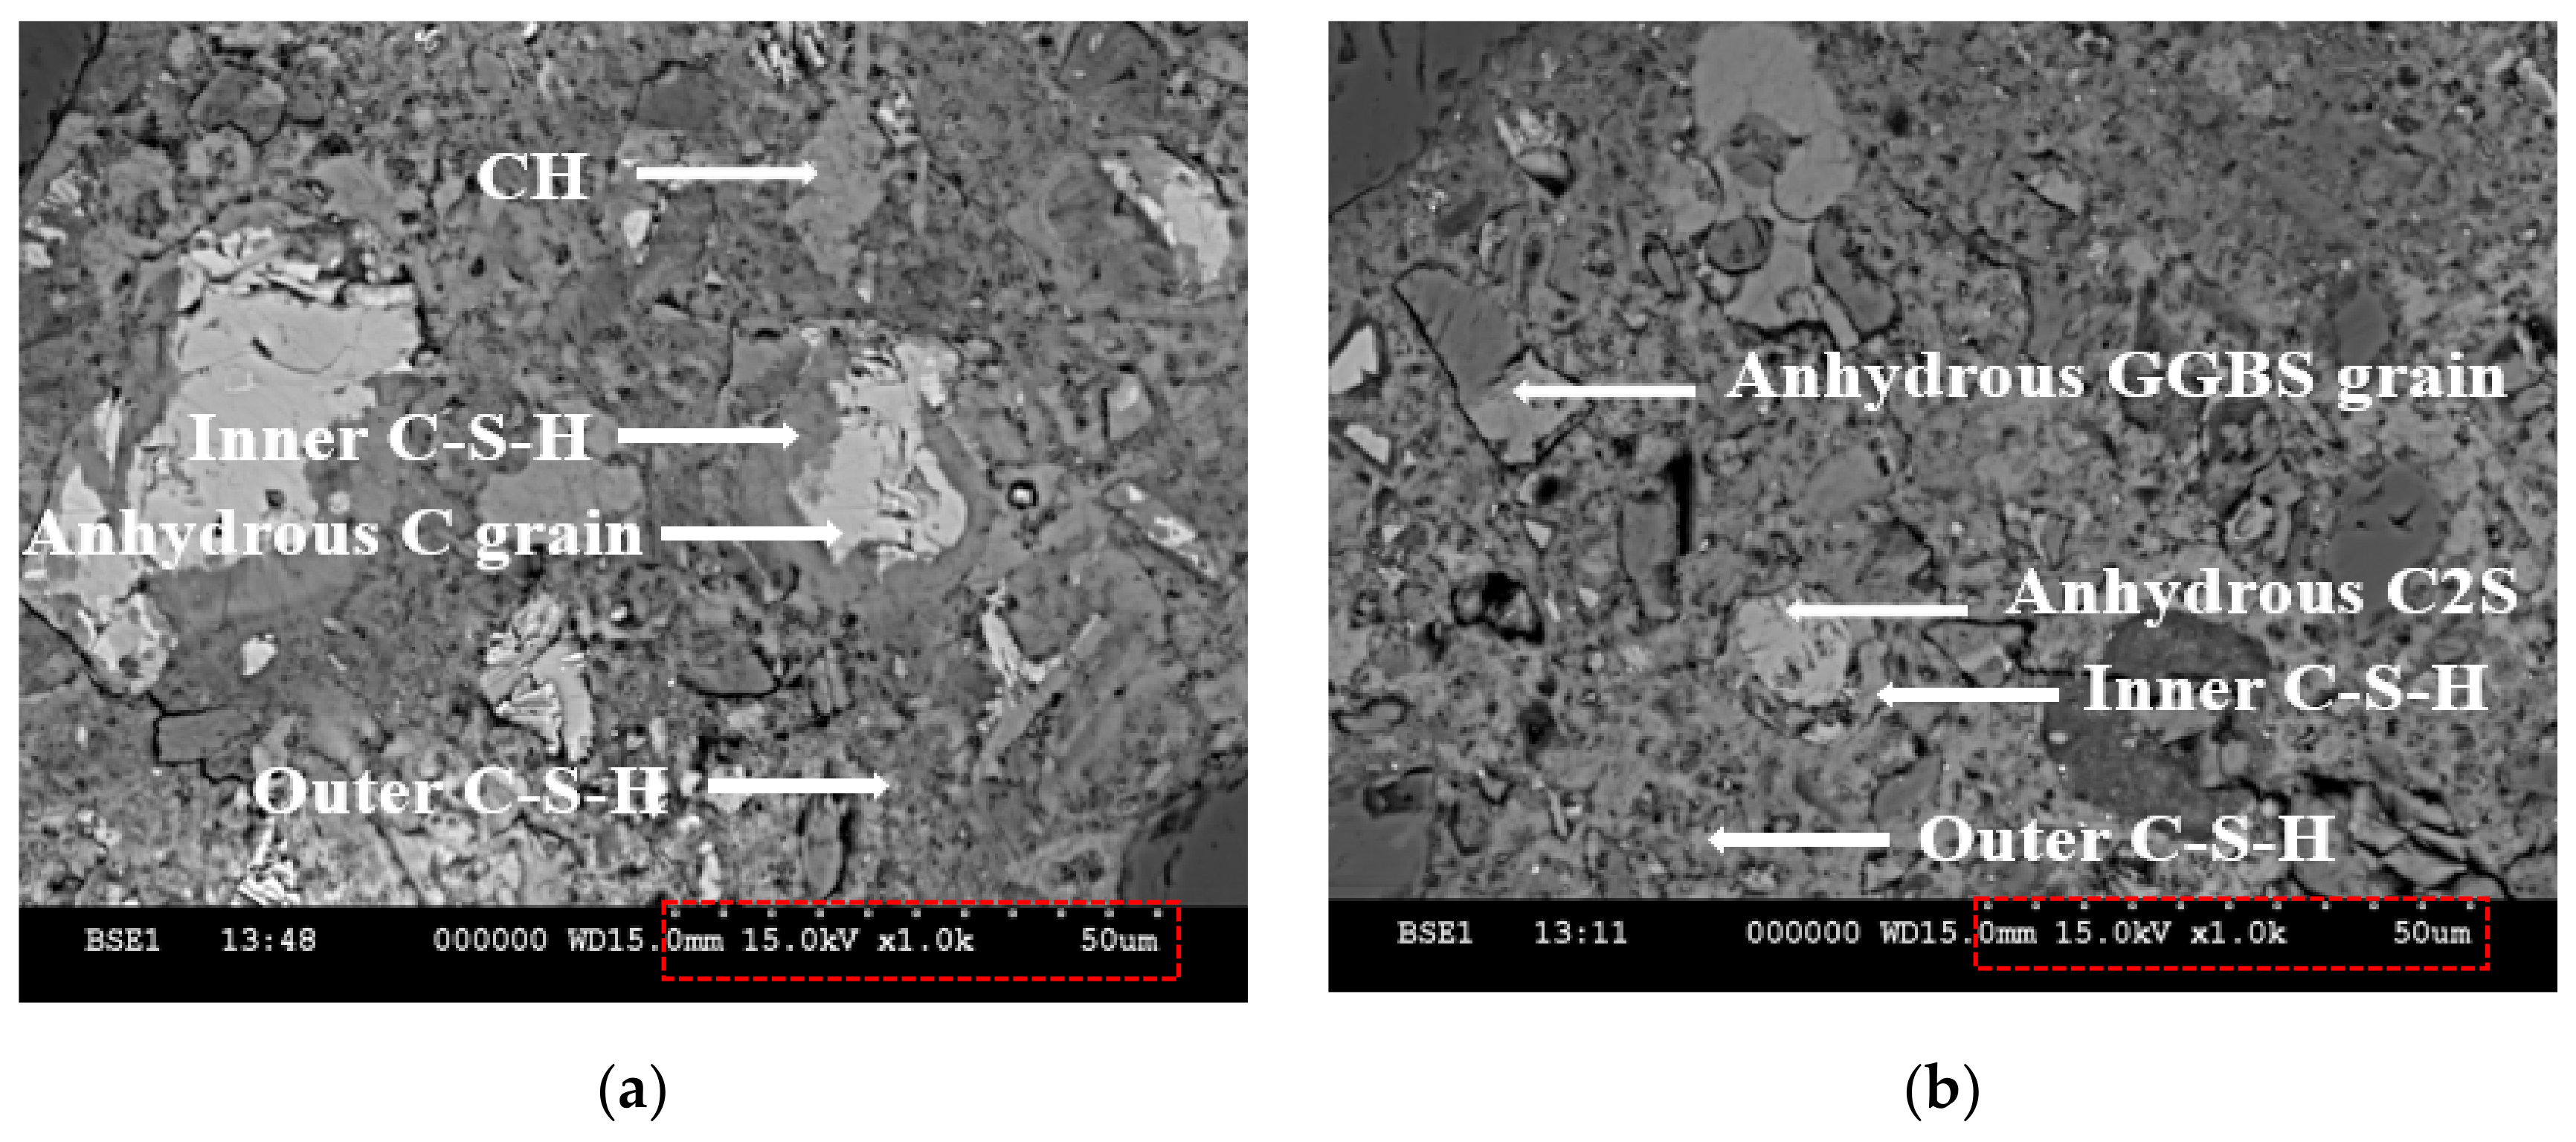
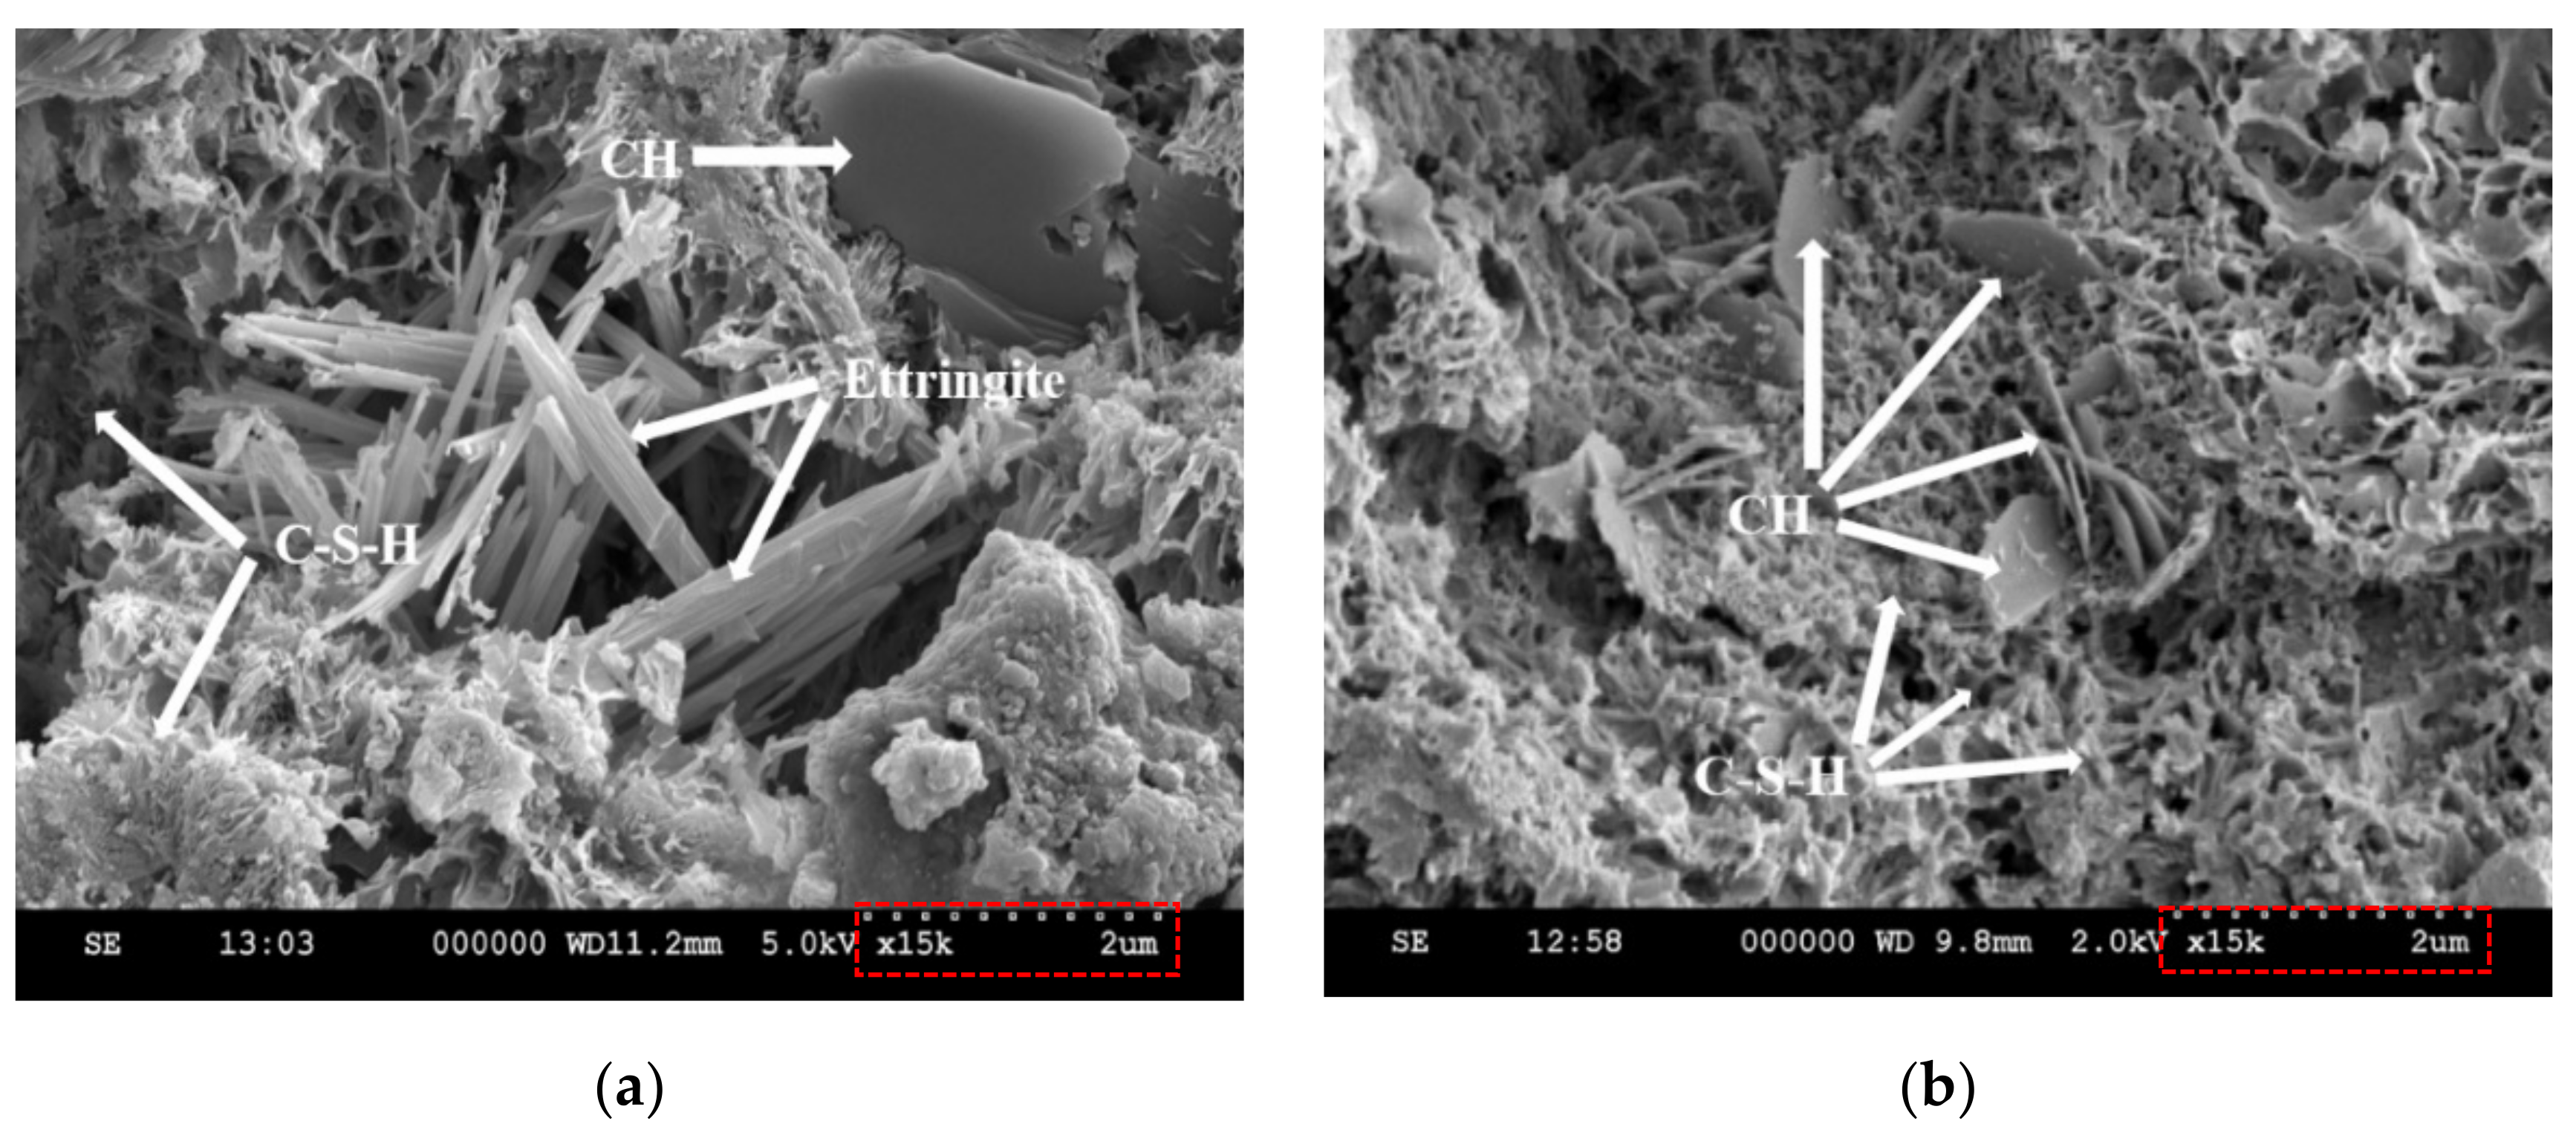
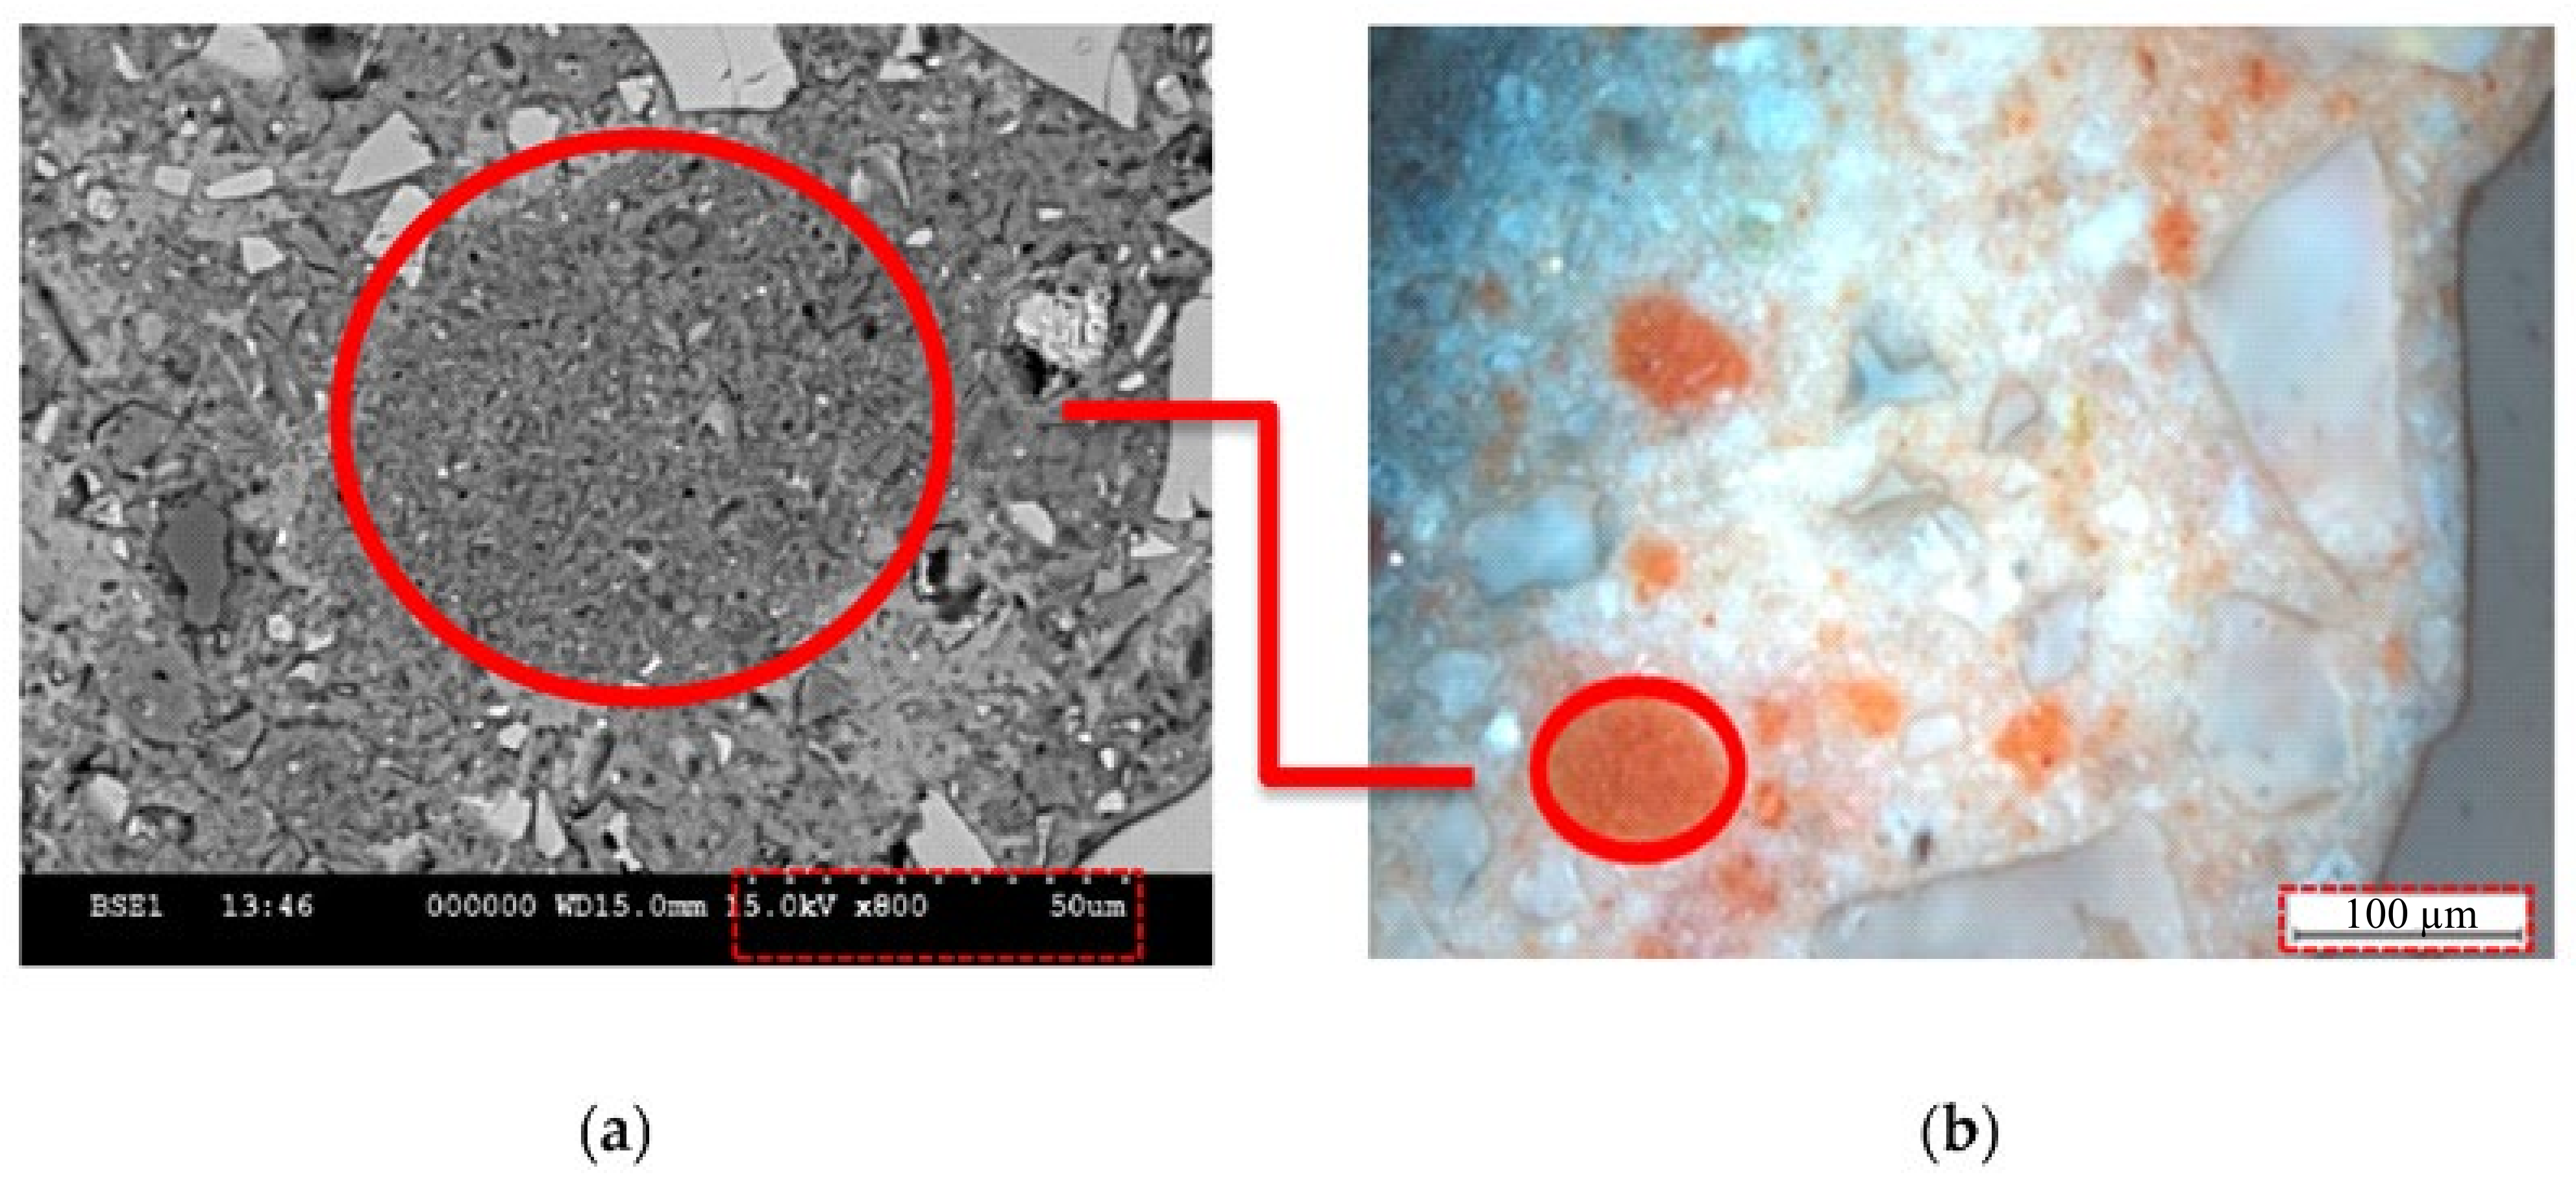
3.9. Scanning Electron Microscopy (SEM)
3.10. Mix Leaching Tests
4. Conclusions
- Both mixtures are qualified as plastic mixes because their flow values were higher than the threshold limit of 140 mm (RS, 2015). The cement substitution by supplementary materials led to a negligible decrease in workability compared to the control mix.
- The setting times of the formulated hydraulic road binders are suitable because they are greater than the limit value of 150 min.
- The sulfate contents for both mixes containing GGBS and Calcined sediments were well below than 4%, which is required value for hydraulic road binders with normal hardening according EN 13282-2 standard.
- The volume expansions were higher than that of the control (0.33 mm). However, the increased volume expansions remain very low and not significant when compared to the threshold limit value of 30 mm for normal hardening hydraulic road binders (EN 13282-2).
- At 56 days of curing, the compressive strength values ranging between 32.5 MPa and 52.5 MPa, met the mechanical strength requirements for normal hardening hydraulic road binders (class N4) according to EN 13282-2.
- The replacement of cement by supplementary materials led to a porosity decrease, refined porosity distribution, and mechanical strength increase.
- The incorporation of GGBS and calcined sediments on the mixt exhibited an increase in harmless porosity.
- The concentrations of heavy metals on the mix containing GGBS and calcined sediments remained below the detection thresholds of measuring devices and lower than that of the raw sediments. Moreover, their anion concentrations (chloride, fluoride, and sulfate) remained below the threshold limits for Inert Waste (French Directive of 14 December 2014).
Author Contributions
Funding
Institutional Review Board Statement
Informed Consent Statement
Data Availability Statement
Acknowledgments
Conflicts of Interest
References
- Scrivener, K.L.; John, V.M.; Gartner, E.M. Eco-Efficient Cements: Potential Economically Viable Solutions for a Low-CO2 Cement-Based Materials Industry. Cem. Concr. Res. 2018, 114, 2–26. [Google Scholar] [CrossRef]
- Laoufi, L.; Senhadji, Y.; Benazzouk, A. Valorization of Mud from Fergoug Dam in Manufacturing Mortars. Case Stud. Constr. Mater. 2016, 5, 26–38. [Google Scholar] [CrossRef] [Green Version]
- Rivera, R.A.; Sanjuán, M.Á.; Martín, D.A. Granulated Blast-Furnace Slag and Coal Fly Ash Ternary Portland Cements Optimization. Sustainability 2020, 12, 5783. [Google Scholar] [CrossRef]
- Benzerzour, M.; Maherzi, W.; Amar, M.A.A.; Abriak, N.E.; Damidot, D. Formulation of Mortars Based on Thermally Treated Sediments. J. Mater. Cycles Waste Manag. 2018, 20, 592–603. [Google Scholar] [CrossRef]
- Segui, P.; Aubert, J.E.; Husson, B.; Measson, M. Utilization of a Natural Pozzolan as the Main Component of Hydraulic Road Binder. Constr. Build. Mater. 2013, 40, 217–223. [Google Scholar] [CrossRef]
- Yu, J.; Wu, H.L.; Mishra, D.K.; Li, G.; Leung, C.K. Compressive Strength and Environmental Impact of Sustainable Blended Cement with High-Dosage Limestone and Calcined Clay (LC2). J. Clean. Prod. 2021, 278, 123616. [Google Scholar] [CrossRef]
- Hameed, R.; Seo, J.; Park, S.; Amr, I.T.; Lee, H.K. CO2 Uptake and Physicochemical Properties of Carbonation-Cured Ternary Blend Portland Cement–Metakaolin–Limestone Pastes. Materials 2020, 13, 4656. [Google Scholar] [CrossRef] [PubMed]
- Juenger, M.C.G.; Snellings, R.; Bernal, S.A. Supplementary Cementitious Materials: New Sources, Characterization, and Performance Insights. Cem. Concr. Res. 2019, 122, 257–273. [Google Scholar] [CrossRef]
- IEA-CSI Technology Roadmap for Cement; International Energy Agency: Paris, France, 2018.
- Pade, C.; Guimaraes, M. The CO2 Uptake of Concrete in a 100 Year Perspective. Cem. Concr. Res. 2007, 37, 1348–1356. [Google Scholar] [CrossRef]
- Li, J.; Tharakan, P.; Macdonald, D.; Liang, X. Technological, Economic and Financial Prospects of Carbon Dioxide Capture in the Cement Industry. Energy Policy 2013, 61, 1377–1387. [Google Scholar] [CrossRef]
- Shanks, W.; Dunant, C.F.; Drewniok, M.P.; Lupton, R.C.; Serrenho, A.; Allwood, J.M. How Much Cement Can We Do without? Lessons from Cement Material Flows in the UK. Resour. Conserv. Recycl. 2019, 141, 441–454. [Google Scholar] [CrossRef] [Green Version]
- Dixit, A.; Du, H.; Pang, S.D. Carbon Capture in Ultra-High Performance Concrete Using Pressurized CO2 Curing. Constr. Build. Mater. 2021, 288, 123076. [Google Scholar] [CrossRef]
- Scrivener, K.; Martirena, F.; Bishnoi, S.; Maity, S. Calcined Clay Limestone Cements (LC3). Cem. Concr. Res. 2018, 114, 49–56. [Google Scholar] [CrossRef]
- Men, G.; Bonavetti, V.; Irassar, E.F. Strength Development of Ternary Blended Cement with Limestone Filler and Blast-Furnace Slag. Cem. Concr. Compos. 2003, 25, 61–67. [Google Scholar]
- Bágel, L. Strength and pore structure of ternary blended cement mortars containing blast furnace slag and silica fume. Cem. Concr. Res. 1998, 28, 1011–1020. [Google Scholar] [CrossRef]
- Shanmuga Priya, D.; Sakthieswaran, N.; Ganesh Babu, O. Experimental Study on Mortar as Partial Replacement Using Sawdust Powder and GGBS 2020. Mater. Today Proc. 2021, 37, 1051–1055. [Google Scholar] [CrossRef]
- Toumi, A.; Remini, B. Zardezas (algeria): A dam that is silting up? zardezas (algerie): UN barrage qui s’envase? LARHYSS J. 2020, 43, 7–22. [Google Scholar]
- Benzerzour, M.; Amar, M.; Abriak, N.E. New Experimental Approach of the Reuse of Dredged Sediments in a Cement Matrix by Physical and Heat Treatment. Constr. Build. Mater. 2017, 140, 432–444. [Google Scholar] [CrossRef]
- Dang, T.A.; Kamali-Bernard, S.; Prince, W.A. Design of New Blended Cement Based on Marine Dredged Sediment. Constr. Build. Mater. 2013, 41, 602–611. [Google Scholar] [CrossRef]
- Hadj Sadok, R.; Belas, N.; Tahlaiti, M.; Mazouzi, R. Production, Reusing Calcined Sediments from Chorfa II Dam as Partial Replacement of Cement for Sustainable Mortar. J. Build. Eng. 2021, 40, 102273. [Google Scholar] [CrossRef]
- Snellings, R.; Cizer, Ö.; Horckmans, L.; Durdziński, P.T.; Dierckx, P.; Nielsen, P.; van Balen, K.; Vandewalle, L. Properties and Pozzolanic Reactivity of Flash Calcined Dredging Sediments. Appl. Clay Sci. 2016, 129, 35–39. [Google Scholar] [CrossRef]
- van Bunderen, C.; Snellings, R.; Vandewalle, L.; Cizer, Ö. Early-Age Hydration and Autogenous Deformation of Cement Paste Containing Flash Calcined Dredging Sediments. Constr. Build. Mater. 2019, 200, 104–115. [Google Scholar] [CrossRef]
- van Bunderen, C.; Benboudjema, F.; Snellings, R.; Vandewalle, L.; Cizer, Ö. Experimental Analysis and Modelling of Mechanical Properties and Shrinkage of Concrete Recycling Flash Calcined Dredging Sediments. Cem. Concr. Compos. 2021, 115, 103787. [Google Scholar] [CrossRef]
- Stevulova, N.; Strigáč, J.; Junak, J.; Terpakova, E.; Holub, M. Incorporation of Cement Bypass Dust in Hydraulic Road Binder. Materials 2021, 14, 41. [Google Scholar] [CrossRef]
- Behim, M.; Cyr, M.; Clastres, P. Physical and Chemical Effects of El Hadjar Slag Used as an Additive in Cement-Based Materials. Eur. J. Environ. Civ. Eng. 2011, 15, 1413–1432. [Google Scholar] [CrossRef]
- Remini, B.; Hallouche, W.; Achour, B. L’algerie: Plus D’un Siecle 2 De Desenvasement Des 3 Barrages. 2020. Available online: https://www.researchgate.net/publication/343636574_PARTIE_II_-LES_EAUX_DOUCES_ET_DE_SURFACE_CHAPITRE_8_L’ALGERIE_PLUS_D’UN_SIECLE_2_DE_DESENVASEMENT_DES (accessed on 23 September 2021).
- Alujas, A.; Fernández, R.; Quintana, R.; Scrivener, K.L.; Martirena, F. Pozzolanic Reactivity of Low Grade Kaolinitic Clays: Influence of Calcination Temperature and Impact of Calcination Products on OPC Hydration. Appl. Clay Sci. 2015, 108, 94–101. [Google Scholar] [CrossRef]
- Sadok, R.H.; Maherzi, W.; Benzerzour, M.; Lord, R.; Torrance, K.; Zambon, A.; Abriak, N. Mechanical Properties and Microstructure of Low Carbon Binders Manufactured from Calcined Canal Sediments and Ground Granulated Blast Furnace Slag (GGBS). Sustainability 2021, 13, 9057. [Google Scholar] [CrossRef]
- Nozahic, V. Vers Une Nouvelle Démarche de Conception Des Bétons de Végétaux Lignocellulosiques Basée Sur La Compréhension et L’amélioration de L’interface Liant/Végétal: Application à Des Granulats de Chenevotte et de Tige de Tournesol Associés à Un Liant Ponce/chaux. Ph.D Thesis, Université Blaise Pascal, Clermont-Ferrand, France, 2012. [Google Scholar]
- Bouchikhi, A.; Maherzi, W.; Benzerzour, M.; Mamindy-Pajany, Y.; Peys, A.; Abriak, N.E. Manufacturing of Low-Carbon Binders Using Waste Glass and Dredged Sediments: Formulation and Performance Assessment at Laboratory Scale. Sustainability 2021, 13, 4960. [Google Scholar] [CrossRef]
- Avet, F.; Snellings, R.; Alujas Diaz, A.; ben Haha, M.; Scrivener, K. Development of a New Rapid, Relevant and Reliable (R3) Test Method to Evaluate the Pozzolanic Reactivity of Calcined Kaolinitic Clays. Cem. Concr. Res. 2016, 85, 1–11. [Google Scholar] [CrossRef]
- Herrero, A.; Ortiz, M.C.; Sarabia, L.A. D-Optimal Experimental Design Coupled with Parallel Factor Analysis 2 Decomposition a Useful Tool in the Determination of Triazines in Oranges by Programmed Temperature Vaporization-Gas Chromatography-Mass Spectrometry When Using Dispersive-Solid Phase Ex. J. Chromatogr. A 2013, 1288, 111–126. [Google Scholar] [CrossRef] [PubMed] [Green Version]
- Fatemi, S.; Varkani, M.K.; Ranjbar, Z.; Bastani, S. Optimization of the Water-Based Road-Marking Paint by Experimental Design, Mixture Method. Prog. Org. Coat. 2006, 55, 337–344. [Google Scholar] [CrossRef]
- Li, X.; Huang, H.; Xu, J.; Ma, S.; Shen, X. Statistical Research on Phase Formation and Modification of Alite Polymorphs in Cement Clinker with SO3 and MgO. Constr. Build. Mater. 2012, 37, 548–555. [Google Scholar] [CrossRef]
- Imanzadeh, S.; Hibouche, A.; Jarno, A.; Taibi, S. Formulating and Optimizing the Compressive Strength of a Raw Earth Concrete by Mixture Design. Constr. Build. Mater. 2018, 163, 149–159. [Google Scholar] [CrossRef]
- Zeraoui, A. Approche Opérationnelle Pour Une Gestion Durable des Sédiments de Dragage dans des Filières de Génie Civil: Mise en Place d’un Outil D’aide à la Décision. Ph.D Thesis, Université de Lille, Douai, France, 2020. [Google Scholar]
- el Mahdi Safhi, A.; Benzerzour, M.; Rivard, P.; Abriak, N.E. Feasibility of Using Marine Sediments in SCC Pastes as Supplementary Cementitious Materials. Powder Technol. 2019, 344, 730–740. [Google Scholar] [CrossRef]
- Fernandez, R.; Scrivener, K. Calcined Clayey Soils as a Potential Replacement for Cement in Developing Countries. Ph.D Thesis, Ecole Polytechnique Fédérale de Lausanne, Lausanne, Switzerland, 2009; p. 178. [Google Scholar]
- Bouchikhi, A.; Benzerzour, M.; Abriak, N.E.; Maherzi, W.; Mamindy-Pajany, Y. Study of the Impact of Waste Glasses Types on Pozzolanic Activity of Cementitious Matrix. Constr. Build. Mater. 2019, 197, 626–640. [Google Scholar] [CrossRef]
- Mobili, A.; Belli, A.; Giosuè, C.; Bellezze, T.; Tittarelli, F. Metakaolin and Fly Ash Alkali-Activated Mortars Compared with Cementitious Mortars at the Same Strength Class. Cem. Concr. Res. 2016, 88, 198–210. [Google Scholar] [CrossRef]
- Samet, B.; Mnif, T.; Chaabouni, M. Use of a Kaolinitic Clay as a Pozzolanic Material for Cements: Formulation of Blended Cement. Cem. Concr. Compos. 2007, 29, 741–749. [Google Scholar] [CrossRef]
- Wang, L.; Ur, N.; Curosu, I.; Zhu, Z.; Abdul, M.; Beigh, B.; Liebscher, M.; Chen, L.; Tsang, D.C.W.; Hempel, S.; et al. Cement and Concrete Research On the Use of Limestone Calcined Clay Cement (LC3) in High-Strength Strain-Hardening Cement-Based Composites (HS-SHCC). Cem. Concr. Res. 2021, 144, 106421. [Google Scholar] [CrossRef]
- Kuri, J.C.; Khan, M.N.N.; Sarker, P.K. Fresh and Hardened Properties of Geopolymer Binder Using Ground High Magnesium Ferronickel Slag with Fly Ash. Constr. Build. Mater. 2021, 272, 121877. [Google Scholar] [CrossRef]
- Berodier, E.; Scrivener, K. Evolution of Pore Structure in Blended Systems. Cem. Concr. Res. 2015, 73, 25–35. [Google Scholar] [CrossRef] [Green Version]
- Zhao, S.; Xia, M.; Yu, L.; Huang, X.; Jiao, B.; Li, D. Optimization for the Preparation of Composite Geopolymer Using Response Surface Methodology and Its Application in Lead-Zinc Tailings Solidification. Constr. Build. Mater. 2021, 266, 120969. [Google Scholar] [CrossRef]
- Briki, Y.; Avet, F.; Zajac, M.; Bowen, P.; Haha, M.B.; Scrivener, K. Understanding of the Factors Slowing down Metakaolin Reaction in Limestone Calcined Clay Cement (LC3) at Late Ages. Cem. Concr. Res. 2021, 146, 106477. [Google Scholar] [CrossRef]
- Zhou, Y.F.; Li, J.S.; Lu, J.X.; Cheeseman, C.; Poon, C.S. Sewage Sludge Ash: A Comparative Evaluation with Fly Ash for Potential Use as Lime-Pozzolan Binders. Constr. Build. Mater. 2020, 242, 118160. [Google Scholar] [CrossRef]
- Scrivener, K.L. Backscattered Electron Imaging of Cementitious Microstructures: Understanding and Quantification. Cem. Concr. Compos. 2004, 26, 935–945. [Google Scholar] [CrossRef]
- Hadj-Sadok, A.; Kenai, S.; Courard, L.; Darimont, A. Microstructure and Durability of Mortars Modified with Medium Active Blast Furnace Slag. Constr. Build. Mater. 2011, 25, 1018–1025. [Google Scholar] [CrossRef]
- Ahmed, H. sadok Effect of the Microstructure of Mortars with Low Hydraulicity Slag on Their Behavior in Aggressive Environments. MATEC Web Conf. 2018, 149, 01025. [Google Scholar] [CrossRef]
- Lehner, P.; Ghosh, P.; Konečný, P. Statistical Analysis of Time Dependent Variation of Diffusion Coefficient for Various Binary and Ternary Based Concrete Mixtures. Constr. Build. Mater. 2018, 183, 75–87. [Google Scholar] [CrossRef]
- Adu-Amankwah, S.; Black, L.; Skocek, J.; ben Haha, M.; Zajac, M. Effect of Sulfate Additions on Hydration and Performance of Ternary Slag-Limestone Composite Cements. Constr. Build. Mater. 2018, 164, 451–462. [Google Scholar] [CrossRef]


| Physical Properties | Values | Major Oxides | Percentage (%) |
|---|---|---|---|
| SSA BET (cm2/g) | 9194 | SiO2 | 17.13 |
| Density (g/cm3) | 3.16 | Al2O3 | 4.51 |
| D10 | 1.09 | FeO3 | 2.95 |
| D50 | 12.09 | CaO | 60.13 |
| D90 | 43.50 | MgO | 0.78 |
| SO3 | 4.09 | ||
| K2O | 1.01 | ||
| Na2O | 0.29 | ||
| TiO2 | 0.32 | ||
| MnO | Traces | ||
| BaO | Traces | ||
| SrO | Traces | ||
| OF2 | --- |
| Physical Properties | Values | Major Oxides | Percentage (%) |
|---|---|---|---|
| SSA BET (cm2/g) | 9171 | SiO2 | 34.35 |
| Density (g/cm3) | 2.95 | Al2O3 | 7.83 |
| D10 | 0.73 | FeO3 | 0.76 |
| D50 | 5.70 | CaO | 41.47 |
| D90 | 20.09 | MgO | 4.09 |
| SO3 | 1.56 | ||
| K2O | 1.19 | ||
| Na2O | 0.26 | ||
| TiO2 | 0.27 | ||
| MnO | 1.48 | ||
| BaO | 1.56 | ||
| SrO | 0.24 | ||
| OF2 | 0.82 |
| Physicochemical Properties | Raw Sediment | Calcined Sediment |
|---|---|---|
| Water content (%) | 49.86 | 0 |
| Clayey fraction Dmax < 2 μm | 23.6 | 39.57 |
| Silty fraction 2 μm < Dmax < 63 μm (%) | 76.4 | 60.43 |
| Density (cm2/g) | 2.63 | 2.75 |
| Plasticity index (%) | 29.9 | --- |
| Blue methylene value (g/100 g) | 4.41 | --- |
| CaCO3 (%) | 15.55 | --- |
| SiO2 | 48.27 | 51.84 |
| Al2O3 | 17.73 | 19.23 |
| FeO3 | 6.26 | 6.92 |
| CaO | 9.35 | 10.2 |
| MgO | 2.11 | 2.41 |
| SO3 | --- | 0.28 |
| K2O | 2.25 | 2.47 |
| Na2O | 0.36 | 0.38 |
| TiO2 | 0.81 | 0.9 |
| Elements | Raw Sediment | Inert Waste Reference |
|---|---|---|
| (mg/kg of Dry Matter) | (mg/kg of Dry Matter) | |
| As | <0.11 | 0.5 |
| Ba | 0.57 | 20 |
| Cd | <0.009 | 0.04 |
| Cr | <0.004 | 0.5 |
| Cu | 0.064 | 2 |
| Mo | <0.088 | 0.5 |
| Ni | <0.047 | 0.4 |
| Pb | <0.023 | 0.5 |
| Sb | <0.057 | 0.06 |
| Se | <0.083 | 0.1 |
| Zn | 0.02 | 4 |
| Chloride | 39.5 | 800 |
| Fluoride | 7.15 | 10 |
| Sulfate | 515 | 1000 |
| Soluble fraction | 1000 | 4000.00 |
| Value Limits | X1 (C) | Variables X2 (GGBS) | X3 (CS) |
|---|---|---|---|
| Low | 50 | 0 | 0 |
| High | 100 | 50 | 30 |
| Mix Designs | Cement (C) | G: Granulated Blast Furnace (GGBC) | CS: Calcined Sediment | |||
|---|---|---|---|---|---|---|
| (%) | (g) | (%) | (g) | (%) | (g) | |
| 84C01GGBS15CS | 84 | 378 | 01 | 5 | 15 | 68 |
| 68C02GGBS30CS | 68 | 306 | 02 | 09 | 30 | 135 |
| 72C11GGBS17CS | 72 | 324 | 11 | 50 | 17 | 77 |
| 55C15GGBS30CS | 55 | 248 | 15 | 68 | 30 | 135 |
| 73C24GGBS03CS | 73 | 329 | 24 | 108 | 03 | 14 |
| 63C37GGBS00CS | 63 | 284 | 37 | 167 | 00 | 00 |
| 100C00GGBS00CS | 100 | 450 | 00 | 00 | 00 | 00 |
| 87C13GGBS00CS | 87 | 392 | 13 | 59 | 00 | 00 |
| 50C30GGBS20CS | 50 | 225 | 30 | 135 | 20 | 90 |
| 62C23GGBS15CS | 62 | 279 | 23 | 104 | 15 | 68 |
| 50C50GGBS00CS | 50 | 225 | 50 | 225 | 00 | 00 |
| Mix Design | Model Predicted USC (MPa) | 95% CI (MPa) | Experimental USC (MPa) |
|---|---|---|---|
| 50C35GGBS15CS | 35.32 | [33.37, 37.32] | 35.17 |
| 80C10GGBS10CS | 44.10 | [42.69, 45.54] | 45.18 |
| 50C35GGBS15CS | 80C10GGBS10CS | CEM I 42,5N | Threshold Limit Value [EN 13282-2] | |
|---|---|---|---|---|
| Residue by mass at 90 µm (%) | 0.18 | 0.28 | 0.35 | 15 |
| Sulfate content (%) | 2.63 | 3.46 | 4.09 | 4 |
| Mixtures | 100C0GGBS0CS | 50C35GGBS15CS | 80C10GGBS10CS |
|---|---|---|---|
| Volume expansion (mm) | 0.330 | 1.280 | 0.740 |
| Standard deviation (mm) | 0.014 | 0.021 | 0.028 |
| Curing Days | 100C0GGBS0CS | 50C35GGBS15CS | 80C10GGBS10CS |
|---|---|---|---|
| 7 days | 14.25% | 14.84% | 12.62% |
| 28 days | 13.62% | 12.43% | 10.88% |
| 56 days | 9.85% | 10.89% | 10.74% |
| 90 days | 6.91% | 11.02% | 10.10% |
| Curing Days | 100C0GGBS0CS | 50C35GGBS15CS | 80C10GGBS10CS |
|---|---|---|---|
| 7 days | 6.54% | 10.50% | 13.91% |
| 28 days | 6.96% | 3.62% | 5.43% |
| 56 days | 6.54% | 4.07% | 5.97% |
| 90 days | 5.52% | 5.97% | 0.82% |
| Elements | 100C0GGBS00CS | 50C35GGBS15CS | 80C10GGBS10CS | IWR (mg/kg of Dry Matter) |
|---|---|---|---|---|
| As | <0.110 | <0.110 | <0.110 | 0.500 |
| Cd | <0.009 | <0.009 | <0.009 | 0.040 |
| Cr | 0.031 | <0.004 | <0.004 | 0.500 |
| Cu | <0.021 | <0.021 | <0.021 | 2.000 |
| MO | <0.088 | <0.088 | <0.088 | 0.500 |
| Ni | <0.047 | <0.047 | <0.047 | 0.400 |
| Pb | <0.032 | <0.032 | <0.032 | 0.500 |
| Sb | <0.057 | <0.057 | <0.057 | 0.060 |
| Se | <0.083 | <0.083 | <0.083 | 0.100 |
| Zn | <0.010 | <0.010 | <0.010 | 4.000 |
| Chloride | 43 | 42 | 45 | 800 |
| Fluoride | 4 | 4 | 3 | 10 |
| Sulfate | 22 | 13 | 13 | 1000 |
Publisher’s Note: MDPI stays neutral with regard to jurisdictional claims in published maps and institutional affiliations. |
© 2021 by the authors. Licensee MDPI, Basel, Switzerland. This article is an open access article distributed under the terms and conditions of the Creative Commons Attribution (CC BY) license (https://creativecommons.org/licenses/by/4.0/).
Share and Cite
Bellara, S.; Hidjeb, M.; Maherzi, W.; Mezazigh, S.; Senouci, A. Optimization of an Eco-Friendly Hydraulic Road Binders Comprising Clayey Dam Sediments and Ground Granulated Blast-Furnace Slag. Buildings 2021, 11, 443. https://doi.org/10.3390/buildings11100443
Bellara S, Hidjeb M, Maherzi W, Mezazigh S, Senouci A. Optimization of an Eco-Friendly Hydraulic Road Binders Comprising Clayey Dam Sediments and Ground Granulated Blast-Furnace Slag. Buildings. 2021; 11(10):443. https://doi.org/10.3390/buildings11100443
Chicago/Turabian StyleBellara, Selma, Mustapha Hidjeb, Walid Maherzi, Salim Mezazigh, and Ahmed Senouci. 2021. "Optimization of an Eco-Friendly Hydraulic Road Binders Comprising Clayey Dam Sediments and Ground Granulated Blast-Furnace Slag" Buildings 11, no. 10: 443. https://doi.org/10.3390/buildings11100443