Article

The Effect of Sand Type on the Rheological Properties of Self-Compacting Mortar

1
State Key Laboratory of Hydroscience and Engineering, Tsinghua University, Beijing 100084, China
2
Powerchina Roadbridge Group Co., Ltd., Beijing 100011, China
3
College of Civil and Transportation Engineering, Hohai University, Nanjing 210098, China
4
Harbor, Waterway and Coastal Engineering, Chongqing Jiaotong University, Chongqing 400074, China
*
Author to whom correspondence should be addressed.
Buildings 2021, 11(10), 441; https://doi.org/10.3390/buildings11100441
Submission received: 2 September 2021 / Revised: 16 September 2021 / Accepted: 18 September 2021 / Published: 28 September 2021

Abstract

:
In order to understand the effect of sand type on the rheological properties of self-compacting mortar, four varieties of sand, namely, quartz sand (QS), river sand (RS), and two kinds of manufactured sand, marked as MS-A and MS-B, were studied. As part of this study, the sands’ particle shape parameters, such as their length:width ratio and roundness, were determined. Mortars containing the four varieties of sand were tested using the slump flow test and the V-funnel test in oven-dried (OD) and saturated surface-dried (SSD) conditions in order to identify the water absorption, shape-related differences, and specific gravity in their rheological performance. The changing trends of the slump flows and the V-funnel times of the different mortars in OD and SSD were similar. By eliminating the influence of water absorption on mortar rheology, shape–weight parameters, such as the ratio between the length:width ratio and specific gravity (LWS) and the product of roundness and specific gravity (ROS), were defined in order to quantify the compound effects of sand type on mortar rheology. The regression analysis showed an excellent linear correlation between slump flow and both LWS and ROS, and a very good linear correlation was also demonstrated between the V-funnel time and both LWS and ROS. Based on the particle shape–weight parameters, the rheological properties of mortars can be predicted. Based on the mortar rheological threshold theory, the self-compacting mortar (SCM) zone can be drawn. The predicted SCM zone overlaps considerably with the experimental SCM zone for MS-A.

1. Introduction

Self-compacting concrete (SCC) is a kind of concrete that can pass through gaps between reinforcement bars and fill the void between the mold corner and rock block without vibration and bleeding during pouring [1,2]. The good workability of SCC depends on a particular mix proportion design method.
In the last four decades, several mix design methods have been proposed by researchers from around the world. Several researchers [3,4,5,6,7,8,9,10,11,12,13] studied the mix design method of SCC from the perspective of rheology. Saak et al. [4] concluded that the rheological properties of paste determined the flowability and segregation resistance of fresh SCC for aggregates with certain characteristics. Based on this idea, Wu and An [9] established two physical and mechanical models and predicted the working performance of SCC through the rheological properties of the pastes.
SCC can be regarded as a mixture of mortar and gravel [14,15,16]. The working performance of SCC is related to the mortar’s rheology, its gravel content, and the physical properties of its gravel. In mortar, fine aggregate is indispensable. The particle size of fine aggregate is between powder and gravel, which can ensure better cohesion of the concrete. In this context, Zhang et al. [10] investigated the effect of the gradation and content of manufactured quartz sand on the paste’s rheological thresholds. In addition to the gradation and content, sand type also has an impact on the rheological properties of mortar or SCC [17]. Hu and Wang [15] concluded that limestone sand with a poor particle shape results in lower flowability of the mortar compared with river sand. Cortes et al. [18] suggested that more paste was needed in order to obtain an adequate working performance of concrete when natural sand was replaced by crushed sand, because the particle shape of natural sand is much closer to a sphere than that of angular crushed sand. Harini et al. [19] investigated the effect of the sand type, such as river sand and crusher dust, on the working performance of mortar. Zeghichi et al. [20] investigated the influence of manufactured sand and dune sand on the rheological properties of fresh SCC, and their results favored the use of dune sand. Ling and Kwan [21] also reported that the addition of ground sand resulted in a high passing ability for SCC. Haddad et al. [22] found that artificial sand resulted in a higher void content and increased paste consumption, because more paste would be needed to fill these voids. Overall, sand shape affects the flowability of mortar and concrete [23,24]. On the other hand, water absorption related to sand type and lithology also affects the flowability of mortar [15,22]. The different water absorption capacities of different types of sand were ignored by some researchers [14,25,26,27,28,29,30]. The effect of water absorption on mortar rheology can be quantified by comparing the rheological properties of mortar using different types of sand in oven-dried (OD) and saturated surface-dried conditions. Furthermore, the density of different types of sand is a factor to be considered.
There have been important contributions related to the measurement of particle shape parameters. Several groups [31,32,33,34,35,36,37,38] have investigated the possibility of describing a particle from a two-dimensional perspective by using a particle outline obtained with photographic techniques. Others [39,40,41,42] have used the three-dimensional image analysis method to determine particle shape, although it is evident that two-dimensional measurements are much simpler and easier than three-dimensional measurements. Due to the similar results of the two-dimensional method and the three-dimensional method for the measurement of particle shape [43], the two-dimensional image analysis method, therefore, was utilized to determine particle shape in this study.
Scholars have also investigated the effect of sand shape parameters on the rheological behavior of fresh mortar and SCC. Jamkar and Rao [44] reported that the water usage decreased as the aggregate shape became increasingly rounded and the texture became increasingly smooth. Westerholm et al. [45] measured the shape of fine aggregates using thin epoxy-baked section samples in optical microscopy. They concluded that the smaller the f-aspect value, the larger the plastic viscosity of the mortar. Hafid et al. [46] defined three kinds of morphological parameters: aspect ratio, circularity, and convexity. Shen et al. [47] obtained images of particles and then analyzed the images with the Image Pro Plus 6.0 program package. They concluded that manufactured sand with lower roundness and a higher length:width ratio required a higher water dosage than river sand. Huang and Wang [48] used the digital image processing method to study two kinds of sand and found that concrete using manufactured sand with a higher length:width ratio used more water. Estephane et al. [49] indicated that the water usage for certain mortar workability values increased as the sand particles became more prolate.
However, research on the influence of sand type on the rheological relationship between paste and mortar in SCC is still lacking, although the measurements of particle shape parameters from a two-dimensional perspective and the influence of shape parameters on mortar or SCC have been studied. Thus, the influence of sand type on the rheological relationship between paste and mortar should be further investigated. Hence, this study aimed to evaluate the influence of the particle shape, the water absorption capacity of sand, and the density of different types of sand over the rheological relationship between paste and mortar, in an effort to improve the prediction of the rheological characteristics of paste and mortar.

2. Materials and Methods
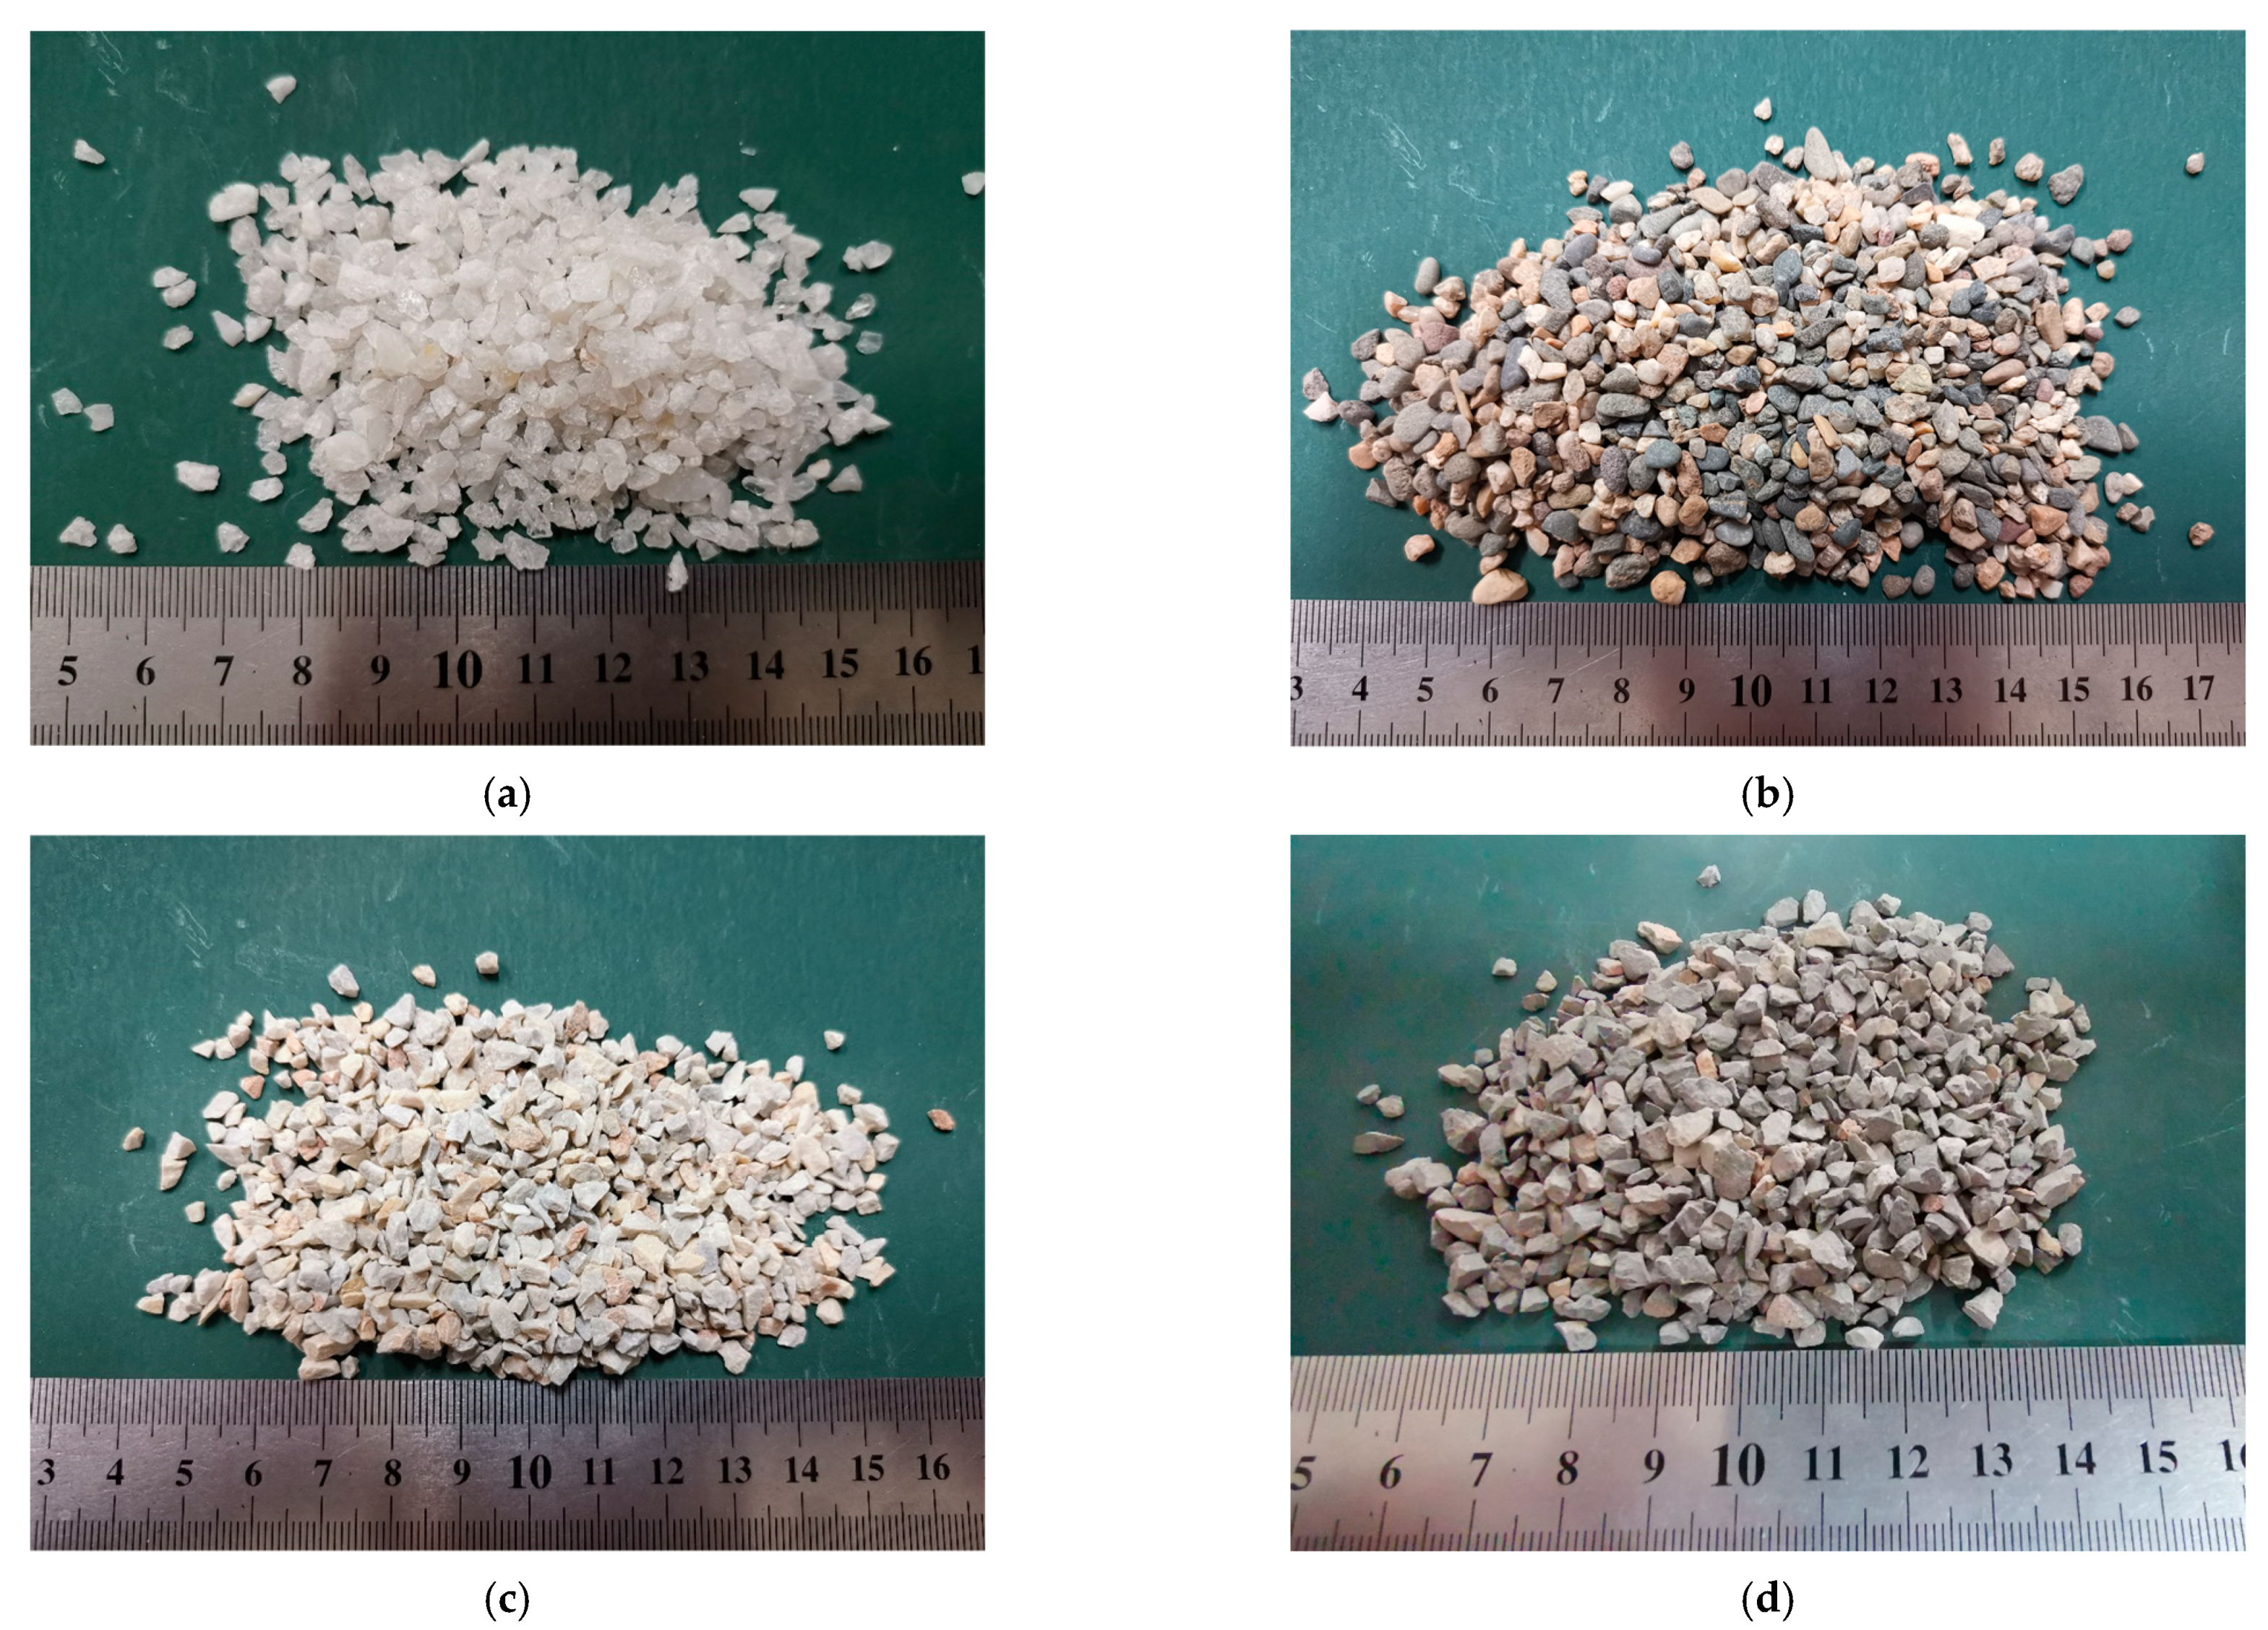
2.1. Materials

Type 42.5 ordinary Portland cement with a specific gravity of 3.10 and a fineness of 473 m2/kg was used. Four kinds of sands were used, namely, quartz sand (QS), river sand (RS), manufactured sand A (MS-A), and manufactured sand B (MS-B). Among the four kinds of sands, MS-A and MS-B were from different manufacturing sand plants in Honghe Prefecture, Yunnan Province, China. The specific gravities of the four kinds of sands were 2.84, 2.67, 2.70, and 2.68, respectively. The absorption values (Abs%) of different types of sand were 0.35%, 0.70%, 1.90% and 2.30%, respectively. To make it easier to prepare four types of sand with the same gradation, particles smaller than 0.16 were removed; the particle sizes ranged from 0.16 mm to 5.0 mm. Then, the four kinds of sand were washed to remove the powder on the surface of the particles. After drying, the four kinds of sand were sieved on square sieves and separated into fractions with the following particle size ranges: 0.16–0.315 mm, 0.315–0.63 mm, 0.63–1.25 mm, 1.25–2.5 mm, and 2.5–5 mm. The percentages of sand between the above size ranges were as follows: 18.2%, 18.5%, 30.9%, 24.4%, and 8.0%. Each fraction of sand was weighed to make sure that the four types of sand had the same gradation. Figure 1 shows the particle morphologies for the four kinds of sands with particle sizes ranging from 2.5 mm to 5.0 mm. Tap water was used in this study. The superplasticizer (SP) used herein had a solid mass content of 20% and a specific gravity of 1.03.

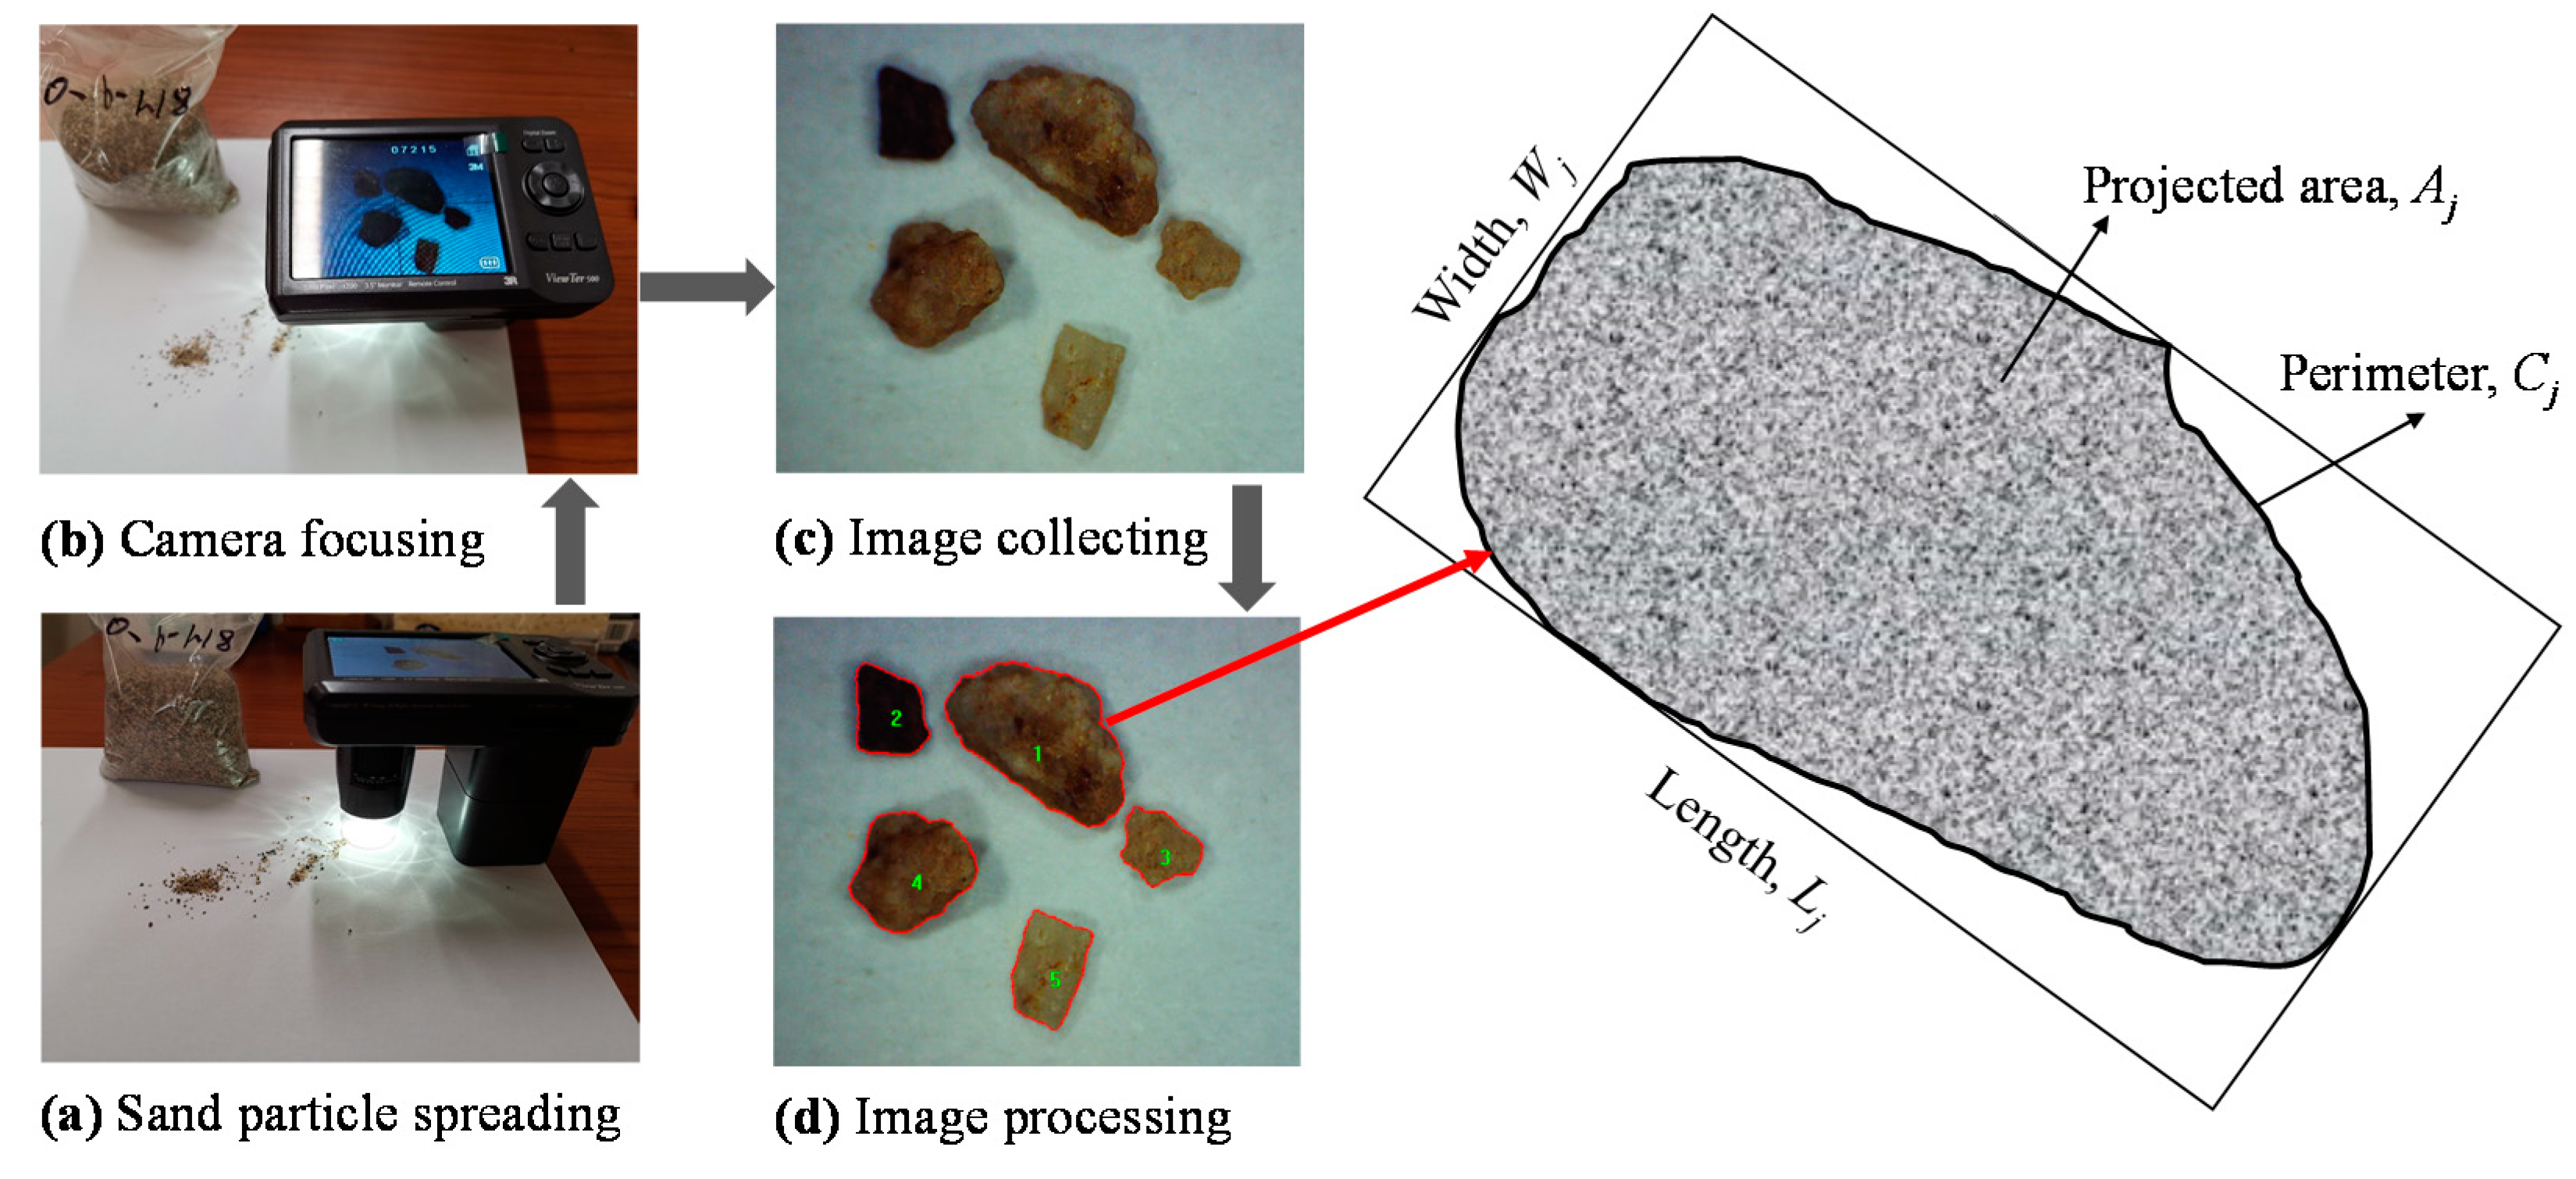
2.2. Particle Shape Measurements

Particle shape was determined according to the process depicted in Figure 2. A white cardboard sheet was laid on the testbed before sand particles were added. The sand particles were carefully spread out on the cardboard sheet so that none of them were touching each other. After the sand particles had been appropriately positioned, a 5-megapixel camera (Anyty 3R-V500IR/UV) with 200 times maximum magnification was placed above the cardboard. Then, the lens focus was adjusted to develop a clear image of the sand sample, and additional images could be obtained by moving the camera. Then, image analysis was performed with an image processing software package called Image-Pro Plus 6.0 to differentiate the sand particles from the background. With the images of the sand particles, particle shape parameters such as area, perimeter, length, and width were measured.
The projected area of a particle is the vertical projection area when it is in its most stable position. The perimeter is the length of the boundary of the vertical projection area. The length and width of a particle are the length and width of the minimum bounding rectangle, as shown in Figure 2. Based on the above analysis, two parameters, length:width ratio (α) and roundness (R) can be calculated to quantify the particle shape of each type of sand. The length:width ratio for the fraction i is:
α i = 1 m j = 1 j = m L j W j
where Lj is the length of the particle j and Wj is the width of the particle j. About 60 particles (i.e., m = 60) were randomly selected in each sieving fraction. αi represents the length:width ratio of sieving fraction i, and
α = i α i a i %
where ai% is the percentage by mass of sand retained between the larger and smaller sieve sizes in fraction i. α represents the weighted average length:width ratio of the entire sample of sand, and
R i = 1 m j = 1 j = m 4 π A j C j 2
where Aj is the projected area and Cj is the perimeter of the particle j. About 60 particles (i.e., m = 60) were randomly selected in each sieving fraction. Ri represents the roundness of sieving fraction i, and
R = i R i a i %
where R represents the weighted average roundness of the sand.
It is worth noting that the photographic shooting distance affects absolute values such as area, perimeter, length, and width of each particle, but not relative values such as length:width ratio and roundness.

2.3. Paste Rheological Threshold Theory

SCC is composed of gravel and mortar [8,14]. Furthermore, sand and paste comprise mortar. Based on the two mechanical models [50] and the relationship between mortar rheological properties and paste rheological properties, Equations (5) and (9) can determine the rheological criteria of SCC formulated paste.
τ p a s t e τ t h r e s h o l d = ρ m o r t a r g ( B + 2 δ m o r t a r ) 2 ( A + 2 δ m o r t a r ) 2 ( 1 ϕ / ϕ max ) n
where τpaste and τthreshold are the paste yield stress and paste yield stress threshold; ρmortar represents mortar density; g equals 9.81 m/s2; δmortar represents the thickness of mortar covering the gravel; A representing the average width of gravel is equal to 2r, B representing the average height is equal to 0.9r, r represents the average radius of gravel [10]; ϕ represents the actual sand:mortar volumetric ratio and ϕmax represents the theoretical maximum of the sand:mortar volumetric ratio; and the coefficient n was obtained to be 4.2 in the study of Toutou and Roussel [51].
The excess mortar film thickness (δmortar) can be obtained by pilot calculation through Equation (6) based on aggregate properties such as the content, particle grading, and void ratio of the gravel.
  V G × a i % 1 6 π D i 3 × 1 6 π [ ( D i + 2 δ m o r t a r ) 3 D i 3 ] = V e x c
where VG is the gravel content by volume (L/m3); Di is the sieving size of the gravel fraction i; Vexc is the volume of excess mortar.
Then, r can be determined by Equation (7).
r =   ( D i 2 × a i % 1 6 π D i 3 /   a i % 1 6 π D i 3 )
Based on the research of Wu and An [9], ϕmax can be determined as follows:
ϕ max = 1 0.45 ( d min / d max ) 0.19
where dmin and dmax are the smallest and largest sieving sizes, respectively.
Then
η p a s t e η t h r e s h o l d = 2 Δ ρ g r 2 δ m o r t a r ( 1 ϕ / ϕ max ) [ η ] ϕ max
where ηpaste and ηthreshold are the paste plastic viscosity and the threshold of paste plastic viscosity, respectively; Δρ represents the density difference between gravel and surrounding mortar; [η] was approximated to be 2.5 in the study of Krieger and Dougherty [52].
The criteria of the paste rheological characteristics described by Equations (5) and (9) indicate that a maximum τpaste and a minimum ηpaste are needed to ensure the fluidity and viscosity of SCC, respectively. The two criteria indicate that τthreshold and ηthreshold both consider the properties of the aggregate. Thus, the thresholds can be determined for given aggregate properties. Therefore, the working performance of SCC can be predicted based on the paste rheological properties.
Based on the research of Roussel et al. [53] and Chidiac et al. [54], the paste yield stress (τpaste) can be calculated through Equation (3) and the paste plastic viscosity(ηpaste) can be calculated through Equation (4) using their mini-SF test results (SFpaste and T200) [55,56]
τ p a s t e = 225 ρ p a s t e g V p a s t e 2 128 π 2 ( S F p a s t e / 2 ) 5 λ ( S F p a s t e / 2 ) 2 V c o n e
η p a s t e = 2 ρ p a s t e g h c o n e V p a s t e 3 π × s l u m p × S F p r e s 2 T 200
where ρpaste is the paste density; Vcone and hcone represent mini-slump cone’s inner volume and height, respectively; SFpaste represents the SF for paste at stoppage; SFpres is equal to 200 mm; T200 is defined by the time spent when SF is up to 200 mm; slump represents the slump value with SFpres equaling 200 mm; λ is equal to 0.0005 [57,58].

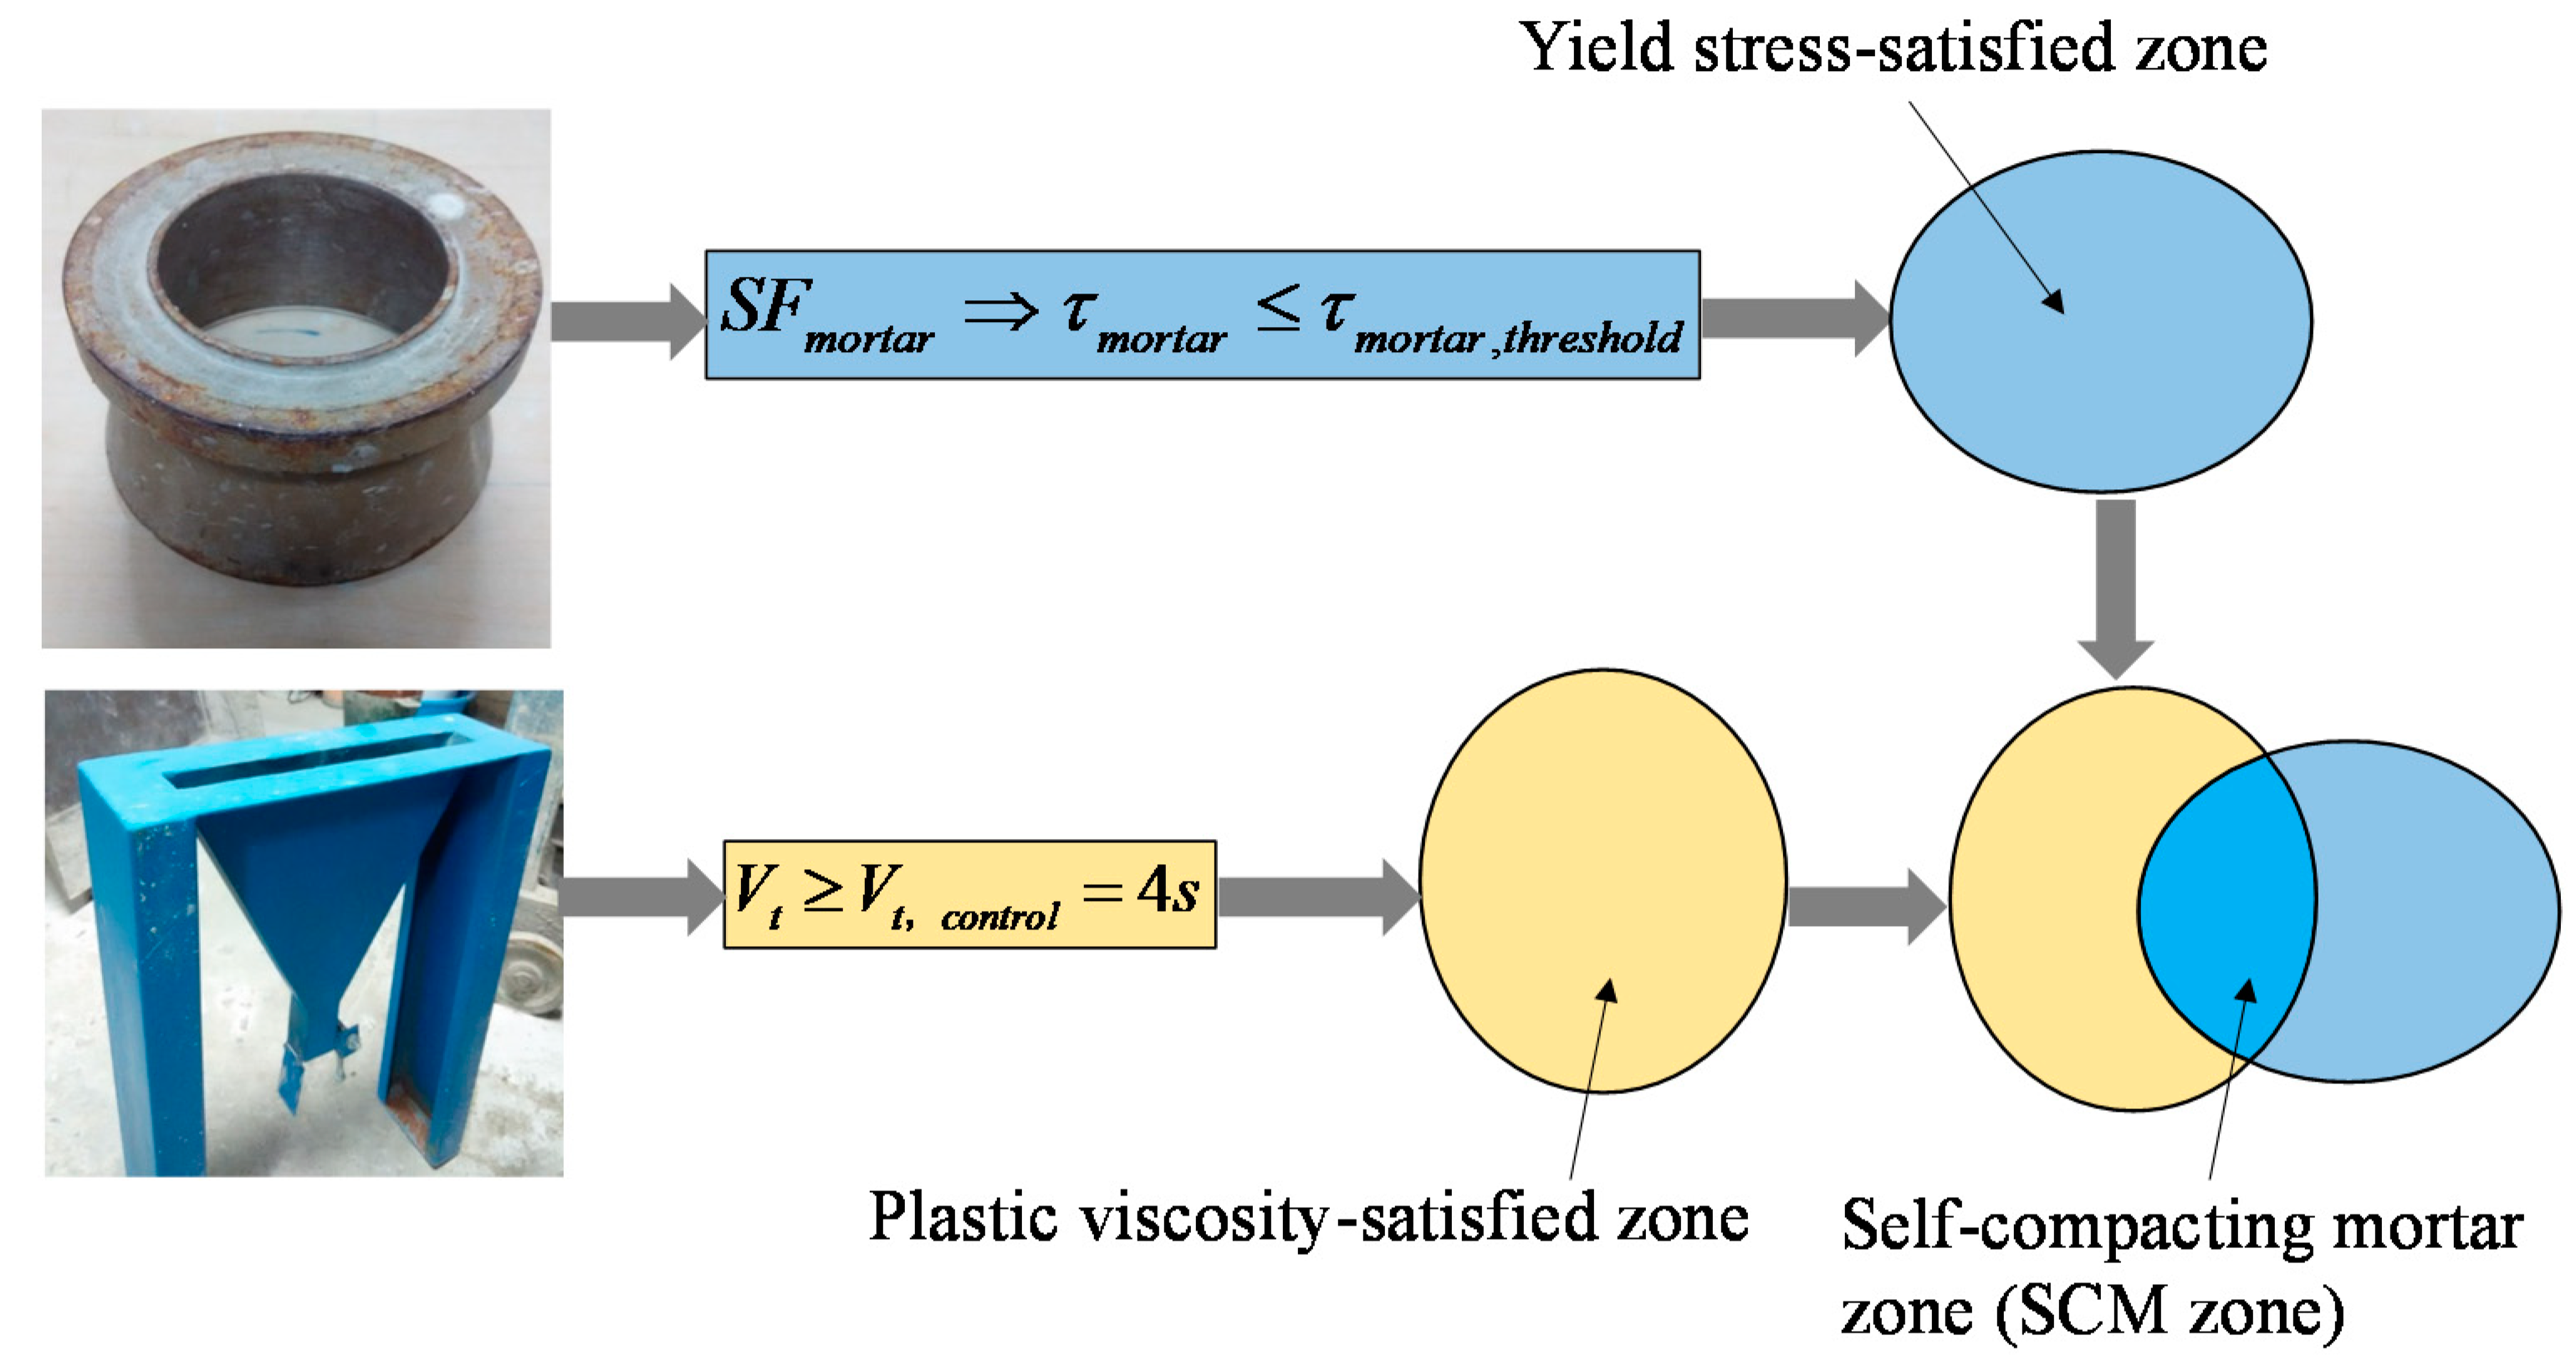
2.4. Mortar Rheology Threshold Theory

The workability of mortar can be determined by conducting slump flow (SFmortar) tests and V-funnel tests [10], as shown in Figure 3. The greater the SFmortar, the better the flowability of the fresh mortar. The V-funnel test measures the flow rate of a fresh mortar and is an index of the segregation resistance of mortar.
The yield stress of mortar can be calculated with Equation (12) because it is a Bingham fluid:
τ m o r t a r = 225 ρ m o r t a r g V m o r t a r 2 128 π 2 ( S F m o r t a r / 2 ) 5 λ ( S F m o r t a r / 2 ) 2 V c o n e
where τmortar is the yield stress of a mortar; ρmortar is the density of a mortar; g equals 9.81 m/s2; Vmortar represents the volume of the mortar slump flow cone; SFmortar is the final slump flow of mortar.
Then, the criterion [9] of the yield stress of mortar can be determined from Equation (13):
τ m o r t a r τ m o r t a r , t h r e s h o l d = 2 Δ ρ g r 2 3 δ m o r t a r
where τmortar, threshold is the threshold of yield stress for a mortar.
The results of the V-funnel test indicate plastic viscosity and segregation resistance. The greater the V-funnel time, the greater the plastic viscosity of the fresh mixture. The criterion [10] of the V-funnel test on mortar can be determined from Equation (14).
V t V t , c o n t r o l = 4 s
Figure 3 indicates the criteria for realizing the self-compacting mortar (SCM) zone. The fluidity is considered good if Equation (13) holds and the yield stress-satisfied zone is obtained. On the other hand, viscosity is considered good if the V-funnel time is no less than 4 s [10,59,60]. The plastic viscosity-satisfied zone is then obtained. The SCM zone is finally reached at the intersection of the yield stress-satisfied zone and the plastic viscosity-satisfied zone. A good SCC can be obtained by adding a certain amount of gravel into mortar within the SCM zone. Based on the mortar rheology threshold theory, the effects of sand shape on the rheological relationship between mortar and paste can be studied without concrete tests, and the SCM zone can be predicted based on the rheological relationship between mortar and paste.

3. Results

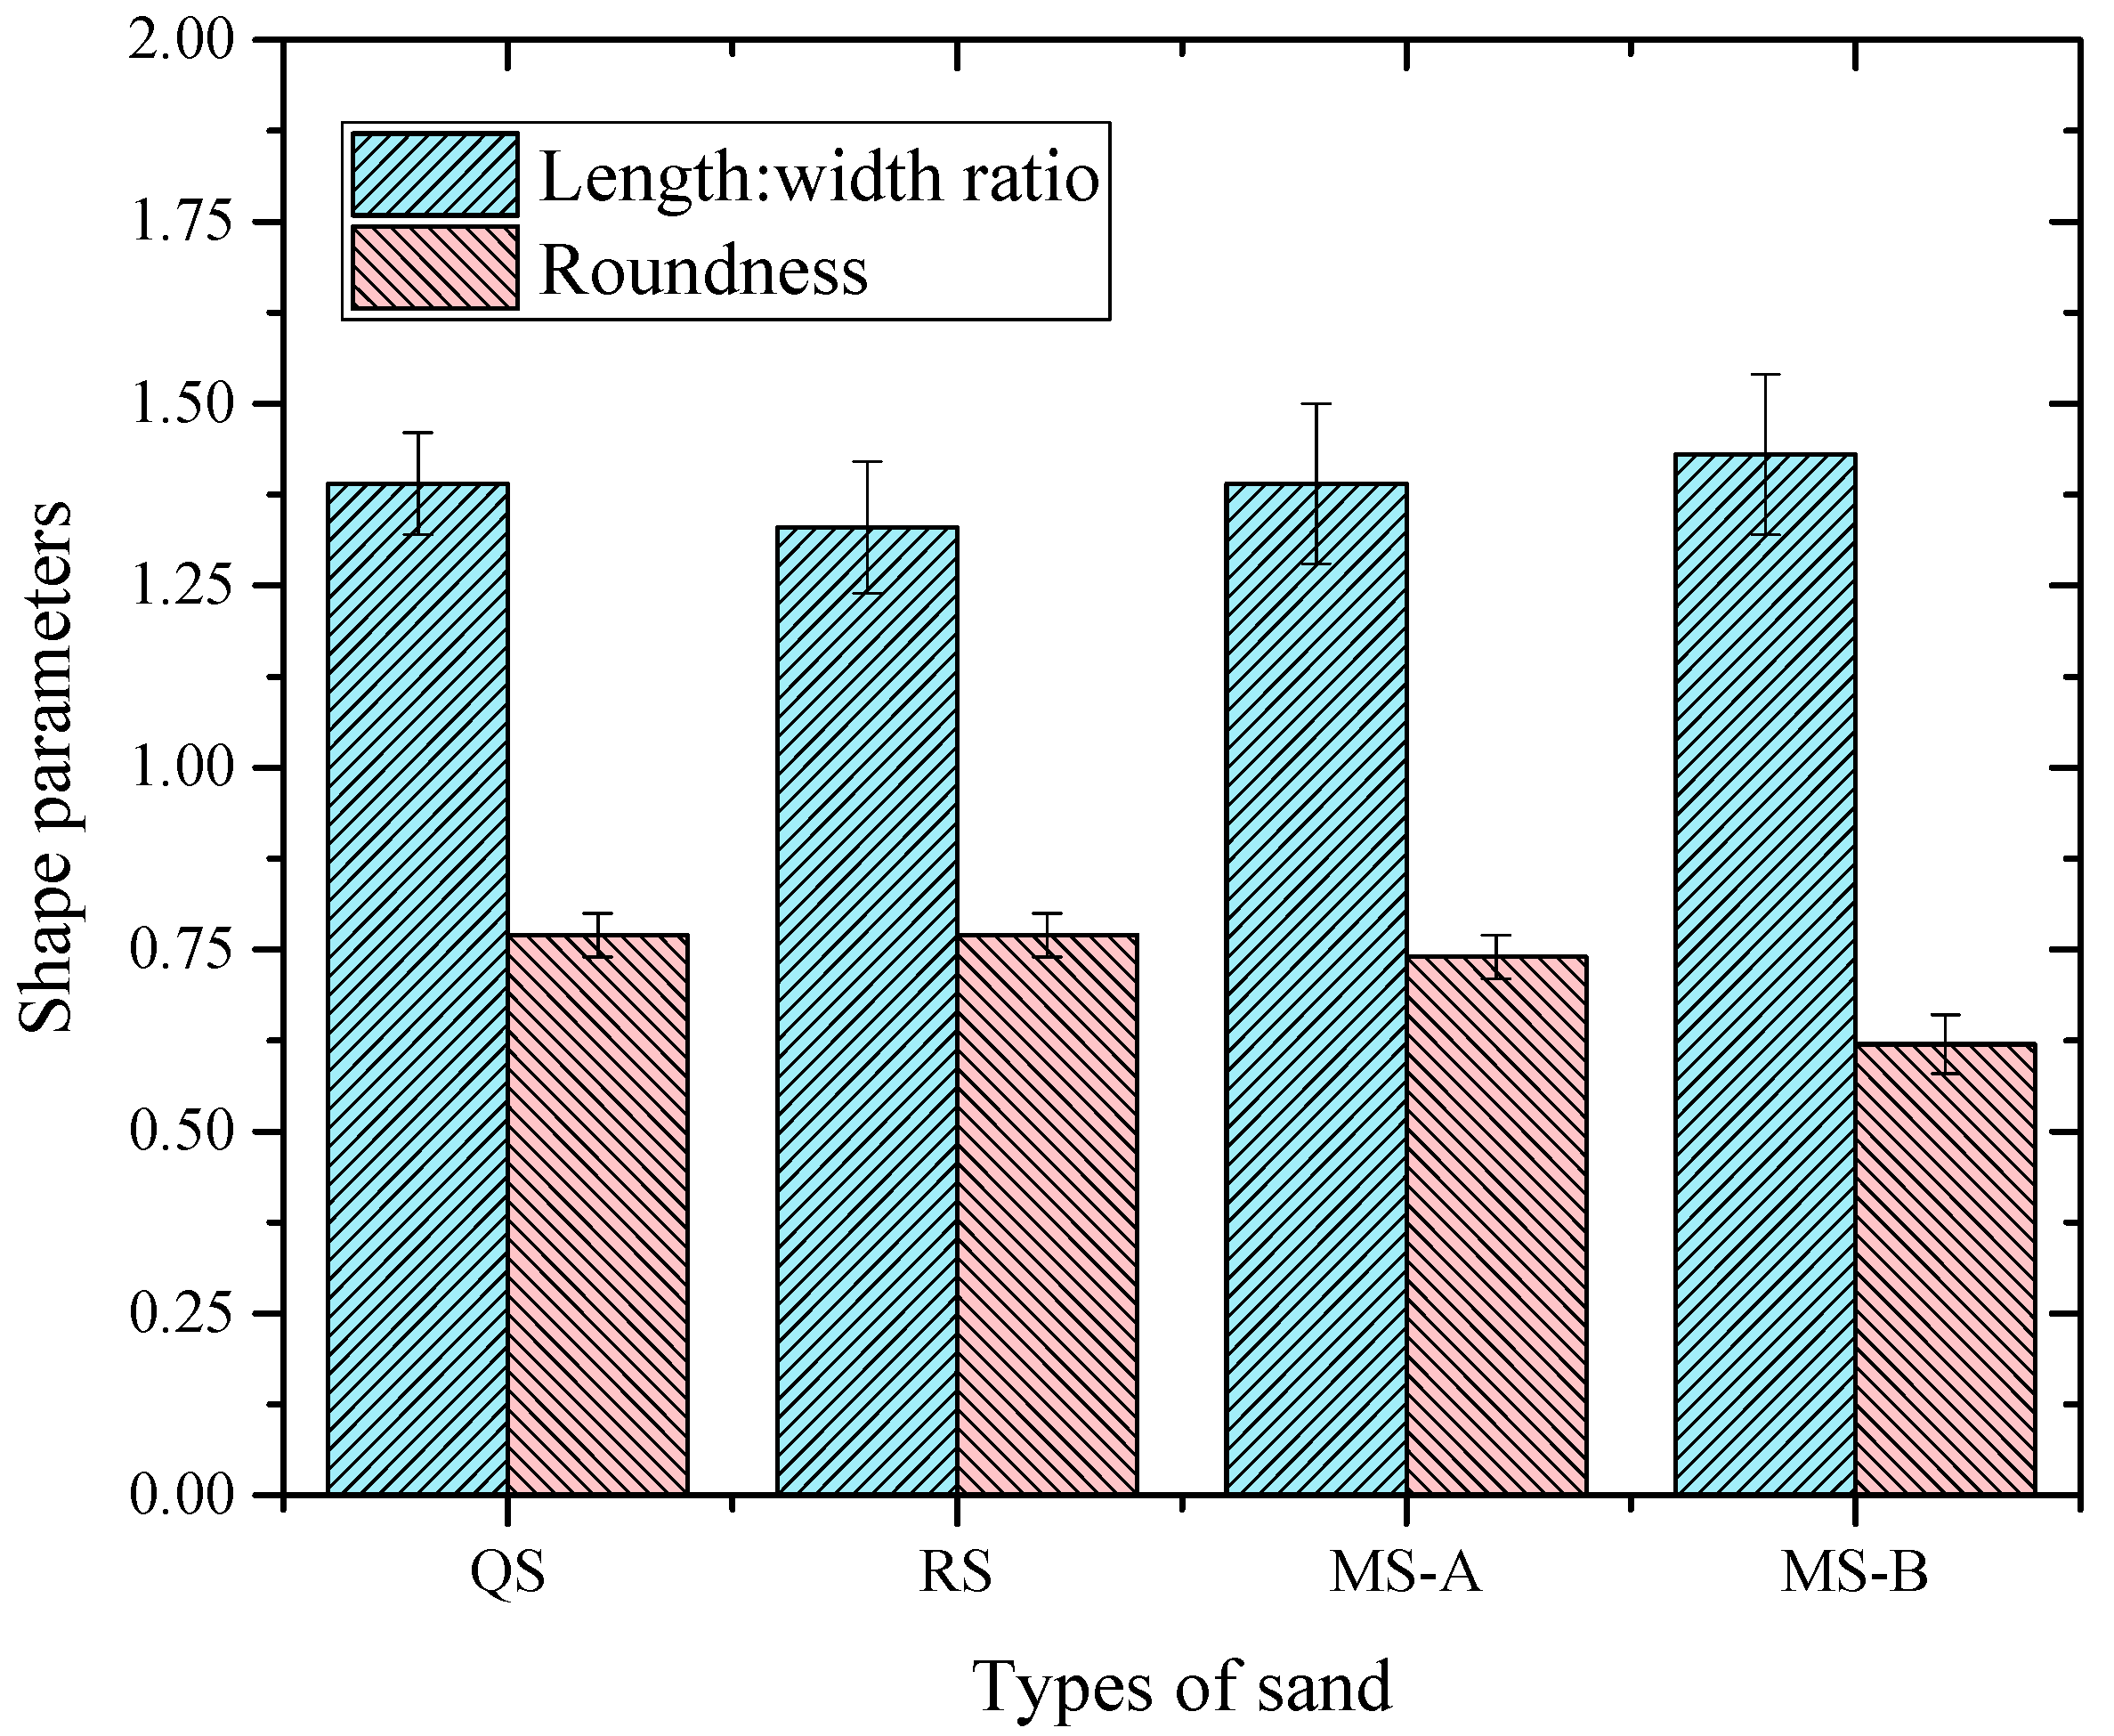
3.1. Particle Shape Parameters

A total of 913 sand particles were measured, comprising 188 QS particles, 141 RS particles, 273 MS-A particles, and 311 MS-B particles. Particle shape parameters such as the length:width ratio (α) and roundness (R) were obtained. A comparison of the four kinds of sand is illustrated in Figure 4. The length:width ratio increased gradually from 1.33 for RS to 1.43 for MS-B, with QS exhibiting a ratio of 1.39. The length:width ratio of QS was larger than that of RS and the specific gravity for QS was greatest among the four. Sands with a larger length:width ratio had lower roundness. The roundness decreased in the order QS ≈ RS > MS-A > MS-B.

3.2. Mortars with Four Kinds of Sands

Mortars with the four kinds of sand were made based on the same paste. Only the sand type was changed in the four kinds of mortars. In order to ensure that the moisture conditions of sand were the same, sands were oven-dried (OD). Dry sand can absorb water from paste; thus, the real VW/VC of the mortar will decrease. The proportions of mortars (1.3 L) and the results of the slump flow test and V-funnel test on mortars are shown in Table 1.
By adding additional water to make the sands reach the saturated surface-dried (SSD) conditions, a new set of mortars was made with the same VW/VC as mortars in OD conditions, as shown in Table 2. The additional water was back-calculated from the OD conditions to the SSD conditions according to the sand water absorption. The equation is as follows.
m w = m s × A b s %
where mw is the additional water needed to make sure that [VW/VC]SSD and [VW/VC]OD are equal, ms is the mass of sand, and Abs% is the water absorption of sand.

3.3. Pastes and Mortars with RS and MS-A in SSD Conditions

Considering the influence of water absorption on the rheological properties of mortars, the following tests on the mortars were carried out in SSD conditions. The paste compositions were changed by adjusting VW/VC and SP%. The experimental variables were combined to form the test matrix. Three VW/VC values, 0.90, 0.96, and 1.02, were used, and three different superplasticizer dosages, 0.8%, 0.9%, and 1.0% by weight of cement, were chosen from within the range suggested by the manufacturer. Nine groups of paste mini-SF test results (SFpaste and T200) were obtained. The thresholds for the rheological characteristics (τthreshold and ηthreshold) can be calculated from Equations (5) and (9) based on the assumption that the gravel content was set to 300 L/m3, and the sand content was set to 45% of the resulting mortar volume in the SCCs. The relevant paste rheology (τpaste and ηpaste) was calculated with Equations (10) and (11), and the results are listed in Table 3.

4. Analysis and Discussion

4.1. Effect of Sand Water Absorption on Mortar Rheological Properties

Slump flows of mortars with various kinds of sand decreased in the order M-QS(OD) > M-RS(OD) > M-MSA(OD) > M-MSB(OD), as shown in Figure 5, an order that differed from that for the length:width ratio and roundness of the various types of sands. The trend in slump flows of different mortars in the SSD conditions was similar to that in the OD conditions. The slump flow of mortar for the same sand in the SSD conditions was greater than that in the OD conditions.
The V-funnel time increased in the order M-QS(OD) < M-RS(OD) < M-MSA(OD) < M-MSB(OD), as shown in Figure 6. The trend in V-funnel time of different mortars in the SSD conditions was similar to that in the OD conditions. However, this trend was opposite to the change rule of slump flow. The V-funnel time of mortar for the same sand in SSD conditions was less than that in OD conditions.
The differences in slump flow and V-funnel time between two different moisture conditions were related to the water absorption of sands. The water absorption of different types of sand increased from 0.35% to 2.30%. Some water was absorbed by sand in OD conditions to reach SSD conditions; therefore, the effective VW/VC decreased, which led to the decrease in slump flow and the increase in V-funnel time. In other words, the decrease in effective VW/VC led to the increase in yield stress and the plastic viscosity of mortars. For the SSD conditions, there was more water to cover the sand particles, and water film thickness had a major effect on the rheology of the mortar [61]. It should be noted that the density and shape parameters of the four kinds of sand were also different, which also affected the rheological properties of mortars.

4.2. Effect of Sand Density on Mortar Rheological Properties

Due to the difference in mass and density of sand in each group of mortar, the relationship between the rheology of mortar and the volume ratio of paste and sand (Vpaste/Vsand) is discussed. Based on the definition of Vpaste/Vsand, the Vpaste/Vsand is directly proportional to the density of sand. The density of QS was much higher than other sands, the volume ratio of paste and sand is the largest. However, there was no obvious linear relationship between slump flow or V-funnel time and Vpaste/Vsand, as shown in Figure 7a,b. This is because of the nature of the RS particles. Mortar using RS had a larger slump flow and smaller V-funnel time as a result of the particles of RS being nearly spherical.
When the particle shape of sand is similar, the rheological properties of mortar are positively related to the densities of sand. When the densities of sands are similar, the rheological properties of mortars are related to sand particle shape. The closer the shape of the sand particle becomes to a spherical form, the larger the slump flow of mortar and the smaller the V-funnel time. Considering that it is difficult to distinguish the influence of sand shape and density on mortar rheology, both of them were considered in this study.

4.3. Relationship between Mortar Rheological Results and Shape–Weight Parameters

To consider the compound effects of sand shape and density on mortar rheology, two forms of shape–weight parameters were defined. One is the ratio of length:width and specific gravity (LWS). The other is the product of roundness and specific gravity (ROS).
L W S = ( l e n g t h : w i d t h ) s p e c i f i c   g r a v i t y
R O S = r o u n d n e s s × ( s p e c i f i c   g r a v i t y )
where length:width represents the weighted average length:width ratio of the entire sample of sand, roundness represents the weighted average roundness of the sand, specific gravity means the specific gravity of sand.
Table 4 shows the shape parameters and the test results for mortar of four kinds of sands in SSD conditions.
The slump flow values had been plotted as a function of the length:width ratios, and the regression analysis indicated a negative but weak linear correlation between them. Additionally, the V-funnel time values had been plotted as a function of the length:width ratios, and regression analysis indicated a positive but weak linear correlation between the two values. The rheological properties of mortars are not only affected by the shape parameters of sand. There are different specific gravities for each type of sand; therefore, specific gravity was selected as one of the main variables. Furthermore, LWS was used as a variable and ROS was taken as another characteristic variable. The reason for this is that sand with a greater specific gravity occupies a smaller volume for a certain weight. Therefore, mortar with this variety of sand has a large percentage of paste, resulting in larger fluidity and smaller plastic viscosity. Moreover, the correlation between the slump flow and length:width ratio is negative, and the correlation between the V-funnel time and length:width ratio is positive. Therefore, LWS was used as a variable, as shown in Table 4. Additionally, the correlation between the slump flow and roundness is positive and the correlation between the V-funnel time and roundness is negative. Thus, ROS was used as another variable, as shown in Table 4.
Based on the data in Table 4, the slump flow values were plotted as a function of LWS in Figure 8a, and regression analysis indicated a negative but excellent linear correlation between them with R2 = 0.9329. Additionally, the V-funnel time values were plotted as a function of LWS in Figure 8b and regression analysis indicated a positive and excellent linear correlation between them with R2 = 0.9602. Furthermore, when ROS was plotted against the measured slump flow values (Figure 8c) and V-funnel times (Figure 8d), good linear correlations were also obtained (R2 = 0.9627 and R2 = 0.8099).
In summary, the different rheological properties between mortars based on the same paste can, to a large extent, be explained by the particle shape properties (length:width ratio and roundness) and specific gravity. Both the length:width ratio and roundness can be selected as parameters to characterize particle shape. Two kinds of compound shape–weight parameters (LWS and ROS) were defined to quantify the combined effects of these parameters on the rheological properties.

4.4. Comparison of SCP Zone and SCM Zones

The self-compacting paste zone (SCP zone) refers to the area where the paste meets the thresholds of paste rheological characteristics and satisfactory SCC can be created by adding sand and gravel. The SCP zone was determined according to the basic steps [57] shown in Figure 9. The necessary steps for determining the SCM zone are shown in Figure 3. The SCM zones for RS and MS-A were determined as the intersection of the zone that satisfies the yield stress threshold and the zone that satisfies the criterion of V-funnel time, as shown in Figure 9. The SCP zone represents the predicted zone based on paste rheological threshold theory, and the SCM zone for RS was derived from mortar tests with RS. Figure 9 indicates that the SCP zone coincided with the SCM zone for RS to the greatest extent, which indicates the good application of paste rheological threshold theory and mortar rheological threshold theory. It is reasonable for the criteria used for obtaining the SCM zone.
However, the SCM zone for MS-A coincided partially with the SCP zone, and the SCM zone for MS-A moved a distance to the right relative to the SCM zone for RS. RS and MS-A had the same mass and grading, but different particle shapes and specific gravity. More specifically, sands with different specific gravities have different shape properties such as LWS and ROS, and these make the SCM zones different.

4.5. Prediction of SCM Zone

Table 5 shows the paste rheological properties, shape–weight parameters, and mortar test results. SFmortar was used to quantify the yield stress of mortar and it was affected by the yield stress of paste, the particle shape of sand, and the specific gravity. Therefore, statistical analysis was carried out to quantify the effects of selected parameters (τpaste and LWS).
Equation (18) stems from the statistical analysis of the test results of 18 different mortars in Table 5:
S F m o r t a r = 5345.7 × τ p a s t e 10960.6 τ p a s t e × L W S + 374.5
where SFmortar is the final slump flow of mortar (mm), τpaste is the yield stress of a paste (Pa) and LWS represents the shape–weight parameter, which is the ratio of the length:width ratio and specific gravity.
The statistical Equation (18) had a root-mean-squared error of 13.5. The R square value was 0.81 and the p-value was less than 0.0005, which indicated an excellent prediction.
In addition to the plastic viscosity and the particle shape of sand, the yield stress of paste also affected the value of Vt. Therefore, statistical analysis was carried out to quantify the effects of selected parameters (τpaste, ηpaste, and LWS). Equation (19) resulted from the statistical analysis of the test results of 18 different mortars:
V t = 38.0 × τ p a s t e 6.8 × η p a s t e + 15.3 × η p a s t e × L W S 3.4
where Vt is the V-funnel time of mortar (s), τpaste is the yield stress of a paste, ηpaste is the plastic viscosity of a paste, and LWS is the ratio of length:width and specific gravity.
The statistical Equation (19) had a root-mean-squared error of 0.33. The R square value is 0.71 and the p-value is less than 0.05, which indicates a good prediction.
If LWS is replaced by ROS for the nonlinear regression, SFmortar can be expressed by a different nonlinear regression formula, as shown in Equation (20).
S F m o r t a r = 2496.4 τ p a s t e × L O S 5265.2 τ p a s t e + 374.5
The statistical Equation (20) had a root-mean-squared error of 13.5. The R square value was 0.81 and the p-value was less than 0.00001, which indicated an excellent prediction.
Then, Vt can be expressed by another nonlinear regression formula, as shown in Equation (21).
V t = 38.0 × τ p a s t e + 8.0 × η p a s t e 3.5 η p a s t e × L O S 3.4
The statistical Equation (21) had a root-mean-squared error of 0.63. The R square value was 0.71 and the p-value was less than 0.05, which indicated a good prediction.
Equations (18) and (20) are equivalent and Equations (19) and (21) are equivalent. These equivalencies are because LWS and ROS quantify sand type from different perspectives. Next, Equations (18) and (19) were selected for SCM zone prediction.
RS and MS-A have different particle shapes and specific gravities, and it is that which leads to different experimental results for mortars and different SCM zones. The results of mortars were predicted with Equations (18) and (19), and then the predicted SCM zone was obtained based on the steps for determining the SCM zone mentioned above. Compared with the experimental SCM zone for MS-A, it is apparent that the two SCM zones overlap considerably, as shown in Figure 10.
As stated above, the mortar experimental results verified the compound effect of sand particle shape and the specific gravity on the rheological properties of mortar. For a given sand type, the particle shape properties were measured with the Image Pro Plus 6.0 software package. Then, nine groups of paste mini-SF tests were conducted. Mortar rheological properties were predicted with Equations (18) and (19). Then, the predicted SCM zone for this kind of sand could be obtained based on the two criteria for obtaining the SCM zone.

5. Conclusions

In this work, we studied the effect of water absorption, sand particle shape, and specific gravity on the mortar rheological properties. Particle shape parameters for four kinds of sands were determined, and slump flow tests and V-funnel tests were carried out on their corresponding mortars. Additionally, a series of mortar tests and their corresponding paste tests were conducted using two kinds of sands, namely, RS and MS-A. The following conclusions were drawn from the obtained results:
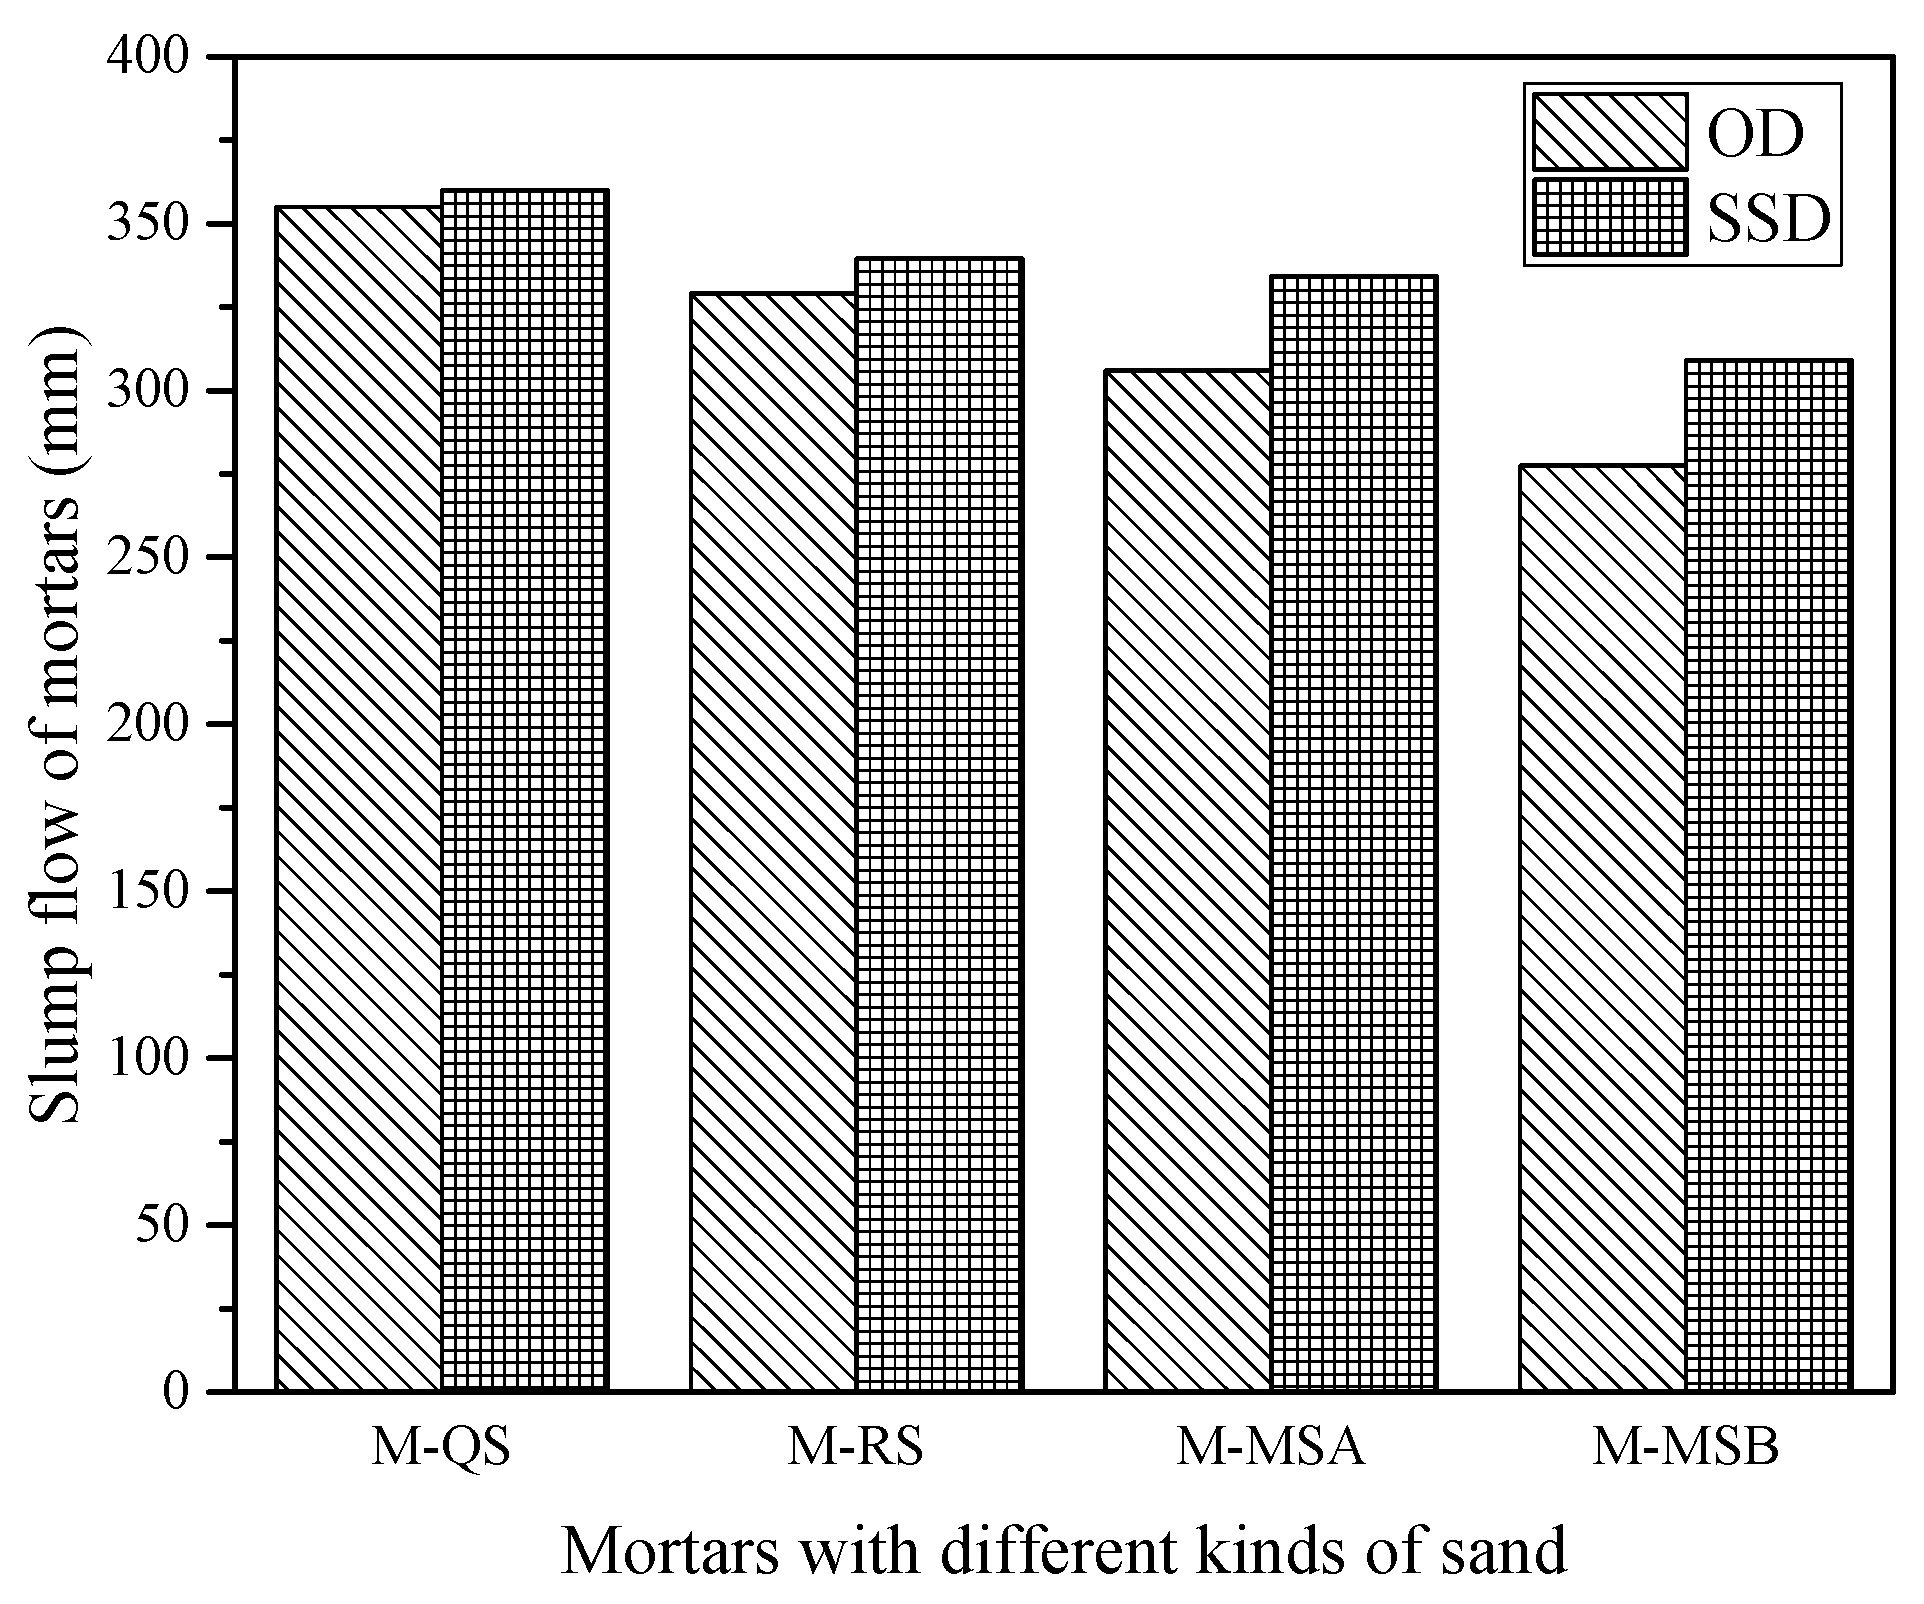
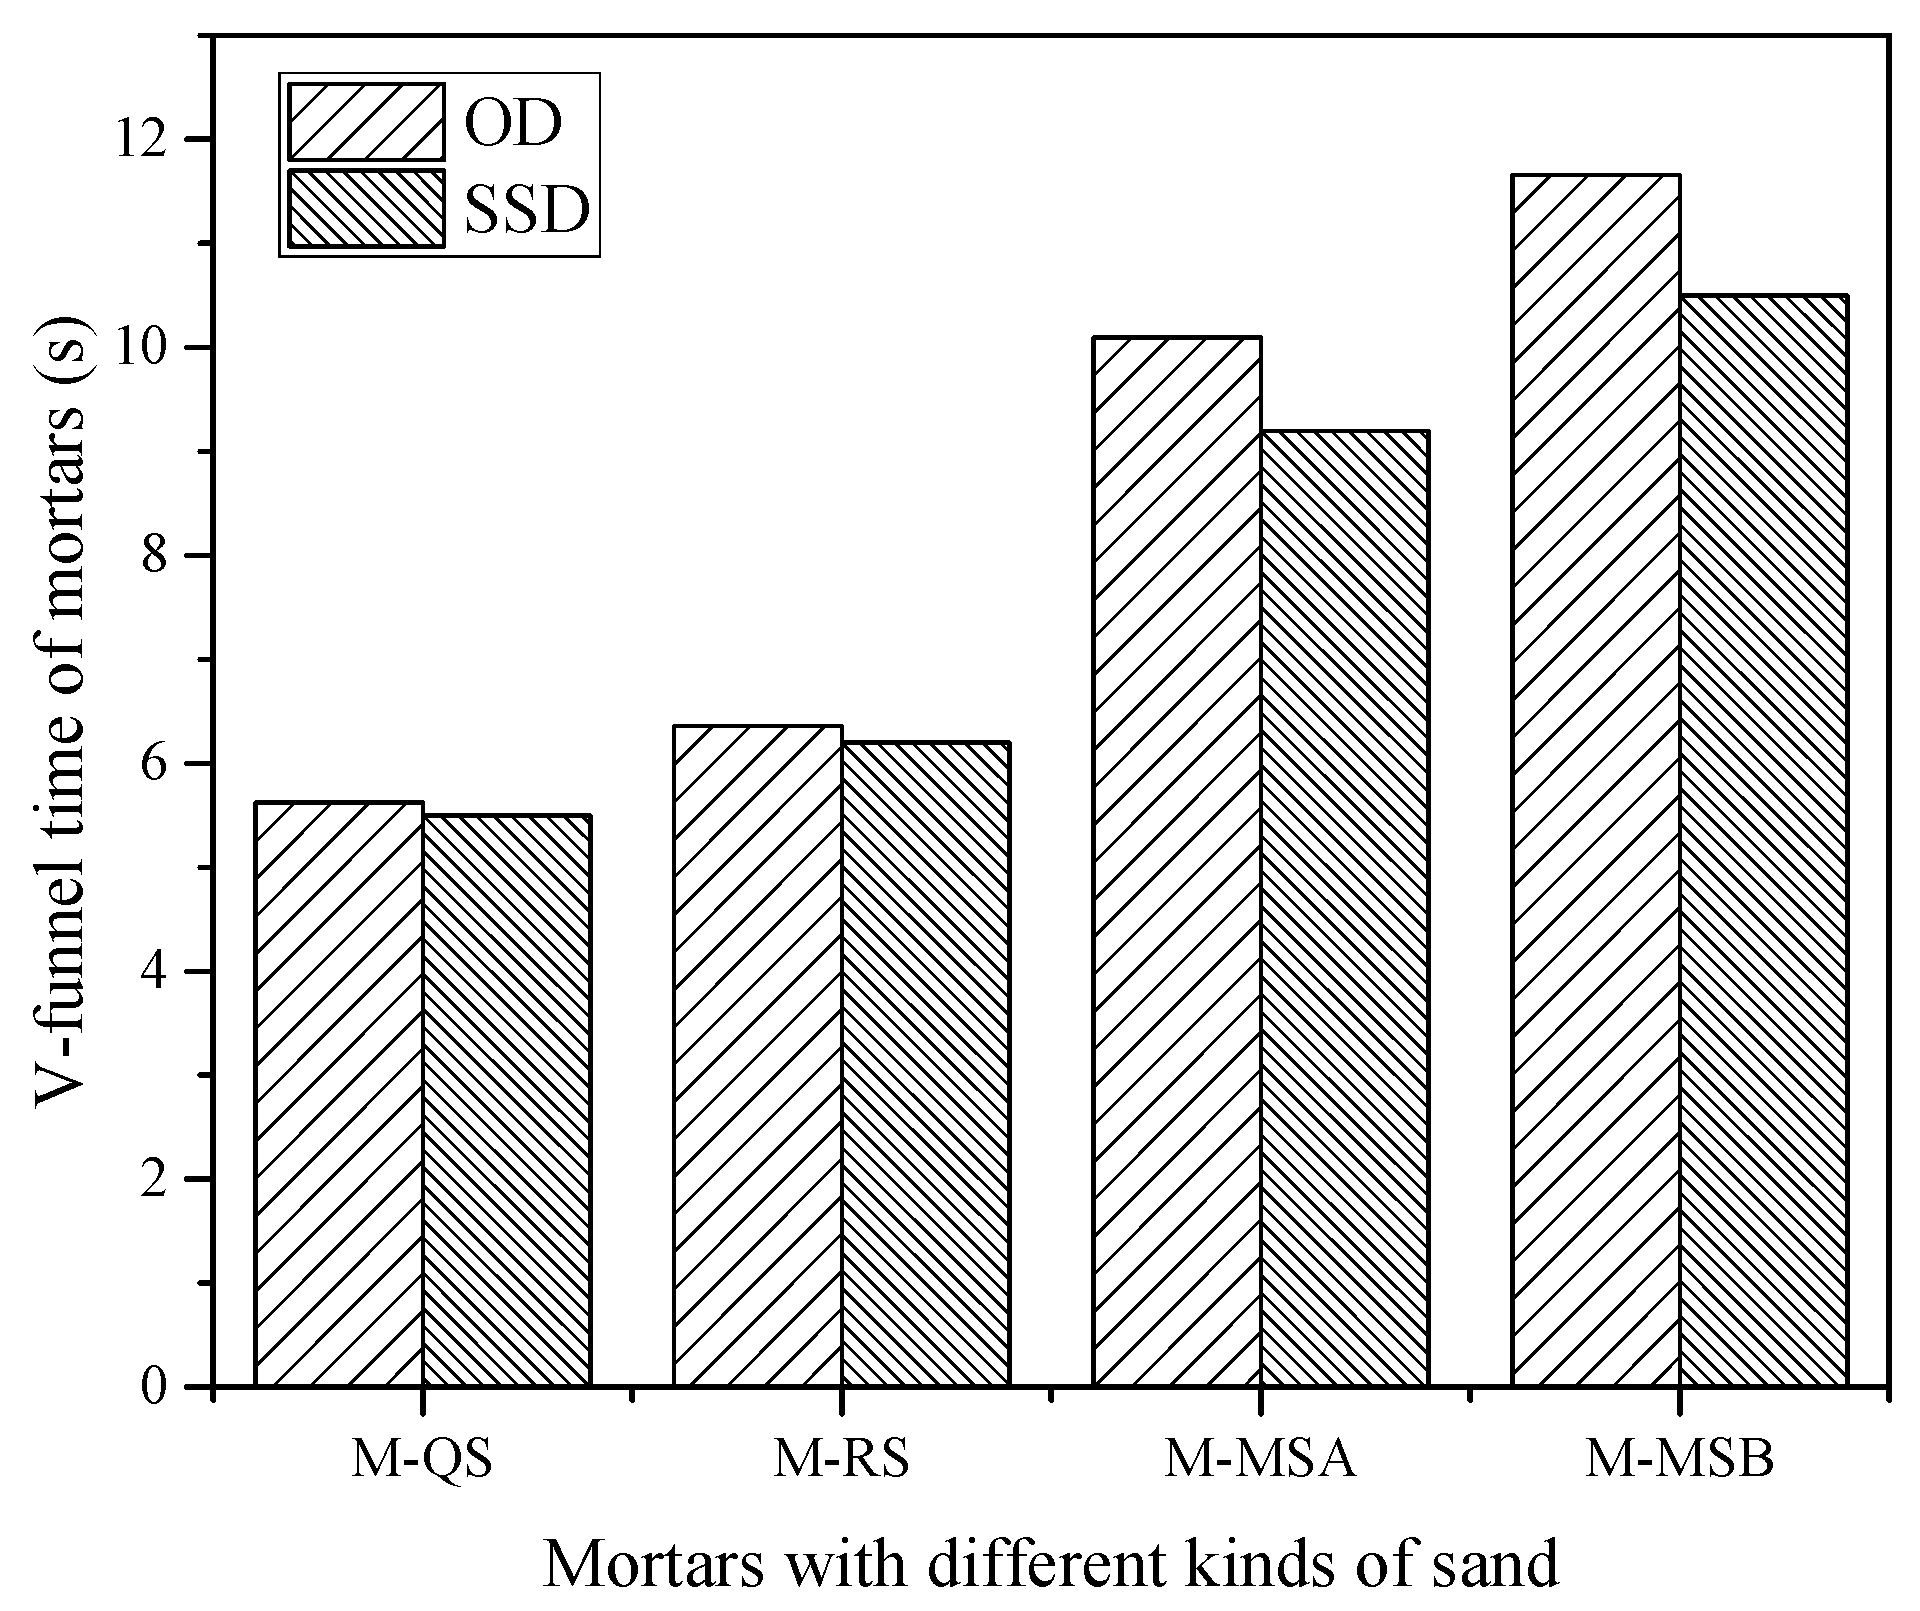
  • The changing trends in slump flows and V-funnel times of different mortars in the SSD conditions are similar to those in the OD conditions. The slump flow of mortar for the same sand in SSD conditions is greater than that in OD conditions, whereas the V-funnel time of mortar for the same sand in SSD conditions is less than that in OD conditions. The effect of different water absorption of different sands on mortar rheology can be eliminated by conducting tests in SSD conditions;
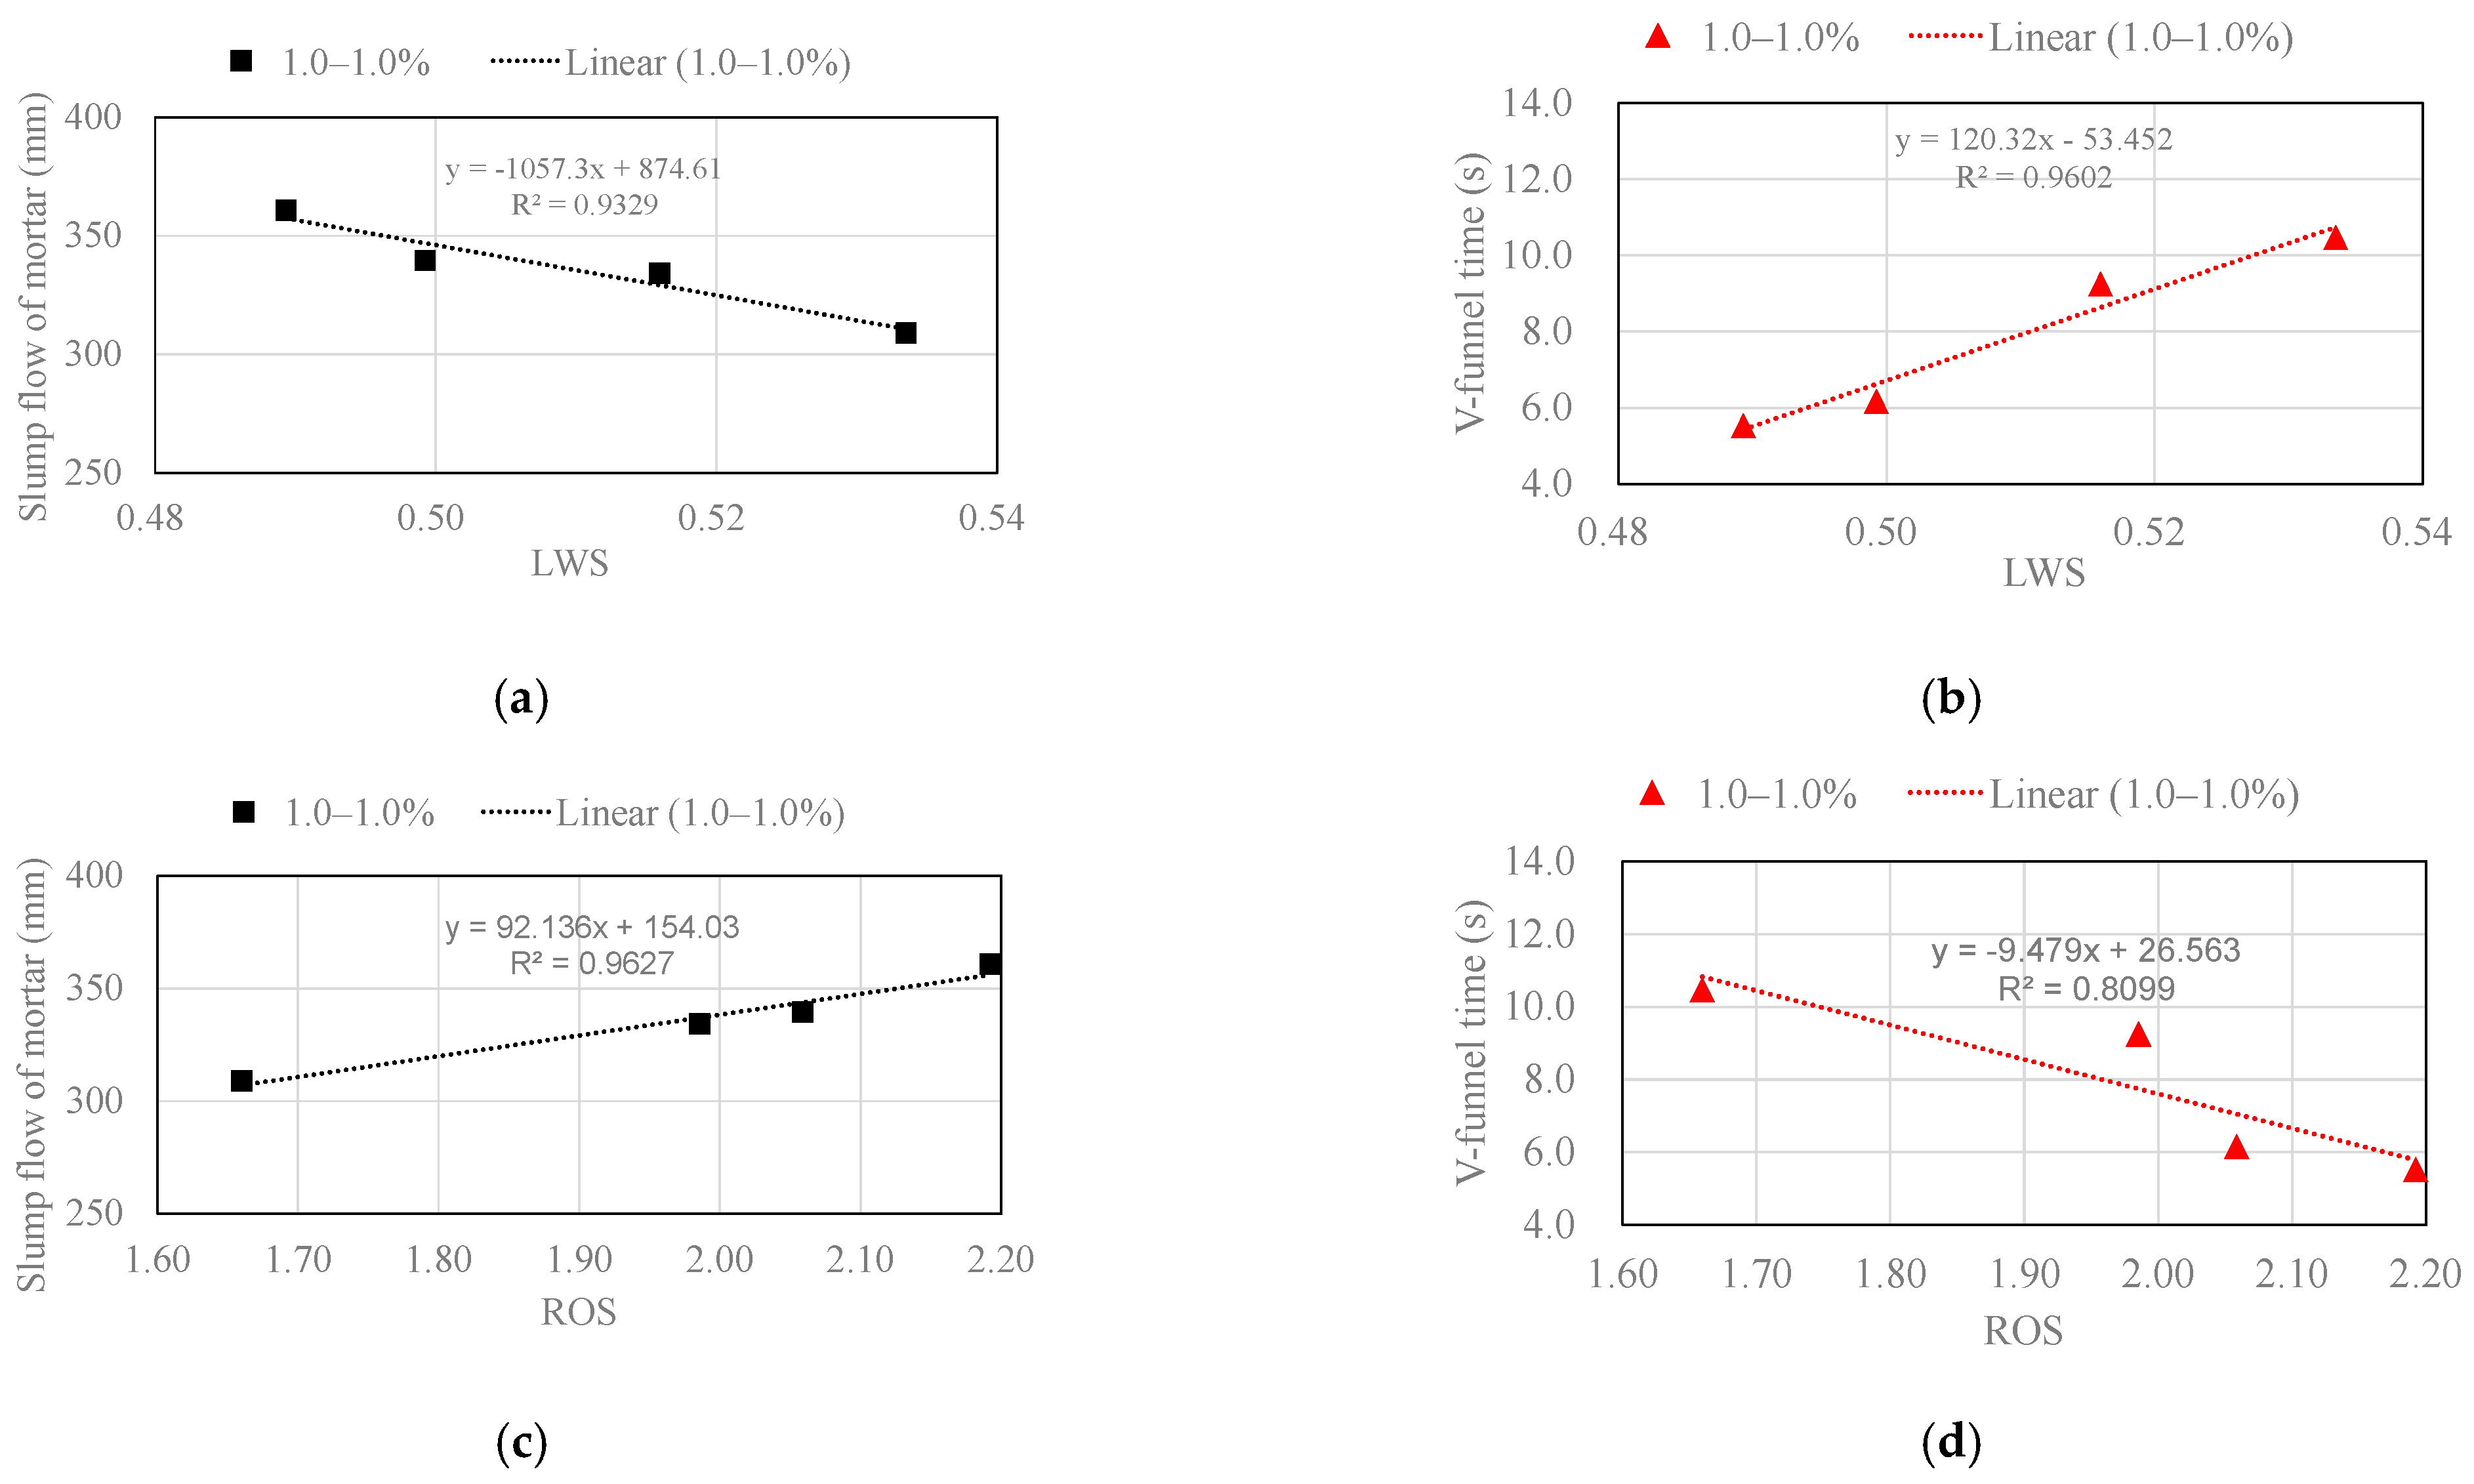
  • LWS and ROS were selected to quantify the compound effects of sand type on mortar rheology. Regression analysis showed an excellent linear correlation between slump flow and LWS, with R2 = 0.9863, or ROS, with R2 = 0.9286. A very good linear correlation also existed between V-funnel time and LWS, with R2 = 0.9625, or ROS, with R2 = 0.8159;
  • The substantial overlap between the SCP zone and the SCM zone for RS indicated the validity of paste rheological threshold theory and mortar rheological threshold theory for obtaining the SCM zone;
  • Based on the particle shape–weight parameters, the rheological properties of mortars could be predicted. Based on the mortar rheological threshold theory, the SCM zone can be drawn. The predicted SCM zone overlapped considerably with the experimental SCM zone for MS-A.

Author Contributions

Conceptualization, J.Z., S.Y. and X.A.; methodology, J.Z. and S.Y.; validation, J.Z., S.Y. and M.L.; formal analysis, P.L.; investigation, S.Y. and B.Q.; resources, B.Q. and W.L.; data curation, B.Q.; writing—original draft preparation, J.Z.; writing—review and editing, D.S. and P.L.; visualization, M.L.; supervision, X.A. and D.S.; project administration, W.L.; funding acquisition, S.Y. and J.Z. All authors have read and agreed to the published version of the manuscript.

Funding

This research was supported by the Fundamental Research Funds for the Central Universities (B210201012), the Jiangsu Planned Projects for Postdoctoral Research Funds (2021K055A), the National Natural Science Foundation of China (No. 52109153 and No. 51909280), the Key Science and Technology Projects in Transportation Industry (2018-MS2-051), and the Foundation of Chongqing Education Commission (KJQN201800741).

Institutional Review Board Statement

Not applicable.

Informed Consent Statement

Not applicable.

Data Availability Statement

The data presented in this study are available on request from the corresponding author. The data are proprietary or confidential in nature and may only be provided with restrictions.

Conflicts of Interest

The authors declare no conflict of interest.

References

  1. Okamura, H.; Ouchi, M. Self-compacting concrete. J. Adv. Concr. Technol. 2003, 1, 5–15. [Google Scholar] [CrossRef]
  2. An, X.; Wu, Q.; Jin, F.; Huang, M.; Zhou, H.; Chen, C.; Liu, C. Rock-filled concrete, the new norm of SCC in hydraulic engineering in China. Cem. Concr. Compos. 2014, 54, 89–99. [Google Scholar] [CrossRef]
  3. Banfill, P.F.G. Rheology of Fresh Cement and Concrete: Proceedings of an International Conference. Liverpool, 1990; CRC Press: Boca Raton, FL, USA, 1990. [Google Scholar]
  4. Saak, A.W.; Jennings, H.M.; Surendra, P.S. New Methodology for Designing Self-Compacting Concrete. Mater. J. 2001, 98, 429–439. [Google Scholar]
  5. Bui, V.K.; Akkaya, Y.; Shah, S.P. Rheological Model for Self-Consolidating Concrete. Mater. J. 2002, 99, 549–559. [Google Scholar]
  6. Roussel, N. A Theoretical Frame to Study Stability of Fresh Concrete. Mater. Struct. 2006, 39, 81–91. [Google Scholar] [CrossRef]
  7. Chidiac, S.E.; Mahmoodzadeh, F. Plastic viscosity of fresh concrete—A critical review of predictions methods. Cem. Concr. Compos. 2009, 31, 535–544. [Google Scholar] [CrossRef]
  8. Hu, J.; Wang, K. Effect of coarse aggregate characteristics on concrete rheology. Constr. Build. Mater. 2011, 25, 1196–1204. [Google Scholar] [CrossRef]
  9. Wu, Q.; An, X. Development of a mix design method for SCC based on the rheological characteristics of paste. Constr. Build. Mater. 2014, 53, 642–651. [Google Scholar] [CrossRef]
  10. Zhang, J.; An, X.; Nie, D. Effect of fine aggregate characteristics on the thresholds of self-compacting paste rheological properties. Constr. Build. Mater. 2016, 116, 355–365. [Google Scholar] [CrossRef]
  11. Yang, S.; Zhang, J.; An, X.; Qi, B.; Shen, D.; Lv, M. Effects of fly ash and limestone powder on the paste rheological thresholds of self-compacting concrete. Constr. Build. Mater. 2021, 281, 122560. [Google Scholar] [CrossRef]
  12. Li, P.; Zhang, T.; An, X.; Zhang, J. An enhanced mix design method of self-compacting concrete with fly ash content based on paste rheological threshold theory and material packing characteristics. Constr. Build. Mater. 2020, 234, 117380. [Google Scholar] [CrossRef]
  13. Li, P.; Ran, J.; Nie, D.; Zhang, W. Improvement of mix design method based on paste rheological threshold theory for self-compacting concrete using different mineral additions in ternary blends of powders. Constr. Build. Mater. 2021, 276, 122194. [Google Scholar] [CrossRef]
  14. Geiker, M.R.; Brandl, M.; Thrane, L.N.; Nielsen, L.F. On the effect of coarse aggregate fraction and shape on the rheological properties of self-compacting concrete. Cem. Concr. Aggreg. 2002, 24, 3–6. [Google Scholar]
  15. Hu, J.; Wang, K. Effects of Size and Uncompacted Voids of Aggregate on Mortar Flow Ability. J. Adv. Concr. Technol. 2007, 5, 75–85. [Google Scholar] [CrossRef] [Green Version]
  16. Li, P.; Lu, W.; An, X.; Zhou, L.; Du, S. Effect of Epoxy Latexes on the Mechanical Behavior and Porosity Property of Cement Mortar with Different Degrees of Hydration and Polymerization. Materials 2021, 14, 517. [Google Scholar] [CrossRef] [PubMed]
  17. Bajad, M.N.; Sakhare, S. Influence of artificial sand on the properties of concrete and mortar. Int. J. Civ. Eng. Technol. 2018, 9, 447–454. [Google Scholar]
  18. Cortes, D.D.; Kim, H.K.; Palomino, A.M.; Santamarina, J.C. Rheological and mechanical properties of mortars prepared with natural and manufactured sands. Cem. Concr. Res. 2008, 38, 1142–1147. [Google Scholar] [CrossRef]
  19. Harini, M.; Shaalini, G.; Dhinakaran, G. Effect of size and type of fine aggregates on flowability of mortar. KSCE J. Civ. Eng. 2011, 16, 163–168. [Google Scholar] [CrossRef]
  20. Zeghichi, L.; Benghazi, Z.; Baali, L. The Effect of the Kind of Sands and Additions on the Mechanical Behaviour of S.C.C. Phys. Procedia 2014, 55, 485–492. [Google Scholar] [CrossRef] [Green Version]
  21. Ling, S.K.; Kwan, A.K.H. Adding ground sand to decrease paste volume, increase cohesiveness and improve passing ability of SCC. Constr. Build. Mater. 2015, 84, 46–53. [Google Scholar] [CrossRef]
  22. De Oliveira Haddad, L.D.; Neves, R.R.; De Oliveira, P.V.; Dos Santos, W.J.; De Carvalho Junior, A.N. Influence of particle shape and size distribution on coating mortar properties. J. Mater. Res. Technol. 2020, 9, 9299–9314. [Google Scholar] [CrossRef]
  23. Ren, Q.; De Schutter, G.; Jiang, Z.; Chen, Q. Multi-level diffusion model for manufactured sand mortar considering particle shape and limestone powder effects. Constr. Build. Mater. 2019, 207, 218–227. [Google Scholar] [CrossRef]
  24. Ren, Q.; Tao, Y.; Jiao, D.; Jiang, Z.; Ye, G.; De Schutter, G. Plastic viscosity of cement mortar with manufactured sand as influenced by geometric features and particle size. Cem. Concr. Compos. 2021, 122, 104163. [Google Scholar] [CrossRef]
  25. Wang, L.; Guo, F.; Lin, Y.; Yang, H.; Tang, S.W. Comparison between the effects of phosphorous slag and fly ash on the CSH structure, long-term hydration heat and volume deformation of cement-based materials. Constr. Build. Mater. 2020, 250, 118807. [Google Scholar] [CrossRef]
  26. Wang, L.; Jin, M.; Zhou, S.; Tang, S.; Lu, X. Investigation of microstructure of CSH and micro-mechanics of cement pastes under NH4NO3 dissolution by 29Si MAS NMR and microhardness. Measurement 2021, 185, 110019. [Google Scholar] [CrossRef]
  27. Tang, S.; Wang, Y.; Geng, Z.; Xu, X.; Yu, W.; Chen, J. Structure, fractality, mechanics and durability of calcium silicate hydrates. Fractal Fract. 2021, 5, 47. [Google Scholar] [CrossRef]
  28. Shen, D.; Wang, W.; Li, Q.; Yao, P.; Jiang, G. Early-age behaviour and cracking potential of fly ash concrete under restrained condition. Mag. Concr. Res. 2020, 72, 246–261. [Google Scholar] [CrossRef]
  29. Shen, D.; Liu, X.; Zhou, B.; Zeng, X.; Du, J. Influence of initial cracks on the frequency of a 60-year-old reinforced-concrete box beam. Mag. Concr. Res. 2021, 73, 121–134. [Google Scholar] [CrossRef]
  30. Shen, D.; Jiao, Y.; Kang, J.; Feng, Z.; Shen, Y. Influence of ground granulated blast furnace slag on early-age cracking potential of internally cured high performance concrete. Constr. Build. Mater. 2020, 233, 117083. [Google Scholar] [CrossRef]
  31. Mora, C.; Kwan, A.; Chan, H. Particle size distribution analysis of coarse aggregate using digital image processing. Cem. Concr. Res. 1998, 28, 921–932. [Google Scholar] [CrossRef]
  32. Kwan, A.K.; Mora, C.; Chan, H. Particle shape analysis of coarse aggregate using digital image processing. Cem. Concr. Res. 1999, 29, 1403–1410. [Google Scholar] [CrossRef]
  33. Mora, C.; Kwan, A. Sphericity, shape factor, and convexity measurement of coarse aggregate for concrete using digital image processing. Cem. Concr. Res. 2000, 30, 351–358. [Google Scholar] [CrossRef]
  34. Rao, C.; Tutumluer, E.; Kim, I.T. Quantification of coarse aggregate angularity based on image analysis. Transp. Res. Rec. 2002, 1787, 117–124. [Google Scholar] [CrossRef]
  35. Fletcher, T.; Chandan, C.; Masad, E.; Sivakumar, K. Aggregate imaging system for characterizing the shape of fine and coarse aggregates. Transp. Res. Rec. 2003, 1832, 67–77. [Google Scholar] [CrossRef] [Green Version]
  36. Marinoni, N.; Pavese, A.; Foi, M.; Trombino, L. Characterisation of mortar morphology in thin sections by digital image processing. Cem. Concr. Res. 2005, 35, 1613–1619. [Google Scholar] [CrossRef]
  37. Bouquety, M.N.; Descantes, Y.; Barcelo, L.; De Larrard, F.; Clavaud, B. Experimental study of crushed aggregate shape. Constr. Build. Mater. 2007, 21, 865–872. [Google Scholar] [CrossRef]
  38. Shen, D.; Liu, C.; Wang, M.; Kang, J.; Li, M. Effect of polyvinyl alcohol fiber on the cracking risk of high strength concrete under uniaxial restrained condition at early age. Constr. Build. Mater. 2021, 300, 124206. [Google Scholar] [CrossRef]
  39. Podczeck, F. A shape factor to assess the shape of particles using image analysis. Powder Technol. 1997, 93, 47–53. [Google Scholar] [CrossRef]
  40. Fernlund, J.M.R. Image analysis method for determining 3-D shape of coarse aggregate. Cem. Concr. Res. 2005, 35, 1629–1637. [Google Scholar] [CrossRef]
  41. Fernlund, J.M.R. 3-D image analysis size and shape method applied to the evaluation of the Los Angeles test. Eng. Geol. 2005, 77, 57–67. [Google Scholar] [CrossRef]
  42. Lin, C.L.; Miller, J.D. 3D characterization and analysis of particle shape using X-ray microtomography (XMT). Powder Technol. 2005, 154, 61–69. [Google Scholar] [CrossRef]
  43. Cepuritis, R.; Wigum, B.J.; Garboczi, E.J.; Mørtsell, E.; Jacobsen, S. Filler from crushed aggregate for concrete: Pore structure, specific surface, particle shape and size distribution. Cem. Concr. Compos. 2014, 54, 2–16. [Google Scholar] [CrossRef]
  44. Jamkar, S.S.; Rao, C.B.K. Index of Aggregate Particle Shape and Texture of coarse aggregate as a parameter for concrete mix proportioning. Cem. Concr. Res. 2004, 34, 2021–2027. [Google Scholar] [CrossRef]
  45. Westerholm, M.; Lagerblad, B.; Silfwerbrand, J.; Forssberg, E. Influence of fine aggregate characteristics on the rheological properties of mortars. Cem. Concr. Compos. 2008, 30, 274–282. [Google Scholar] [CrossRef]
  46. Hafid, H.; Ovarlez, G.; Toussaint, F.; Jezequel, P.H.; Roussel, N. Effect of particle morphological parameters on sand grains packing properties and rheology of model mortars. Cem. Concr. Res. 2016, 80, 44–51. [Google Scholar] [CrossRef]
  47. Shen, W.; Yang, Z.; Cao, L.; Cao, L.; Liu, Y.; Yang, H.; Lu, Z.; Bai, J. Characterization of manufactured sand: Particle shape, surface texture and behavior in concrete. Constr. Build. Mater. 2016, 114, 595–601. [Google Scholar] [CrossRef]
  48. Huang, Y.; Wang, L. Effect of Particle Shape of Limestone Manufactured Sand and Natural Sand on Concrete. Procedia Eng. 2017, 210, 87–92. [Google Scholar]
  49. Estephane, P.; Garboczi, E.J.; Bullard, J.W.; Wallevik, O.H. Three-dimensional shape characterization of fine sands and the influence of particle shape on the packing and workability of mortars. Cem. Concr. Compos. 2019, 97, 125–142. [Google Scholar] [CrossRef]
  50. Zhang, J.; An, X.; Yu, Y.; Nie, D. Effects of coarse aggregate content on the paste rheological thresholds of fresh self-compacting concrete. Constr. Build. Mater. 2019, 208, 564–576. [Google Scholar] [CrossRef]
  51. Toutou, Z.; Roussel, N. Multi Scale Experimental Study of Concrete Rheology: From Water Scale to Gravel Scale. Mater. Struct. 2006, 39, 189–199. [Google Scholar] [CrossRef]
  52. Krieger, I.M.; Dougherty, T.J. A mechanism for non-Newtonian flow in suspensions of rigid spheres. Trans. Soc. Rheol. 1959, 3, 137–152. [Google Scholar] [CrossRef]
  53. Roussel, N.; Stefani, C.; Leroy, R. From mini-cone test to Abrams cone test: Measurement of cement-based materials yield stress using slump tests. Cem. Concr. Res. 2005, 35, 817–822. [Google Scholar] [CrossRef]
  54. Chidiac, S.E.; Maadani, O.; Razaqpur, A.G.; Mailvaganam, N.P. Controlling the quality of fresh concrete—A new approach. Mag. Concr. Res. 2000, 52, 353–363. [Google Scholar] [CrossRef] [Green Version]
  55. Nie, D.; An, X. Optimization of SCC mix at paste level by using numerical method based on a paste rheological threshold theory. Constr. Build. Mater. 2016, 102, 428–434. [Google Scholar] [CrossRef]
  56. Nie, D.; An, X. Mini slump flow measurement tool based on self phase image processing. J. Tsinghua Univ. 2016, 56, 1249–1254. [Google Scholar]
  57. Zhang, J.; An, X.; Li, P. Research on a mix design method of self-compacting concrete based on a paste rheological threshold theory and a powder equivalence model. Constr. Build. Mater. 2020, 233, 117292. [Google Scholar] [CrossRef]
  58. Zhang, J.; Lv, M.; An, X.; Shen, D.; He, X.; Nie, D. Improved Powder Equivalence Model for the Mix Design of Self-Compacting Concrete with Fly Ash and Limestone Powder. Adv. Mater. Sci. Eng. 2021, 2021, 1–12. [Google Scholar]
  59. Chai, H.W. Design and testing of self-compacting concrete. Ph.D. Thesis, University of London, London, UK, 1998. [Google Scholar]
  60. Şahmaran, M.; Christianto, H.A.; Yaman, İ.Ö. The effect of chemical admixtures and mineral additives on the properties of self-compacting mortars. Cem. Concr. Compos. 2006, 28, 432–440. [Google Scholar] [CrossRef]
  61. Adjoudj, M.; Ezziane, K.; Kadri, E.H.; Soualhi, H. Study of the Rheological Behavior of Mortar with Silica Fume and Superplasticizer Admixtures According to the Water Film Thickness. KSCE J. Civ. Eng. 2018, 22, 2480–2491. [Google Scholar] [CrossRef]
Figure 1. Particle morphologies (2.5–5.0 mm) for (a) quartz sand, (b) river sand, (c) manufactured sand-A, and (d) manufactured sand-B.
Buildings 11 00441 g001
Figure 2. Process of obtaining the parameters of a sand particle.
Buildings 11 00441 g002
Figure 3. Criteria for obtaining the self-compacting concrete zone.
Buildings 11 00441 g003
Figure 4. Image analysis of four kinds of sand particles.
Buildings 11 00441 g004
Figure 5. Slump flows of mortars with four kinds of sands.
Buildings 11 00441 g005
Figure 6. V-funnel times of mortars with four kinds of sands.
Buildings 11 00441 g006
Figure 7. Relationship between rheological properties and Vpaste/Vsand: (a) V-funnel times vs. Vpaste/Vsand; (b) slump flows vs. Vpaste/Vsand.
Buildings 11 00441 g007
Figure 8. Relationship between rheological properties and shape–weight parameters: (a) SF vs. LWS, (b) V-funnel time vs. LWS, (c) SF vs. ROS, (d) V-funnel time vs. ROS.
Buildings 11 00441 g008
Figure 9. SCP zone and SCM zones for RS and MS-A.
Buildings 11 00441 g009
Figure 10. Comparison of predicted SCM zone and experimental SCM zone.
Buildings 11 00441 g010
Table 1. Mix proportions and experimental results of mortars for sands in OD conditions.
Mix ID *[VW/VC]ODSP%Cement (g)Water (g)SP (g)Sand (g)SF (mm)Vt (s)
M-QS(OD)1.01.01108.3348.511.081579.53555.62
M-RS(OD)1.01.01108.3348.511.081579.53296.36
M-MSA(OD)1.01.01108.3348.511.081579.530610.10
M-MSB(OD)1.01.01108.3348.511.081579.5277.511.66
* Note: The mixture ID is represented in the form of A-B(C), where A stands for mortar, B stands for sand used, and C stands for sand moisture conditions.
Table 2. Mix proportions for mortar for four kinds of sand.
Mix ID[VW/VC]SSDSP%Cement (g)Water + Additional Water (g)SP (g)Sand (g)SF (mm)Vt (s)
M-QS(SSD)1.01.01108.3348.5 + 5.511.081579.5360.05.50
M-RS(SSD)1.01.01108.3348.5 + 11.111.081579.5339.56.20
M-MSA(SSD)1.01.01108.3348.5 + 30.011.081579.5334.09.20
M-MSB(SSD)1.01.01108.3348.5 + 36.311.081579.5309.010.50
Table 3. Experimental results of pastes and mortars.
[VW/VC]SSDSP%Paste Rheological PropertiesM-RS(SSD)M-MSA(SSD)
SF
(mm)
T200
(s)
τthreshold
(Pa)
ηthreshold
(Pa·s)
τpaste
(Pa)
ηpaste
(Pa·s)
SFmortar
(mm)
Vt
(s)
SFmortar
(mm)
Vt
(s)
0.900.802984.241.2017.20.6255.423914.9811544.84
0.900.902893.961.2017.20.7251.729310.5314430.24
0.901.003063.441.2017.20.5444.930310.1116918.08
0.960.802883.811.1918.30.7249.12988.3214521.23
0.960.903133.001.1918.30.5038.83237.8123110.36
0.961.003382.021.1918.30.3526.23256.902868.90
1.020.802903.221.1819.30.7140.93116.542296.49
1.020.903312.261.1819.30.3428.63306.322796.70
1.021.003531.171.1819.30.2514.93365.973167.11
Table 4. Shape parameters and the test results of mortar of four kinds of sands (SSD).
[VW/VC]SSDSP%Sand TypeLength:Width RatioRoundnessSpecific GravityLWSROSSFmortar
(mm)
Vt (s)
1.01.0QS1.390.772.840.4892.19360.05.50
1.01.0RS1.330.772.670.4992.06339.56.20
1.01.0MS-A1.390.742.700.5161.99334.09.20
1.01.0MS-B1.430.622.680.5341.66309.010.50
Table 5. Shape–weight parameters of sands and the test results of mortars and pastes.
[VW/VC]SSDSP%τpaste (Pa)ηpaste (Pa·s)LWSROSSFmortar (mm)Vt (s)
0.900.800.6255.40.4992.0623914.98
0.900.900.7251.70.4992.0629310.53
0.901.000.5444.90.4992.0630310.11
0.960.800.7249.10.4992.062988.32
0.960.900.5038.80.4992.063237.81
0.961.000.3526.20.4992.063256.90
1.020.800.7140.90.4992.063116.54
1.020.900.3428.60.4992.063306.32
1.021.000.2514.90.4992.063365.97
0.900.800.6255.40.5161.9911544.84
0.900.900.7251.70.5161.9914430.24
0.901.000.5444.90.5161.9916918.08
0.960.800.7249.10.5161.9914521.23
0.960.900.5038.80.5161.9923110.36
0.961.000.3526.20.5161.992868.90
1.020.800.7140.90.5161.992296.49
1.020.900.3428.60.5161.992796.70
1.021.000.2514.90.5161.993167.11
Publisher’s Note: MDPI stays neutral with regard to jurisdictional claims in published maps and institutional affiliations.

