1. Introduction
In view of increasing climate changes, the building sector emphasises sustainability by using less energy-intensive materials to decrease the emission of carbon dioxide. In Denmark, there is a stimulus for using more wood in buildings compared with more traditional products such as bricks and concrete. Substituting more traditional products with wood products is considered more sustainable in regard to buildings [
1]. However, wood is an organic material, which is moisture sensitive and has a risk of being attacked by mould growth and decay.
Wood-frame structures consist of many different material layers, and often include a vapour barrier in the form of a polyethylene foil (PE-foil). Cold climate buildings have an outgoing vapour pressure, and the vapour barrier is installed in the building envelope towards the interior to protect the thermal insulation against vapour diffusion and exfiltration of warm humid air. Some people prefer to construct building envelope structures without vapour barriers of PE-foil, and to secure the thermal insulation of the building envelope by using, for example, board materials. It is well-known that moisture transport by diffusion is much smaller than by convection. For cold, ventilated attics, the use of vapour barrier in ceilings was investigated by Hansen and Møller [
2,
3]. The conclusion was that if the ceiling was airtight, the vapour barrier could be omitted; however, several other assumptions should be met [
4]. For ventilated attics, the exterior side of the thermal insulation is not protected by a material layer and an exterior vapour diffusion resistance does not exist compared with exterior walls, where a wind barrier is used to protect the thermal insulation from being wind washed, but at the same time contributes water vapour diffusion resistance. Prior studies [
2,
3] showed that ceilings that are sufficient airtight at the interior side can be constructed without a vapour barrier layer.
In Denmark, the general rule of thumb is that a vapour barrier must be airtight and at least 10 times more vapour-diffusion-tight compared with the wind barrier [
5], i.e., the ratio between the vapour diffusion resistance of the wind barrier and the vapour diffusion resistance of the vapour barrier is 1:10. Moreover, for some organic insulation materials, e.g., cellulose-based insulation, and in internal humidity classes 1 and 2, the ratio can be as low as 1:5 [
5,
6]. This rule of thumb is only practically applicable for similar climates as Denmark—e.g., in Finland, the exterior to interior ratio for single-family houses is typically in the range from 0 to 1:80; however, 1:5 is often not sufficient [
7]. In Belgium, these rules of thumb are ranging from 1:6 to 1:15 [
8]. Vinha [
7] described several wall configurations, where the interior to exterior ratio can be different, and Vanpachtenbeke et al. [
8] pointed out that seasonal vapour flow, such as winter and summer, can also influence this ratio, e.g., for brick veneer cladding.
The performance of an exterior wall depends on its structure and how the materials to control moisture and airtightness are designed, combined, composed, and gathered. Langmans et al. [
9] investigated the possibility of installing an air-tightness barrier on the exterior side of the structure instead of on the interior side. However, this design led to an increased risk of mould growth within the thermal insulated exterior wall, even though the ratio between the interior and exterior vapour-diffusion resistance was more than 1:10. Marincioni, Lorenzetti, and Altamirano-Medina [
10] performed a parameter study on wood-frame walls with an OSB board as wind barrier (18 GPa m
2 s/kg); when the water vapour diffusion resistance of the vapour control layer was below 30 GPa m
2 s/kg, the risk of mould growth on the OSB board increased. The wind–vapour barrier ratio was 1:1.6. This mould critical results were obtained for Heathrow, United Kingdom, a temperate maritime climate, which indicate that the ratio was too little. Pihelo and Kalamees [
11] investigated different wood-frame walls in internal humidity class 3 in Estonia with different insulation thicknesses and materials as well as different wind and air/vapour barriers. In most cases, the wind–vapour barrier ratio was more than 1:10; for those below 1:10, the design required additional insulation to be installed on the wind barrier to avoid mould growth.
The different studies investigated the wind–vapour barrier ratio by applying slightly different methodologies. Some studies have investigated the exfiltration of humid room air into the wall, others applied moisture penetration from the outside, and others also included experiments. Furthermore, all studies are conducted in different countries, where those located nearby geographically have very similar wind–vapour barrier ratios; colder climates, such as that of Finland, have larger ratios. Finally, the building style differs slightly, and the choice of materials also influences the water vapour diffusion resistance of the different layers in the wall. All these factors affect the evaluation and performance of the wood-frame walls; the boundary conditions, i.e., climate exposure, are conceived of as the dominant factor for the wall design and, by extension, the wind–vapour barrier ratio.
As buildings are designed to have a long service life, and the building envelope and its materials and components should have an equivalent service life. Rasmussen et al. [
12] performed artificial ageing tests on nine different air/vapour barrier systems of PE-foil and concluded that the standardised test method is not applicable for building with regards to lifetime. Therefore, it is uncertain if PE-foil and taped assemblies have a sufficient service life, as a number of the tested taped assemblies only lasted about 15–20 years. Based on these results, it is relevant to investigate the need for vapour barriers to protect against moisture transport into the building envelope. Furthermore, the traditional PE-foil constitutes the air-tightness layer and vapour barrier in one material. The PE-foil is a vulnerable material for penetration—first, during construction, and later, in the use of the building. Even small perforations in the PE-foil can contribute to a significant moisture transport [
13]. Therefore, it could be relevant to substitute the PE-foil with other building materials that are more robust during the construction phases.
The aim of this study is to investigate how the ratio between the water vapour diffusion resistance (Z
p-value) of the wind barrier and the vapour barrier influences the performance of an exterior wood-frame wall. The study considers five different internal humidity classes as described in DS/EN ISO 13788:2013 [
14] and the external climate for Lund in southern Sweden. Furthermore, the insulation material is changed to assess if different insulation material influences the wind–vapour barrier ratio. The overall aim of the study is to determine the wind–vapour barrier ratio required for wood-frame walls in Denmark. Furthermore, the NRC design for durability guideline [
15] is applied in this study and the procedure is evaluated.
2. Materials and Methods
A reference wood-frame wall, with a wind barrier located on the exterior side and a vapour barrier located on the interior side, was used to assess the moisture performance of an exterior wood-frame wall with different internal moisture loads, varying exterior climates, and different ratios between the wind barrier and the vapour barrier.
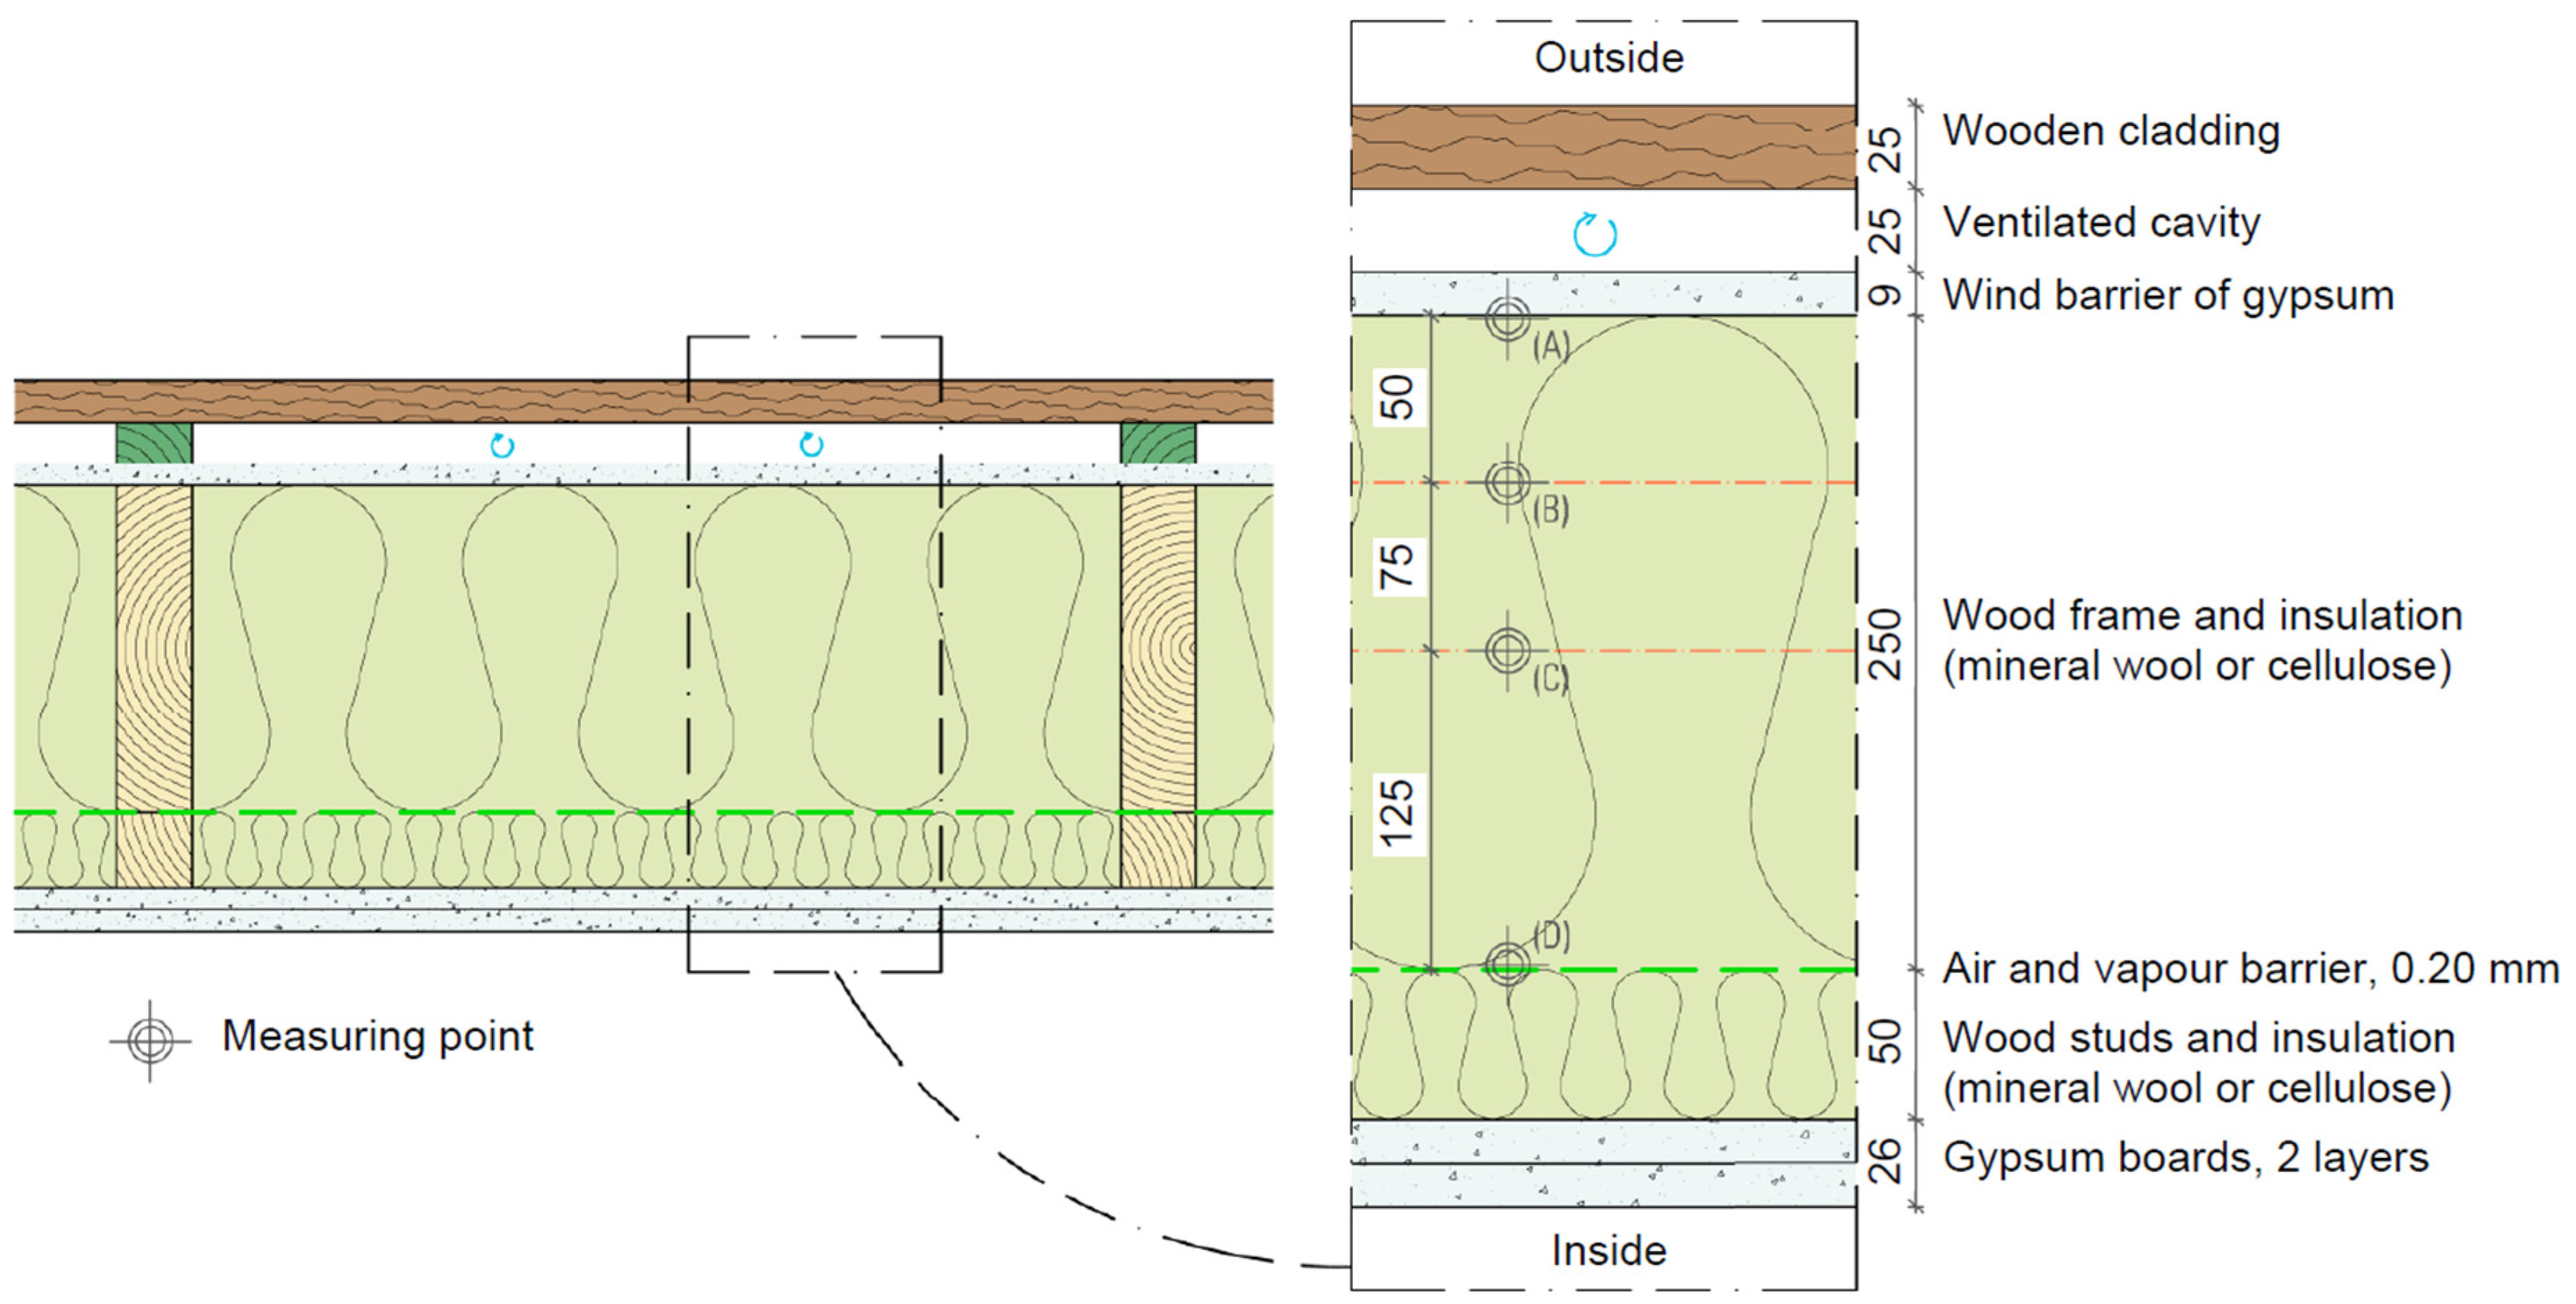
Figure 1 shows a section of the reference wall with the placement of the wind barrier and the air–vapour barrier. From the exterior, the wall is constructed with a 25-mm wooden cladding, 25-mm ventilated cavity, 9-mm wind barrier of gypsum, 250-mm thermal insulation (mineral wool or cellulose) within a wooden stud frame per 600 mm, 0.20-mm air–vapour barrier, 50-mm thermal insulation (mineral wool or cellulose) within wood studs, and 2 × 13 mm gypsum boards. This is a common exterior wood-frame wall structure in Denmark with a thermal transmittance of approx. 0.13 W/m
2K (mineral wool) and 0.14 W/m
2K (cellulose). However, the thermal transmittance of the wall depends on the number of additional studs installed due to the durability of windows, doors, corners, etc.
Four measuring points in the wall were considered, see
Figure 1.
Point A was located behind the wind barrier on the exterior side of the exterior wall;
Point B was located within the thermal insulation, 50 mm behind the wind barrier;
Point C was located within the thermal insulation, 125 mm behind the wind barrier;
Point D was located just on the exterior side of the air–vapour barrier.
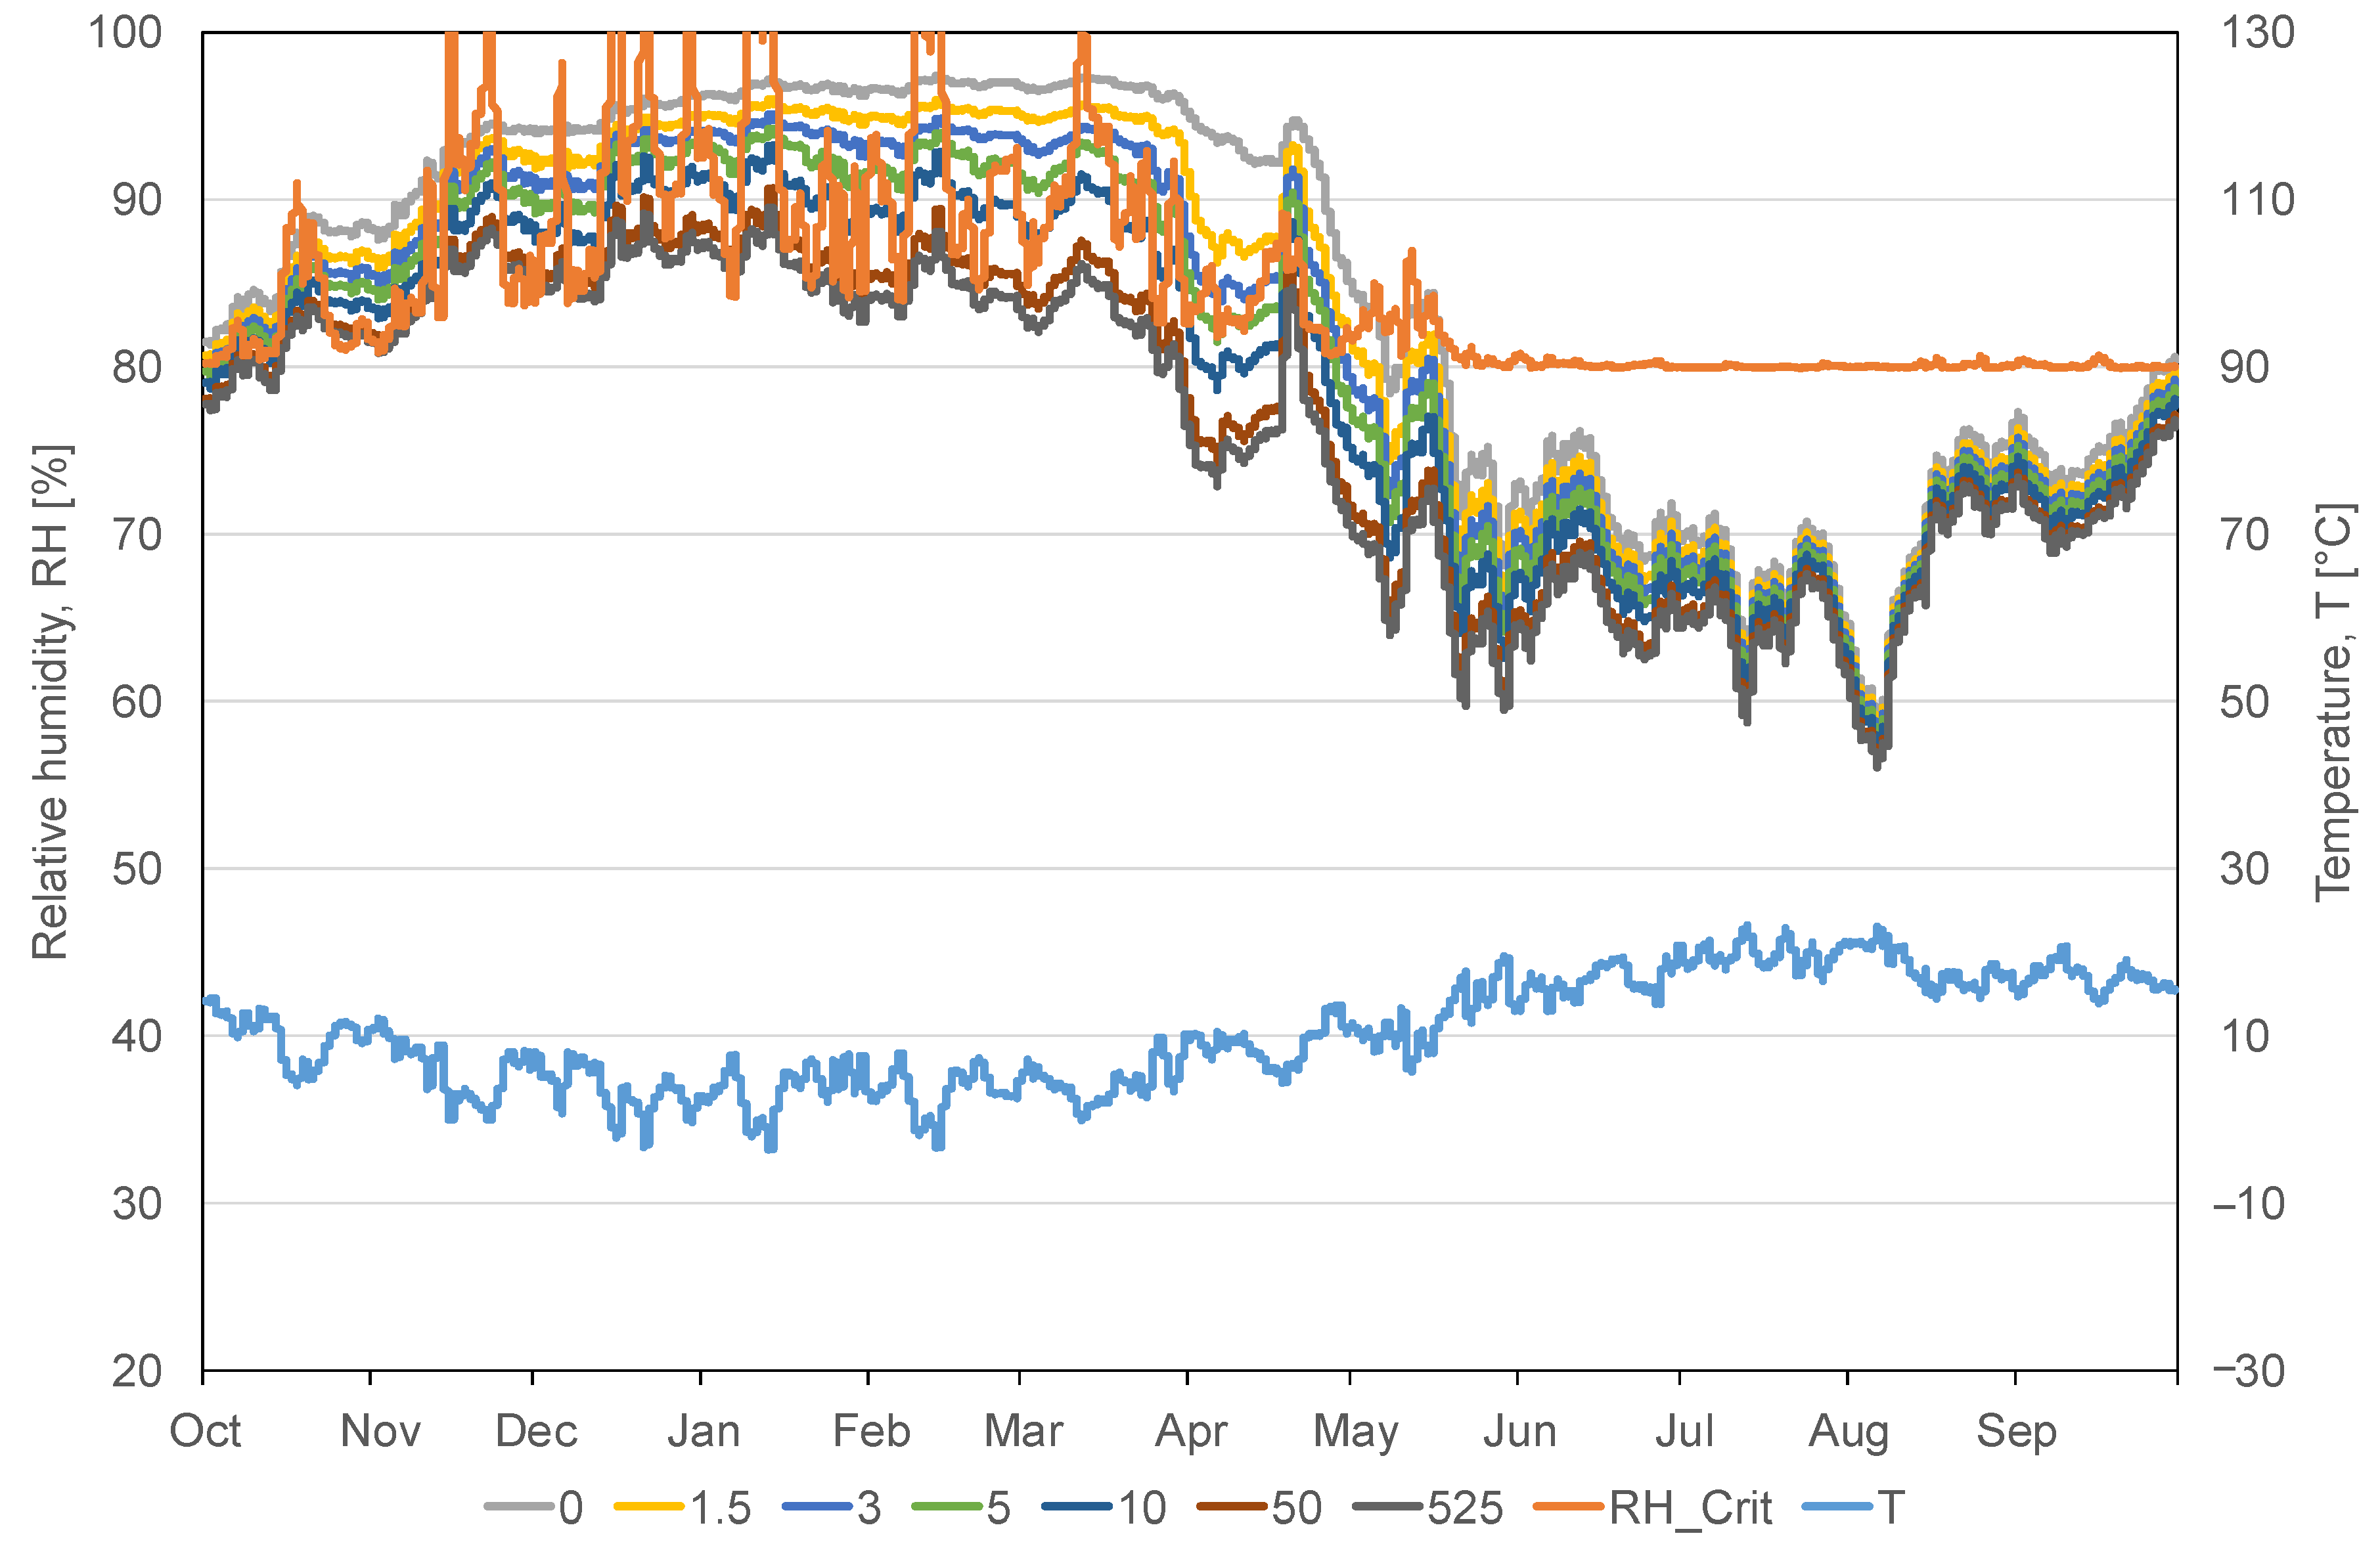
The critical point was chosen based on a preliminary assessment of the relative humidity at the given points A to D. The criterion was that if the maximum relative humidity exceeded 80% during the year, then the exterior wall faced the risk of mould growth in the given position. The selection criterion was used, though it is known as a rough threshold value for the onset of mould growth.
2.1. Dynamic Simulations
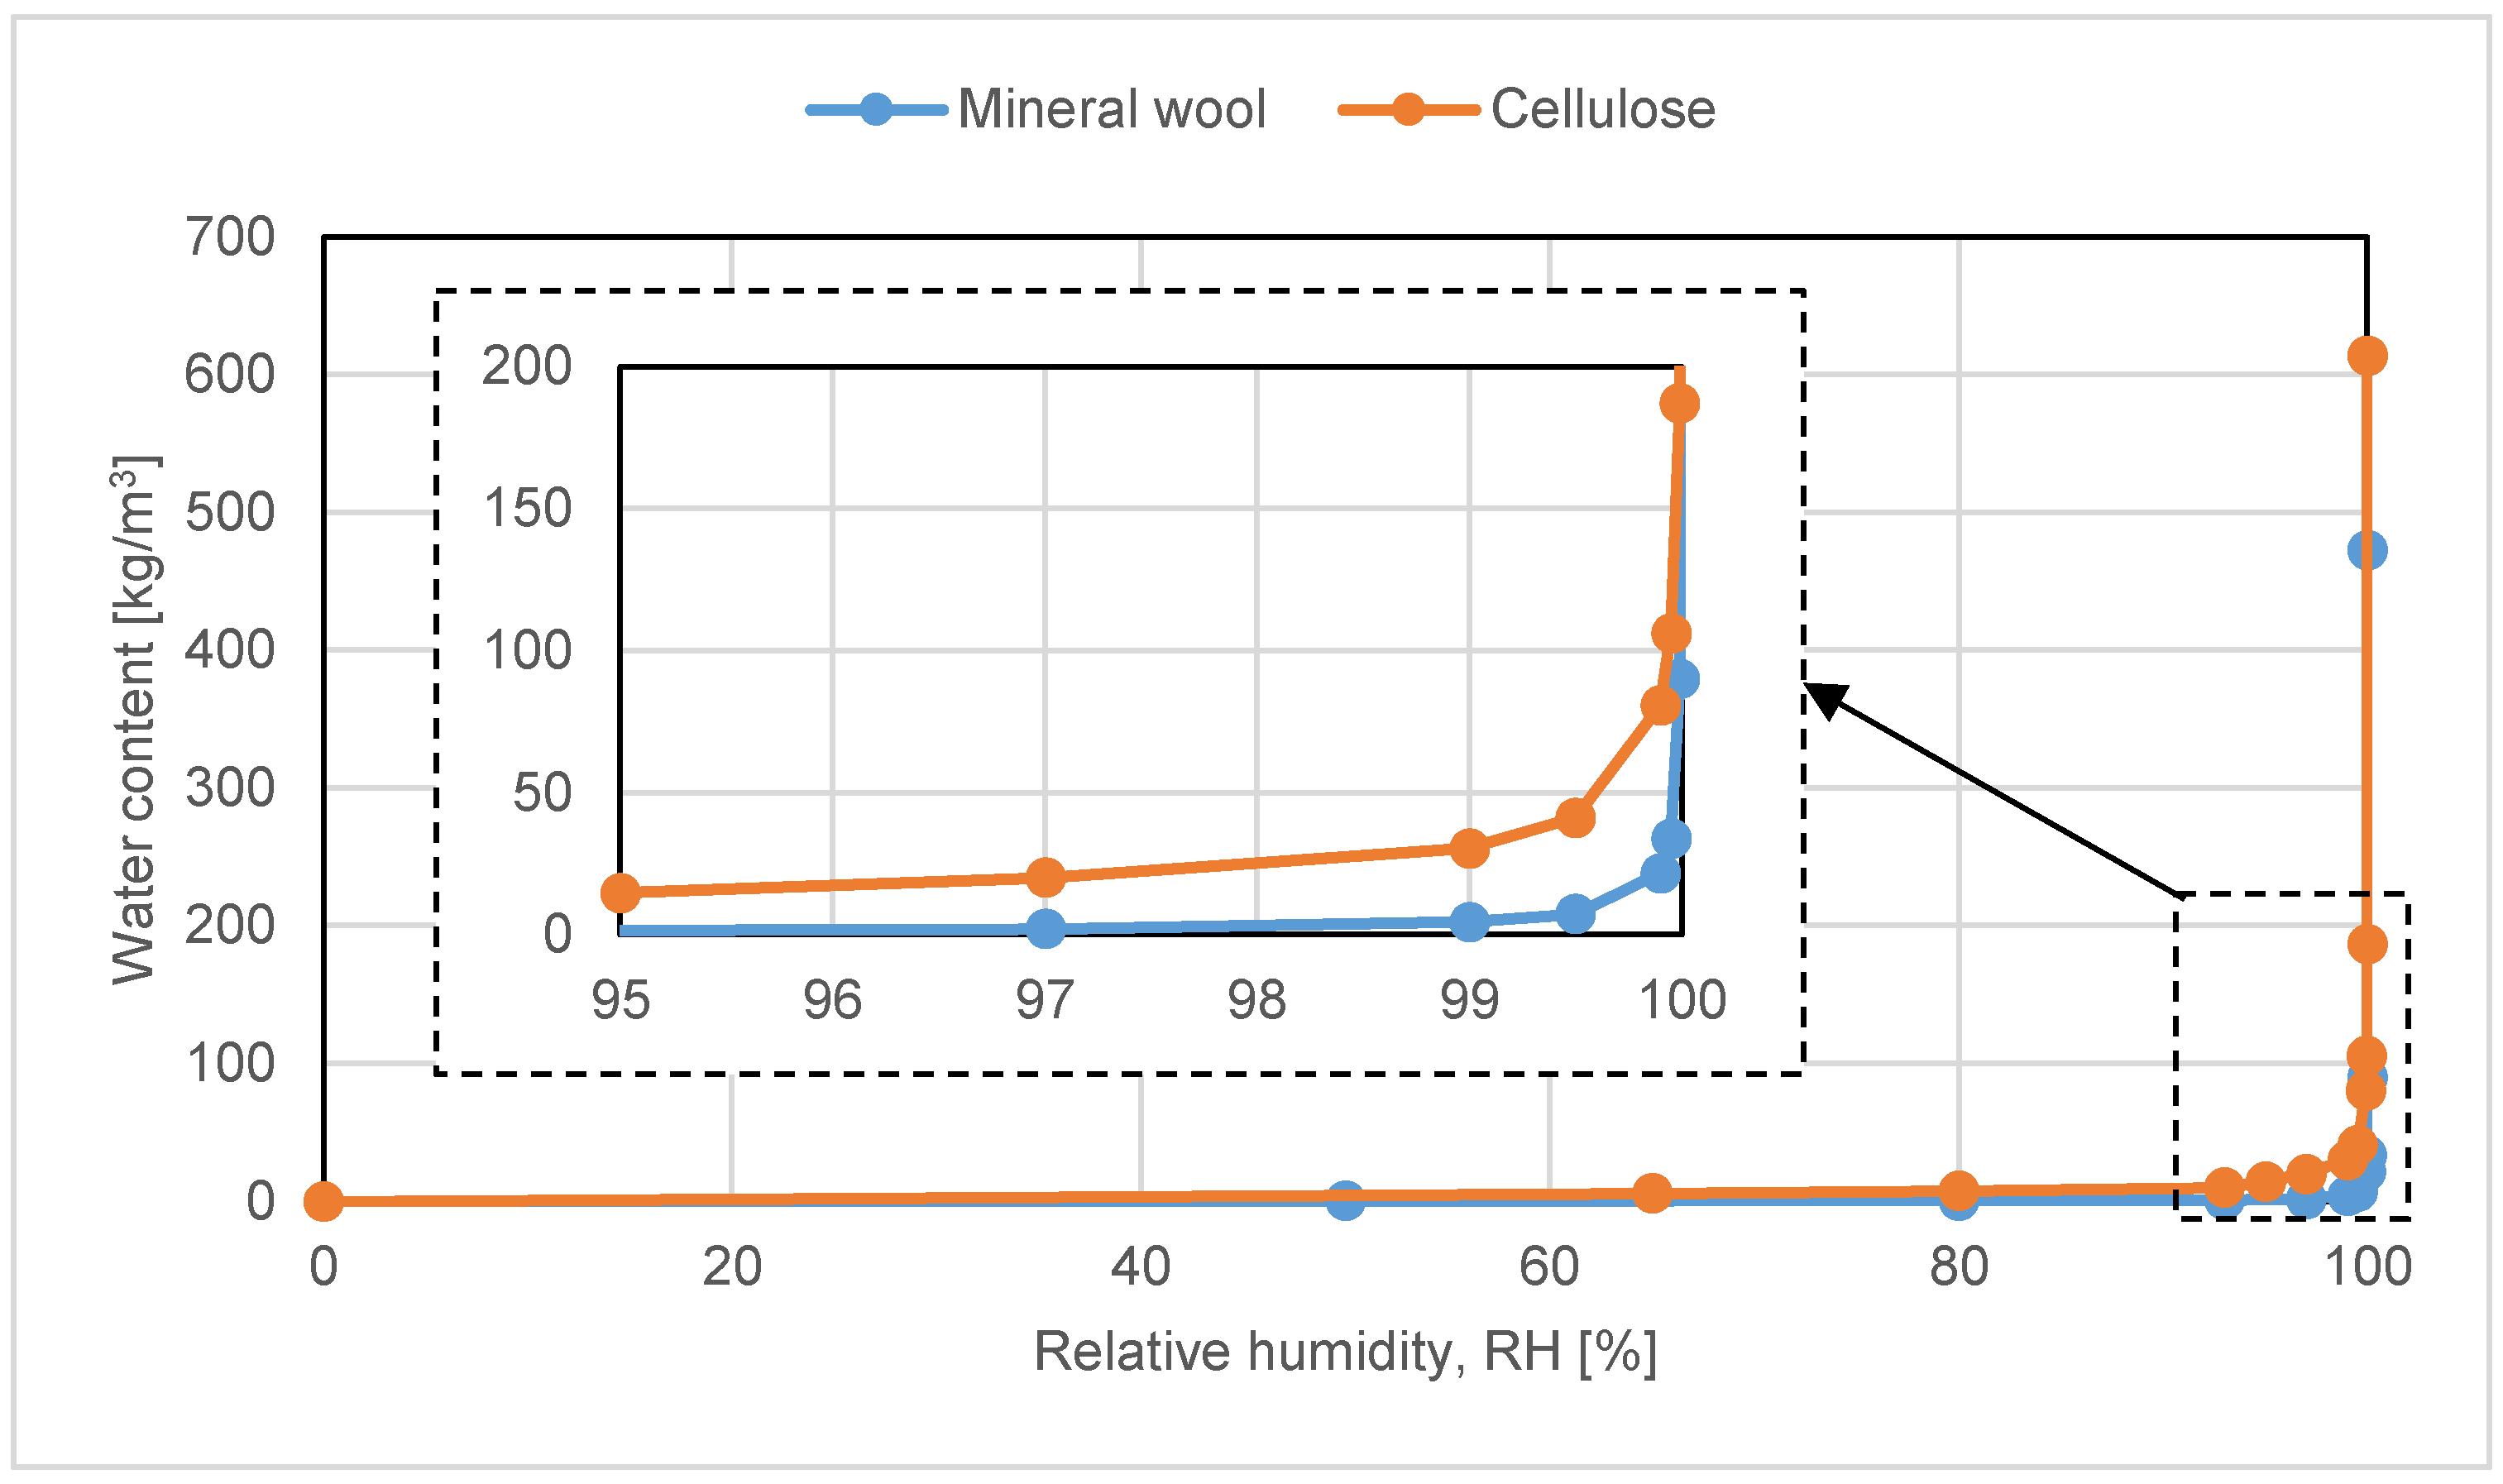
The hygrothermal simulations were performed in WUFI Pro [
16], with the material properties given in
Table 1 and the moisture storage function for thermal insulation materials in
Figure 2. The water vapour diffusion resistance (Z
p-value) for the vapour barrier was varied by changing the water vapour diffusion resistance factor μ of the vapour barrier, see
Table 2. The values of the vapour barriers were chosen based on the ratio to the wind barrier, where the common accepted value is 1:10.
The ventilated cavity was modelled as a 25-mm standard air layer (without additional moisture capacity). The ventilation rate was set constantly to 30 h−1 ventilating with outdoor air.
Boundary and Initial Conditions
The simulations were performed for a short building up to 10 m-height on the north-facing wall, which has the lowest solar radiation; this was a conservative approach as the solar radiation has a significant influence on the drying potential. Hence, the relative humidity was expected to be highest within the north-facing wall [
17]. However, for the location of Lund, Sweden, this was also the direction with a low amount of driving rain. The climate was chosen from the climate files available in WUFI Pro, which had hourly values. This location and reference year was the best representative for Denmark, in which rain data are available on an hourly basis. Currently, no corresponding reference year data are available for locations in Denmark, see
Table 3 for a comparison of the climates.
The wall has a ventilated cladding to equalise pressure; therefore, it was assumed that only 1% of the rain penetrated the cladding and was absorbed in the outer part of the wind barrier, according to the findings of Mundt-Petersen [
18] and DIN 4108-3 [
19].
The internal climate was defined as internal humidity classes 1–5 according to DS/EN ISO 13788:2013 [
14].
Simulations were started 1 October 2020 with initial conditions set to 20 °C and 80% relative humidity. The simulation period was six years, in which periodic stability in each layer was reached after three years. The surface transfer coefficients applied in the model are given in
Table 4. The exterior cladding was ventilated with outside air; hence, the vapour diffusion resistance of the cladding was considered not relevant for the simulation model and was set to 0 m (exterior, moisture).
2.2. Evaluating the Design of the Exterior Wall
The moisture and temperature conditions initiating mould growth were considered the first indications of a poorly functioning structure. Therefore, the risk of mould growth was evaluated by using the VTT mould growth model [
21].
Of the six simulated years, the last five years were included in the mould evaluation. The mould growth index (MI) was considered as acceptable (green: MI ≤ 2), investigations are needed for assessing acceptability (yellow: 2 < MI ≤ 3), and not acceptable (red: MI > 3) [
22]. For the mould evaluation, the sensitivity of the wind barrier was set to ‘sensitive’, material class ‘relative low decline’, and ‘soiled surface’ [
23].
In cases of stable results for mould growth index, the maximum MI was used, and where there was an increasing mould growth index over the five years, the assessment was ‘investigations are needed for assessing acceptability’ if the MI was below 2.
In the mould evaluation, it was assumed that there was no direct contact to the indoor climate, even in the simulations for the cases without a vapour barrier, because the air-tight layer must be established even in walls without a traditional vapour barrier. However, Jensen et al. [
24] showed that VOC from fungal growth can diffuse through many materials, which could influence the acceptable MI. In this study, we determined the acceptable MI to be equal or below 2, which is the criteria for mould growth inside structures.
4. Discussion
The aim of this study is to investigate how the ratio between the water vapour diffusion resistance (Zp) of the wind barrier and the vapour barrier influences the performance of an exterior wood-frame wall. Evaluations are based on the needed ratio between the hygrothermal characteristics of the wind barrier and the air–vapour barrier in the building envelope, depending on the internal humidity class and the exterior climate. Evaluations are based on using well-known hygrothermal simulation tools, mould growth models, and humidity/climate exposures of a typical Danish wood-frame wall.
The simulations were performed with weather data for Lund, which is located in the southern part of Sweden. The results obtained in this study are only applicable for similar exterior climates as in Lund. Copenhagen, Denmark, is located 50 km west of Lund, and a comparison of the Danish weather data [
20,
25] and the weather file for Lund indicate clearly similar weather conditions, see
Table 3.
The internal humidity classes in EN 13788:2013 [
14] is a simplified method to describe the indoor environment that can be applied in hygrothermal simulations. In simulation of single-family houses, the indoor climate would normally be set to internal humidity class 2. Hansen and Møller [
26] investigated the moisture supply in 500 Danish single-family houses (owner occupied), and concluded that 40% were in class 1, 28% in class 2, and 32% in class 3. These variations were not easily linked to parameters such as occupant density, social status, gender, age, etc. [
27]. In the design of exterior wood-frame walls, where there is a desire to omit the vapour barrier of PE-foil, the indoor climate has been shown to have a high influence on the requirement for the wind–vapour barrier ratio, which is closely linked to the water vapour diffusion resistance of the interior cladding of the exterior wall.
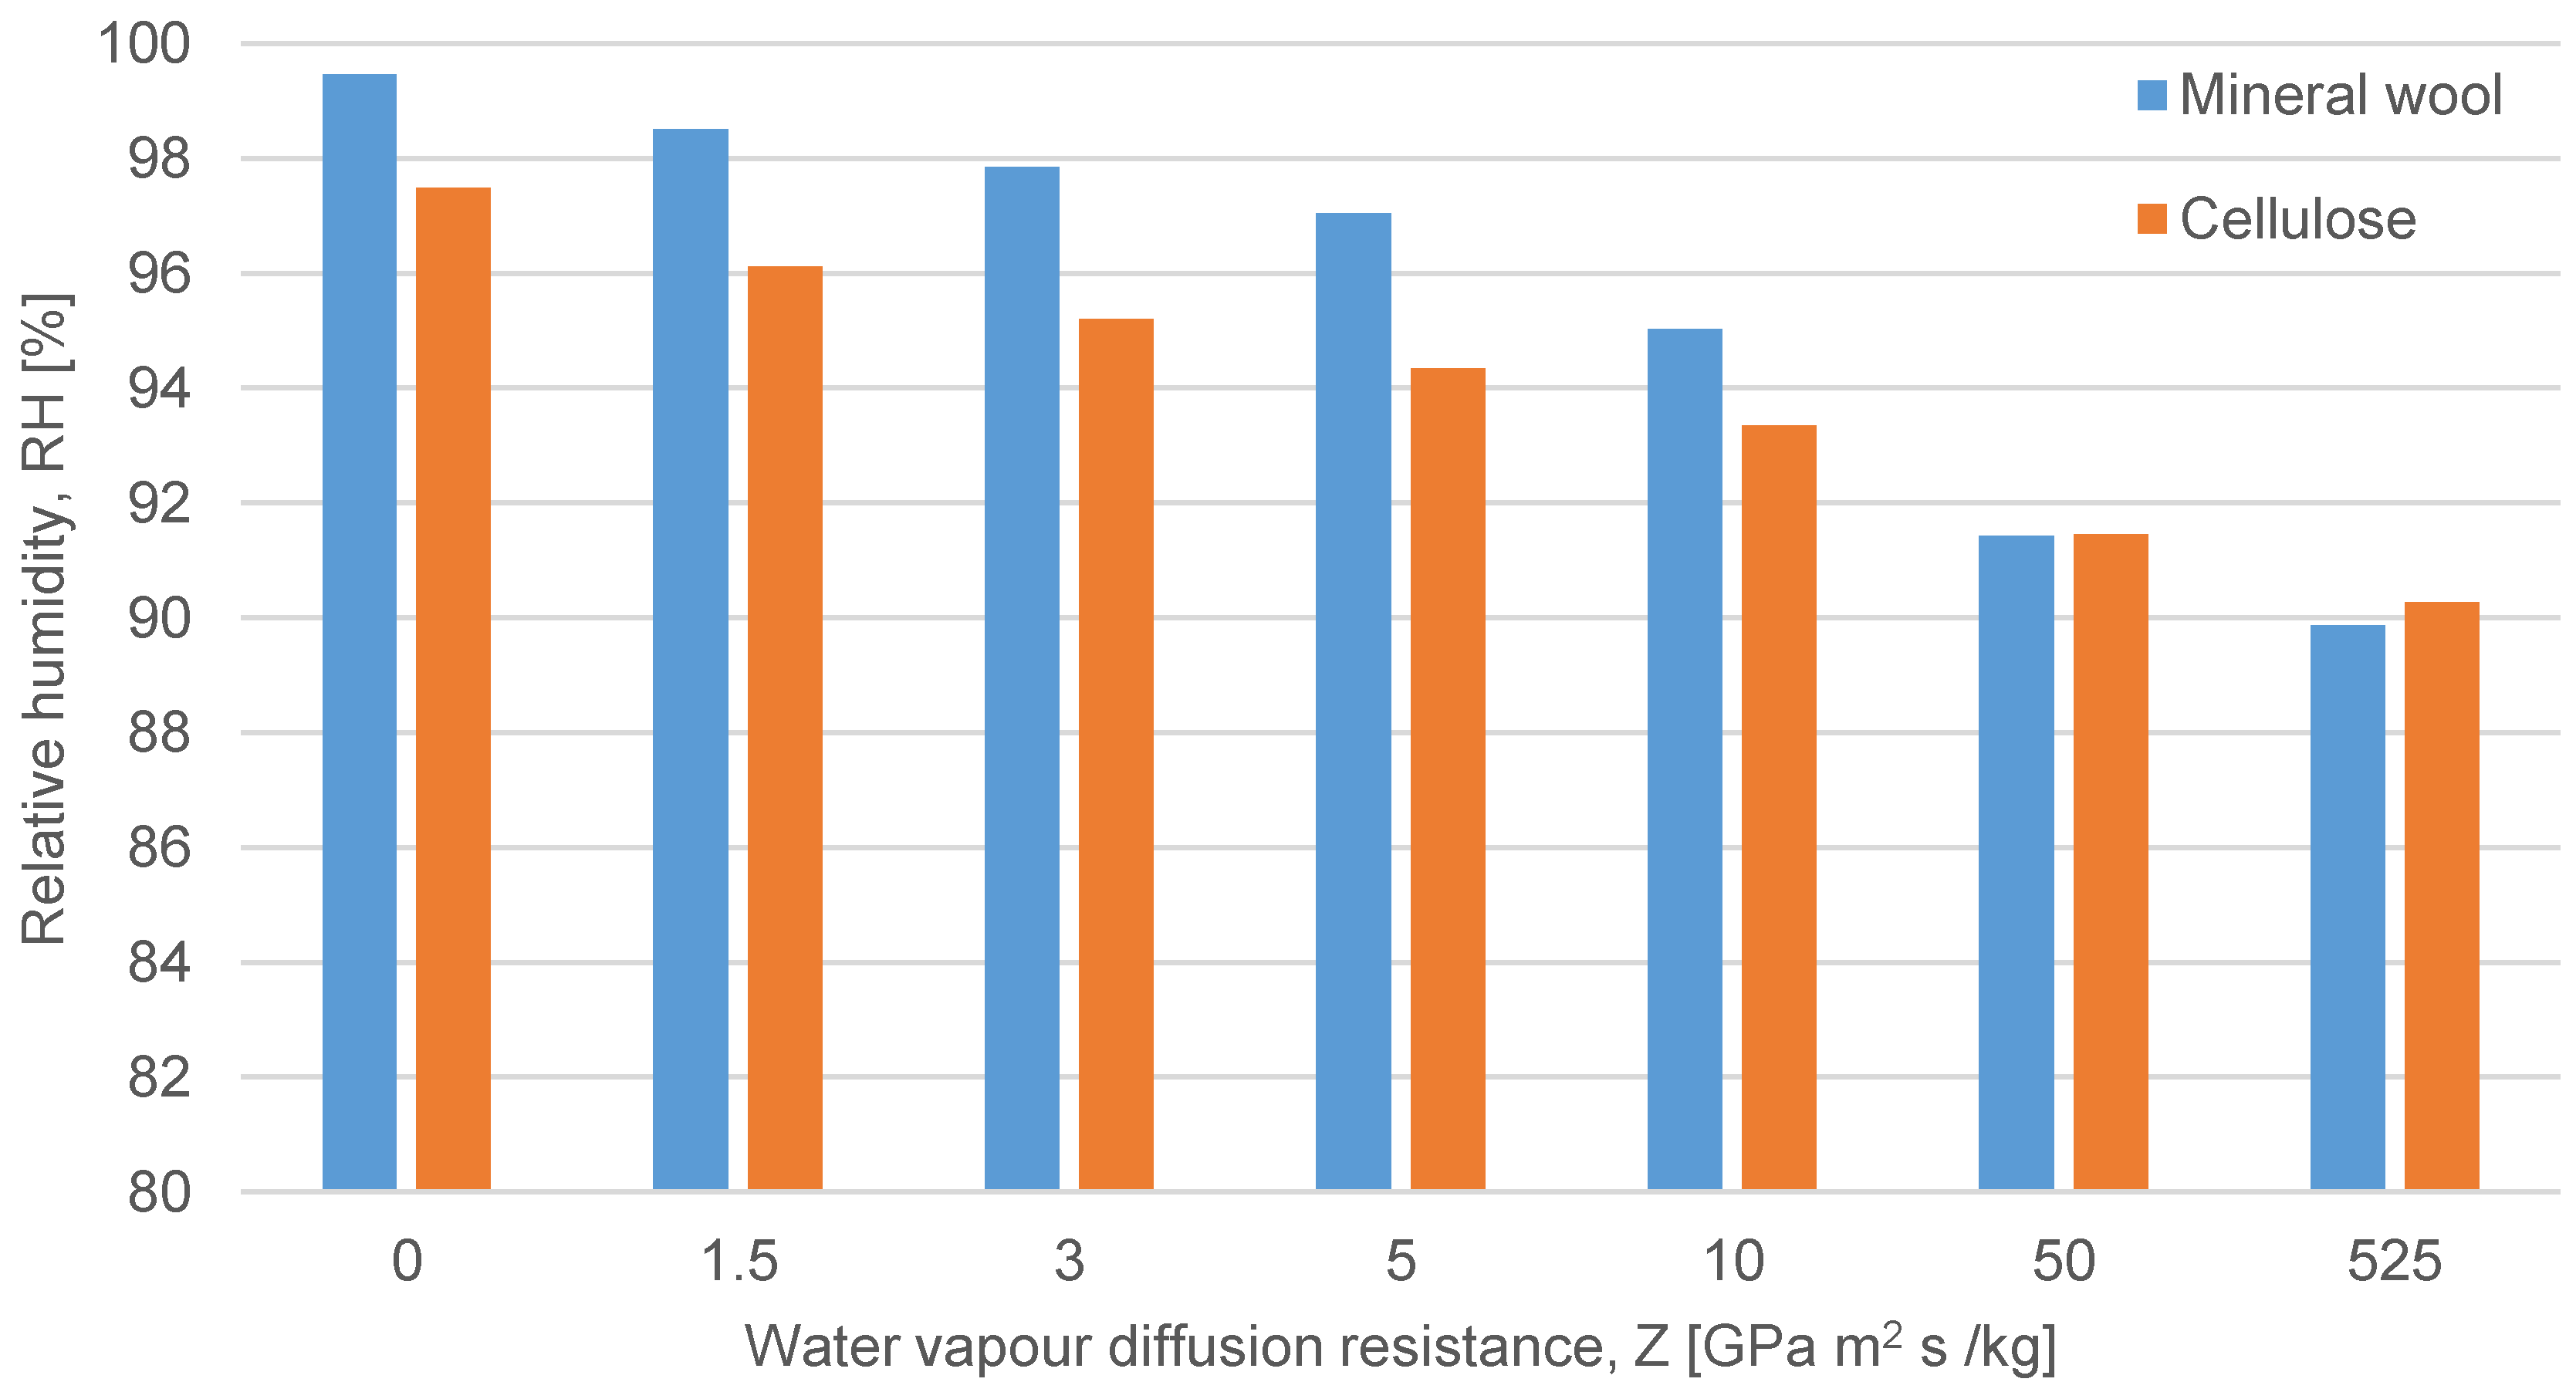
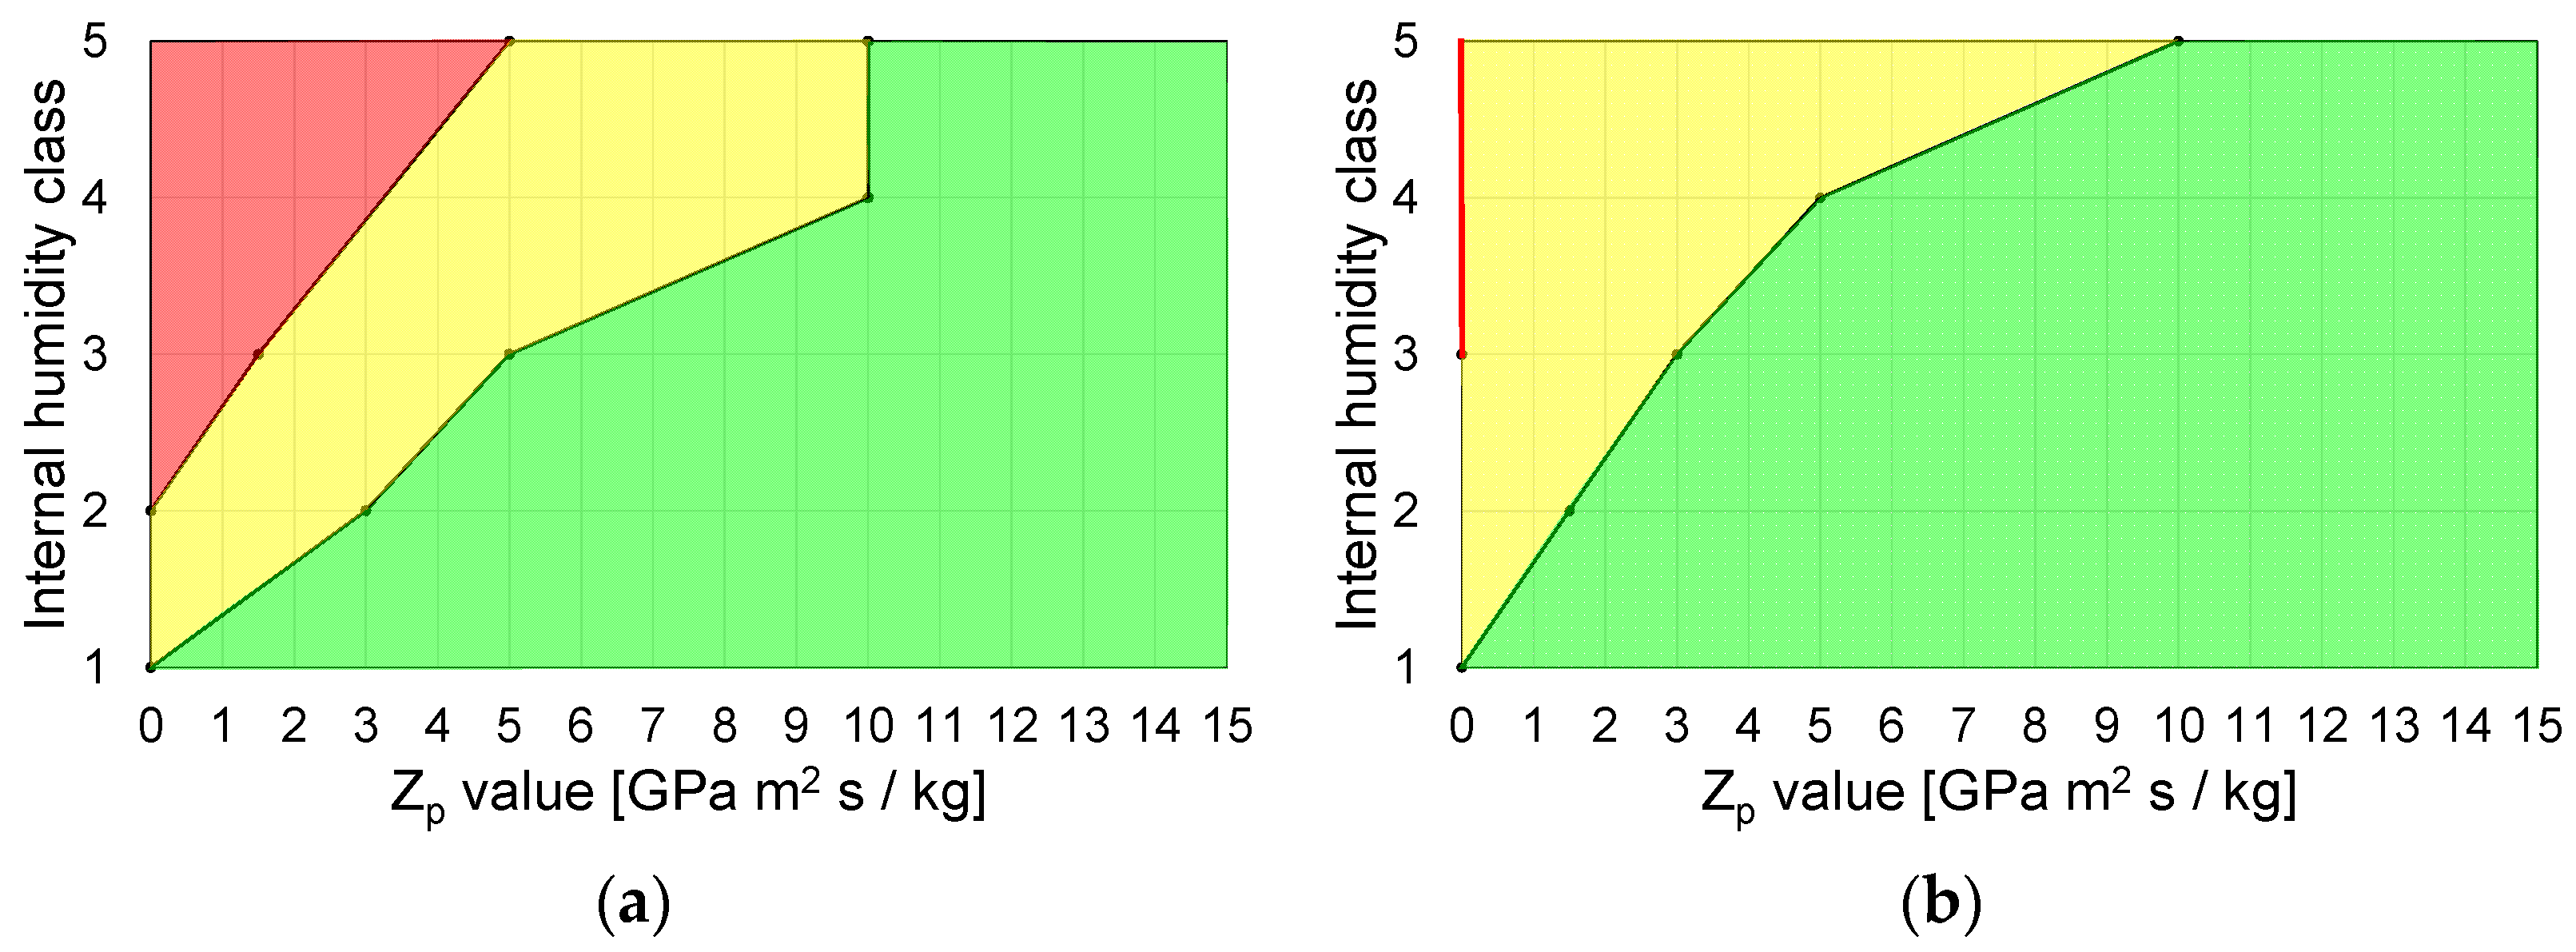
Figure 6 shows that if a wall is constructed with thermal insulation of mineral wool, and is dependent on the internal humidity class, the water vapour diffusion resistance could be 0 GPa m
2 s/kg in class 1 and should be 5 GPa m
2 s/kg in class 3. It must be noted that the two interior gypsum boards contribute with a Z
p-value of 1 GPa m
2 s/kg; thus, a structure rarely exists without any water vapour diffusion resistance of the interior cladding. With increasing internal humidity class, a larger vapour pressure is present, which will increase the moisture transport through the wall. Therefore, the requirements for the internal materials increase with regard to the water vapour diffusion resistance of the cladding to control the vapour diffusion into the building envelope.
From the simulations, it is seen that the choice of thermal insulation influences the wind–vapour barrier ratio; however, in the areal with a mould growth index (MI) below 2, there are only minor differences, which is for internal humidity class 4. For thermal insulation of cellulose, the threshold line between mould growth (red, MI > 3; yellow, 2 < MI ≤ 3) is almost non-existent, as only values of Z
p of 0 and internal humidity classes 3–5 have MI > 3. These results are in line with those presented by Pihelo and Kalamees [
11]. One of the reasons is that thermal insulation of cellulose can contain more moisture than mineral wool, see
Figure 2, which is one reason why the moisture conditions at the wind barrier are lower for the thermal insulation of cellulose.
Traditionally, a vapour barrier of 0.2 mm PE-foil (Z
p of approx. 500 GPa m
2 s/kg) constitutes both the air-tightness layer and the barrier against vapour diffusion. In cases where such a PE-foil is not desired, the air tightness can be achieved by using other materials—e.g., two gypsum boards spackled and painted—and the resistance against vapour diffusion can be achieved by various materials depending on the requirement of the water vapour diffusion resistance, e.g., plywood.
Figure 6 can be used to design the exterior wood-frame wall regarding internal humidity class and water vapour diffusion resistance. As the study worked with a wind barrier with a value of Z
p of 1 GPa m
2 s/kg, the requirements set for the vapour barrier layer will give the wind–vapour barrier ratio. Based on this ratio, the practicable cladding materials can be chosen. Furthermore, it is necessary to consider how the air and vapour layers are built together for the different building envelope components. Especially, the assemblies between different buildings envelopes components; thus, no cracks will allow too much moisture or air exfiltration.
4.1. Ratio between Wind and Vapour Barrier
The general ratio between the wind–vapour barrier in Denmark is 1:10, and for internal humidity classes 1 and 2 or thermal insulation of cellulose, it can be 1:5. This entails that moisture will have 5 or 10 times more difficulty entering the exterior wall from the inside than remaining outside the building. The study came to an agreement with the existing guidelines when looking at the MI ≤ 2 (green area). However, for internal humidity classes 1 and 2, the ratio might even be 1:3 for thermal insulation of mineral wool and 1:1.5 for thermal insulation of cellulose, when only considering the vapour barrier mounted as a layer at the interior side of the exterior wall. In buildings with very low moisture production [
26], i.e., internal humidity class 1, the simulations indicate that no vapour barrier is needed for both types of insulation evaluated. For internal humidity classes 4 and 5, the ratio must be 1:10, and for class 4 with cellulose insulation, it can be 1:5; more detailed investigation of the design must be carried out if this ratio is changed to allow for more internal moisture to penetrate into the exterior wall.
On the internal side of the construction, the water vapour diffusion resistance of the two layers of gypsum correspond to the wind barrier (1 GPa m2 s/kg) and contribute much to the total interior water vapour diffusion resistance at low values. For higher internal humidity classes 4 and 5, the vapour barrier might be applied as a PE-foil; then, the resistance from the gypsum boards do not influences the overall ratio, as the PE-foil resistance is much higher than the gypsum boards. When designing wood-frame walls without vapour barrier, i.e., PE-foil, care must be taken to ensure the correct ratio of water vapour diffusion resistance between wind and vapour barrier materials. A change in wind barrier to, for example, board material with higher water vapour diffusion resistance, would change the wind–vapour barrier ratio and the performance of the structure. Similarly, if a wall is planned with thermal insulation of cellulose and later changed to a thermal insulation of mineral wool, the ratio between wind and vapour barrier might not be sufficient. Special care must be taken when changes in projects are introduced, as almost every component in the wall influences the moisture performance of the wall.
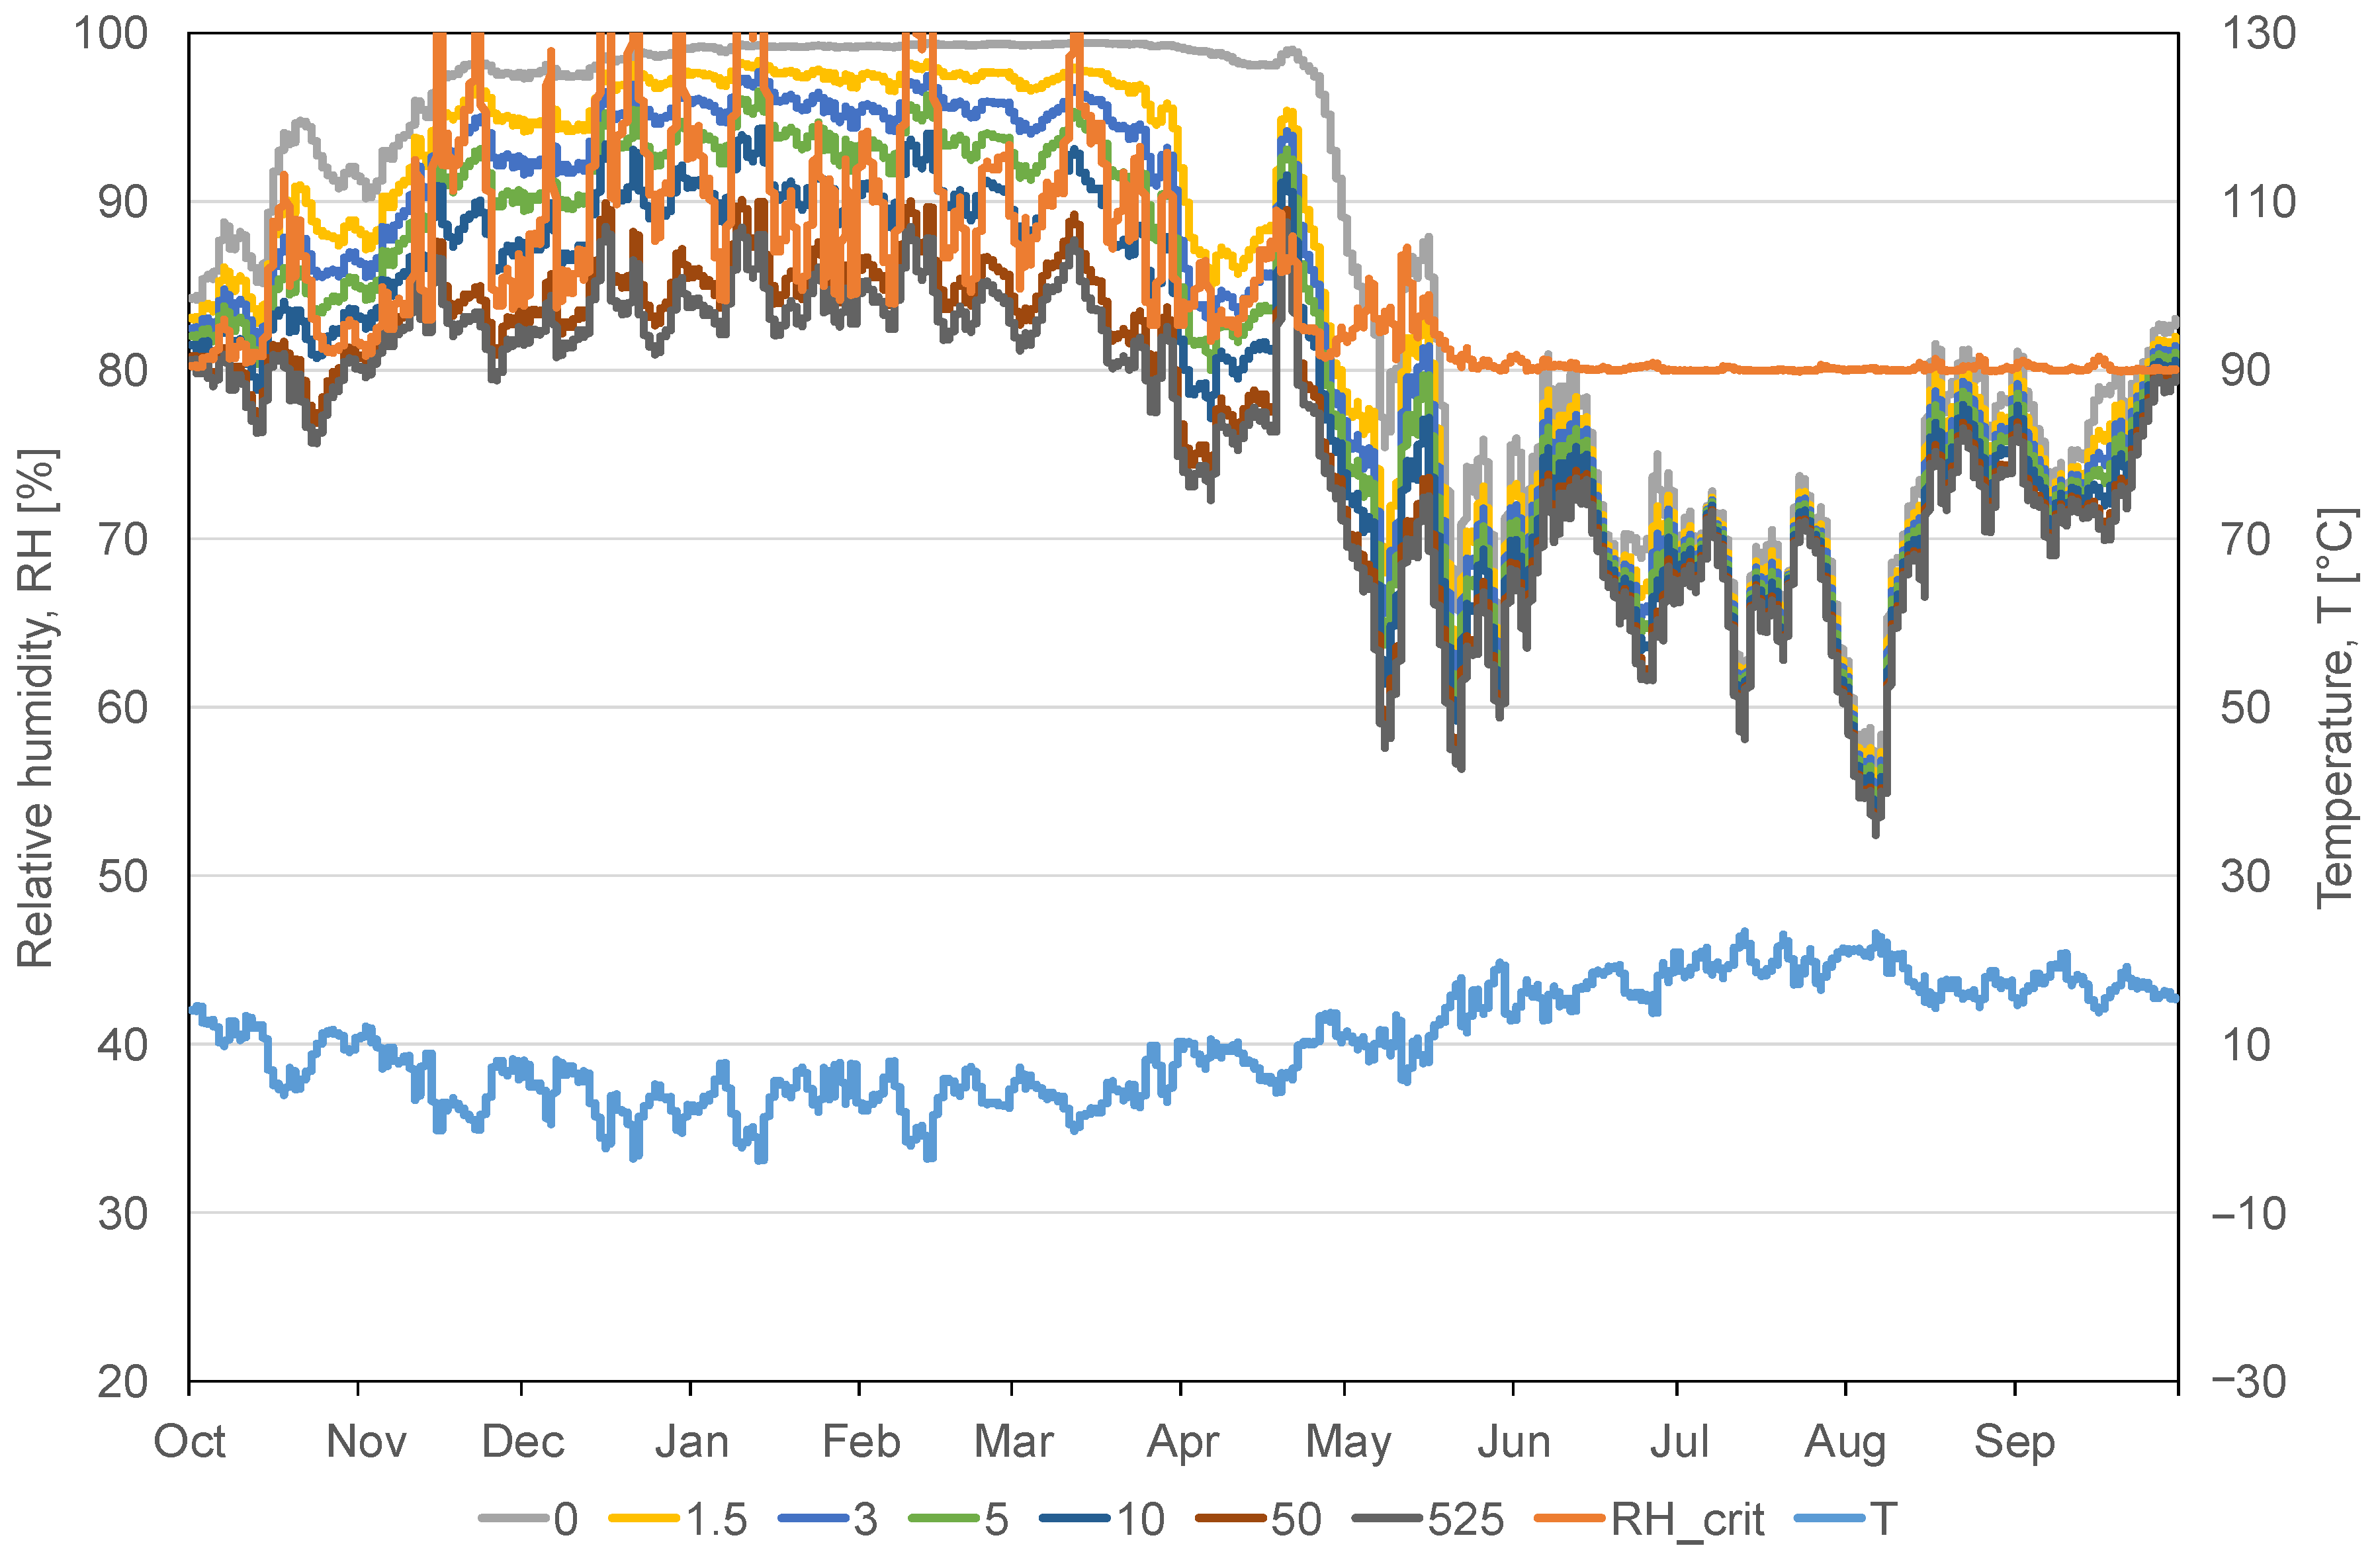
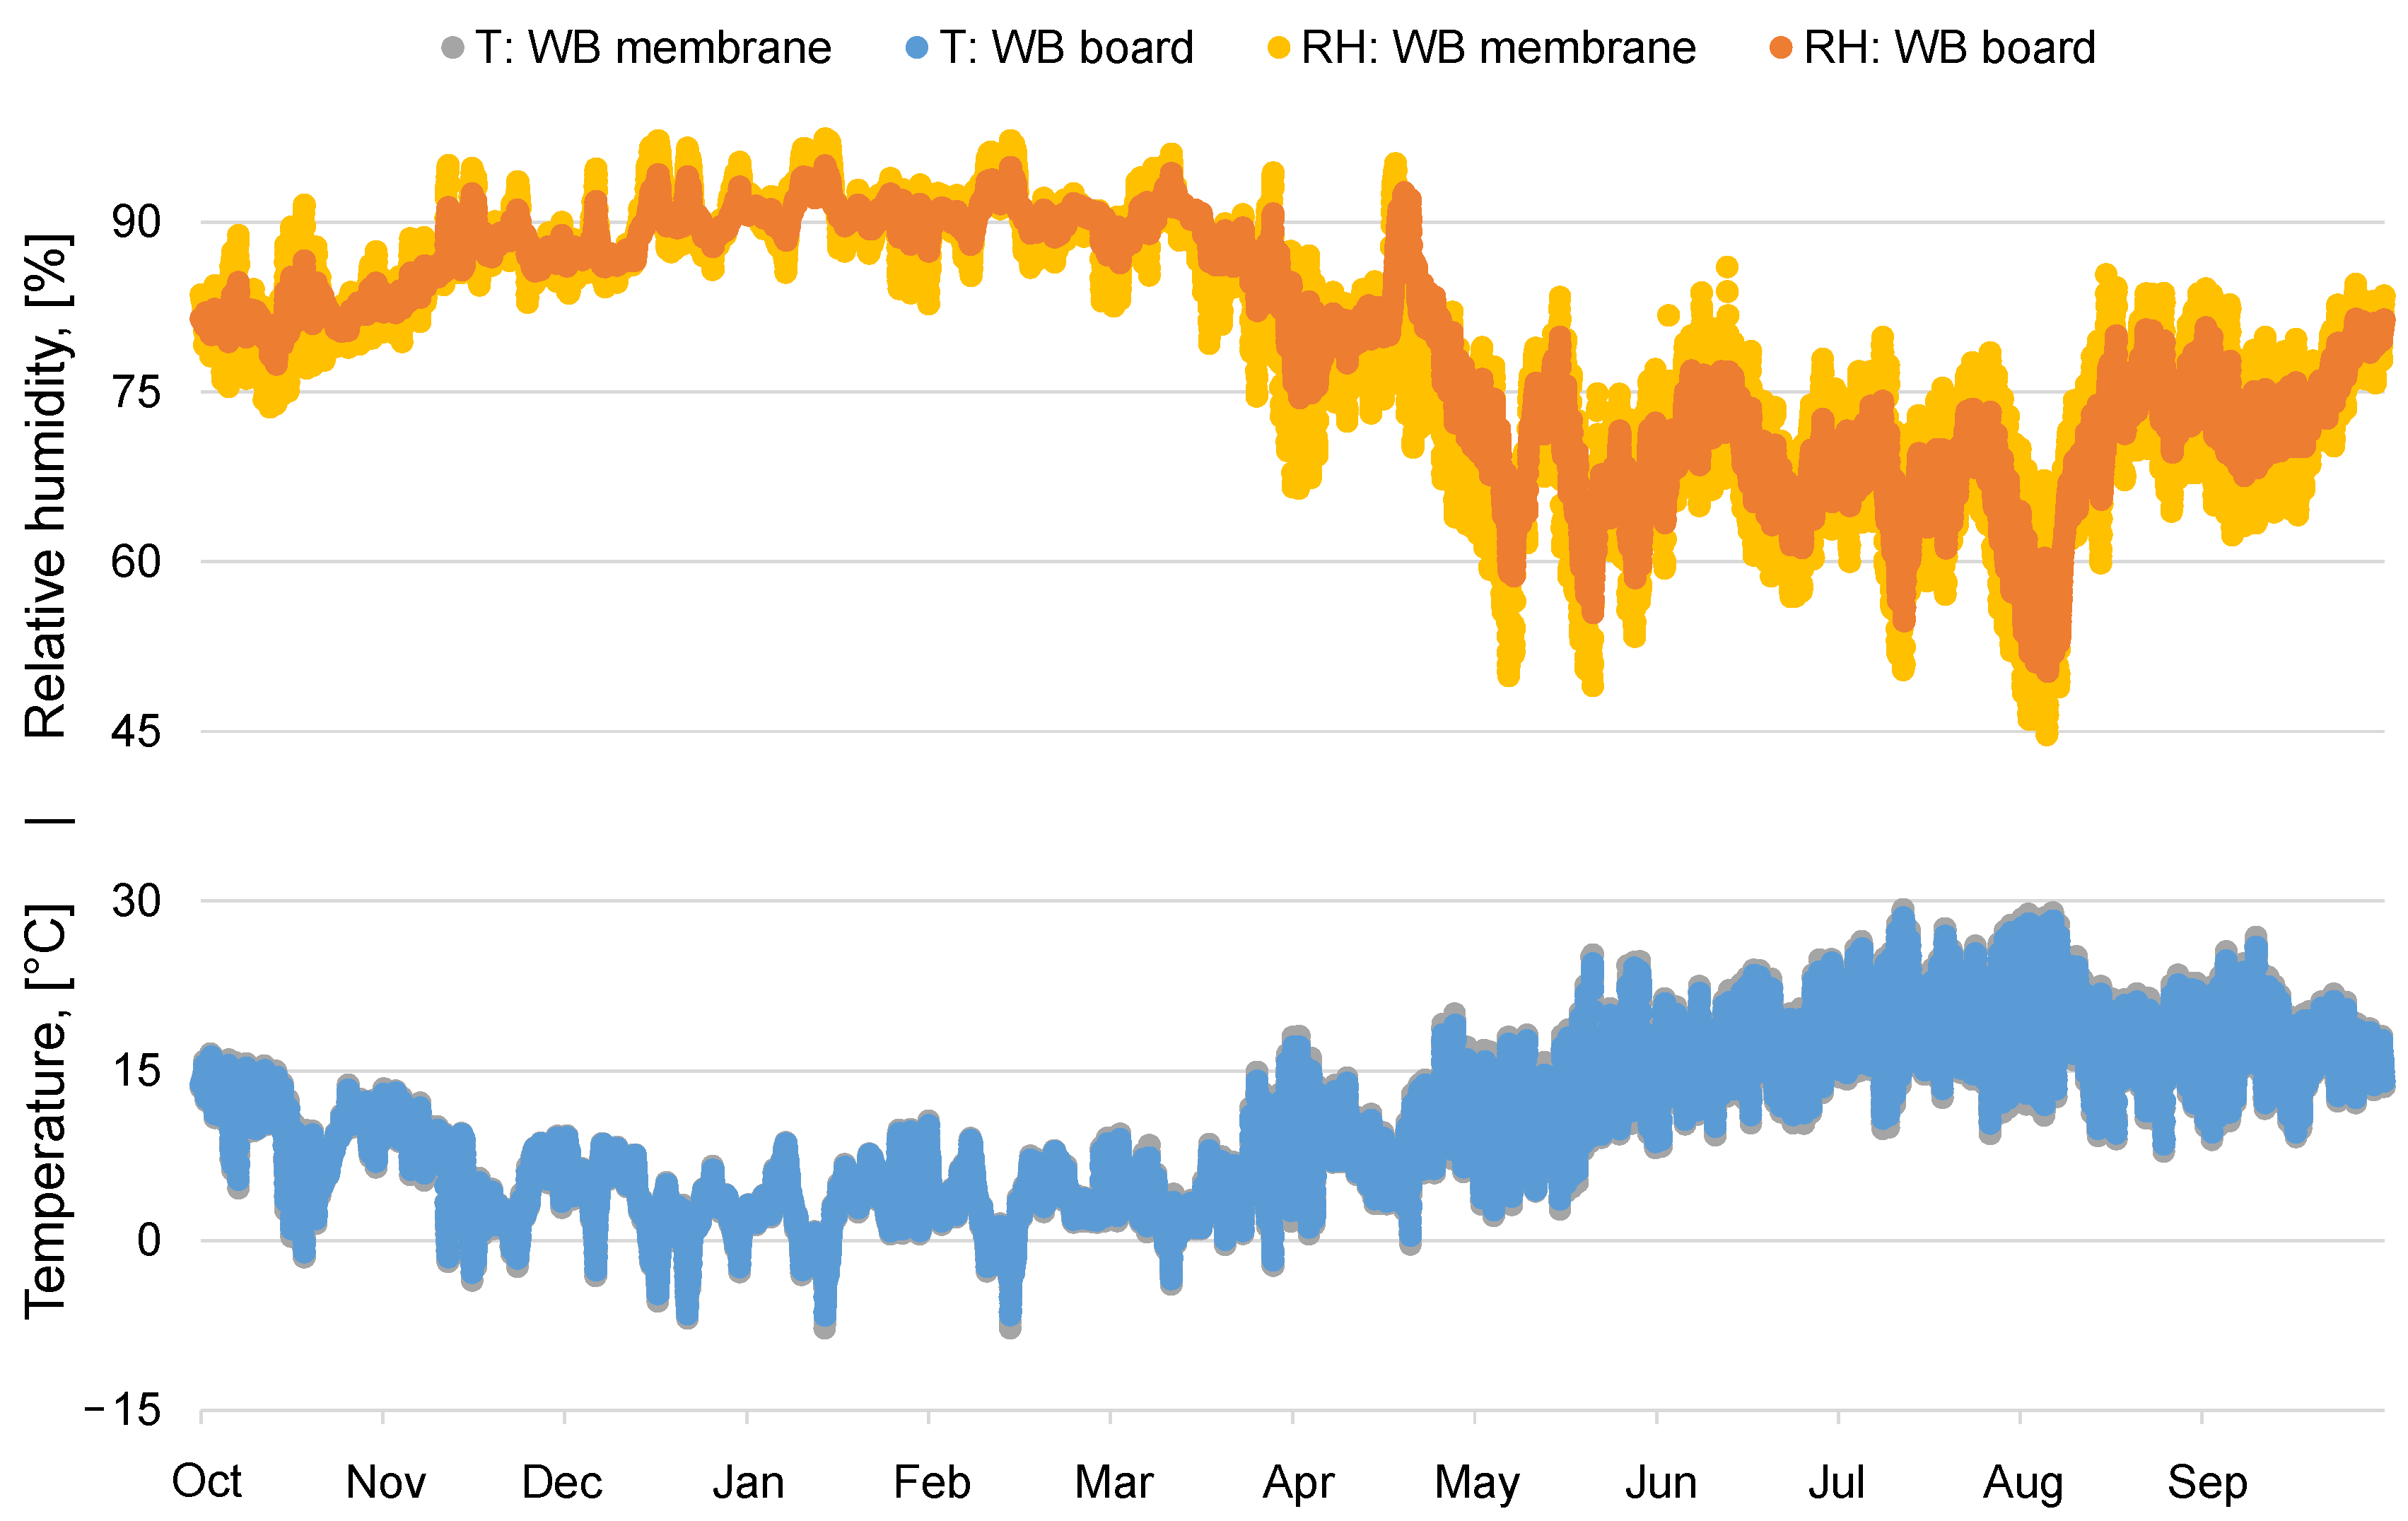
Instead of board materials as wind barrier, a water-vapour-permeable airtight wind barrier membrane can be used. A wind barrier membrane has no thermal resistance compared with a wind barrier of board material; hence, the relative humidity behind the wind barrier membrane will fluctuate more.
Figure 7 shows the different temperature and relative humidity for both a wind barrier membrane and board material. A comparison of the mould growth index gives MI
max = 0.06 for the membrane and for the board MI
max = 0.27. Both cases are far below the threshold value of mould growth. In this case, the wind–vapour barrier ratio for the exterior wall with a membrane is 0.5:10, whereas for the board material, it is 1:10.
4.2. Assessment of Mould Growth
The performance of a wood-frame exterior wall was evaluated based on the risk of mould growth by applying the VTT model [
21]. The locations under consideration were inside the thermal insulation of a wood-frame construction, and it was assumed that no spores or mycelium could reach the indoor climate. In the present study, the mould index was used, where the threshold value for an acceptable level was a mould growth index below two, which corresponds to the maximum allowable growth: ‘Several local mould growth colonies on surface (microscope)’ [
21]. However, Jensen et al. [
24] mentioned that VOCs from fungal growth can diffuse through materials, which might indicate that the threshold criteria should be lowered if the VOCs have a negative effect on occupants.
The mould growth model requires a number of input parameters; especially, the sensitivity class for materials and the amount of decline in the mould index affect the development in mould growth index. Johansson et al. [
28] investigated the use of several mould prediction models and pointed out that these parameters highly influence the results of exterior wood-frame wall performance regarding mould growth. In this study, a conservative approach was chosen, where a relatively low decline was chosen and a soiled surface, to be on the safe side. Furthermore, 1% precipitation reached the outer layer of the wind barrier. The simulations were conducted until the periodic stationary condition was obtained, which was after three years; however, the evaluation of mould growth was performed for 6 years, to ensure that the evaluation also was periodic stationary or had exceeded the threshold values. In case the evaluation period was too short, the assessment of mould growth index could be interpreted as to low, resulting in an acceptable structure that, over time, would perform inadequately.
The calculated mould growth index that was used as limit values in the evaluation was assessed to be on the safe side.
4.3. Boundary Conditions and the Wind–Vapour Barrier Ratio
The performed calculations have been carried out for climate data applicable to Denmark. The choice of climate, both outdoor climate and indoor climate, is of great importance for the possibility of choosing a material that is to constitute the traditional used PE-foil vapour barrier. The calculations are, thus, strongly dependent on temperature and humidity, which results in an efficient vapour pressure both indoors and outdoors. Temperature and humidity are the result of parameters such as rain, wind, sun, and shading for the outdoor climate, while for the indoor climate, it is the users’ use that defines the climate. If an exterior construction is carried out with only the sufficient ratio between the internal and external water vapour diffusion resistance, a construction is carried out, which is vulnerable to changes in the climate, both in relation to climate change and the use of the building. Forecasts for climate change in Denmark point in the direction of a warmer and more humid outdoor climate, which suggests that the moisture supplement from the indoor climate to the insulated structures must be as small as possible in future buildings to ensure robust constructions. However, control of the indoor climate might be necessary to reduce the moisture impact of constructions in future climates depending on the choice of the vapour diffusion resistance of the vapour barrier.
4.4. Evaluation of the NRC Guideline for Durability
The ‘Guideline on Design for Durability of Building Envelopes’ [
15] was followed through the work of this study. The approach is very comprehensive and a systematic method for conducting and documenting the hygrothermal simulations, which carries great importance. However, the authors find that part of postprocessing results are lacking information, especially if the document is supposed to support the practitioner. It should also be considered who will conduct simulations, i.e., typically experts in simulation programs and recipients who are, e.g., employees at municipalities without experience in simulations (nonexperts). The difference between competences within simulations should be considered. The information provided in the report based on [
15] will be relevant for replication of the work, but perhaps with minor relevance to those interested in the result; therefore, it must be considered that if the postprocessing should follow a systematic method, and for example, dictating the mould model that should be used to minimise the risk of miscalculations of the results, as illustrated with mould models in [
28].
4.5. Outlook
This study investigated the possibility of constructing exterior wood-frame walls without a traditional vapour barrier, e.g., PE-foil. The study came up with a more varied view on the ratio between wind and vapour barrier; thus, it can be less than 1:10 in climate for Denmark and, under some conditions, be omitted. However, to ensure that moisture problems do not arise due to moisture trapped in the exterior walls, the rule of thumb is still recommended until further investigations are conducted. A next step to investigate would be the consequences of applying future climate scenarios, room air exfiltrating the exterior wall, rain intrusion behind the wind barrier, different materials of wind and vapour barrier, etc. However, it is important to validate the hygrothermal simulation tools with laboratory and/or full-scale experiments.


