2. The Essence of Eye-Tracking Studies
The subject of the video-oculographic method has been discussed in works presenting research assumptions concerning the experiment and the considerations indicating its application potential. The most important items of the literature on the subject include publications by D. Richardson [
15], G.D.M. Underwood [
16], A. Duchowski [
17], as well as Z. Hoolmovist, M. Nystrom, R. Anderson et al. [
18], which together form a compendium of knowledge on the method. Other notable publications include those by A. Bojko [
19]; as well as those edited by M. Horsley, M. Eliot, B. Knight and R. Reilly [
20]; and by J. Nielsen and K. Pernice [
21].
The subject matter of the possible application of the method in studies of architecture and spaces has recently been discussed by the following teams: Ch. Lebrun, A. Sussman, W. Crolius, G. van der Linde from the Institute for Human Centered Design in Boston [
22]; D. Junker and Ch. Nollen from the University of Applied Science in Osnabruck [
23]; Z. Zou and S. Ergan; as well as A. Radwan from New York University [
24,
25]; L. Dupont, K. Ooms, A. Duchowski and V. Van Eetvelde from Ghent University [
26,
27], R. Noland, M. Weiner, D. Goo, M. Cook and A. Nelessen from State University of New Jersey [
28], J. Hollander from Tufts University [
5] and by M. Rusnak, W. Fikus and J. Szewczyk from the Faculty of Architecture of the Wrocław University of Technology [
1,
29], in addition to the authors of this article [
3,
4,
30].
Previous studies focusing on the suitability of eye tracking in architecture, urban planning and landscape architecture performed by other research teams focused on three main aspects, namely: the use of eye tracking itself, coupled with a stationary or mobile eyetracker, and the use of eye tracking in combination with tools from other research methods. Those that have been found to be the most numerous in the literature are studies presenting results based only on the use of eye tracking with the implementation of stationary devices to investigate the visual perception of works of architecture and landscape architecture.
These, among others, include an experiment performed by a team of researchers focusing on architecture, interior architecture and cognitive science from the Institute of Human-Centred Design in Boston, who used a stationary device and focused on the visual perception of architecture and its surroundings in Boston. The experiment was performed on volunteers from different professions and of various ages, while the object of research were photographs of buildings and their interiors, either individually, or with persons present. The results pointed to a varied visual perception of buildings, often independent of their type, depending on the presence of human figures, their faces and other elements of the landscape. According to the publication’s authors, eye tracking is a very good method in allowing scholars to understand the visual aspects of experiencing architecture by persons who are not architects. Furthermore, it pointed to the justification of obtaining knowledge about how an architectural design communicates with the public, the client and professionals, particularly when viewers see buildings with people present around said buildings or the buildings alone. The authors pointed to the utility of this knowledge in teaching architectural theory, the history of architecture and architectural design [
22].
Studies conducted at the Faculty of Architecture of the Wrocław University of Technology focused on determining the utility of this method in investigating the visual perception of historical structures. According to the authors of this publication, knowledge based on video-oculographic study findings could aid in facilitating the objectivisation of historical zone evaluation, and would make it easier to manage them [
1]. Another study, which was performed using a stationary eyetracker, also pertained to the visual perception of the interior of a Gothic church depending on its height and depth. The experiment focused on depth perception in modelled interiors and changes in interest in reading depth relative to increases in the cathedral’s height. The results made it possible to conclude that the change in a layout’s length causes more complex consequences in matters of depth perception than merely changes in nave height. The study pointed out that more in-depth research using other methods is justified [
29].
Studies performed at another Polish research facility, namely the Faculty of Architecture of the Cracow University of Technology, performed using a stationary device, concerned the perception of selected historical buildings and the space of the Rabka-Zdrój health resort in Poland. The study was aimed at determining the scope and manner of perception of buildings of high cultural significance that suffer from decay. Its findings have confirmed the effect of perceptual competition between the details of the buildings and historical and contemporary spaces. According to the study’s author, the focus on and perception of these details instead of entire buildings can be the reason for a lack of valuation of the perceived surroundings [
3]. Further studies have enabled the detection of the strong impact of various types of advertisements and information boards on the disruption of a building’s perception. The authors demonstrated the utility of video-oculographic studies in formulating guidelines and planning measures associated with the protection of heritage sites and conducting education efforts [
30].
Another type of study conducted using stationary devices were those of the impact of the level of urbanisation on the landscape presented on photographs on the visual exploration of images by viewers. The experiments, conducted at Ghent University, concerned the assessment of the visual perception of various landscapes, ranging from rural to urban ones, as seen on photographs. More extensive and scattered exploration was observed in more urbanised landscapes. In poorly urbanised landscapes, fixations were more focused. Meanwhile, when no buildings were visible on the photograph, unexpectedly broad exploration was observed. The results of this study provided evidence for the conclusion that the level of urbanisation is positively correlated with visual complexity, as indicated by its potential impact on the viewer’s behaviour [
26]. Furthermore, studies concerning the use of significance maps, which are theoretical prognoses of the pattern of human vision, with the aim of comparing the visibility of various designs of simulated constructs placed on photographs of original landscapes, have been performed. The results of the experiment, in the form of a high correlation of significance maps with human focus maps, made it possible to formulate conclusions as to the suitability of eye tracking and the significance maps themselves in planning structures within the landscape, as it was concluded that visual impact is lower when the visual perception of a structure decreases and an optimal integration of a structure with the existing landscape can be achieved [
27].
The second aspect of previous studies was the sole use of eye tracking through mobile devices. Studies of this type were performed at, among other places, Tufts University and New York University, and focused on the impact of urban environments on the mental states of people present within them. Experiments performed using a mobile eye tracker made it possible to identify urban environments associated with more positive reactions, suggesting a feeling of relaxation and the desire to spend time there. The authors of the publication also pointed to the significance of the study and the detection of such environments as a part of formulating new principles of urban design [
5,
24,
25].
Studies performed at the University of Applied Science in Osnabrűck, which similarly utilised a mobile device, involved long-term experiments in real-world open urban environments (“Grosser Garten” in Hanover and “Stourhead” in Wiltshire). The experiments made it possible to prove the suitability of this method in studies of open space with the purpose of obtaining knowledge about how people behave and react and how they enter said reactions. This knowledge is particularly noteworthy and can be useful in designing the best possible spaces, consequently enabling quality of life improvements. The research team behind the study pointed to the purposefulness of conducting holistic research, e.g., by using a combination of eye tracking with other methods. According to the authors, a combination of eye tracking with electroencephalography (EEG) along with mobile measurements intended to record interactions in detail and analyse the reactions of the human body, could prove particularly useful. Knowledge obtained through such studies should form a repository of data concerning user requirements and provide utility in the planning and management of green areas and public buildings, while taking subjective feelings of safety and contemporary aesthetic tastes into account [
23].
The third aspect of eye tracking studies is using them in conjunction with or by using other research tools. One example of such studies are experiments performed at the State University of New Jersey. As a part of the said experiment, qualitative survey studies concerning visual preferences were performed and were followed by eye-tracking experiments. The survey study focused on the perception and assessment of various urban objects placed in green surroundings, amidst pedestrian traffic and in proximity of public transport. Eye-tracking studies with the use of mobile devices have made it possible to expand the knowledge declared by the subjects with an objective image of their perception of this environment. According to the publication’s authors, studies following this methodology provide knowledge that is necessary to urban and transport planners and municipal governing bodies, allowing them to improve the functioning of the city, e.g., by increasing pedestrian activity and introducing vehicular traffic constraints in cities [
28].
Analysis of the state of the art in terms of the application of eye tracking in studies of architecture revealed significant factual discrepancies between individual studies. The experiments that have thus far been performed concern the utility of this method in solving specific scientific problems that are the focus of the given research teams. Therefore, it can be said the studies are selective in nature. Regardless of the context of the method’s application, all completed experiments point to its significant application potential in architecture, urban planning and landscape architecture. The authors wish to highlight the significance of the findings concerning the visual perception of various works of architecture, both historical and contemporary ones, located in various spaces, landscapes and surrounded by people and various forms of technical infrastructure. The findings are based on analysis of so-called descriptive statistic parameters. Despite all of the publication’s authors declaring an awareness of the need for further studies in broader, more comprehensive perspectives, they are of the opinion that their findings provide research material that can prove highly useful in formulating assumptions and measures concerning the planning, design and construction of contemporary architecture, as well as protecting and managing heritage sites. Furthermore, in the opinion of the authors, the presented findings should be used in educating future architectural staff and social education efforts.
In the literature, video-oculography is presented as a set of research and study techniques used to measure, record and analyse data concerning the position and motion of the eye. It supplies quantitative measurement data without referring to subjective, verbal reactions of the subject, instead referring to psychophysical and neuropsychological processes that accompany the collection and processing of visual information and oculomotor reactions to stimuli received from the environment. Eye tracking and visual perception are fundamentally interlinked.
In cognitive psychology (U. Neisser), perception is understood as a process of rationality and abstraction. Abstraction activities are present at two levels of perception: first taking place after the sensory reception phase. The sensory reception that precedes it is equated with the initial process of passive information gathering, during which input is detected in receptors (“burned” in the photoreceptors of the retina). Reception inaugurates the process of information processing. In the case of visual perception, during this stage it is already possible to indicate so-called property detectors, i.e., neurons that selectively react to lines with a specific spatial orientation, or the general outline of the human face. It is the second stage of experiencing that is considered rational, and which involves the active process that follows reception. It is based on interpreting sensory data using contextual suggestions, attitude and previously gained knowledge. Perception involves activities such as discrimination, recognition, orientation or perceptual categorisation. Rationality is present during this stage of higher-order cognition, which is equated with the capacity to think, distinguish certain common traits in objects at the cost of ignoring others (either indistinct or non-general traits), which are then used to form generalisations in creating cognitive representations. It can be said that in U. Neisser’s cognitive psychology, which is derived from experimental psychology, references are made to the notion of cognition as construing and creating knowledge. Meanwhile, in the concept of “visual thinking” or “thinking with images” (R. Arnheim), it is assumed that perception processes feature rational principles that govern the seeing and imaging of an object. Here, this notion is seen as an equivalent to the image and treated as a word. The language of images is less arbitrary and wealthy than the language of words, featuring more analogies and non-isomorphic relations between the sign and the object. In this concept, the geometric shape is seen as one of the most stable notions of the language of images. In Gestalt theory, it is assumed that sensory experience and cognition are not based on the passive reception of individual stimuli, but on the creative perception of a certain whole—the image of an object as a whole that is not reduced to the sum of its parts. The object of cognition is also its construct—a creation dependent on such factors like one’s memory, experience, knowledge, attitude or desire. Principles of extracting the whole or the figure from the background (spatial proximity, similarity, good figure, symmetry), the principles of simplicity and the illusory character of perception (illusion is an essential component of images and gives them continuity) function here. In summary, it can be concluded that there are many different concepts of visual perception. This model of perception is referenced by some theories from the field of philosophy and psychology, namely: Gestalt psychology and other psychologies of aesthetic perception, such as psycho-aesthetics, neuro-aesthetics or visual psychology, and philosophical epistemology in part. The aforementioned disciplines are a part of broader theoretical and experimental perception studies [
31,
32,
33,
34,
35,
36].
The following definition of visual perception was adopted for the purposes of the experiment.
Visual perception is a complex cognitive process based on the interpretation of objects, phenomena and processes in the environment based on specific stimuli picked up by the visual system. Receiving a stimulus begins the process of perception, which makes it possible for one to understand what has been seen and to implement the information one has received within one’s system of knowledge and values and to memorise it. Perception is conditioned by the aesthetic and artistic elements of an exposition and by the individual characteristics of the person performing the observation [
18,
19,
29,
30].
The use of eye tracking began to see wider methodological application in the second half of the twentieth century, along with the development of academic disciplines and specialisations such as psychology, cognitive science or human-computer interactions. The period towards the end of the twentieth century saw the technological development of tools enabling the manufacture of small, mobile devices, along with the development of applications for computing data, obtaining specific results and their presentation and interpretation. At present, video-oculographic studies are typically based on using a system of video cameras placed near the subject’s eyes or at a close proximity to their face. During tests, the cameras track the movement of the subject’s eyes and their video feed is recorded by a computer and analysed using specialist software. We can extract a lot of useful information from this data, including which elements attracted the attention of the subject and after what length of time; which element attracted the subject’s attention the longest and which elements were observed repeatedly, what is the direction of the sequence of scanning space or whether the subject was confused or showed interest [
15,
18,
23,
37].
A typical eye-tracking measurement is based on recording two types of information:
Fixations, which are points that the subject looked at. Visual information is collected during fixation. Knowing where the subject looks (the locations they fixate their eyes on) helps in identifying what they noticed. These locations are recorded in the form of dots of varying size, with the size of each dot denoting the duration of the fixation.
Saccades, which are eye movements from one fixation to another. During a saccade (20–40 milliseconds), the brain records no visual information. Saccades are recorded in the form of lines that connect dots (fixations) [
17,
19].
The most often used forms of the graphical presentation of data obtained during tests include: heat maps, gaze plots and area of interest analyses.
The heat map (or hotspot map) makes it possible to determine which element attracted the subject’s attention. In the case of each of the materials presented on-screen, it is possible to display the points that the subject fixated their eyes on, presenting summary attention focus results for each subject group. A longer fixation time is marked by a more intense warm colour, while cool colours denote a shorter focus time. Places without colour denote fragments that were completely ignored by the subjects. A particular case of heat map is its inverted version, called the focus map, which shows only those areas the subjects fixated their eyes on, with the remaining areas blacked out [
18,
20,
32].
The second form of graphical presentation is the gaze plot, which indicates the sequence of fixations on individual areas during the observation of the presented image. Circles are used to mark each gaze point (fixation). The longer the subject looked at a given point, the larger the diameter of the corresponding circle. The number presented inside the circle shows the sequence in which it was observed, while lines symbolise saccades, presenting the path that the subject’s gaze travelled between fixations.
The third form of graphical presentation is the area of interest (AOI). Here, it is possible to separate a large number of gazes that concern distinguishable areas presented on-screen. AOIs can themselves be individually designed by the person designing the study or generated automatically, with a recorded attention distribution percentage. The advantage of using areas of interest over heat maps is the possibility of obtaining specific numerical values that enable a more precise quantitative analysis of fixations and the use of parametric metrics. The so called statistics in use here are different from study to study and depend on their objective [
17].
When analysing areas of interest, the following measurements are typically taken, among others:
time to first fixation; this makes it possible to determine how much time subjects require to find a given area that is significant for the study.
the number of fixations within a given area of interest during observation for one subject and for all subjects; it is assumed that a larger number of fixations indicates greater interest in an area;
total time of all fixations on a given area for a single subject and for all subjects;
the number of persons who made at least 1 fixation relative to the number of study participants; it is assumed that the greater the percentage of these persons is, the more attractive the area is to the subjects;
the number of revisits to a given area of interest during observation for one subject and for all subjects; it is assumed that the greater the number of visits to an area, the more interesting it appears to the viewer (it can represent interest in novelty or content that is difficult, hence the revisit to help understand the information) [
38,
39].
After outlining areas of interest, every area or image used in the study typically shows areas that are unclassified, or not an AOI. These areas, although uninteresting from the point of view of the degree of perception of objects that make up AOIs, can also be included in the analysis from the point of view of the presence of other attractors (elements that attract attention) or distractors (elements that distract one’s attention) [
18].
In conclusion, the main advantage of video-oculographic studies is that they allow one to study the perception activity of test subjects objectively. Eye tracking makes it possible to pinpoint those elements of the image of an analysed object that the observer actually looks at. Therefore, results are based on facts, instead of declarations or conjecture [
3].
3. Research Material, Methods Used in the Experiment, and the Course of the Experiment
The primary objective of the study was to determine the scope of utility of eye-tracking research in relatively objectively assessing the visual perception of space and the works of architecture within it. Mindful of the results of experiments concerning the use of this method, performed by various research teams and the authors themselves for the purposes of studying architecture, urban layouts and landscape architecture, the authors assumed that one can describe and then attempt to define mechanisms of perception that are dependent on external factors through appropriately planned experiments. Such measures are necessary to create repositories of data concerning the perception of various objects and buildings and to describe and spread good practices so as to modify the process of building design from the point of view of improving the quality of life of their users. The authors also assumed that case studies can prove to be the appropriate research method for such experiments. This method is widely used in studies in the social sciences (psychology, management) and can be considered useful in this experiment as, based on an analysis of an individual case with its detailed description, it enables one to draw conclusions as to the causes and results of its course and concerning a certain model of behaviour and any observed technical, cultural and social determinants. Furthermore, in methodological terms, it can include various quantitative and qualitative research techniques [
40,
41].
The case study included the following stages:
preparation of the experiment;
selection of research material for analysis;
selection of the target population;
performance of eye-tracking tests with the participation of test subjects;
calculating the sequence and scope of the analysis of generated quantitative and qualitative data;
research findings presentation and commentary.
The preparation of the experiment included a pilot study intended to perform an initial validation of research assumptions. Due to the experiment comprising a portion of studies and analyses of contemporary Cologne, 10 photographs of the city’s architecture were taken, featuring various views of buildings within space. The photographs, with a vertical and horizontal orientation, presented architecture from up close and from afar, with various technical infrastructure and surrounded by greenery, as well as with persons present in the view and without the surrounding landscape. These views of architecture were selected and based on an analysis of studies presented in publications by Ch. Lebrun et al. [
22], R. Noland et al. [
28], L. Dupont et al. [
26,
27], L. Garcia Moruno et al. [
42] and the authors of [
3,
30]. In terms of selecting the target population of the experiment, a random selection of volunteers declaring no visual impairments was chosen for the pilot study. According to recommendations concerning the number of subjects presented by A. Duchowski [
17], Z. Hoolmovist et al. [
18], J. Nielsen and K. Pernice [
21], and Tobii [
39], the company that supplied the stationary equipment, as well as taking into consideration experiments performed previously by the aforementioned research teams, 30 subjects were chosen. It was assumed that the time of exposure to the photographs on a computer screen would be between 10 to 15 s. It was assumed that results generated in the form of heat maps, focus maps and gaze plots of around half a dozen subjects for each photograph should be sufficient material for analysis during the pilot study.
The pilot study was carried out according to plan and the analysis of its findings made it possible to make appropriate decisions concerning the preparation of the main experiment. It was assumed that, in light of the use of case studies, there was no need to present a large number of photographs to the subjects. Three photographs of works of architecture located in the historical centre of Cologne were taken: one with a purely random view and two with a pre-determined selection of buildings and their surroundings. The first photograph was not intended to be used as research material, as it was meant to stimulate the focus of the experiment’s subjects and lower the level of emotion associated with their initial impressions. The two photographs depicting works of architecture built as designed by award-winning and world-famous architects were the essential research material. One photograph showed a vertically-oriented frame, while the other showed a horizontal one, with the buildings being shown either closer or farther away from the camera and were thus seen from different perspectives. There were no people visible in the two photographs, with exposed elements including greenery and public space with its accompanying technical infrastructure, cars and public transport vehicles. The elimination of the presence of people, who are considered to be perceptual distractors, was assumed to allow for an analysis of other distractors within the surroundings of historical buildings. The presence of greenery could allow a confrontation of the eye-tracking experiment’s findings with those of other studies concerning landscape architecture [
43]. Concerning the target population of the experiment, it was decided to increase considerably the number of subjects taking part in the experiment relative to the number recommended in the literature and to the number of persons who participated in the pilot study. After deciding on a population count of 100, the authors decided that the population type should be more homogenous in terms of age and to exclude persons with an architectural education. It was assumed that persons belonging to generation Z could be a good population choice in light of the experiment’s objective. The recruitment of volunteers was performed by telephone, with two assumptions regarding age and educational background. The time of exposure to each photograph displayed on-screen was 10 seconds. Furthermore, the authors assumed that data would be generated by the eye-tracking system for pre-determined areas of interest.
The research material prepared in accordance with guidelines that had been formulated after the pilot study encompassed two visualisations of works of architecture in the space of the historical centre of Cologne, Germany.
The first building to be studied was the “Kolumba” museum, designed by the well-known Swiss architect and Pritzker prize [
44] laureate Peter Zumthor [
45].
The museum is located in the historic centre of the city and occupies a part of the urban block delineated by the following streets: Brückenstraße, Kolumbastraße, Ludwigstraße and Minoritenstraße. Its vicinity is primarily composed of multi-storey housing and office buildings with commercial spaces on the ground floors. It is of varied cultural value as only some of the buildings near the museum are actual historic townhouses. The townhouse at 17 Brückenstraße is one such building. The ground level of its street-facing facade is composed of large windows that are highlighted and separated by pilasters that are slightly extruded from the facade’s surface. These pilasters are crowned by reliefs depicting human figures. The aforementioned windows fulfil the role of storefronts. The first-floor level, similarly to the ground floor, has a notable rhythm of window openings (in a shape more or less resembling elongated rectangles), which form windows or porte-fenêtres providing access to balconies. The upper storeys are much less architecturally varied. They feature narrow windows that are rhythmically placed along the entire width of the facade.
The part of the city under analysis does not have many green spaces. In this context, the green square near the museum gains a particular significance. It is located at the intersection of Brückenstraße and Ludwigstraße.
The museum building was built in 2007 and incorporated the adaptive reuse of the ruins of the medieval church of St. Kolumba that was destroyed during a bombing raid of the city in 1943, along with a bold contemporary design above them [
46].
The main idea devised by the architect was to incorporate the museum into the extant context and to continue the accruing of historical layers. The building’s massing is massive, has three storeys and is enclosed in cuboid forms. Notably, the walls of the museum not only feature the relics of the Gothic temple and its predecessors (a Carolingian and a Romanesque church), but also those of a villa from the period of the end of the second and the beginning of the third century CE, which remembers the ancient Roman beginnings of the city.
The facades of the museum were built from bright, elongated, beige-coloured brick, which contrasts with the stone relics of the church of St. Kolumba, which are visible on southern and western facades. Other important elements of the massing include the remains of the Gothic sacristy, which were left in place in accordance with the concept of the “permanent ruin”, as an original archaeological reference in the south-western corner of the museum.
The facades were designed to feature few windows, which causes the observer to see them as almost complete solids, interspersed in places with openwork strips. This produces the impression of an austere and minimalist work and does not compete with the well-preserved Gothic relics in the form of openings with pointed arches.
The main entrance to the museum is located in the southern facade. It is formed by a simple, recessed opening [
39,
40,
41]. A view of a fragment of the museum’s facade and that of the historical townhouse and square from the side of Bruckenstrasse and Ludwigstrasse is presented in
Figure 1.
The second of the investigated buildings is the “Weltstadthaus” department store designed by the outstanding Italian architect and likewise Prtizker prize [
42] laurieae Renzo Piano [
43].
The building that houses the facility, similarly to the “Kolumba” museum, is located in the historic city centre. It occupies the rather narrow space between Cäcilienstraße, Antonsgasse and Schildergasse. The building is adjacent to contemporary commercial and office buildings. Most of them were built in the 1970s. Another notable piece of information is that the late Gothic church of St. Anthony is located nearby, to the south-east of Renzo Piano’s building.
The building’s most important facade faces southwards. It is highlighted thanks to the broad circulation arterial of Cäcilienstraße, which forms an appropriately wide open space in front of it, facilitating observation.
The building, erected in 2005, despite the use of modern materials such as glass and glued-laminated timber which enabled its flowing, organic form, harmoniously blends into the extant cultural context of Cologne’s city centre. The “Weltstadthaus” is another “blob” architecture project (a part of so-called “blobism”), which, as a current of postmodernism, is characterised by curved and rounded building forms or “droplet architecture”.
The building is composed of two parts. From the west, from the side of Antonsgasse, it is composed of a facade from natural stone with a classical, cubic shape. The northern facade (from the side of Schildergasse) and the western facade were designed in contrast to this simple form. They are composed of organic, rounded forms made from glass curtain walls with high thermal insulation and optical parameters. The form of the building necessitated that the glass panels and profiles had to be manufactured using high-precision CNC (computer or computerized numerical control) technology.
Thanks to the abovementioned measures and the use of then-cutting-edge construction materials and technologies, the “Weltstadthaus” has remained one of the most recognisable buildings of the centre of Cologne [
47,
48,
49,
50,
51,
52]. A view of a fragment of the “Weltstadthaus” and the church of St. Anthony from the south is presented in
Figure 2.
The subject population for the experiment was selected in a deliberate manner. The subjects were selected from among young people belonging to generation Z (persons born after 1995, who were mostly still university students). The distinct characteristics of this generation were the reason behind this decision. Members of generation Z are generally reported to have a realistic outlook on life, while also being creative and ambitious. They have been brought up under the influence of talent shows and iEverything—iPhones and iPods. They also stand out because of their approach to knowledge—they learn by themselves using online sources. They are also characterised by high mobility, their knowledge of foreign languages, their frequent travels and having acquaintances from all across the world. Members of generation Z display a natural approach to online and information and communication technology (ICT) studies. Generation Z is sometimes labelled as Generation C—which stands for connected [
53]. It was assumed that young people from Generation Z who studied in Krakow can constitute a test subject population for this experiment. The subject population encompassed 100 individuals within the Generation Z age group, with additional selection criteria such as: the character of their education being unrelated to architecture and a lack of visual impairment. The size of the population was deemed sufficient from the point of view of the study’s methodological assumptions, in addition to being much higher than population samples taking part in similar studies from other fields [
8,
17,
20,
21,
22,
38]. The population’s structure in terms of gender was as follows: 66% of the population was composed of women and 34% was composed of men.
Prior to the start of the test, the participants were informed about its course. However, no information about the objective of the study and the manner of analysis of the gaze plot of the subject was divulged. Withholding this information was intentional so as not to suggest areas of interest and attention focus. The study was performed using a stationary Tobii X2-30 Eye Tracker with specialist equipment [
39]. Prior to displaying photographs of the selected buildings on a computer screen, the eye-tracking device was calibrated for each subject to adapt it to their eyes. Afterwards, each of the photographs was displayed on the screen for 10 seconds.
The areas that the subjects fixated their eyes on were recorded by the computer and processed using specialist software and could be generated in the form of various types of plots. Due to the objective and goal of the study (two buildings held in high regard by professionals, along with their surrounding space and architectural context), the following sequence and scope of analysis were adopted for each image:
determining areas of interest and the “unclassified” area;
the generation of so-called descriptive statistic metrics, i.e., the quantitative data for the selected areas;
the presentation of cumulative quantitative data in graphical form, as a heat map;
the generation of quantitative data for a single gaze plot, including the outlined areas, followed by their qualitative graphical presentation.
Three areas of interest were outlined for image 1 with the “Kolumba” museum building (1AOI - formed by the museum building; 1AOI2-a fragment of the historical residential and office townhouse with store windows at 17 Bruckenstrasse 17; 1AOI3-formed by the greenery of the square adjacent to the museum at the intersection of Bruckenstrasse and Ludwigstrasse).
Area of interest 1AOI3 was included because of the possibility of greenery acting as an attractor—drawing in the gaze of the observers. Furthermore, an unclassified area (Not on 1AOI) was included because of the possibility of it featuring distractors, i.e., elements that could distract the subjects, in the form of parked cars and road infrastructure.
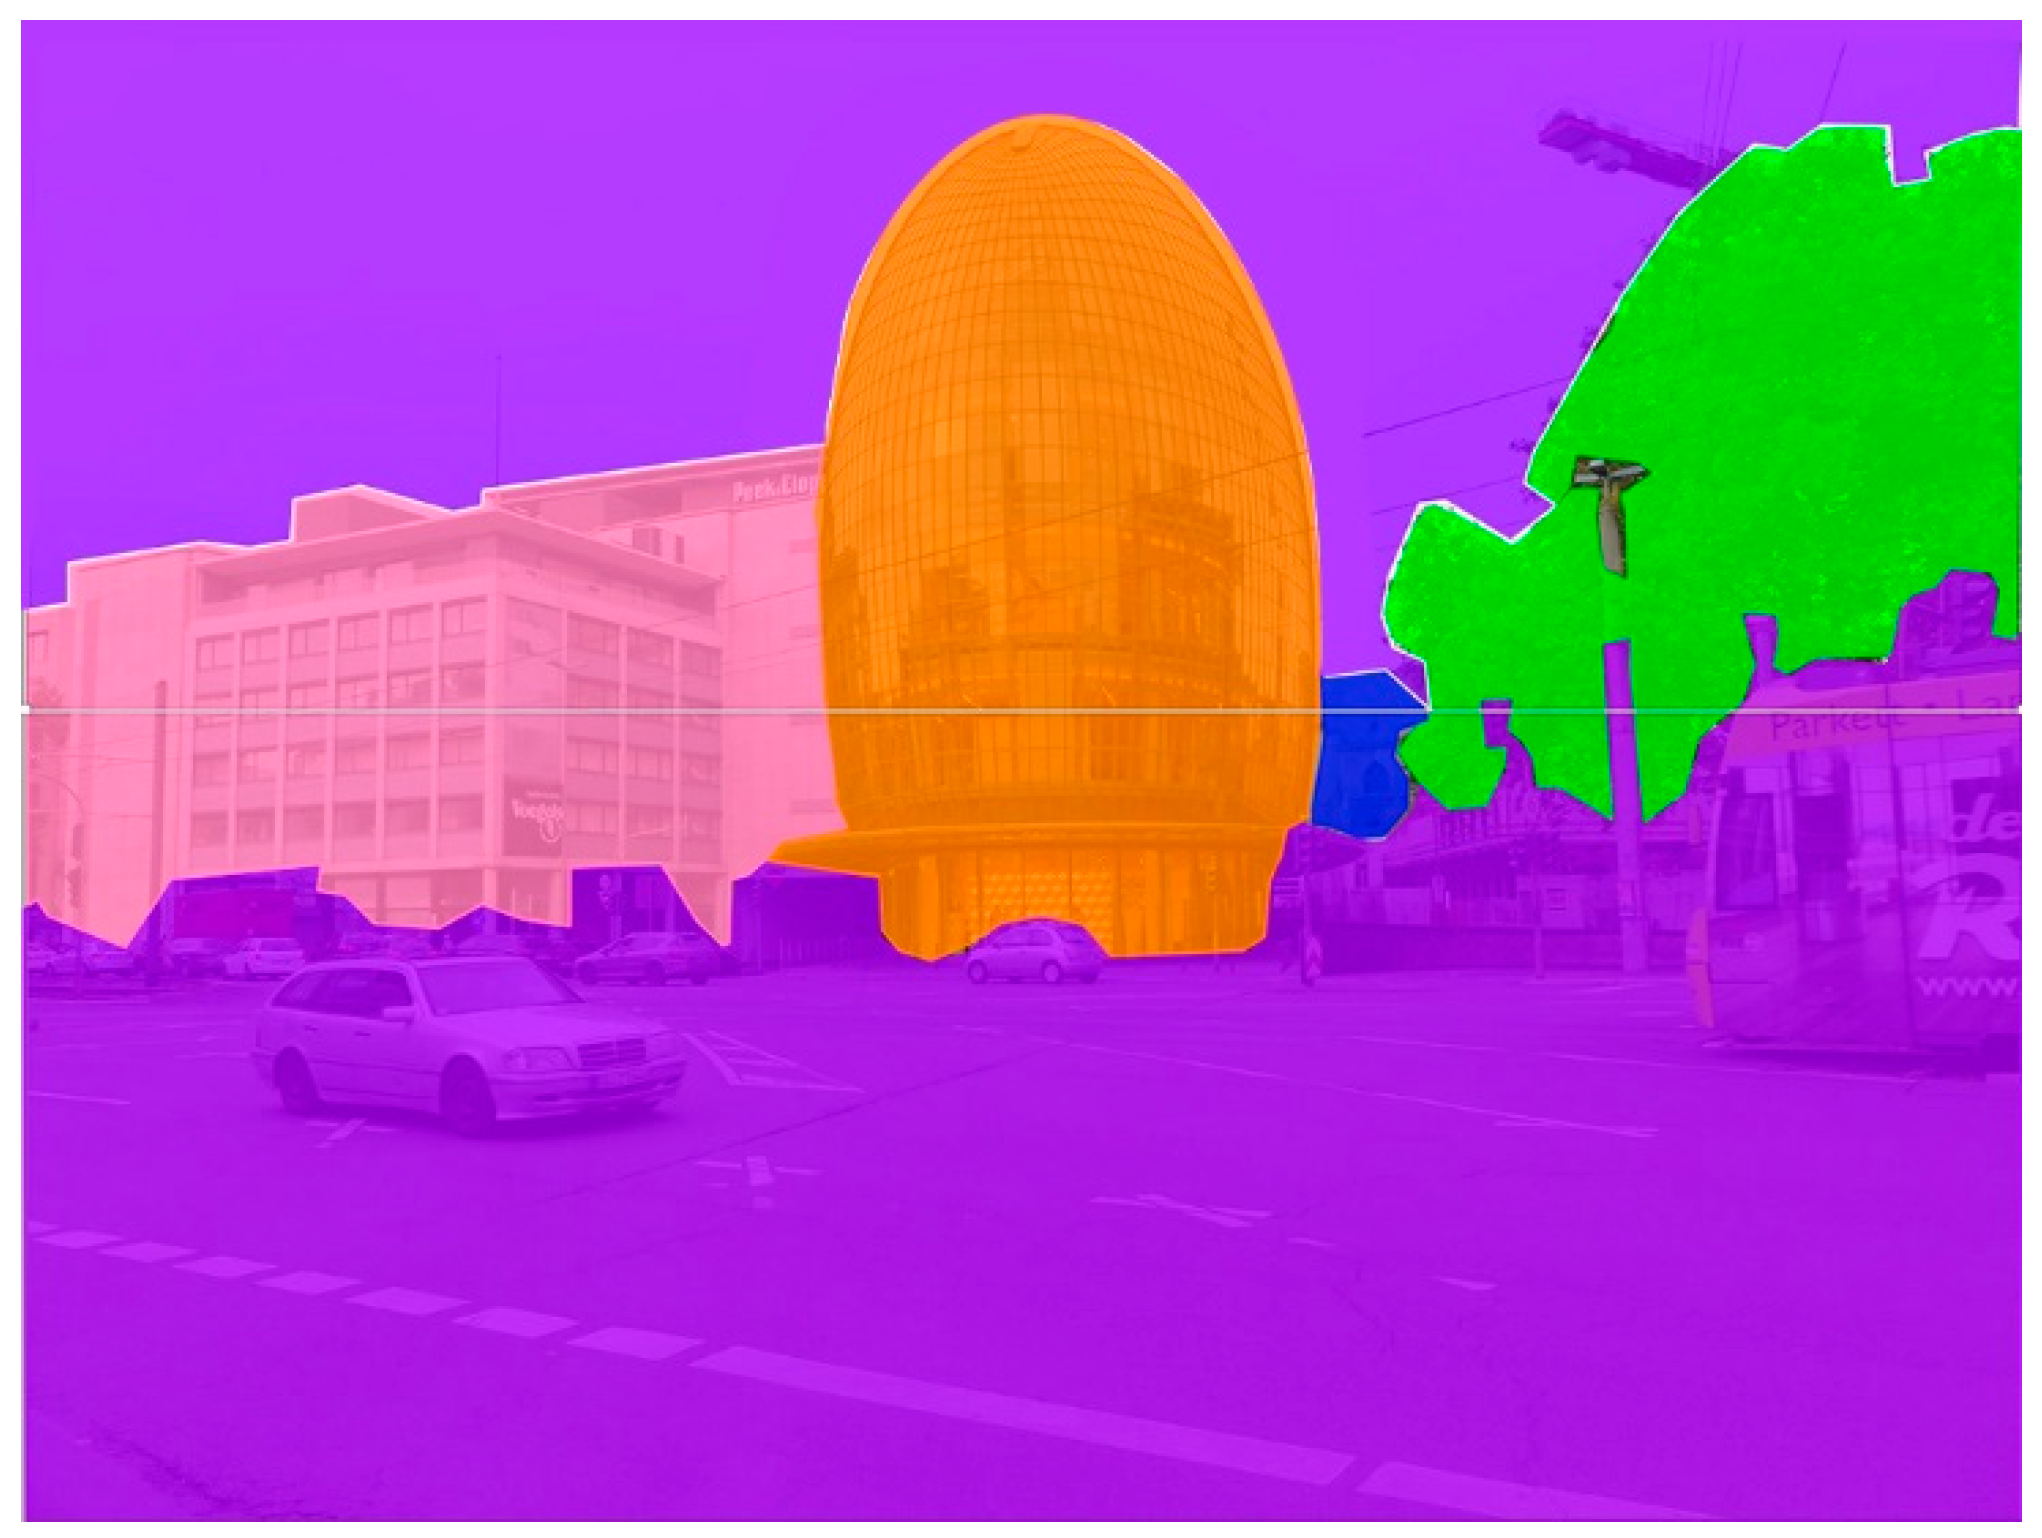
For image 2, which features the “Weltstadthaus” commercial building, four areas of interest were defined (2AOI1—the “Weltstadthaus” building itself; 2AOI2—the church of St. Anthony; 2AOI3—the frontage of commercial and office buildings; 2AOI4—the visible greenery). It was assumed that the area of greenery located near the buildings could play the role of an attractor. An unclassified area (Not on 2AOI) was also included, in the form of the Cȁcilienstraβe circulation arterial, along with vehicles and road infrastructure, which could distract the subjects.
The data generated for the outlined areas—i.e., parameters—included: average time to first fixation, the number of fixations during observation, the average number of fixations per subject, the total duration of all fixations, the number of persons who performed at least 1 fixation relative to the total number of participants, the number of visits during observation and the average number of visits per person. The numerical data that were generated was grouped by subject gender. Apart from heat maps, inverted heat maps were also plotted to be used in distractor analysis.
The data generated for each gaze plot, including the outlined areas, concerned the following parameters: time to first fixation, the number of fixations and their percentage in each area, the total duration of all fixations during observation, the number of visits and the minimum and maximum fixation time. A graphical presentation of eye movement paths was generated based on this data for a representative individual from among the subject population, whose parameters were the closest to the average parameter values for areas associated with buildings of the highest value as rated by professionals.
4. Research Findings and Analysis
Image 1 is oriented vertically. The main building (the “Kolumba” museum), in the context of the analysis, is set back relative to the observer. In the first plane, to the left, we can see the facade of the historical building, while to the right we can see trees. A significant portion of the image’s surface area below the view of the museum is occupied by the intersection of Bruckenstrasse and Ludwigstrasse.
The areas of interest and the unclassified area taken into consideration in the assessment of the visual perception of architecture and its surroundings by subjects who observed image 1 has been presented in
Figure 3. The parameters describing the process of perceiving these areas have been presented in
Table 1.
Analysis of the generated numerical data concerning average time to first fixation, the number of all fixations during observation and their duration have provided evidence that the unclassified area (Not on 1AOI) was not only noticed the quickest, but was also the most interesting to the observers. The share of the number of fixations on this area amounted to over 43% of all fixations. The area’s greatest attractiveness was confirmed not only by the fact that it was noticed by all observers, but that it was also the most explored, as proven by the number of observer revisits to this area. The share of revisits to this area relative to all revisits amounted to 37%. The area representing the space of the streets behind the Kolumba museum from the south-west, up to the urban block outlined by Bruckenstraβe and Ludwigstraβe along with its infrastructure and parked cars, appeared to be the most interesting to the observers. This area, constituting the surroundings of works of architecture, occupies a significant portion of the photograph. It can be assumed that, similar to the case of studies performed by Ch. Lebrun et al. [
22], this space has a significant impact on the perception of works of architecture. Numerical data indicate interest in this area, which features various elements of street infrastructure and standing cars. These elements, as indicated in studies by R. B. Noland et al. [
28] and the authors of [
30], can dominate the interest of viewers.
The second area shown to attract the greatest attention and focus was area of interest 1AOI2. The fixations on this area constituted 31% of all fixations performed on the entire image. Only one person out of the entire population was uninterested in this area and did not look at it. The share of revisits to this area amount to almost 29% of all revisits made by the viewers to each area. The area outlined by the view of a fragment of the facade of the historical townhouse at 17 Bruckenstraβe along with its ground floor commercial section was also interesting to the subjects, although less so. The initially greater interest in this building as an area relative to the building of greater cultural value can be a result of its elements, which are important in cognition theory, such as: its perspective view, spatial character, shape, lines, colour and texture [
34,
35].
The third area in terms of interest shown by those who viewed the image was area 1AOI1, which is a view of a part of the Kolumba museum’s facade from its south. It is the area where we can see the building with the greatest cultural value and acknowledged architectural design. The average time to first fixation on this area was four times as long as the value for the unclassified area. The number of fixations on this area was significantly lower than the values for the previous two areas and constituted only 18% of all fixations. Despite a similar degree of interest to other areas (almost every subject performed at least one fixation), the degree of exploration was lower, at a level of slightly over 25% of all revisits to all areas. The above can be considered proof that elements that form perceptual notions that are significant in perception theory (according to R. Arnheim), such as shape, light, colour and texture did not have as significant of an impact as might be expected [
35]. Therefore, it can be stated that the architectural design incorporating the medieval church of St. Kolumba which made it a part of a modern museum building held in high regard by professionals and that has won numerous prizes, along with its visually perceived informative content, was not a particularly strong stimulus to the viewers.
The area that the observers noticed the slowest and the one that attracted the least amount of interest from observers was area 1AOI3. It was formed by the greenery of the small green square adjacent to the Kolumba museum. The average time to first fixation was 10 times as long as in the case of the area spotted as the first (Not on 1AOI). As many as 31% of the viewers did not perform a single fixation on this area, while in the case of those that did, the area was visited only once in most cases. Fixations on this area constituted only around 7% of all fixations performed by those who observed the image, providing evidence of its lack of attractors and distractors relative to the areas featuring works of architecture. The late spotting of greenery, as indicated by average time to first fixation, is theoretically understandable, as studies conducted by, among others, D. Junker and Ch. Nollen and L. Dupont et al. on the perception of greenery among buildings indicate its perception as varied [
23,
26]. The number of fixations and the low level of exploration indicate a lack of interest in greenery. Therefore, no conclusive evidence of the role of greenery as an estimator of “mystery” to the viewers was found [
43].
The statistical analysis of the data generated by the computer system for the entire studied population concerning the degree of their variability (standard deviation and coefficient of variation) showed high variability irrespective of the subject’s gender. No correlation was found with the findings of M. Schissel et al. [
30] concerning significant gender-dependent differences in perceiving photographs, particularly concerning the much stronger attention focus reportedly displayed by men relative to women. However, the statement that the elements conditioning visual perception were mostly individual character traits, such as aesthetic and artistic sensitivity or one’s awareness level [
18,
19,
29,
30] was confirmed. Such views are presented by U. Neisser in the concept of cognitive psychology, R. Arnheim in the concept of “visual thinking” and in Gestalt psychology [
33,
35,
36]. This was also the motivation behind analysing average values for quantitative data for such a large population group, whose size significantly exceeded recommendations featured in the literature [
8,
17,
20,
21,
22,
39].
Heat map no. 4 is a graphical presentation of the places and elements that attracted the attention of all subjects and held it the longest (
Figure 4).
The heat map in question shows three major hotspots. The first, larger hotspot and the second, smaller hotspot are formed by the surface of the image of cars parked along Bruckenstraβe near the Kolumba museum. They attracted and held the gaze of viewers significantly longer than other areas. These red, hot areas extended through yellow areas to extensive green ones. These mutually adjacent areas were fragments of the unclassified area (not on 1AOI). Another clear, yet smaller, focus of viewer attention was also shown near the traffic light infrastructure and on the street surface, forming yellow and green areas. The third major hotspot on the map is a fragment of the facade of the historical building (area 1AOI2), in its storefront-featuring ground-floor section. An area of intense red coloration formed by numerous long fixations on the area of a round advertisement and the lighting above the storefront awning expanded through yellows to fading greens. A number of smaller green-coloured areas can be seen in the commercial section of this townhouse.
No coloured signs of interest were observed for original facade elements such as sculptures above the ground-floor section of the building, which constitute its cultural value, despite greater interest in this building as an area than the museum. Heat maps did not point to the perception of the entirety of the building in accordance with cognition theory’s “visual thinking” and Gestalt psychology [
35,
36].
The area outlined by the facade of the museum (area 1AOI1) showed various clusters of eye attractors, with yellow and green colours. They were present both in the historical section, i.e., the stone remains of the Gothic temple, and in the openwork section of the facade and the part made from bright, contrasting brick. The varied facade, which appeared to attract the attention of viewers, inspired viewer interest in the entirety of the building and not just a few of its elements. The museum’s design included numerous attractors for viewers—particularly those of high aesthetic awareness and sensitivity, hence the yellow and green colours. To perform a detailed analysis of distractors, inversed heat maps were prepared (according to a procedure used by Bric Visual Solution) [
38]. The inversed heat map confirmed the presence of distractors in the form of an area (a sequence of cars), an advertisement and the lighting above the shop window’s awning.
The sequence and length of the observation of the aforementioned areas and objects that are essential in the aspect of the process of visual perception for a selected representative of the studied population has been presented using generated statistical metrics in
Table 2, as well as in graphical form, as shown in
Figure 5.
Numerical data from
Table 2, presented in a corresponding view with
Table 1 and supplemented by the minimum and maximum fixation times, enable the analysis of the perception of buildings by a specific person. In this case the population representative was male.
The analysis of statistical metrics of the descriptive heat map for the entire population, as well as the gaze plot for the selected person, provide evidence in favour of stating that the processes of perceiving buildings and spaces were practically analogous. There were some differences that had probably been caused by the individual traits of the person performing the observation, e.g., their state of socio-cultural awareness. The difference between the averaged perception characteristic and that of the selected person was largely rooted in the much quicker fixation on and interest of the selected person in the area outlined by the green square near the museum (1AOI3). The duration of the fixations on this area was close to the average value, but the number of fixations and revisits was greater. Furthermore, no clear difference in the number of fixations on areas with works of architecture (1AOI1 and 1AOI2), as in the average for all subjects, was observed here. Instead, the difference pertained to the duration of all fixations and a greater focus of attention on the historical commercial townhouse.
The first element of the image to be noticed by the person whose gaze plot is discussed were the cars along the street near the museum (area Not in 1AOI1). The first fixation took place after an observation time close to the average value for the entire population, whilst its duration (811 ms) was relatively long when compared to the average and the longest among all of the fixations of this person in this area. The two subsequent fixations were within area 1AOI2, while the elements that were observed were associated with the facade of the ground-floor section of the townhouse. The third fixation has been presented as a circle placed near to the round advertisement board and the lighting, and has the largest diameter of all the circles comprising the gaze plot, as it lasted for 981 ms.
The first sign of interest in the facade of the museum is illustrated by fixations 5 and 6. The duration of each was relatively short, at around 300 ms. They focused on an element (a Gothic window) in the historical section and the bright section of the contemporary facade of the building. Subsequently, the gaze plot shows how greenery, traffic light infrastructure and the road surface and its information lines were viewed, in the order listed. Of note is the return of the viewer’s focus to the openwork section of the museum’s facade (fixation 17) and the bright section above it (fixation 21). The previous gaze plot path and fixations in area 1AOI1 could be considered evidence of the perception of the museum as an entire object by the person. Therefore, it can be stated that perception was based on it shape, light, colour and texture. It can also be presented as R. Arnheim’s “visual thinking” [
35]. Only fixation 20 pointed to renewed interest in the facade of the historical townhouse—specifically, the balcony on one of the upper floors. This observation lasted a substantial amount of time, with its fixation time amounting to around 720 ms. The last three fixations were also focused on the townhouse, but on its ground-floor section featuring storefronts. The occurrence of the last and longest fixation (778 ms) here can point to the subject becoming bored with the image, instead of merely showing heightened interest.
The individual subject’s gaze plot analysed above, analysed against the heat map for all subjects, shows how the different elements and objects within the space surrounding the professionally acknowledged and prize-winning architectural projects can shape the process of their visual perception by viewers through the sequence of observations and interest in them, followed by their study.
The numerical data obtained in the study and their analysis can be used to theoretically present the process of visual perception of presented photographs in accordance with the chosen concept of cognition theory, e.g., Gestalt psychology [
34,
36]. However, this subject is a separate research problem that exceeds the factual scope of this experiment.
The second photograph used in the experiment, labelled as image 2, has a horizontal orientation. The central placement of the main building (the “Weltstadthaus”) was deliberate in relation to the photograph’s analysis. To the left we can see the commercial and office building adjacent to the “Weltstadthaus”, while to the right is the greenery surrounded by buildings. On a further plane there is a fragment of the late Gothic church of St. Andrew. A large portion of the photograph below the “Weltstadthaus” is occupied by a fragment of the Cäcilienstraβe arterial, with its typical road infrastructure, cars and tram.
The areas of interest and the unclassified area outlined for the purposes of the analysis of this photograph have been presented in
Figure 6. The descriptive statistical metrics—the parameters—are shown in
Table 3.
After performing a holistic analysis of the parameter values that describe the process of the visual perception of architecture and its surroundings, it can be concluded that the perception of the building selected for analysis—a prize-winning work of architecture widely acknowledged by professionals—was different in this case. Area 2AOI1 (the facade of the “Weltstadthaus”) and the unclassified area (Not on 2AOI) were determined to be the most readily noticeable and most interesting to those who viewed the image. The share of the fixations on each of these areas among all fixations amounted to around 40% each. The facade of the “Weltstadhaus”, a building with a curved and rounded shape (“droplet architecture”), was the first to be looked at and was explored numerous times (high number of revisits) by all of the viewers when compared to the unclassified area, which featured numerous elements that, by attracting the viewers’ attention, could act as distractors and hinder the perception of the value of the design of Renzo Piano’s project. It should be added that area 2AOI1 was the only one to achieve a 100% notice rate among all subjects. Apart from shape, material type and colour, essential perceptual elements most probably included light and shadow, and the repeating shape of the reflected building. Light and shadow can significantly affect the visual expression of a building’s massing and composition and the perception of the aesthetic of an architectural form [
35].
The second building, located to the left of the “Weltstadthaus” (area 2AOI3) was noticed by almost all of the viewers, who did so in a relatively short time (time to first fixation) relative to the remaining areas of interest. However, the share of the number of fixations on the facade of this building amounted only to 18% of all fixations performed on the photograph by the subjects. Its degree of exploration was at a similar level to that of the unclassified area, which had a much higher number of fixations. One can assume that the elements of the facade of this building inspired interest and a desire to inspect them, hence the number of visits. These areas dominated the attention and visual perception of the photograph’s viewers.
The remaining areas of interest (2AOI2 and 2AOI4) were not only noticed to a small degree (attractiveness estimated at 14% and 34%, respectively), but their share of fixations relative to all fixations was below 1% and slightly above 2%, respectively. It should be concluded that this view of the historical church of St. Andrew was practically invisible to the viewers. The area with greenery was more noticeable (almost a half of all men fixated their eyes on it at least once) and neutral from a cognitive point of view.
Similarly as in the case of data concerning image 1, no significant gender-based differences were found in the perception of the elements of the photograph among the experiment’s subjects. This provides evidence that an analysis performed on a large population pool can ignore gender as a factor.
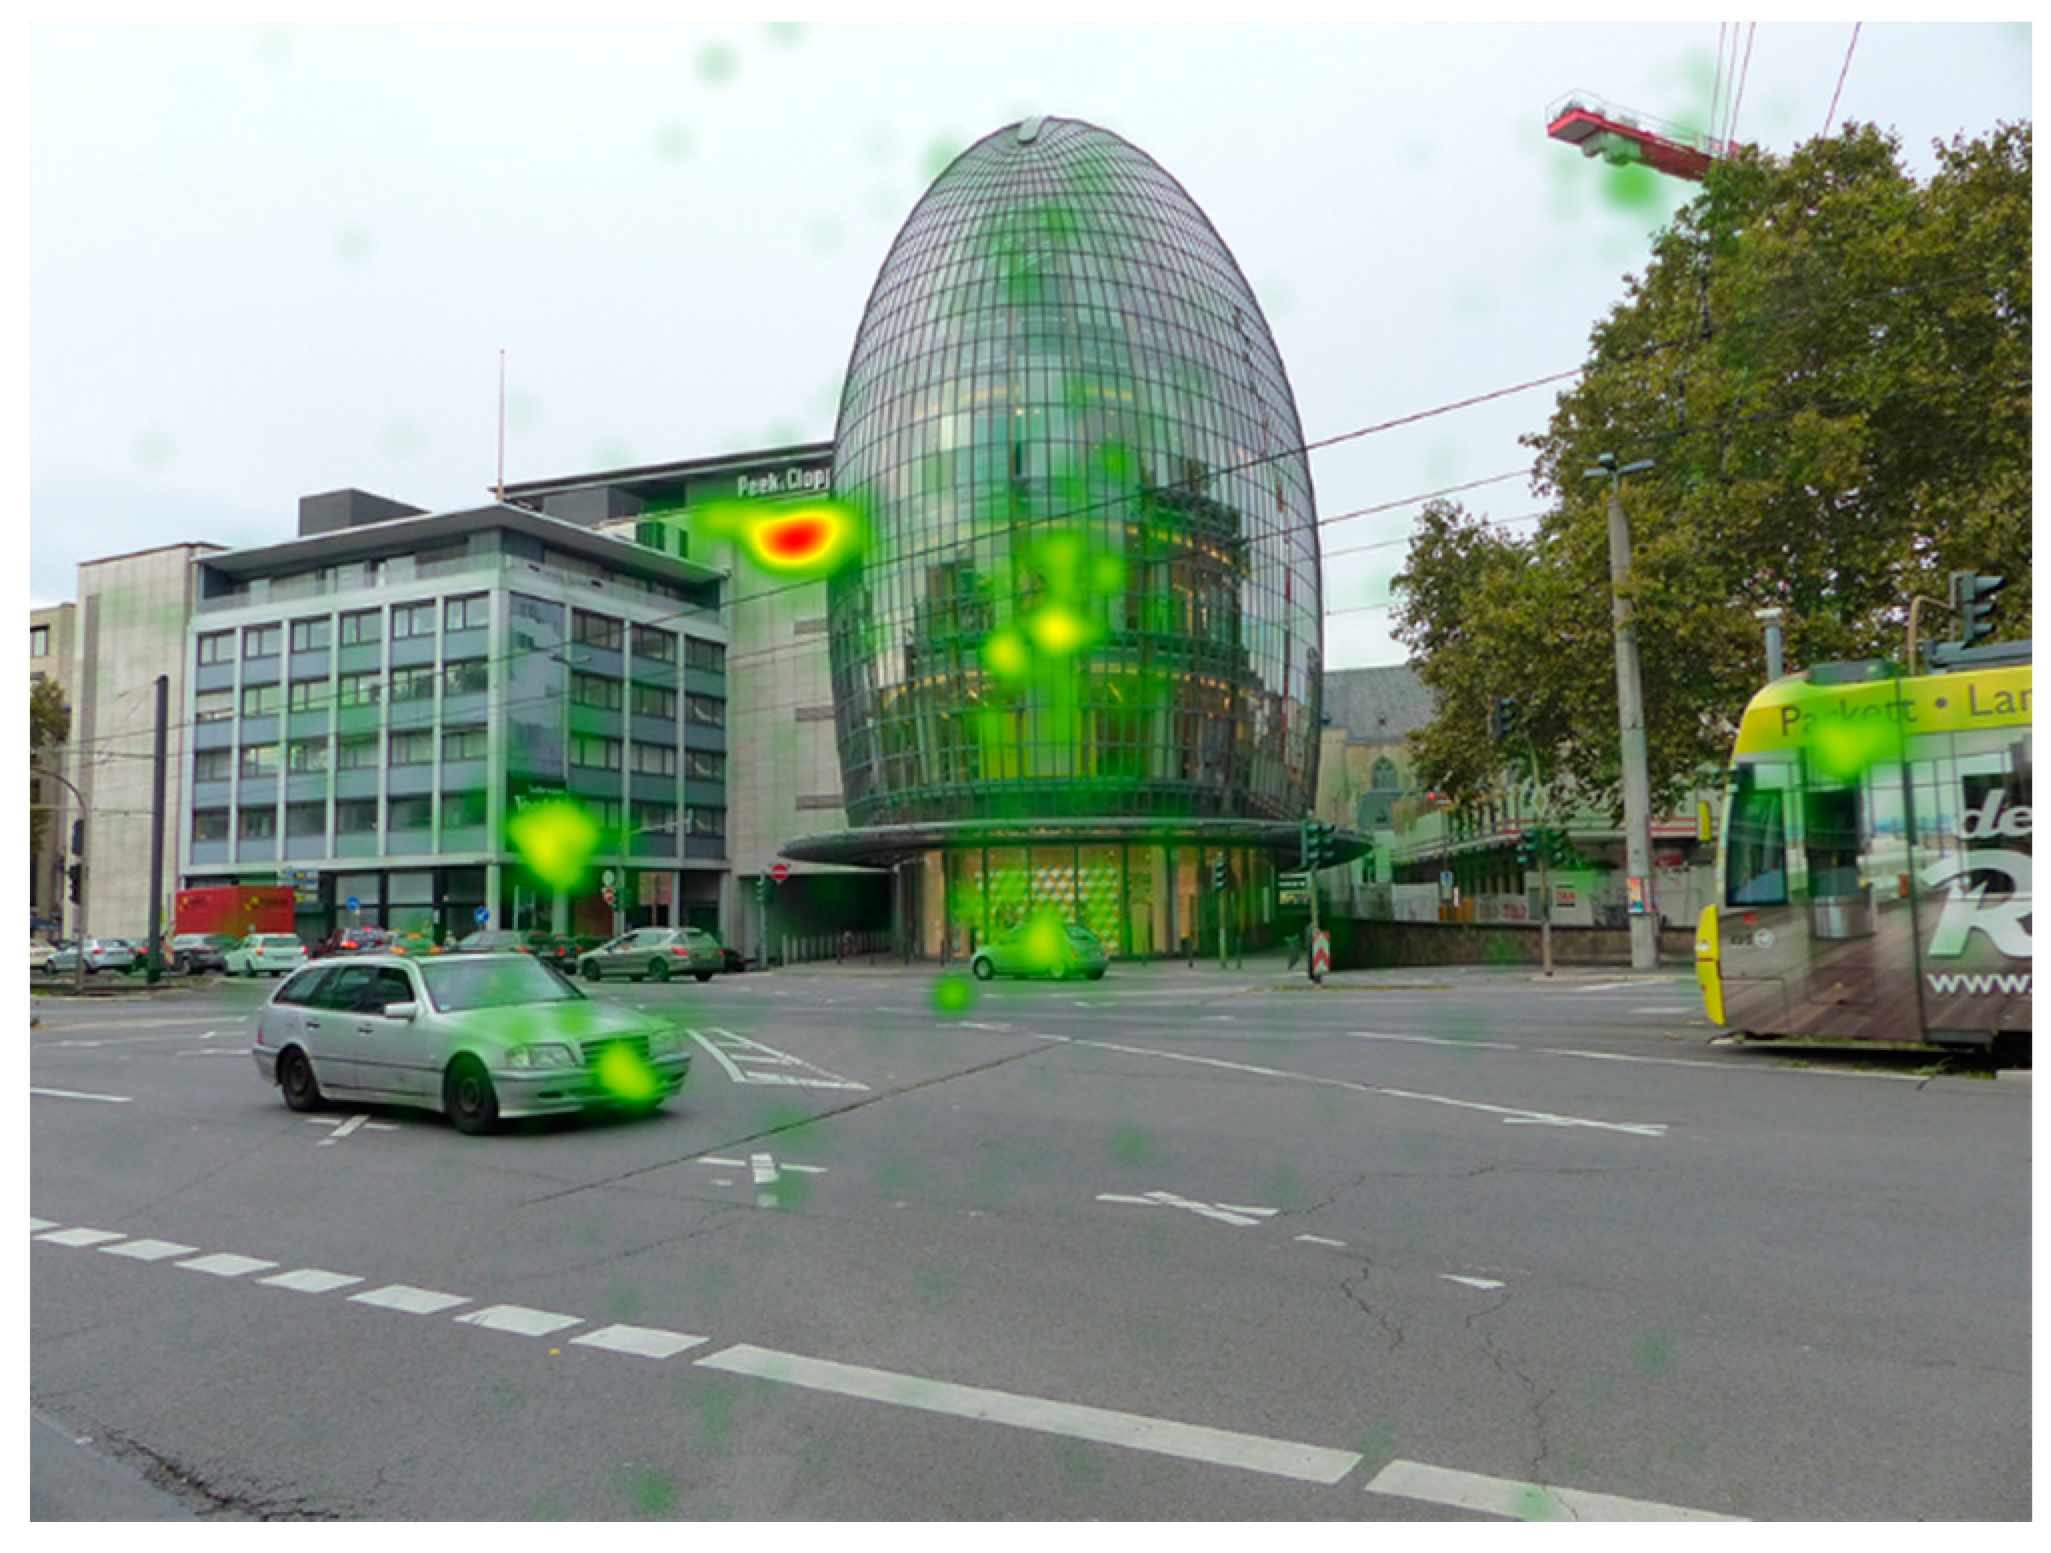
The graphical presentation of the places and elements that attracted and focused the attention of all subjects in the form of a heat map has been presented on
Figure 7.
The heat map has only one major hotspot, which attracted and held the attention of the subjects. The area, with a red colour and a yellow outline that fades into horizontal, blurry green elements, is located in the upper portion of the commercial office building’s facade, below a horizontal advertisement featuring a white inscription. It was the major attractor within area 2AOI3, which attracted the most attention. The second attractor on the facade was another advertisement with an analogous black and white colour scheme, located at the height of the first floor, near the corner of two outer walls. A yellow and green, circular-shaped area covered almost the entirety of the advertisement. In area 2AOI1, the facade of the “Weltstadthaus”, there are four yellow spots that blend into a green surface that stretches vertically in two directions. They are present in the “droplet-shaped” part of the facade. A blurry green colour is also visible along the entire height of the object. The building’s form, which proved attractive to viewers, resulted in interest in the entire building and its key perceptual elements. The heat map for the unclassified area, which attracted around 40% of all fixations, also displayed yellow and green areas that covered elements which attracted the attention of the viewers. Analogous to the area Not on 1AOI, in this case they were also mostly associated with cars and the surface of the road, in addition to a public transport vehicle, near its section with an inscription denoting its route. This was also visible on an inverse heat map, similarly as in the case of the “Kolumba” museum.
The gaze path and the duration of fixations on the abovementioned areas and elements have been presented on data generated for one of the subjects, meant to serve as an example, and presented in
Table 4. The gaze plot for this person, who was also male, analogous to the case of photograph 1, has been presented in
Figure 8.
Analysis of quantitative data describing the heat map for all subjects and the gaze plot for the selected person provides evidence of an above-average interest of that person in buildings and their architectural elements relative to the entire population. This is corroborated by a higher number of fixations on area 2AOI3 and their greater duration, making one fixation in area 2AOI2, which was noticed only by 14% of all subjects, while maintaining an analogous interest in area 2AOI1. Furthermore, the aforementioned statement is also supported by the time to first fixation in the unclassified area being twice as long relative to the average for the entire population. This male subject completely ignored area 2AOI4 (the greenery), despite a higher attraction estimator value for this area indicated for the remainder of the population in reference to area 2AOI2.
The gaze plot for the subject selected for analysis, similarly to the one pertaining to photograph 1, was composed of 24 circles of varying diameter, linked by saccades.
The first five fixations were on the “Weltstadthaus” building’s facade, the first landing on the base of the glass wall comprising the rounded form, with the following landing on its subsequent floor, whose interior is visible from outside. The duration of each fixation was around average, and in the case of fixation 3 was even the shortest of all the fixations on this area. Fixation 6, which landed in the area formed by the facade of the nearby commercial and office building, had the longest duration of all of the fixations on this photograph (1638 ms). This fixation, indicated by the circle with the largest diameter, which almost completely covers the advertisement, corresponded with the heat map’s major hotspot. The two subsequent fixations also landed on the facade of this building, with fixation 9, which ended this exploratory visit, also having a long duration (914 ms). The five subsequent fixations landed in the unclassified area, on the opposite side of the photograph. The first focused on an element of a building that was under construction, while the three successive ones were aimed at the tram car in its upper section featuring an inscription detailing its route. Fixation 14 was the only one to target the church of St. Anthony, located to the south of the “droplet” building and visible on the far plane of the frame, from the side of the Cäcilienstraβe arterial. This object held the attention of the viewer for around 500 ms. The following fixations amounted to 3 visits to the unclassified area and 3 to the area outlined by the facade of the commercial and office building. Within the area Not on 2AOI, the elements that were noticed and that attracted attention included the traffic light infrastructure, overland power cables and a car visible on the first plane of the photograph. It was a distractor, although it became active relatively late (fixation 19). The final four fixations, including fixation 24, which had the longest duration in this area (657 ms), focused on the building inspiring the greatest interest, namely the “Weltstadthaus”, a project by Renzo Piano and one of the most recognisable buildings of Cologne’s city centre. The gaze plot, along with its fixations and the saccades linking them, constitutes valuable analytical material along with the statistical metrics that describe it, allowing a better understanding of the process of visual perception, presenting the sequence and type of elements that were noticed, the implementation of the collected information within the system of the knowledge and values of the person observing a photograph. It is possible to determine attractors and distractors for specific persons with a defined aesthetic and artistic sensitivity and awareness concerning values within the space that surrounds them.


