1. Introduction
Seismic isolation is based on well-established mechanical principles [
1,
2] and it is nowadays widely adopted worldwide both in the realization of new buildings [
3,
4] and retrofitting existing ones [
5,
6,
7]. Several studies have demonstrated the effectiveness of base isolation in the case of historic structures with the aim to preserve and reuse the buildings or protect their non-structural elements and contents [
8,
9]. A wide variety of seismic isolators are currently available on the market [
10,
11] and further devices are being developed and tested in research laboratories [
12,
13]. Although they are based on various mechanical phenomena (i.e., elastic response of soft materials, yielding of metals either in bending or torsion, surface friction, sliding, etc.), the mechanical behavior of seismic isolators is generally characterized by non-linear behavior [
14,
15] and, hence, non-linear time history (NLTH) analyses are needed to consistently simulate the response of base-isolated (BI) buildings subjected to seismic excitations [
16].
However, NLTH analyses are computationally demanding and time consuming, which makes them unfit for practice-oriented design activities. Therefore, modern codes and guidelines [
17,
18,
19,
20] consider both linear and non-linear analysis methods for seismic design of base-isolated buildings. Specifically, linear static analysis (LSA) is generally permitted with some limitations, depending on the properties of both the isolation system (IS) and the building super-structure. It is based on defining a pattern of horizontal forces and equivalent stiffness and viscous damping for the base-isolation system [
21,
22,
23,
24]. According to various structural codes, IS may be modelled by an equivalent linear visco-elastic behavior with some limitations defined in terms of effective damping ratio, re-centering capability and invariability of the mechanical properties [
15,
20].
Various researchers have investigated accuracy and suitability of LSA in design-oriented simulations of base-isolated buildings [
25,
26,
27]. Specifically, several studies were intended at assessing and possibly enhancing the definition of the properties of linearized structural models to be employed in LSA, especially in the case of bridges [
28,
29,
30]. Moreover, the use of alternative lateral force patterns was assessed to perform pushover analyses on BI-structures [
31]. However, setting an appropriate equivalent linearized model is only the first step in LSA procedures for multi-story buildings [
32,
33], as they also require a consistent definition of the distribution of equivalent horizontal forces in height.
As a matter of principle, two typical behaviors can be distinguished. On the one hand, if it is assumed that the base-isolation system is significantly more flexible than the superstructure (the latter being basically assumed as a rigid body), a uniform distribution can be figured out where the equivalent static seismic forces F
i at the i-th story can be determined as a function of both the total design base shear (V
b) and the story masses m
i [
17,
34]:
On the other hand, other seismic codes, including the US and Chinese ones [
20,
35,
36], assume an inverted triangular distribution of the base shear V
b that can be described as follows:
However, some studies [
37,
38] demonstrate that uniform distribution tends to neglect flexibility of the superstructure and the participation of the higher vibration modes. Conversely, the inverted triangular force distribution has been found to overestimate the maximum seismic responses of most BI-buildings, even when the IS exhibits a strong non-linear behavior [
39,
40].
Therefore, enhanced formulations are also available in the literature to describe the distribution in height of lateral forces with the aim to take into account relevant parameters, such as the frequency ratio between BI- and fixed-base structure [
41,
42], the fundamental period of the superstructure [
43], the modal shape of the latter [
42], the non-linearity factor [
14] of seismic isolators [
44,
45] or combination of some of the above parameters [
46,
47,
48,
49]. Under the mathematical standpoint, the proposed formulations are based on either introducing an exponent to h
i in Equation (2) [
44,
46] or combining Equations (1) and (2) [
41,
42,
48].
This work aims at assessing several formulations available in the scientific literature [
41,
42,
43,
44,
45,
46,
47,
48,
49], as well as in codes and standards [
17,
20,
34], for the distribution in height of lateral earthquake-induced forces to be considered in LSA of base-isolated structures. Specifically, NLTH analyses are carried out on the numerical models of three reinforced-concrete (RC) frames with three, five and seven stories and various fundamental periods of vibration at the fixed-base configuration. Various ISs, characterized by elastic-hardening force-displacement curves, are considered. The parameters describing the isolation devices range within the interval of relevance in practical applications with the aim to reproduce the actual behavior of commercial ISs, which may either be realized by lead rubber bearings (LRB), high-damping rubber bearings (HDRB), low-damping rubber bearings (LDRB) and friction pendulum bearings (FPB). Regardless of the specific technological solution, the formulation proposed herein depends on the relevant mechanical properties of the IS under consideration and allows us to analyze BI-structures by means of LSA in lieu of more time-consuming NLTH analyses, which results in a more efficient design procedure.
The paper is organized as follows.
Section 2 describes the types of analysis and the domain of variation of the relevant parameters considered in this study.
Section 3 summarizes the results of the seismic analyses and shows the comparisons between the outcome of NLTH and LSA, the latter being carried out with lateral forces distributed both uniformly and as an inverted triangle, according to two well-established practices.
Section 4 discusses the results by comparing the pattern of horizontal forces resulting from NLTH analyses with the relevant formulations available in the literature; a practice-oriented formula for lateral force distribution to be adopted in LSA is finally proposed as a main finding of the present paper. The main results of the work are then remarked upon in
Section 5.
2. Research Methodology: Parametric Analysis
The present study is based on comparing the results of accurate, yet computationally intensive, NLTH analyses with the corresponding ones obtained via LSA under lateral loads supposedly equivalent to the effect of the seismic excitation. The relevant modelling assumptions and analysis procedures are described into details in the following sections.
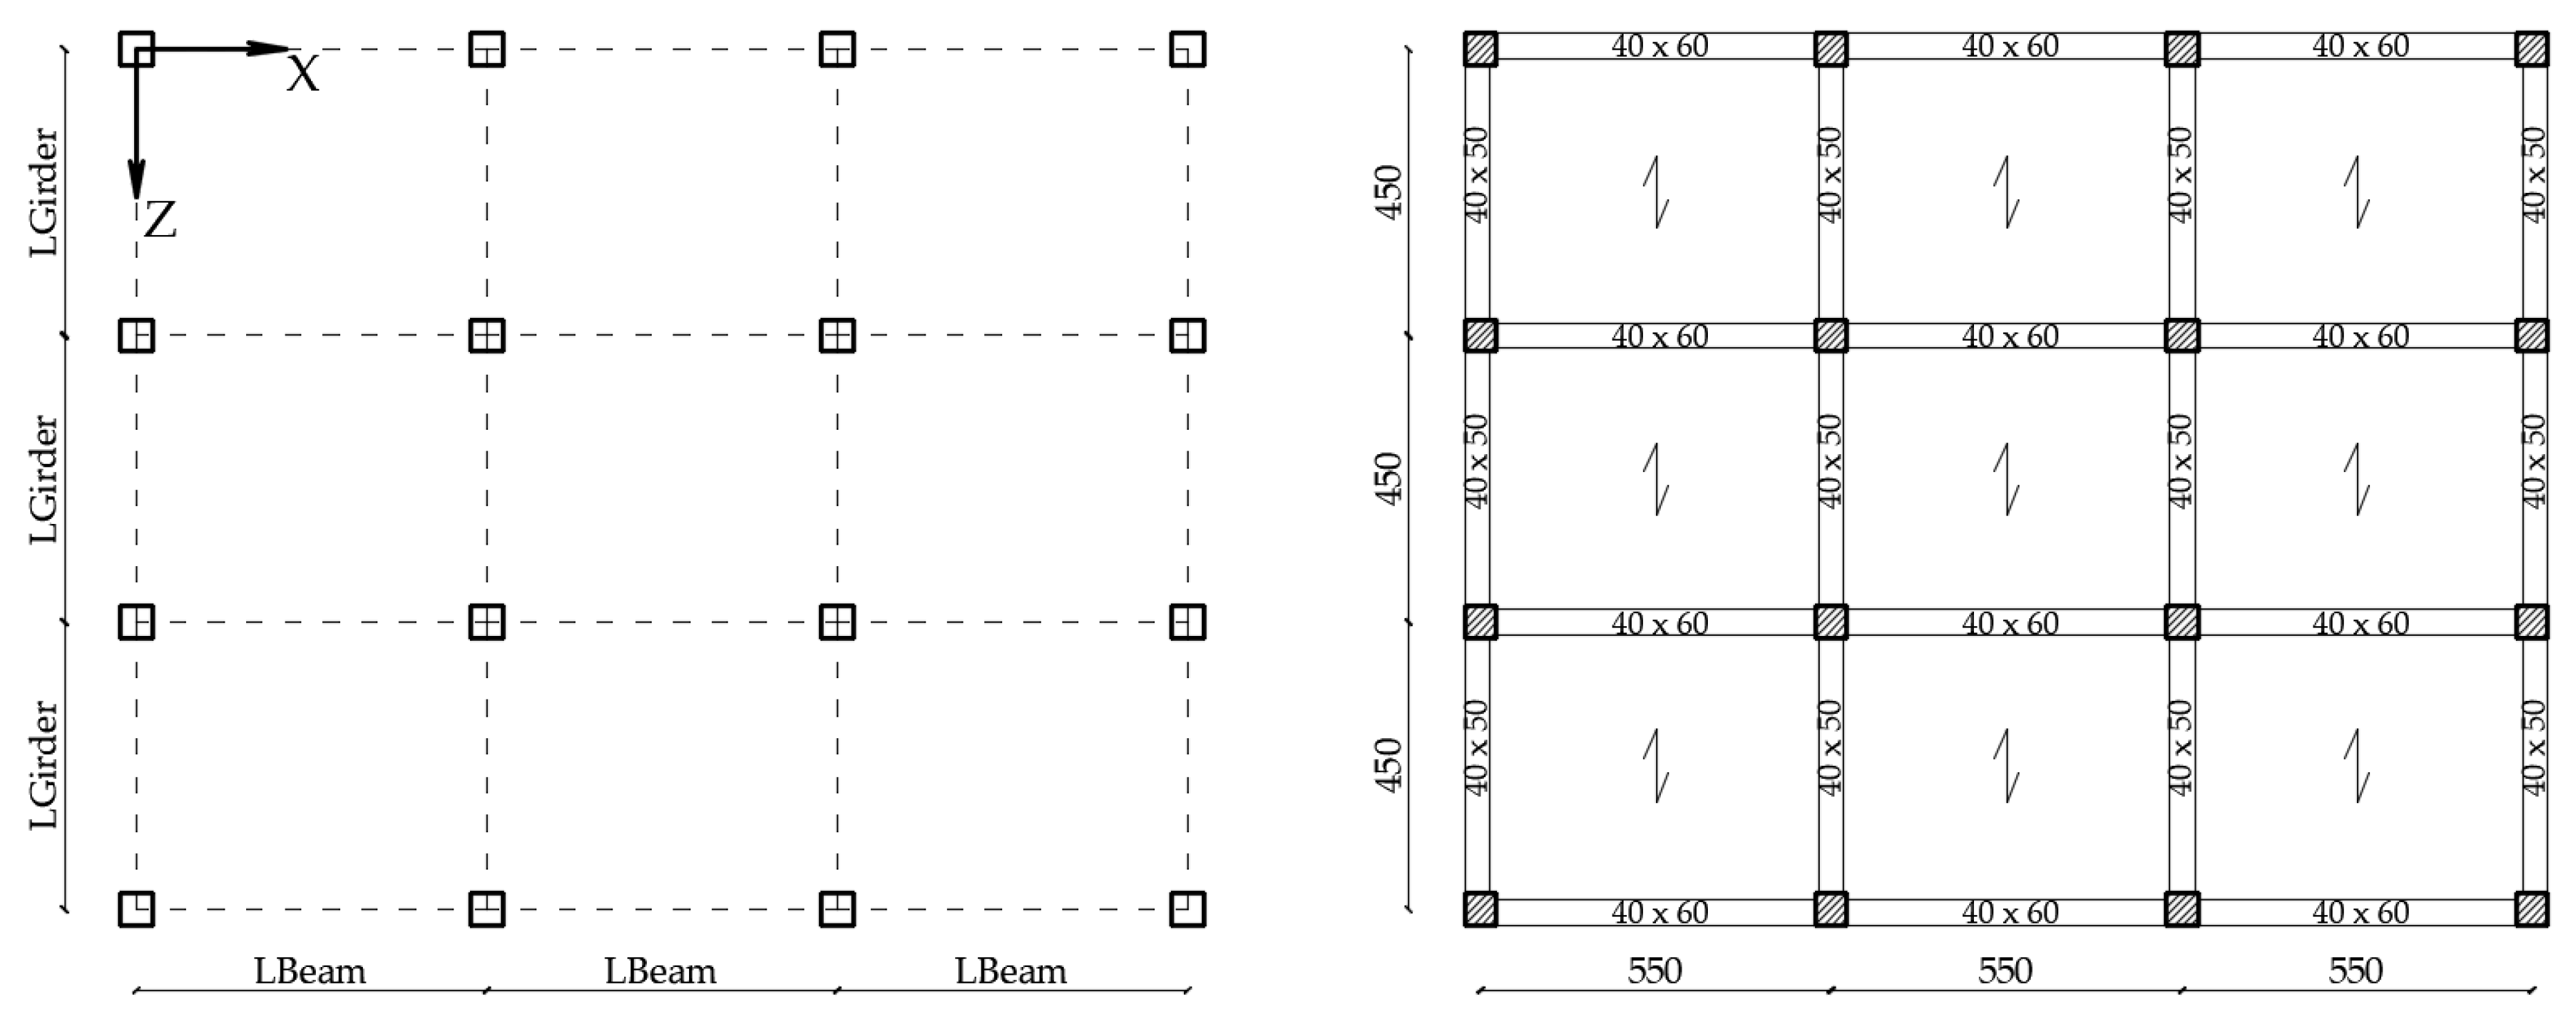
2.1. Superstructure
The present study is based on considering a set of three-, five- and seven-story reinforced RC frame structures. Specifically, the attention has been focused on regular buildings with invariant horizontal stiffness throughout the height of the structure and moderately variable floor mass. The building models have a rectangular plan and a symmetric distribution of resisting systems.
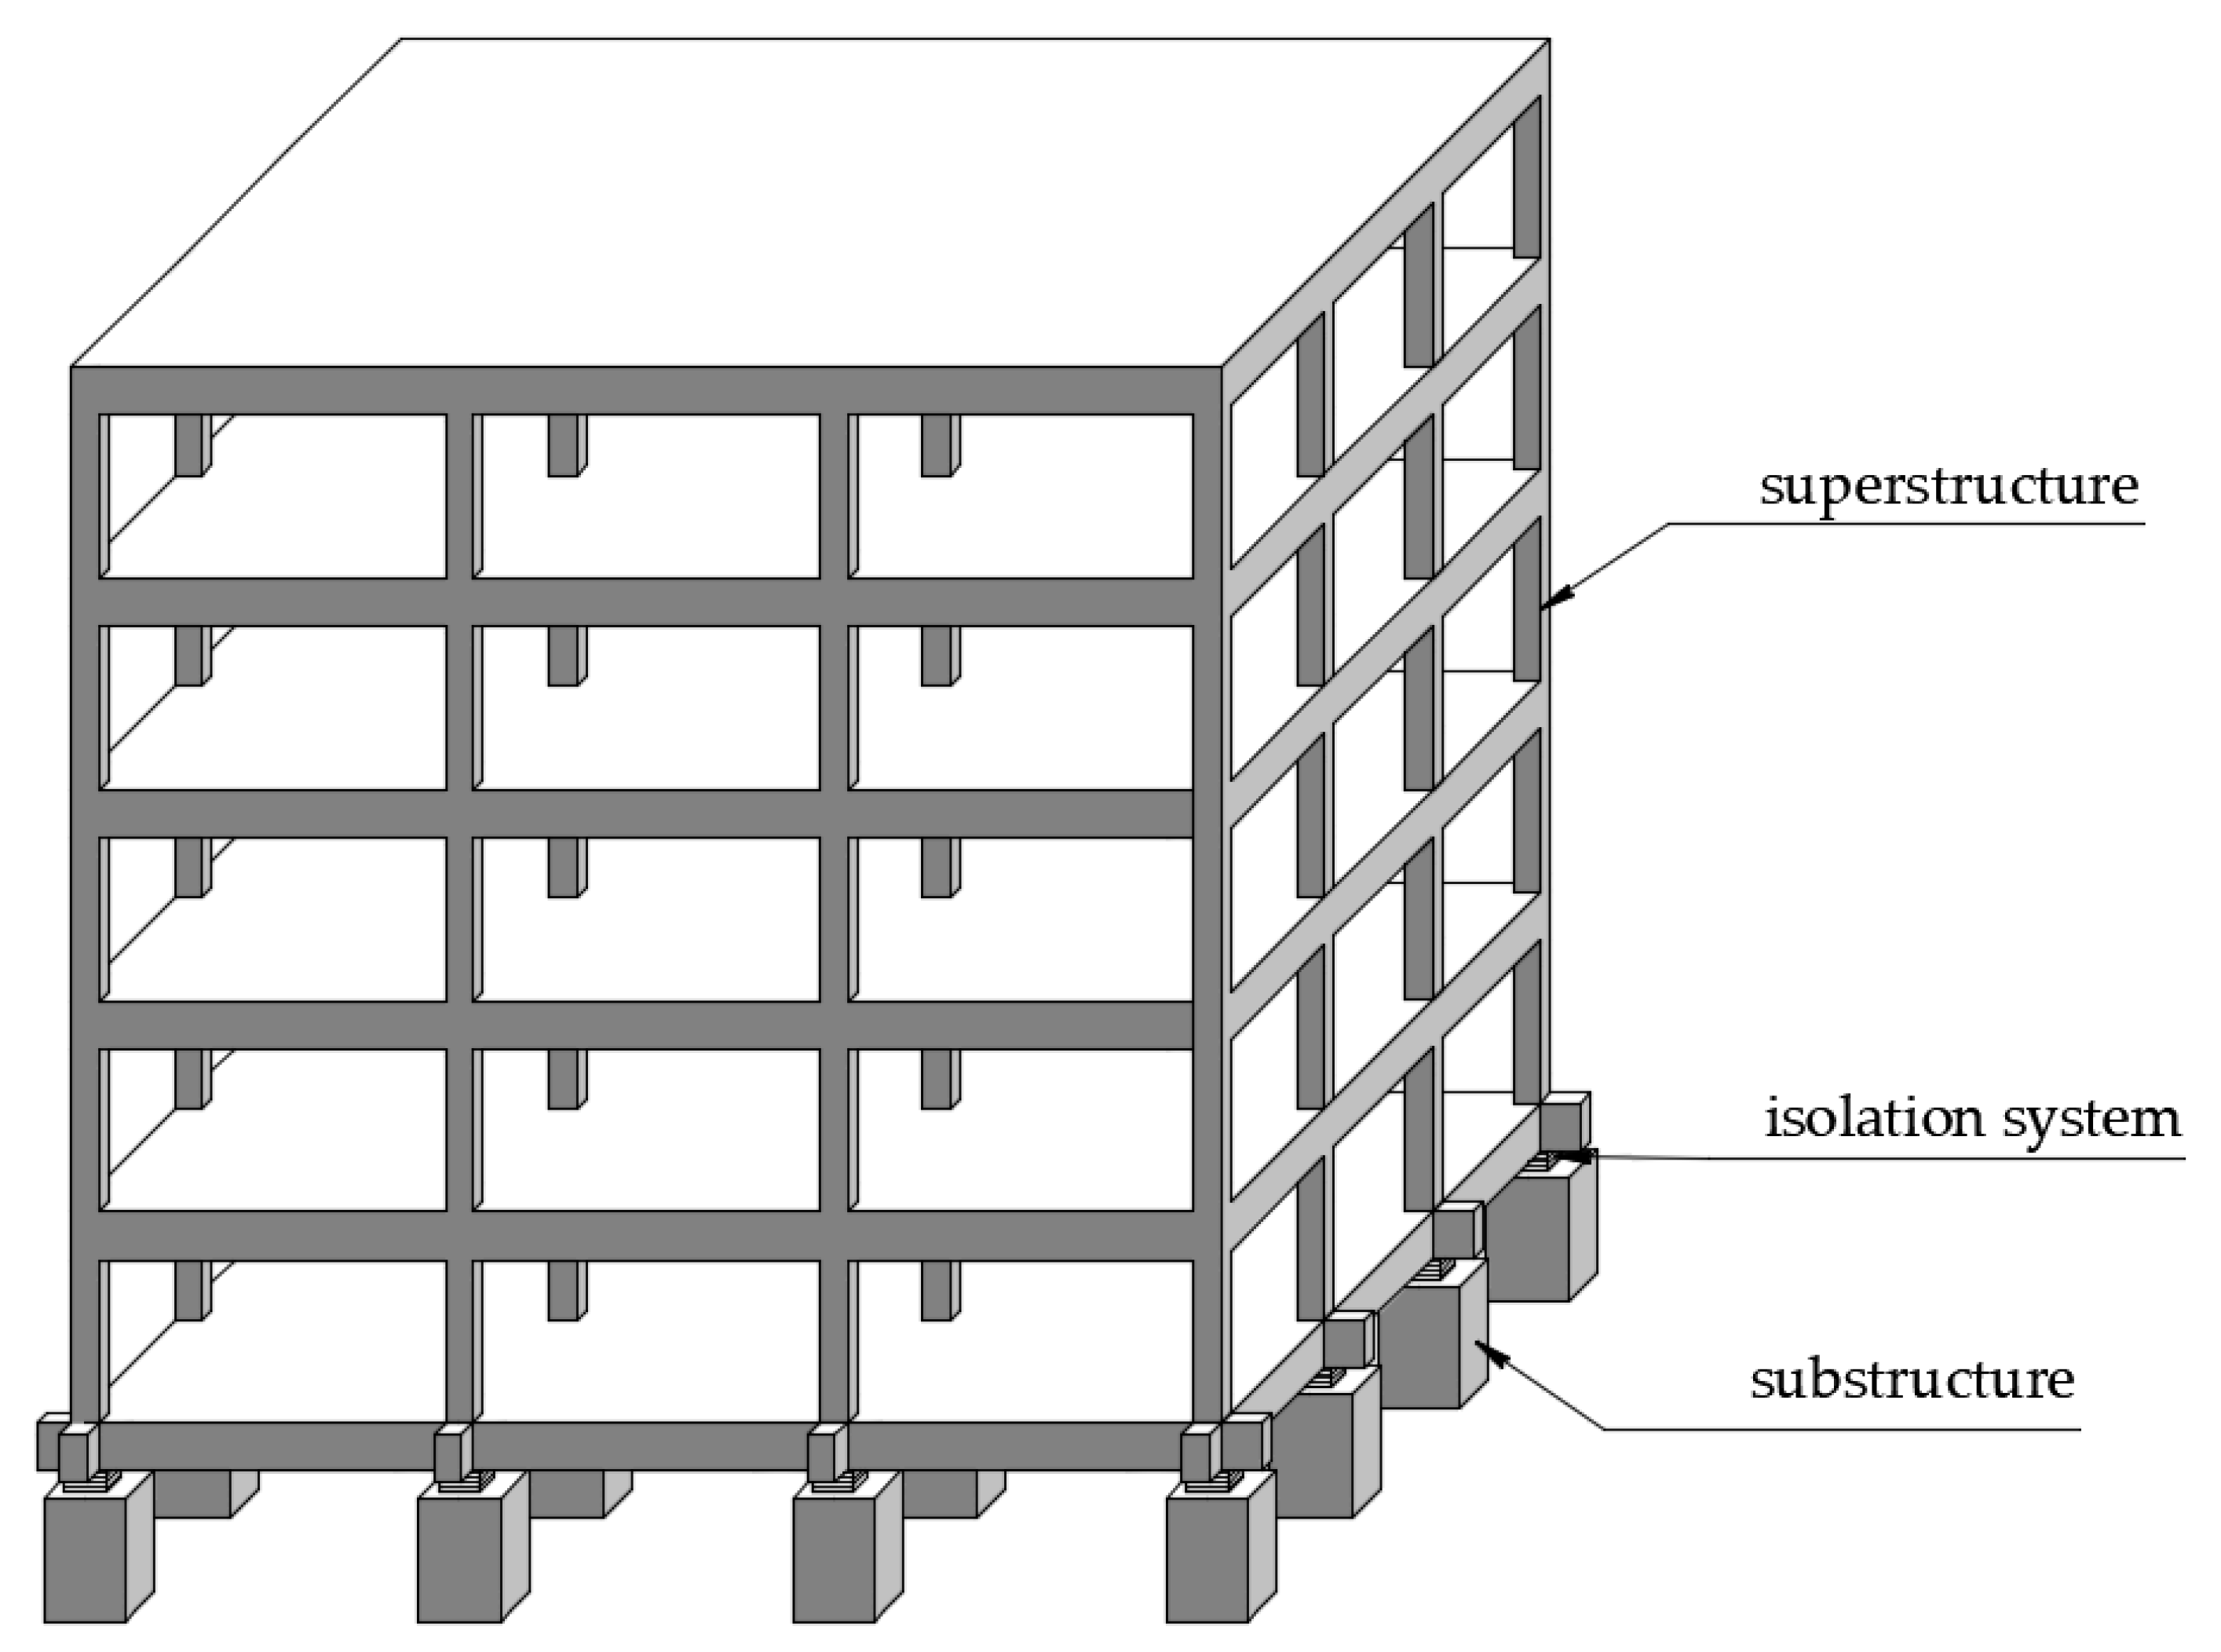
Figure 1 depicts the model of the five-story base-isolated building.
The following main assumptions are made in modelling the superstructure:
linear-elastic behavior of the superstructure, which is generally accepted in BI-structures;
rigid diaphragm constraints are set at all floor;
soil-structure interaction is neglected;
torsional effects are also neglected, as the superstructure is regular both in plan and height.
The plan dimensions are 16.50 m × 13.50 m. The story area is approximately 223 m
2 and is divided into three equal bays along the X-direction and three equal bays along the Z-direction. The story height is 3.10 m (
Figure 2).
The mass is the same at each level, except for base- and roof-levels. Uniform dead loads (G1 and G2) at the intermediate floor is equal to 7.17 kN/m2, at the base levels 8 kN/m2 and at the roof levels 4.30 kN/m2. Live load (Qk) is the same for each level and it is equal to 2 kN/m2. Moreover, the infill walls are not considered as structural elements and are modelled with a uniform load of 7.25 kN/m. Therefore, the total masses of the three-, five- and seven-floor superstructures are 1142 t, 1817 t and 2555 t, respectively.
The superstructure is modelled by elastic elements whose transverse sections are dimensioned in such a way that the corresponding fixed-base structure has realistic fundamental vibration periods. Specifically, the beam cross-sections are 0.40 m × 0.60 m in the longitudinal direction and 0.40 m × 0.50 m in the transversal direction. At the base level, a greater depth of the beam sections is adopted (0.70 m). Conversely, the sizes of column sections vary for the three prototype buildings. A square shape is always assumed: 0.40 m × 0.40 m for the 3-story building, 0.50 m × 0.50 m for the 5-story building and 0.60 m × 0.60 m for the 7-story building. The section dimensions are the same from the base to the roof.
Table 1 summarizes the cross-section sizes of the structural elements.
Table 2 reports the main properties of the three-prototype buildings, including the total height and mass of the buildings, the superstructure-to-base-level mass ratio M
s/M
b and the superstructure fundamental period T
bf.
In NLTH analyses, 2% of the critical damping is assumed by using Rayleigh damping [
50,
51,
52] for the superstructures, in addition to the dissipated hysteretic energy at the isolation level due to the non-linear behavior of the IS.
2.2. Seismic Isolation System
Nowadays, several types of isolation devices are available in the market, which have been briefly mentioned in
Section 1. Although more sophisticated models can be found in the literature to simulate the non-linear response of those devices [
53,
54,
55,
56], the present study is based on assuming a general elastic-hardening hysteretic force-displacement law (
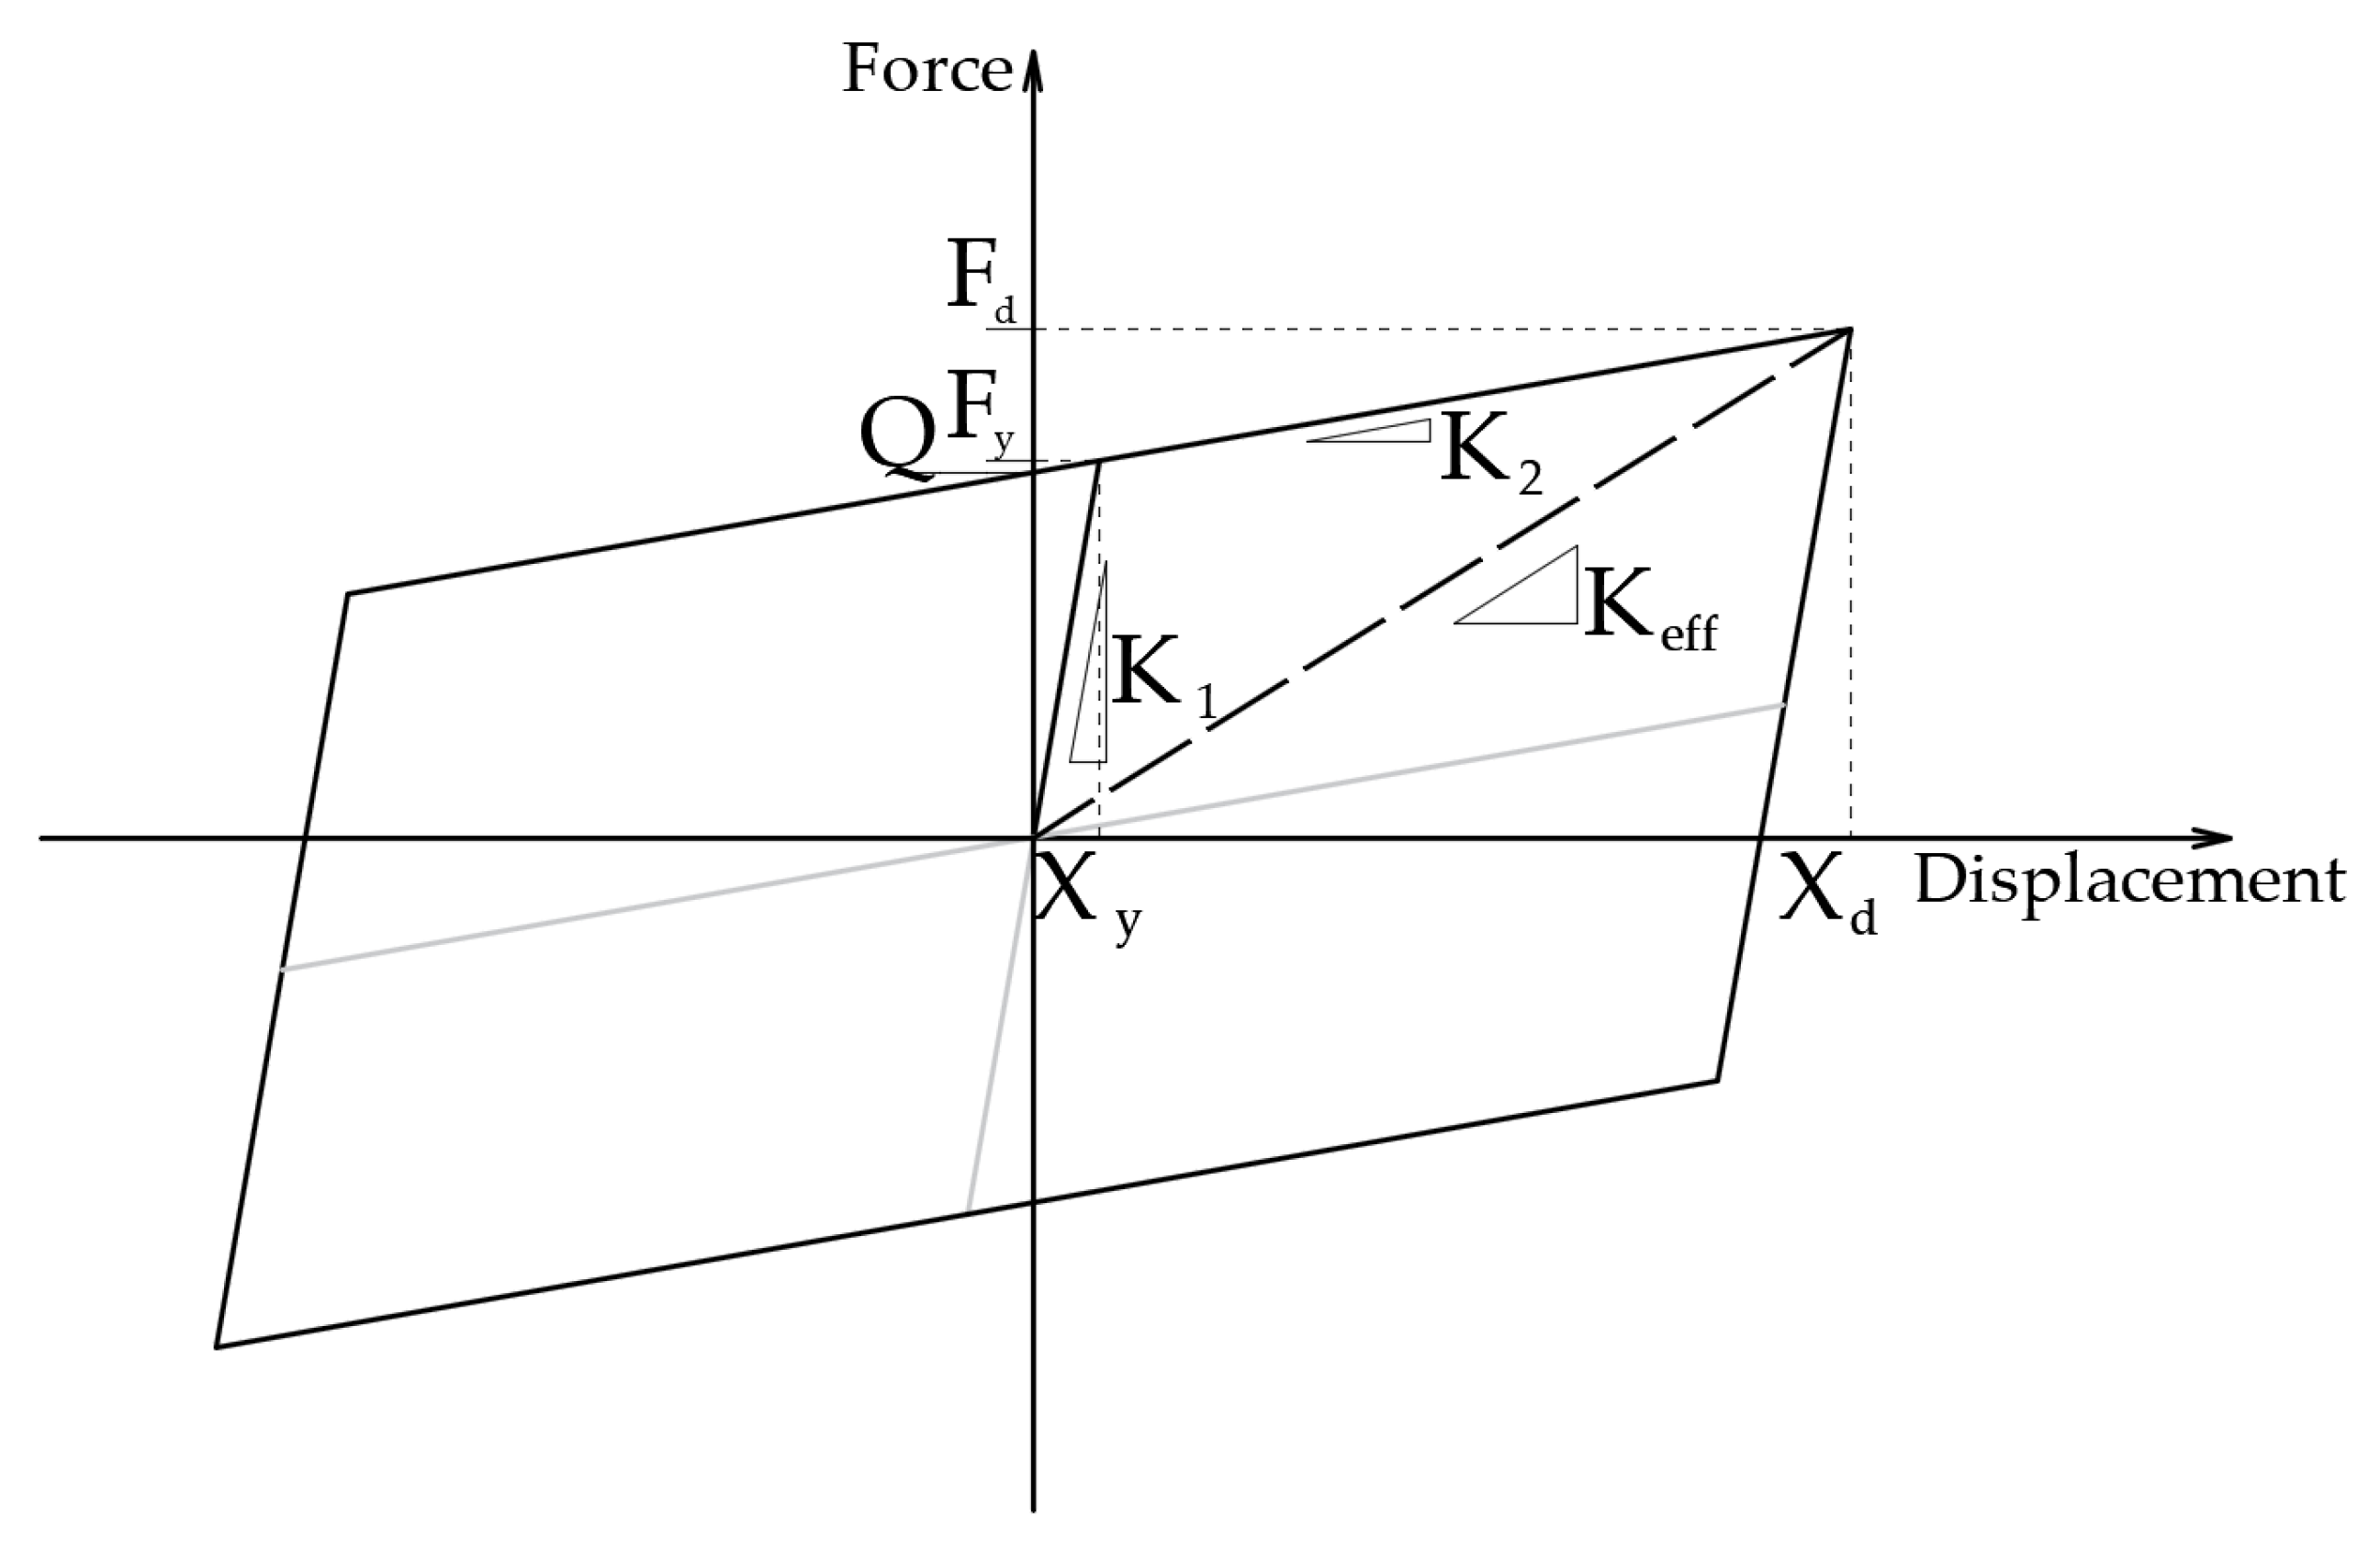
Figure 3), which, in principle, can represent the response of three main groups of isolation devices, such as LDRB (or HDRB), LRB and FPB.
This bilinear force-displacement relationship of the isolation systems is identified by three main parameters: the initial stiffness K
1 (before yielding/sliding), the post-yield stiffness K
2 and the intersection Q between the post-elastic branch and the vertical axis (
Figure 3). The other parameters are the yield force and displacement, F
y and X
y, and the NLTH design displacement demand X
d. The ratios α = K
2/K
1 and μ = X
d/X
y are the post-yield hardening and ductility ratio of the IS, respectively. Specifically, for FPB, the mechanical behavior is described by an elastic-hardening curve with a high value of the initial stiffness, K
2 is given by the W/R ratio and the characteristic force Q is equal to υW, where the W is the weight supported by the bearings, R is the effective curvature radius of the concave surface, and υ is the friction coefficient.
Since existing building codes tend to propose, at least for preliminary design purposes, the use of simplified models and techniques that facilitate the analysis of seismically isolated structures in the LSA, an equivalent linearization of the IS non-linear hysteretic behavior is assumed, as isolators are modelled through their effective stiffness K
eff and effective damping ratio ξ. The effective stiffness is defined as the secant stiffness to the design displacement X
d and is related to the effective period T
eq of the BI-building. The hysteretic damping ratio is given by the energy dissipation principle, based on the equivalence between the energy dissipated by one cycle of the bilinear model, EH, and the damping energy of the linear damped system, ED, related to the maximum displacement value [
57].
The effective stiffness K
eff and the effective damping ratio ξ, at the displacement X
d are calculated by the following equations:
In this study, the main IS properties are defined by three fixed a-priori effective values of the equivalent vibration period Teq, and various values of initial stiffness K1 of the isolators. For the sake of clarity, the ranges of α and ξ parameters assumed in this study are wider than those typically associated to the IS in order to get a better knowledge of the BI structural dynamics and evaluated the applicability of the formulae over a larger selection. In fact, the α values vary between 0 and 1 and the ξ values, with respect to the limit values of the previous parameter, can increase from 0 to 0.63. On the one hand, the lower effective damping value, related to α equal to 1, represents a linear behavior, on the other the upper limit, related to α equal to 0, describes an elastic perfectly plastic curve. It is worth noting that the typical values of ξ parameter range from 0.05 to 0.35.
Table 3 reports the main parameters of the isolation devices employed for the previously described buildings. In particular, the following parameters are expected to have the most influence on the vertical distribution of the base shear: effective period of isolated system (T
eq), ductility ratio (μ), initial stiffness and period (K
1, T
1), the stiffness ratio (α) and, obviously, the hysteretic damping ratio (ξ).
2.3. Ground Motions
The Italian Seismic Building Code [
34] defines the response spectra in each point of a network covering the entire Italian territory. Based on location of the building and the return period of the seismic events, three parameters, a
g, F
0, and T
C* are provided to generate the horizontal elastic acceleration and displacement spectra. More details (the shape of an acceleration spectrum and the meanings of the different parameters) can be found in Chapter 3 of NTC 2018 [
34].
In this case, to determine the non-linear properties of the isolation system, the target IS deformation X
d, defined according to the simplified approach suggested by the Italian Building Code, is obtained from the elastic design spectrum for a reference return period T
r = 975 years. Only the limit state of collapse prevention (SLC) with a low probability of occurrence of the 5% in the design working life of 50 years is considered as seismic input. The seismic parameters for the design spectra are listed in
Table 4. As for geotechnical parameters, soil type B and topology type T
1 are considered.
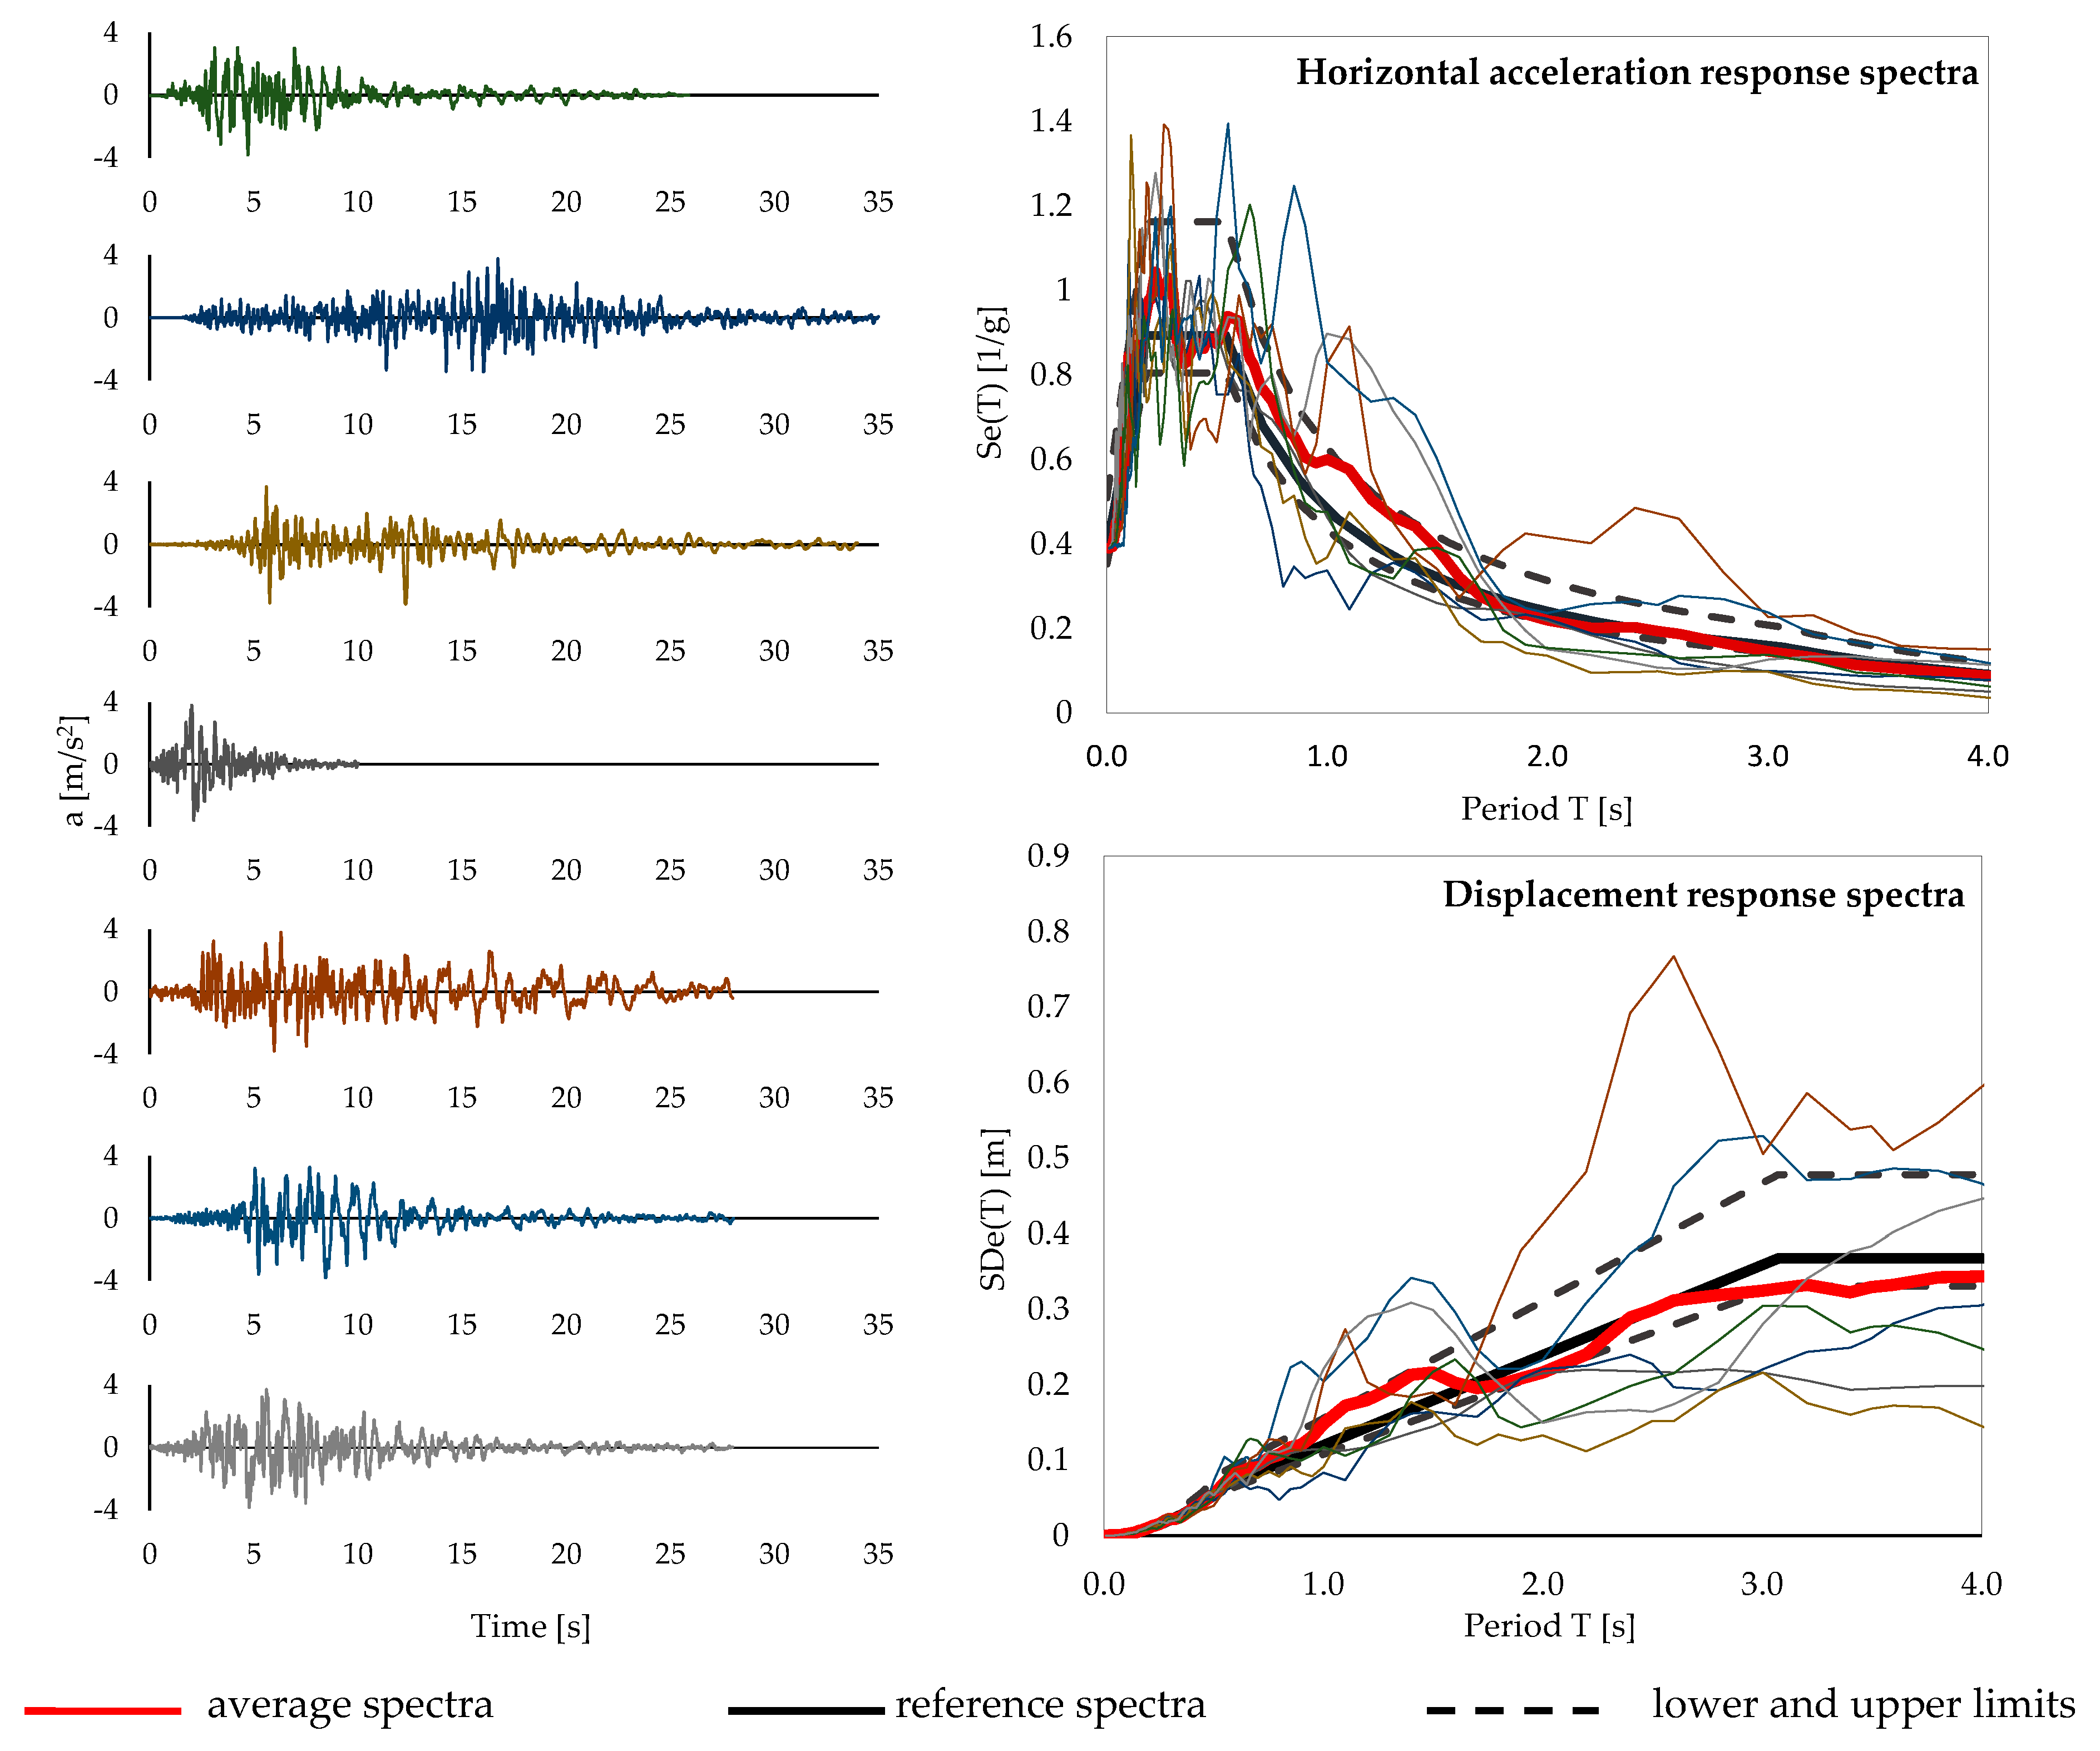
To perform NLTH analysis of the BI buildings under consideration, a set of seven natural ground motions has been selected by means of the REXELite software [
58].
Figure 4 shows the selected-accelerograms and the corresponding response spectra: the graph demonstrates the limited scatter of the single signal spectra with respect to the target design spectra assumed in this study. According to the Italian Code [
34], spectro-compatibility is checked in the period range between 0.15 s and 1.2 T
eq: the average spectrum is never lower than 10% and higher than 30% of the target response spectrum.
2.4. Methods
A total of 108 different bilinear curves to describe the isolators behavior (3 building configurations × 3 equivalent periods × 4 initial stiffnesses × 3 ductility values) have been considered in the NLTH analyses. A total number of 756 NLTH analyses have been.
In this work, one-directional seismic input is considered in X-direction and no amplification is considered for torsional effects. The considered structures are regular in plan and elevation, which makes torsional effects negligible, and the study of bi-direction seismic input is beyond the scope of this paper. The step-by-step procedure followed in this study to derive the actual lateral force distributions is summarized below.
- Step 1:
NLTH analyses of base isolated building configurations by considering a set of seven spectrum-compatible accelerograms;
- Step 2:
Average of the maximum story shear values at the different levels derived from the selected seven accelerograms;
- Step 3:
Conversion of the median peak story shears V
i at the i-th level to median lateral force F
i, according to the following equations:
where the F
j are the shear forces recorded at the column of each i-th level, V
i and V
i+1 are the average of the maximum story shears at the i-th and (i + 1)-th levels and the F
i are the lateral force applied at the i-th level;
- Step 4:
Normalization of the story shear and lateral force distributions by base shear (assuming Vb = 1), in order to focus on relative distribution of force rather than their values.
3. Results
Displacement demand on the isolation system and story shear forces are the main factors for the design of BI structures: the following subsections report a comparison between the results obtained by NLTH analyses and LSA on the RC structures defined in
Section 2.
3.1. Base-Isolated (BI) Structure Response: Ground Motions
Various configurations of base-isolated buildings are presented in order to evaluate the dynamic response obtained for the different seismic inputs.
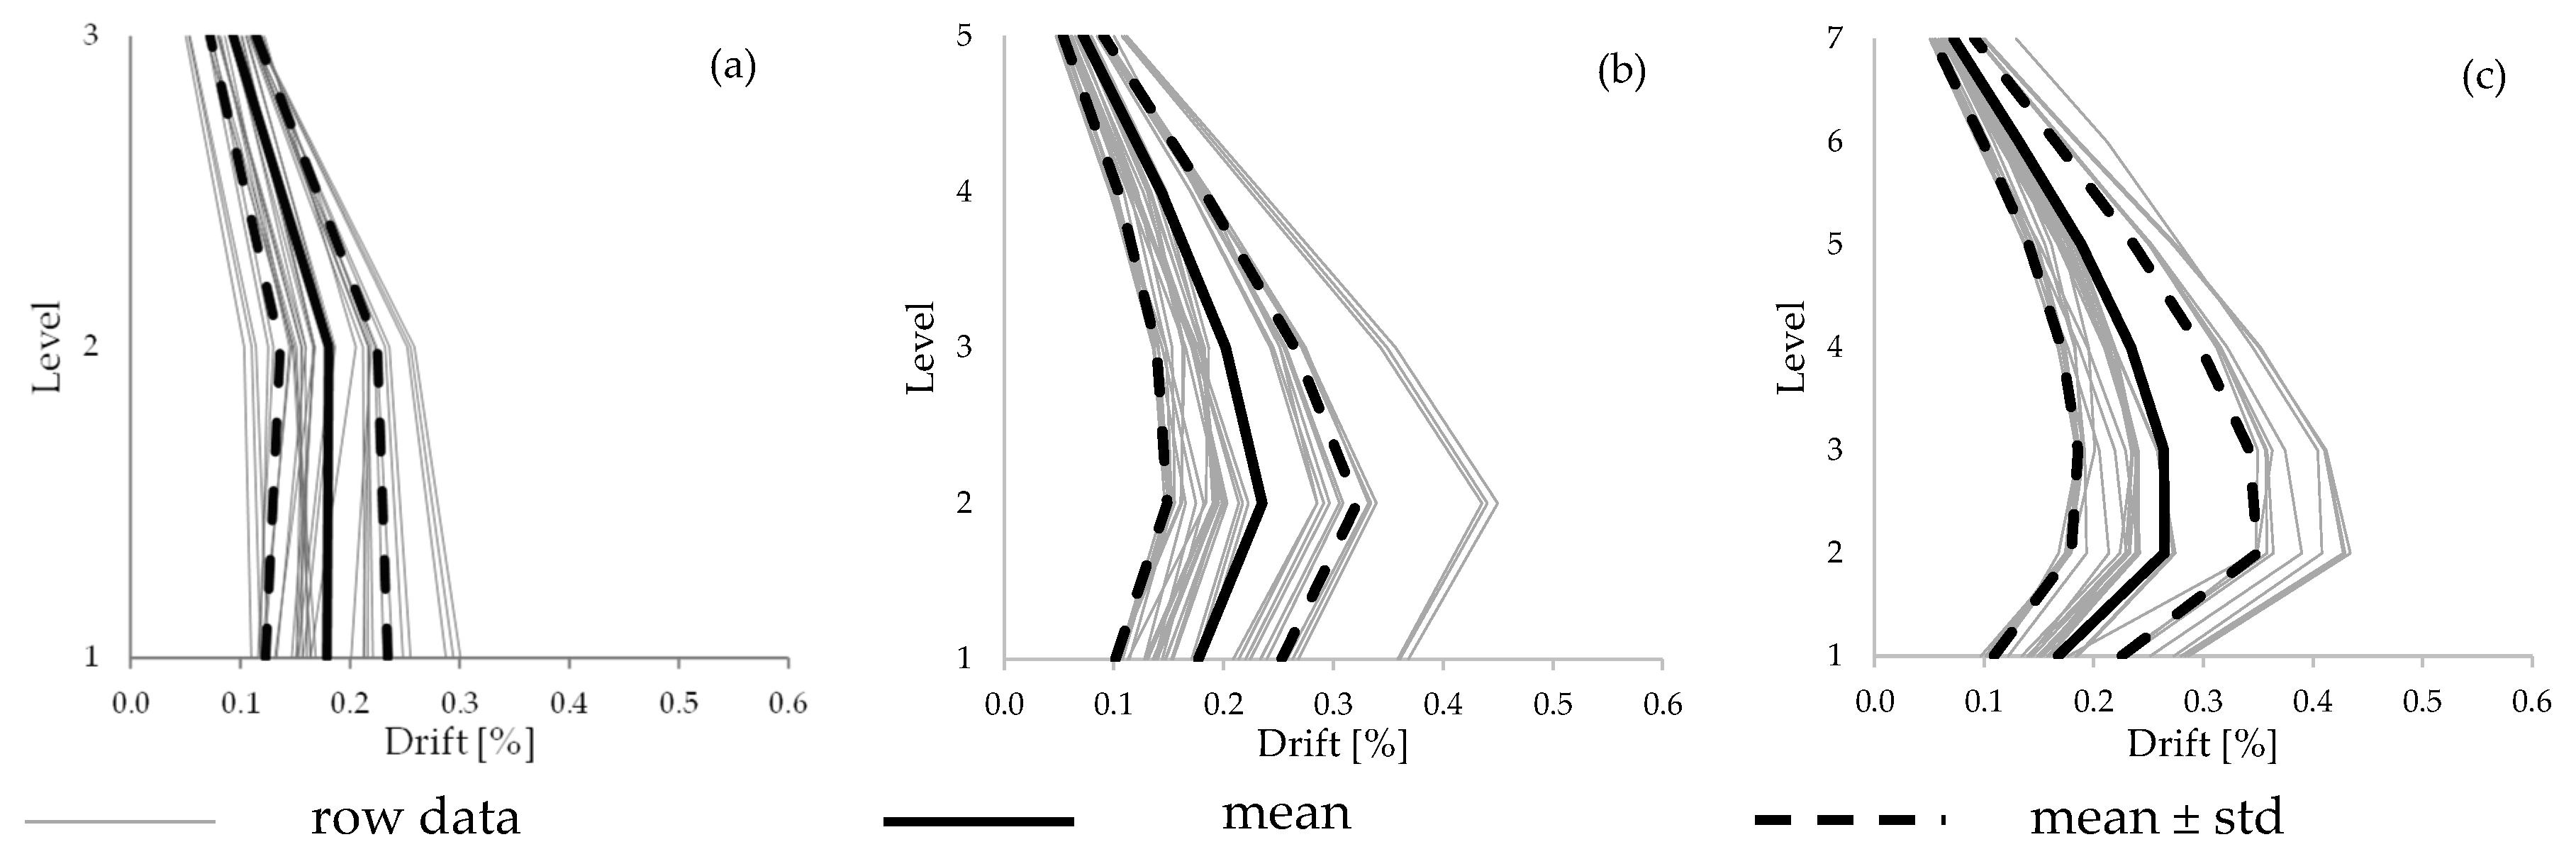
Figure 5 shows the maximum demands in terms of inter-story drift ratio (IDR). It demonstrates that the maximum inter-story drift ratios obtained from NLTH analyses are generally below 0.45% in all the considered structures. This confirms that the demand on the isolated structures is lower than the corresponding limits of the elastic range [
31], which is consistent with assuming a linear-elastic model for the superstructures.
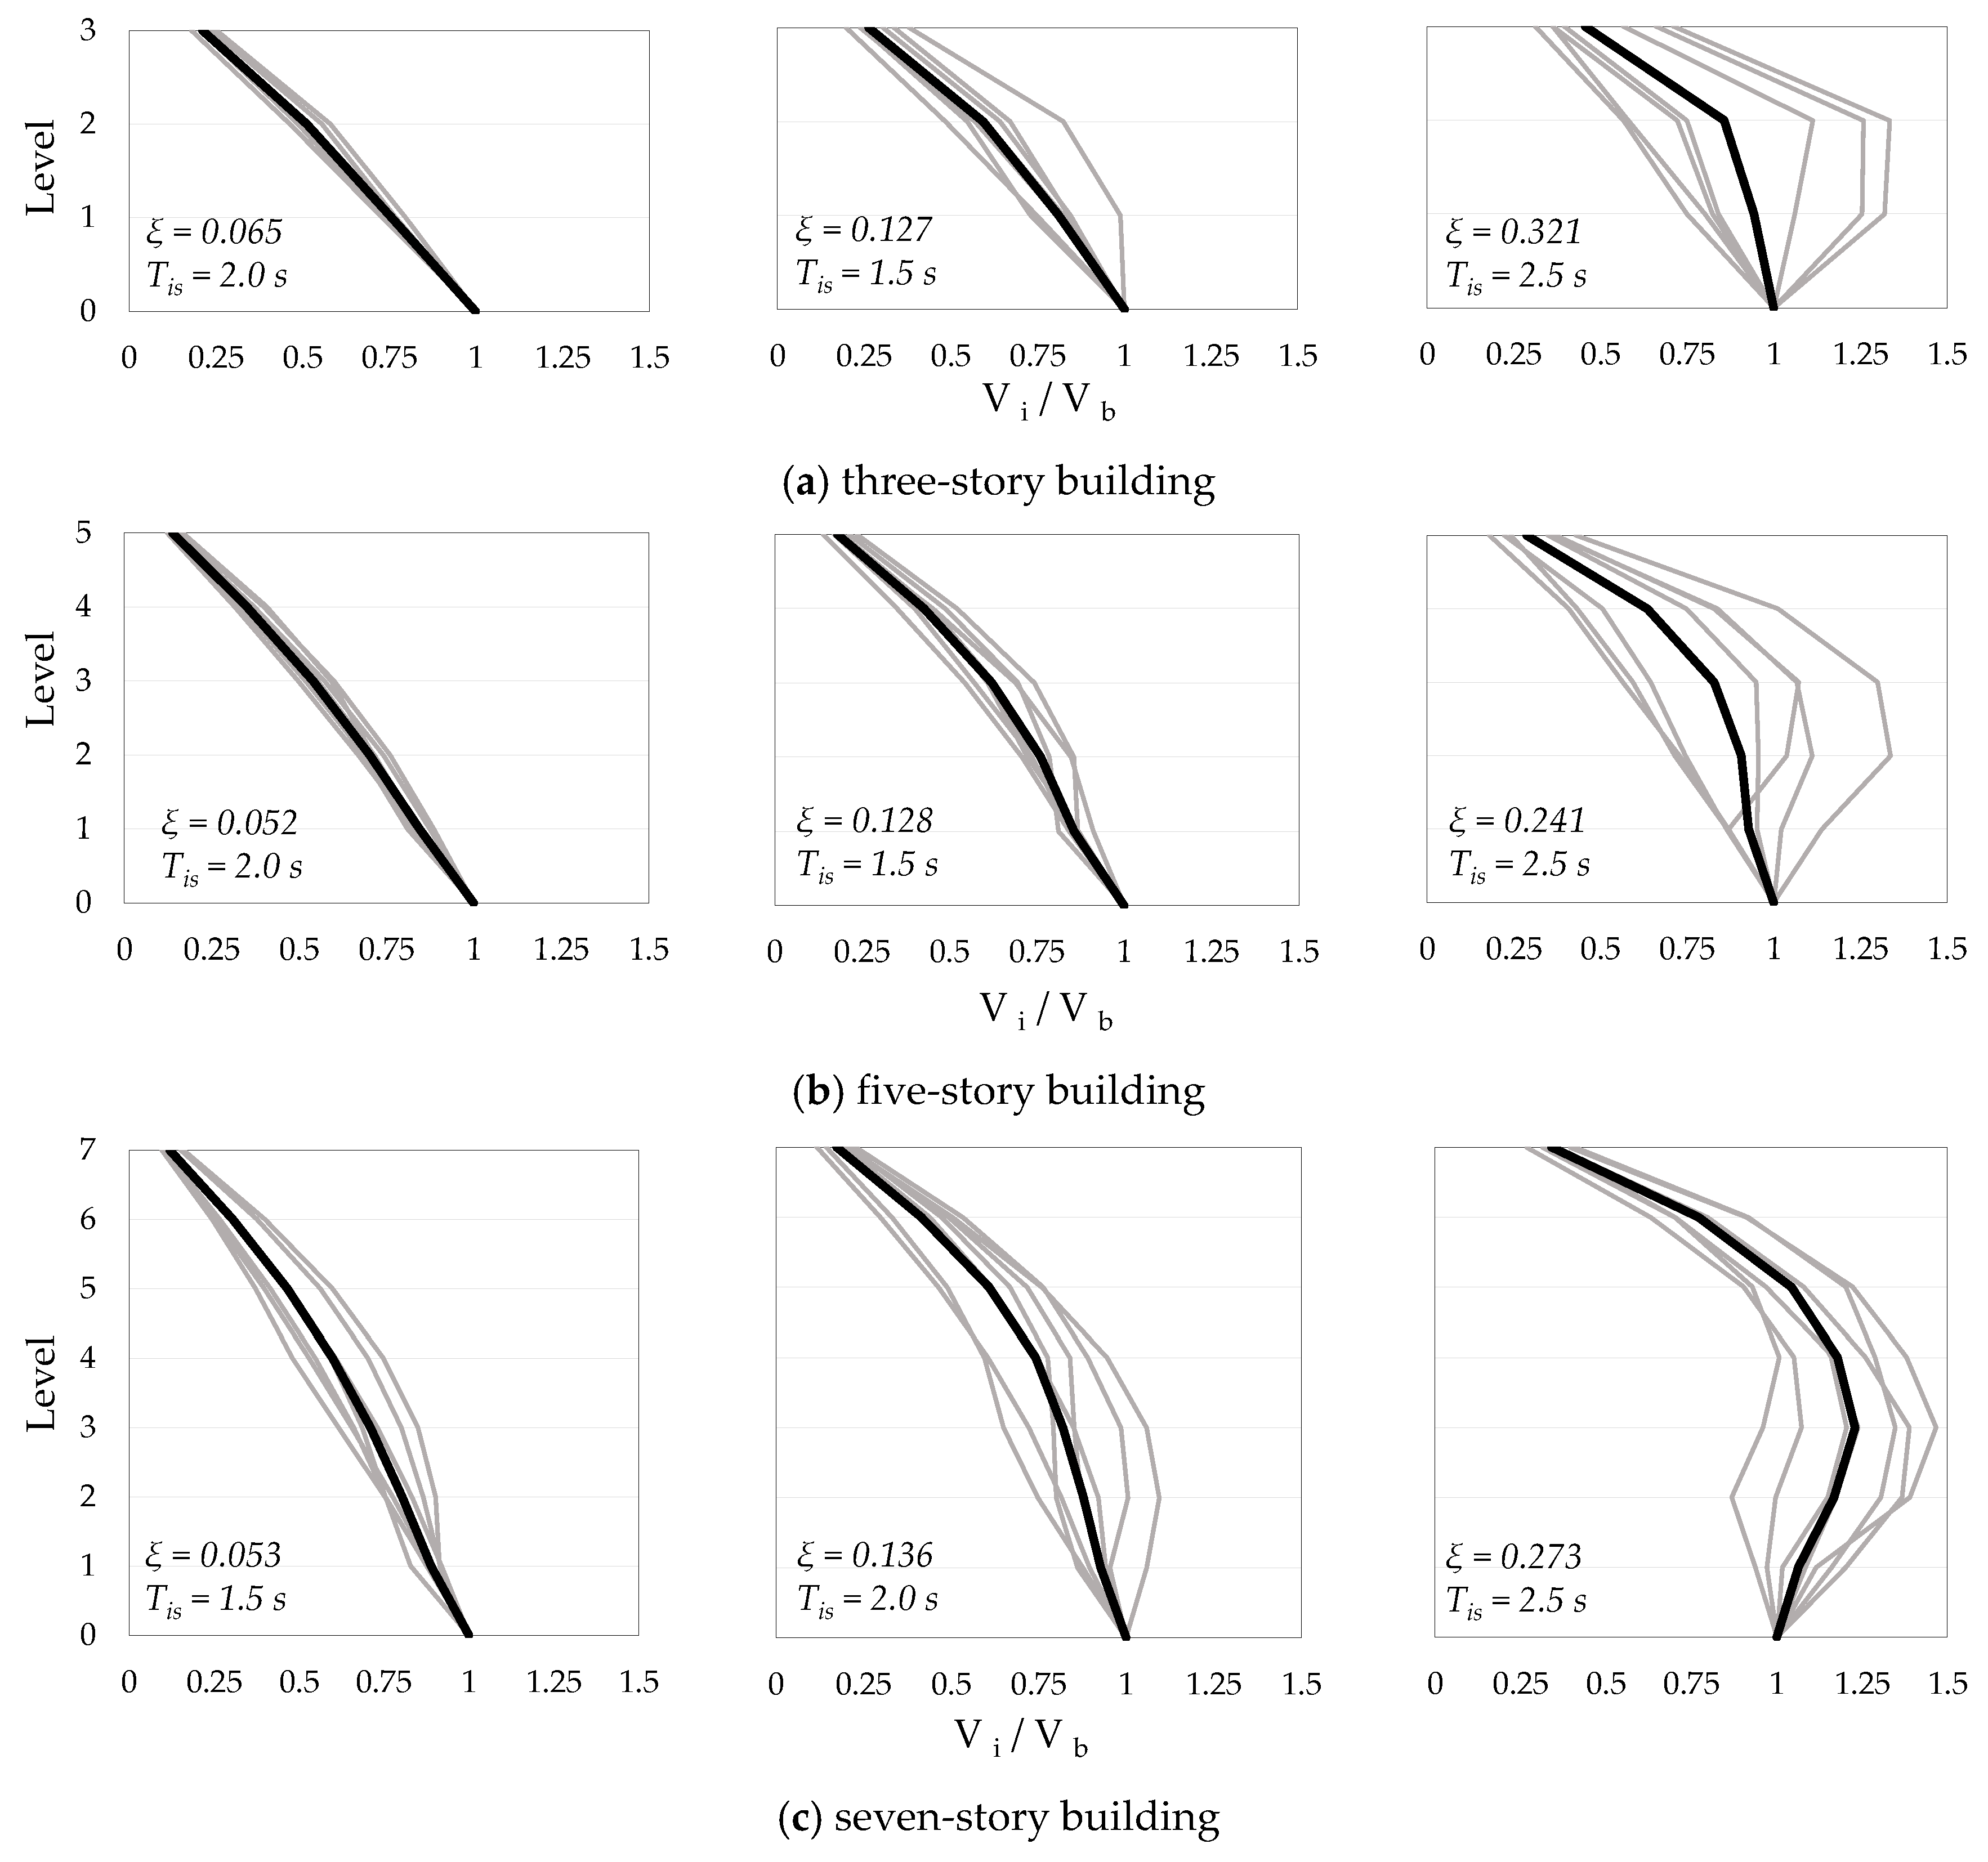
Figure 6 reports the distribution of story shear V
i normalized with respect to the mean of the base shear V
b obtained from NLTH analysis.
Since the actual hysteretic response of the various BI-structures depend on the different seismic inputs, the values and distribution of the lateral shear forces may vary significantly. As shown in the graphs of the first column in
Figure 6, when the BI structure has a low equivalent damping value, the envelopes of shear forces for each selected ground motion (and, consequently, the average distribution represented by the bold line) present an almost linear distribution as a result of a base isolation system. By increasing the damping ratio of the isolation systems, more seismic force is transferred to the superstructure. The contributions of the higher modes become significant in the upper levels so the normalized lateral shear envelope is more bulged (see third column of
Figure 6).
Moreover, although the accelerograms have been scaled to be compatible with a selected spectrum, earthquake excitation characteristics and intensity affect the seismic response of the base isolated buildings as well. The first reason is the significant difference in low- and high- period energy content of the scaled spectrum. In fact, some of the scaled ground motions have a large amount of energy in the high-frequency range and this can trigger the higher-modes response. The second reason is the equivalent damping ratio. For low damping values, in a classically damped vibrating linear system, all modes tend to be mutually orthogonal [
2]. In these cases, the dynamic response becomes first-mode dominated and the influence of the seismic input becomes negligible.
3.2. Equivalent Distribution of Lateral Forces
The equivalent static story forces resulting from the LSA code procedures are compared with those obtained from NLTH analysis. According to EuroCode 8 and Italian Building Code [
17,
34], the LSA equivalent lateral forces are distributed over the height of the building in proportion to the story masses. Conversely, in US codes a different lateral pattern is assigned based on an inverted triangular distribution of story accelerations. The results of the NLTH analysis executed in this study can be utilized to assess the actual accuracy of the two distributions described by Equation (1) and Equation (2) in terms of lateral force distribution employed in LSA. Specifically, the maximum values of V
i and F
i, analytically defined by Equations (5) and (6), respectively, can be determined for each NLTH analysis and the corresponding average value can be determined for the seven accelerograms considered in this study. The base shear V
b = V
i|i=1 can also be determined.
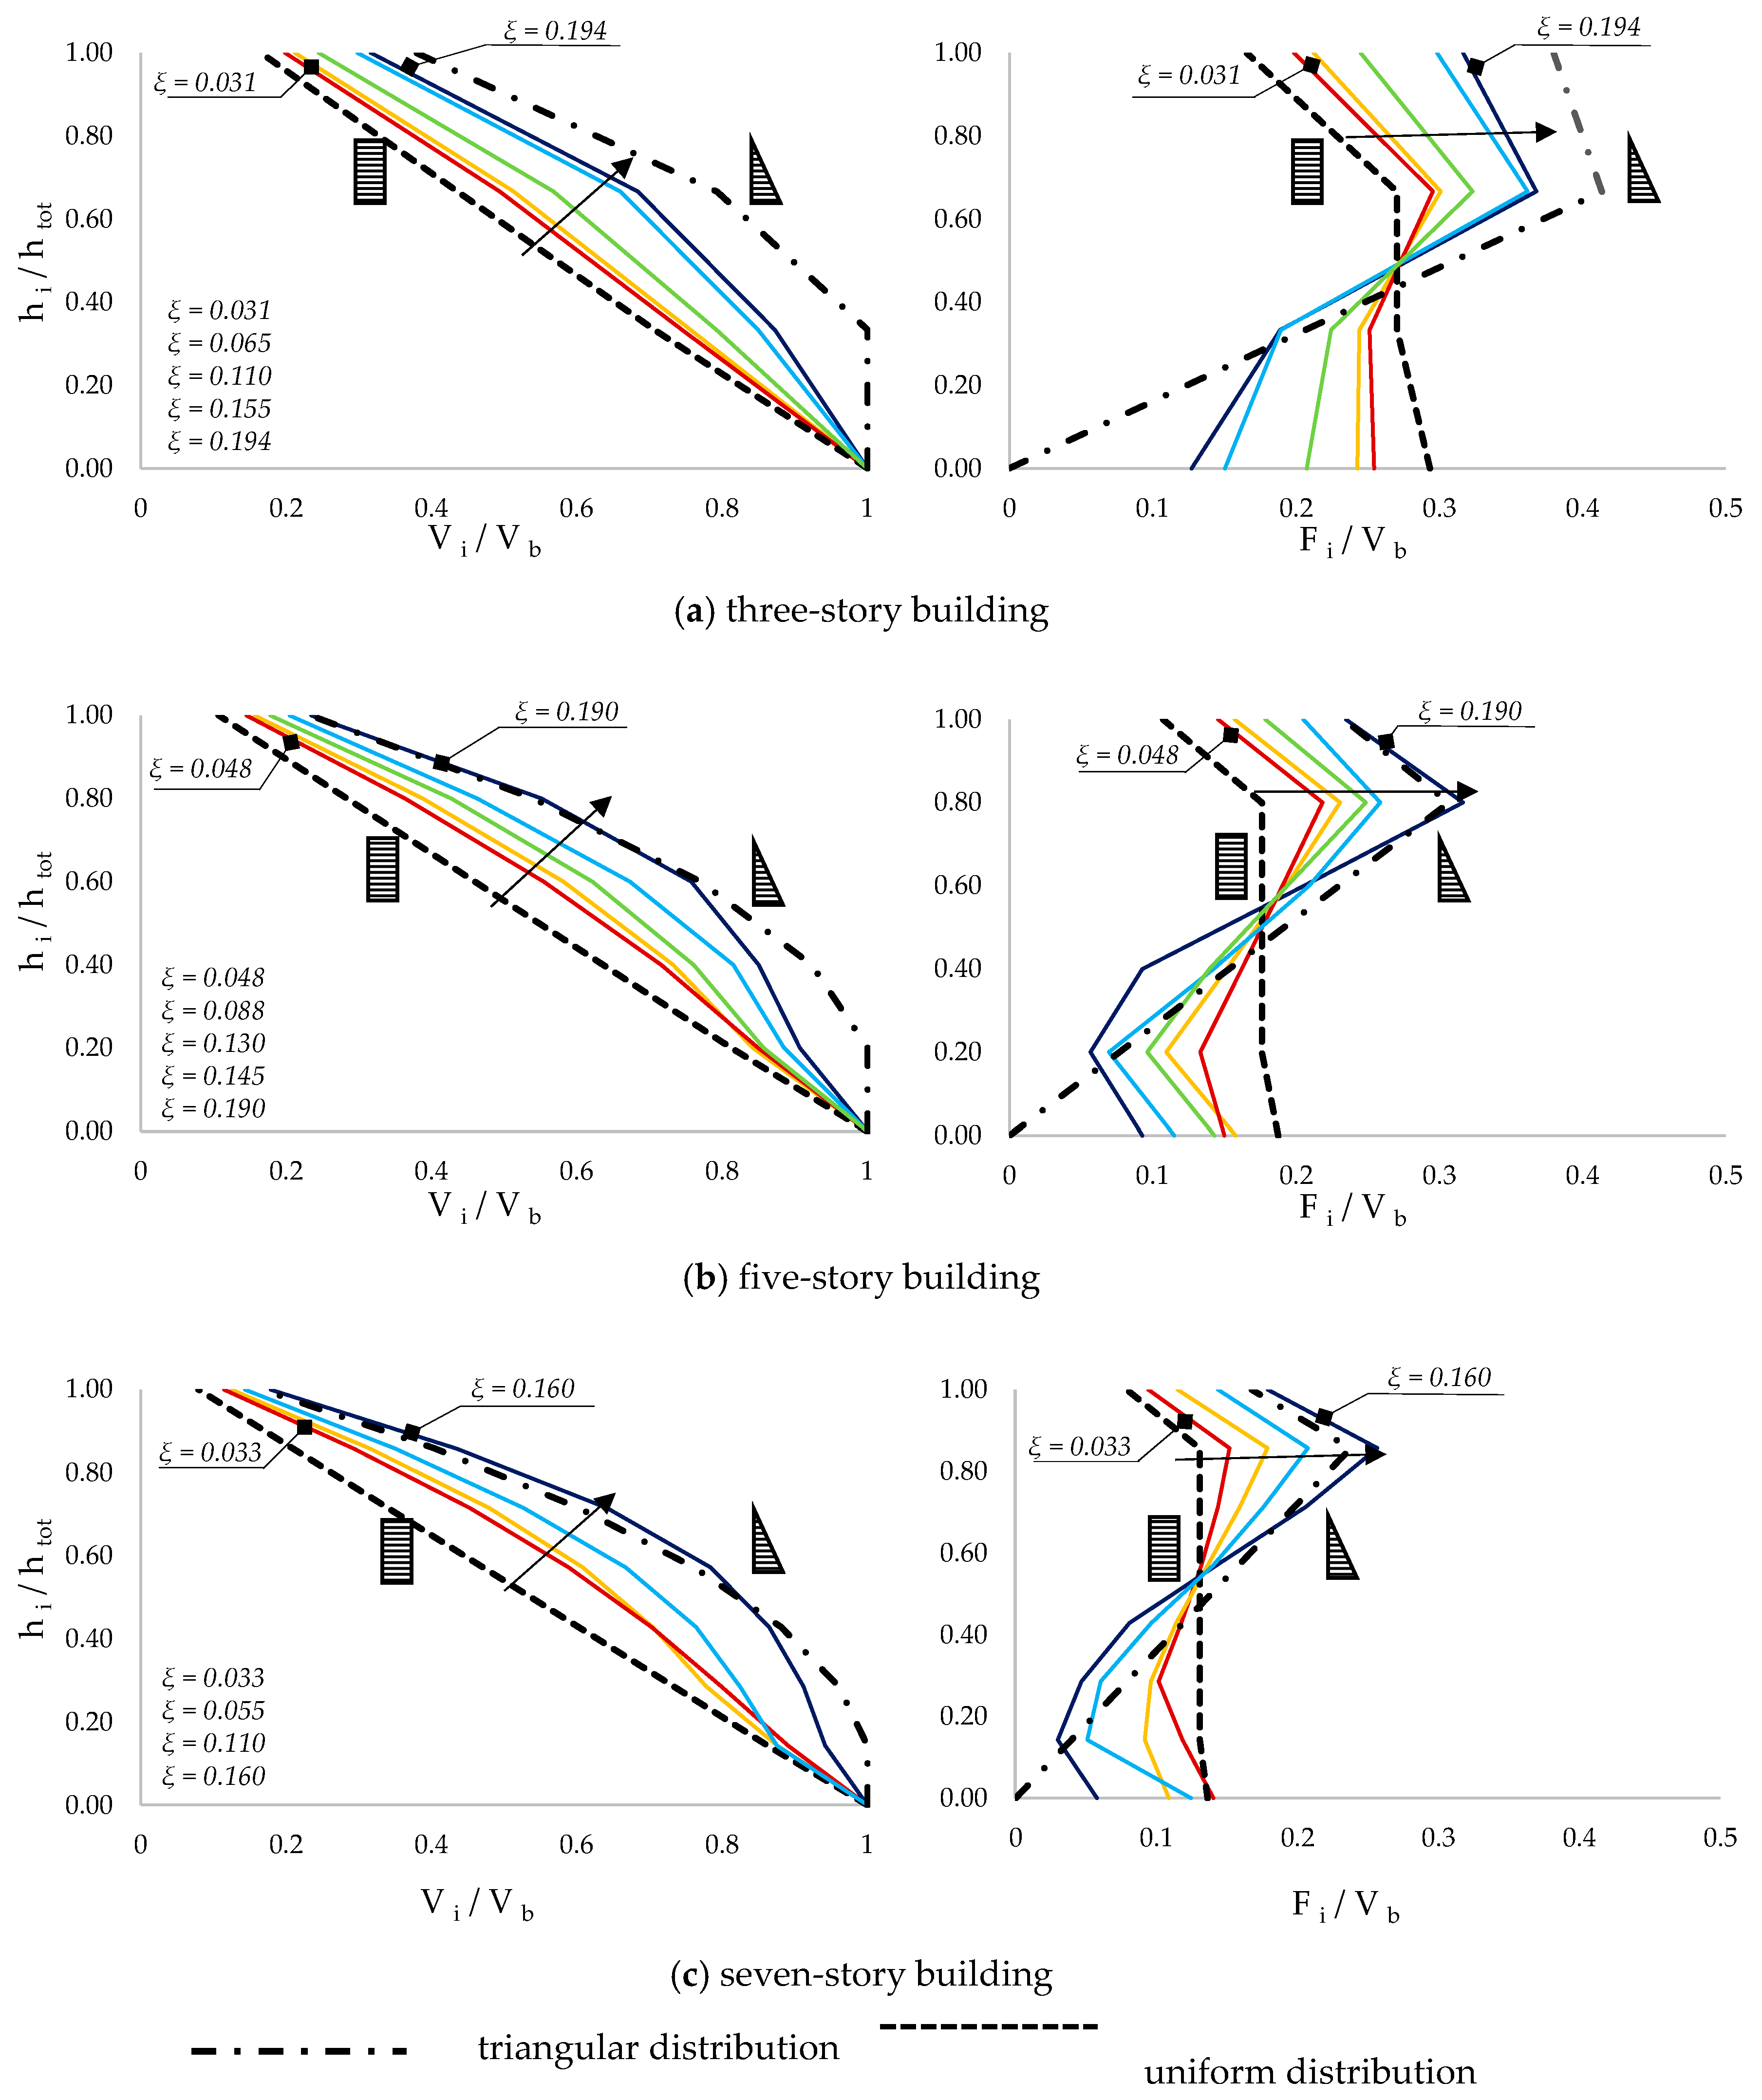
The diagrams reported in
Figure 7 show (on the x-axes) the ratios V
i/V
b (left column) and F
i/V
b (right column) for the three buildings with 3, 5, and 7 stories. It is worth highlighting that the resulting F
i/V
b gives a clear picture of the resulting seismic lateral force distribution, which can be deducted from NLTH analyses. The dashed and the dash-dotted lines reported in the same diagrams correspond, respectively, to the uniform acceleration pattern of Equation (1) and the inverted triangular distribution of Equation (2).
The synoptic view of the diagrams depicted in
Figure 7 demonstrates that the distributions of the maximum story shear-forces obtained from NLTH analysis strongly diverge from the conventional uniform distribution as the equivalent damping in the isolators increases. A marked bulge at the mid-height of the building, due to the higher-mode contribution, is observed with a relatively high value of ξ. Compared with the results of the non-linear analysis, the uniform distribution approach is substantially unconservative. Conversely, the inverted triangular distribution shows a relatively good correspondence with the shear at the higher stories for medium-high damping values although it is too conservative for the lower stories.
The results of NLTH analysis confirm that both the uniform and the inverted triangular distributions are unable to characterize the dynamic behavior of base-isolated building. In fact, the uniform distribution underestimates the maximum shear forces, especially at the upper stories of the building, even for relatively low equivalent damping ratio values. On the other hand, the inverted triangular distribution results too conservative for the typical values of common applications (ξ < 0.20). However, for very high value of equivalent damping ratio (ξ > 0.30) the triangular distribution leads to an underestimation of lateral force at the top and the mid height of the building.
Therefore, for typical values of ξ the average of nonlinear results under ground motion records shows that the real distribution falls between these two extremes.
3.3. Effective Height
To better understand the dynamic behavior of an isolated building, the effective height can return an appropriate indication about the shear force profile, providing the location of the resultant equivalent force along the height of the building [
37,
41,
49]:
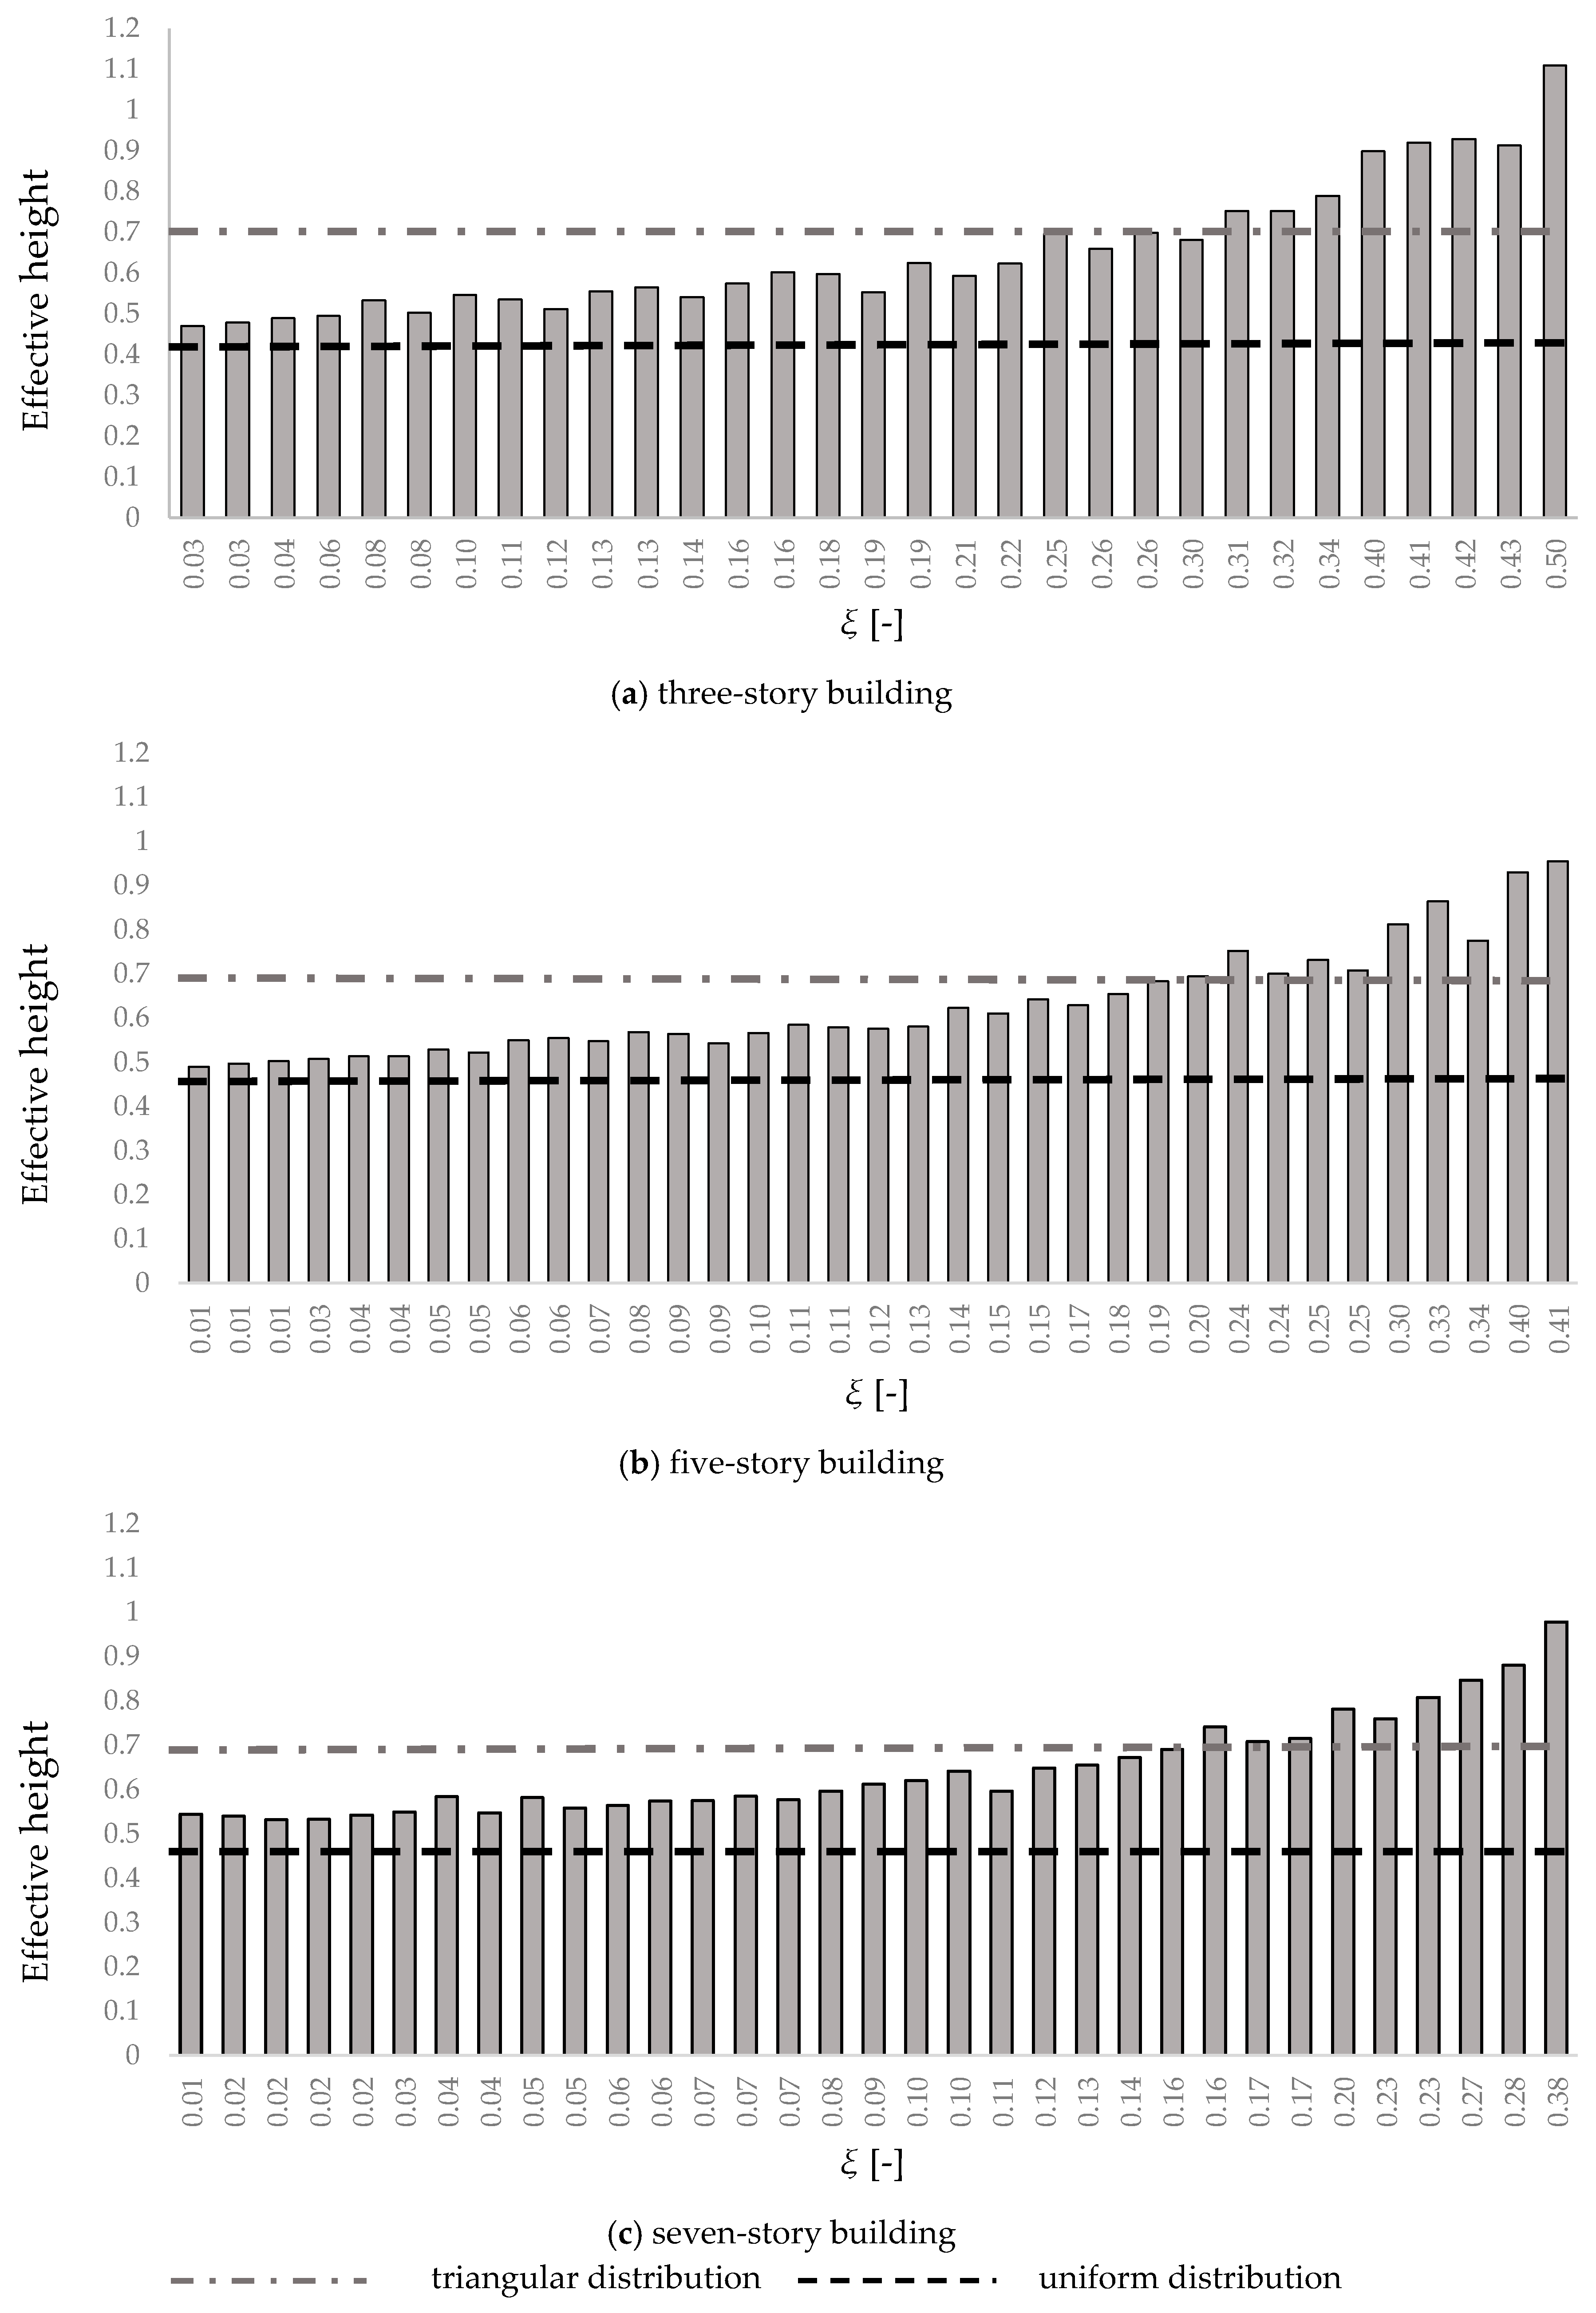
Figure 8 presents the effective height related to 3-, 5- and 7-story buildings. It is compared with that calculated from uniform and inverted triangular distribution. The different configurations are described in terms of equivalent damping ratio of the isolation systems.
Figure 8 confirms that the dynamic response of base-isolated buildings significantly depends on the degree of non-linearity of the isolation system. For the three superstructures, higher values of the equivalent damping ratio cause an increase of the effective height: the resulting horizontal force is applied at a higher point due to the contribution of higher modes that increase the shear forces at the top level. The effective height for the uniform distribution is equal to 0.436 h, 0.460 h and 0.471 h for the 3-, 5-, and 7-story building respectively, while for the inverted triangular distribution it is equal to 0.724 h, 0.693 h and 0.682 h, in the same order.
The values highlight that the uniform distribution of lateral forces over the height of the three structures always underestimates the inertial forces at the upper levels. By contrast, the inverted triangular distribution provides conservative values of the shear forces for values of the damping ratio smaller than 0.30 for 3-story buildings, 0.20 for the 5-story buildings and 0.16 for the 7-story buildings. It should be noted that structures with more levels and a longer period in fixed-base configurations show effective heights even greater than the values associated with a uniform distribution. Indeed, the shear envelope is closer to a triangular distribution than to the uniform one, even for small values of equivalent damping ratio.
Nevertheless, for relatively high values of ξ also the triangular distributions are not suitable. The greater effective height implies the base shear distribution is more bulged than triangular distribution. For completeness, if the damping ratio tends to extreme values, non-linear analyses provide anomalous values of the effective height that becomes greater than the total height.
4. Discussion
The alternative lateral force distributions, available in the literature for the base isolated buildings, are compared to those used by building codes (uniform and inverted triangular) and to the shear force profiles obtained from NLTHA, in order to investigate their applicability and accuracy.
4.1. Comparison between Different Lateral Distribution
As reported in
Section 1, most of the different formulae, obtained for BI structures, are functions of the non-linearity properties of the IS and superstructure to adapt to various configurations of BI Systems [
43,
44,
46,
47]. As seen in
Section 3, a proper prediction can be obtained only by including the IS characteristics in the lateral force distributions.
In addition, since the main problem in the triangular distribution is that the entire base shear is transferred to the superstructure and that the story force at the base level is equal to zero, some distributions consider the influence of the inertia of the base floor [
41,
42,
43,
46,
48]. Indeed, ignoring this story force in distributing the base-shear forces leads to overestimating the forces at higher levels and overturning the moment on the structure. Therefore, some authors propose distributions given by a combination of different modes of vibration or by the union of uniform and triangular shear profiles, while others include concentrated force at the base level.
In particular, Khoshnoudian et al. [
49] and Cardone et al. [
47] propose a distribution given by the combination of the first three simplified modal shape accounting for the superstructure period of vibration and for the non-linearity of the isolation system. Khoshnoudian et al. [
48], Lee et al. [
41], and Tsai et al. [
42] proposed a combination of the uniform and linear distributions not considering the IS characteristics but only the superstructure properties. Since the last formulae, developed for configurations with almost linear isolation system and isolation periods well-separated from the superstructure period, provide similar values of story shear, in the following, only the Lee’s formula will be considered as reference.
In the non-linear distribution proposed by Ryan et al. [
43], York et al. [
46] and Andriono et al. [
44], the exponent “p” [
44] or “k” [
43], depending on IS parameters, predict with more accuracy the bulging shape of the shear envelopes due to the several damping values. In fact, the predicted superstructure force distribution is strongly influenced by effective damping: as the damping increases, the exponent value becomes greater and the lateral shear envelope becomes more bulged. For completeness, the distribution is nearly uniform (exponent tends to zero) for a lightly damped system and more than linear (exponent is greater than the unit) for a highly damped system.
For the sake of simplicity, the improved force distributions are compared to the existing force distribution used by the codes in
Figure 9. The comparison is carried out for the 3-, 5- and 7-story prototype buildings, equipped with different isolation systems. In order to make it more meaningful, any of these IS parameters are compatible with those investigated by other authors in their studies.
The charts in
Figure 9 refer to a 3-story (a), a 5-story (b) and a 7-story (c) buildings. For every type of superstructure two different configurations of IS are considered, the first one with a low value of the equivalent damping ratio, the second one with a medium-to-high value.
As can be observed, for the base isolated configurations analyzed in this study, only some formulae can accurately predict the effective distribution of the inertial forces over the height of the superstructure.
In their studies, Lee et al. [
41] and Tsai et al. [
42], for instance, refer to an equivalent viscous-elastic model that describes the isolation system with low degree of non-linearity. For this reason, their formulae underestimate the shear values at the upper level, especially for highly damped systems. The lateral force distribution proposed by Andriono and Carr [
44,
45], instead, tends to overestimate the shear force at the different levels because at the base story the inertial force is equal to 0.
Also the first formula developed by Khoshnoudian et al. [
48] provides values too conservative for slightly damped systems. It becomes even less accurate for the configurations with a greater number of stories. For a highly damped system, by contrast, it predicts unsafe values of the story shears. The same considerations hold also for the second formula [
49]. For the structures under consideration, the formula by Cardone et al. [
47] does not generally lead to accurate predictions. Conversely, more recent formulations [
43,
46] are able to predict very accurately the shear force at the different levels of the superstructure. The distribution proposed by them fits the shear profile even for high values of equivalent coefficient damping ratio. However, while for three- and five-story structures a perfect overlap can be observed between the results of the NLTH analysis and that of the LSA, for the seven-story building their distribution is less accurate and underestimates the shear forces at the upper levels. These results may restrict their applicability for building with a number of stories in accordance with the international regulations [
17,
20].
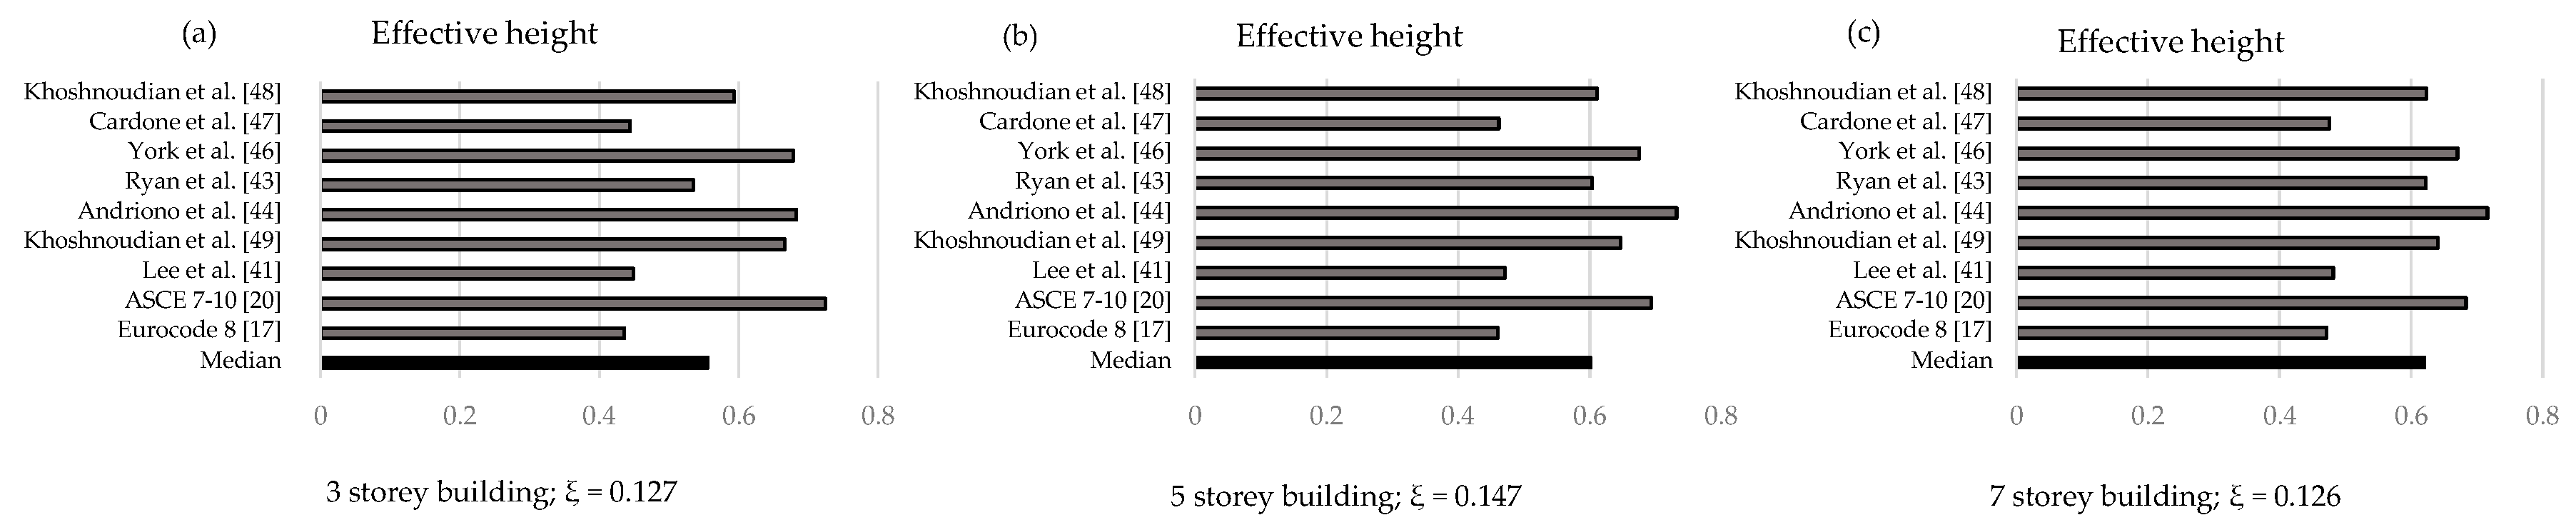
The effective height is a parameter that makes the shape of the lateral force distribution immediately understandable.
Figure 10 shows a comparison in terms of effective heights for a configuration of each prototype building considering similar values of the equivalent damping ratio.
By comparing the effective heights, for medium values of equivalent damping ratio, it can be noted that the distribution proposed by Lee et al. [
41] provides an underestimation of the effective height, while the formulations suggested by Khoshnoudian et al. [
49], York at al. [
46] and Andriono et al. [
44] overestimate the shear forces at the upper levels, especially in the cases of three- (a) and five-story (b) buildings. It can be observed again that the equivalent distribution of static forces proposed by Ryan et al. [
43] better predicts the seismic response of the base-isolated buildings.
4.2. Statistical Analysis and Considerations
The results of the NLTH analysis have demonstrated that, as expected, the superstructure force distribution is strongly influenced by the effective damping. In fact, an apparent correlation between the damping ratio and the shape of the shear envelope can be observed in the previous charts (
Figure 7 and
Figure 8).
Figure 11 shows the correlation between the relative error of base shear distribution, obtained from a uniform distribution formula and non-linear dynamic analysis results, and the equivalent damping ratio. For the sake of simplicity, the relative error is reported in terms of story shear force (Equation (8)):
where i indicates the ith level and F
NLTH and F
LSA represent, respectively, the peak of the story shear force obtained from NLTHA and the static force provided by the uniform distribution for the i-th level.
Figure 10 shows an almost linear correlation between the relative error of shear forces and the effective damping. Passing through the origin, the relationship highlights the suitability of the uniform distribution for value of ξ near zero and the inadequacy to describe the seismic response of BI structures even for relatively low values of the effective damping.
It can be observed that the slope of the curves is steeper for the upper levels. The negative slopes of the lower levels, instead, underline that the uniform distribution overestimates the shear force of these levels while underestimating those of the upper levels with the increase of the damping.
Specifically, for slightly and moderately damped systems, the effective shear envelopes fall between the two distributions recommended by the building codes, though it should be noted that the inverted triangular distribution is unconservative for highly damped systems, which tends to increase the superstructure forces. For this reason, in order to provide an accurate lateral distribution of base shear over the height of superstructure for LSA procedures and preserve the intrinsic simplicity and practicality of the method, a simplified formula is proposed by Equation (9), given by the combination of the two formulae used by building codes [
15,
18]:
The accuracy of this force distribution can be related to an easily interpretable variable: the effective height of the shear forces.
Figure 8 has documented a strong correlation between the effective height and the degree of non-linearity of the IS, expressed in terms of equivalent damping ratio ξ. For practical purpose, a linear correlation between the effective height and ξ can be detected:
where the h
eff, u is the effective height assessed for uniform distribution.
Thus, the δ parameters can be derived as a function of the equivalent damping ratio in order to provide an appropriate effective height for the force distribution.
Since the effective height of the proposed distribution can be easily expressed by Equation (11), by equalizing Equations (10) and (11), δ can be derived from Equation (12):
where h
eff,t is the effective height assessed for triangular distribution.
In an idealized configuration, where the story mass is the same at the different levels, heff,u and heff,t reduces to 0.50 htot and 0.67 htot, respectively. Conversely, the expression of h in Equation (11) covers the case of more general distribution of lateral forces resulting from the variability of relevant structural parameters.
As shown in
Figure 8, the θ coefficient, instead, depends on the number of stories of the superstructure. It assumes values ranging from 0.93 (for 3-story buildings) to 1.34 (for 7-story buildings).
5. Conclusions
This study investigated the validity of linear static analysis (LSA) for BI-structures. Specifically, equivalent lateral force distributions recommended in structural building codes and proposed in the literature have been examined to evaluate realistic seismic loads in the preliminary analysis and design of seismic-isolated structures using simplified procedures.
Based on the comparisons between the story-shear envelopes, obtained from NLTH analyses and the corresponding shear profiles proposed for LSA, considering the different lateral force distributions, the following conclusions can be drawn:
the lateral force distribution currently recommended in EuroCode and NTC 2018, which neglects the contribution of higher modes, significantly underestimates the shear forces at the upper levels of the superstructures, even when the IS exhibits weakly non-linear response;
the lateral force distribution proposed by ASCE 7–10 provides results that are too conservative compared with those of dynamic analyses for low and medium equivalent damping ratios;
the degree of non-linearity of the isolation system strongly influences the seismic response of the base-isolated buildings. As the equivalent damping ratio increases, the shear envelope increasingly bulges because of more significant higher mode effects;
some formulations available in the literature provide more accurate predictions of the peak seismic forces throughout the height of buildings and hence of the lateral force distributions because of their explicit dependence on IS parameters;
an accurate vertical distribution can be achieved as a function of the relevant parameters of the superstructures and isolation systems;
a simplified formula for the vertical distribution of the base shear, combining both uniform and linear distributions, is proposed as a function of the equivalent damping ratio (Equation (9));
the formula provides slightly conservative seismic story forces, resulting in a more economic design compared to the procedure of the ASCE and in a safer method than that proposed in NTC 2018 for buildings that comply with the codes’ limitation.
Finally, the simplicity of the proposed formulation for determining lateral force distribution in LSA makes them a valid alternative to more computationally intensive NLTH analyses, with a significant reduction in time and an easier way to check the physical consistency of the analysis results. However, further research is needed to verify the general applicability of the proposed equations for different configurations of base-isolated buildings, including different structural types (e.g., shear-wall systems, masonry building), and different distributions of structural stiffness over height, as well as for a more diverse set of seismic records.


