Article

Numerical Modelling and Validation of the Response of Masonry Infilled RC Frames Using Experimental Testing Results

1
University School for Advanced Studies IUSS Pavia, 27100 Pavia, Italy
2
European Centre for Training and Research in Earthquake Engineering, 27100 Pavia, Italy
*
Author to whom correspondence should be addressed.
Buildings 2020, 10(10), 182; https://doi.org/10.3390/buildings10100182
Submission received: 8 September 2020 / Revised: 5 October 2020 / Accepted: 9 October 2020 / Published: 13 October 2020
(This article belongs to the Collection Structural Analysis for Earthquake-Resistant Design of Buildings)

Abstract

:
Reinforced concrete (RC) frame buildings with masonry infills represent one of the most common structural typologies worldwide. Although, in the past, masonry infills were frequently considered as non-structural elements and their interaction with the structure was neglected, earthquakes occurring over the last decades have demonstrated the important role of these elements in the seismic response of all RC-infilled building typologies. In this regard, the selection of the most suitable numerical modelling approaches to reproduce the hysteretic response of the masonry infills—and their interaction with the RC frames—is still an open issue. To deal with this issue, in this study, a macro-classification based on different available databases of experimental tests on infilled RC frames, is firstly proposed to understand the variability in the infill properties and the corresponding numerical modelling uncertainties. Five masonry infill types are selected as representative for the typical existing configurations in Italy and other Mediterranean countries. Three of those masonry infill types are then selected to carry out a more detailed analysis, namely their numerical modelling validation using experimental testing results, considering and comparing the main formulations available in the literature for the definition of the hysteretic behaviour of infills. From such a comparison, the model that minimizes the prediction error, according to specific features of the selected masonry infill, is identified for each masonry infill type.

1. Introduction

A relevant portion of the existing buildings in Italy and other Mediterranean countries is constituted by reinforced concrete (RC) buildings with masonry infills, not designed according to modern seismic codes. The current state of practice for the design of these buildings generally does not consider the influence of masonry infills, which are rather treated as non-structural elements with the only scope of providing thermal insulation from the outdoors. By contrast, earthquakes that occurred over the last decades and post-earthquake survey damage assessment reports [1] showed the relevant role played by masonry infills in the global and local building response. Extensive damage and collapse of masonry infills led to significant economic and human losses, which are often worsened by the fact that poor seismic detailing may frequently be found in existing RC buildings. About 80% of the earthquake-related losses in this type of buildings are the consequence of damage to the masonry infills [2]. As such, the frame-infill interaction should not be neglected, given that the masonry infills significantly affect the dynamic response of the building both in the linear and nonlinear range. A significant increase of the seismic demand at which the buildings start to become unstable can be observed due to the period shortening related to the presence of the masonry infills [3]. At the same time, the modification in the inelasticity spreading might lead to brittle failure mechanisms. Many efforts have been made in the last years to better understand both the behaviour of masonry infill panels when subjected to earthquakes and their interaction with the surrounding RC frame. Extensive experimental tests, both in-plane (IP) [4,5,6,7] and out-of-plane (OOP) [8,9,10,11,12], investigated the cyclic hysteretic response of masonry infilled RC frames. Most of the experimental results are collected in databases aimed at providing performance parameters to account for the masonry infills in the seismic design and performance assessment [13,14]. Many researchers proposed analytical methods—generally based on the results of single experimental testing campaigns—to provide approaches for the numerical modelling of the masonry infills [15,16,17]. However, each approach has been validated for a specific case and/or frame-infill system, thus implying that, at the moment, there is no consensus on a unified and reliable approach for the design of fully- or partially-infilled RC frames. This is partly due to—(i) the uncertainties and variability inherently related to the frame, infills and infilled frame as a system and mostly to (ii) the lack of comprehensive cross-validation modelling efforts. Based on these considerations, further research is still required to provide exhaustive indications to account for the response of the masonry infills both in the design and assessment of RC buildings. In this sense, starting from an extensive literature review, fully described in Section 3, this paper contributes to addressing such an issue, through a series of analytical simulations, to define a comprehensive number of masonry infill typologies that can be generally found in the Italian/European context and develop reliable numerical models to be implemented in performance assessment of infilled frames both at single and regional scale.

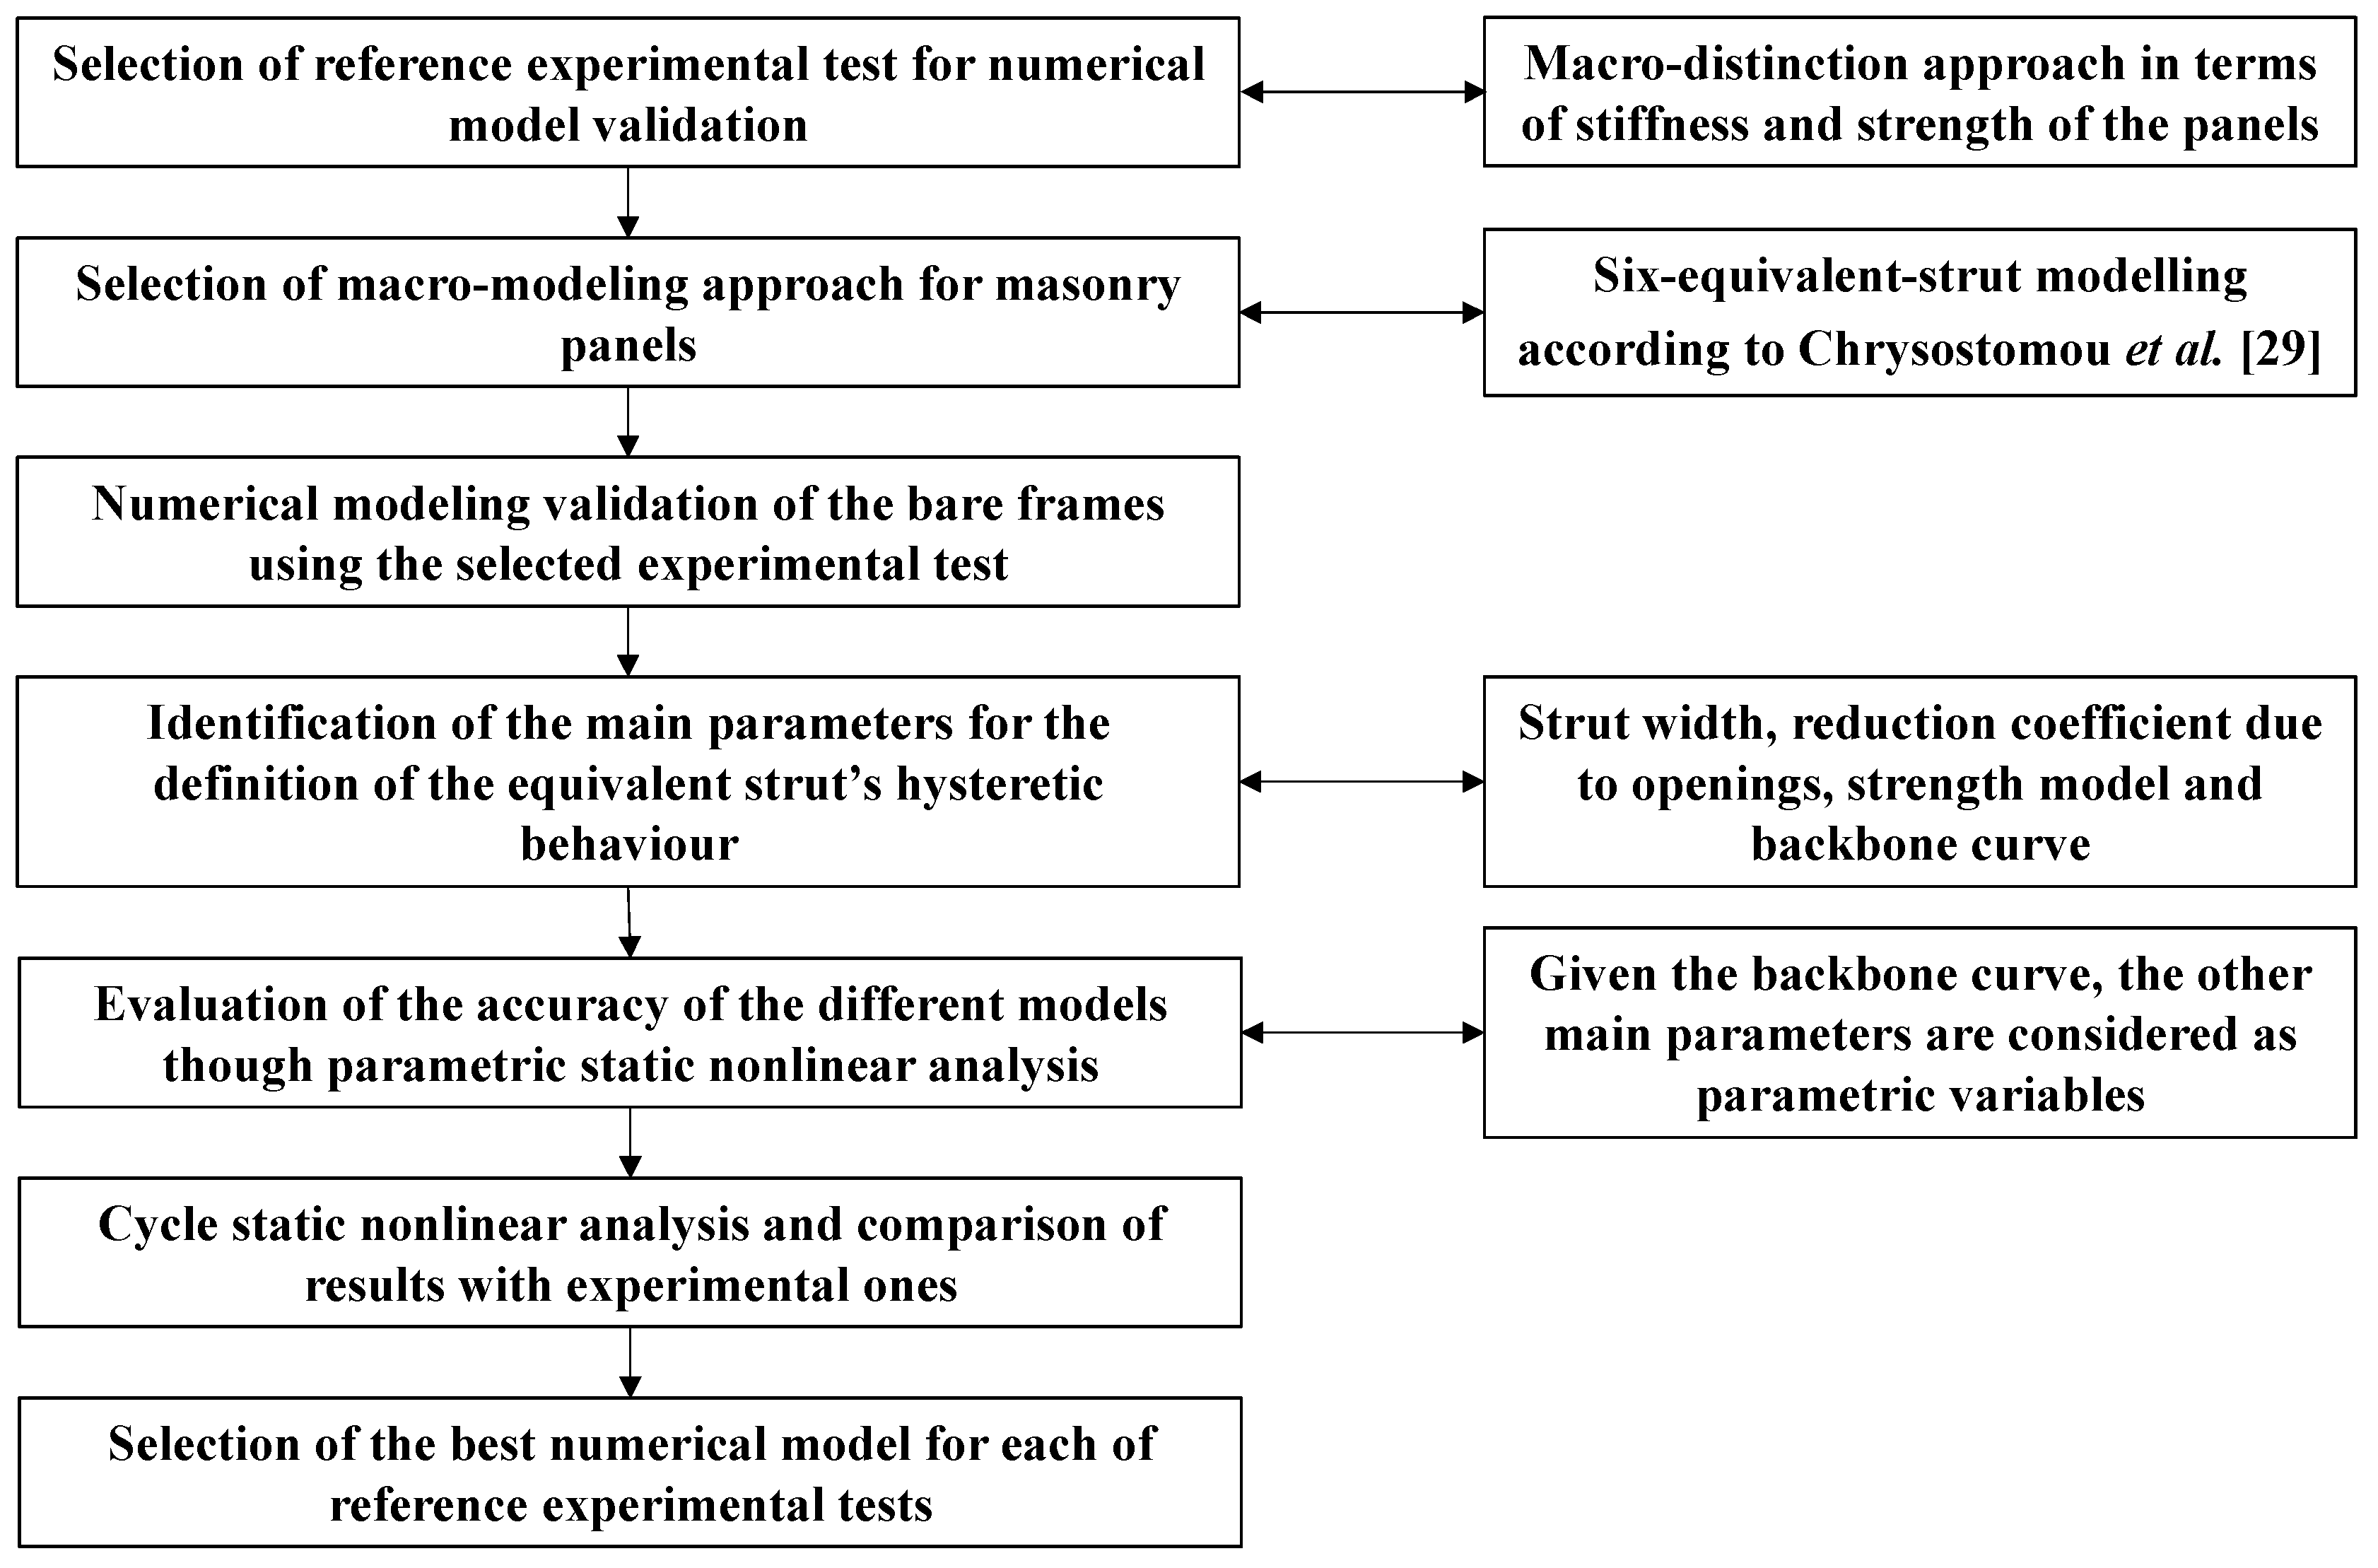
2. Research Methodology

Numerous analytical models have been proposed over the last decades for the prediction of the lateral response of masonry-infilled RC frames. All of these models are generally developed and calibrated using the results of a specific set of experimental pseudostatic tests. However, the specimens of each experimental campaign are generally characterised by specific features that render them rarely comparable. This leads to significant issues with the choice of the most appropriate analytical models to be used for the design and assessment of masonry-infilled RC buildings, with non-negligible implications, particularly for large-scale simulation research questions. For instance, De Risi et al. [14] investigated the effectiveness of two largely adopted analytical models [18,19] in predicting the test results from a database colleting many experimental campaigns on masonry-infilled RC frames. Their study pointed out that the prediction capability of the two analytical models, in terms of backbone curves, is significantly affected by the configuration of holes in the masonry bricks [14]. This is only one example of the multiple sources of variability and consequent uncertainty that can affect the choice of the analytical models for nonlinear analysis; other examples are the mechanical properties of the masonry panels, the presence of openings and the observed failure modes, just to name a few.
A possible approach to overcome the inconsistency in selecting a unique analytical model for seismic performance assessment of masonry-infilled RC buildings, both at single and regional scale, consists in the development of a masonry infill taxonomy. For each masonry infill typology, the corresponding analytical model or models, that best reproduce the structural response obtained by experimental testing should be identified. This approach was followed in the present study to define a comprehensive number of masonry infill typologies, generally found in the Italian/European context and to develop reliable numerical models to be implemented in the performance assessment both at single and regional scale. The points briefly discussed below summarise the adopted research methodology (Figure 1):
  • Classify the typologies of masonry infills representative of the typical configurations adopted in Italy and other Mediterranean countries based on experimental data. The results of in-plane pseudostatic cyclic tests, carried out on single-storey and single-bay masonry-infilled RC frames, with and without openings, are analysed to identify the most common configurations. The masonry infill typologies are defined based on the masonry infills strength; this parameter was found to be the most suitable for future analytical applications on the seismic performance assessment of masonry infilled RC building portfolios accounting for infill variability [20];
  • Define the most accurate numerical modelling approach to simulate the experimental lateral response of masonry-infilled RC frames. If the frames are not designed according to modern seismic provisions, then the numerical modelling should also be able to account for the typical phenomena observed in existing buildings, such as material and geometrical nonlinearity, bar slippage, joint flexibility, behaviour of poorly detailed and non-ductile RC frame members, among others;
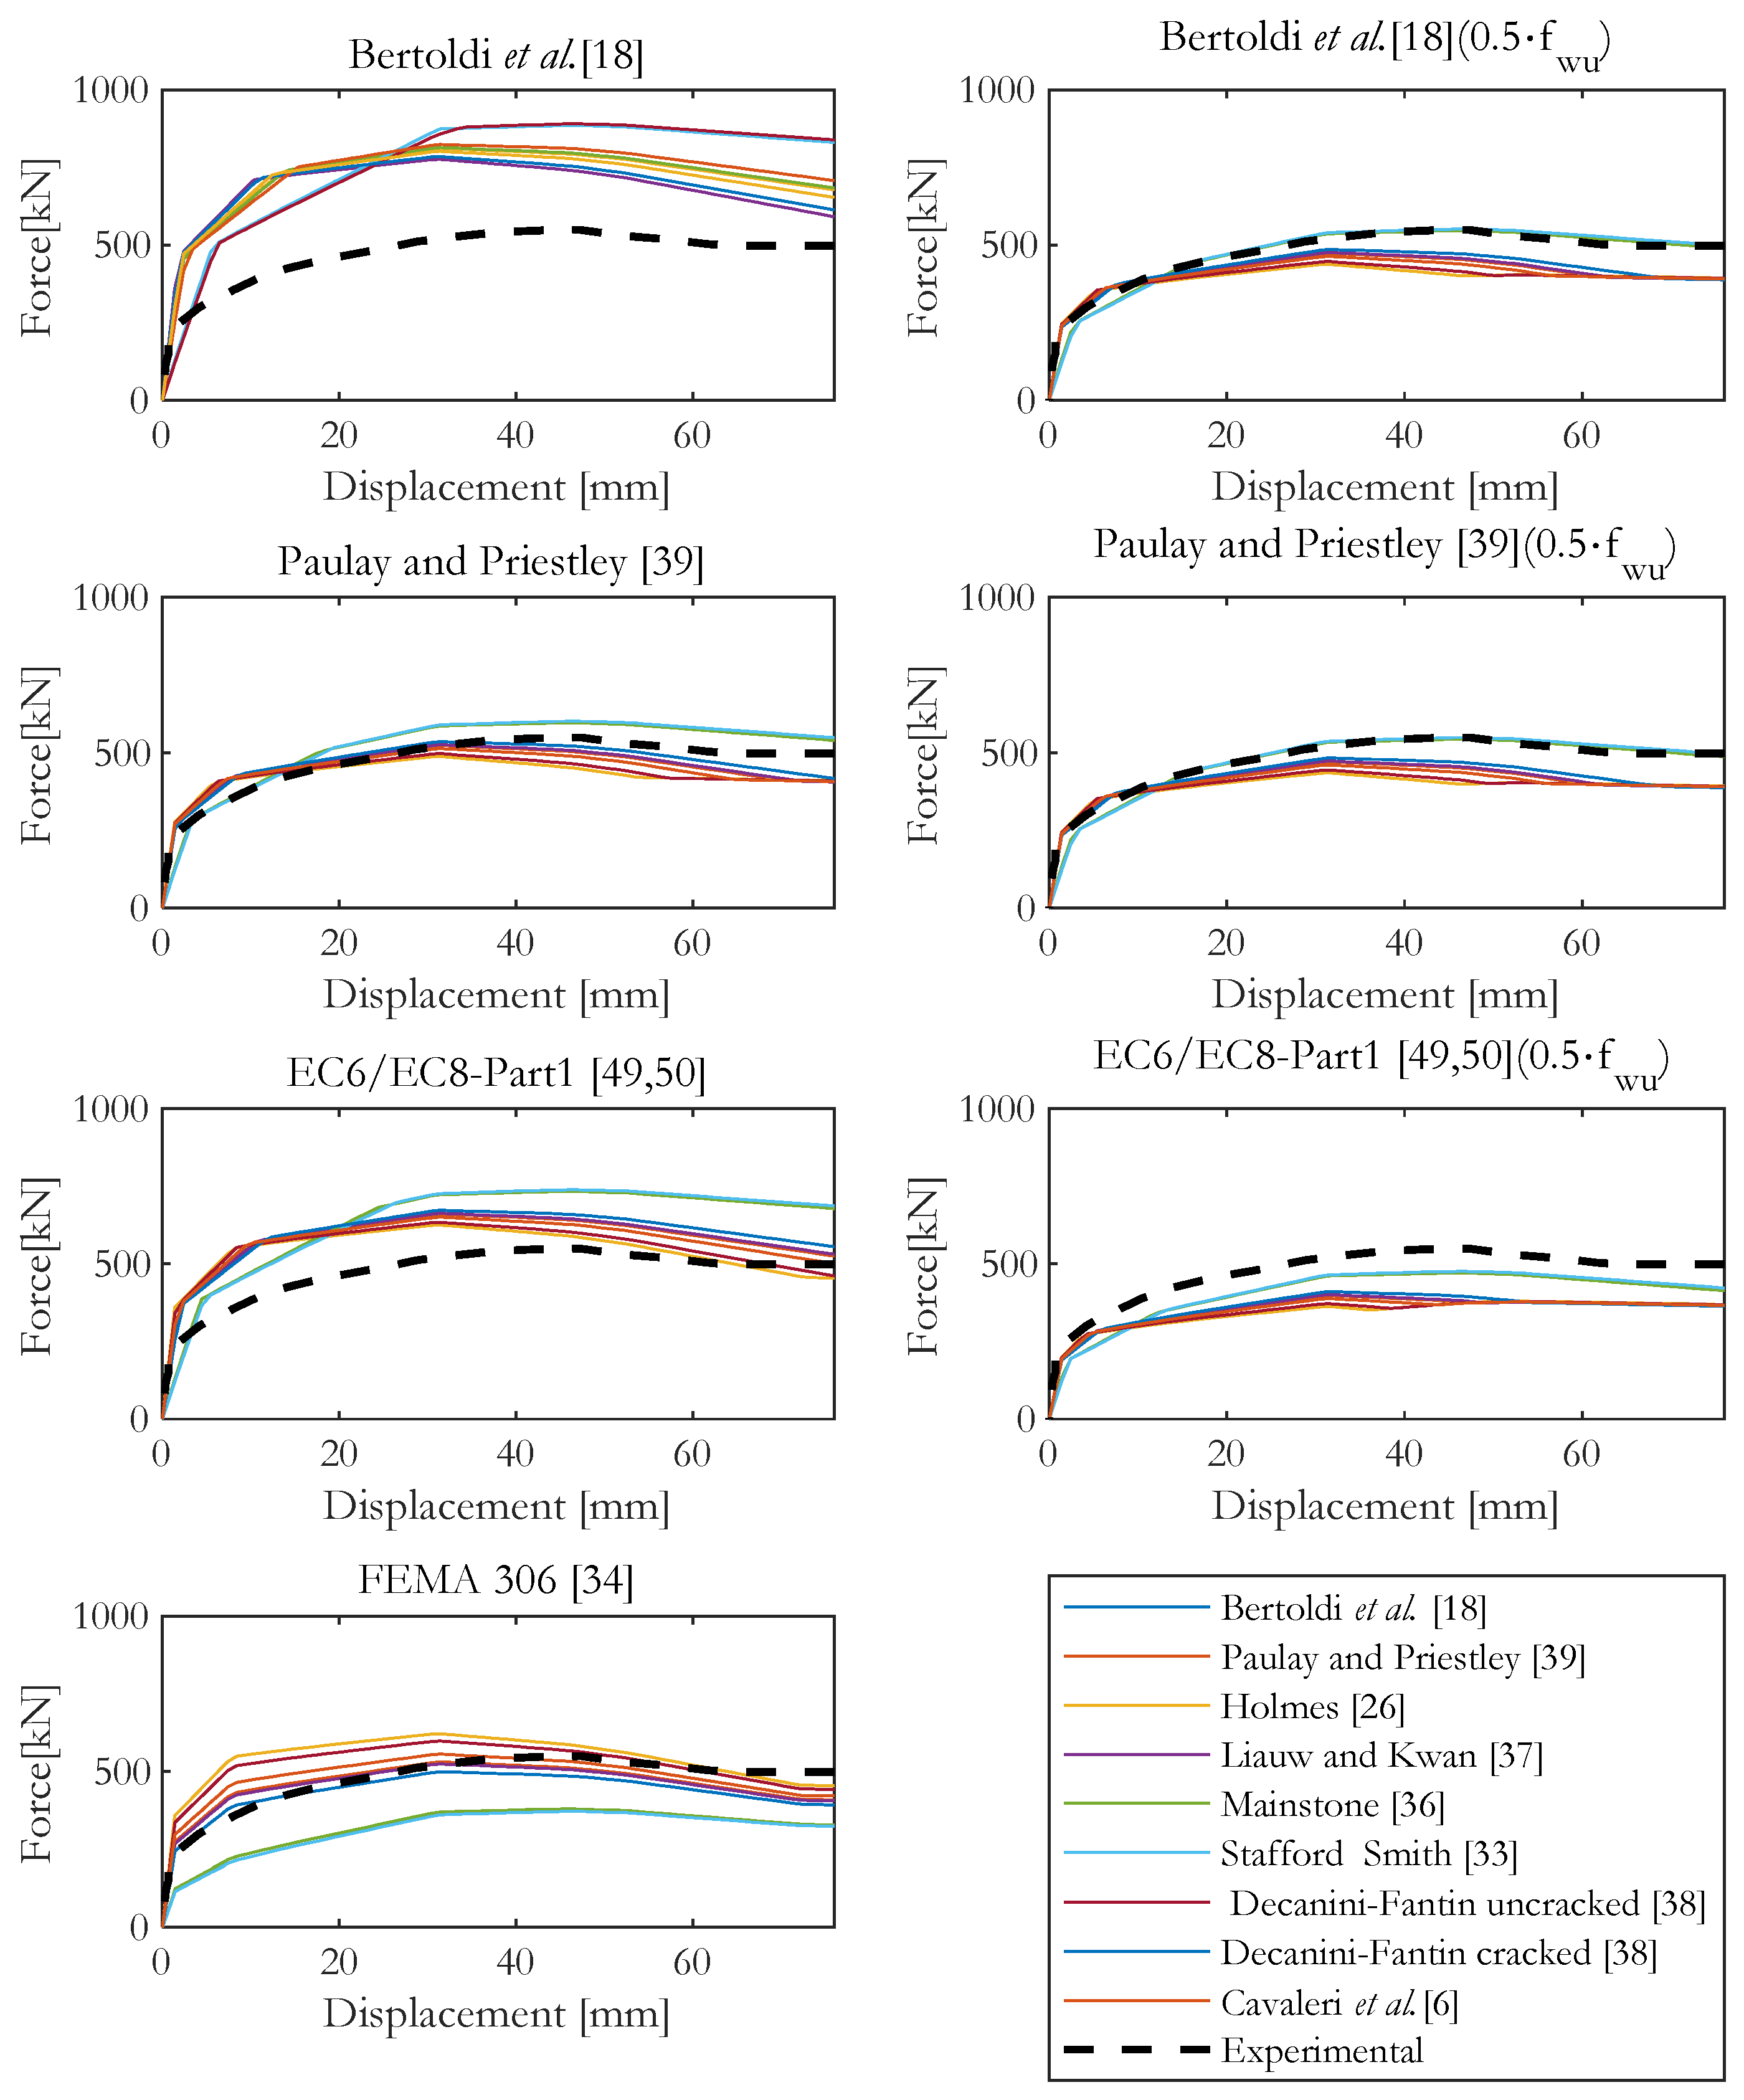
  • The main parameters affecting the numerical modelling of masonry infills are investigated. The hysteretic behaviour of the masonry infill panel depends on several parameters, such as the strut width, reduction coefficient to account for the presence of openings, failure mechanism model or formulations to define the backbone curve. For each of these parameters, the main formulations available in the literature are analysed to undertake parametric static pushover analysis;
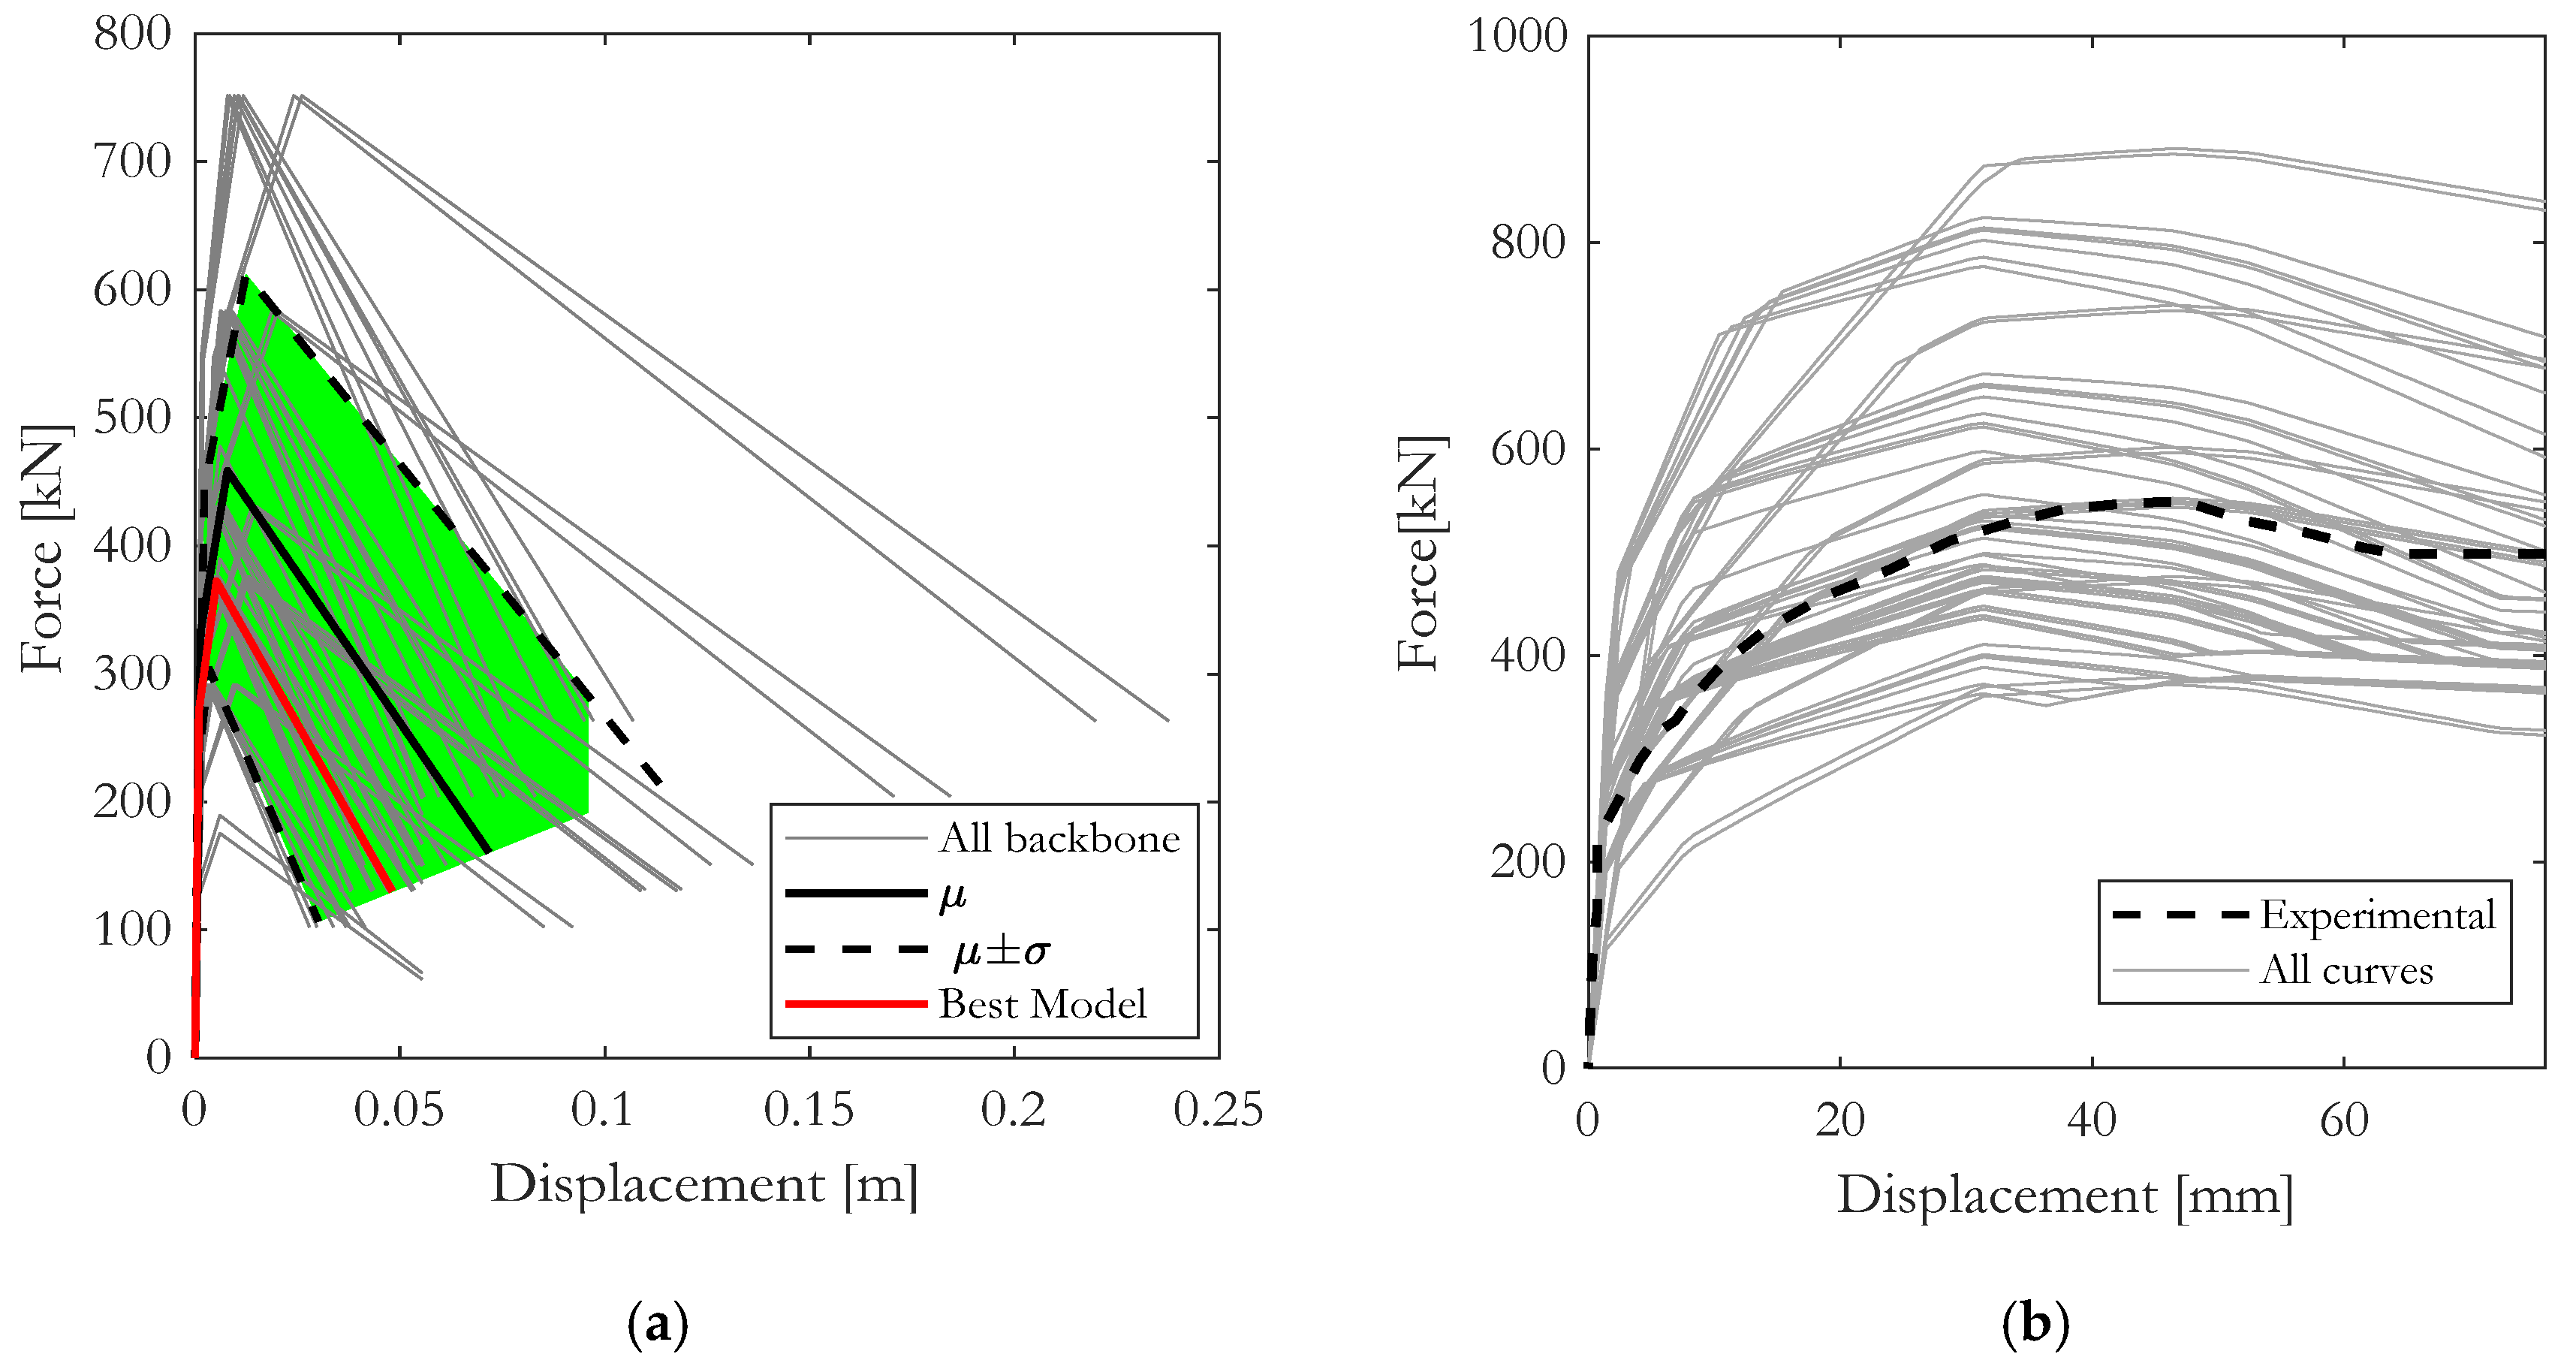
  • In order to define the most reliable numerical modelling approach, for each masonry infill typology identified in point 1, a set of parametric static pushover analyses are carried out combining all the formulations defined in point 3. The comparison is then performed in terms of capacity curves. In specific, given a selected backbone curve, different models could be employed to predict the failure mechanism and strut width; hence, for each of the selected strength models, the impact and accuracy of all the strut width equations is investigated and the same procedure is repeated for all the parameters investigated;
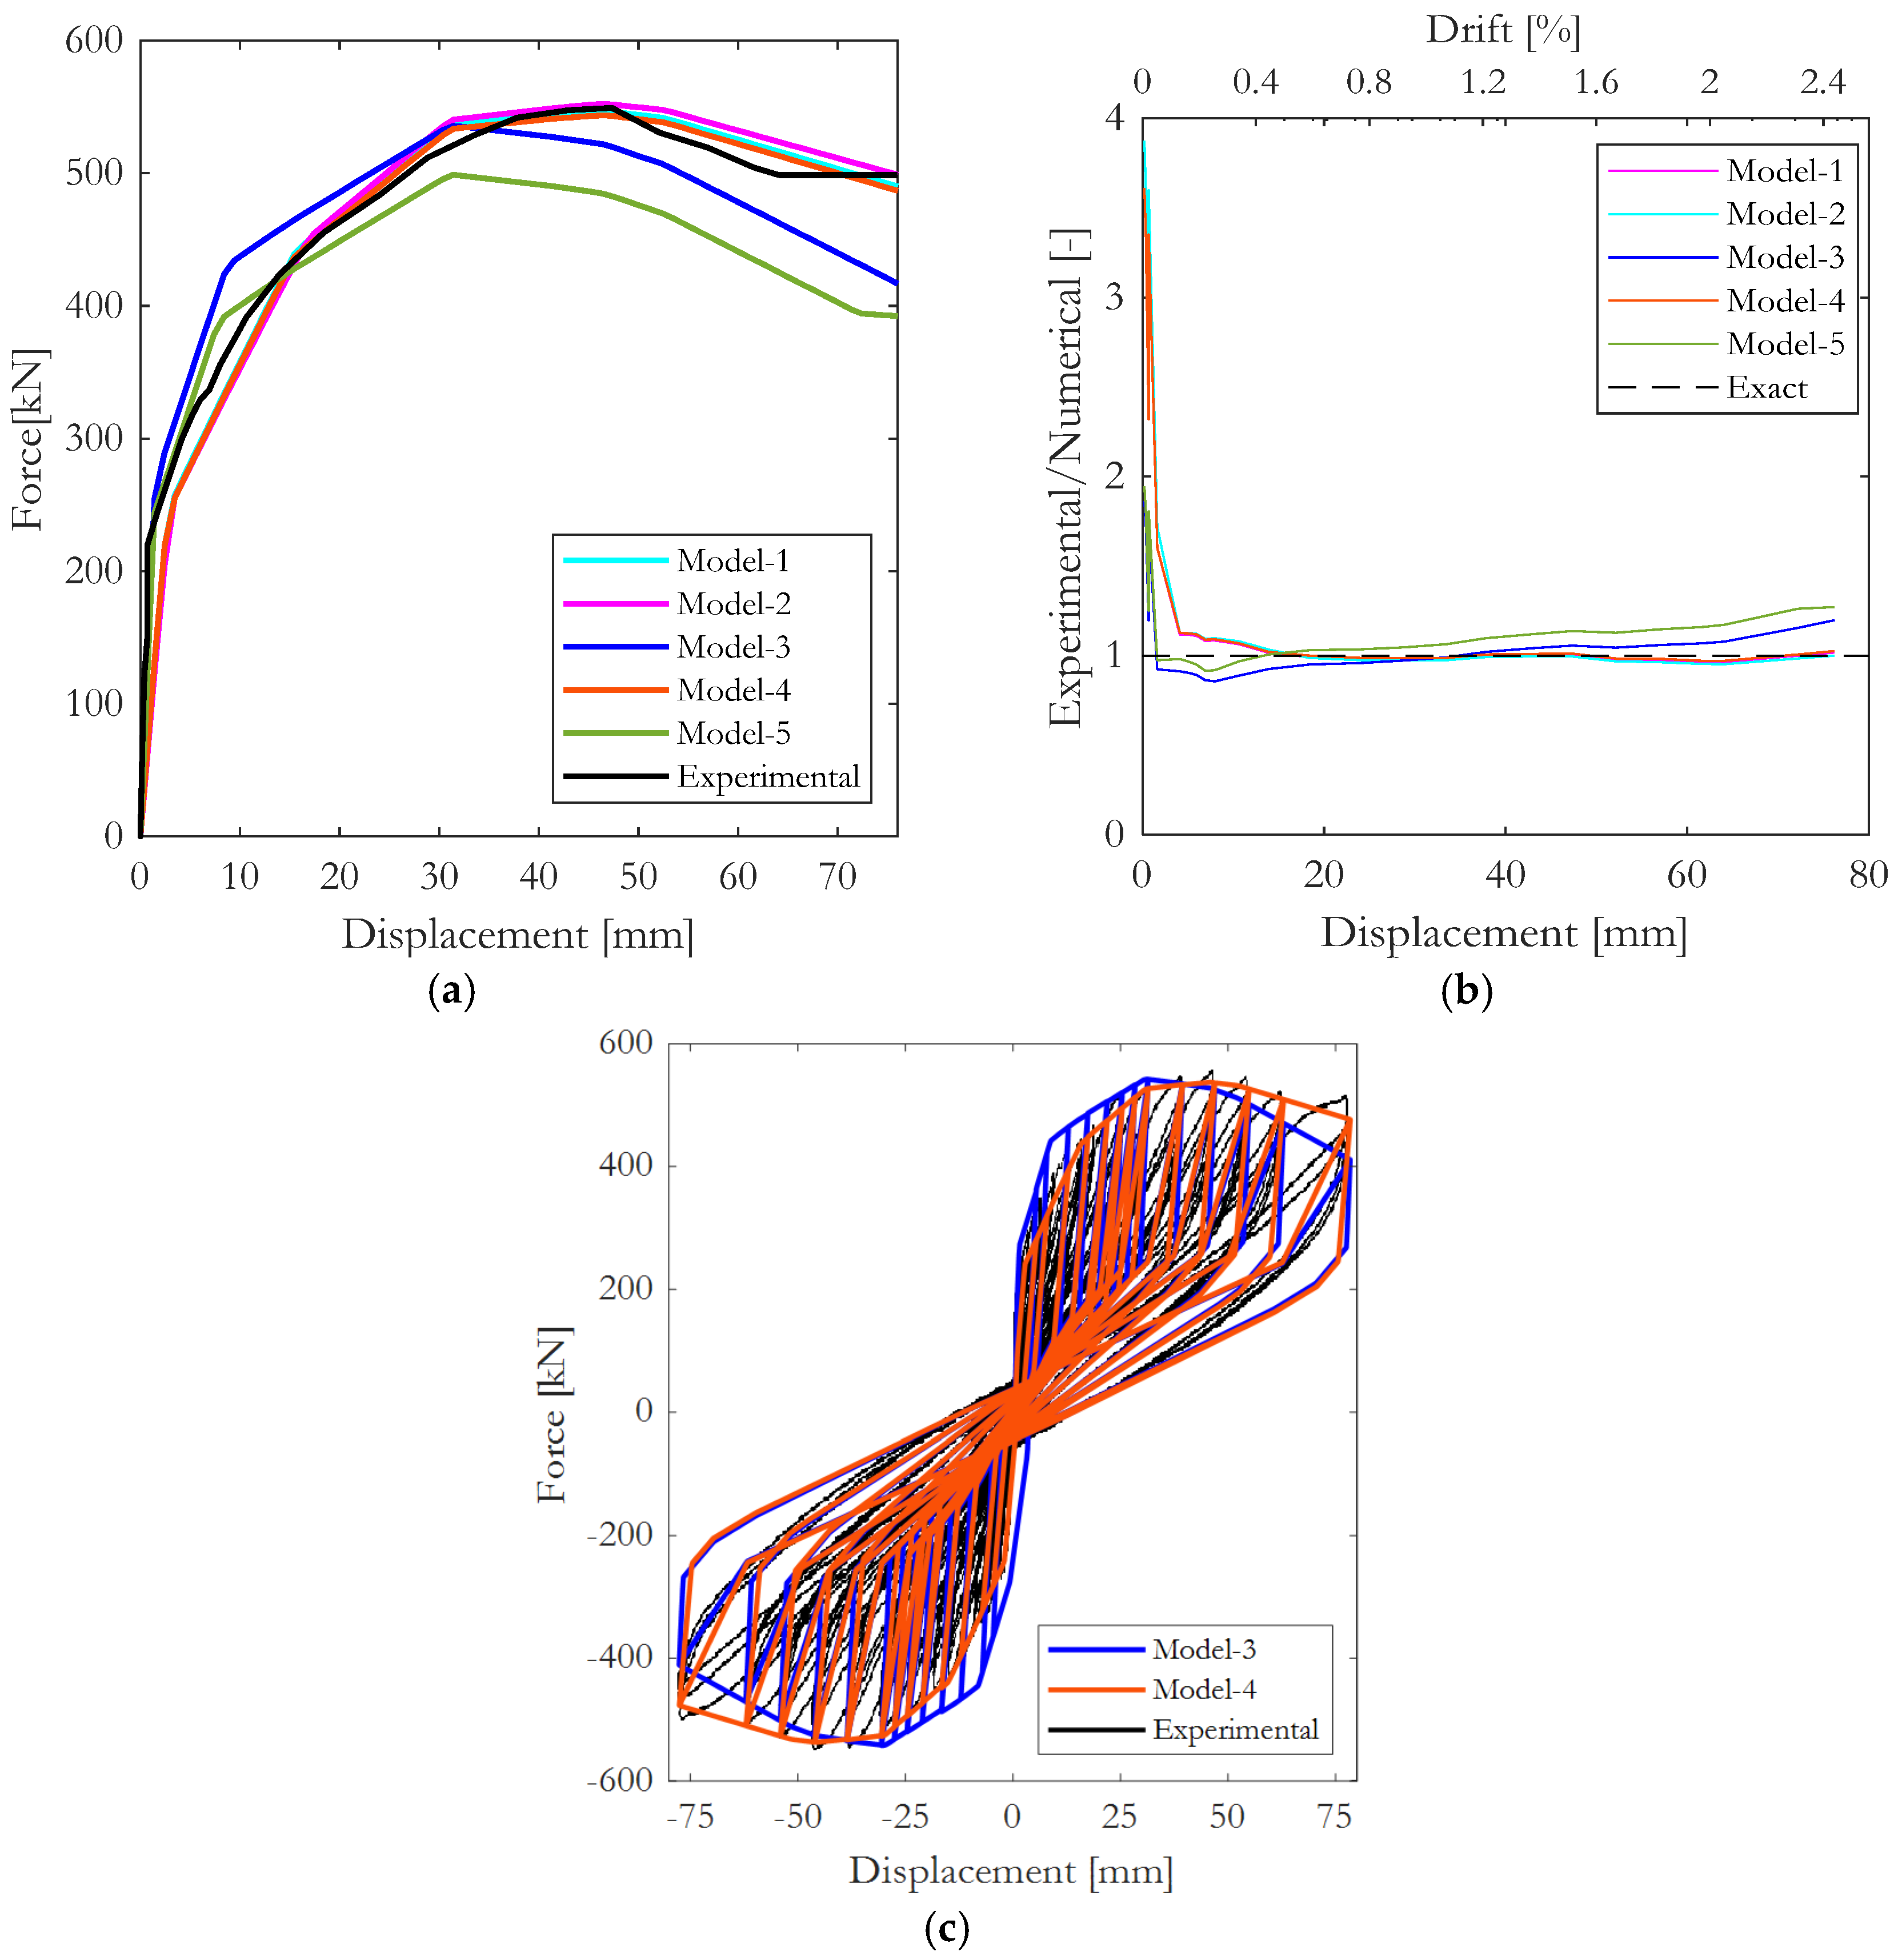
  • Finally, once the most accurate numerical model is identified, cyclic pushover analysis (according to the loading protocol used for the corresponding testing) is performed to investigate the effectiveness of the proposed numerical models, when it comes to predicting the hysteretic response of the masonry infilled RC frames.

3. Numerical Modelling and Structural Response of Masonry Infills

An extensive literature review of the numerical modelling techniques commonly adopted to simulate the seismic response of masonry-infilled RC frames points to a distinction between two macro-categories: local or micro-models [21,22,23,24,25] and simplified or macro-models [15,26,27,28,29,30]. The micro-modelling approaches allows analysts to account for the local effects and to define the crack patterns, ultimate load and collapse mechanisms. However, these models require the calibration of a large number of parameters and high computational resources. For this reason, micro-modelling approaches are generally used only for specific research scopes, targeting specific objectives. Additionally, the micro-modelling approaches can be further classified by distinguishing between simplified and detailed. In the simplified case, the brick units are represented by continuum finite elements with the brick–mortar interface and the mortar properties being lumped into a unique element; conversely, in the detailed micro-modelling, the brick units and the mortar are modelled by continuum (smeared) elements and their interaction is represented by discontinuum interface elements. The simplified or macro-modelling techniques allow the global behaviour of the masonry panels and their influence in the building response to be reproduced. Nowadays, the equivalent strut models represent the most used macro-modelling approach.
Given that the scope of this study is to provide reliable numerical models to be used both at single and regional scale, the macro-modelling approaches, discussed more in detail in the next section, are used. Interested readers are referred to Crisafulli et al. [15], Asteris et al. [16] and Asteris et al. [17] for a comprehensive overview on finite element (FE) methods for infilled frames.

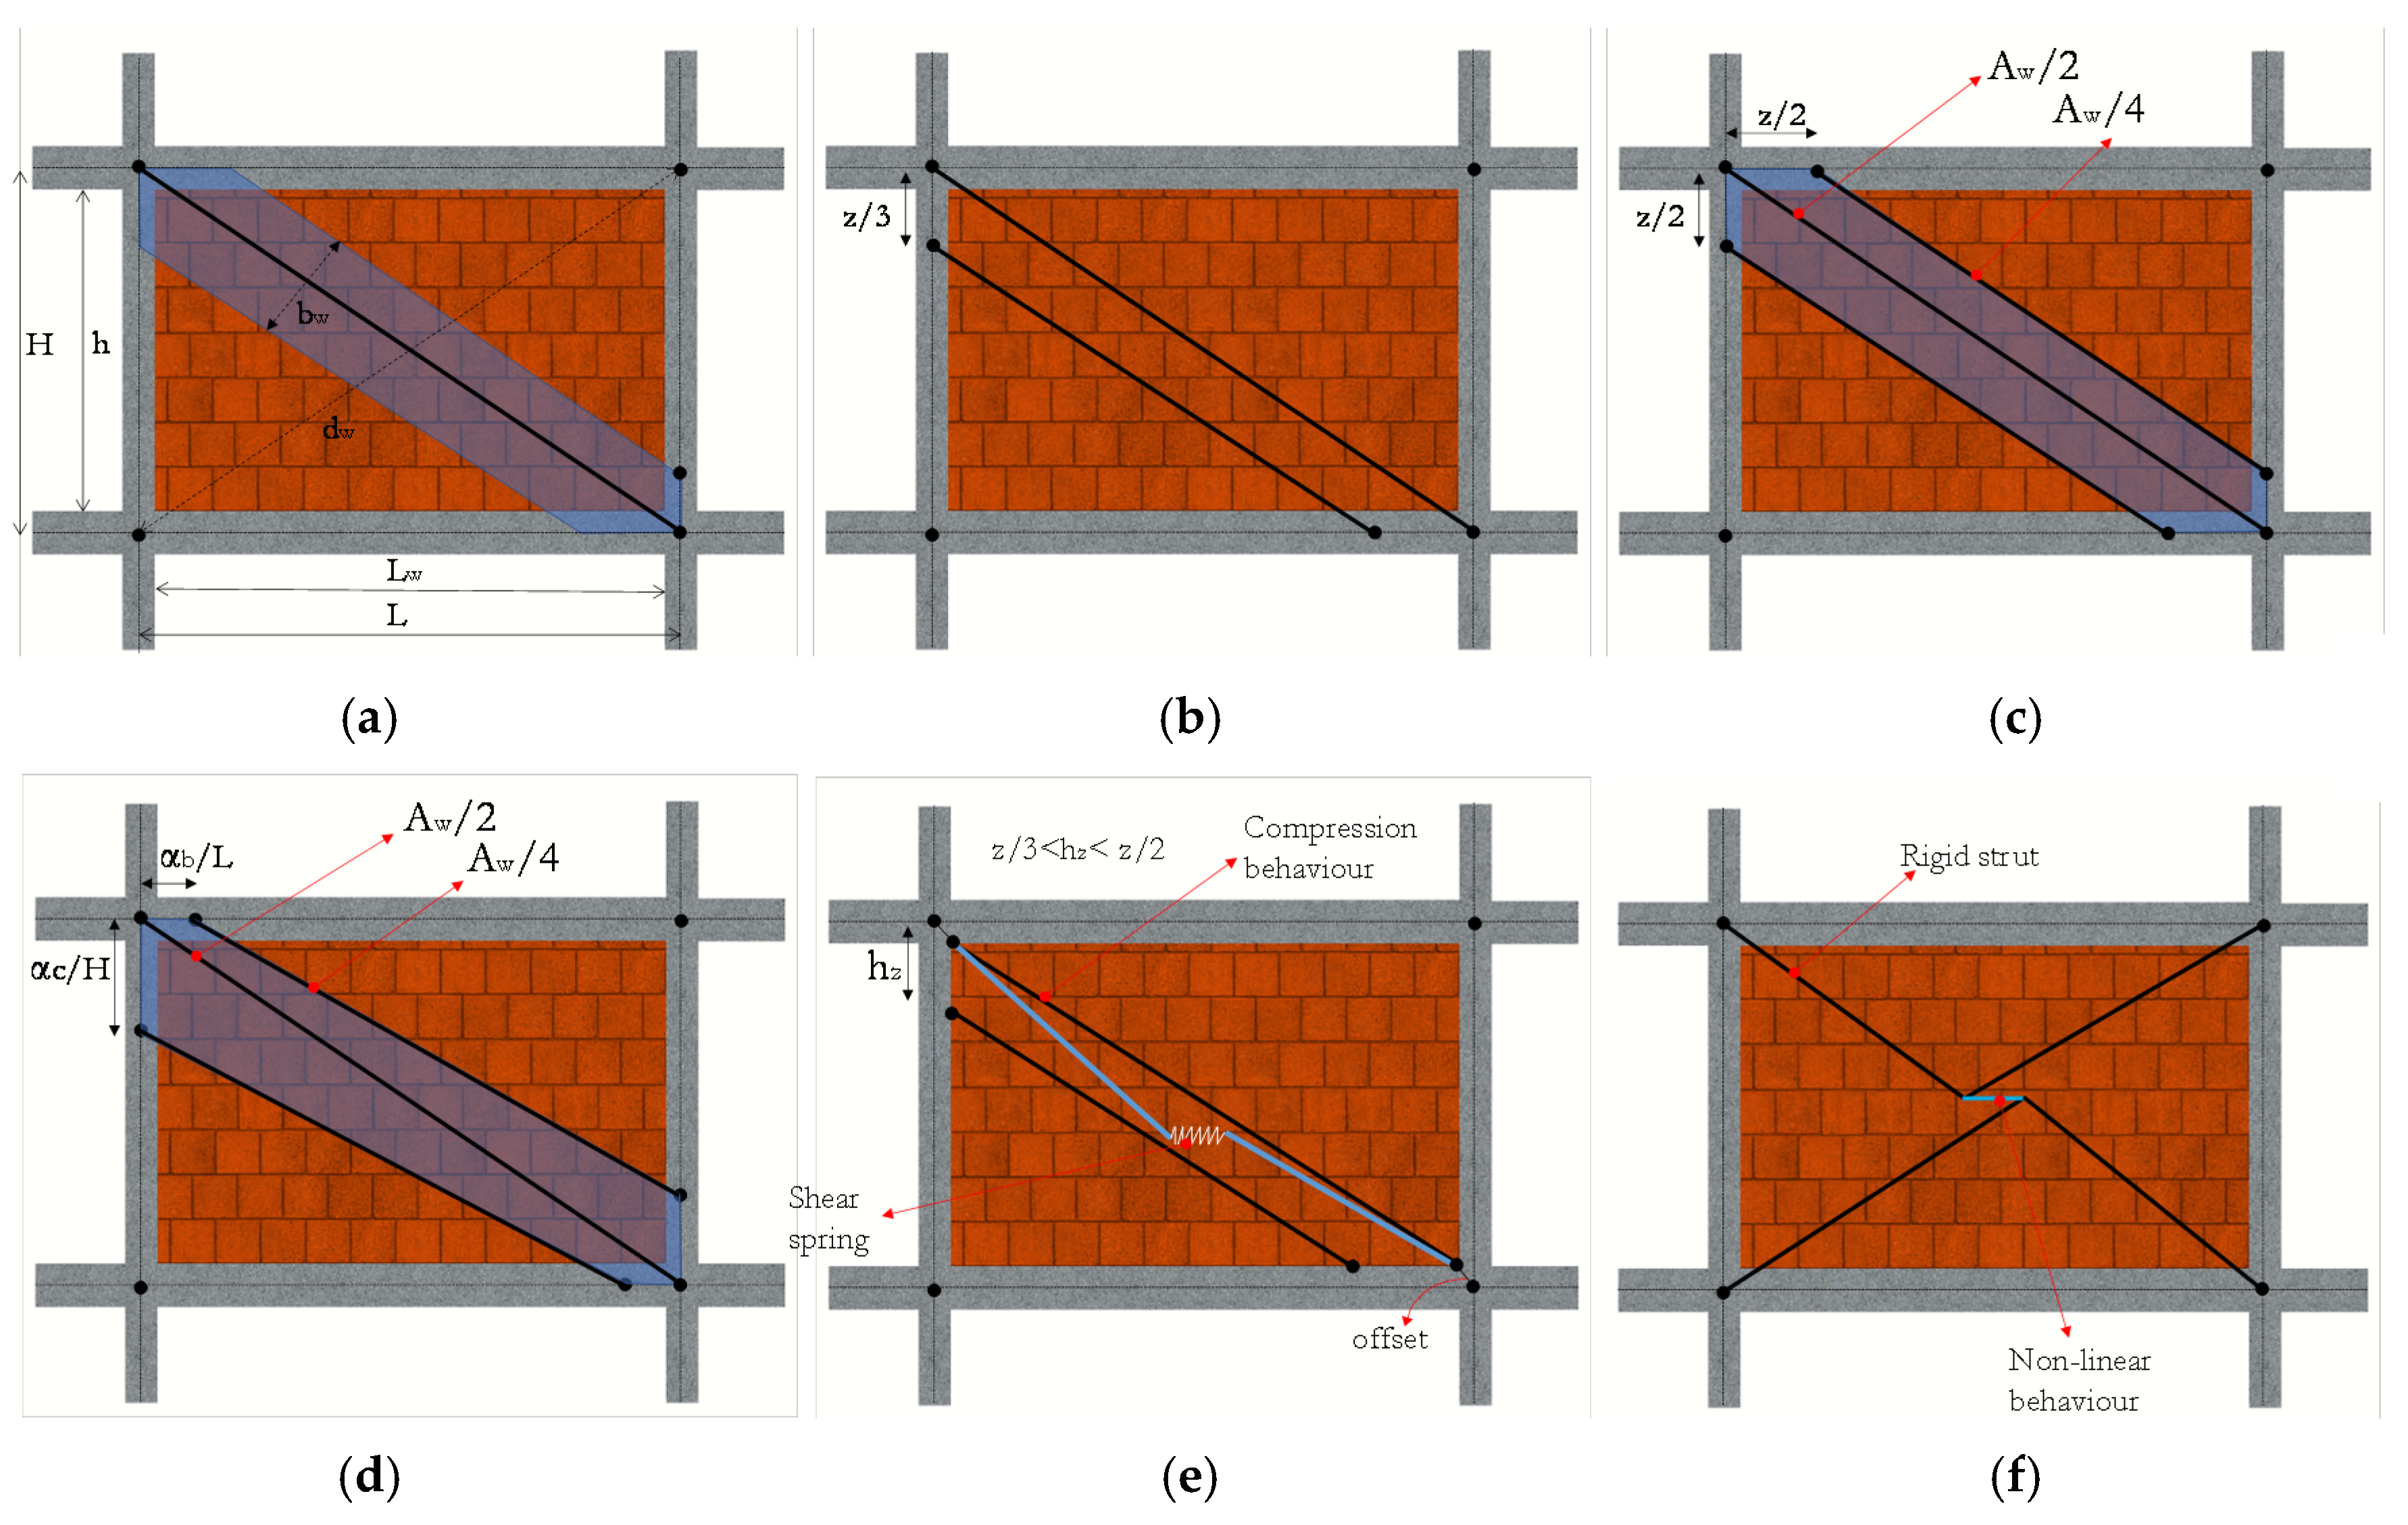
3.1. Macro-Modelling Approaches

Simplified or macro-models are mechanics-based modelling techniques developed by analysing evidence from past earthquake events and experimental test results. Different numerical strategies can be employed in macro-modelling techniques, ranging from simplified equivalent single strut models to complex ones including multiple struts.
One of the first macro-modelling approaches used to account for the infill contribution to the seismic response of RC buildings was proposed by Polyakov [31] (as reported by Klinger and Bertero [32]) and implemented by Holmes [26] and Stafford Smith [33] in the 1960s. It consists in adding two opposite diagonal struts to the RC frame (Figure 2a) and is largely adopted by engineers and researchers, as also demonstrated by its implementation into seismic codes [34].
However, as highlighted by Crisafulli [28], although the global behaviour of the masonry-infilled RC frames is predicted quite well, single strut models are not able to account for the local interaction between frame and infills, thereby inducing inaccuracy in the distribution of shear and moment demand in the surrounding RC frame.
For the analysis of existing RC buildings, more than often characterized by poor seismic details and non-ductile RC frame members, it might be more accurate to consider an off-diagonal macro-model to simulate the possible shear failure mechanisms at the top of the columns. To accomplish this, more complex macro-models were developed by using multiple diagonal struts. For instance, Leuchars and Scrivener [35] proposed a model with two single struts and a shear spring, which is located at the centre of the panel to reproduce the shear sliding failure of the panel. Furthermore, Chrysostomou et al. [29] (Figure 2c) and El-Dakhakhni et al. [30] (Figure 2d) proposed a six-strut approach, foreseeing three struts per direction, to accurately reproduce the local effects due to the frame-infill interaction. It is worth mentioning that in case of multiple-strut approaches, different prescriptions regarding the relative stiffness, the inclination and the contact length (length of the columns in contact with the infill side during the horizontal deformation) are provided in literature and have to be adequately calibrated. As regards the relative stiffness, in case of three struts, 50% and 25% of the total stiffness of the panel are generally assumed for the central and off-diagonal struts, respectively. In case of two struts, if both of the struts are off-diagonal, the relative stiffness is generally 50% of the total stiffness of the panel (for each strut), whereas if just one is off-diagonal, the stiffness is generally set as 75% for the diagonal strut and 25% for the off-diagonal one.
Crisafulli [28] developed a 4-node panel element in which the compressive and shear behaviour were accounted for separately by using a double truss mechanism and a shear spring in each direction (Figure 2e). The model is characterised by internal nodes and dummy nodes, spaced each other as function of the contact length; only the internal nodes are connected to the beam-column joints, which enables the subdivision of the column to be remedied and permits to reproduce the local effect due to the frame-infill interaction more accurately. Finally, another simplified macro-model, which is an upgrading of the equivalent bi-diagonal compression strut model, was proposed by Furtado et al. [27]; it consists of four rigid strut elements, which are connected to the beam-column joints and a central element wherein the nonlinear behaviour is lumped (Figure 2f).

3.1.1. Approaches for Full-Height Solid Infill Panels

As mentioned above, Polyakov [31] pioneered the use of macro-models and suggested that an equivalent diagonal bracing system could allow to consider the effect of infill panels. An equivalent strut width needs to be defined within this numerical modelling framework. Based on the suggestion by Polyakov, Holmes [26] proposed the first expression (Equation (1)) to calculate the width of the equivalent diagonal strut:
b w d w = 0.33
where, bw and dw are the strut width and length, respectively.
In the same period, Stafford Smith [33] pointed out that the strut width is expected to vary between 0.10 and 0.25 times the diagonal length of the panel and later on proposed a formulation (Equation (2)) to estimate the relative panel-to-frame-stiffness parameter [32]:
λ = E w ϑ t w sin ( 2 ϑ ) 4 E c I c h w 4
where E is the elastic modulus of masonry panel in the diagonal direction, tw is the thickness of the infill panel, EcIc is the flexural stiffness of the columns of the surrounding frame, hw is the panel’s height and ϑ is the angle related with the aspect ratio of the panel ( h w / L w ) and defined according to Equation (3):
ϑ = t a n 1 ( h w L w )
where Lw is the length of infill panel. Higher values of ϑ indicate that the surrounding frame is less stiff than the infill panel.
Later on, other researchers proposed different equations to calculate the equivalent strut width, detailed in Table 1.
Mainstone [36] proposed two empirical expressions, Equations (4) and (5), based on analytical and experimental tests on a series of infilled steel frames. Equation (5) is also employed in FEMA-306 [34].
b w d w = 0.16 ( λ   h ) 0.3
b w d w = 0.175 ( λ   h ) 0.4
Liauw and Kwan [37] proposed a semi-empirical expression (Equation (6)), based on tests of infilled steel frames, to assess the equivalent strut width, assuming 25° ≤ ϑ ≤ 50°.
b w d w = 0.95 sin ( 2 ϑ ) 2 λ h
In Bertoldi et al. [18] the strut width (Equation (7)) is defined by means of two coefficients (K1 and K2), which are defined as a function of λh.
b w d w = K 1 λ h + K 2 ;   { K 1 = 1.300 ,   K 2 = 0.178 ;   i f   λ h < 3.14 K 1 = 0.707 , K 2 = 0.010 ;   i f   3.14 < λ h < 7.85 K 1 = 0.470 , K 2 = 0.040 ;   i f   λ h > 7.85   }
Decanini and Fantin [38] proposed two different sets of expressions (Equation (8)), depending on the damage state of the considered infill panels (i.e., uncracked or cracked). The equations were calibrated according to experimental tests on RC masonry infilled frames under lateral loading.
Uncracked :   { ( 0.085 + 0.748   λ ) d w ;   i f   λ h 7.85 ( 0.130 + 0.393   λ ) d w ;   i f   λ h > 7.85 } Cracked :   { ( 0.010 + 0.707 λ ) d w ;   i f   λ h 7.85 ( 0.040 + 0.470   λ ) d w ;   i f   λ h > 7.85 }
Another simple formulation (Equation (9)) was proposed by Paulay and Priestley [39].
b w d w = 0.25
It is noteworthy that the values provided by this equation, meant for the seismic design of masonry-infilled frames, are in-between the lower-bound value proposed by Mainstone [36] and the upper-bound one proposed by Holmes [26]. Furthermore, the value proposed by Paulay and Priestley [39] corresponds to the upper bound value of the range proposed by Stafford Smith [33].
Papia et al. [40] proposed Equation (10) to calculate the strut width as a function of the Poisson’s ratio (c, β), vertical load (k) and geometrical parameter (z):
b w d w = k c z ( λ * ) β
where, in particular, λ * is dimensionless, given by Equation (11), to estimate the relative panel-to-frame-stiffness parameter.
λ * = E w ϑ t w h E c A c ( h 2 L 2 + A c L 4 A b h )
All the parameters of the aforementioned equations are listed in Table 1.

3.1.2. Approaches for Infill Panels with Openings

The previously presented Equations are all related to full-height solid panels, however, the presence of infills with openings is not unusual in many building layouts. With this in mind, several analytical, numerical and experimental studies were undertaken in order to quantify the effect of openings on the lateral stiffness and strength of partly infilled frame systems. In general, openings lead to a reduction in the stiffness and strength of the masonry infilled frame system, depending on several parameters, such as the size and position of the openings, the presence of lintels and reinforcements, among others. Polyakov [31] tested eight infilled steel frames with openings of different dimensions observing a reduction of the ultimate strength in the range of 23% to 76% with respect to the fully-infilled counterparts. In Benjamin and Williams [41], the ultimate strength of a partly infilled frame including a central opening with dimensions equal to 1/3 of the infill panel dimensions was about 55% of the fully infilled one. To evaluate the shear strength in panels with openings, Imai and Miyamoto [42] used the reduction coefficient in Equation (12):
r p = min ( 1 0.01 α l ; 1 0.1 α a 0.5 )
where αl is 100 multiplied by the ratio between the length of the opening (lp) and the length of the panel (Lw), expressed in percentage; αa is 100 multiplied by the ratio between the product of the opening’s dimensions (lp·hp) and the product of the panel’s dimensions (Lw·hw), expressed in percentage.
Another expression (Equation (13)) was proposed by Tasnimi and Mohebkhah [43], who derived it based on experimental tests on infilled steel frames:
r p = 1 2.238 ( α a 100 ) + 1.49 ( α a 100 ) 2 ;   α a < 40 %
Asteris [44] suggested another well-known formula (Equation (14)) to define the reduction coefficient to be applied to the width of the diagonal strut.
r p = 1 2 ( α a 100 ) 0.54 +   ( α a 100 ) 1.14
Equation (14) was obtained through a parametric study investigating the influence of the opening’s position and dimension and its mathematical formulation is quite similar to the one by Tasnimi and Mohebkhah [43].
The effect of an opening may be accounted for by means of a simplified approach based on the work of Dawe and Seah [45], in which the reduction of stiffness and strength of the panel due to an opening is taken into account through Equation (15):
r p = 1 1.5 α l 100 ;   α l < 66 %
More recently, the effect of openings was also investigated by Decanini et al. [46], in which a novel reduction coefficient (Equation (16)) was proposed by means of about 150 experimental and numerical tests.
r p = 0.55 e ( 0.035 α a ) + 0.44 e ( 0.025 α l )
Additional details on the reduction coefficients proposed in literature are summarized in Table 1.

3.1.3. Infill-Frame Contact Length

Due to the different lateral stiffness of the masonry infill panel and the RC surrounding frame, at increasing lateral displacements a disconnection between the panel and the frame is observed except for two opposite corner zones, which define the so called “contact length.” It is worth mentioning that the contact length (z) has a significant effect in the distribution of shear and moment in the surrounding frame, as reported in Reference [28]. Moreover, due to the contact length reduction under lateral loading, as well as to the masonry infill cracking, the area of the struts decreases as a function of the increment of the axial displacement in the strut. Under the assumption of constant modulus of elasticity, this decrement is in the range of 20–50% due to cracking of the masonry. The model proposed by Crisafulli [28] directly accounts for this phenomenon, given that the area of the strut varies as a function of the axial displacement and considering a variable modulus, which decreases as the axial compressive strain increases.
For what concerns the calibration of z, different approaches are available. Stafford Smith [33] made use of experimental results for diagonally loaded steel frames pointing out that the contact length is governed by the relative stiffness parameter ( λ ). More in detail, in his proposal, z is given by π / ( 2 λ )   and the column-infill and beam-infill contact lengths should be distinguished. To this end, the contact lengths Zc and Zb (for columns and beams respectively) are defined by means of λ ; Zc can be assessed through Equation (2), whereas Zb is assessed replacing EcIc with EbIb in Equation (2) (where EbIb is the flexural stiffness of the beam). Consequently, depending on the selected macro-modelling approach, the location of the off-diagonal struts varies between z/3 (for the two-strut model) and z/2 (for the three-strut model). Alternatively, according to Al-Chaar [47], the location of the off-diagonal struts may be assessed using two non-dimensional parameters Cd and Cod; the expressions in Equation (17) provide z c and z b , where the off-diagonal struts are positioned, from the beam-column joints:
z c = C d b w + C o d b w 2 cos ϑ ;   z b = C d b w + C o d b w 2 sin ϑ
where the non-dimensional parameters Cd and Cod are set equal to 0.50 and 0.25, respectively (which correspond to the portion of the horizontal stiffness assigned to each strut).

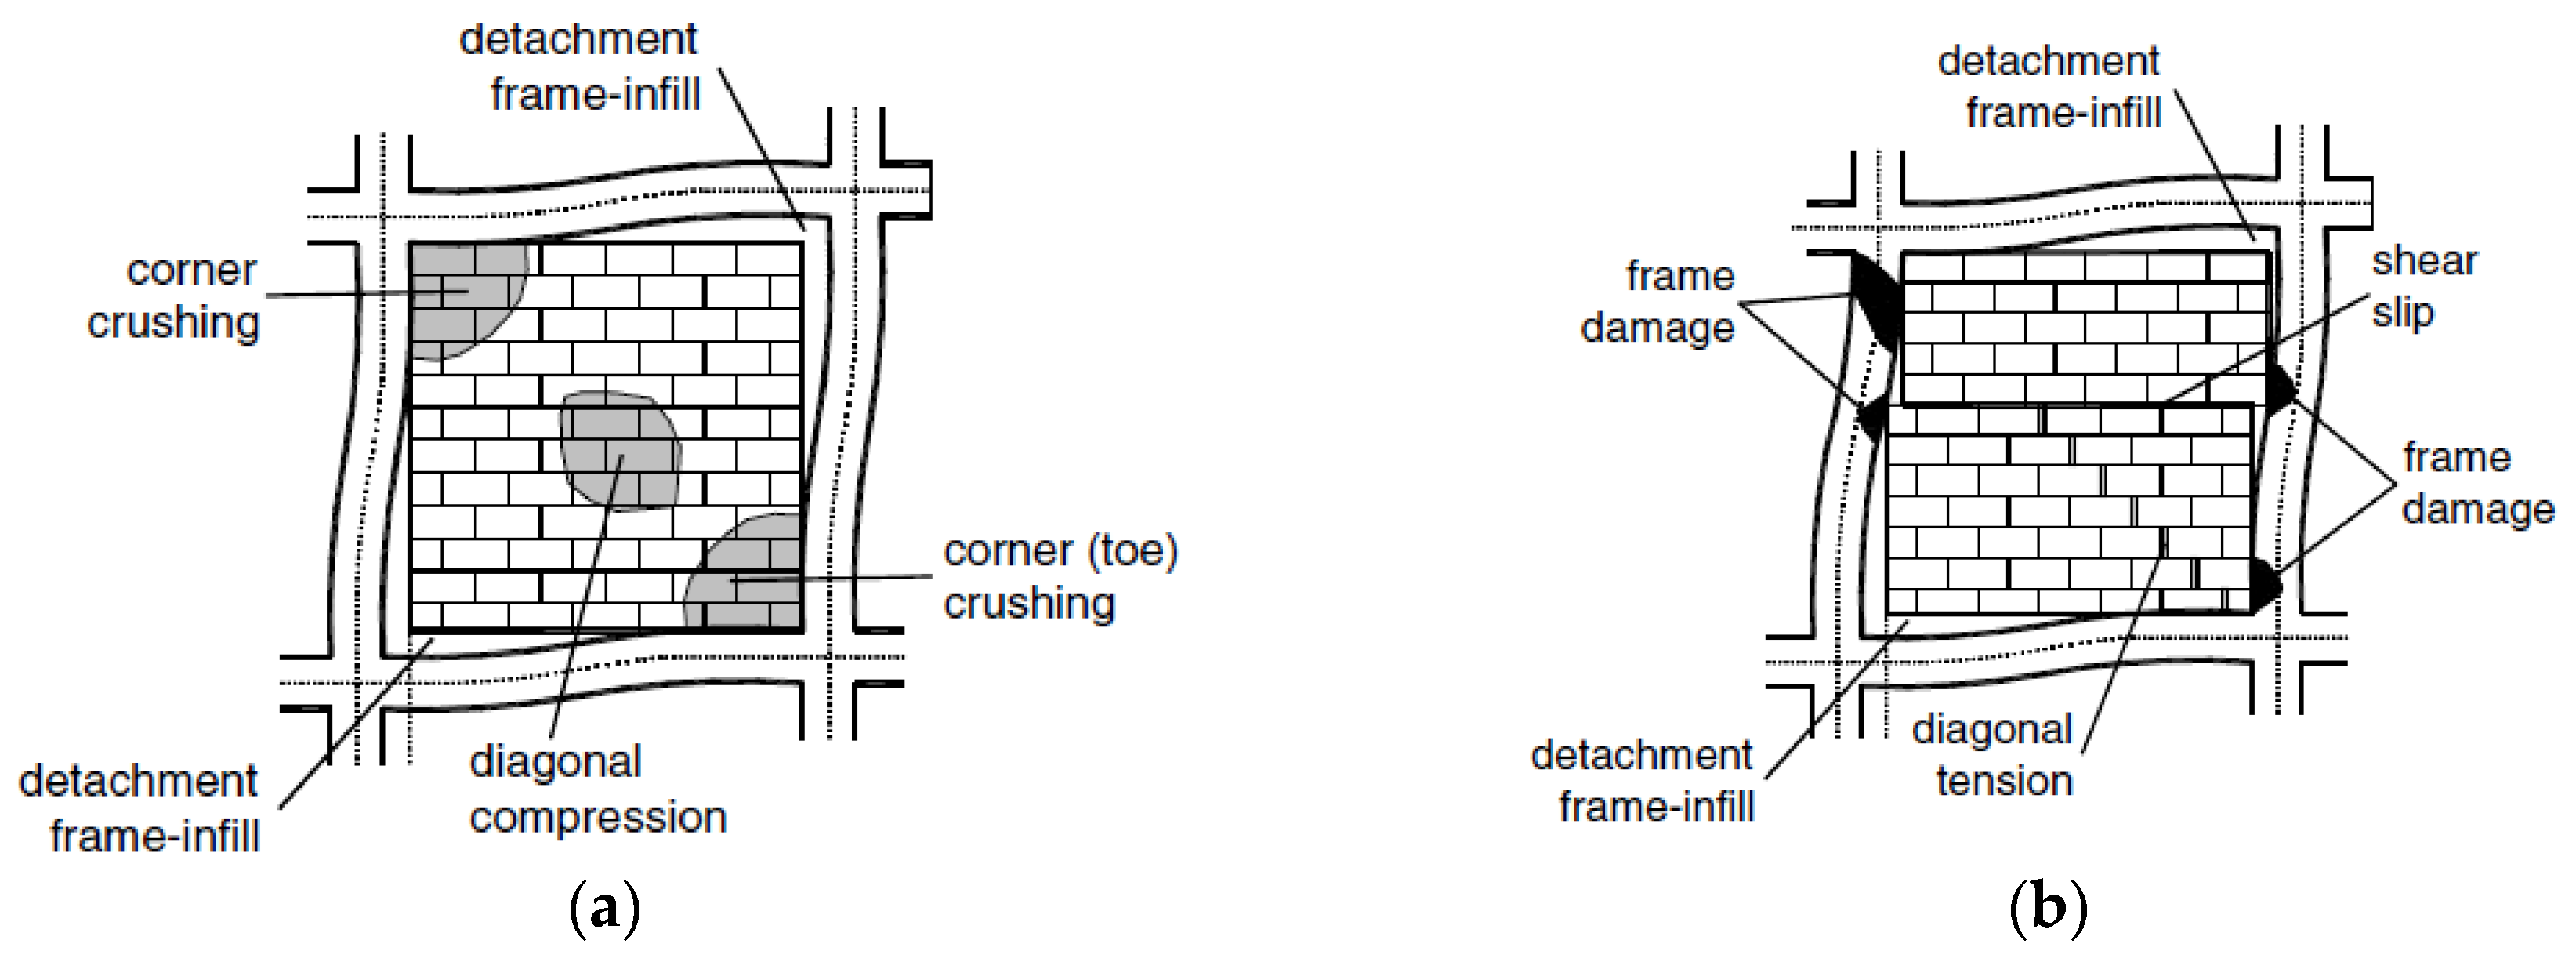
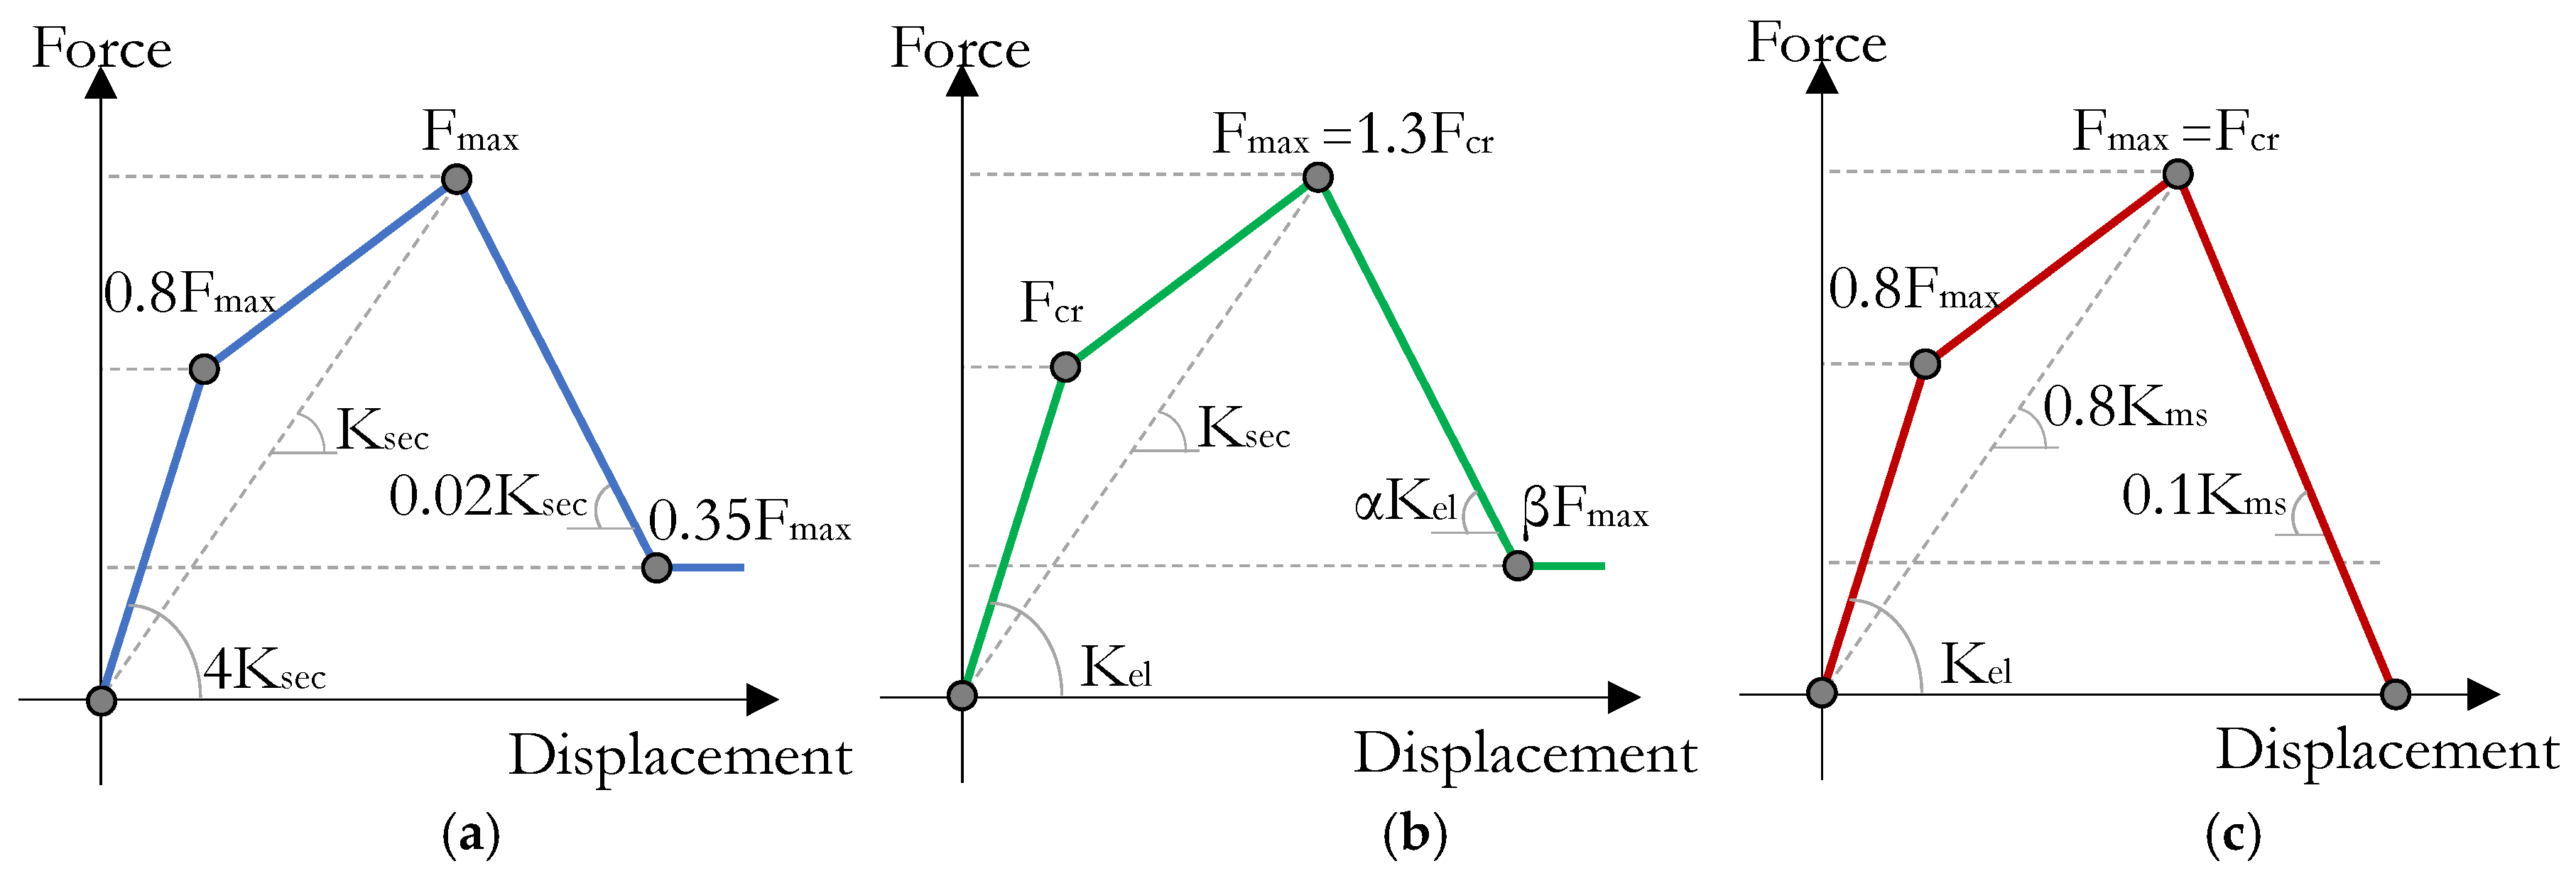
3.2. Failure Modes and Backbone Curves

When an infilled frame is subjected to an earthquake, different types of failure could occur and drive the response of the infill panel and RC elements. The onset and development of a given failure mode depends strongly on the material and geometrical properties of both infill panels and the surrounding frame, as well as on the manufacturing techniques and the type of stress state mobilised in the panel. This variability renders non-trivial to predict the likeliest failure modes. Thus, it is useful to recall the classification provided by Crisafulli [28] and Asteris et al. [17], who identified five main failure modes for a masonry infilled RC frame (Figure 3):
  • Surrounding frame: this failure mode is associated with the development of plastic hinges in the RC elements. The collapse mechanism could be due to flexure, shear, beam-column joint failure or high axial load. The location of flexural plastic hinges is strongly related to the features of the frame-infill systems and may occur (very rarely) in the beams and/or columns, where the maximum bending moment demand is reached. Shear failure in the columns is due to high shear stress in the contact length zones and depends on the amount of transverse reinforcement, concrete strength and efficiency of the concrete confinement. Especially in existing RC frames built according to old codes and prescriptions, the panel may cause wide diagonal cracks along the beam-columns joints and, consequently, their failure. Finally, even though it is very rare, due to concrete strength effect, an axial failure might take place as consequence of high axial load transmitted by a truss mechanism;
  • Shear sliding: this mode produces horizontal sliding failure through several bed joints; it is related to the aspect ratio of the masonry units and the infill panel, as well as the poor mechanical properties of the mortar in the bed joints. This failure mode is associated with a strong frame and weak mortar joints. The crack pattern starts a few courses beneath the upper loaded corner and continues along the diagonal direction until reaching the centre of the panel, where finally the cracks spread horizontally;
  • Corner crushing: this failure mode produces compression failure (due to a biaxial compression state) of the infill panels with crushing of the units near the beam-column joints; later on, it might produce out-of-plane (OOP) failure and eventually collapse. It normally occurs if the contact length is very or the contact length may be reduces increasing the lateral displacement and the infilled frame is characterized by weak infill panel, combined with strong columns/beams and weak joints;
  • Diagonal compression: it is another compression failure mode however, in contrast with the previous failure mode, the crushing of masonry units appears in the centre of the panel. This failure mode is due to the geometry of panel, that is, when the infill is slender, with a subsequent OOP failure;
  • Diagonal tension or cracking: this is related to the failure of the compressed diagonal strut, which consists of widespread cracking along the panel; as highlighted in El-Dakhakhni [15], this failure mode occurs when the RC frame is weak or is characterized by weak joints and strong elements, combined with a rather strong infill.
Many researchers developed infill strength models based on the available experimental results. Strength models allow to predict the maximum shear strength based on the failure mode observed during the tests. The most used strength models are listed in Table 2 [18,34,39,49,50].
Once the shear strength capacity of the infill panel is calculated, the equivalent strut’s hysteretic behaviour has to be defined. To this aim, different relationships are available in the literature to predict the backbone curve [14,18,19,51]. Generally, these relationships are trilinear or quadrilinear idealizations of the force-displacement envelopes. The idealized backbone curves should be able to reproduce all the phases observed during the progressive damage caused by horizontal loading: detachment between the infill and the surrounding frame, complete cracking of the panel and attainment of the maximum lateral load and degrading phase until zero or residual capacity.
Bertoldi et al. [18] proposed a simplified formulation to evaluate the infill behaviour by means of a quadrilinear backbone curve (Figure 4a).
In detail, the backbone is defined according to the expected failure mode, which defines the maximum force (Fmax), the cracking point (0.8Fmax), the residual strength (0.35 Fmax), the cracking-to-peak stiffness and the residual-to-peak strength stiffness, the latter being derived though the secant stiffness (−0.02Ksec). Both cracking-to-peak and softening-to-peak stiffness ratios are defined according to De Sortis et al. [52].
Panagiotakos and Fardis [19] (Figure 4b) proposed a quadrilinear backbone curve based on ten tests on infilled RC frames with horizontally hollow masonry bricks [53,54].
It is worth mentioning that diagonal cracking was the prominent failure mode of the infills tested during this experimental programme. The main parameters to be derived to calibrate this model are the cracking strength Fcr and the maximum shear strength Fmax. As opposed to the previous model, the first parameter depends on the actual cracking shear strength, whereas the second parameter is set as a function of Fcr ( F m a x = 1.3 F c r ). The elastic stiffness depends on the shear modulus of the panel and on the geometrical properties, whereas the secant-to-peak stiffness is derived according to Mainstone [36]. The degrading branch, up to the attainment of a residual strength, has a slope that depends on the elastic stiffness (Kdeg = αKel)α is in the range [0.005%, 0.1%] according to Reference [19]. Finally, the residual strength is defined by a multiplier of the maximum shear strength. The residual-to-maximum shear strength ratio β is suggested as 0.01–0.02. It is worth noting that this model relies on the definition of only two parameters, Gm and τcr, with significant benefits for what concerns its calibration; the former parameter is related to the modulus of elasticity (Em = 0.4Gm), whereas the latter can be obtained as 0.275 times the square root of the comprehensive strength of a masonry prism (fmv).
Recently, the formulations proposed by Bertoldi et al. [18] and Panagiotakos and Fardis [19] have been modified by Sassun et al. [51] and De Risi et al. [14]. In Sassun et al. [51] a modified Bertoldi’s backbone curve with prefixed values of drift capacity ϑ (or in terms of strain capacity ε [55]) is provided. The drift capacity ϑ, associated with different damage states, is based on experimental tests conducted in Europe, the Middle East and the United States on RC and steel frames (Table 2). In order to be representative of likely infill typologies, solid and hollow clay brick and concrete block infills were considered. The correlation between drift capacity ϑ and strain capacity ε is defined according to Hak et al. [55] who proposed Equation (18):
ϑ = d r h = L h ( 1 ε ) 2 [ 1 + ( L h ) 2 ] 1 ,
where dr is the lateral displacement at a given storey, L is the frame centreline span and h is the centreline storey height.
In contrast to the approach adopted by Sassun et al. [51]—and only once the reliability of the backbone models by Bertoldi et al. [18] and Panagiotakos and Fardis [19] were proved through more than 200 experimental tests collected from the literature—De Risi et al. [14] modified each of the parameters (Fcr, Fpeak, Kcr, Ksec and Kdeg) needed to define the Panagiotakos and Fardis backbone curve. This modification of the methodology proposed by Panagiotakos and Fardis [19] was made because the CoV values calculated in the comparison with the experimental tests were lower than those related to the model by Bertoldi et al. [18]. After a disaggregation of the collected data by considering horizontal holes bricks and tests with vertical holes bricks separately, De Risi et al. [14] pointed out that the CoV values are lower if the test results involving horizontally hollow bricks are compared with those provided by the Panagiotakos and Fardis backbone [19].
All the modified parameters needed to implement the methodology proposed by De Risi et al. [14] are listed in Table 2. De Risi et al. [14] indicated that the resulting backbone curve shows mean relative error lower than 3% for all the required parameters thus proving the model accurate.

4. Classification of Masonry Infills According to Test Data

The importance of masonry infills in the seismic performance assessment of RC buildings is demonstrated by the increasing number of experimental tests carried out over the last four decades. Most of the experimental data available in the literature has been collected from recent databases demonstrating the high variability associated with all the parameters characterizing the lateral response of masonry infilled RC frames [13,14,51].
Despite the staggeringly-high-level of uncertainty surrounding the masonry infill properties, constant mechanical and geometrical properties of the masonry infills are typically assumed in risk assessment studies both at single-building and regional scale. To deal with this issue and include infill-to-infill variability in a seismic risk assessment framework, however, results of in-situ tests on masonry infills are not available, to the authors’ best knowledge at least. Thus, only data reported in recent databases are at hand and could allow to classify the masonry infills in different typologies, as function of specific infill-related features, such as the in-plane stiffness, shear strength, vertical/horizontal compressive strength of the masonry, vertical/horizontal modulus of elasticity and thickness of the masonry, among others. This classification should help analysts in forging ahead and reducing the uncertainty in the numerical simulation problem. It is noteworthy that the approach of aggregation and classification the masonry infill properties is not a mere theoretical construct, since for unreinforced masonry structures and masonry infills something similar already exists; for instance, the material properties of different parameters for unreinforced masonry buildings and masonry infills are provided in References [56,57], according to specific features and based on in-situ tests. Preliminary attempts to provide a classification of the typologies of masonry infills were also done in the databases proposed by De Luca et al. [13] and De Risi et al. [14].
De Luca et al. [13] proposed a database referred to as MID, namely Masonry Infill Database, which consists of 114 tests; among them, 13 were tests on bare frames and 101 were tests for masonry-infilled systems. All tests were classified based on the specific features of the masonry infills and RC frames. The novelty of this database is that it provides damage data, a failure mode classification and a normalized piecewise multi-linear fit of all the tests for future analytical applications, which makes it a unique tool for analysts.
Within this context, in order to develop numerical models that can be considered representative of typical typologies of masonry infills adopted in Italy and other Mediterranean countries, a classification is proposed in this study, scrutinizing data reported in the available databases and presented by further experimental testing efforts. Nowadays, a common and unique philosophy on the masonry infills’ characterization does not exist and some parameters should be selected to undertake it. A macro-classification approach based on masonry infills strength is adopted herein since it was deemed the best approach to assume for analysing the seismic response of masonry-infilled RC building classes accounting for infill’s variability and involving entire building portfolios. Even if many other parameters, such as the relative stiffness between the panel and the surrounding frame, the vertical/horizontal compressive strength of the masonry, vertical/horizontal modulus of elasticity and thickness of the masonry could be selected as metrics for the masonry infills’ characterization. However, the latter parameters would make the generation of building portfolios and the interpretation of analysis results more complex and less effective/immediate.
The macro-classification approach used herein permits: (i) to include and elaborate on the uncertainty underlying the mechanical properties of the infills, which is often neglected in large-scale studies; (ii) to decouple beam-column joint failure or shear failure of non-ductile RC frame members; and (iii) to correlate analysis results with the modes of failure of the masonry infills, which in turn are generally correlated with the strength of each structural component of the infilled frames. Moreover, Mohammad et al. [58] pointed out that the infill characteristics (e.g., infill stiffness, maximum strength and displacement capacity) and the seismic masses have the greatest impact on the seismic response parameters. This macro-classification approach is also used in Hak et al. [55], in which three different increasing values of strength and stiffness of the infill panels were selected with the aim of defining infill damage control through the limitation of the inter-storey drift.
In order to select reference experimental tests useful for the validation of the numerical modelling presented in the following section, five masonry infill typologies have been identified in this study from data available in the literature. The adopted strength-based classification is reported in Table 3 along with the reference experimental study and the main features of the test specimens.
Although the main metric for masonry infills’ characterization is the strength, the selected specimens show a clear trend with respect to the stiffness, which increases with the strength; hence, it is possible to state that a strength- and stiffness-based macro-classification has been considered. The representativeness of the selected masonry infill typologies has been verified using the results provided in the database by De Risi et al. [14]. In this database, the Young’s modulus (Ew) of the masonry panels varies between 494 and 8140 MPa, the shear modulus (Gw) is in the range 130–2547 MPa, whereas the cracking (Fcr) and peak (Fpeak) loads are in the range of [5 kN, 270 kN] and [10 kN, 350 kN], respectively. Comparing these ranges with those of the five masonry infill typologies selected, it can be concluded that the latter are representative of the ranges of variation of the main mechanical properties evinced from the database, as can be gathered from Table 3.

5. Numerical Modelling Results and Validation with Experimental Data

Simulation of masonry-infilled RC frames requires advanced numerical modelling to accurately predict the interaction between the masonry panel and the surrounding frame, as well as all failure mechanisms that can occur both in the masonry panels and RC elements. In this section, the results of the numerical simulations, carried out to investigate the most reliable numerical modelling approach are presented. Firstly, the most accurate numerical modelling approach to simulate the response of the RC bare frames has been investigated and validated using test results. Then, the influence of the masonry infills has been investigated to validate the numerical modelling approach also for the masonry infilled RC frames. For the sake of brevity, only the numerical validations of masonry infill type 1 and type 4 (Table 3) are presented. The numerical modelling approach adopted for type 1 masonry infill can be also applied to types 2 and 3, while the approach adopted for the masonry infill type 4 can be adopted for infill type 5 as well. In addition to that, since the selected experimentally tested specimens were designed according to Eurocode 2 [59] and Eurocode 8 [50], the experimental test presented in Verderame et al. [7] was also selected to prove the reliability of the numerical modelling approach in case of RC frames designed for gravity loads according to Italian building code provisions in force during the 1970s–1990s. Finally, with the aim of simulating a structural configuration that features openings, an additional test presented in Morandi et al. [5], is considered in the numerical modelling validation, allowing to identify the best reduction coefficient, rp, in the case that the masonry infills present openings. This further test specimen belongs to the medium-strong masonry infill typology. The numerical modelling validations were carried out using the FE software OpenSees [60].

5.1. Bare Frames

The experimental tests carried out in the last years to investigate the seismic response of both existing and newly built RC buildings help clarifying the main features that a reliable numerical model should be able to take into account. The simulation of the seismic response of an existing RC structure requires more detailed numerical models with respect to the ones developed to simulate the response of seismically designed RC buildings. In fact, in an existing building, specific behavioural aspects should be simulated with great care: material and geometrical nonlinearity, rebar slippage, flexible beam-column joints, damage of non-ductile and poorly detailed RC frame members, shear failure due to deficiencies in stirrups spacing, lack of concrete core confinement, amongst others. In order to account for these phenomena, the numerical model approach developed by O’Reilly and Sullivan [61] has been adopted and modified so as to account for additional aspects. Several experimental tests available in the literature were used by O’Reilly and Sullivan [61] to calibrate the seismic response of each structural member, such as columns or beam-column joints. The original model proposed by O’Reilly [62] is based on a lumped plasticity approach that accounts for both flexural and shear behaviour. Beams and columns are modelled by using the BeamWithHinges [63] element object implemented in OpenSees [60], where the nonlinearity is lumped at the ends of the element and an aggregation section [64], V–γ and M–Ɵ, was introduced. Hence, the flexural behaviour is defined through the moment-curvature relationships proposed in [62], whereas the shear behaviour was modelled according to Zimos et al. [64], in which the backbone shear deformation curve consists of four phases, namely initial elastic behaviour, post-cracking, peak response and strength degradation. The behaviour of poorly detailed beam-column joints is another issue of paramount importance in the seismic response assessment, as highlighted by past earthquakes [65] and experimental tests [66,67,68,69]. In the adopted numerical modelling approach, this aspect was considered by means of rigid links in the joint and a central rotation spring, which represents the shear joint behaviour; its hysteretic behaviour was calibrated according to different experimental tests [66,67,68,69].
Given that the model is meant to later incorporate the strut elements simulating the presence of the masonry infills, both columns and beams are subdivided in three model elements per each (Figure 5).
This modelling approach follows the indications provided by Chrysostomou et al. [29], which account for the possible inaccuracy in the distribution of shear and moment in the surrounding frame in case of single strut modelling of infill panel.
The experimental tests of RC bare frames carried out by Calvi and Bolognini [4], Morandi et al. [5] and Verderame et al. [7] are selected in this study to validate the adopted numerical modelling approach for the bare frame configuration. Some details about the tested specimens and the results of the numerical validation are briefly discussed below.
The experimental tests performed by Calvi and Bolognini [4] are considered as a benchmark in the modelling validation. The single-storey, single-bay frame specimens were designed as the lowest part of a four-storey building, according to Eurocode 2 [59] and Eurocode 8 [50]. These specimens were full-scale ones with total span length and storey height equal to 4.8 m and 3.0 m, respectively.
The structural elements were built using concrete with characteristic strength equal to 25MPa and steel rebars with yielding strength equal to 500 MPa. The longitudinal reinforcement consists in eleven (7 bottom + 4 upper) and eight (4 bottom + 4 upper) 16 mm diameter rebars in beam ends and central region, respectively. Eight 22 mm diameter rebars were provided in the columns. The columns had 8 mm diameter stirrups with spacing of 18 cm and 8 cm in central and end regions, respectively. The transverse reinforcement of beams consisted in 8 mm diameter stirrups spaced of 13 cm and 6 cm at mid-span and end regions, respectively. Figure 6 reports the comparison between the in-plane static cyclic response recorded during the experimental test and the numerical prediction.
The numerical model is able to predict reasonably well the experimental results and the hinging mechanisms, which were forced to form in the beam. The stiffness and strength predicted by the numerical model, in the positive loading direction, is in accordance with the experimental evidence, while the lateral capacity in the negative direction is slightly underestimated. Nevertheless, the model is considered adequate to reproduce the cyclic behaviour of this frame typology.
Verderame et al. [7] tested four 1:2 scale specimens, two of which were designed only for gravity loads, according to Italian code provisions in force during the 1970–1990s, while the other two were designed for seismic loads. The total span length and storey height were equal to 2.30 m and 1.60 m, respectively, for both specimen typologies. The gravity-load-designed (GLD) specimens were designed to be representative of the bottom storey of a five-storey RC existing building. The longitudinal reinforcement consisted of 8 mm and 10 mm diameter rebars for columns and beam, respectively; 6 mm diameter stirrups spaced at 15 cm were used as transverse reinforcement. Both longitudinal and transverse reinforcement were anchored with 90-degree hooks. Figure 7a,b shows the results of the in-plane static cyclic test and the numerical ones; in this case, two different assumptions were considered for the modelling of beam-column joints, namely rigid joints and flexible joints with inelastic shear deformation.
Since the GLD specimen was designed to be representative of an RC existing building, the hysteretic behaviour of the RC joints is calibrated according O’Reilly [62] and Pampanin et al. [66]. Modelling the beam-column joints through rotational springs, which represent their shear behaviour, produces a reduction of both elastic stiffness and global load capacity. The flexibility associated with the beam-column joints allowed quite an accurate prediction of the cyclic behaviour of the bare frame, thereby confirming the importance of adequately calibrating the shear response of beam-column joints (Figure 7b). The achievement of the maximum shear capacity in the beam-column joints leads to the failure of the specimen. Considering the beam-column joints as rigid, which is common for buildings designed for seismic loads, yields an overestimated global capacity of the specimen and denotes that both stiffness and strength degradation are not adequately reproduced, as reported in Figure 7a. The test was terminated after the attainment of ±5.30% lateral drift, when significant shear sliding appeared along the diagonal cracks occurred in the joints (already formed at almost 1% drift, mixed with flexural cracking in the columns), as confirmed by vertical displacement in columns with propensity to a potential imminent joint axial failure.
As regards the seismic-load-designed (SLD) specimens, it can be inferred that six (3 bottom +3 top) 10 mm diameter rebars were provided in the beam and eight 12 mm rebars in columns were used to reinforce the columns.
Also, 6 mm diameter stirrups spaced at 10 cm and 5 cm in the central and end regions were considered for both columns and beam and the transverse reinforcement was anchored with 135-degree hooks. In contrast to the poorly detailed beam-column joints of the GLD specimens, the transverse reinforcement in these beam-column joints consisted of 6 mm diameter stirrups spaced at 5 cm.
The numerical modelling approach adopted to reproduce this experimental campaign is the same as that previously adopted, even if the beam-column joints are modelled by means of rigid links without shear springs. The model is able to predict the elastic stiffness of the specimen, as well as the maximum lateral force. As can be seen in Figure 8, the hysteretic behaviour of the experimental test is reproduced quite well, which confirms the effectiveness of the adopted numerical modelling approach. At ±5.30% drift, a significant crack was observed at a beam-joint interface, thus bringing the test to a halt.
Finally, the bare frame tested by Morandi et al. [5] was also simulated. The specimen was designed according to the following European code provisions: EC8-Part 1 [50], EC1-Part 1-1 [70] and EC2-Part 1-1 [59].
On the other hand, the Italian building code (NTC08) [71] was used for what concerns the definition of the selected design spectra, assuming high ductility class (DCH). The clear span and height of the test specimen were 4.22 m and 2.95 m, respectively, whereas the structural elements were made up of concrete with characteristic compressive strength equal to 35MPa and reinforcing steel yield strength of 450MPa. The cross section of the columns was 35 × 35 cm2 and eight (3 bottom + 2 middle + 3 top) 22 mm diameter rebars were provided as longitudinal reinforcement. The transverse reinforcement, consisting of 8 mm diameter bars spaced at 9 cm, was uniformly distributed. Also, the beam had a 35 × 35 cm2 cross section, in which eight (4 bottom + 4 upper) 14 mm and two 10 mm (in the middle) longitudinal rebars were located. Moreover, 8 mm diameter stirrups spaced at 20 cm and 7 cm were lodged in the central and end regions, respectively.
The numerical modelling approach predicted quite well the results of the in-plane quasi static test, as can be seen in Figure 9.
Both stiffness and strength are accurately reproduced. It worth mentioning that the joints featured good detailing, in line with Eurocode recommendations and for this reason the beam-column joints were modelled by means of rigid links without rotational springs. Such assumption underlying the results presented in Figure 9 is in accordance with the experimental observations for the selected specimen, which showed no beam-column joint failure or damage.

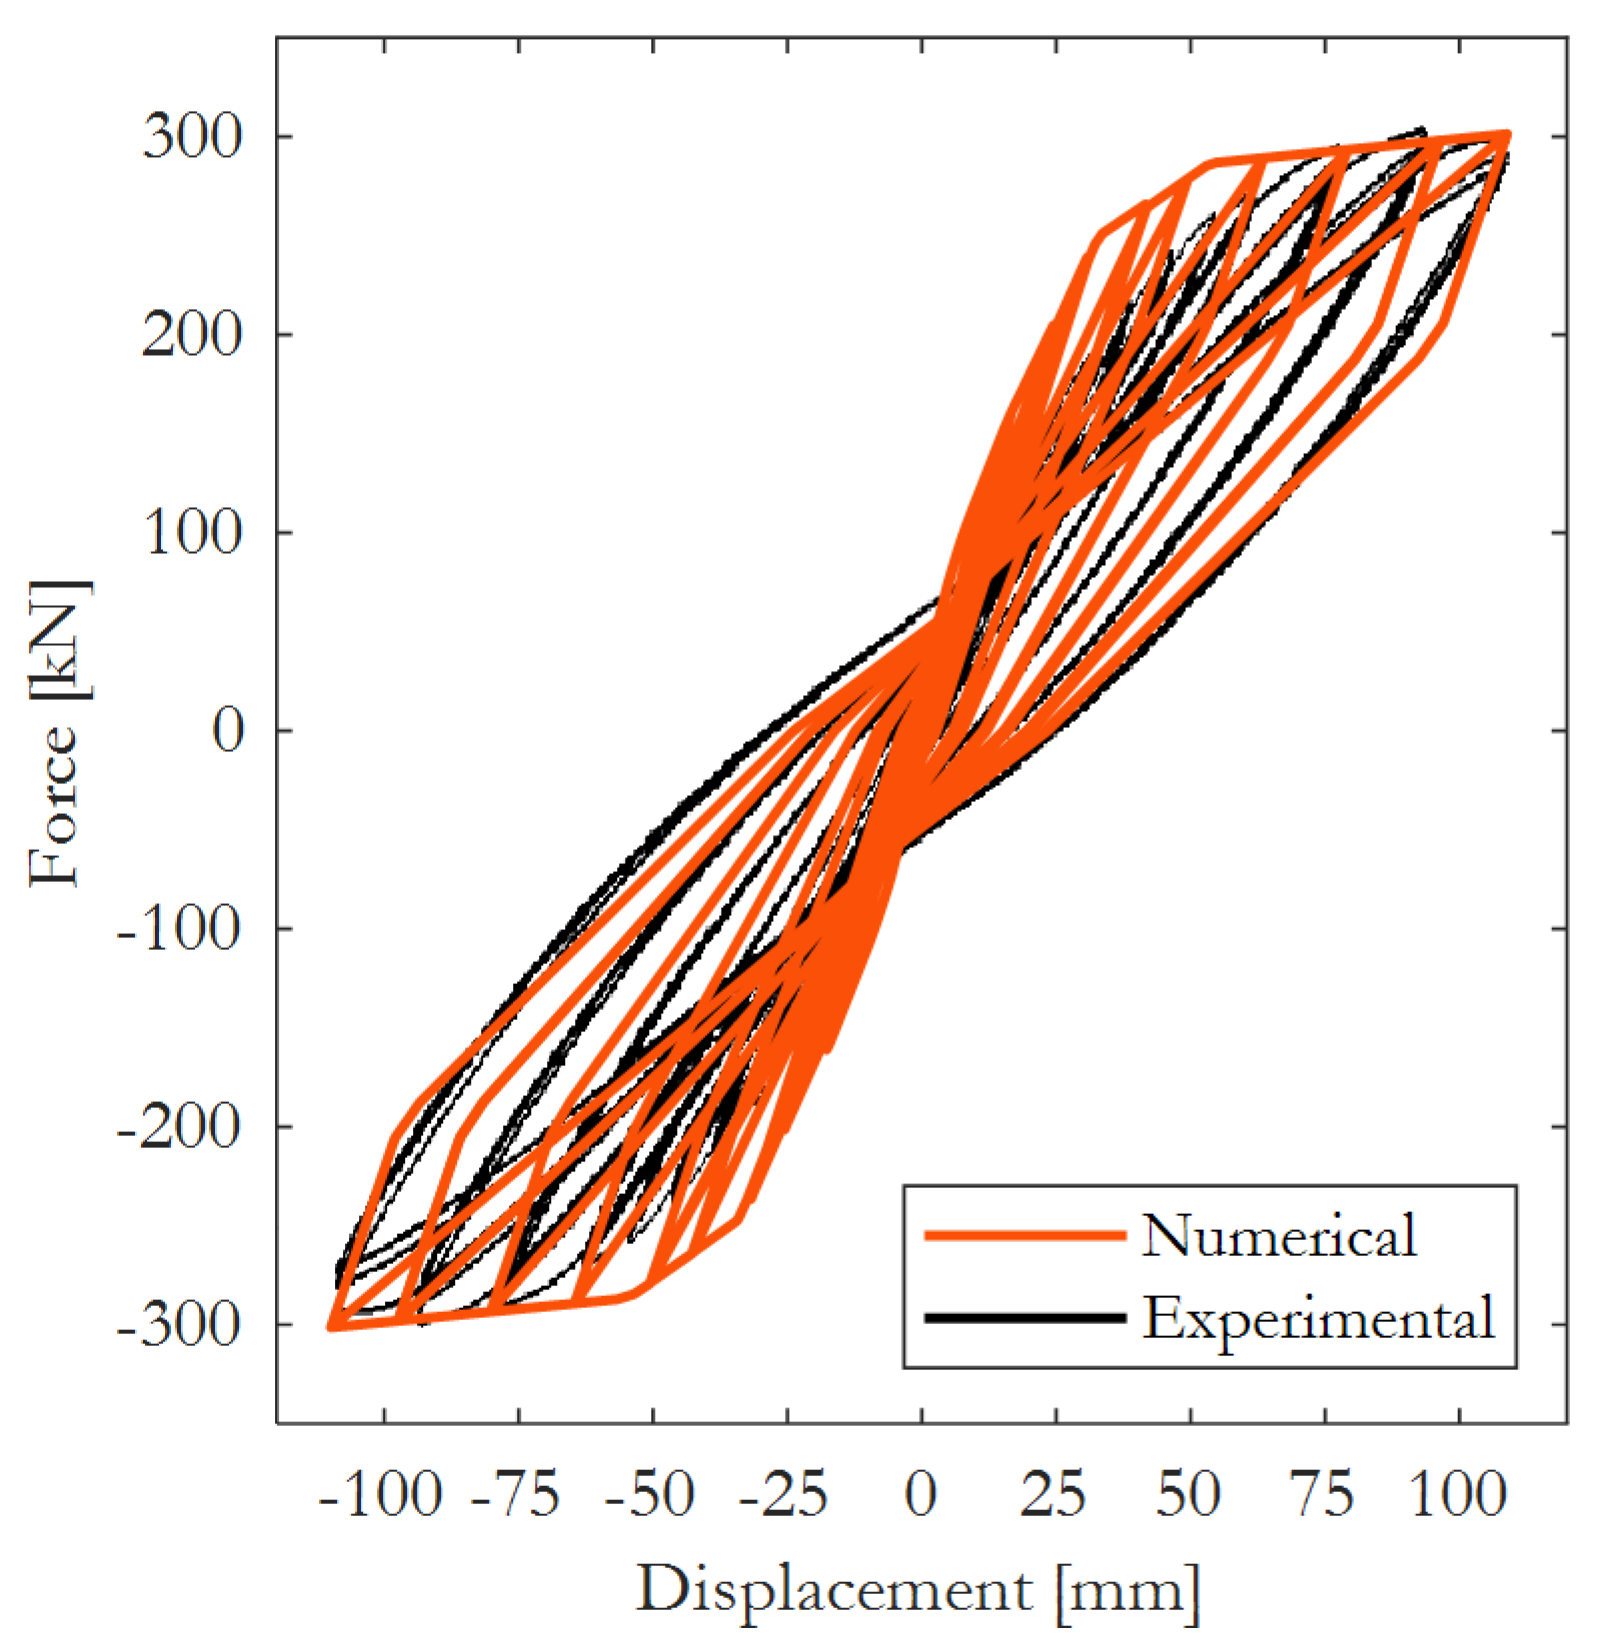
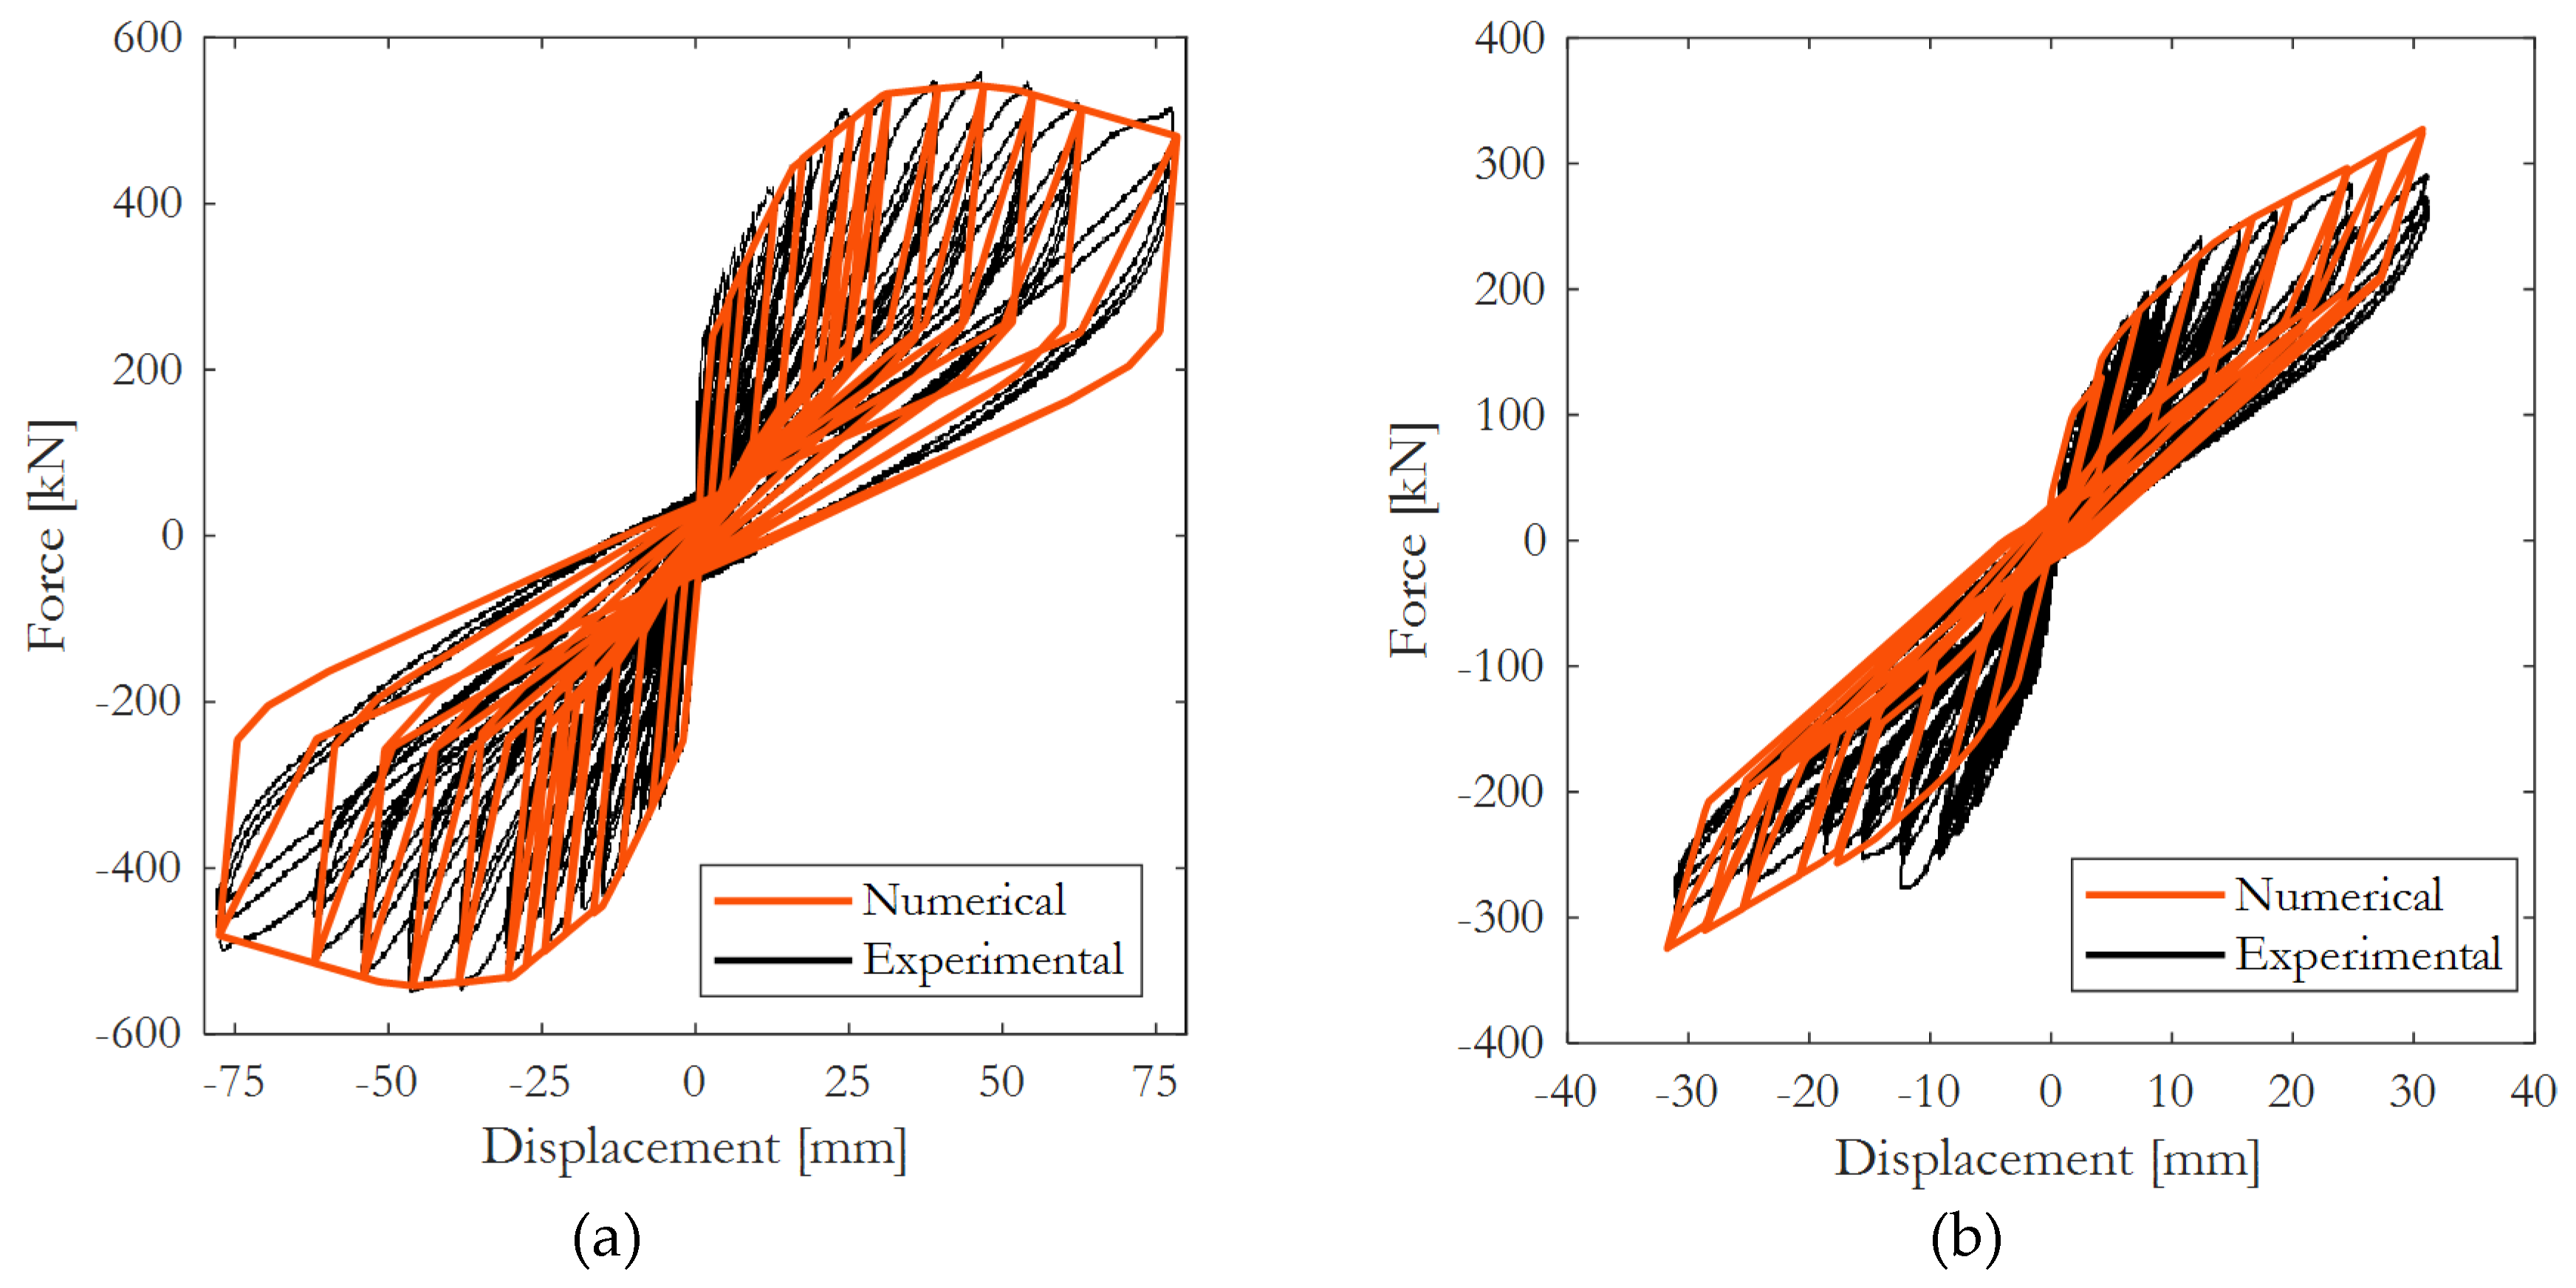
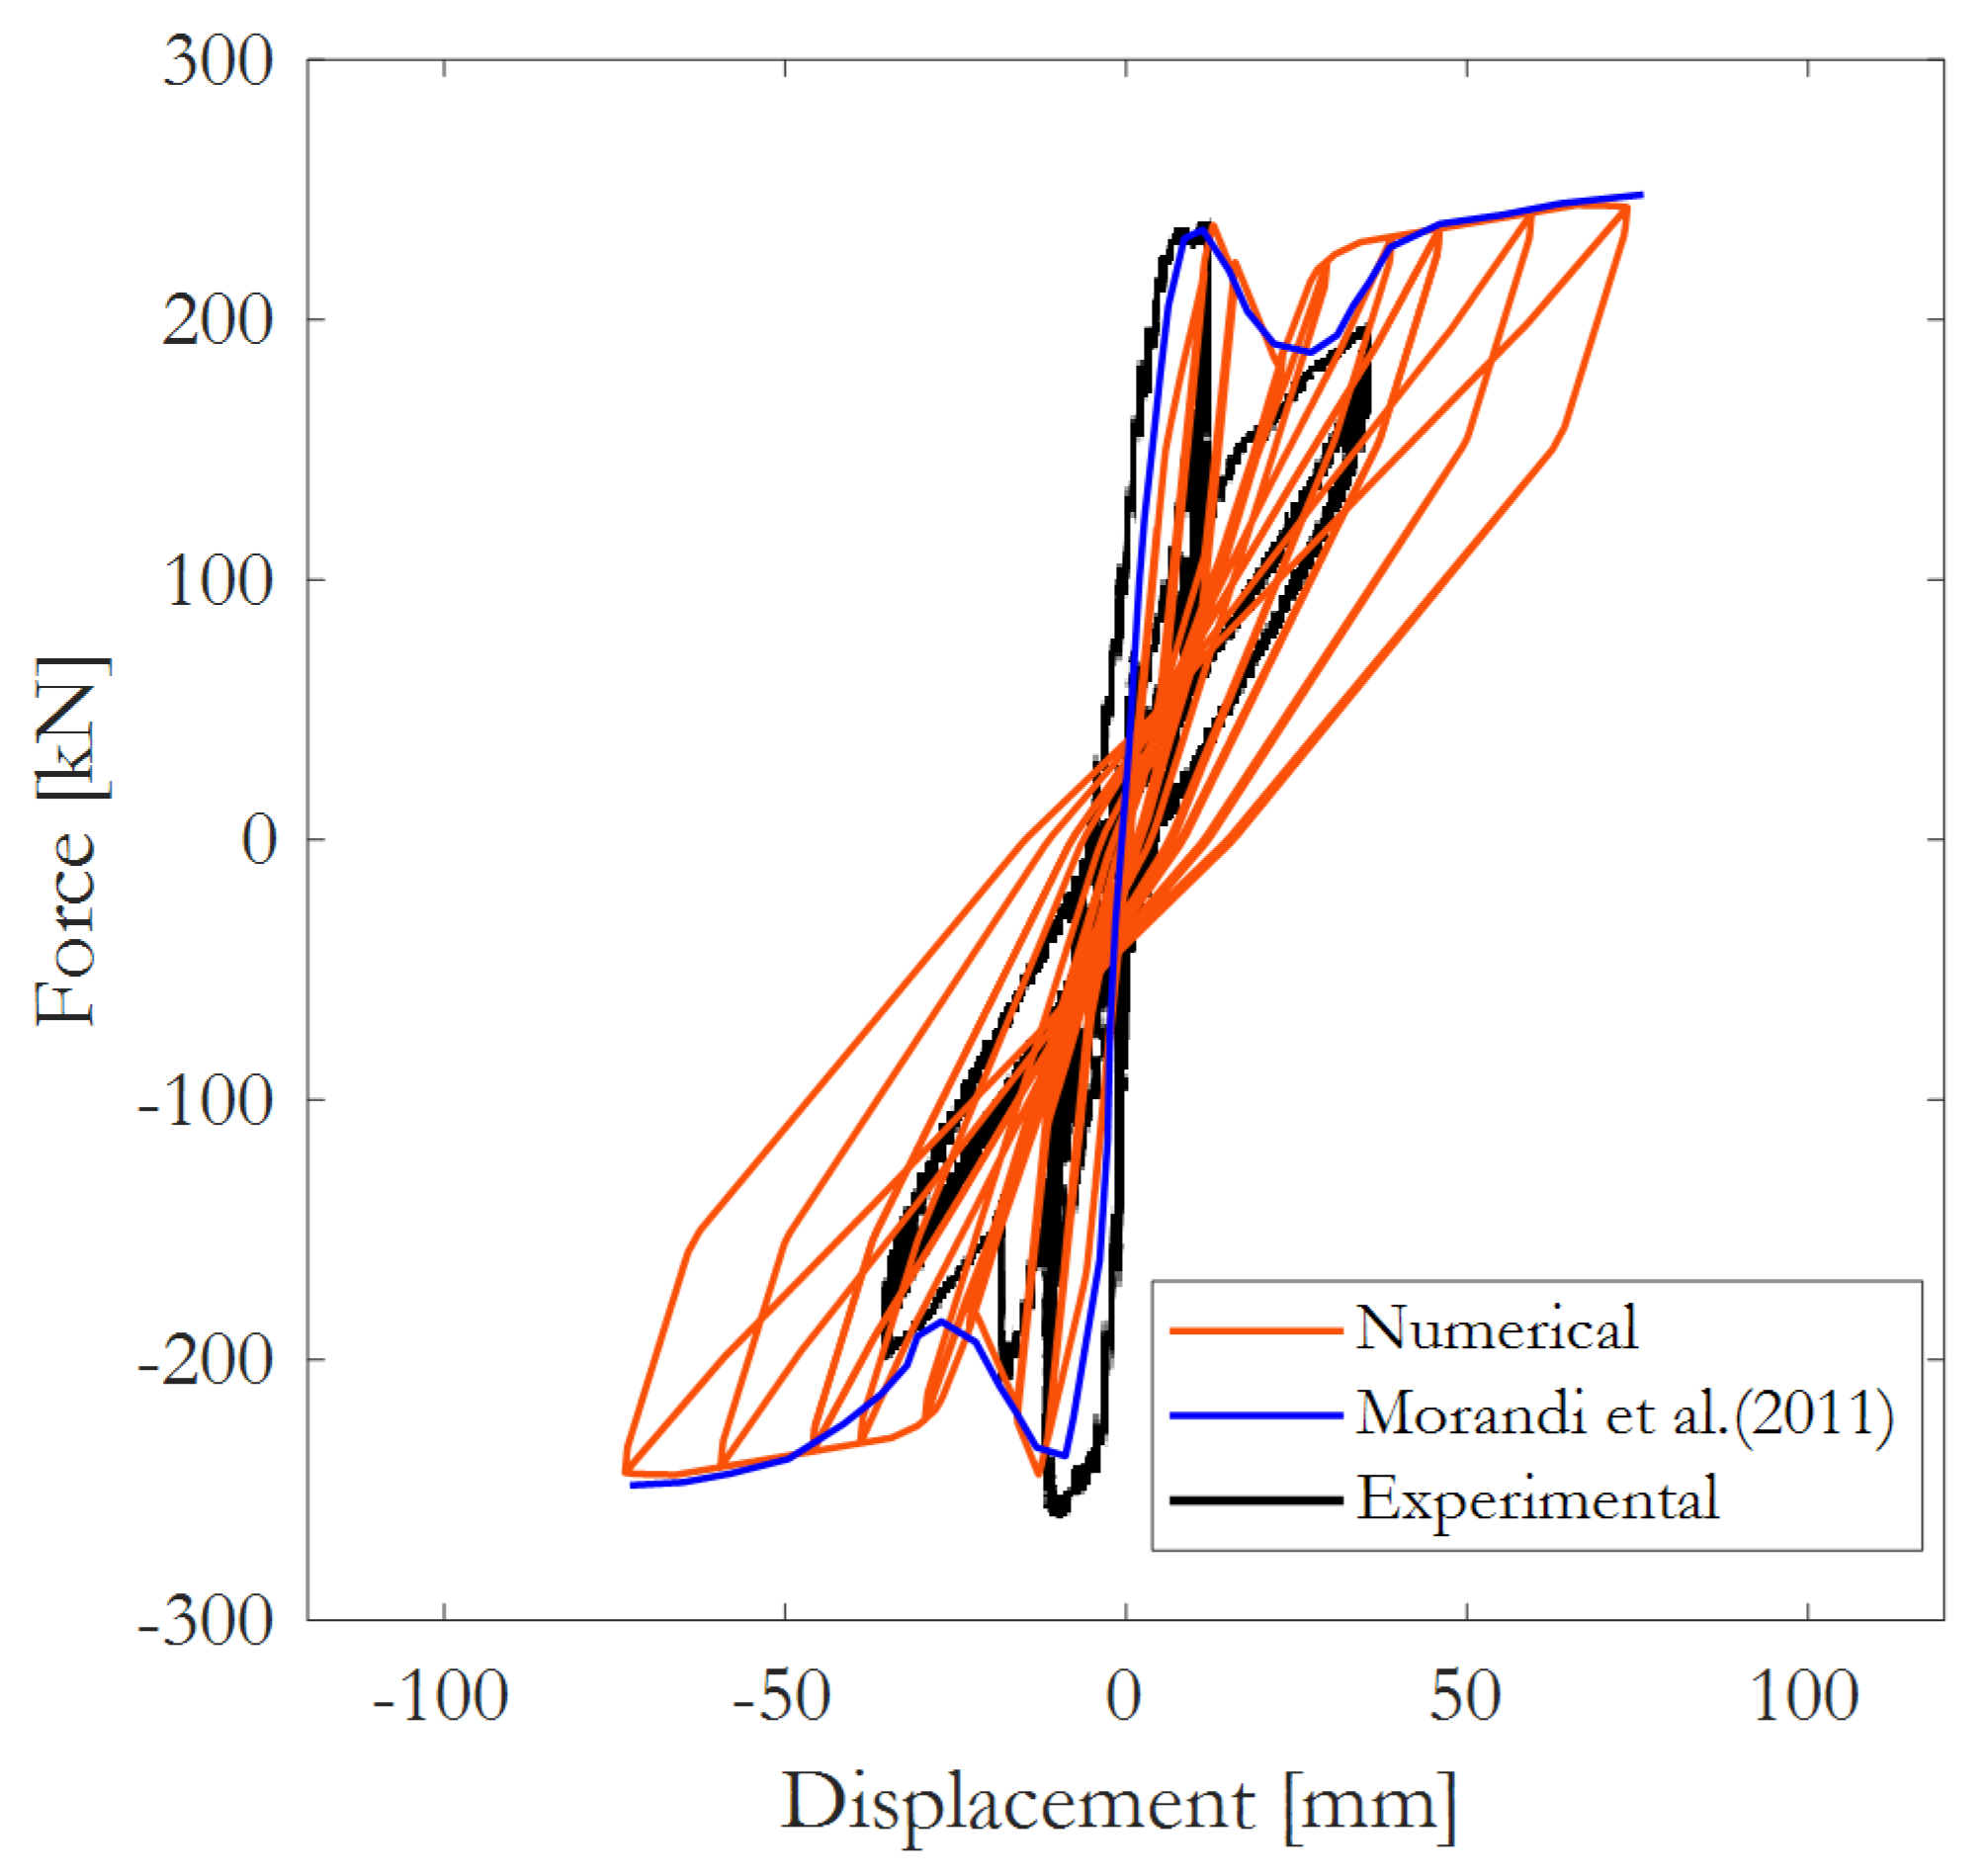
5.2. Masonry-Infilled Frames

Masonry infills were modelled by using a six-equivalent-strut model, which consists of modelling the panel through three diagonal, compression-only nonlinear truss elements, for each direction, according to the methodology proposed by Chrysostomou et al. [29]. The uniaxial nonlinear Pinching4 Material model object available in OpenSees [64] has been adopted to simulate the hysteretic behaviour of the masonry infills, following the rules described in what follows. The contact length (z) is estimated according to Stafford Smith [33]. All the parameters defining the equivalent strut’s hysteretic behaviour were not selected a priori but rather calibrated considering the specific features of each masonry infill typology defined in Table 3. An extensive parametric study was carried out to define the most appropriate formulations to represent the experimental response and all the formulations presented in Table 2 and Table 3 were investigated and combined to define the best set of parameters for each masonry infill typology. In addition to the analytical models listed in Table 2 and Table 3, the assumption of reducing the initial shear strength (cohesion) fv0 to one-half is also assessed, which complies with the recommendations provided in EC6 [49]. For the sake of brevity, only the numerical validation for weak and strong masonry infill typologies are presented in Figure 10 and Figure 11 in terms of cyclic load-displacement curves. For completeness, Table 4 reports—for each masonry infill typology—the formulations that provide the best fit with the experimental results.
In particular, the formulations for each input/response item required to define the hysteretic behaviour of the equivalent strut models are provided in Table 4.
The medium-strong masonry infill type tested by Morandi et al. [5], herein referred to as type 4, is selected and consists in an ordinary single-leaf masonry infill with thickness of 35 cm. It is made up of vertically hollowed lightweight tongue and groove clay block units. Regarding the damage pattern emerged from testing, it can be inferred that, at 1.75% drift, most of the masonry blocks in the top course and some blocks in the lower central part were strongly damaged, while the infill was substantially destroyed at approximately 2.50% drift; only a shear crack in the upper part of a column was found to occur at 0.8% drift but it remained stable until the end of the test. The results of the parametric analysis pointed out that the formulation proposed by Mainstone [36] provides the best results for the prediction of the strut width; this formulation is also adopted in FEMA 306 [34]. The expression proposed by Paulay and Priestley [39], modified by halving the initial shear strength (cohesion) fv0—according to the analytical and experimental results presented in Morandi et al. [5]—provides the best estimation of the lateral strength. Finally, the relationships proposed by Bertoldi et al. [18] were selected to calculate all the points defining the backbone curve. A comparison of experimental and numerical results is provided in Figure 10a.
The defined numerical model predicts quite well the stiffness and strength in both elastic and nonlinear regimes of the response; also, the softening branch is in good agreement with the experimental results. Further details regarding the approach employed to identify the best formulations for each of the main parameters needed as input to the strut’s hysteretic behaviour are presented in Section 6.
In Figure 10b the comparison is plotted between the numerical prediction and the experimental results, for the medium-strong masonry infill typology including the presence of opening, which are of the same height of the panel, in this case. To simulate the results of this experimental test, the same modelling strategy of the test without opening is used but with a reduction coefficient, rp, to account for the opening. This reduction coefficient is applied to both strength and stiffness. The formulation selected to evaluate rp is the one proposed by Decanini et al. [46], since the parametric analysis shows it to be in very good agreement with the experimental response. Nonetheless also the reduction coefficient rp proposed by Imai and Miyamot [42], Tasnimi and Mohebkah [43] and Dawe and Seah [45] provided good results. Compared to the fully-infilled configuration, the match between the numerical prediction and the experimental results is slightly worse, confirming that the presence of openings leads to high variability and modelling issues. Moreover, in this particular case, an additional challenging is introduced by the opening size and the force-displacement curves that shown an unsymmetrical behaviour, although almost the same values of force were achieved for both loading directions. In spite of these issues, the modelling approach provides results in good agreement with the experimental ones: the strength is very well predicted, the stiffness in the positive loading direction is captured, whilst the stiffness in the negative direction of loading is slightly underestimated. After a diagonal crack formed at 0.4–0.5% drift in the left and right panel, a stepwise crack pattern developed starting from the bottom left corner and reaching up to mid-height of the right panel at 0.6% drift. At the end of the test (1% drift), the diagonal crack on the left panel widened further (this panel was already more damaged than the right one), while the failure mechanism was not completely formed in the right pane.
The weak masonry infill type 1, corresponding to that tested by Calvi and Bolognini [4], consists in a single leaf infill made up of horizontally hollowed brick with a 1.0 cm thick plaster on each external side and thickness equal to 8.0 cm. The results of the parametric analysis pointed out that the analytical model proposed by Bertoldi et al. [18] provides the best estimation both in terms of lateral strength and strut width. In this case, the formulations presented in Table 3 did not provide adequate results. Hence, the a priori fixed values of drift capacity ϑ proposed by Sassun et al. [51], to which correspond the strains εi to be assigned to the struts, have been modified with respect to the ones reported in Table 3. In particular, εm (peak response) and εu (collapse) are set equal to 0.0012 and 0.044, respectively. The values of the strains εi to be assigned at the struts are in good agreement with Morandi et al. [72], who considered the same specimen as benchmark test for numerical validation purposes. For this reason, in addition to the numerical results obtained in this study, the numerical validation proposed by Morandi et al. [72] is presented in Figure 11.
As far as the experimental force-displacement response and the failure mechanisms are concerned, it appears very clear how a weak masonry infill does not result in important damage to the surrounding frame; once the masonry infill collapsed with an abrupt loss of shear capacity, the system response is completely controlled by the bare frame, which has the capability to withstand an increment of lateral force. The numerical model is able to reproduce such lateral response by considering prefixed values of strains εi. Moreover, the numerical results of this study are in good agreement with those provided in Morandi et al. [72], although the macro-modelling of the infill panel and RC elements are different.
The same process just described for the weak and medium-strong infill types was undertaken for each experimental test of interest and the best numerical models are reported in Table 4, whereas the corresponding force-displacement response curves are depicted in Figure 12.
These force-displacement response curves are derived assuming L = 4.0 m and h = 3.0 m, where L is the frame centreline span and h is the centreline storey height; beam and column cross sections are 300 × 300 mm, the modulus of elasticity of concrete (Ec) is 2500 MPa and the material properties of the masonry infills are listed in Table 3.

6. Discussion and Influence of Modelling Assumptions

In order to further investigate the influence of the modelling assumptions on lateral load-carrying capacity and inelastic response of infilled frame systems, the results of the previously presented parametric analysis (meant to identify the numerical models) are discussed more in detail, here focusing on the role played by the uncertainties surrounding the modelling of masonry infill.
As previously discussed, the three main parameters for the definition of the equivalent strut hysteretic behaviour are: (i) the formulation to define the backbone curve; (ii) the relationships to calculate the width of the equivalent strut; and (iii) the failure mechanism of the infill. Figure 13a provides insight on the variability of the backbone curve for the medium-strong masonry infill typology, when varying the relationship to calculate the width of the strut (from Table 1) and the failure mechanism (Table 2). In particular, for what concerns the backbone curve modelling, the formulation by Bertoldi et al. [18] has been selected for this illustrative example, given that it provided the best correlation with the experimental results for that specific masonry infill typology (type 4, Table 4).
Figure 13a also presents the mean (μ) and mean ± standard deviation (μ ±   σ ), along with the backbone curve that most accurately reproduces the experimental behaviour. It is also worth noting that if the backbone curve would have been modelled according to the formulation proposed by Panagiotakos and Fardis [19] or the modified Panagiotakos and Fardis proposed by De Risi et al. [14], the dispersion would still be significant. This happens even if the models assume that the maximum strength (Fmax) of the backbone curve be derived using the cracking stress (τcr) of the masonry (measured in a diagonal compression test), rather than with one of the relationships proposed in Table 2. Although the backbone curves proposed by Panagiotakos and Fardis [19] and De Risi et al. [14] are based on very few parameters, the obtained response is still affected by high dispersion, caused by the effect of the cracking stress, which can be estimated through a series of vertical compression tests or through the expression 0.275 f m v proposed by Jeon et al. [73]; in both cases, the dispersion surrounding the material properties is generally high.
Using the backbone curves presented in Figure 13a, monotonic static pushover analyses are carried out to evaluate the force-displacement capacity curve of the medium-strong masonry infill typology (Figure 13b). The variability associated with the definition of the backbone curve induces significant modelling uncertainties, demonstrating the importance of an accurate definition of the formulation to be used for the development of the numerical models. When comparing the capacity curves obtained from the numerical modelling with the experimental results, it is possible to state that an incorrect definition of the masonry infill model may lead to unrealistic results in the lateral load response.
With the aim of selecting the most suitable numerical models, a disaggregation of the parametric results is presented in Figure 14.
In each subplot, the variability in the load-displacement capacity curve due to the variation in the formulation adopted to evaluate the width of the strut, for any given formulation to evaluate the maximum strength, is plotted. This representation allows to better understand the impact of the strut width and of the strength model on the global response. The formulation adopted to evaluate the width of the equivalent strut does not induce a strong variation in the capacity curves, although it is evident how this parameter introduces additional numerical modelling uncertainties. More specifically, the observed variation ranges between 10% and 25%. By further analysing the results, it is possible to observe that, with the exception of the models proposed by Mainstone [36] and Stafford Smith [33], all the formulations proposed to evaluate the width of the equivalent strut provide similar results. Conversely, the selection of the strength model has a strong impact on the capacity curve, leading to a variation of the maximum base shear capacity of almost 59%, the maximum base shear being in the range [360 kN, 880 kN]. To define the best numerical modelling approach, the ratio between the experimental and numerical lateral load capacities was calculated over the imposed displacement range (Figure 15b).
The five modelling approaches that best reproduce the experimental results are plotted in Figure 15a, in terms of force-displacement response curve and are listed in Table 5.
Table 5 also reports the mean and standard deviation evaluated over the entire displacement range. Model-3 and model-5 provide a very good match in terms of elastic stiffness, although once the nonlinear behaviour is reached large differences emerge with respect to the experimental test results. The mean of the experimental-to-numerical resistance ratio is 0.86 and 0.93 for model-3 and model-5, respectively, thus that associated with the latter model is closer to unity. Nonetheless, even model-3 predicts quite well the maximum base shear. In the elastic range, the numerical results of model-1, model-2 and model-4 underestimate the elastic stiffness of the infilled specimen, showing a more flexible behaviour in comparison with the experimental results. In the nonlinear range these models provide a response similar to the experimental one with a better estimation of the maximum base shear, which is almost identical to the experimentally observed one. Finally, an additional comparison involving cyclic static push-pull analysis is presented in Figure 15c, in which the numerical results for model-3 and model-4 are compared with the results of the in-plane pseudostatic cyclic test undertaken by Morandi et al. [5]. As already pointed out, model-3 overestimates the lateral capacity and the stiffness in the elastic range with respect to model-4, thus causing more damage to the surrounding frame. This consideration is confirmed by a steeper softening after the maximum peak capacity is achieved. By contrast, even though model-4 slightly underestimates the elastic stiffness, as well as the secant stiffness for small deformation testing stages, its overall hysteretic behaviour is in good agreement with the experimental ones and the model shows significant accuracy both for medium and large deformations. Hence, the struts’ hysteretic behaviour set according to the strut width by Mainstone [36] and the strength model by Bertoldi et al. [18], that is, model-4, is deemed to be the best approach in reproducing the experimental response of the medium-strong masonry infill typology identified in Section 4.

7. Conclusions

This study deals with the numerical modelling of the response of masonry-infilled RC frames, stressing model validation needs, with the support of available experimental test results. Although many efforts have been made in the last years to better understand the behaviour of masonry infill panels when subjected to earthquakes and their interaction with the surrounding RC frame, issues on both modelling and corresponding uncertainties are still open and some of them are treated in this study. As discussed herein, the definition of the backbone curve, as well as of other input parameters such as the strut width, the reduction coefficient for openings and the failure mode model should be selected and calibrated with great care, paying significant attention to material and geometric properties of the masonry panel-frame system of interest, so as to reproduce the in-plane behaviour of any given masonry-infilled RC frame typology. Moreover, the significant variability related to the material properties, infill panel thickness, presence of openings and manufacturing techniques is examined and available data is scrutinized.
A macro-level classification that relies upon the masonry infill maximum shear strength criterion is proposed in order to categorise with sufficient accuracy and representativeness the main masonry infill typologies used in RC residential buildings in Italy, deemed to be relevant to other Mediterranean countries as well. To this end, five masonry infilled specimens are taken from experimental testing efforts available in the literature and the representativeness of these specimens and corresponding typologies has been verified using a recent database that covers the very wide range of shear strength levels that may be detected from in-situ material characterisation tests on RC residential buildings. The approach of aggregation and classification is meant to be the same as that for unreinforced masonry structures, for which a taxonomy based on specific features and in-situ test results was developed and implemented in some codes and standards. Since no in-situ test on infill panels are available so far, the macro-level distinction presented herein might be a useful tool in the assessment of infilled existing buildings, at single and regional scale, as the current codes require to account for the masonry infill interaction with the surrounding frame but none of them specify what properties have to be considered. Also, no in-situ tests on masonry infills are prescribed nowadays.
In the second part of this study, the numerical model is adequately validated by reproducing the experimental in-plane cyclic response of RC bare frame prototypes for existing and new, seismically-designed buildings. Subsequently, different experimental tests are used as benchmark to demonstrate the feasibility and accuracy of the employed macro-modelling approach for masonry-infilled frame systems. The numerical results present a very good agreement with the experimental data and test observations, once the modelling approaches with the strongest correlation with experimental results are identified. In effect, for the remaining alternative approaches, the differences with respect to the observed experimental response were significant.
Following the assessment of the effectiveness of the numerical models, the effect of variability and uncertainties surrounding the masonry infills is investigated and propagated involving the following numerical model parameters: the strut width, the reduction coefficient to account for the presence of openings, the failure mechanism model and the formulation to define the backbone curve. To do so, the analysis framework takes into account: (i) nine formulations to define the width of the struts; (ii) five equations to consider the presence of openings in the infill panel; (iii) four strength models to evaluate the failure mechanism; and (iv) four relationships to define the simplified force-displacement behaviour of the masonry infill panel. In particular, for a given masonry infill typology and backbone curve, the validated numerical modelling is integrated with different combinations of strut width formulation and failure mechanism model and a series of pushover analyses are carried out. Again, the results of parametric pushover simulations underlined the high variability in the response, even when these input/model parameters are set according to the most used relationships provided in the literature. These numerical results actually confirm that an a priori selection of the numerical modelling should be avoided and that the response variability is not only related to material and geometric properties of the infills but also to the formulations needed to characterise their hysteretic behaviour. Indeed, the latter has to be carefully selected, as demonstrated by the scatter surrounding the pushover curves with respect to the experimental data.
In addition to a macro-level, strength-based distinction of masonry infills, the research outcomes and methodology presented herein have allowed to identify the best model and relationships to be used in the numerical modelling and/or in performance assessment exercises both at single and regional scale for each of the considered masonry infill typologies. These outcomes support analysts in selecting beforehand what models could be more representative of the actual inelastic response of the multiple selected masonry infill typologies.

Author Contributions

Conceptualization, R.M., D.P., E.B. and G.M.; methodology, R.M., D.P., E.B. and G.M.; software, G.M.; validation, G.M., D.P., E.B. and R.M.; formal analysis, G.M.; investigation, G.M., D.P., E.B. and R.M.; resources, G.M.; data curation, G.M., D.P., E.B. and R.M.; writing—original draft preparation, G.M.; writing—review and editing, D.P., E.B. and R.M.; visualization, G.M., D.P., E.B. and R.M.; supervision, D.P., E.B. and R.M.; project administration, R.M.; funding acquisition, R.M. All authors have read and agreed to the published version of the manuscript.

Funding

This research was funded by the Italian Ministry of Education, University and Research, grant Dipartimenti di Eccellenza and by the ReLUIS consortium, grant ReLUIS/DPC 2019-2021.

Conflicts of Interest

The authors declare no conflict of interest.

References

  1. Manfredi, G.; Prota, A.; Verderame, G.M.; De Luca, F.; Ricci, P. Emilia earthquake, Italy: Reinforced concrete buildings response. Bull. Earthq. Eng. 2014, 12, 2275–2298. [Google Scholar] [CrossRef] [Green Version]
  2. Cardone, D.; Perrone, G. Damage and Loss Estimation of Pre-70 Reinforced Concrete Frame Buildings with FEMA P-58: A Case Study. J. Earthq. Eng. 2016, 21, 23–61. [Google Scholar] [CrossRef]
  3. El-Dakhakhni, W.W.; Hamid, A.A.; Hakam, Z.H.R.; Elgaaly, M. Hazard mitigation and strengthening of unreinforced masonry walls using composites. Compos. Struct. 2006, 73, 458–477. [Google Scholar] [CrossRef]
  4. Calvi, G.M.; Bolognini, D. Seismic response of RC frames infilled with weakly reinforced masonry panels. J. Earthq. Eng. 2001, 5, 153–185. [Google Scholar] [CrossRef]
  5. Morandi, P.; Hak, S.; Magenes, G. Performance-based interpretation of in-plane cyclic tests on RC frames with strong masonry infills. Eng. Struct. 2018, 156, 503–521. [Google Scholar] [CrossRef]
  6. Cavaleri, L.; Di Trapani, F. Cyclic response of masonry infilled RC frames: Experimental results and simplified modeling. Soil Dyn. Earthq. Eng. 2014, 65, 224–242. [Google Scholar] [CrossRef]
  7. Verderame, G.M.; Ricci, P.; Del Gaudio, C.; De Risi, M.T. Experimental tests on masonry infilled gravity- and seismic-load designed RC frames. In Proceedings of the 16th International Brick and Block Masonry Conference—IB2MAC, Padova, Italy, 26–30 June 2016. [Google Scholar]
  8. Ricci, P.; Di Domenico, M.; Verderame, G.M. Experimental assessment of the in-plane/out-of-plane interaction in unreinforced masonry infill walls. Eng. Struct. 2018, 173, 960–978. [Google Scholar] [CrossRef]
  9. Hak, S.; Morandi, P.; Magenes, G. Out-of-plane experimental response of strong masonry infills. In Proceedings of the Advances in Civil Engineering 17 Proceedings of the Presented at the Second European Conference on Earthquake Engineering and Seismology—2ECEES, Istanbul, Turkey, 25–29 August 2014. [Google Scholar]
  10. Akhoundi, F.; Vasconcelos, G.; Lourenço, P.; Silva, B. Out-of-plane response of masonry infilled RC frames: Effect of workamnship and opening. In Proceedings of the 16th International Brick and Block Masonry Conference—IB2MAC, Padova, Italy, 26–30 June 2016. [Google Scholar]
  11. Furtado, A.; Rodrigues, H.; Arˆede, A.; Varum, H. Effect of the panel width support and columns axial load on the infill masonry walls out-of-plane behavior. J. Earth. Eng. 2018, 24, 653–681. [Google Scholar] [CrossRef]
  12. Ricci, P.; Di Domenico, M.; Verderame, G.M. Experimental investigation of the influence of slenderness ratio and of the in-plane/out-of-plane interaction on the out-of plane strength of URM infill walls. Constr. Build. Mater. 2018, 191, 507–522. [Google Scholar] [CrossRef]
  13. De Luca, F.; Morciano, E.; Perrone, D.; Aiello, M.A. MID1.0: Masonry Infilled RC Frame Experimental Database. In Proceedings of the Italian Concrete Days, Rome, Italy, 27–28 October 2016; Lecture Notes in Civil Engineering. Springer: Cham, Switzerland, 2016; Volume 10. [Google Scholar]
  14. De Risi, M.T.; Del Gaudio, C.; Ricci, P.; Verderame, G.M. In-plane behaviour and damage assessment of masonry infills with hollow clay bricks in RC frames. Eng. Struct. 2018, 168, 257–275. [Google Scholar] [CrossRef]
  15. Crisafulli, F.J.; Carr, A.J.; Park, R. Analytical modelling of infilled frame structures—A general review. Bull. N. Z. Soc. Earthq. Eng. 2000, 33, 30–47. [Google Scholar]
  16. Asteris, P.G. Finite Element Micro-Modeling of Infilled Frames. Elect. J. Struct. Eng. 2008, 8, 1–11. [Google Scholar]
  17. Asteris, P.G.; Cotsovos, D.M.; Chrysostomou, C.Z.; Mohebkhah, A.; Al-Chaar, G.K. Mathematical micromodeling of infilled frames: State of the art. Eng. Struct. 2013, 56, 1905–1921. [Google Scholar] [CrossRef]
  18. Bertoldi, S.H.; Decanini, L.D.; Gavarini, C. Telai tamponati soggetti ad azioni sismiche, un modello semplificato: Confronto sperimentale e numerico. In Proceedings of the 6 Convegno Nazionale L’ingegneria sismica in Italia, Perugia, Italy, 13–15 October 1993. [Google Scholar]
  19. Panagiotakos, T.B.; Fardis, M.N. Seismic response of infilled RC frames structures. In Proceedings of the 11th World Conference on Earthquake Engineering, Acapulco, Mexico, 23–28 June 1996. [Google Scholar]
  20. Mucedero, G.; Perrone, D.; Monteiro, R. Nonlinear static characterisation of masonry-infilled RC building portfolios accounting for variability of infill properties. Bull. Earth. Eng. (under review).
  21. Rivero, C.E.; Walker, W.H. An analytical study of the interaction of frames and infill masonry walls. In Proceedings of the 11th World Conference on Earthquake Engineering, San Francisco, CA, USA, 21–28 July 1984. [Google Scholar]
  22. Mehrabi, A.; Shing, P.B. Finite Element Modeling of Masonry-Infilled RC Frames. ASCE J. Struct. Eng. 1997, 123, 604–613. [Google Scholar] [CrossRef]
  23. Lotfi, H.R.; Shing, P.B. Interface model applied to fracture of masonry structures. ASCE J. Struct. Eng. 1994, 120, 63–80. [Google Scholar] [CrossRef]
  24. Lourenço, P.B. Computational Strategies for Masonry Structures. Ph.D. Thesis, Delft University, Delft, The Netherlands, 1996. [Google Scholar]
  25. Al-Chaar, G.L.; Mehrabi, A. Constitutive Models for Nonlinear Finite Element Analysis of Masonry Prisms and Infill Walls, No. ERDC/CERL-TR-08-19; Engineer Research and Development Center, Construction Engineering Research Lab: Champaign, IL, USA, 2008. [Google Scholar]
  26. Holmes, M. Steel frames with brickwork and concrete filling. In Proceedings of the Institution of Civil Engineers, London, UK, August 1961; Volume 19, pp. 473–478. Available online: https://www.icevirtuallibrary.com/doi/abs/10.1680/iicep.1961.11305?journalCode=jpric (accessed on 12 October 2020).
  27. Furtado, A.; Rodrigues, H.; Arêde, A.; Varum, H. Simplified macro-model for infill masonry walls considering the out-of-plane behaviour. Earth. Eng. Struct. Dyn. 2015, 45, 507–524. [Google Scholar] [CrossRef]
  28. Crisafulli, F.J. Seismic Behaviour of Reinforced Concrete Structures with Masonry Infills. Ph.D. Thesis, University of Canterbury, Christchurch, New Zealand, 1997. [Google Scholar]
  29. Chrysostomou, C.Z.; Gergely, P.; Abel, J.F. A six-strut model for nonlinear dynamic analysis of steel infilled frames. Int. J. Struct. Stab. Dyn. 2002, 2, 335–353. [Google Scholar] [CrossRef]
  30. El-Dakhakhni, W.W.; Elgaaly, M.; Hamid, A.A. Three-strut model for concrete masonry infilled steel frames. J. Struct. Eng. 2003, 129, 177–185. [Google Scholar] [CrossRef]
  31. Polyakov, S.V. Masonry in Framed Buildings (An Investigation into the Strength and Stiffness of Masonry Infilling); Translated from the Russian by Cairns, G.L., Moscow, 1956; National Lending Library for Science and Technology: Boston Spa, Yorkshire, 1963. [Google Scholar]
  32. Kligner, R.E.; Bertero, V.V. Eartquake Resistance of Infilled Frames. Reinforced Concrete Structures Subjected to Wind and Eartquakes Forces. Am. Concr. Inst. 1980, 63, 1–25. [Google Scholar]
  33. Stafford Smith, B. Behaviour of square infilled frames. ASCE J. Struct. Div. 1966, 92, 381–403. [Google Scholar]
  34. FEMA 306. Evaluation of Earthquake Damaged Concrete and Masonry Wall Buildings—Basic Procedures Manual; Federal Emergency Management Agency: Washington, DC, USA, 1998.
  35. Leuchars, J.M.; Scrivener, J.C. Masonry Infill Panels Subjected to Cyclic In-Plane Loading. In Proceedings of the South Pacific Regional Earthquake Engineering Conference, Wellington, New Zealand, 13–15 May 1975. [Google Scholar]
  36. Mainstone, R.J. Supplementary Note on the Stiffnesses and Strengths of Infilled Frames; Building Research Establishment, Building Research Station: Watford, UK, 1974. [Google Scholar]
  37. Liauw, T.C.; Kwan, K. Nonlinear behaviour of non-integral infilled frames. Comput. Struct. 1984, 18, 551–560. [Google Scholar]
  38. Decanini, L.D.; Fantin, G.E. Modelos Simplificados de la Mamposteria Incluida en Porticos. Caractreisticas de Rigidez y Resistencia Lateral en Estrado Limite (in spanish). J. Argent. Ing. Estruct. 1987, 2, 817–836. [Google Scholar]
  39. Paulay, T.; Priestley, M.J. Seismic Design of Reinforced Concrete and Masonry Buildings; John Wiley & Sons: New York, NY, USA, 1992. [Google Scholar]
  40. Papia, M.; Cavaleri, L.; Fossetti, M. Infilled frames: Developments in the evaluation of the stiffening effect of infills. Struct. Eng. Mech. 2003, 16, 675–693. [Google Scholar] [CrossRef]
  41. Benjamin, J.E.; Williams, H.A. The behaviour of one story brick shear walls. ASCE J. Struct. Div. 1958, 84, 1–30. [Google Scholar]
  42. Imai, H.; Miyamoto, M. Seismic behavior of reinforced masonry walls with small opening. In Proceedings of the 5 Jornadas Chilenas de Sismología e Ingeniería Antisísmica, Santiago, Chile, 7–11 August 1989; Volume 2, pp. 965–973. [Google Scholar]
  43. Tasnimi, A.A.; Mohebkhah, A. Investigation on the behavior of brick-infilled steel frames with openings, experimental and analytical approaches. Eng. Struct. 2011, 33, 968–980. [Google Scholar] [CrossRef]
  44. Asteris, P.G. Lateral stiffness of brick masonry infilled plane frames. ASCE J. Struct. Eng. 2003, 129, 1071–1079. [Google Scholar] [CrossRef] [Green Version]
  45. Dawe, J.L.; Seah, C.K. Lateral load resistance of masonry panels in flexible steel frames. In Proceedings of the 8th International Brick and Block Masonry Conference, Dublin, Ireland, 19–21 September 1988; Elsevier Applied Science: London, UK, 1988; Volume 2, pp. 606–616. [Google Scholar]
  46. Decanini, L.D.; Liberatore, L.; Mollaioli, F. Strength and stiffness reduction factors for infilled frames with openings. Earthq. Eng. Eng. Vib. 2014, 13, 437–454. [Google Scholar] [CrossRef]
  47. Al-Chaar, G. Evaluating Strength and Stiffness of Unreinforced Masonry Infill Structures. Rep. No. ERDC/CERL TR-02-1; U.S. Army Corps of Engineers: Champaign, IL, USA, 2002. [Google Scholar]
  48. Asteris, P.G.; Antoniou, S.T.; Sophianopoulos, D.S.; Chrysostomou, C.Z. Mathematical macromodeling of infilled frames: State of the art. J. Struct. Eng 2011, 137, 1508–1517. [Google Scholar] [CrossRef]
  49. CEN Eurocode 6 EN 1996-1-1. Design of Masonry Structures, Part 1—1. Common Rules for Reinforced and Unreinforced Masonry Structures; European Committee for Standardisation: Brussels, Belgium, 2004. [Google Scholar]
  50. CEN Eurocode 8 EN 1998-1. Design of Structures for Earthquake Resistance, Part 1. General Rules, Seismic Actions and Rules for Buildings; European Committee for Standardisation: Brussels, Belgium, 2004. [Google Scholar]
  51. Sassun, K.; Sullivan, T.J.; Morandi, P.; Cardone, D. Characterising the In-Plane Seismic Performance of Infill Masonry. Bull. N. Z. Soc. Earthq. Eng. 2015, 49, 98–115. [Google Scholar] [CrossRef]
  52. De Sortis, A.; Bazzurro, P.; Mollaioli, F.; Bruno, S. Influenza delle tamponature sul rischio sismico degli edifici in calcestruzzo armato. In Proceedings of the ANIDIS Conference L’ingegneria Sismica in Italia, Pisa, Italy, 10–14 June 2007. (In Italian). [Google Scholar]
  53. Pires, F.; Carvalho, E.C. The behaviour of infilled reinforced concrete frames under horizontal cyclic loading. In Proceedings of the 10th World Conference on Earthquake Engineering, Madrid, Spain, 9–24 July 1992. [Google Scholar]
  54. Stylianides, K.C. Cyclic Behaviour of Infilled R/C Frames. Brick and Block Masonry (8th IBMAC); Elsevier Applied Science: London, UK, 1988; Volume 2, pp. 792–799. [Google Scholar]
  55. Hak, S.; Morandi, P.; Magenes, G.; Sullivan, T. Damage control for clay masonry infills in the design of RC frame structures. J. Earth. Eng. 2012, 16, 1–35. [Google Scholar] [CrossRef]
  56. Ministero delle Infrastrutture e dei Trasporti. Circolare n.7 C.S.LL.PP 21 January 2019 “Istruzioni per L’applicazione dell’Aggiornamento delle Norme Tecniche per le Costruzioni di cui al Decreto Ministeriale 17 gennaio 2018”; Ministero delle Infrastrutture e dei Trasporti: Rome, Italy, 2018. (In Italian)
  57. NPR 9998:2017. Assessment of Structural Safety of Buildings in Case of Erection, Reconstruction and Disapproval—Basic Rules for Seismic Actions: Induced Earthquakes; Nederlands Normalisatie Instituut: Delft, The Netherlands, 2017. [Google Scholar]
  58. Mohammad, A.F.; Faggella, M.; Gigliotti, R.; Spacone, E. Probabilistic seismic response sensitivity of nonlinear frame bending-shear and infill model parameters for an existing infilled reinforced concrete structure. In Proceedings of the Twelfth International Conference on Computational Structures Technology, Naples, Italy, 2–5 September 2014; Topping, B.H.V., Iványi, P., Eds.; Civil-Comp Press: Stirlingshire, UK, 2014. [Google Scholar]
  59. CEN Eurocode 2 EN 1992-1-1. Design of Concrete Structures, Part 1—1 General Rules and Rules for Buildings; ECS: Brussels, Belgium, 2004. [Google Scholar]
  60. McKenna, F.; Fenves, G.L.; Scott, M.H. Open System for Earthquake Engineering Simulation; University of California: Berkeley, CA, USA, 2000; Available online: http://opensees.berkeley.edu (accessed on 13 October 2020).
  61. O’Reilly, G.J.; Sullivan, T.J. Modeling techniques for the seismic assessment of the existing Italian RC Frame Structures. J. Earth. Eng. 2017, 23, 1262–1296. [Google Scholar] [CrossRef]
  62. O’Reilly, G.J. Performance-Based Seismic Assessment and Retrofit of Existing RC Frame Buildings in Italy. Ph.D. Thesis, IUSS, Pavia, Italy, 2016. [Google Scholar]
  63. Scott, M.H.; Fenves, G.L. Plastic hinge integration methods for force-based beam–column elements. ASCE J. Struct. Eng. 2006, 132, 244–252. [Google Scholar] [CrossRef]
  64. Zimos, D.K.; Mergos, P.E.; Kappos, A.J. Shear hysteresis model for reinforced concrete elements including the post-peak range. In Proceedings of the 5th Thematic Conference on Computational Methods in Structural Dynamics and Earthquake Engineering, Crete Island, Greece, 25–27 May 2015. [Google Scholar]
  65. Bosi, A.; Marazzi, F.; Pinto, A.; Tsionis, G. The L’Aquila (Italy) Earthquake of 6 April 2009: Report and Analysis from a Field Mission; EUR—Scientific and Technical Research Reports; Publications Office of the European Union: Luxembourg, 2011. [Google Scholar]
  66. Pampanin, S.; Magenes, G.; Carr, A. Modelling of shear hinge mechanism in poorly detailed RC beam column joints. In Proceedings of the FIB Symp. Concrete Structures in Seismic Regions, Federation International du Beton, Athens, Grece, 6–8 May 2003. [Google Scholar]
  67. Braga, F.; Gigliotti, R.; Laterza, M. R/C Existing Structures with Smooth Reinforcing Bars: Experimental Behaviour of Beam-Column Joints Subject to Cyclic Lateral Loads. Open Constr. Build. Technol. J. 2009, 3, 52–67. [Google Scholar] [CrossRef] [Green Version]
  68. Melo, J.; Varum, H.; Rossetto, T.; Costa, A. Cyclic response of RC beam-column joints reinforced with plain bars: An experimental testing campaign. In Proceedings of the 15th World Conference on Earthquake Engineering, Lisbon, Portugal, 24–28 September 2012. [Google Scholar]
  69. Beschi, C.; Riva, P.; Metelli, G.; Meda, A. HPFRC Jacketing of Non Seismically Detailed RC Corner Joints. J. Earth. Eng. 2014, 19, 25–47. [Google Scholar] [CrossRef]
  70. CEN Eurocode 1 EN 1991-1-1. Actions on Structures, Part 1—1 General Actions—Densities, Selfweight, Imposed Loads for Buildings; ECS: Brussels, Belgium, 2002. [Google Scholar]
  71. NTC08. Norme Tecniche per le Costruzioni, D.M. 14 Gennaio 2008; S.O. No. 30 alla G.U. del 4.2.2008, No. 29; Ministero delle Infrastrutture: Rome, Italy, 2008. (In Italian) [Google Scholar]
  72. Morandi, P.; Hak, S.; Magenes, G. Comportamento sismico delle tamponature in laterizio in telai in c.a.: Analisi numeriche su edifici ed implicazioni progettuali. In Proceedings of the XIV Convegno ANIDIS, Bari, Italy, 18–22 September 2011. [Google Scholar]
  73. Jeon, J.S.; Park, J.H.; DesRoches, R. Seismic fragility of lightly reinforced concrete frames with masonry infills. Earthq. Eng. Struct. Dyn. 2015, 44, 783–1803. [Google Scholar] [CrossRef]
Figure 1. Research methodology framework.
Buildings 10 00182 g001
Figure 2. Macro-modelling approaches: (a) Holmes [26] single strut (b) [33] two-strut approach, (c) Chrysostomou et al. [29] three-strut approach,(d) El-Dakhakhni et al. [30] three-strut approach, (e) Crisafulli [28] macro-model, (f) Furtado et al. [27] macro-model.
Buildings 10 00182 g002
Figure 3. Different failure modes of reinforced concrete (RC) infilled frames: (a) corner crushing and diagonal compression, (b) diagonal tension and shear sliding (adapted from Asteris et al. [48]).
Buildings 10 00182 g003
Figure 4. Example of backbone curves: (a) Bertoldi et al. [18], (b) Panagiotakos and Fardis [16] and (c) De Risi et al. [14].
Buildings 10 00182 g004
Figure 5. Numerical modelling approach for masonry infill, frame elements and beam-column joints, implemented in OpenSees [60].
Buildings 10 00182 g005
Figure 6. Comparison between numerical and experimental test results by Calvi and Bolognini [4].
Buildings 10 00182 g006
Figure 7. Numerical versus experimental results of the GLD specimen by Verderame et al. [7] for (a) modelling option 1 (rigid beam-column joints) and (b) modelling option 2 (with shear springs).
Buildings 10 00182 g007
Figure 8. Comparison between numerical and experimental results of the SLD specimen by Verderame et al. [7].
Buildings 10 00182 g008
Figure 9. Comparison between numerical and experimental results of the test by Morandi et al. [5].
Buildings 10 00182 g009
Figure 10. Numerical versus experimental test results for masonry infill type 4 [5]: (a) without openings and (b) with openings.
Buildings 10 00182 g010
Figure 11. Numerical versus experimental test results for masonry infill type 1 [4].
Buildings 10 00182 g011
Figure 12. Backbone curves (a) for masonry infill type 1-2-3 according to Table 3 and Table 4 and (b) for masonry infill type 4-5 according to Table 3 and Table 4.
Buildings 10 00182 g012
Figure 13. (a) Backbone curves by Bertoldi et al. [18] varying the strut width and the strength models; (b) pushover curves resulting from each backbone curve versus experimental test results.
Buildings 10 00182 g013
Figure 14. Pushover analysis results as function of the strut width and the strength formulations.
Buildings 10 00182 g014
Figure 15. (a) Best numerical results versus experimental ones for infill type 4 [5]; (b) experimental-to-numerical capacity ratio for different models; (c) comparison of two of the best numerical models with in-plane static cyclic test results by Morandi et al. [5].
Buildings 10 00182 g015
Table 1. Formulations to evaluate the width of the strut and reduction coefficients of stiffness and strength due to the presence of the openings.
Diagonal Infill Strut Width According to Different Models
Bertoldi et al. [18] b w d w = K 1 λ h + K 2
{ K 1 = 1.300 , K 2 = 0.178 ;   i f   λ h < 3.14 K 1 = 0.707 , K 2 = 0.010 ;   i f   3.14 < λ h < 7.85 K 1 = 0.470 , K 2 = 0.040 ;   i f   λ h > 7.85   }
λ = E w ϑ t w sin ( 2 ϑ ) 4 E c I c h w 4
(Stafford Smith [33])
E w ϑ : elastic modulus of
masonry (inclined direction)
E c : elastic modulus of concrete
I c : elastic modulus of concrete
t w : thickness of the infill
b w : strut width of the infill
d w : diagonal length of the infill
Paulay and Priestley [39] b w d w = 0.25
Holmes [26] b w d w = 0.33
Liauw and Kwan [37] b w d w = 0.95 sin ( 2 ϑ ) 2 λ h
Mainstone [36] b w d w = 0.175 ( λ h ) 0.4
Stafford Smith [33] 0.1 < b w d w < 0.25
Decanini and Fantin [38]Uncracked: {   ( 0.085 + 0.748   λ ) d w ;   i f   λ h 7.85 ( 0.130 + 0.393   λ ) d w ;   i f   λ h > 7.85 }
Cracked: {   ( 0.010 + 0.707 λ ) d w ;   i f   λ h 7.85 ( 0.040 + 0.470   λ ) d w ;   i f   λ h > 7.85 }
Papia et al. [40] b w d w = k c z ( λ * ) β
c, β: accounting for Poisson’s ratio
k: accounting for vertical load
z: geometrical parameter
λ * = E w ϑ t w h E c A c ( h 2 L 2 + A c L 4 A b h )
According to Papia et al. [40]
L: frame centreline span
h: centreline storey height.
A c : column cross section
A b : beam cross section
Reduction Coefficients of Stiffness and Strength due to the Presence of Openings
Dawe and Seah [45] r p = 1 1.5 α l 100 ;   α l < 66 % α a = 100 l p h p L w h w
α l = 100 l p L w
l p : opening length
h p : opening height
L w : infill length
h w : infill height
Imai and Miyamoto [42] r p = min ( 1 0.01 α l ; 1 0.1 α l 0.5 )
Tasnini and Mohebkhan [43] r p = 1 2.238 ( α a 100 ) + 1.49 ( α a 100 ) 2 ;   α a < 40 %
Decanini et al. [46] r p = 0.55 e ( 0.035 α a ) + 0.44 e ( 0.025 α l )
Asteris [44] r p = 1 2 ( α a 100 ) 0.54 + ( α a 100 ) 1.14
Table 2. Formulations for the evaluation of infill strength and backbone curve.
Infill Strength According to Different Models
Paulay and Priesley [39] V W   =   m i n ( V s   ; V c )
Sliding shear failure:
V s   =   f v 0 t w L w 1 μ h L
Compression failure:
V c   =   2 3 z t w f l a t
z = π 2 λ 1
f v 0 : initial shear strength of bed-joints;
μ :   friction coefficient ( μ = 0.3 ) ;
λ : according to (Stafford Smith [33].
Bertoldi et al.
[18]
f m =   min ( σ w , c c ; σ w , c o r n ; σ w , ss ; σ w , sd )
Compression at the centre:
σ w , c c = 1.16 f v e r t t a n ϑ K 1 + K 2 λ h
Compression at the corners: σ w , ccorn = 1.2 f v e r t s i n ϑ c o s ϑ K 1 ( λ h ) 0.12 + K 2 ( λ h ) 0.88
Sliding shear failure:
σ w , ss = ( 1.2 s i n ϑ + 0.45 c o s ϑ ) f v 0 + 0.3 σ v b w d w
Diagonal cracking:
σ w , sd = 0.6 f t + 0.3 σ v b w d w
f t : shear strength under diagonal compression;
f v e r t :   compression strength in vertical direction;
f v 0 : initial shear strength of bed-joints;
σ v :   vertical stress;
λ : according to Stafford Smith [33].
b w : according to Bertoldi et al. [18].
EC6/EC8
[49,50]
V W = f v t w L w f v = f v 0 + 0.4 σ v
f v 0 : initial shear strength of bed-joints;
σ v :   vertical stress.
FEMA 306
[34]
V m f     V W   =   m i n ( V s   ; V c ; V c r )     V m i
Sliding shear failure:
V s =   ( f v 0   +   μ σ v ) t w L w
Compression failure:
V c   =   t w b w f l a t c o s θ
Diagonal cracking failure:
V c r   =   2 2 t w L w σ c r L w h w + h w L w
V m i   =   2   0.0069 f v e r t   t w L w
V m f =   0.3 V m i
f v 0 : initial shear strength of bed-joints;
σ c r : cracking strength of masonry;
μ :   friction coefficient ( μ = 0.4 ) ;
σ v :   vertical stress;
f l a t :   compression strength in horizontal direction of masonry;
f v e r t :   compression strength in vertical direction;
b w : according to Mainstone [36];
λ : according to Stafford Smith [33].
Backbone Curve according to Different Models
Bertoldi et al.
[18]
cracking strength:
F c r = 0.8 F m a x
residual strength:
F r e s = 0.35 F m a x
elastic stiffness:
K f c = 4 K s e c
softening-to-peak stiffness:
K d e g = 0.02 K s e c
F m a x : peak strength, defined according to the selected infill strength model;
K s e c : secant stiffness according to Mainstone [36].
Panagiotakos and Fardis [19]cracking strength:
F m a x = 1.3 F c r
residual strength
F r e s = β F m a x
elastic stiffness
K f c = 4 K s e c
softening-to-peak stiffness
K d e g = α K s e c
F c r : cracking strength, defined according to the selected infill strength model;
α: [0.5%, 10%];
β: [1%, 2%];
K s e c : secant stiffness according to Mainstone [36].
De Risi et al.
[14]
cracking strength:
F c r = 0.7 F m a x
residual strength:
F r e s = 0
elastic stiffness:
K e l = 2.8 K M S
secant stiffness:
K s e c = 0.8 K M S
softening-to-peak stiffness:
K d e g = 0.1 K M S
F m a x : peak strength, defined according to the selected infill strength model;
K s e c : secant stiffness according to Mainstone ( K M S ) [36].
Sassun et al.
[51]
Backbone according to Bertoldi et al. [18] modified with prefixed values of drift capacity ϑ (or equivalently in terms of strain capacity ε [55]) DS1 (Operational): ϑ = 0.18 %
DS2 (Damage Limitation): ϑ = 0.46 %
DS3 (Life Safety): ϑ = 1.05 %
DS4 (Ultimate): ϑ = 1.88 %
Table 3. Representative masonry infills.
ReferencesTypeMacro Classificationtw [mm]Ewv [MPa]Ewh [MPa]Gw [MPa]fwv [MPa]fwlat [MPa]fwu [MPa]
Calvi and Bolognini [4]1Weak80187399110892.021.180.44
Hak et al.
[55]
2Weak-Medium240187399118731.51.110.25
Hak et al.
[55]
3Medium-Strong 3003240105012963.511.50.3
Morandi et al. [5]4Medium-Strong350529949421204.641.080.359
Cavaleri and Di Trapani [6]5Strong1506401503825478.664.181.07
tw: thickness; Ewv: elastic modulus vertical direction; Ewh: elastic modulus horizontal direction; Gw: shear modulus; fwv: vertical strength; fwlat: lateral strength; fwu: shear sliding strength.
Table 4. Summary of the best numerical modelling approach adopted to define the strut’s hysteretic behaviour for each masonry infill typology.
TypeMacro
Classification
Strut
Width
Reduction CoefficientFailure
Mechanism
Backbone
Curve
1WeakBertoldi et al. [18]-Bertoldi et al. [18]Sassun et al. [51] (modified)
2Weak-MediumBertoldi et al. [18]-Bertoldi et al. [18]Sassun et al. [51] (modified)
3Medium-StrongBertoldi et al. [18]-Bertoldi et al. [18]Sassun et al. [51] (modified)
4Medium-StrongMainstone [36]Decanini et al. [46]Paulay and Priestley [39]Bertoldi et al. [18]
5StrongMainstone [36]-Paulay and Priestley [39]Bertoldi et al. [18]
Table 5. Summary of the best numerical models for the strong masonry infill typology, as function of strut width and strength formulations.
Numerical Modelling IDBackbone CurveStrut WidthStrength Modelμσ
Model-1Bertoldi et al. [18]Mainstone [36]Bertoldi et al. (fwu/2) [18]1.002.46
Model-2Bertoldi et al. [18]Stafford Smith [33]Bertoldi et al. (fwu/2) [18]1.022.64
Model-3Bertoldi et al. [18]Bertoldi et al. [18]Paulay and Priestley [39]0.861.29
Model-4Bertoldi et al. [18]Mainstone [36]Paulay and Priestley (fwu/2) [39]1.002.46
Model-5Bertoldi et al. [18]FEMA 306 [34]Bertoldi et al. [18]0.931.35

