Article

Investigation on the Precipitates of IN718 Alloy Fabricated by Selective Laser Melting

1
College of Materials Science and Engineering, Inner Mongolia University of Technology, Hohhot 010051, China
2
College of Mechanical and Electric Engineering, Hulunbiur college, Hulunbiur 021000, China
3
Engineering Research Center for the Safe Exploitation and Comprehensive Utilization of Mineral Resources at Universities of Inner Mongolia Autonomous Region, Hulunbiur 021000, China
*
Author to whom correspondence should be addressed.
Metals 2019, 9(10), 1128; https://doi.org/10.3390/met9101128
Submission received: 2 September 2019 / Revised: 10 October 2019 / Accepted: 10 October 2019 / Published: 22 October 2019

Abstract

:
The microstructure and precipitates of INCONEL 718 alloy (IN718) fabricated by selective laser melting (SLM) are investigated. The matrix is comprised of the elongated γ grains along Z direction, tilting a few degrees. The microstructure mainly consists of a cellular–columnar structure with fine first dendrite arm space of 1–1.5 µm originated from the rapid solidification rate locally. The precipitates of the SLMed IN718 are confirmed to be a significant amount of Laves in the form of irregular bulk distribution, small amount of carbonitride and spherical Al2O3 particles in nanoscale. Some of the carbonitrides grow separately and some of the carbonitrides enwrap the Al2O3 fully or partly, forming the shell structure of the Al2O3–carbonitride. The reheating effect from the following layers to the previous layers have not reached the solid-state transformation temperature of the γ′ and γ″.

1. Introduction

IN718 is supposed to be one of the most promising superalloys for its high strength, excellent corrosion resistance, and oxidation resistance at an elevated temperature up to 650 °C. It has been extensively used in aerospace and energy industries [1,2,3]. Selective laser melting is a layer-upon-layer additive manufacturing technique. Based on the powder bed fusion system, the focused laser beam is employed to produce dense metallic parts [4,5,6]. This process is widely used in superalloy components with complex geometry and hollow structure. The precipitates derived from the fast solidification process have strongly affected the microstructure and mechanical property of the parts. The mechanical property of IN718 formed by SLM can not satisfied with the industry usage, and thus further heat-treatment process is still needed. However, the tune of the heat-treatment is determined by the precipitates and microstructure formed in the SLM process. In order to control the final mechanical property, the as-deposited microstructure and the following heat treatment process have become an important issue [7,8]. Mang et al. [9] believed that the precipitates existing in the SLMed IN718 should be 75% γ,17% γ′’, and 7% γ′. Often the γ′ is distributed in the subgrain boundary, and the γ″ is uniformly distributed in the whole section, whose strengthening effect is supposed to be the main reason that the mechanical property is higher than the cast IN718; Y. Tian et al. [10] found that the deposited SLMed samples with cellular dendrite structure mainly precipitates the Laves phases in microscale and NbC in nanoscale, no γ′ and γ″ have been tracked due to the high cooling rate, and after heat treatment, recrystallization occurs, making the needle-like shape δ precipitated. However, Yen et al. [11] found that in the as-deposited samples, δ–Ni3Nb precipitates were arranged in a chessboard pattern in the top view, and parallel to the building direction of SLM in the side view. It was also noted that the δ phases were localized in the interdendritic regions, which affects the ductility of the printed samples. They cannot come to an agreement of the precipitates of as-deposited IN718 superalloy fabricated by SLM. However, the as-deposited microstructures and precipitates of IN718 will determine the following heat-treatment process parameters. This research means to characterize the precipitates of IN718 during selective laser melting process to form a fundamental research for the following heat-treatment process.

2. Experiment

Spherical gas atomized IN718 powders with an average particle size of 65 µm were used. The chemical compositions of the IN718 powder are listed in Table 1. The SLM process was conducted on an EOS M280 rapid forming machine (EOS Gmbh, Munich, German) equipped with maxim 400 W Yb fiber laser. The substrate material is 45 steel with dimension of 250 mm × 250 mm × 30 mm, which is preheated to 80 °C to reduce the deformation of the component. All the manufacturing process is under the shielding gas in the form of Argon. Rectangular shaped samples (10 mm × 10 mm × 100 mm) were fabricated with the parameters shown in Table 2. And the striped scanning strategy with turning 67° layer by layer is shown in Figure 1.
After deposition, the as-fabricated samples were sectioned along XZ and XY planes and mounted into a standard metallographic specimen. The optical microscope (OM) (MDJ 200, Chongqing, China) was used to observe the macrostructure of the sample. The scanning electron microscope (SEM) (FFI Quanta 650, Hillsboro, USA), operating at 20 kV accelerating voltage, was employed to obtain the secondary electron images of the microstructure. Thin foils with a diameter of 3 mm for transmission electron microscopy (TEM) were prepared by mechanically grinding down to 50 µm and further electropolishing down to electron transparency. The TEM characterization was performed using a TEM (FEI, Talos 200, Hillsboro, USA), operating at an accelerating voltage of 200 kV to make the crystal structure determination. The phase constitutions of the samples were determined by X-ray diffractometer (XRD) (D/MAX-2500/PC, Tokoy, Japan) with a CuKα radiation.

3. Results and Discussion

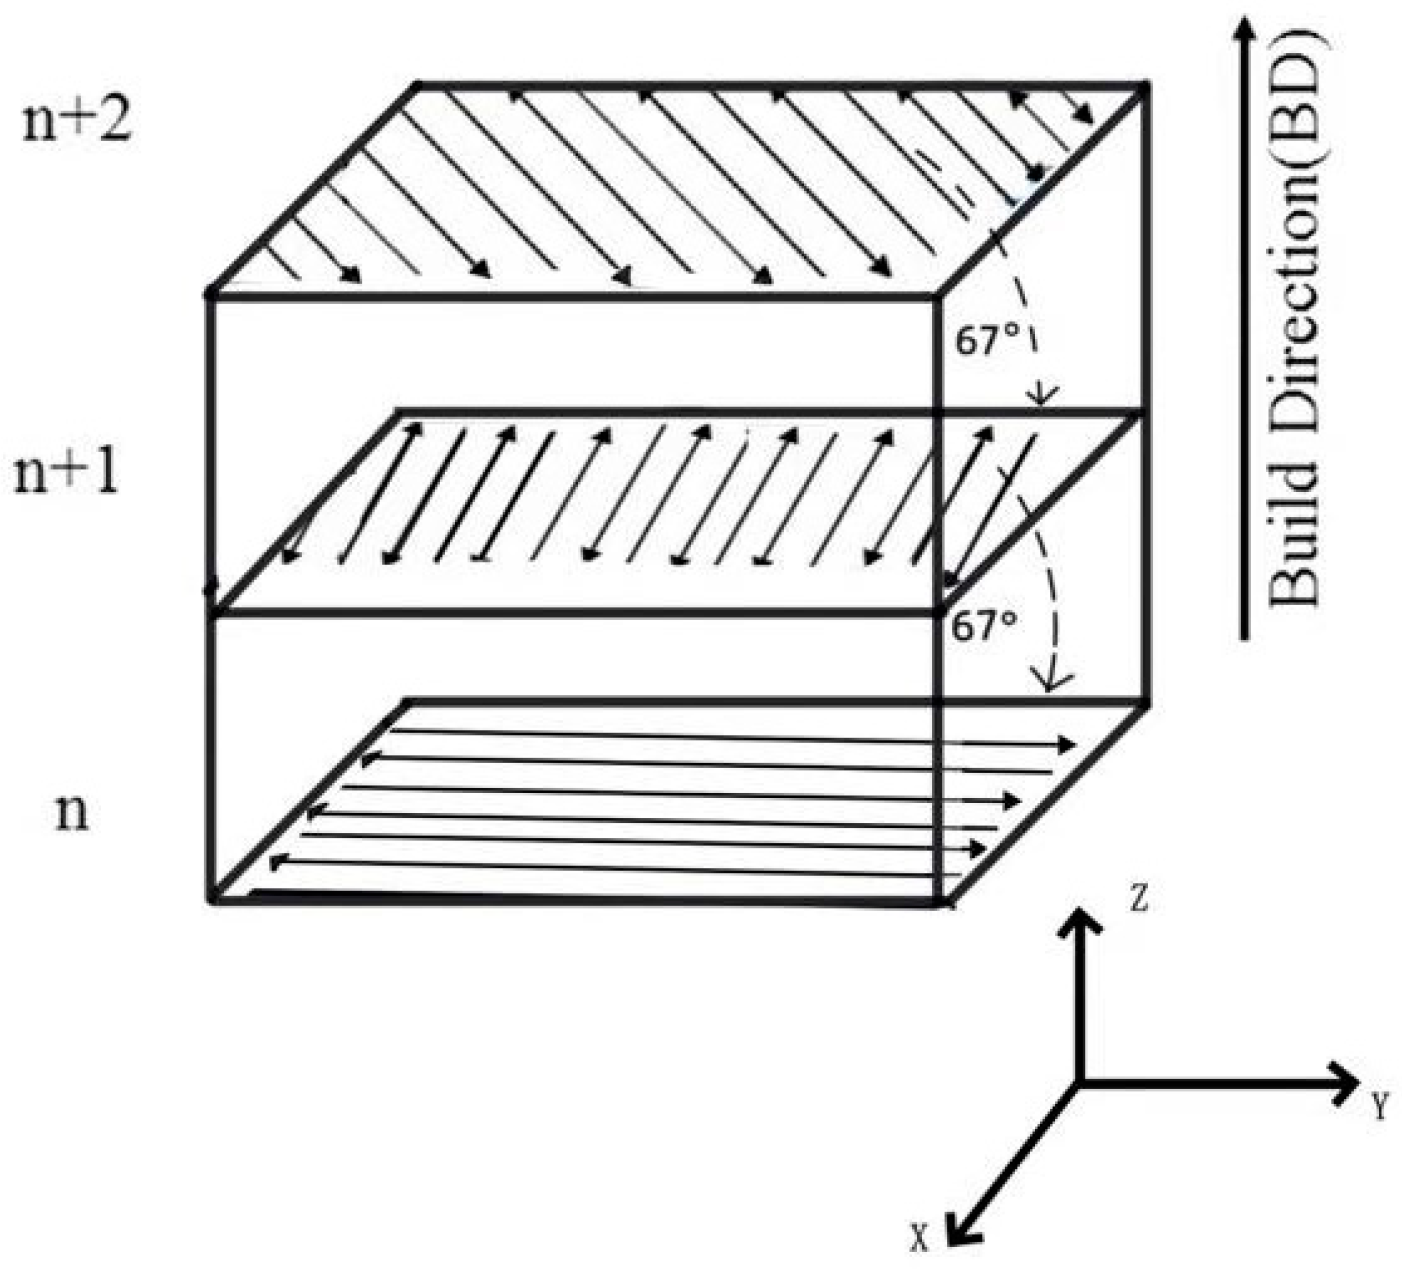
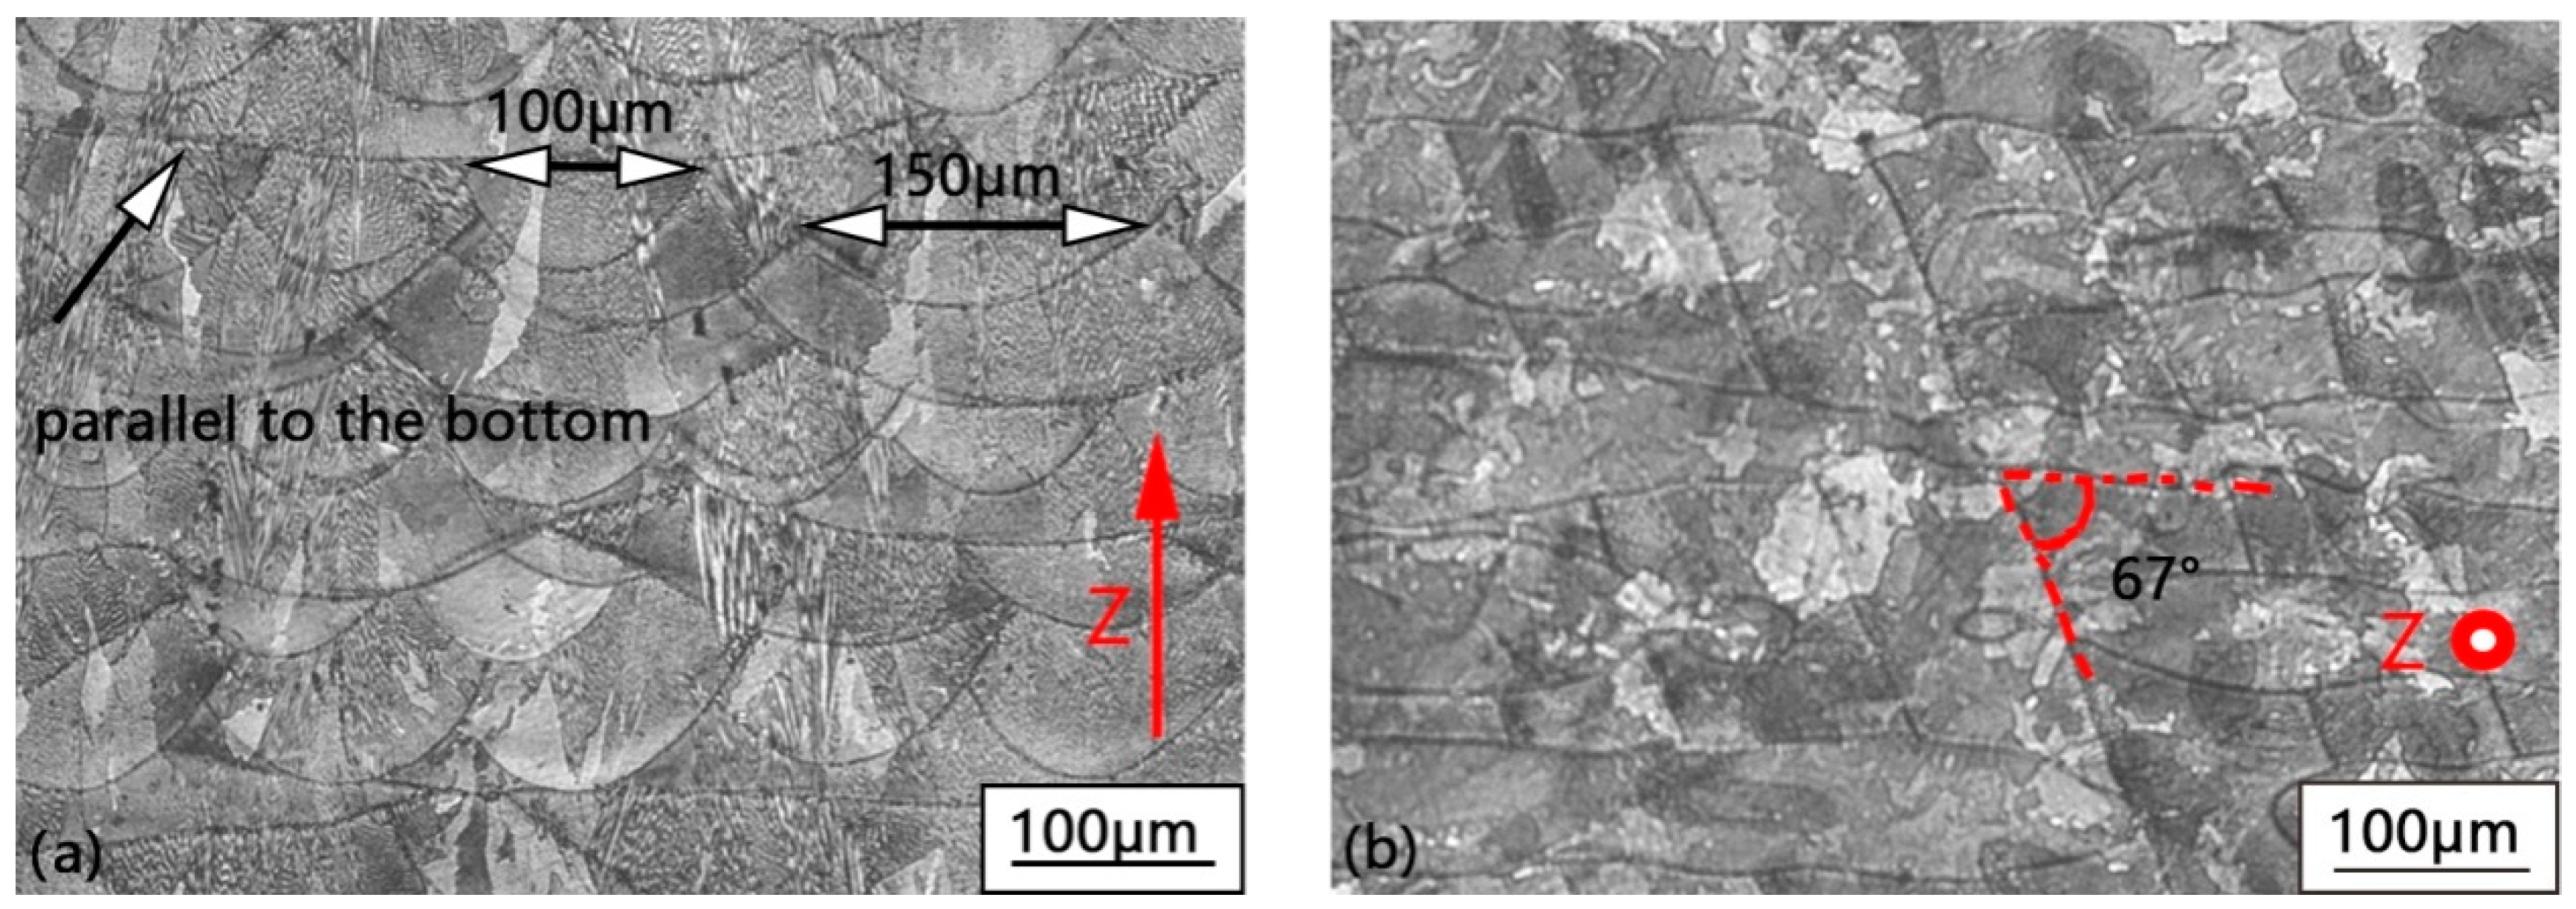
3.1. Grain Morphology

Figure 2a illustrates the macrostructure of the XZ section of the sample. The XZ section shows the arc-featured melting pools resulting from the Gaussian distribution of the energy generated from the laser powder bed fusion process. The section shows different melting pool widths, from 100 µm to even parallel to the bottom line of the section. That is because of the striped scanning strategy with a 67° hatch angle. Figure 2b depicts the track–track relationship with 67° hatching angles of the XY section. The height of the melting pool is all around 40 μm, which is identical to the manufacturing parameter. This scanning strategy will severely affect the heat dissipation of the tracks and layers, which will make a complex grain morphology distribution.
From Figure 2a, the elongated grains along Z direction with tilting a few degrees were observed, maxim up to 120 µm, which approximately grow across three layers. This feature is similar to the directional solidification. During the melting process, the substrate, or the previously deposited layer, acts as a huge heat sink. The steep temperature gradient direction is normal to the substrate. The total heat dissipation direction is the opposite of the grain growth direction.
SEM was used to observe the microstructure of the sample. Figure 3a is the magnification of one region of the XZ section. Mixed cell structure and cellular dendrite with huge length to width ratio were observed. The grain morphologies are determined by the extent of the constitutional undercooling in the frontier of the solid–liquid interface. Figure 3c–f show different cell structure morphologies magnified from the respective areas of Figure 3a. Figure 3c is the node cell structure, since the constitutional undercooling in this area is not obvious. Figure 3g–j are the diagrammatic sketches of the constitutional undercooling extent of different microstructure morphologies of Figure 3c–f, respectively. With the increase of the constitutional undercooling, the microstructure changed into irregular cells, depicted in Figure 3d. When the constitutional undercooling further increased, the elongated cell was formed, as revealed in Figure 3e. Figure 3f is called a hexagonal cell, corresponding to higher constitutional undercooling than Figure 3e. According to the Gäumann model [12,13], at a given composition of the alloy, the solidification morphology depends on the solidification parameters: temperature gradient (G) and solidification velocity (V). The ration of G and V can determine the extent of the constitutional undercooling, and it is more prone to be constitutional undercooling with lower G and higher V. With the increasing of G/V, the solidification morphology changes from Figure 3c to f, and even cell structure will transfer to cellular dendrite structure (Figure 3b) and columnar dendrite. The diverse grain morphologies reveal different thermal contents in the local areas.

3.2. First Dendrite Arm Space
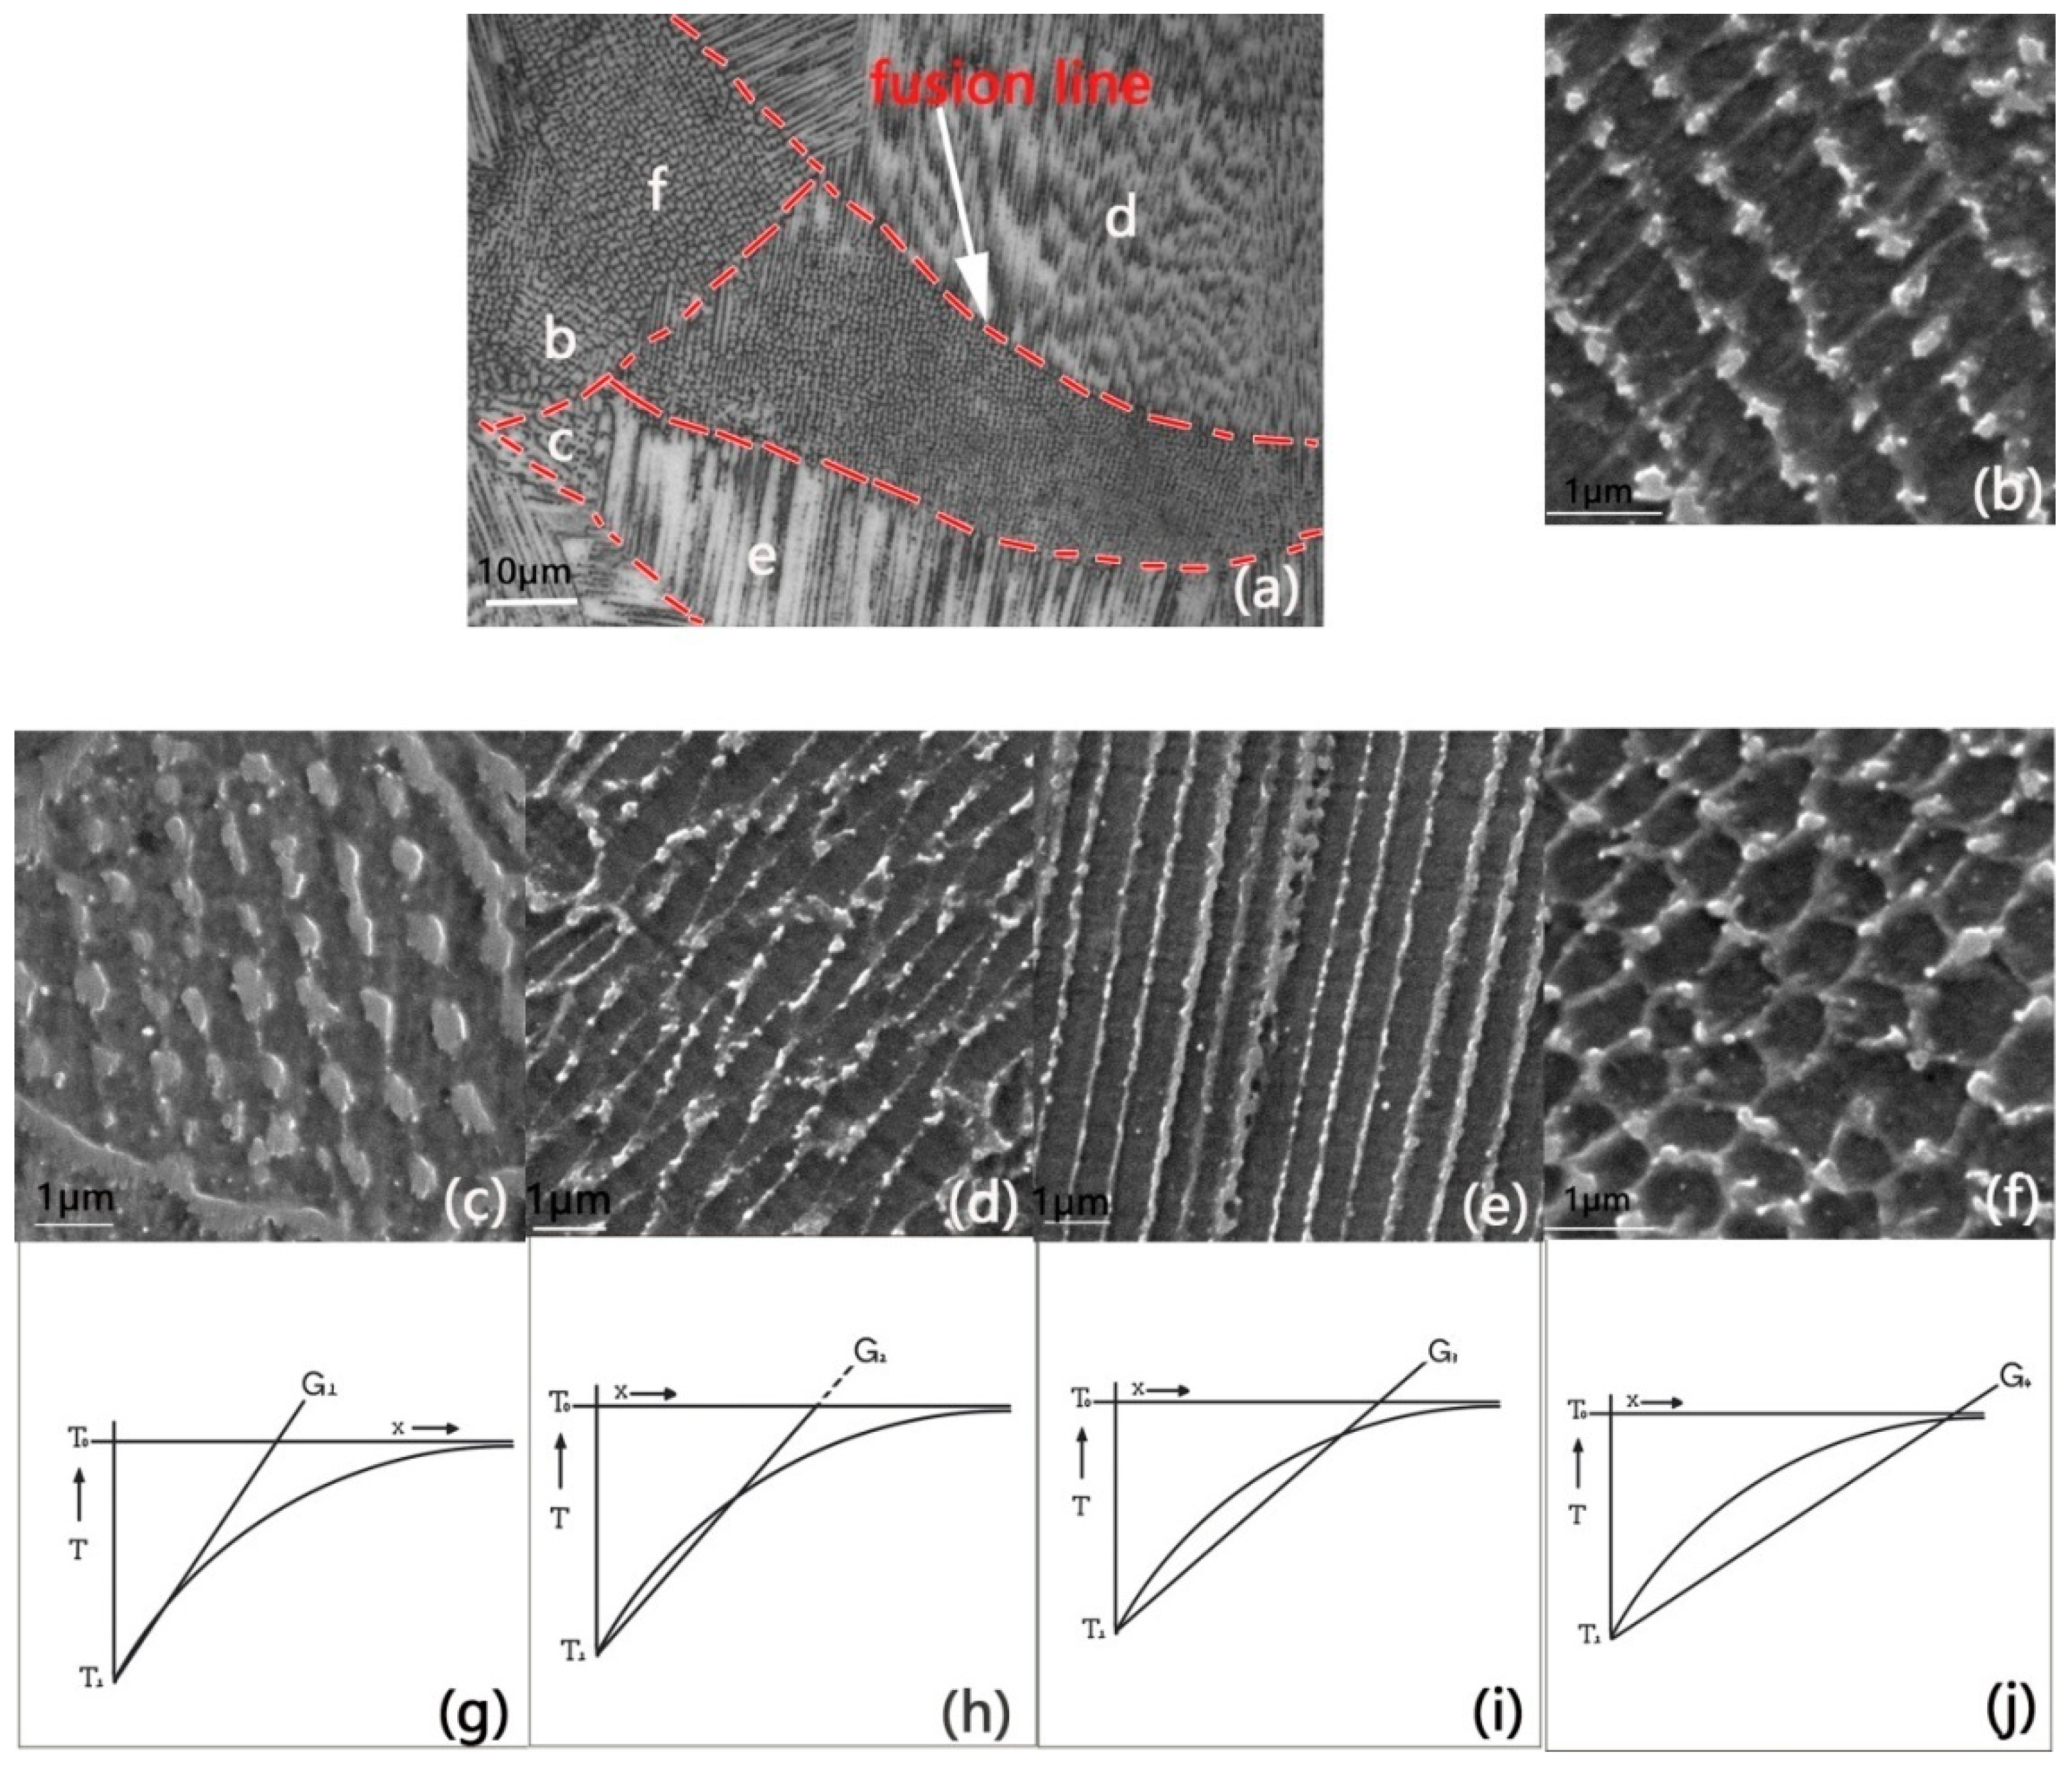
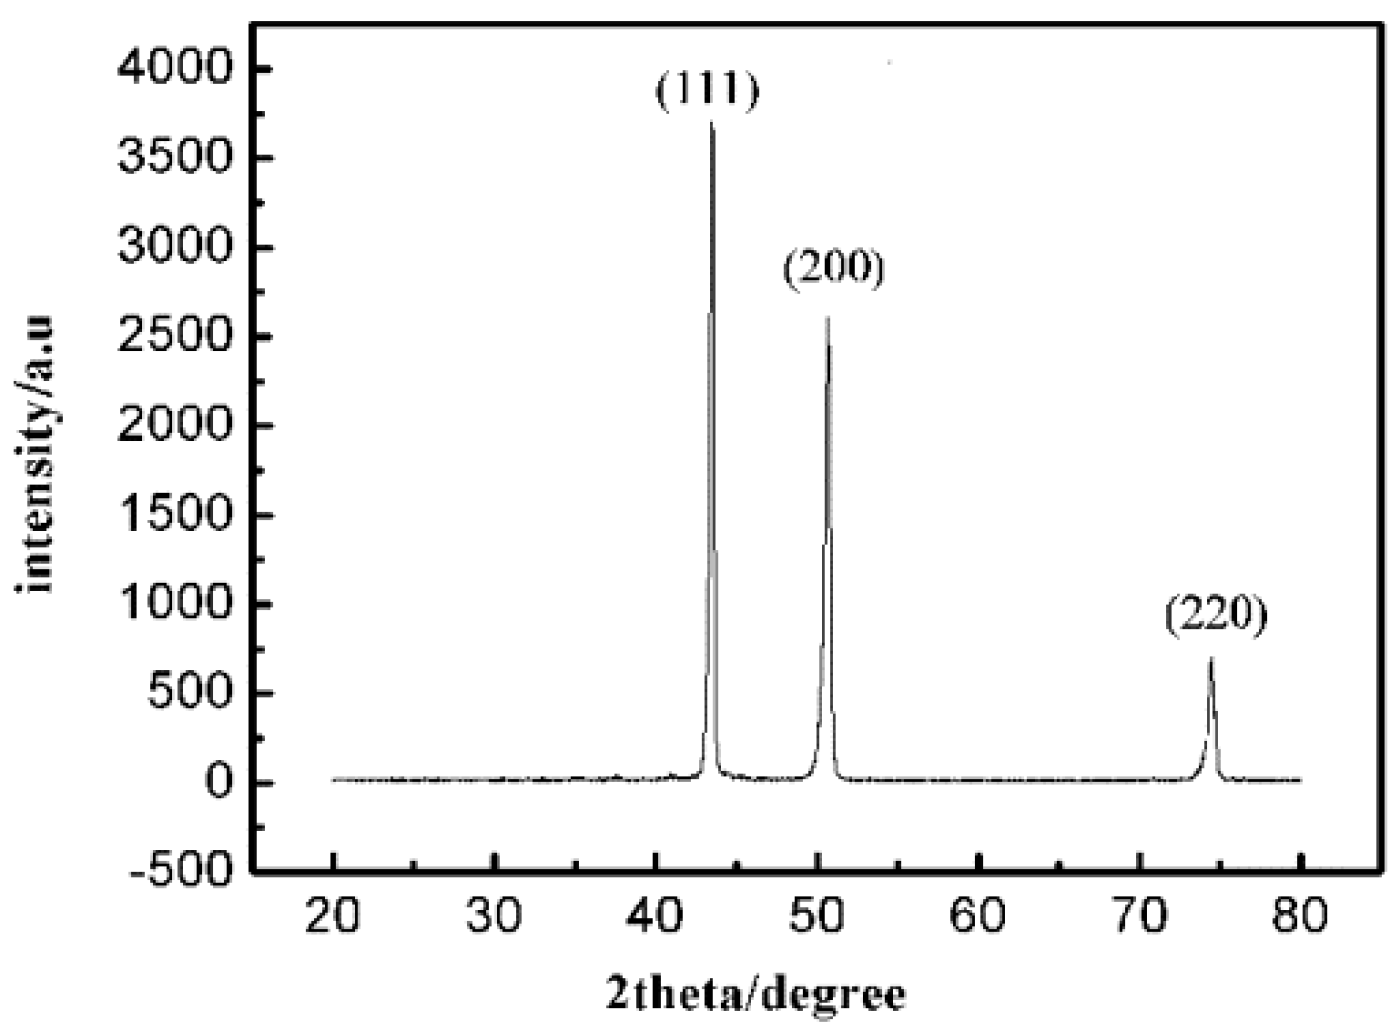
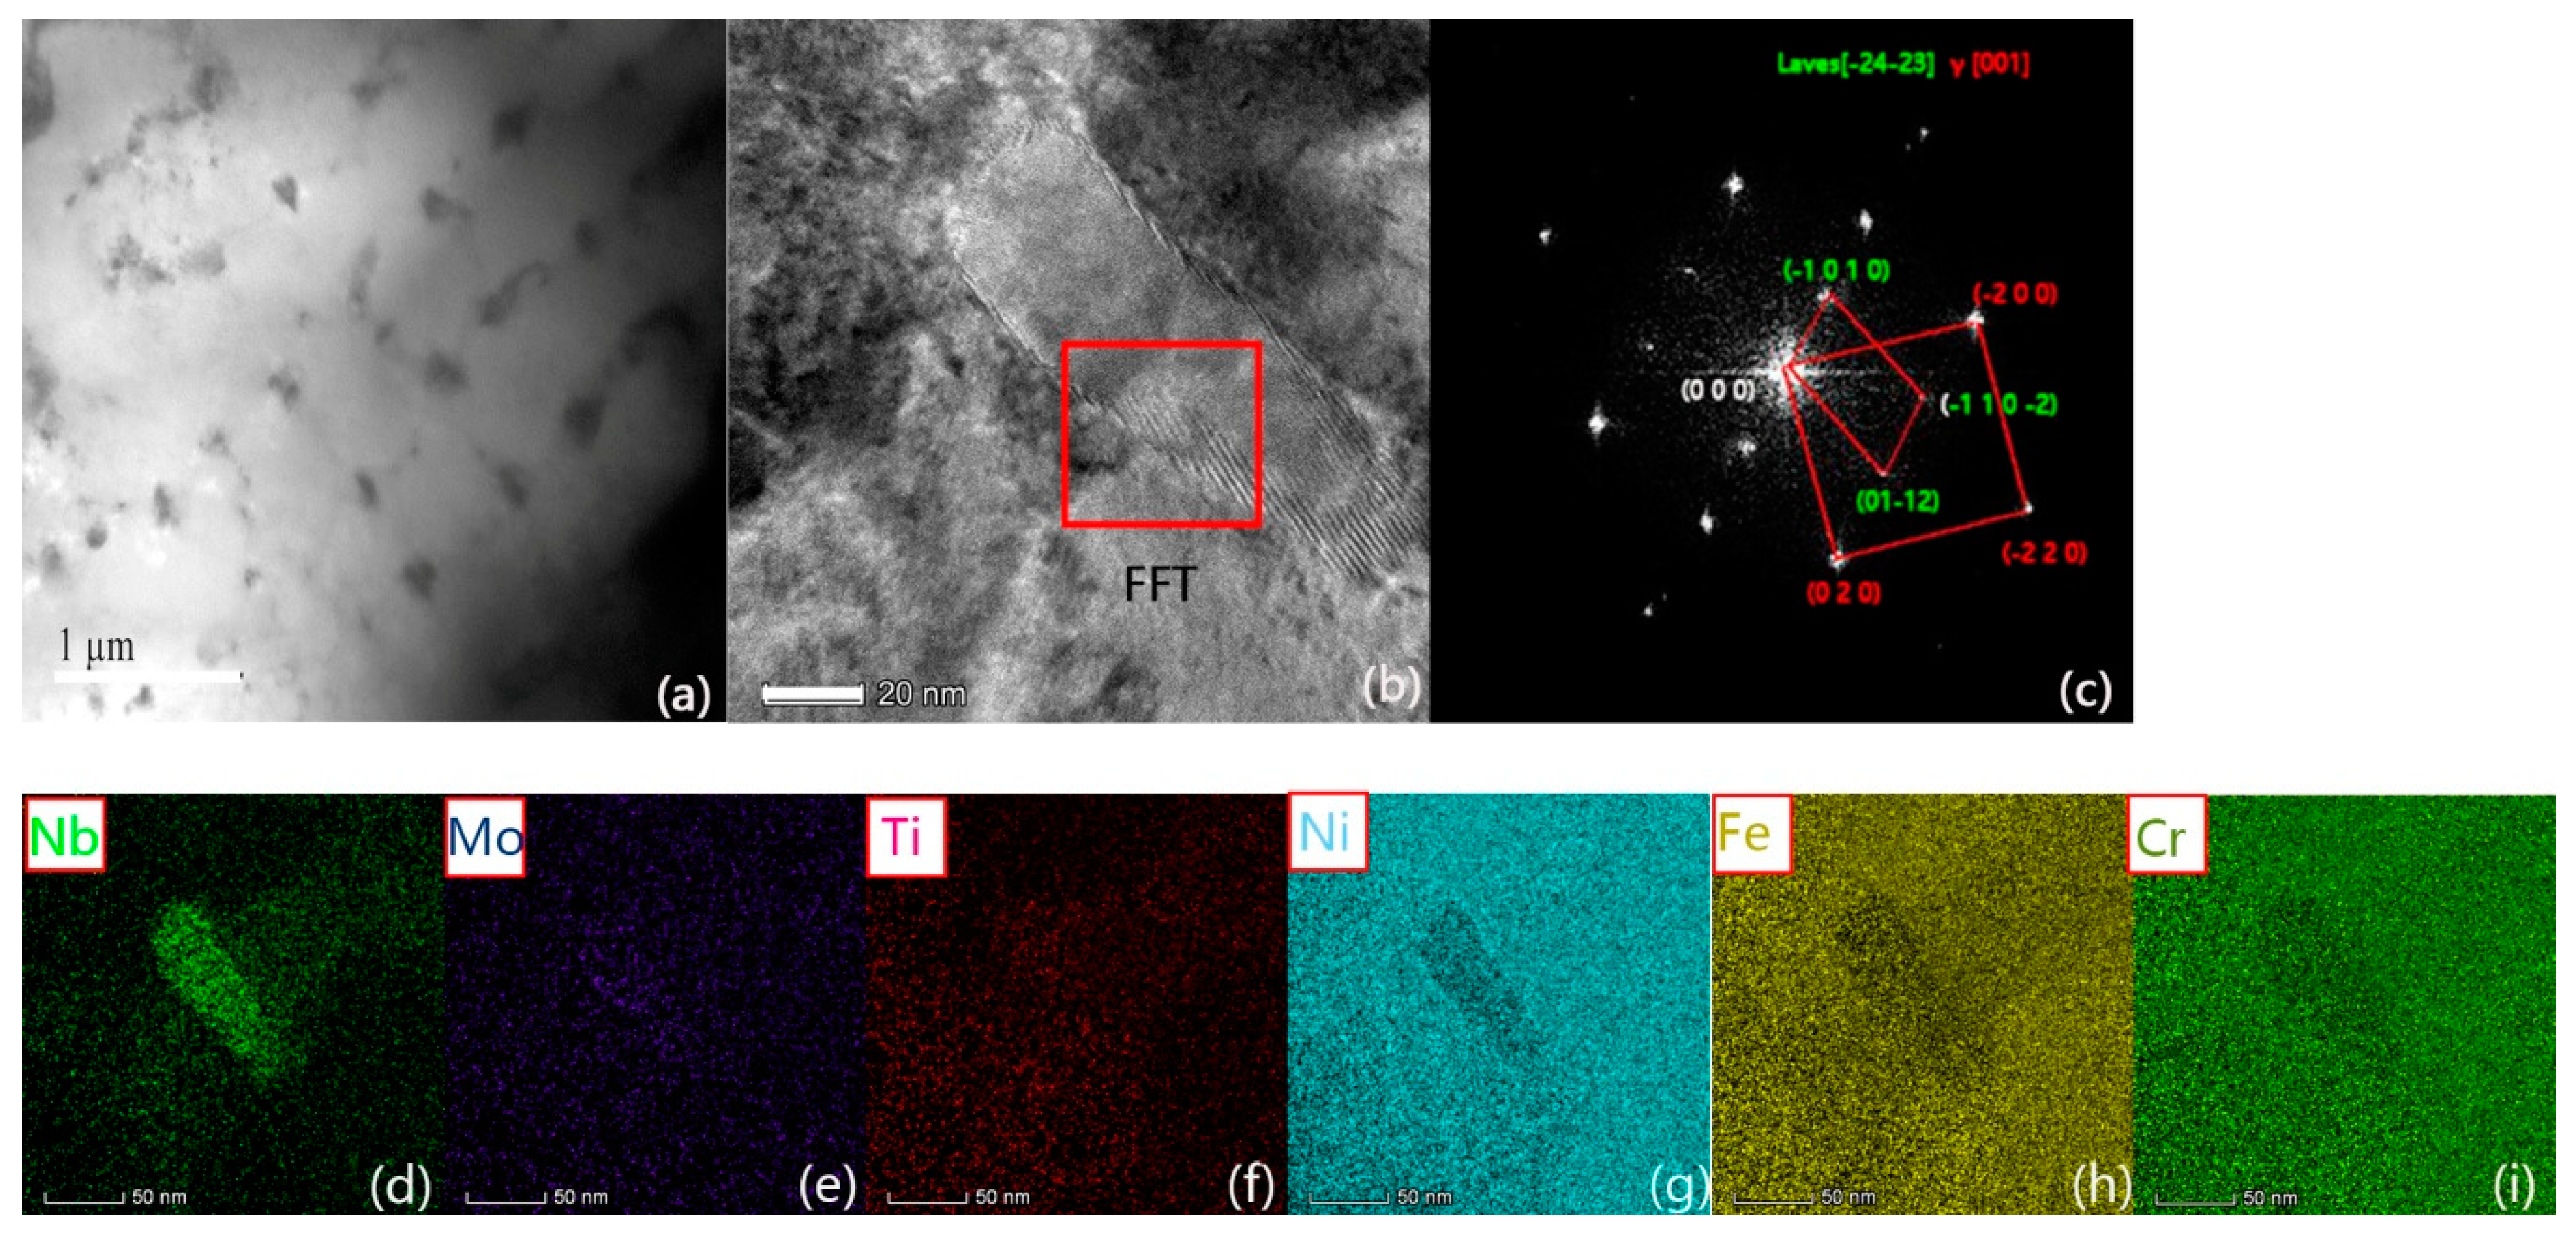
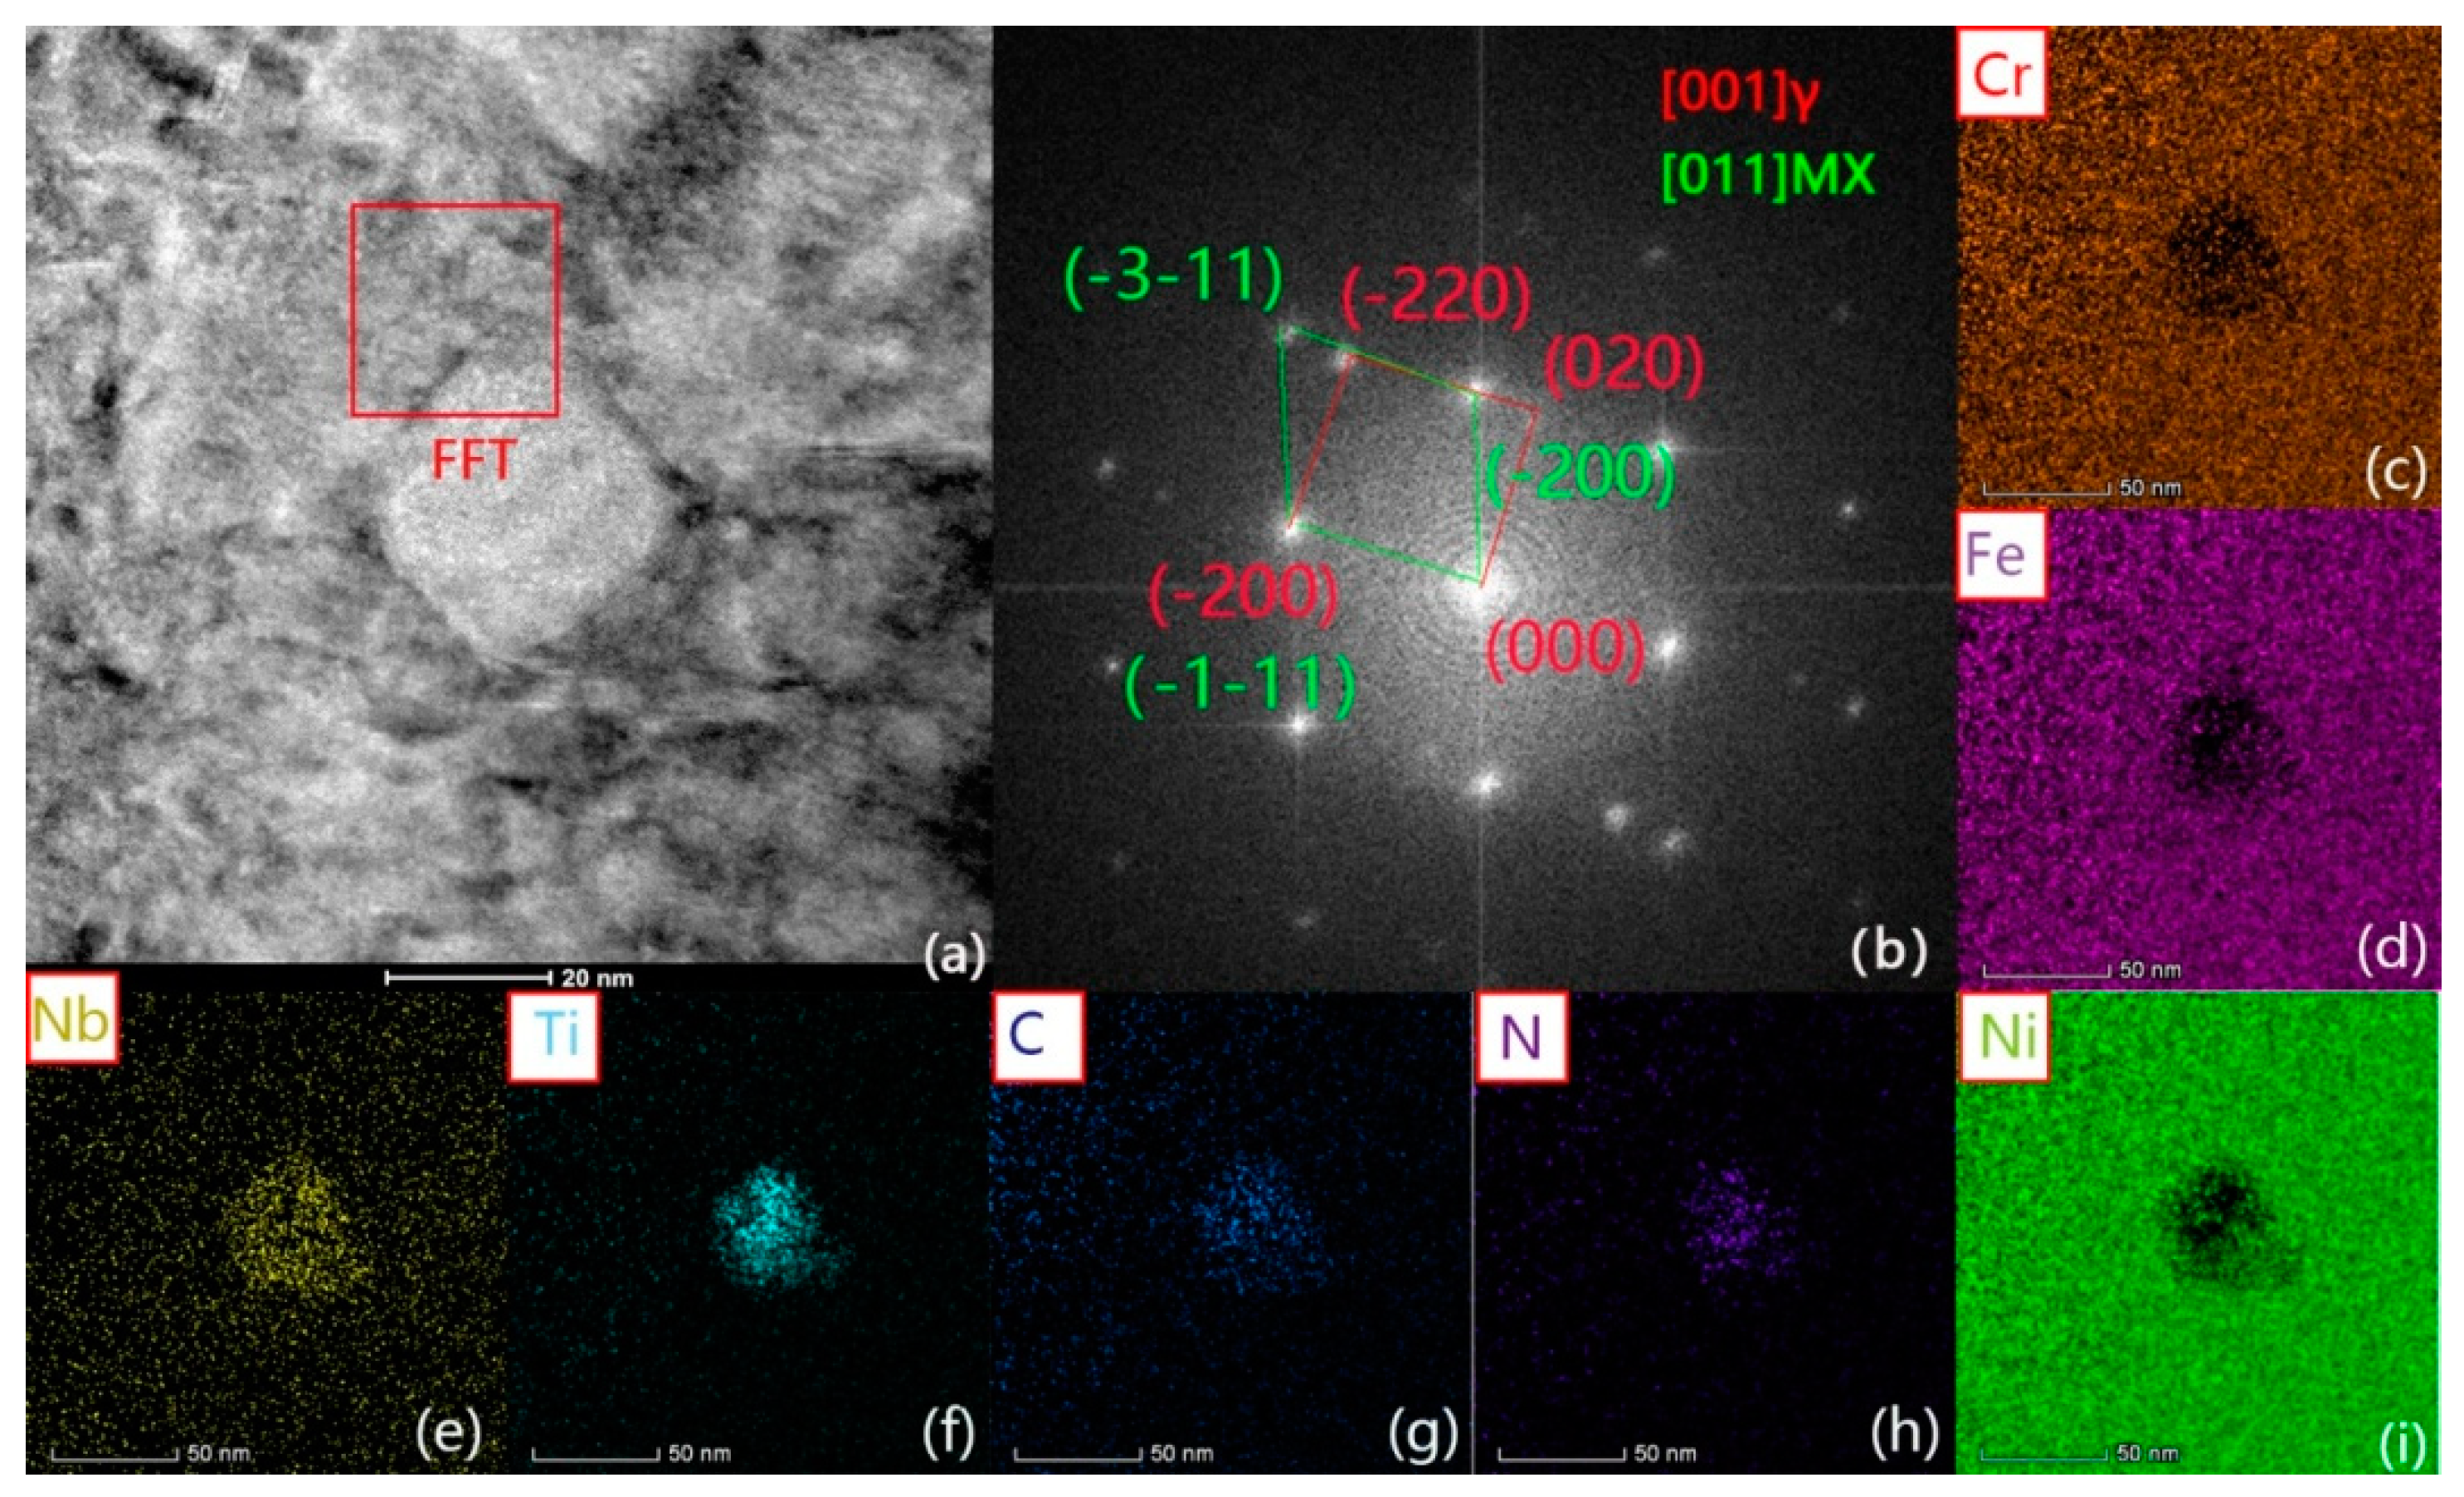
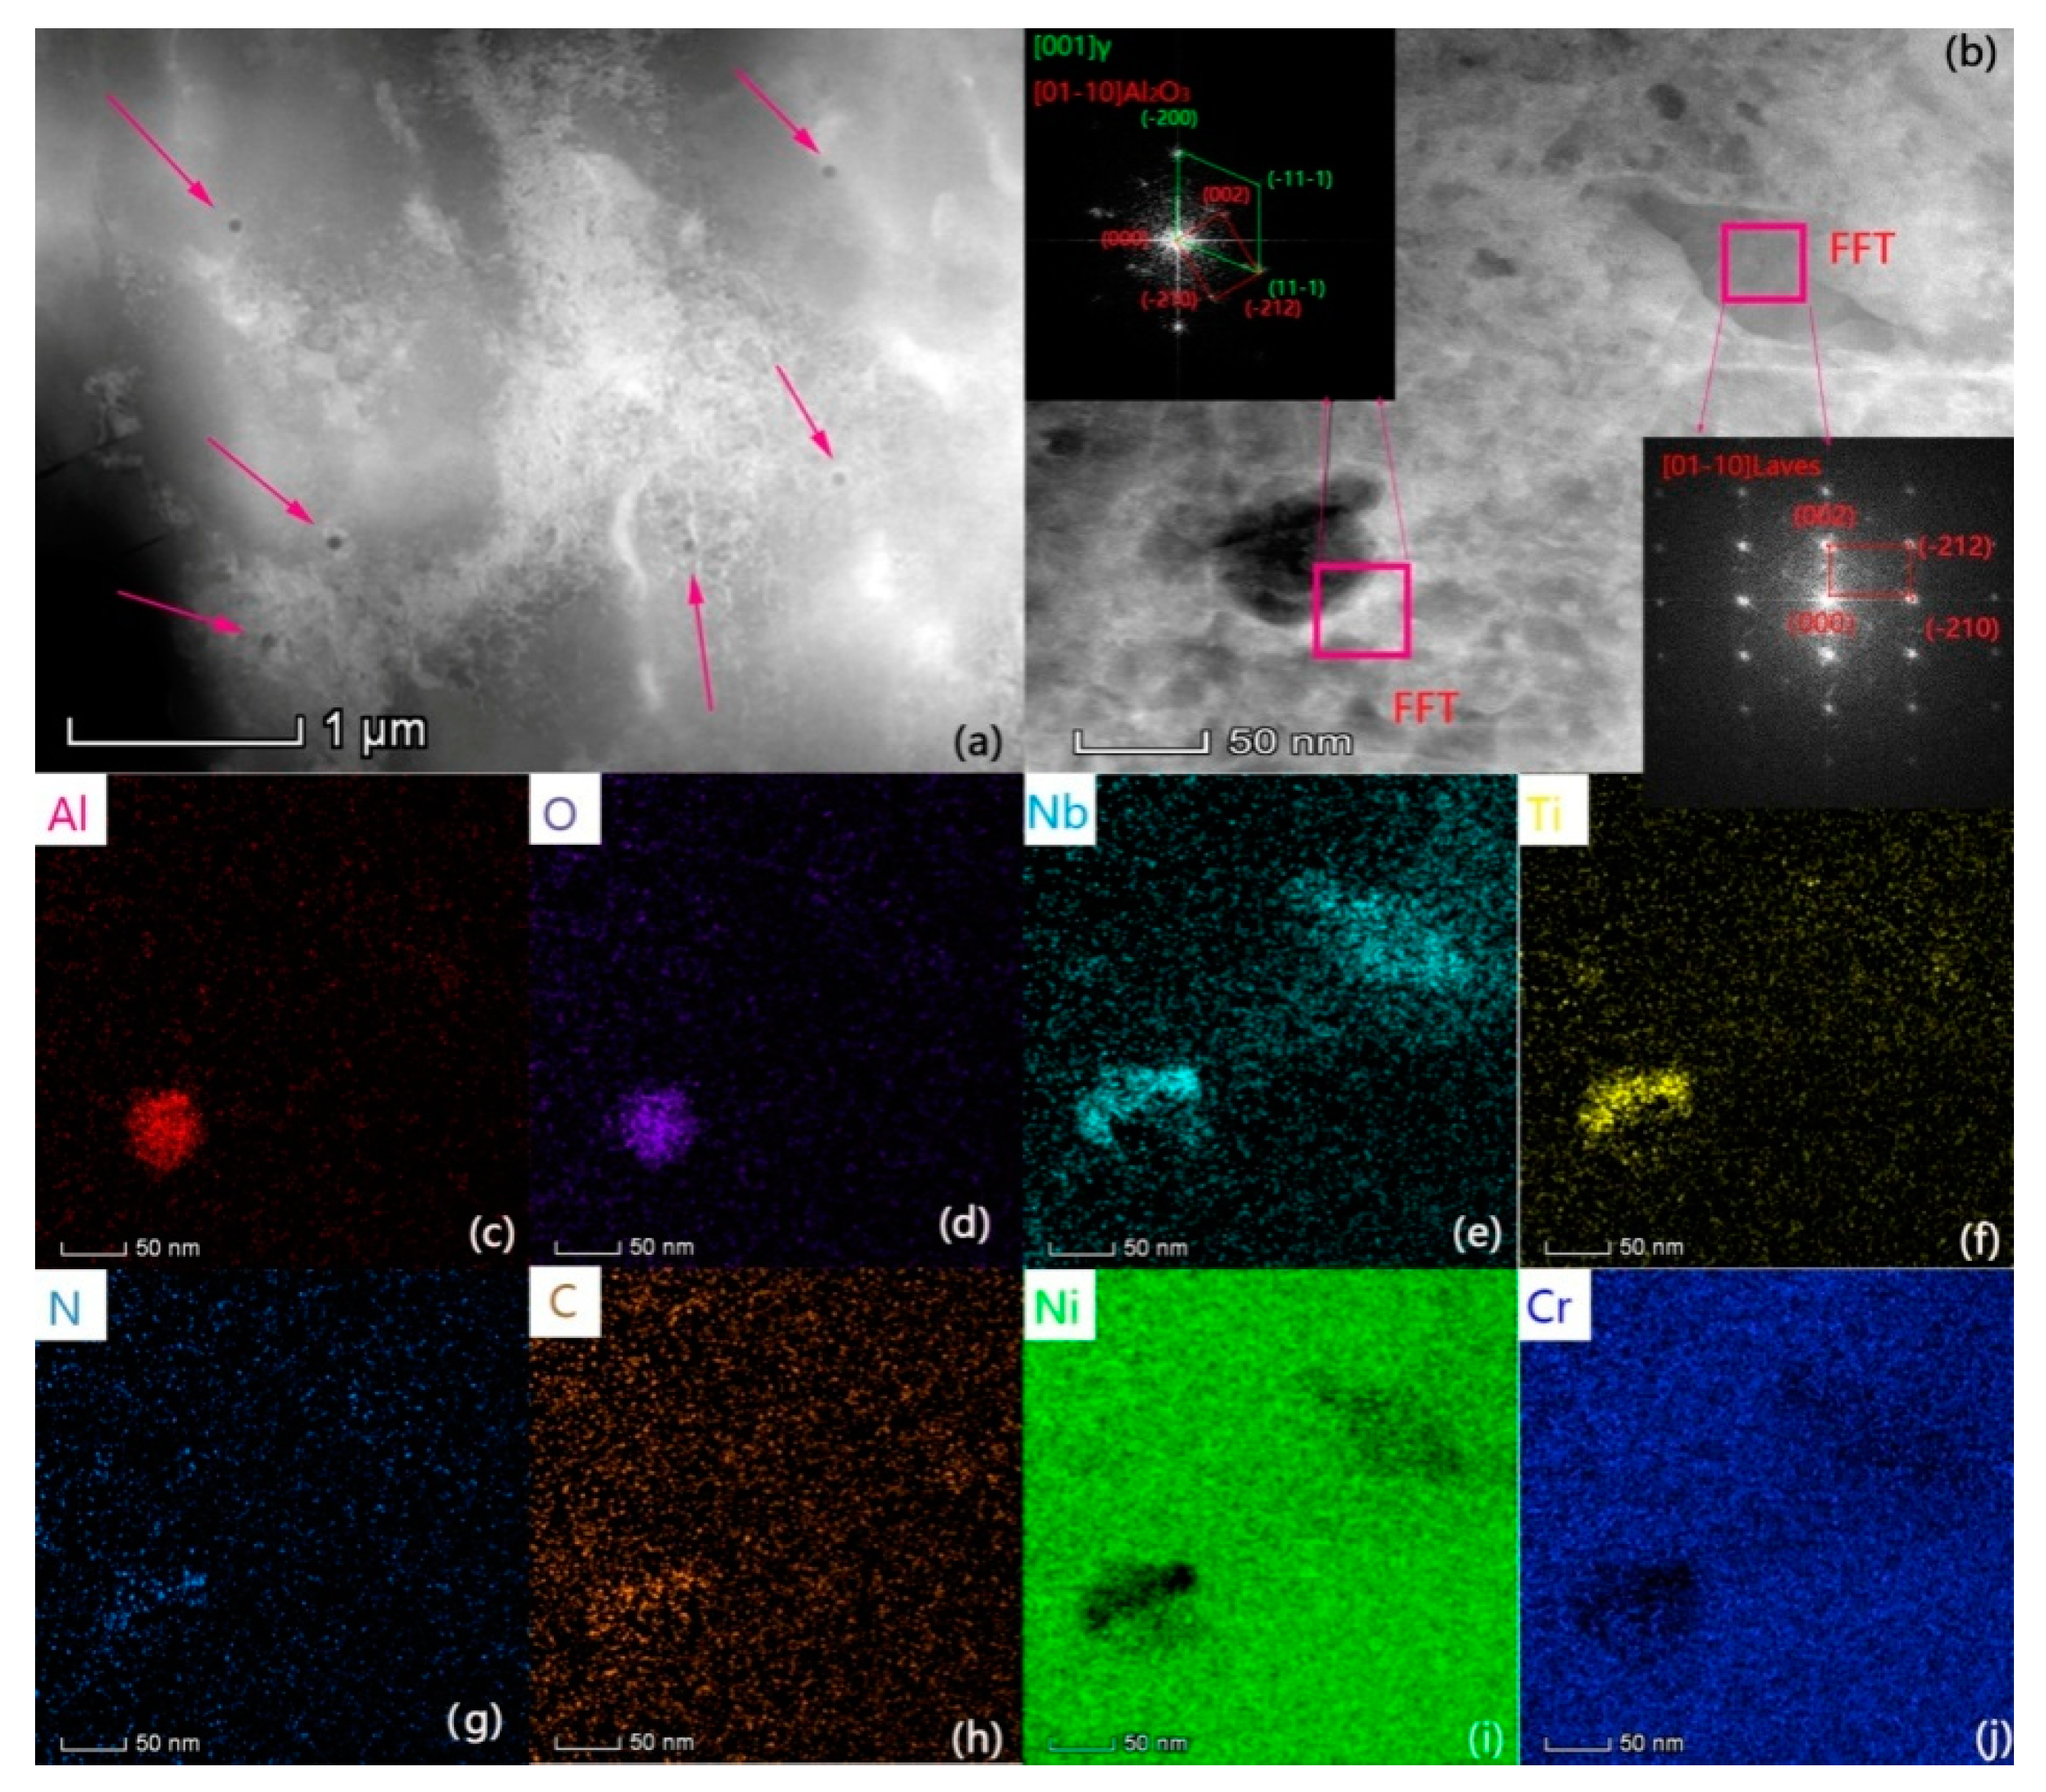
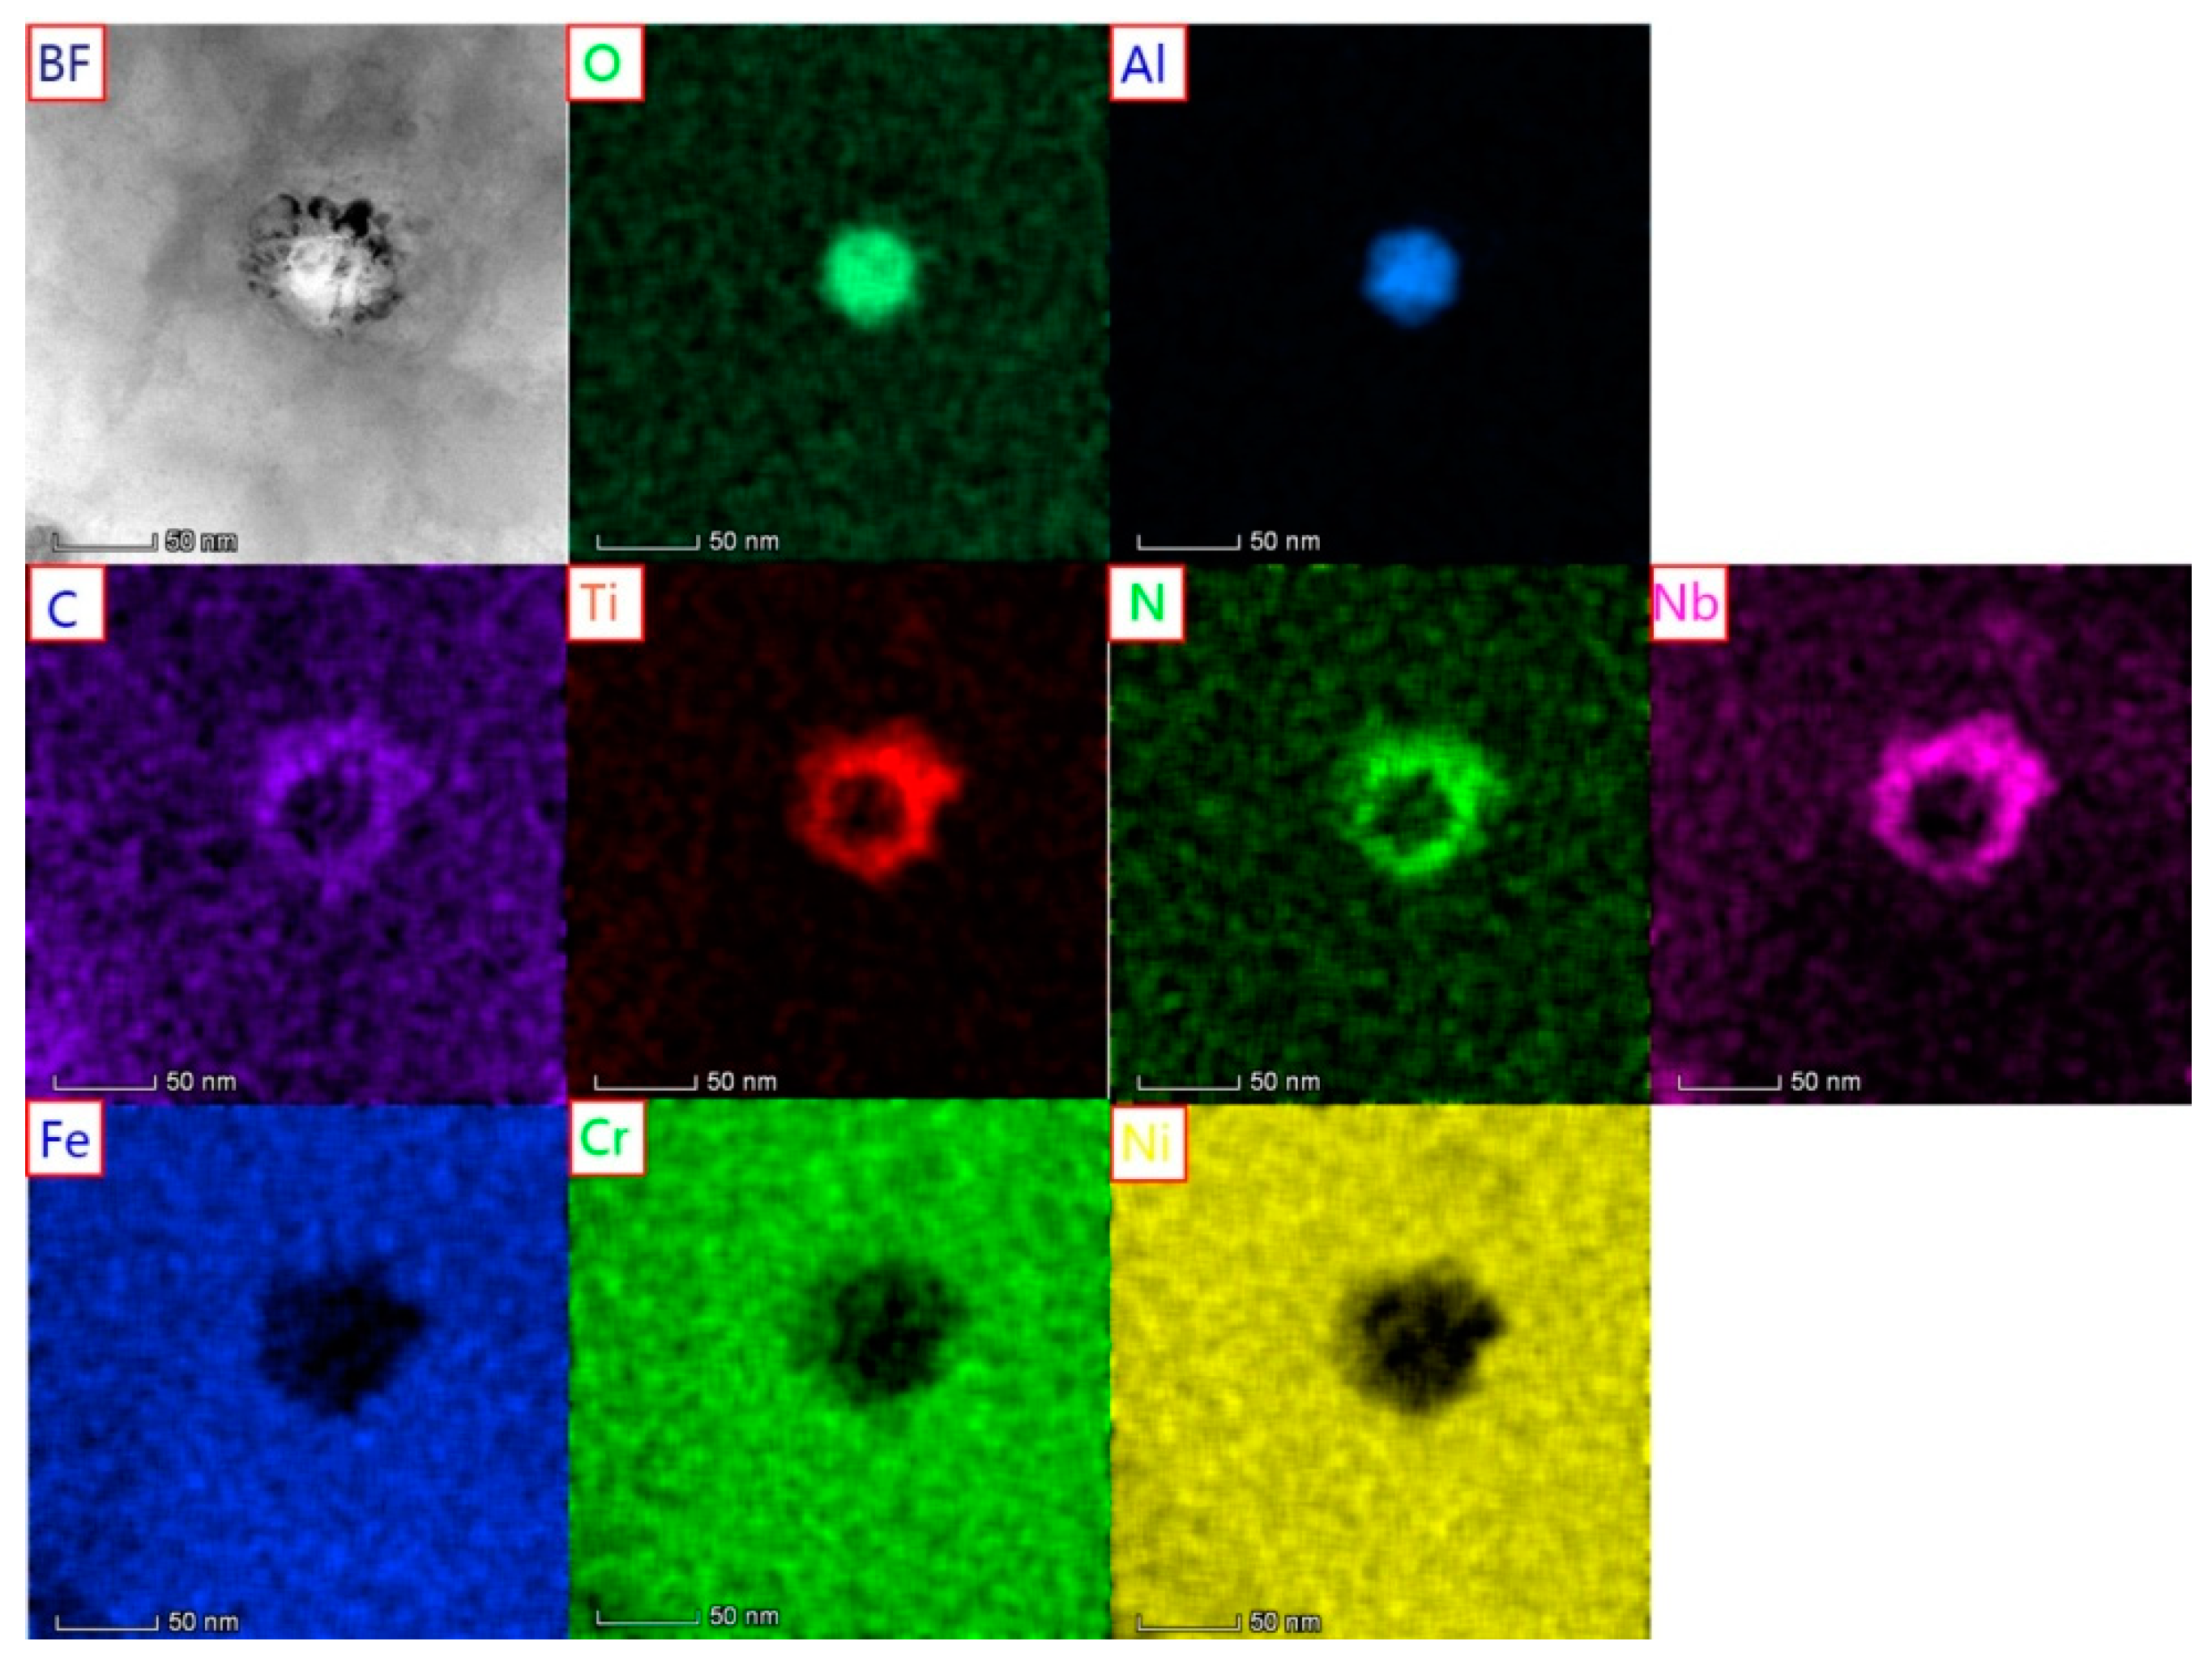
From Figure 3b, the first dendrite arm space (FDAS) can be measured as 1–1.5 µm, but compared with the direct laser fabricated process, the FDAS is about 5–8 µm [14,15]. The FADS is finer in the SLM sample due to the smaller melting pool and more rapid solidification rate. As for the cast process, the FDAS is approximately 10 µm–40 µm, [16] and all the FDAS is proved to be affected by the cooling rate. Hunt has set a model to estimate the cooling rate by quantitative analysis of the FDAS as follows [17]:
λ = a ε b
λ is the FDAS, a and b are material constants, and ε is the cooling rate. For nickel-based superalloys, a 50 μ m ( K / s ) , b = 1 3 [17]. After calculation, the cooling rate is in the magnitude of 106 K/s, which is supposed to be extremely higher compared to the cooling rate of DLF process of (103–105 K) [14,15], which has also been found in the simulation of SLM processing.

3.3. Precipitates

Figure 3 clearly reveals the highlighted precipitates in the interdendritic regions. These bulk precipitates distribute along the boundaries the cellular structure or interdendritic regions. The XRD spectra depicted in Figure 4 are consistent with solid solution γ (Ni, Cr, Fe) with face-centered cubic structure with lattice constant a = 0.352 nm. No other peak was detected from the XRD result. The missing diffraction peak could be either peak overlapping with the matrix or a small amount of some unknown phase which cannot detected by the XRD results. The spectra of the γ″ phase of Ni3Nb with a body-centered tetragonal structure could coincide with the γ spectra of (200) (220) and the spectra of the γ′ precipitate of Ni3 (Al, Ti) with face-centered cubic structure overlapping with the γ spectra of (111)(200)(220). Whether the highlight precipitates are the strengthening phase or not, further observations by TEM are essential to analyze the matrix and precipitates.
Figure 5a shows the irregular bulk precipitates distributed along the grain boundary and sub-grain boundary. Figure 5b is the high resolution TEM image of one of the precipitates along the grain boundary, with a width of 25 nm and length of 80 nm. From the Fast Fourier Transform (FFT) result (Figure 5c) of the picked area in Figure 5b in the red square, the structures of the matrix and the precipitates are indexed. The matrix is a face-centered cubic structure according to the standard electron diffraction pattern along [001] zone axis, and the precipitate is a close-packed hexagonal structure according to the standard electron diffraction pattern along [–24–23] zone axis. The [–24–23] zone axis of the precipitate is parallel to the [001] zone axis of the matrix. Combined with the element distribution mapping in Figure 5d–h, this precipitate is enrichment of Nb and Mo, and depletion of Fe, Cr, and Ni. According to References [18,19,20,21], the precipitate can be confirmed as the Laves phase, which is generally accepted to be the form of (Fe,Ni,Cr)2(Nb,Mo,Ti). It is a eutectic with the matrix. The continuous bulk Laves phase is proved to be detrimental to the high-temperature property of the matrix [22], which should be dissolved after the following heat-treatment process, since the element Nb has the lower value of partition coefficient, making it more likely to be trapped in the liquid phase during solidification process. The dendrite core is primarily solidified from the liquid and the element Nb is pushed into the liquid phase from the solid–liquid interface. With the solidification process developed, the Nb is left in the interdendrite areas and grain boundaries to form the eutectic of Laves phase. It is understandable why the Laves phase precipitates along the interdendrite areas and grain boundaries. Since the dimension of the Laves is small, it could not be detected from the XRD result.
However, there are also some regular precipitates in the dendrite core area. Figure 6a is the high resolution TEM image of the square precipitate. Figure 6b is the FFT of the red square region in Figure 6a from which the precipitate is indexed to be a face-centered structure, and the FFT pattern is along [011] zone axis. The element content mapping shows that this precipitate is enrichment of Nb, Ti, C, N, and no Ni, Cr, Fe are included in it. Further, according to Reference [23], this regular phase is the carbonitride with the chemical formulae of (Ni, Ti) (C,N), usually in the form of MX. For directionally solidified superalloys, it has been reported that block carbides nucleate on stable TiN during the re-melting process [24].
Other nanoscale precipitates were also found to distribute in the interdendritic regions and the dendrite core. The arrows in Figure 7a show the spherical particle precipitates in the bright field image. Figure 7b is the high-resolution TEM image of one of the spherical particles in Figure 7a. The diameter of the spherical particle is about 50 nm. In addition, an irregular precipitate enriched with Nb and Mo is also in this visual, combined with the FFT of the irregular precipitate, which has indicated that it is a close-packed hexagonal structure from the [01–10] zone axis. This phase is the Laves phase, as we have already identified. The FFT result in Figure 7b of the spherical phase is a FFT pattern of a face-centered cubic structure from the [01–10] zone axis.
According to the element distribution mapping, this spherical particle, containing Al and O, is Al2O3. It is worth noting that this spherical particle is half surrounded by the precipitates consisting of Nb, Ti, N, and C from Figure 7e–h, which have been certified to be (Nb, Ti)(N,C) in Figure 6 already. This phenomenon is not accidental. Figure 8 shows the same circumstance, in which the carbonitride entirely surrounds the Al2O3. The rapid solidification process is a nonequilibrium process, and the focused laser beam melts the powder into liquid, and the liquid fast solidifies into solid. All the process is under the protection of argon gas, and the oxygen of the Al2O3 is from the water vapor of the powder, even though it has been dried before using. The element Al is easy to oxidize. So, the nanoscale Al2O3 is prone to form. As for the surrounding MX, there are two kinds of hypothesis in this paper: (1) Al2O3 serves as the heterogeneous nucleating agent of the MX. However, this Al2O3 and MX have different crystal structures, and no coherent interfaces are detected in this shell structures. (2) The melting point of Al2O3 is about 2303 K, which means the Al2O3 will precipitate from the liquid in the first, and the interface between the Al2O3 and the matrix accumulates a huge interfacial energy, which will provide the driving force of the MX to nucleate. These shell structures will be the most stable structure to form. The composite Al2O3 and MX have also been found in carbon steel.
Above all, the solidification process of SLMed IN718 can be estimated to be L γ + L a v e s + M X , which is in accordance with the research [25]. Phases in the as-deposited IN718 fabricated by selective laser melting are the matrix, Laves, carbonitride, and Al2O3, and there is no γ′ and γ″ being detected. The Laves phase and MX have exhausted a lot of Nb, which inhibits γ′ and γ″ from precipitating. The heat effect of following tracks on the previous layer is not high enough to form the γ′ and γ″ phase. In References [26,27], they have found the strengthening phase γ′ and γ″ in as-deposited IN718 sample made by direct laser forming (DLF) and electron beam melting (EBM), and confirm the temperature of manufacturing process can reach approximately 950 °C according to the following layers’ heat input, which equals the aging process of the previous layers. It is not suitable for this research, due to the different heat input of the SLM process and DLF process. Figure 9 is the simulation result of the temperature of the middle point in layers 1–6. The simulation result shows that the temperature of layer 1 will go down to 500 °C–600 °C when the deposition of layer 6 is finished. According to Reference [28], the TTT diagram of IN718 [28], during this temperature interval, requires one hour to form γ′ and γ″. The temperature of layer 1 is dropped by the rate of 10 °C/s. After one hour, the temperature of this layer will drop to room temperature, so no γ′ and γ″ will be formed in this process.

4. Conclusions

A selective laser melting process is employed to fabricate the IN718 sample. The sample shows the elongated columnar grain to the building directly in the XZ section. The microstructure of the SLMed sample consists of cell structure and cellular dendrite with the FDAS of 1–1.5 µm. From the FDAS, the cooling rate of this process can be estimated as 106 K/S. The precipitations are comprised of Laves and carbon nitrides, and the nanoscale Al2O3 is also detected, which is surrounded by the carbonitrides partly or fully. The shell structure of the Al2O3–carbonitride is supposed to be such that the Al2O3 is beneficial to the nucleation of the MX. No strengthening phases, such as γ′ and γ″, are observed, which means that the following heat input to the previous layers has not yet reached the aging temperature and time to trigger the solid-state transformation in this proceeding manufacturing process.

Author Contributions

This paper reports part of the Ph.D work of Y.C. prepared under the supervision of P.B. Y.C. and F.L. designed and performed the experiments. P.B. and X.H. helped her to analysis the data and improve the experiments. Y.C. wrote the paper in the present form. P.B. and X.H. reviewed this paper.

Funding

This paper was supported by the National Natural Science Foundation of China (No.11672140) and the postgraduate Innovation Founding Project of Inner Mongolia autonomous region. (No. B2018111928).

Conflicts of Interest

The authors declare no conflict of interest.

References

  1. Amato, K.N.; Gaytan, S.M.; Murr, L.E.; Martinez, E.; Shindo, P.W.; Hernandez, J.; Collins, S.; Medina, F. Microstructures and mechanical behavior of Inconel 718 fabricated by selective laser melting. Acta Mater. 2012, 60, 2229–2239. [Google Scholar] [CrossRef]
  2. Chlebus, E.; Gruber, K.; Kuźnicka, B. Effect of heat treatment on the microstructure and mechanical properties of Inconel 718 processed by selective laser melting. Mater. Sci. Eng. A 2015, 639, 647–655. [Google Scholar] [CrossRef]
  3. Tillmann, W.; Schaak, C.; Nellesen, J.; Schaper, M.; Aydinöz, M.E.; Hoyer, K.P. Hot isostatic pressing of IN718 components manufactured by selective laser melting. Addit. Manuf. 2017, 13, 93–102. [Google Scholar] [CrossRef]
  4. Frazier, W.E. Metal Additive Manufacturing: A Review. J. Mater. Eng. Perform. 2014, 23, 1917–1928. [Google Scholar] [CrossRef]
  5. Fayazfar, H.; Salarian, M.; Rogalsky, A.; Sarker, D.; Russo, P.; Paserin, V.; Toyserkani, E. A critical review of powder-based additive manufacturing of ferrous alloys: Process parameters, microstructure and mechanical properties. Mater. Des. 2018, 144, 98–128. [Google Scholar] [CrossRef]
  6. Olakanmi, E.O.; Cochrane, R.F.; Dalgarno, K.W. A review on selective laser sintering/melting (SLS/SLM) of aluminium alloy powders: Processing, microstructure, and properties. Prog. Mater. Sci. 2015, 74, 401–477. [Google Scholar] [CrossRef]
  7. Wang, Z.; Guan, K.; Gao, M.; Li, X.; Chen, X.; Zeng, X. The microstructure and mechanical properties of deposited-IN718 by selective laser melting. J. Alloy. Compd. 2012, 513, 518–523. [Google Scholar] [CrossRef]
  8. Zhang, D.; Niu, W.; Cao, X.; Liu, Z. Effect of standard heat treatment on the microstructure and mechanical properties of selective laser melting manufactured Inconel 718 superalloy. Mater. Sci. Eng. A 2015, 644, 32–40. [Google Scholar] [CrossRef]
  9. Ni, M.; Chen, C.; Wang, X.; Wang, P.; Li, R.; Zhang, X.; Zhou, K. Anisotropic tensile behavior of in situ precipitation strengthened Inconel 718 fabricated by additive manufacturing. Mater. Sci. Eng. A 2017, 701, 344–351. [Google Scholar] [CrossRef]
  10. Tian, Y.; Muñiz-Lerma, J.A.; Brochu, M. Nickel-based superalloy microstructure obtained by pulsed laser powder bed fusion. Mater. Charact. 2017, 131, 306–315. [Google Scholar] [CrossRef]
  11. Kuo, Y.L.; Horikawa, S.; Kakehi, K. The effect of interdendritic δ phase on the mechanical properties of Alloy 718 built up by additive manufacturing. Mater. Des. 2017, 116, 411–418. [Google Scholar] [CrossRef]
  12. Gäumann, M.; Henry, S.; Cléton, F.; Wagniere, J.D.; Kurz, W. Epitaxial laser metal forming: Analysis of microstructure formation. Mater. Sci. Eng. A 1999, 271, 232–241. [Google Scholar] [CrossRef]
  13. Kurz, W.; Bezenon, C.; Gumann, M. Columnar to equiaxed transition in solidification processing. Sci. Technol. Adv. Mater. 2008, 2, 185–191. [Google Scholar] [CrossRef]
  14. Dinda, G.P.; Dasgupta, A.K.; Mazumder, J. Laser aided direct metal deposition of Inconel 625 superalloy: Microstructural evolution and thermal stability. Mater. Sci. Eng. A 2009, 509, 98–104. [Google Scholar] [CrossRef]
  15. Tan, C.; Zhou, K.; Ma, W.; Zhang, P.; Liu, M.; Kuang, T. Microstructural evolution, nanoprecipitation behavior and mechanical properties of selective laser melted high-performance grade 300 maraging steel. Mater. Des. 2017, 134, 23–34. [Google Scholar] [CrossRef]
  16. Parimi, L.L.; Ravi, G.A.; Clark, D.; Attallah, M.M. Microstructural and texture development in direct laser fabricated IN718. Mater. Charact. 2014, 89, 102–111. [Google Scholar] [CrossRef]
  17. Griffith, M.L.; Ensz, M.T.; Puskar, J.D.; Robino, C.V.; Brooks, J.A.; Philliber, J.A.; Smugeresky, J.E.; Hofmeister, W.H. Understanding the Microstructure and Properties of Components Fabricated by Laser Engineered Net Shaping (LENS). MRS Online Proc. Lib. Arch. 2000, 625. [Google Scholar] [CrossRef] [Green Version]
  18. Li, S.; Wei, Q.; Shi, Y.; Zhu, Z.; Zhang, D. Microstructure Characteristics of Inconel 625 Superalloy Manufactured by Selective Laser Melting. J. Mater. Sci. Technol. 2015, 31, 946–952. [Google Scholar] [CrossRef]
  19. Ling, L.; Han, Y.; Zhou, W.; Gao, H.; Shu, D.; Wang, J.; Kang, M.; Sun, B. Study of Microsegregation and Laves Phase in INCONEL718 Superalloy Regarding Cooling Rate During Solidification. Metall. Mater. Trans. A 2015, 46, 354–361. [Google Scholar] [CrossRef]
  20. Xiao, H.; Li, S.M.; Xiao, W.J.; Li, Y.Q.; Cha, L.M.; Mazumder, J.; Song, L.J. Effects of laser modes on Nb segregation and Laves phase formation during laser additive manufacturing of nickel-based superalloy. Mater. Lett. 2016, 188, 260–262. [Google Scholar] [CrossRef]
  21. Long, Y.T.; Nie, P.L.; Li, Z.G.; Huang, J.; Xiang, L.I.; Xu, X.M. Segregation of niobium in laser cladding Inconel 718 superalloy. Trans. Nonferrous Met. Soc. China 2016, 26, 431–436. [Google Scholar] [CrossRef]
  22. Manikandan, S.G.K.; Sivakumar, D.; Rao, K.P.; Kamaraj, M. Laves phase in alloy 718 fusion zone—Microscopic and calorimetric studies. Mater. Charact. 2015, 100, 192–206. [Google Scholar] [CrossRef]
  23. Radhakrishna, C.; Rao, K.P.; Srinivas, S. Laves phase in superalloy 718 weld metals. J. Mater. Sci. Lett. 1995, 14, 1810–1812. [Google Scholar] [CrossRef]
  24. Mclean, M. Directionally Solidified Materials for High Temperature; Metals Society: Pittsburgh, PA, USA, 1983; pp. 158–165. [Google Scholar]
  25. Liu, Y.; Guo, Q.; Li, C.; Mei, Y.; Zhou, X.; Huang, Y.; Li, H. Recent progress on evolution of precipi-tates in inconel 718 superalloy. Acta Metall. Sin. 2016, 52, 1259–1266. [Google Scholar]
  26. Knorovsky, G.A.; Cieslak, M.J.; Headley, T.J.; Romig, A.D.; Hammetter, W.F. Inconel 718: A solidification diagram. Metall. Trans. A 1989, 20, 2149–2158. [Google Scholar] [CrossRef]
  27. Tian, Y.; McAllister, D.; Colijn, H.; Mills, M.; Farson, D.; Nordin, M.; Babu, S. Rationalization of Microstructure Heterogeneity in INCONEL 718 Builds Made by the Direct Laser Additive Manufacturing Process. Metall. Mater. Trans. A 2014, 45, 4470–4483. [Google Scholar] [CrossRef]
  28. Oradei-Basile, A.; Radavich, J.F. Superalloys718, 625, 706 and Various Derivatives; Structural Materials Division, The Minerals, Metals, and Materials Society: Warrendale, PA, USA, 1991; pp. 325–335. [Google Scholar]
Figure 1. Scanning strategy of the selective laser melting (SLM) processing.
Metals 09 01128 g001
Figure 2. The macrostructure of selective laser melted (SLMed) sample observed by the optical microscope (OM). (a) The magnification of XZ section (b) The magnification of XY section.
Metals 09 01128 g002
Figure 3. (a) Scanning electron microscopy (SEM) of one region of the XZ section of the sample. (b) Cellular dendrite. (c) node cell structure. (d) irregular cell structure. (e) elongated cell structure. (f) hexagonal cell structure. (gj) diagrammatic sketches of the undercooling of (cf), respectively.
Metals 09 01128 g003
Figure 4. X-ray diffraction (XRD) result of the XZ section of the sample.
Metals 09 01128 g004
Figure 5. (a) The transmission electron microscopy (TEM) image of the XZ section of the sample. (b) The high-resolution TEM image of the precipitate. (c) The fast Fourier transform (FFT) of the picked region in (b). (di) The element content distribution mapping on this visual field.
Metals 09 01128 g005
Figure 6. (a) The high-resolution transmission electron microscopy (TEM) image of the MX. (b) The fast Fourier transform (FFT) of the boxed region in (a). (ci) The element content distribution mapping on this visual field.
Metals 09 01128 g006
Figure 7. (a) the bright field image of the nanoparticles; (b) high-resolution transmission electron microscopy (HRTEM) image of one of the nanoparticles, embedded images are the fast Fourier transform (FFT) of boxed areas, respectively; (cj) the element content distribution on this visual field.
Metals 09 01128 g007
Figure 8. Bright-field transmission electron microscopy (TEM) image of the entrapped Al2O3 by MX and element distribution mapping in this field.
Metals 09 01128 g008
Figure 9. Simulation of temperature of the middle points of layers 1–6.
Metals 09 01128 g009
Table 1. Chemical composition of INCONEL 718 alloy (IN718) powder (mass fraction: %).
ElementAlTiCrFeNbMoNi
(wt%)0.61.019.718.45.13.0Bal.
Table 2. Selective laser melting (SLM) manufacturing parameters.
Laser powerScanning speedLaser spot diameterHatch spacingLayer thickness
350 W1000 mm/s0.1 mm0.2 mm0.04 mm

