Article

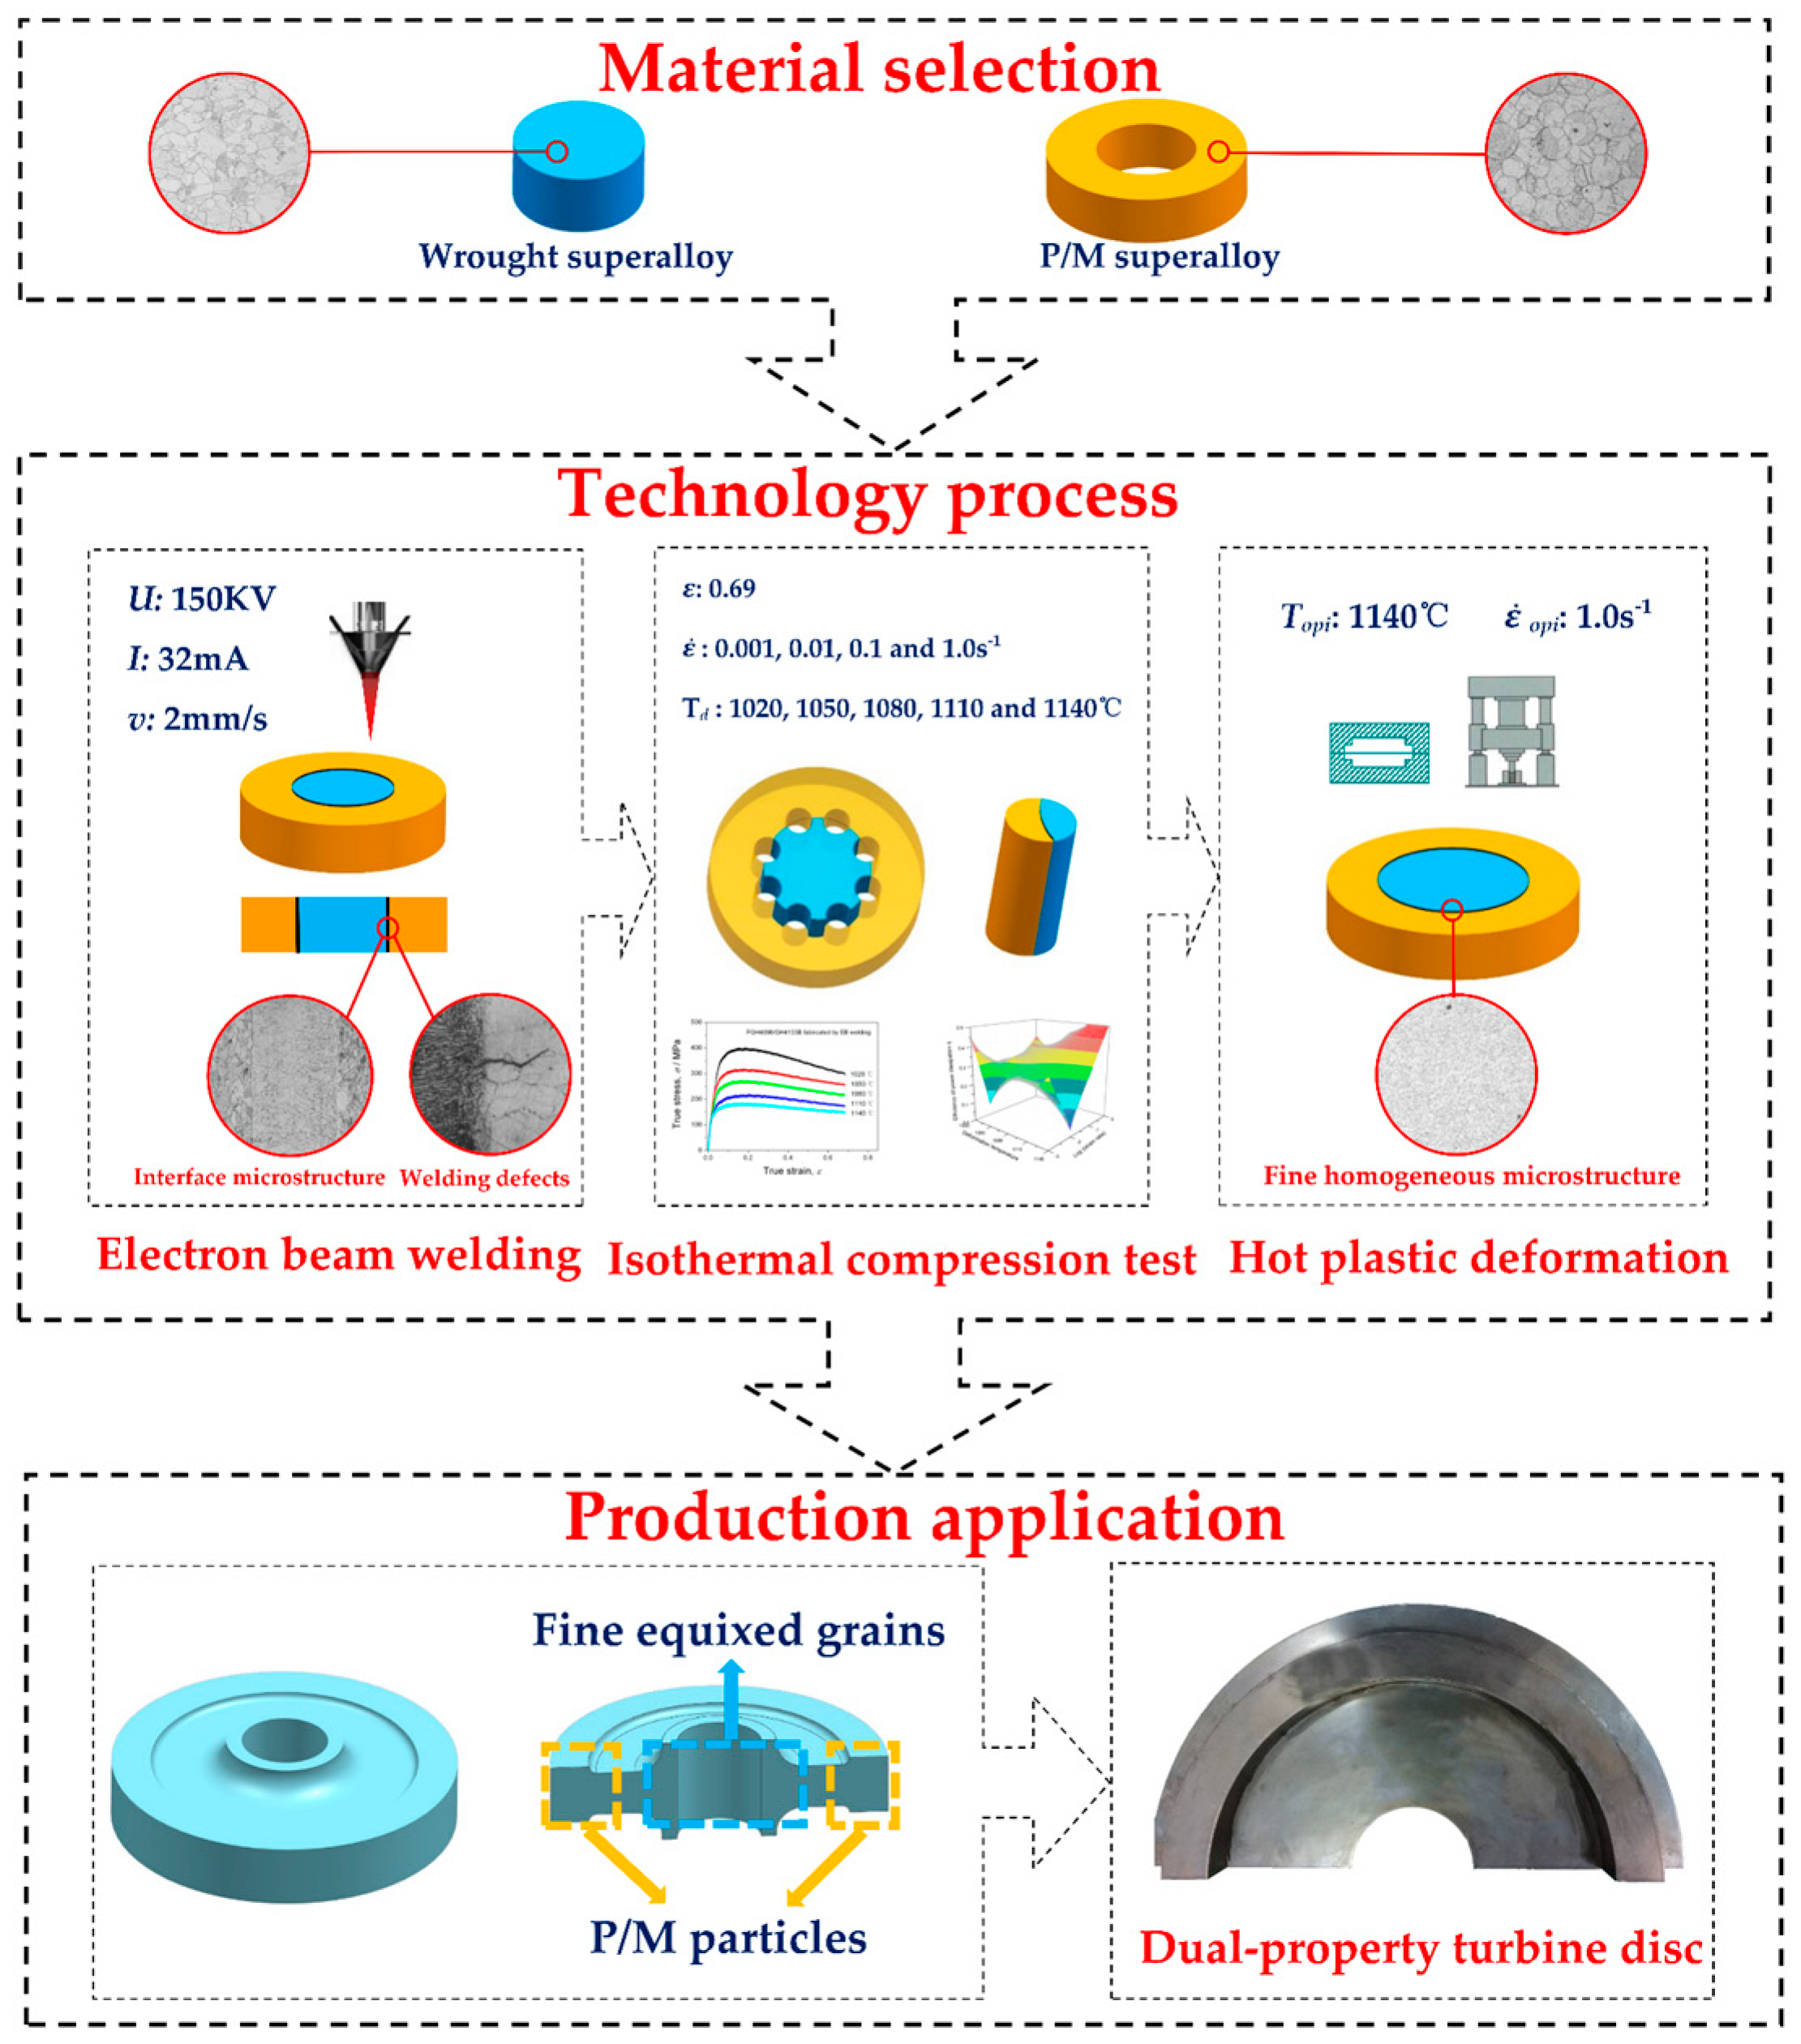
The Deformation Behavior, Microstructural Mechanism, and Process Optimization of PM/Wrought Dual Superalloys for Manufacturing the Dual-Property Turbine Disc

School of Materials Science and Engineering, Northwestern Polytechnical University, Xi’an 710072, China
*
Author to whom correspondence should be addressed.
Metals 2019, 9(10), 1127; https://doi.org/10.3390/met9101127
Submission received: 27 September 2019 / Revised: 18 October 2019 / Accepted: 18 October 2019 / Published: 21 October 2019
(This article belongs to the Special Issue The Behaviours of Alloys under Thermo-Mechanical Treatment)

Abstract

:
With the rapid development of modern aviation industry, dual-property turbine disc with fine comprehensive performance plays an important role in raising the thrust-to-weight ratio of the aero-engine. For manufacturing dual-property turbine disc, the powder metallurgy superalloy (PM) with excellent creep resistance was chosen as rim material, and the wrought superalloy with fine equiaxed grains was chosen as bore material. Electron beam welding was carried out on the PM/wrought dual superalloys. Hot compression tests were conducted on the PM/Wrought dual superalloys at temperatures of 1020–1140 °C and strain rates of 0.001–1.0 s−1. Deformation behavior and microstructure evolution have been investigated to study the deformation and recrystallization mechanism during hot deformation process. The results showed that PM/Wrought dual superalloy presents the similar flow behavior to single alloys and flow stress decreases significantly with the increase of deformation temperature or the decrease of strain rate. The apparent activation energy of deformation at the strain of 0.2 was determined as being 780.07 kJ·mol−1. The constitutive equation was constructed for modeling the hot deformation of PM/Wrought dual superalloy. Meanwhile, the processing map approach was further adopted to optimize the manufacturing process for the dual-property turbine disc. Additionally, a new instability criterion was proposed: the “cliff” and “valley” in the power dissipation map are determined as sufficient conditions for flow instability. The optimum processing parameter for manufacturing the PM/Wrought dual-property turbine disc can be obtained to enhance the mechanical properties, based on the analysis of processing map technology and microstructural mechanism.

1. Introduction

Turbine discs are usually the most critical engine components attracting the main research attention in the field of advanced manufacturing. As the major component in advanced aero-engines, the working circumstances of turbine disc are severe and special, owing to the different parts of the disc need to bear different working temperatures and stresses. For turbine disc, high mechanical strength and fatigue resistance are needed for the inner region, which works at a low temperature. Excellent fatigue life and crack growth resistance are required for the outer region, which works at a high temperature [1]. With the rapid development of modern aviation industry, dual-property turbine disc with fine comprehensive performance plays an important role in raising the thrust-to-weight ratio of the aero-engine.
Generally, it is an effective and reliable method to fabricate the dual-property turbine disc by welding. Electron beam welding is a useful emerging technology for joining and repairing aero-engine components because it has many advantages, such as small ratio between width and depth, narrow heat affected zone, and little weld thermal deformation [2,3]. During the electron beam welding process for nickel-based superalloys, solidification cracking occurs in the fusion zone. Meanwhile, the heat-affected zone may develop grain boundary liquation micro-fissuring [4]. Both of these outcomes are harmful to the mechanical properties of the electron beam weldments. Therefore, it is of great importance that the hot forging process should be conducted on the electron beam seam to solve the defects and improve the microstructure. Ning et al. [5] investigated the electron beam welding process of Ni-base superalloy GH4133B and found that the welding defects can be eliminated availably by the following hot plastic deformation process conducted on weldments. Qing et al. [6] explored the hot deformation behavior of the TC11/Ti−22Al−25Nb dual-alloy and obtained the optimum processing condition for the electron beam (EB) weldments during the hot working process.
In present research, the powder metallurgy superalloy (PM) with excellent creep resistance was chosen as rim material, and the wrought superalloy with fine equiaxed grains was chosen as bore material. The electron beam welding was carried out on the PM/Wrought dual superalloys. Cylindrical compression specimens were fabricated from the welding seam of the PM/Wrought structure, and then hot compression tests were conducted. Deformation behavior and microstructure evolution were systematically and deeply investigated to study the deformation and recrystallization mechanism under the thermal-mechanical coupling conditions, and processing map approach was further adopted to optimize the manufacturing process for the dual-property turbine disc.

2. Materials and Methods

Figure 1 schematically illustrates the main fabrication processes of dual-property turbine disc. Two specimens were machined with the same dimensions of 30 × 30 × 6 mm from as-received nickel-based superalloys. Mechanical polishing was conducted on the specimens to reduce their surface roughness before electron beam welding. The electron beam welding was carried out on the prepared specimens by using a KS55-G150 (IGM, Frankfurt, Germany) with the welding speed at 2 mm/s. The accelerating voltage was selected as 150 kV and the electron current was 32 mA. The compression specimen with diameter 8 mm and height 12 mm was machined from the welding seam of the PM/Wrought dual superalloy, which contains the base metal of PM superalloy, welding seam, and the base metal of wrought superalloy.
The isothermal compression tests were conducted using Gleebe-1500D thermo-simulation machine (DSI, America) at different deformation temperatures (1020, 1050, 1080, 1110, and 1140 °C) and different strain rates (0.001, 0.01, 0.1, and 1.0 s−1) with the height reduction selected as 50%. Specimens were heated up to the target temperature with the heating rate of 10 °C/s and then maintained for 3.0 min to achieve homogenize temperature distribution in the entire specimen. The true stress-strain data during the isothermal compression test were collected and recorded automatically. After compression, the deformed specimens were water-quenched instantly to retain the deformed microstructure. Then these specimens were wire-cut along the plane containing compression axis. After being ground and polished, the exposed surfaces were corroded with the chemical etchant of CuSO4 (10 g) + H2O2 (10 mL) + HCl (40 mL) + H2O (50 mL). Finally, the microstructure examination of compressed specimens was illustrated by using optical microscope (Olympus, Japan).
The typical microstructure of welding seam for PM/Wrought dual superalloy is given in Figure 2. It can be observed from Figure 2a that PM superalloy reveals previous particle boundaries (PPBs) network and wrought superalloy shows equiaxed microstructure. Meanwhile, there is dendrite microstructure in fusion zone. Therefore, the microstructure distribution at bonding interface of the PM/Wrought dual superalloy presents three different states, the transition of interfacial microstructure is not uniform. In addition, the optical micrograph at higher magnification shows no boundary between the base metal PM superalloy and the fusion zone (Figure 2b), which indicates that the interface between the previous particle boundary and dendrite is well connected macroscopically and the micro-mechanism deserves further exploration. Remarkably, an obvious boundary between the fusion zone and the base metal wrought superalloy can be seen from Figure 2c. At the interface, there may be some defects, such as micro-cracks, which can cause instability in the weldments, and it is extremely unfavorable for the mechanical properties of the PM/Wrought dual superalloy.

3. Results and Discussion

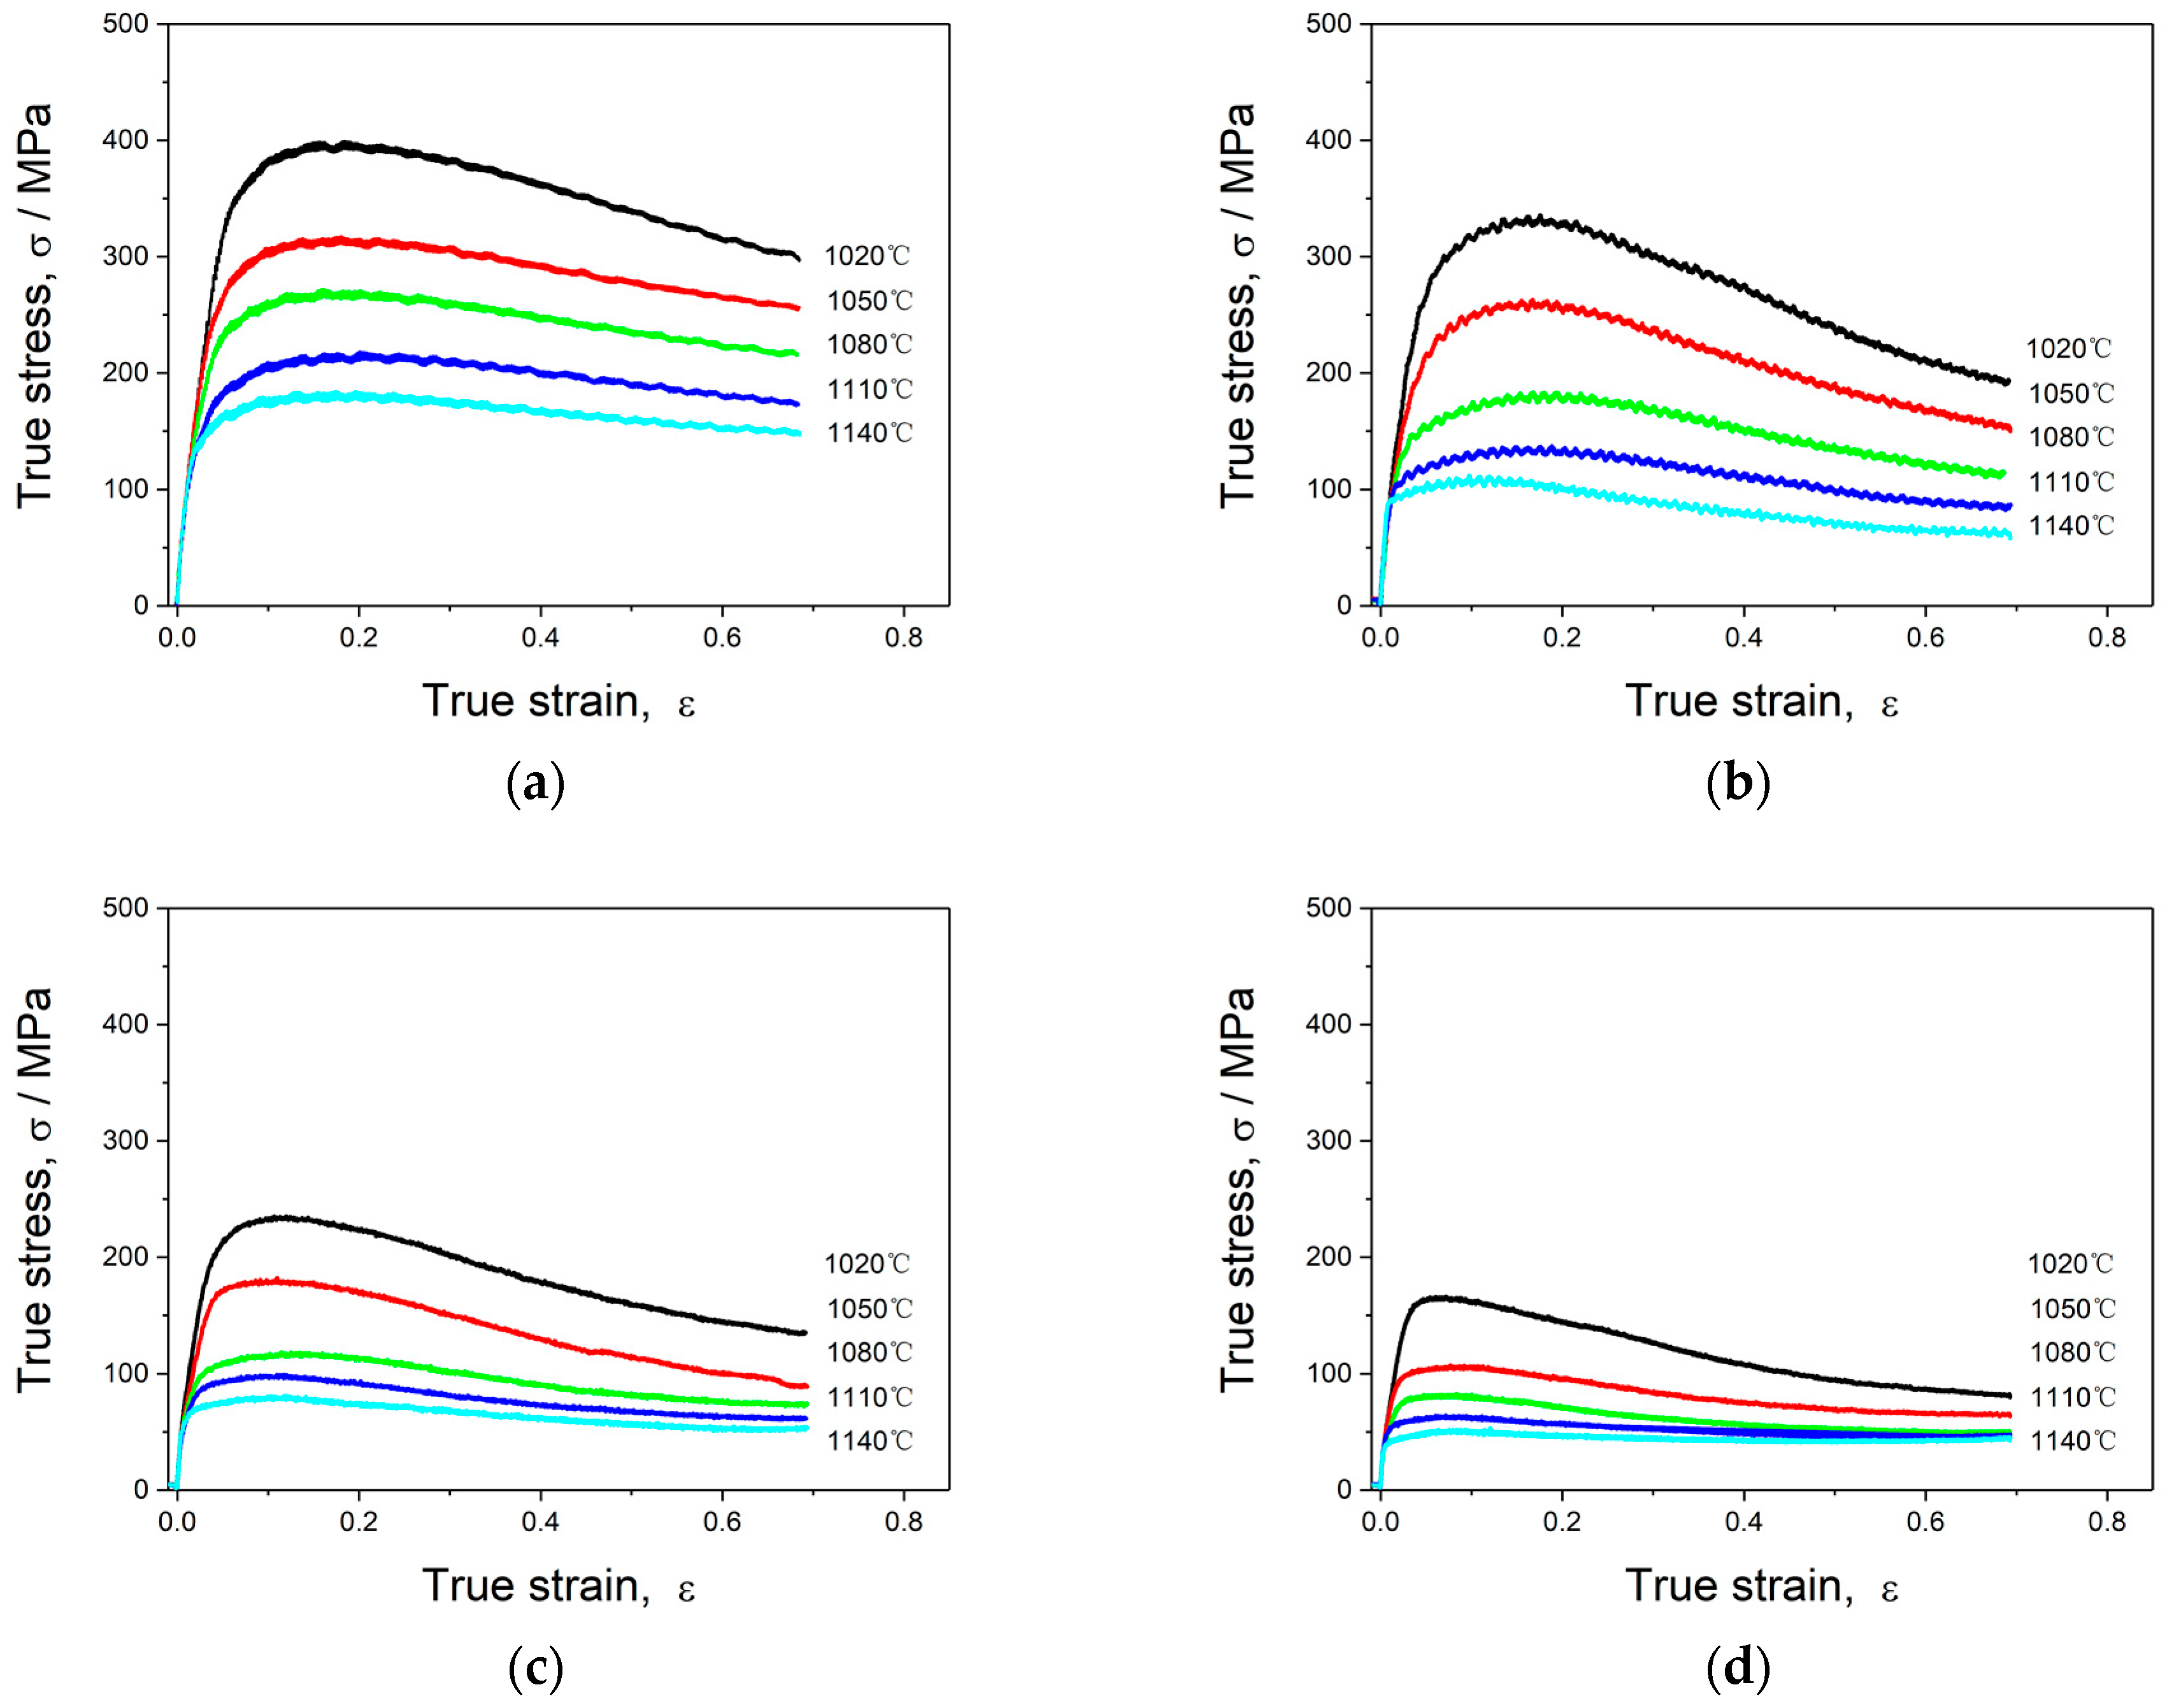
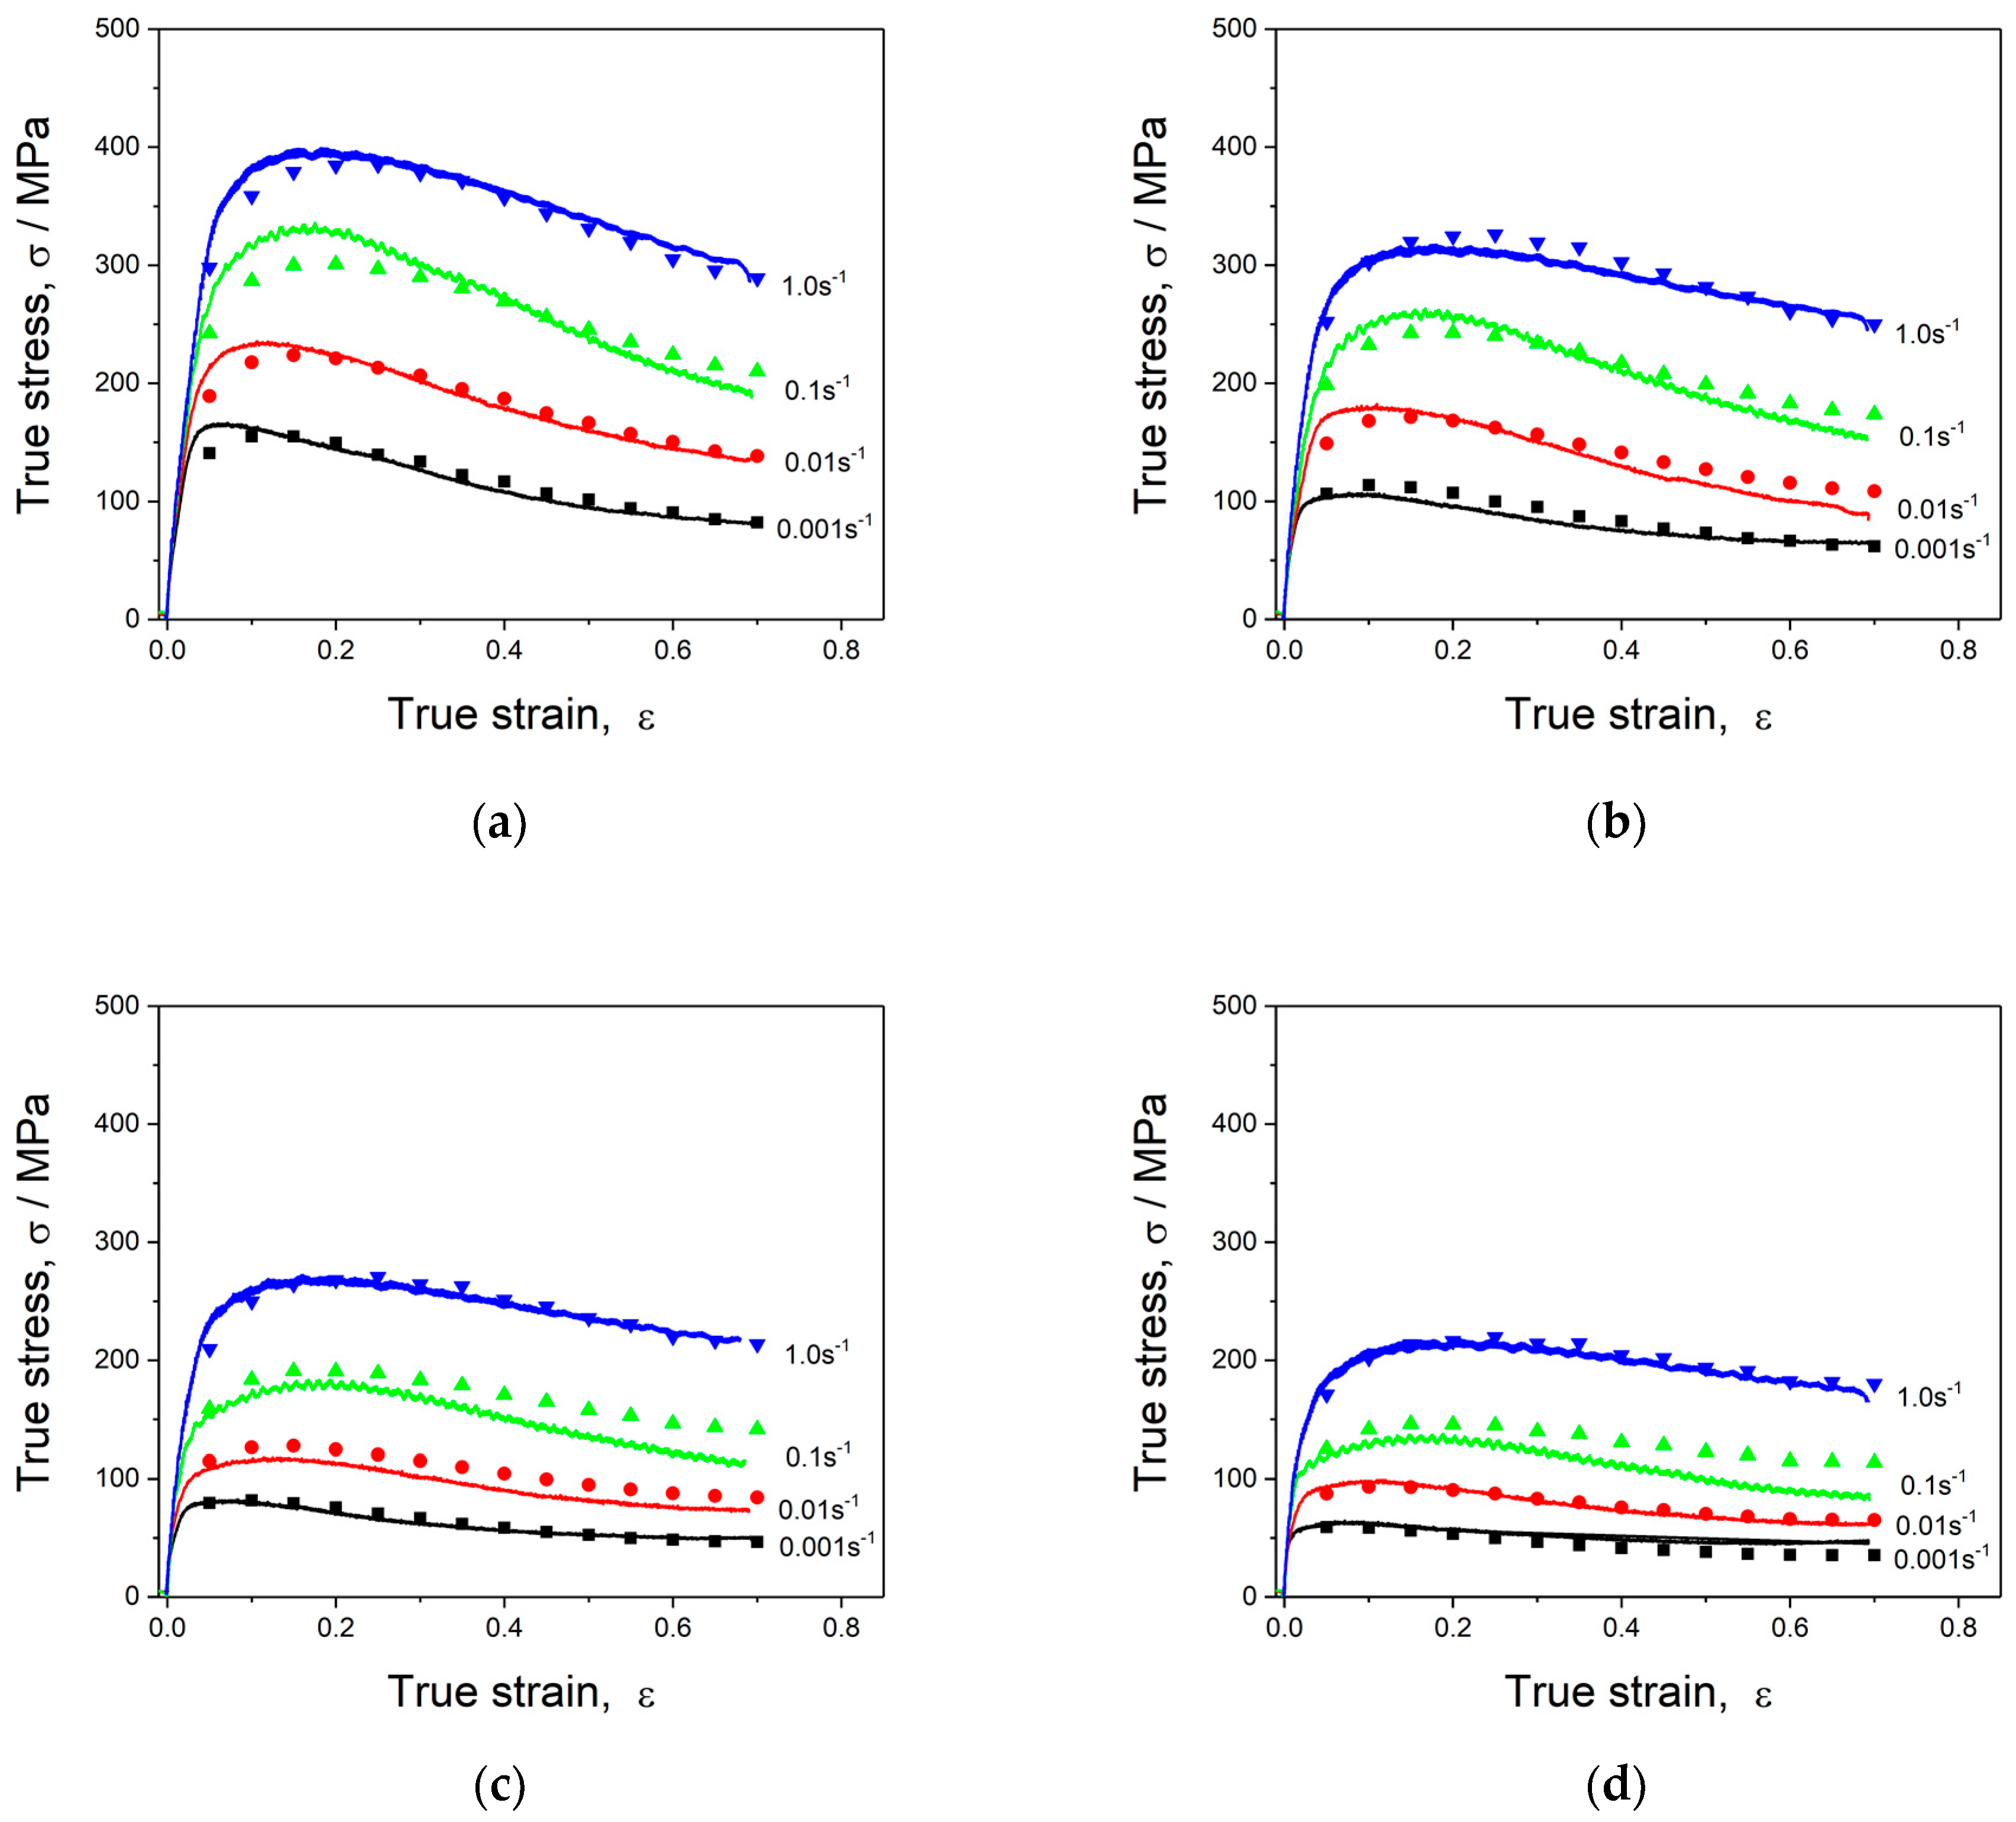
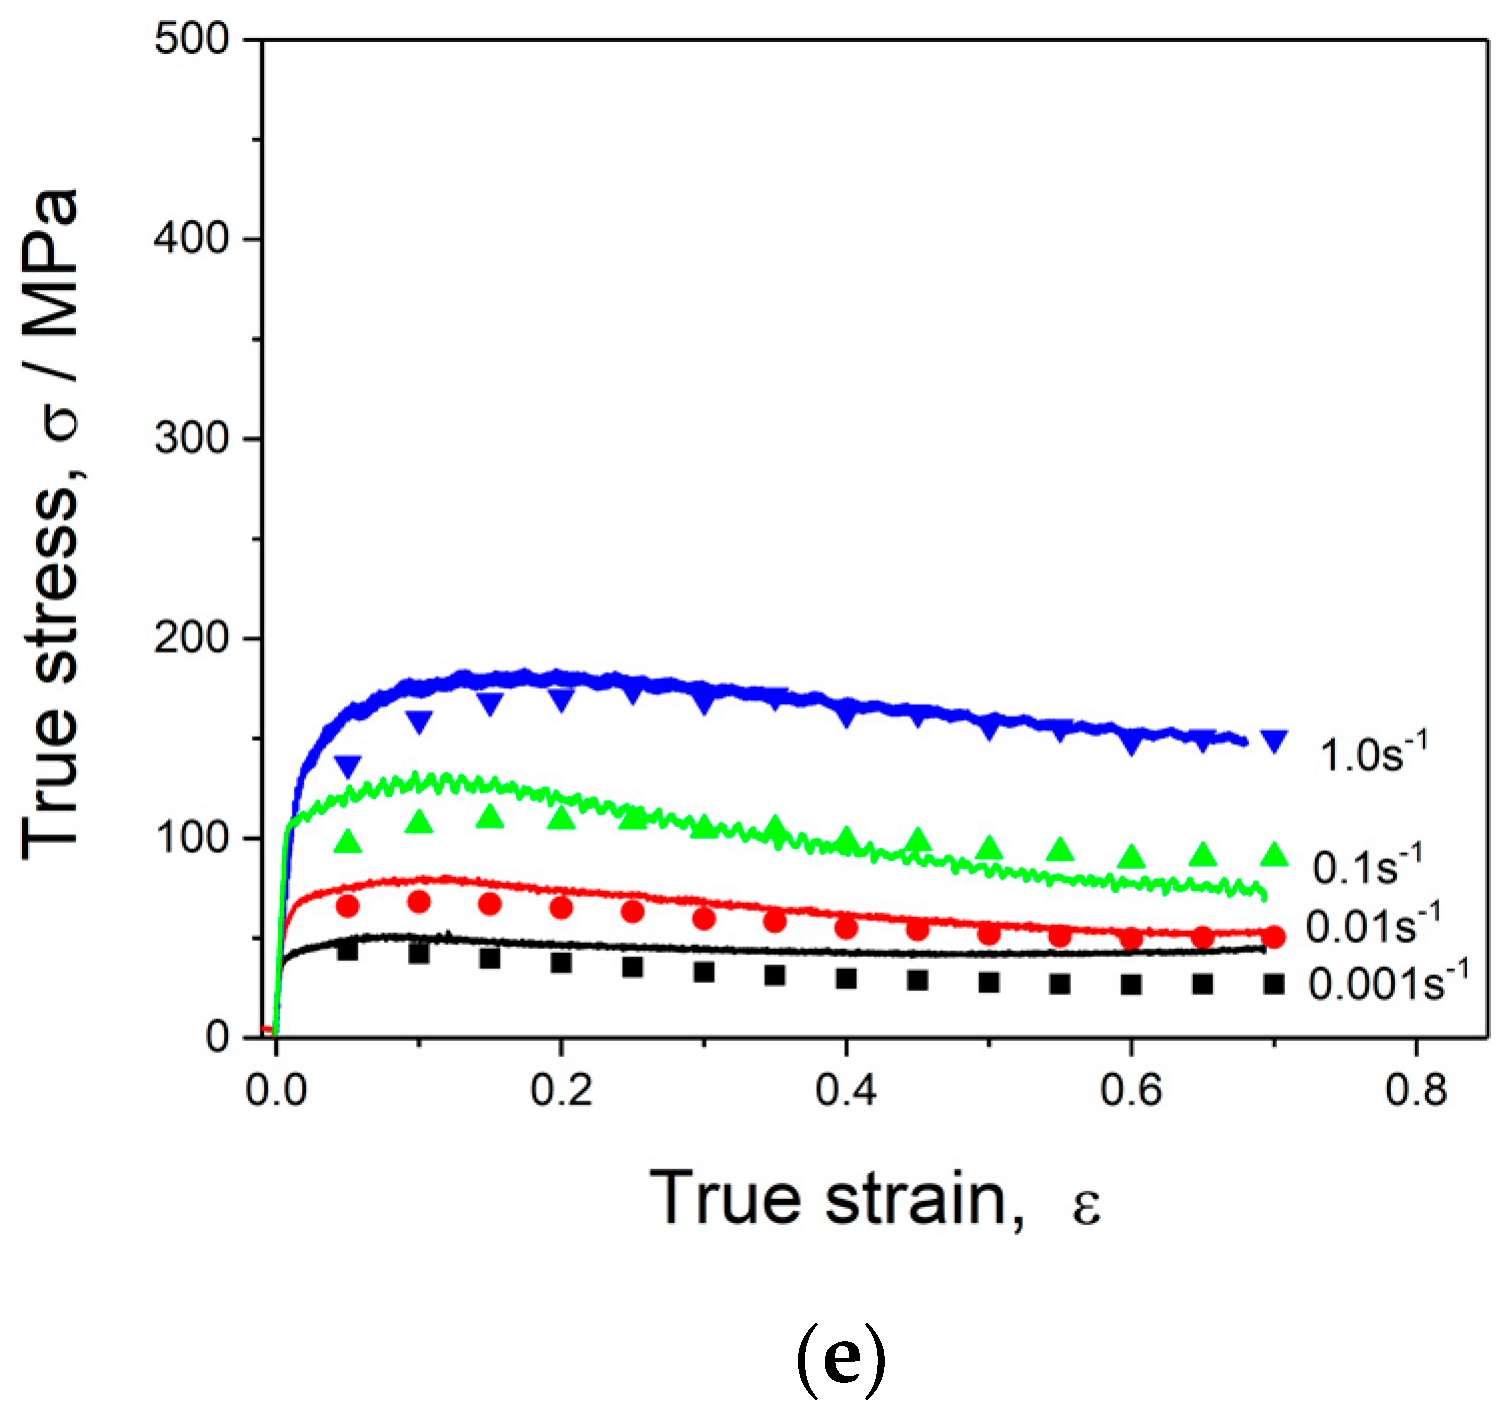
3.1. Flow Stress Behavior of PM/Wrought Dual Superalloy

Figure 3 demonstrates the true stress-strain curves of the PM/Wrought dual superalloy at different isothermal compression test conditions. The deformation temperature and strain rate have a significant effect on the true stress-strain curves, from which the inherent connection between the flow stress and deformation behavior can be systematically studied. The curvilinear trend of all flow stress curves is similar, both of them can be divided into three different parts, which are strain hardening stage, dynamic-softening stage, and relatively steady stage. In the initial stage of hot compression, the flow stress increases rapidly (almost linearly) until a peak value appears due to the generation and multiplication of dislocations, results in obvious strain hardening stage [7]. During the following stage, the flow stress progressively decreases as deformation proceeds. This feature of flow stress is related to the emergence of dynamic softening mechanisms (DRV and DRX) due to the cross-slip and climb of dislocation, which can partially neutralize the effect of strain hardening. At the high-strain zone, with the further accumulation of dislocation density, the DRX behavior is more sufficient and plays the major role in dynamic softening. Finally, the dynamic equilibrium between strain hardening and dynamic softening can be reached, leading to a relatively steady state of flow stress. In addition, it is noteworthy that the value of peak stress is sensitive to the strain rate and deformation temperature. At a specific deformation temperature, the peak stress increases following the increase of the strain rate. Under a relatively high strain rate, the shortening of the deformation time not only increases the strain hardening effect but also restrains the nucleation and growth of DRX grains. However, for a fixed strain rate, the peak stress generally decreases with the augmentation of the deformation temperature. As the deformation temperature increases, the kinetic energy of atoms increase due to the enhancement of thermal activation energy. Moreover, the critical cutting stress among atoms controlled through crystal slip decreases. Both of these outcomes lead to lower flow stress [8].

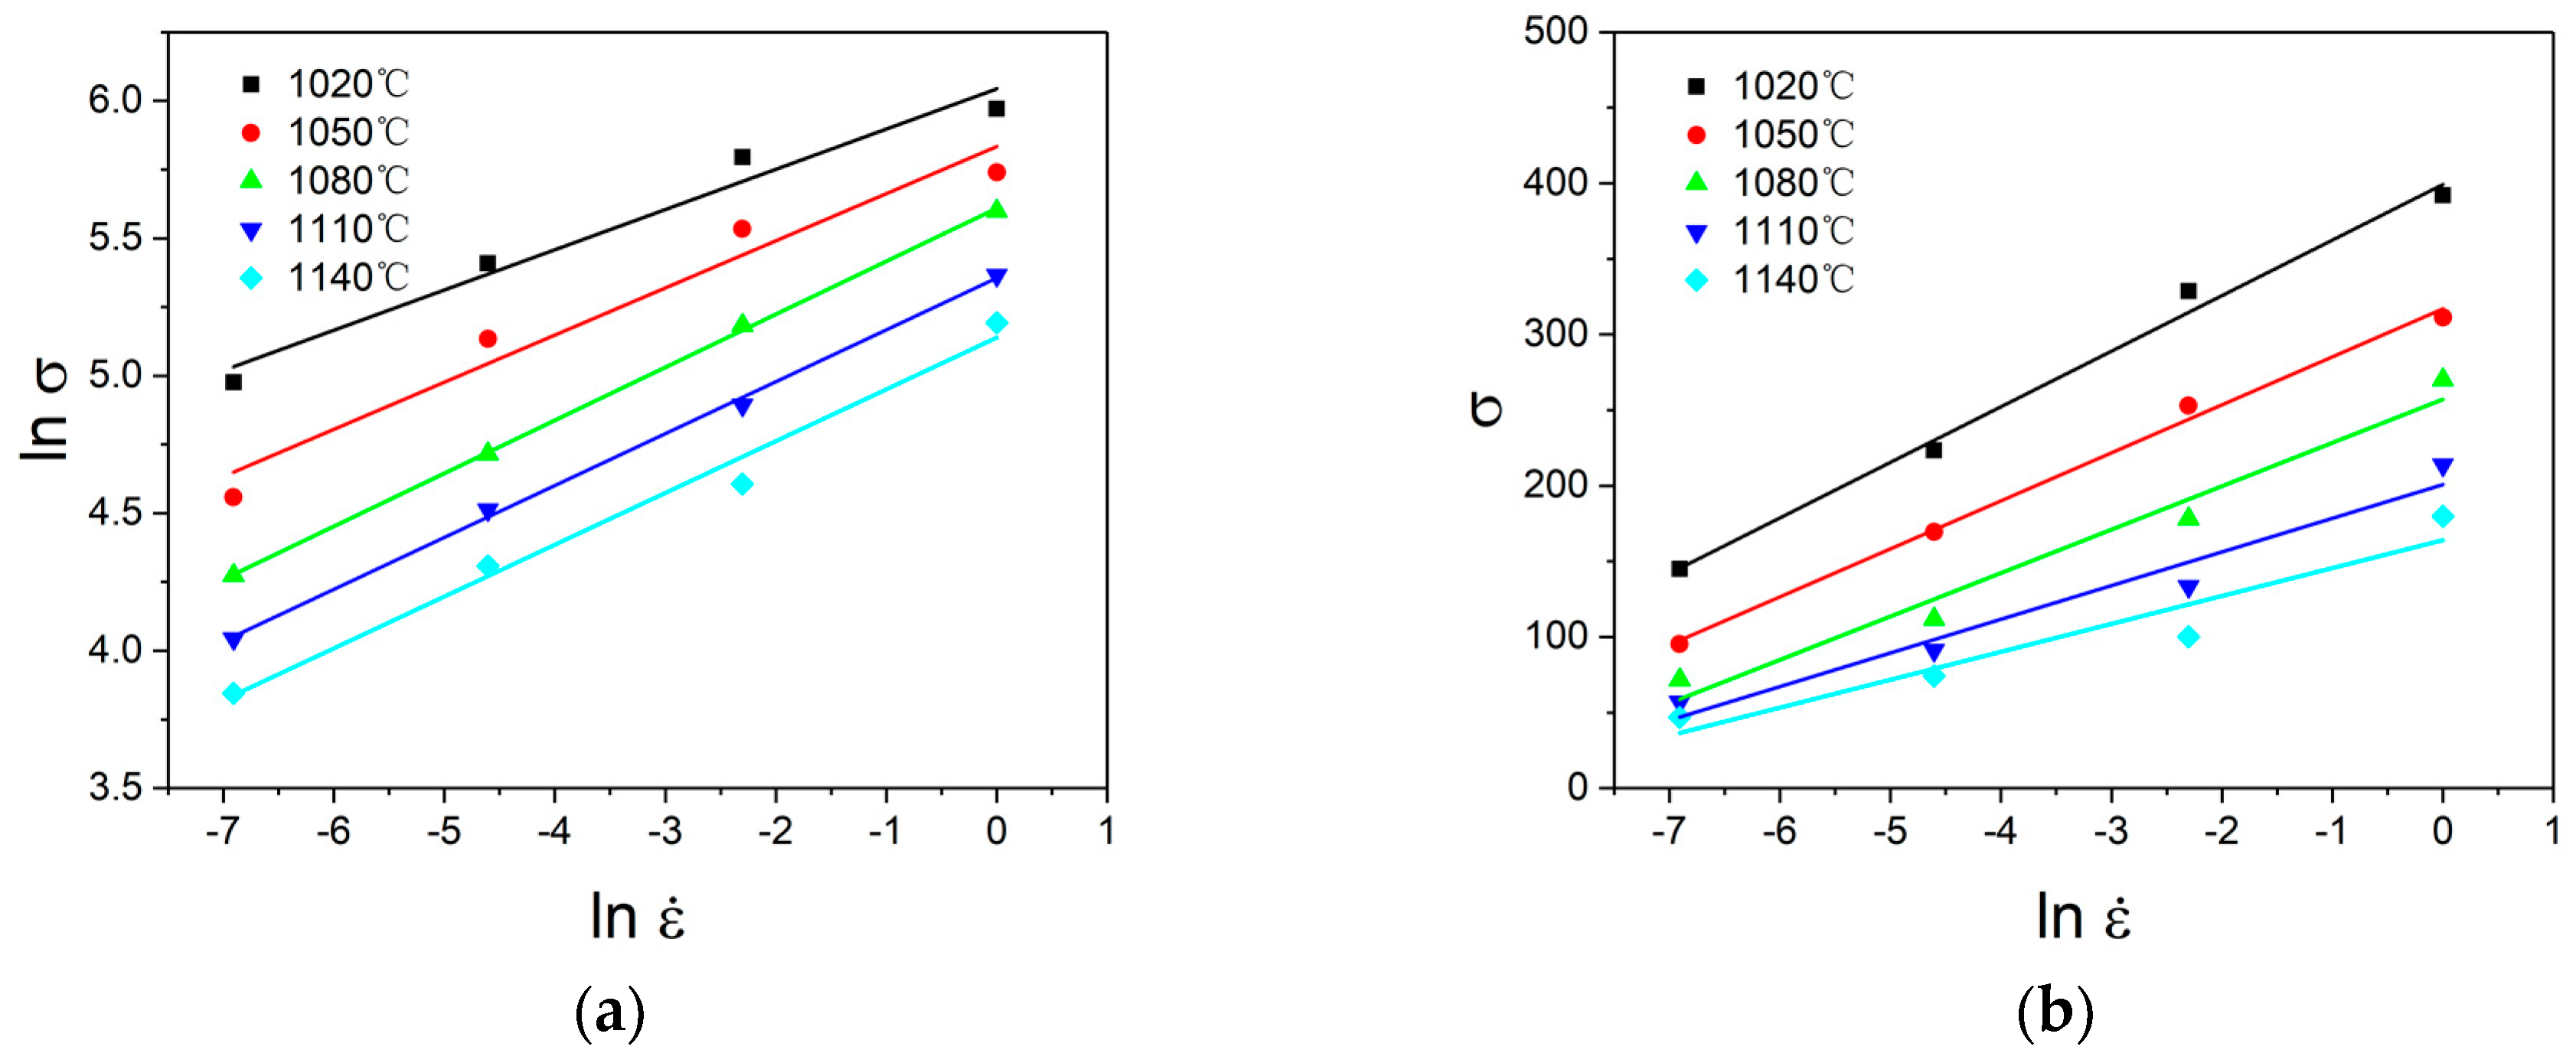
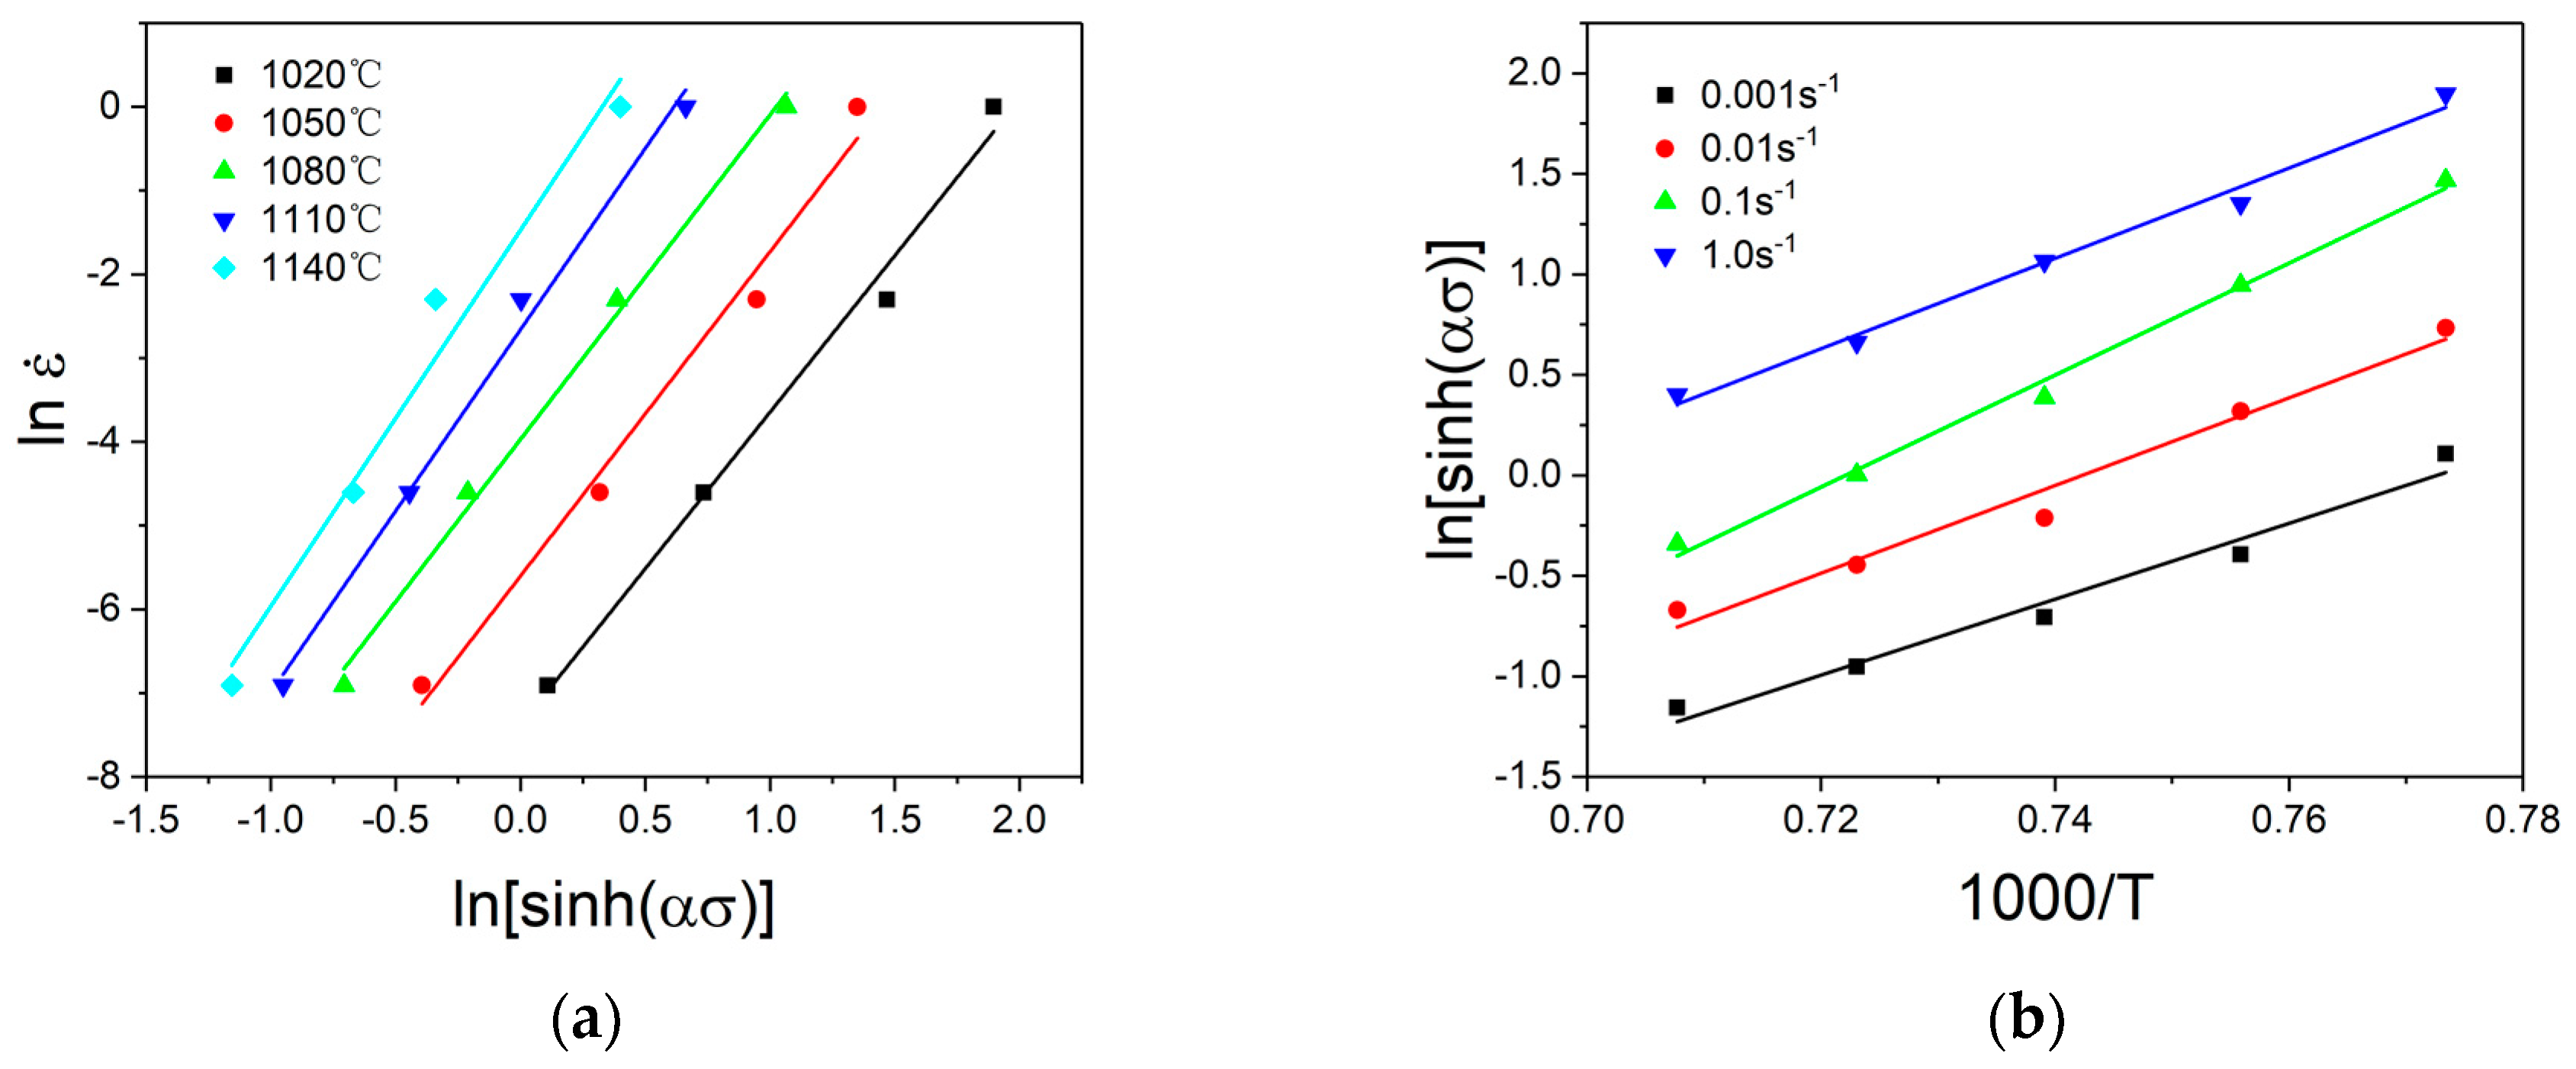
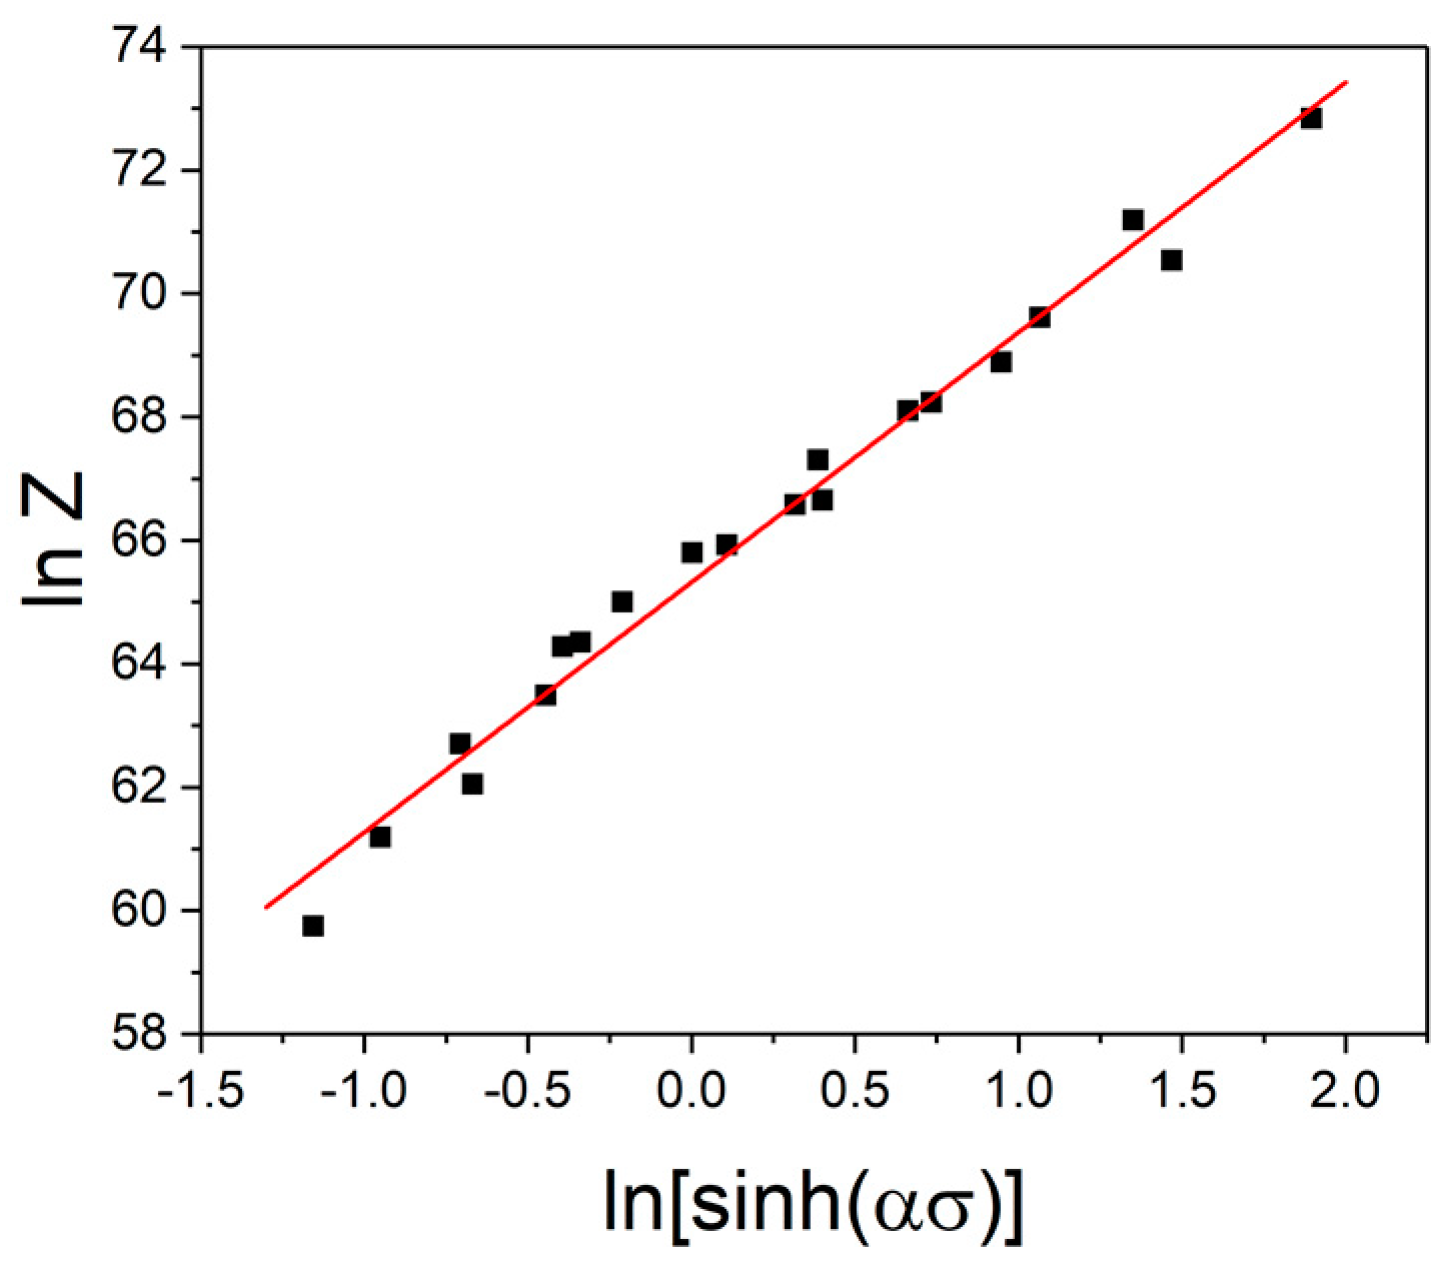
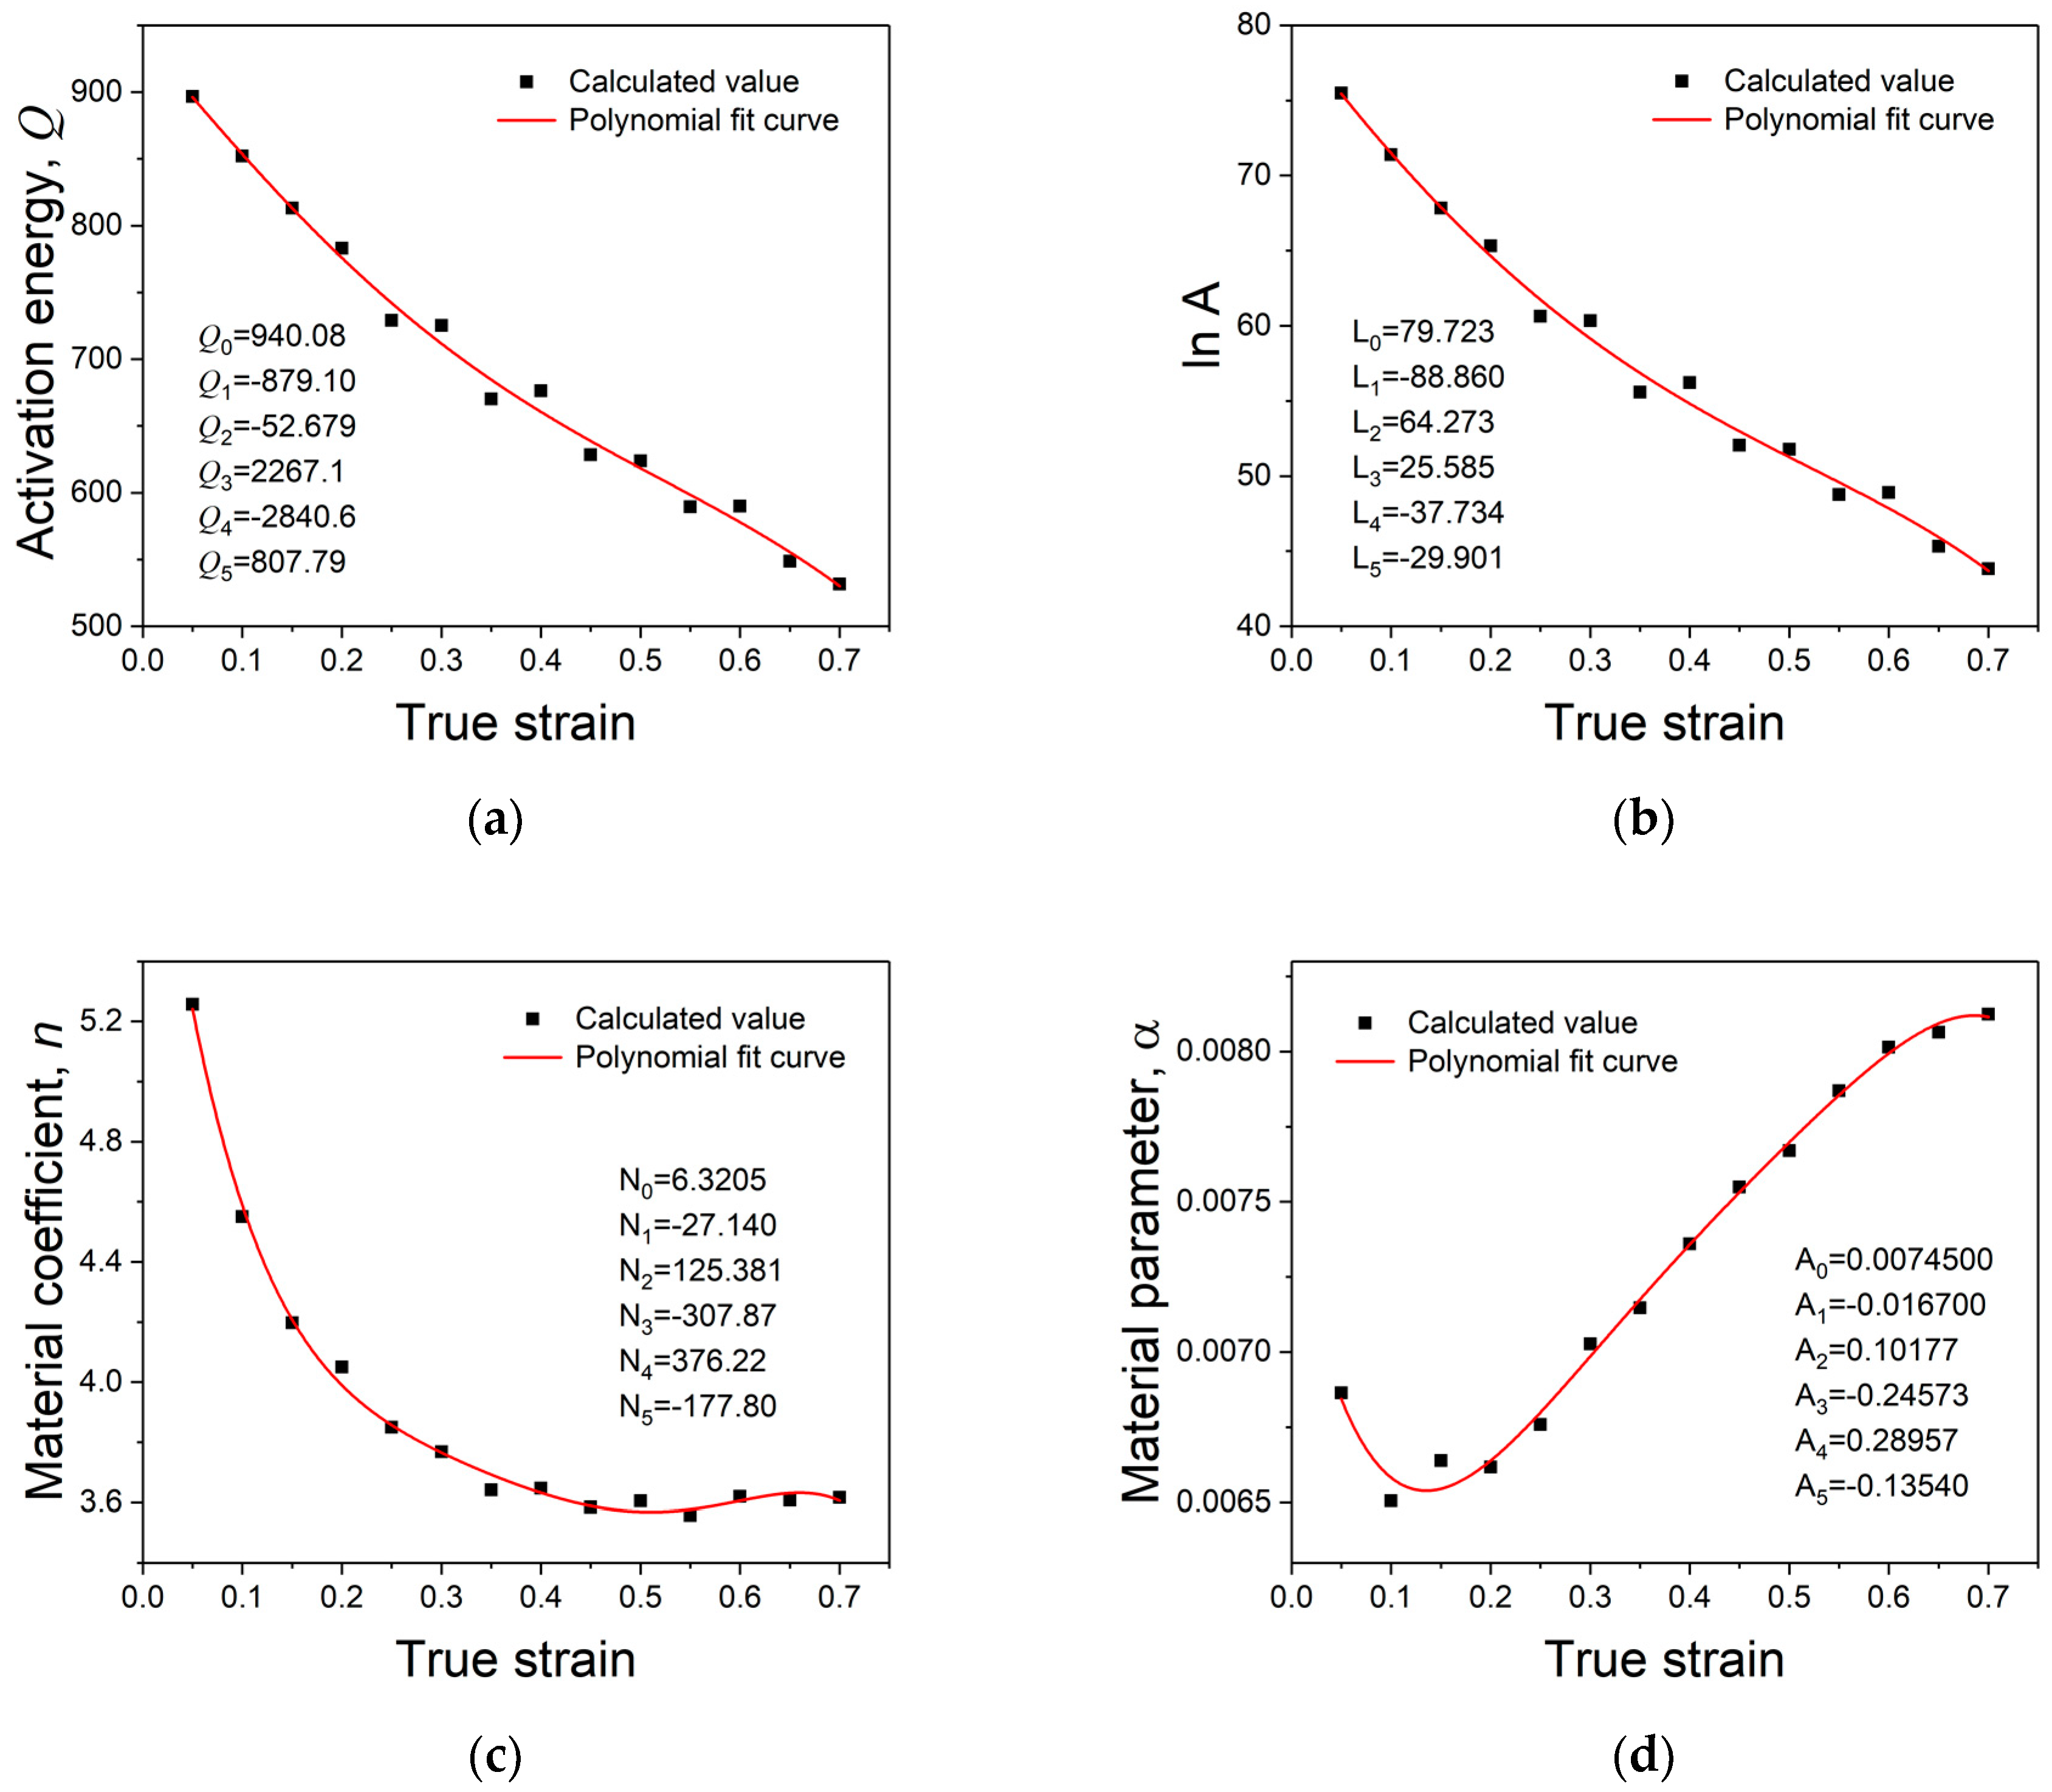
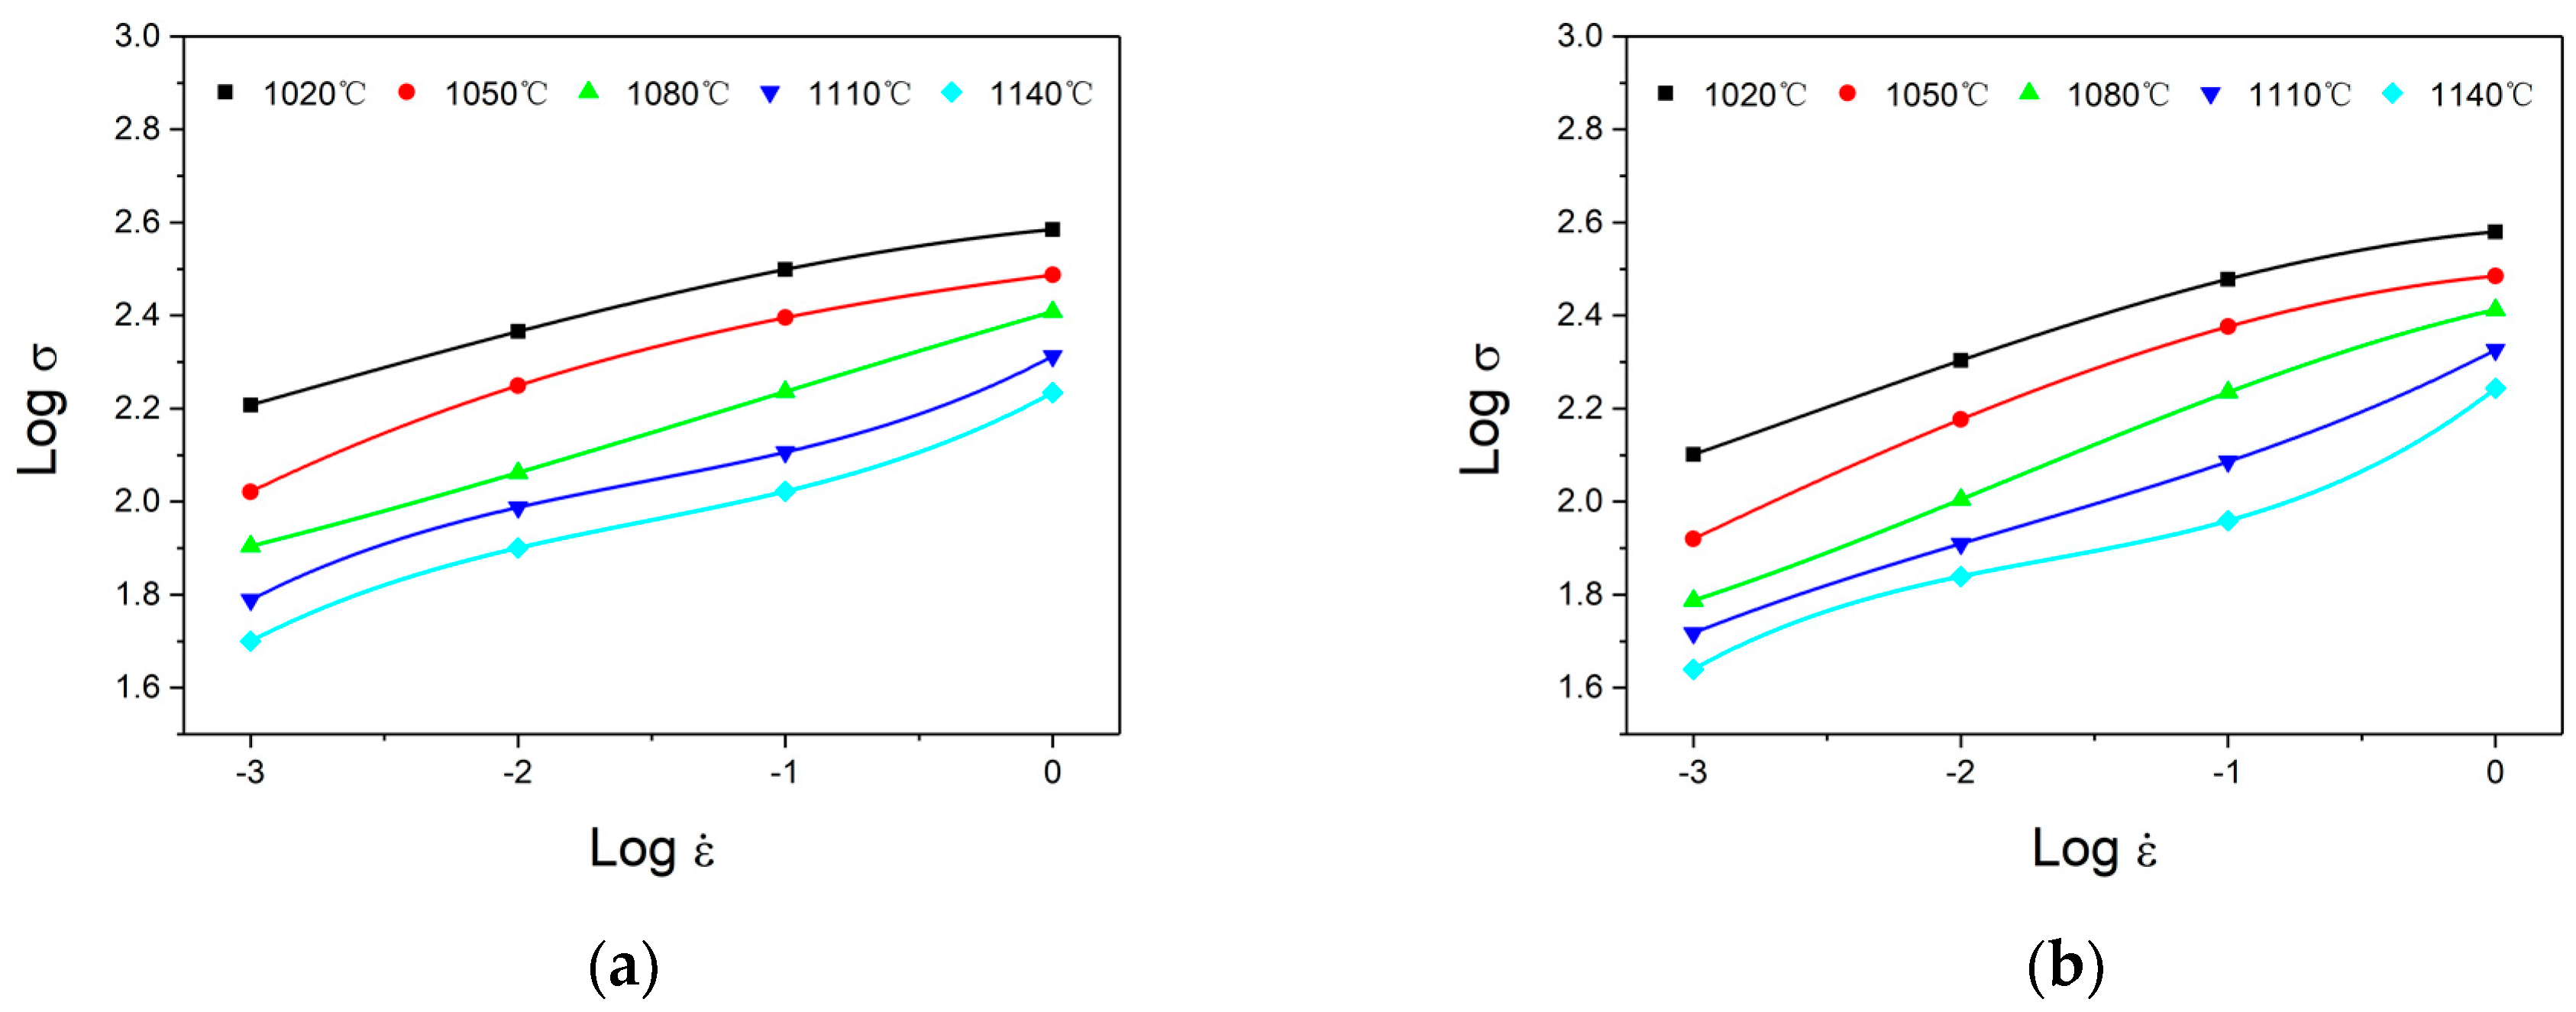
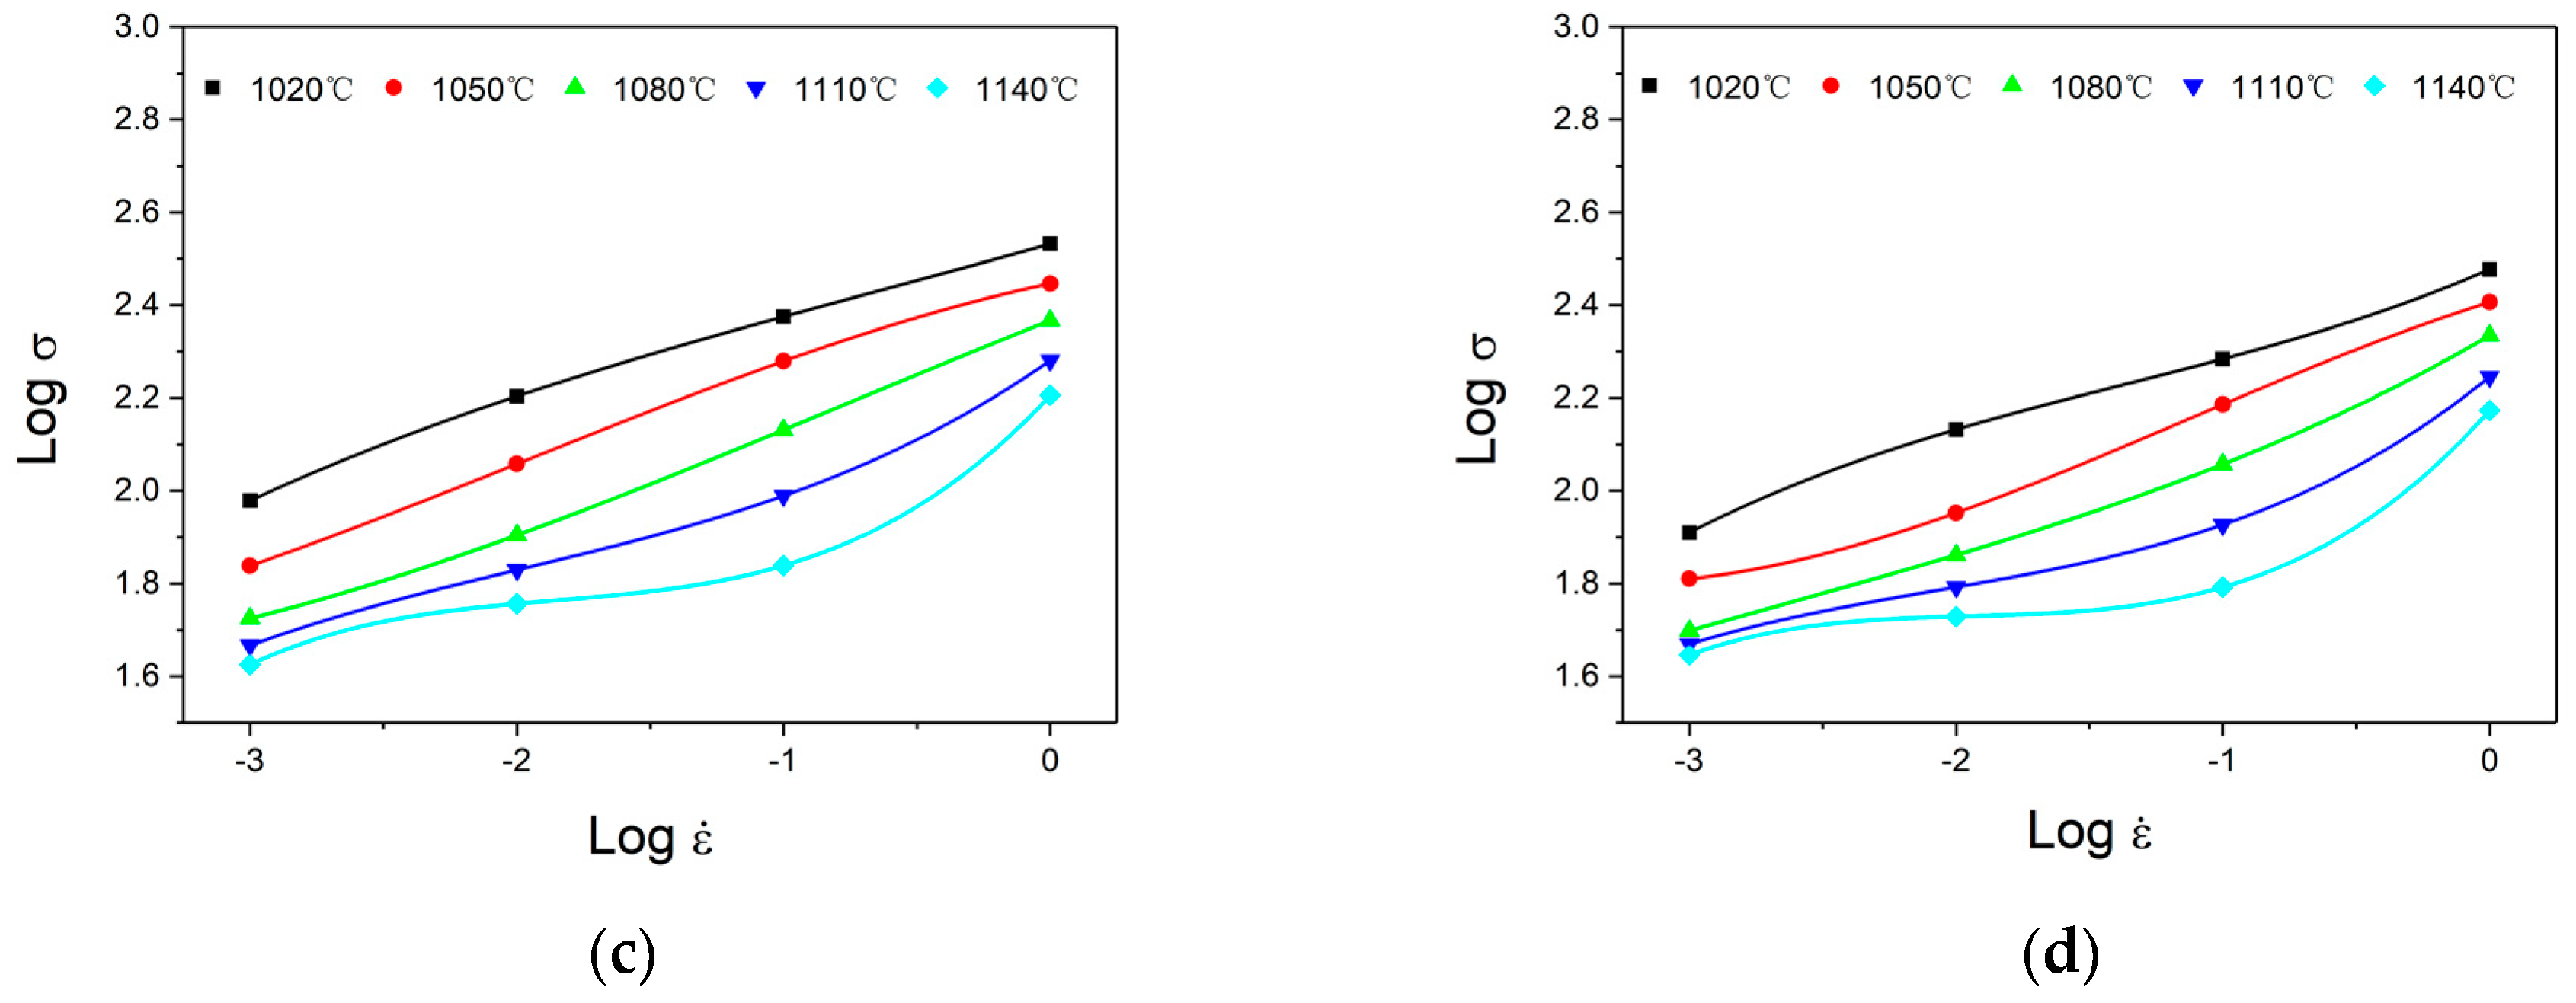
3.2. Constitutive Equation of PM/Wrought Dual Superalloy

Generally, the hot plastic deformation of superalloys can be considered to be a process controlled by thermal activation, which is susceptible to deformation parameters such as true strain, strain rate, and deformation temperature. The constitutive equation, which reveals the intrinsic relationship between the flow stress, deformation temperature, and strain rate, is regarded as an effective approach to describe the flow behavior and predict the flow stress of work-piece during the deformation process. The Arrhenius-type equation, proposed by Sellars and Mctegart [9], which is the most widely applied model and can be denoted as the following:
ε ˙ = A f ( σ ) exp ( Q R T )
According to the different level of stress, Equation (1) can be simplified into these forms:
  • When ασ < 0.8, viz., for lower stress,
    ε ˙ = A 1 σ n 1 exp ( Q R T )
  • When ασ > 1.2, viz., for higher stress,
    ε ˙ = A 2 exp ( β σ ) exp ( Q R T )
  • For all values of ασ,
    ε ˙ = A [ sinh ( α σ ) ] n exp ( Q R T )
In the above equations, ε ˙ is strain rate (s−1); σ is the flow stress (MPa); T is deformation temperature (K); Q is activation energy (kJ·mol−1); R is molar gas constant (8.314 kJ·mol−1·K−1); Moreover, A1, A2, A, β, n, n 1 , and α ( α = β / n 1 ) are material constants.
In order to identify the above material constants, taking the natural logarithm on both side of Equations (2)–(4) simultaneously:
ln ε ˙ = n 1 ln σ + ( ln A 1 Q R T )
ln ε ˙ = β σ + ( ln A 2 Q R T )
ln ε ˙ = n ln [ sin h ( α σ ) ] + ( ln A Q R T )
In this research, the true strain of 0.2 is taken as an example to illustrate the calculating procedure of material constants. From Equations (5) and (6), it can be known that n 1 = ln ε ˙ / ln σ and β = ln ε ˙ / σ . Figure 4a,b gives the linear relationship of ln σ ln ε ˙ and σ ln ε ˙ at different deformation temperatures. Based on the reciprocal of average value of slopes of these fitted lines, the value of n 1 and β can be obtained as 5.584 and 0.037. Then the α-value is determined to be 0.0066.
The partial derivative is taken on both sides of Equation (7) to ln [ sin h ( α σ ) ] . When the deformation temperature is fixed, the following linear relationship can be given:
n = ln ε ˙ ln [ sin h ( α σ ) ] | T
Similarly, when the strain rate is constant, the activation energy Q can be expressed as:
Q = R n ln [ sinh ( α σ ) ] ( 1 / T ) | ε ˙
The linear relationship of ln ε ˙ ln [ sin h ( α σ ) ] and ln [ sin h ( α σ ) ] ( 1000 / T ) are obtained, respectively, as shown in Figure 5. From Figure 5a, the average slope of these lines gives the value of n as 4.14. Likewise, the value of Q/Rn can be calculated from Figure 5b. The Q-value is derived as 780.07 kJ·mol−1, and this value is higher than the self-diffusion of nickel (278 kJ·mol−1) [10], which is attributed to the occurrence of DRX [11].
Based on the research of Zener and Hollomon [12], the comprehensive effect of deformation temperature and strain rate on flow stress during the hot plastic deformation process can be expressed by Zener–Hollomon parameter, as shown in following equation:
Z = ε ˙ exp ( Q R T )
By combining Equations (4) and (10), and then taking the natural logarithm, Equation (11) can be derived as:
ln Z = ln A + n ln [ sinh ( α σ ) ]
According to the linear relationship of ln Z ln [ sin h ( α σ ) ] , Figure 6 can be obtained. Moreover, the correlation coefficient is about 0.99. The intercept of this line represents the value of ln A , thus the A-value is determined as being 2.33 × 1028.
On the basis of above analysis, all of the material constants can be obtained. Therefore, the constitutive equation at the strain of 0.2 that describes the flow stress (σ) as a function of deformation temperature (T) and strain rate ( ε ˙ ) for PM/Wrought dual superalloy can be expressed as:
ε ˙ = 2.33 × 10 28 [ sinh ( 0.0066 σ ) ] 4.14 exp ( 780070 R T )
It is worth noting that in the established constitutive model of Equation (12), only the effects of deformation temperature and strain rate on flow stress are considered. However, as shown in Figure 3, the flow stress changes with the augmentation of the strain. Moreover, it is well known that the influence of the strain on the deformation activation energy and material constants is significant. In order to more accurately analyze the flow behavior of the PM/Wrought dual superalloy, the material constants (Q, A, n, and α) are obtained using above-mentioned method at various strains within the range of 0.05–0.69 (interval of 0.05). The relationships between Q, ln A , n, α, and true strain for PM/Wrought dual superalloy (Figure 7) can be polynomially fitted, as shown in Equation (13). The polynomial fitting results are presented in Table 1.
Q = Q 0 + Q 1 ε + Q 2 ε 2 + Q 3 ε 3 + Q 4 ε 4 + Q 5 ε 5 ln A = L 0 + L 1 ε + L 2 ε 2 + L 3 ε 3 + L 4 ε 4 + L 5 ε 5 n = N 0 + N 1 ε + N 2 ε 2 + N 3 ε 3 + N 4 ε 4 + N 5 ε 5 α = A 0 + A 1 ε + A 2 ε 2 + A 3 ε 3 + A 4 ε 4 + A 5 ε 5
Based on the above-mentioned computation, the constitutive equations under different strains can be established. Thus, the predicted-values of flow stress can be calculated for PM/Wrought dual superalloy at various deformation conditions. The comparison between the experimental flow stresses and the predicted flow stresses at a certain strain rate is shown in Figure 8. Obviously, it can be observed that the predicted results are in good agreement with the experimental values, which indicates that the constitutive equations established in this paper are able to provide a higher prediction accuracy of flow stress for the PM/Wrought dual superalloy.

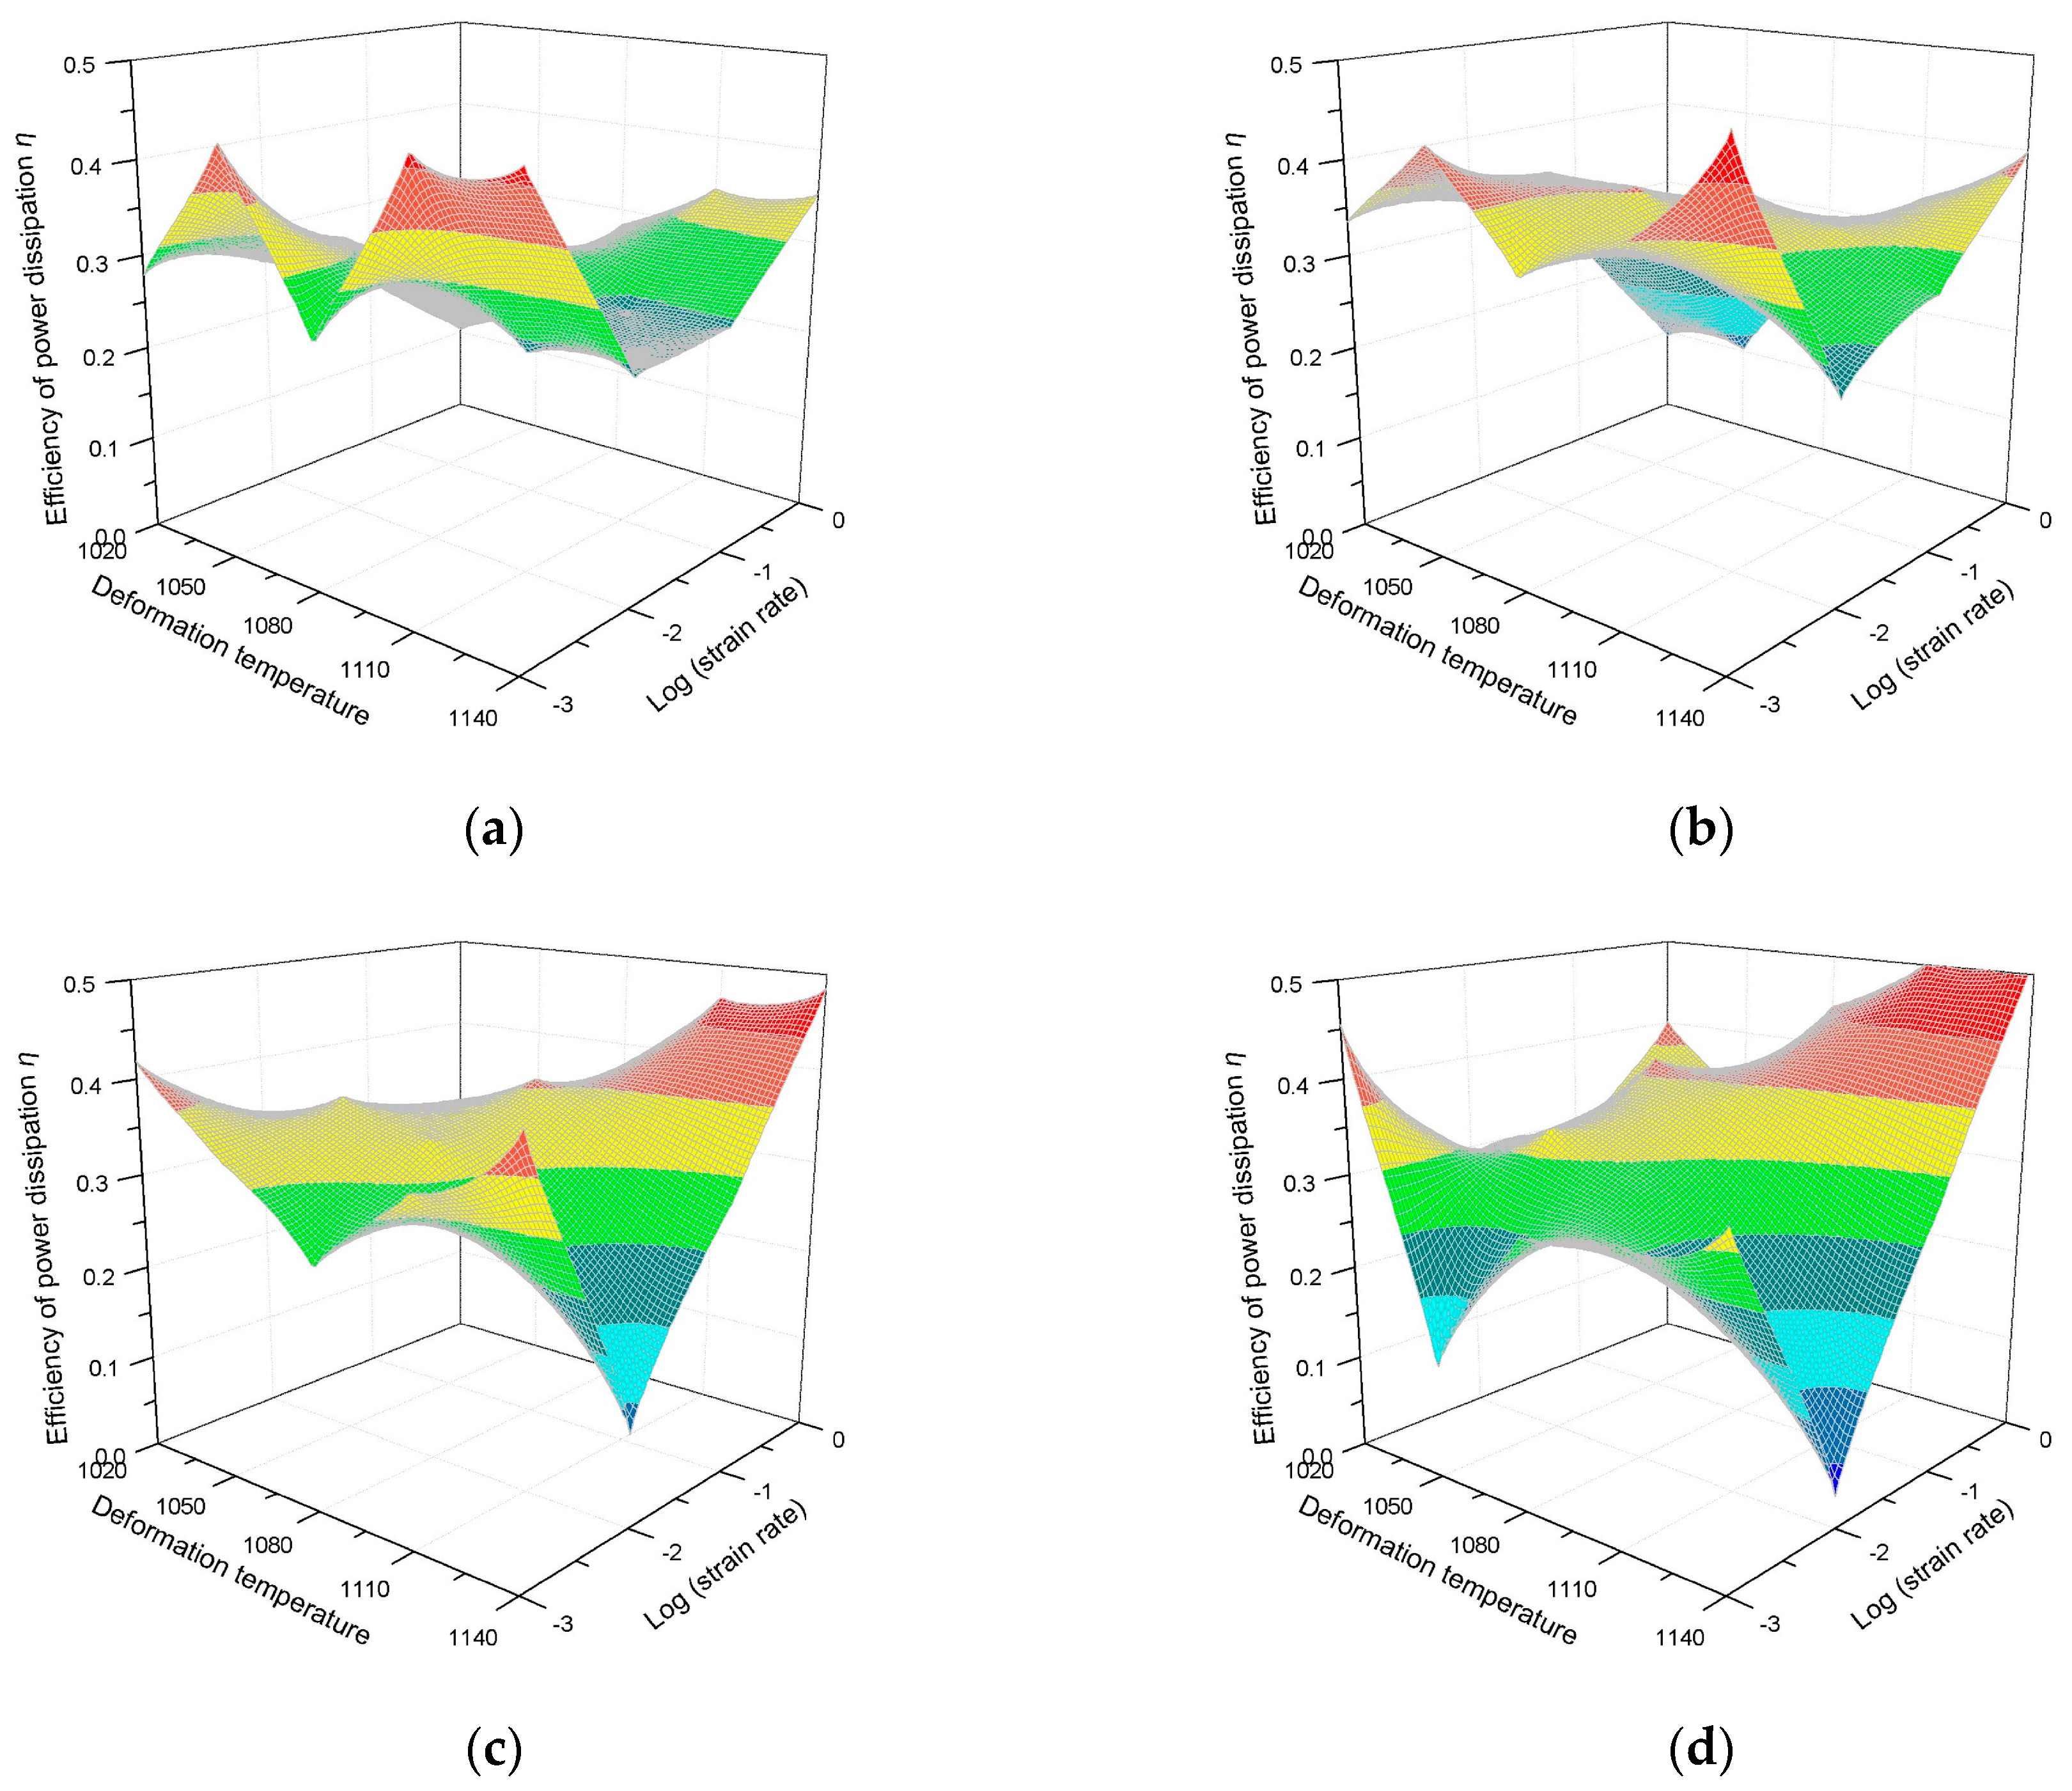
3.3. Establishment of Processing Map

The approach of dynamic materials model (DMM) has been widely used to establish processing map [13,14,15]. Based on the theory of DMM, the work-piece under the hot deformation process can be well regarded as a power dissipating system. The total power dissipation P is assumed to be combination of two complementary parts: G content and J co-content, which can be determined by:
P = σ ε ˙ = G + J = 0 ε ˙ σ d ε ˙ + 0 σ ε ˙ d σ
where G content denotes the power consumed by the plastic deformation, most of which is released by thermal energy, while the J co-content represents the power dissipation induced by metallurgical evolution during hot deformation, such as DRV, DRX, and phase transformation. When the deformation temperature and strain are constant, the flow stress (σ) of work-piece can be represented by the dynamic constitutive equation σ = K ε ˙ m , where K is a material parameter and m is the strain rate sensitivity exponent. Generally, the distribution of power dissipation between G and J is determined by the constitutive flow behavior of metal materials, thus the G content and J co-content can be expressed as:
G = 0 ε ˙ σ d ε ˙ = 0 ε ˙ ( K ε ˙ m ) d ε ˙ = K ε ˙ m + 1 m + 1 = σ ε ˙ 1 + m
J = 0 σ ε ˙ d σ = 0 σ ( σ / K ) 1 m d σ = K ( σ / K ) 1 m + 1 1 m + 1 = m σ ε ˙ 1 + m
The strain rate sensitivity exponent m can be defined by the ratio of d J / d G . For an ideal linear dissipater, the value of m is 1 and the J co-content reaches the maximum value J max = σ ε ˙ / 2 . For a non-linear dissipation process, the efficiency of dissipation η is employed to measure the power dissipation capacity of materials during hot deformation, which can be evaluated as:
η = J J max = 2 m 1 + m
The power dissipation map can be composed by the variation of η-value under all hot deformation conditions, which is employed to preliminarily judge certain specific microstructural mechanism may develop during the hot deformation process. Generally, the region with a high η value corresponds to a preferable processing condition. In this “safe” regime, power dissipates by great microstructure evolution.
In order to avoid the formation of defects during the hot deformation process, on the basis of the maximum rate of entropy production principle, a continuum criterion used to judge the occurrence of flow instability can be obtained, which is shown as the following:
ξ ( ε ˙ ) = ln [ m / ( 1 + m ) ] ln ε ˙ + m < 0
Generally, the negative value of ξ ( ε ˙ ) indicates that detrimental deformation mechanism may happen, such as dynamic strain aging, mechanical twinning, adiabatic shear band formation, and the initiation of micro-cracks [16,17], thus flow instability can be forecasted to occur.
The strain rate sensitivity exponent m is a very critical parameter in the forming of plastic materials. Generally, m-value is widely associated with deformation mechanism, therefore many investigators have employed diverse means to calculate it [18,19]. In addition, some researchers reported that the variety of m-values is related to the deformation parameters and microstructural evolution. Ning et al. [20] investigated the hot deformation behavior of P/M nickel-based superalloy, and found the variation of m-value is related to the DRX process. Moreover, with the increase of strain, the fraction of the dynamic recrystallized grains increases with the m-value. Lin et al. [21] explored the hot tensile deformation behavior of a typical Ni-based superalloy and determined that the studied superalloy has a good necking diffusion and transfer capacity when the strain rate sensitivity exponent m is relatively high. Liu et al. [22] studied the effect of temperature and strain rate on the workability of the FGH4096 superalloy, and concluded that the values of strain rate sensitivity exponent m present significant variation because of the dissolution of the γ′ phase.
Figure 9 gives the fitted cubic splines for Log σ Log ε ˙ at different deformation conditions to calculate the value of the strain rate sensitivity exponent m. Apparently, the value of m for PM/Wrought dual superalloy is significantly influenced by the different deformation temperatures and strain rates. Figure 10 presents the variation map of the m-value for PM/Wrought dual superalloy, from which the explicit response of m-value to strain, strain rate, and deformation temperature can be directly reflected. It can be observed that with the alteration of strain, strain rate and deformation temperature, the strain rate sensitivity exponent m varies irregularly. Remarkably, the m-value at the strain of 0.69 and the strain rate of 1.0 s−1 decreases at first as the deformation temperature increases. Then, a minimum m-value can be gotten. Finally, the value begins to increase gradually at higher deformation temperatures. It is interesting to note that the minimum m-value is gained at 1050 °C, and this temperature is near the recrystallization temperature. The cause of this phenomenon may be well explained by the variation of the grain size.
Figure 11 illustrates the microstructures and the m-values of the PM/Wrought dual superalloy deformed at the strain rate of 1.0 s−1. The nuclei of recrystallized grains can be observed at 1050 °C from Figure 11, which indicates that recrystallization begins to occur, results in the minimum m-value appeared. With the deformation temperature increases, the nuclei gradually grow up into equiaxed grains, which leads to the m-value at the deformation temperature of 1140 °C is higher than 1050 °C. Generally, fine grain size is favorable for the sliding of grain boundary, so the alternation of the grain size can provide a reasonable explanation for the variation of strain rate sensitivity exponent m when the deformation temperature increases from 1050 to 1140 °C.
It has been widely accepted that the investigation of power dissipation map is an effective method to optimize hot processing parameters and control microstructural evolution during the hot plastic deformation process. Based on the three-dimensional variations of the η-value with the strain rate and deformation temperature, the power dissipation map can be constructed under a particular strain. Power dissipation map can be employed to exhibit various regions, which are correlated with particular mechanism of microstructural evolution during the hot plastic deformation process. In this map, the different contours with various efficiency of power dissipation η values represent the diverse microstructural mechanisms. It is generally considered that the regions with higher η values are the optimum hot deformation condition, under which the hot workability could be ameliorated and suitable microstructure can be obtained. Figure 12 gives the response 3D surfaces of the efficiency of power dissipation for PM/Wrought dual superalloy at the true strains of 0.1, 0.3, 0.5, and 0.69. It can be observed from Figure 12 that there are three features shown in the 3D-colormap surface, viz., mountain, valley, and cliff. The efficiency of power dissipation (η) shifts among different feature, indicating that the hot workability of PM/Wrought dual superalloy changes evidently with the increasing strain from 0.1 to 0.69. With further observation, at deformation temperatures ranging from 1110 to 1140 °C, under a relatively small true strain (0.1 and 0.3) the η-value at the strain rate of 1.0 s−1 is lower than at 0.001 s−1, however, which is completely opposite to when there is a high strain (0.5 and 0.69). In general, the efficiency of power dissipation η related to DRV is about 0.30, while the value associated with DRX is about 0.30–0.50 [23,24]. Obviously, the efficiency of power dissipation is higher than 0.30 under the deformation condition of (Td: 1100–1140 °C, ε ˙ : 0.1–1.0 s−1) at large strains. Moreover, the peak efficiency of about 0.55 occurring at 1140 °C/1.0 s−1 in this domain. Therefore, the optimum processing condition of PM/Wrought dual superalloy may be considered under this region in the case of large deformation.

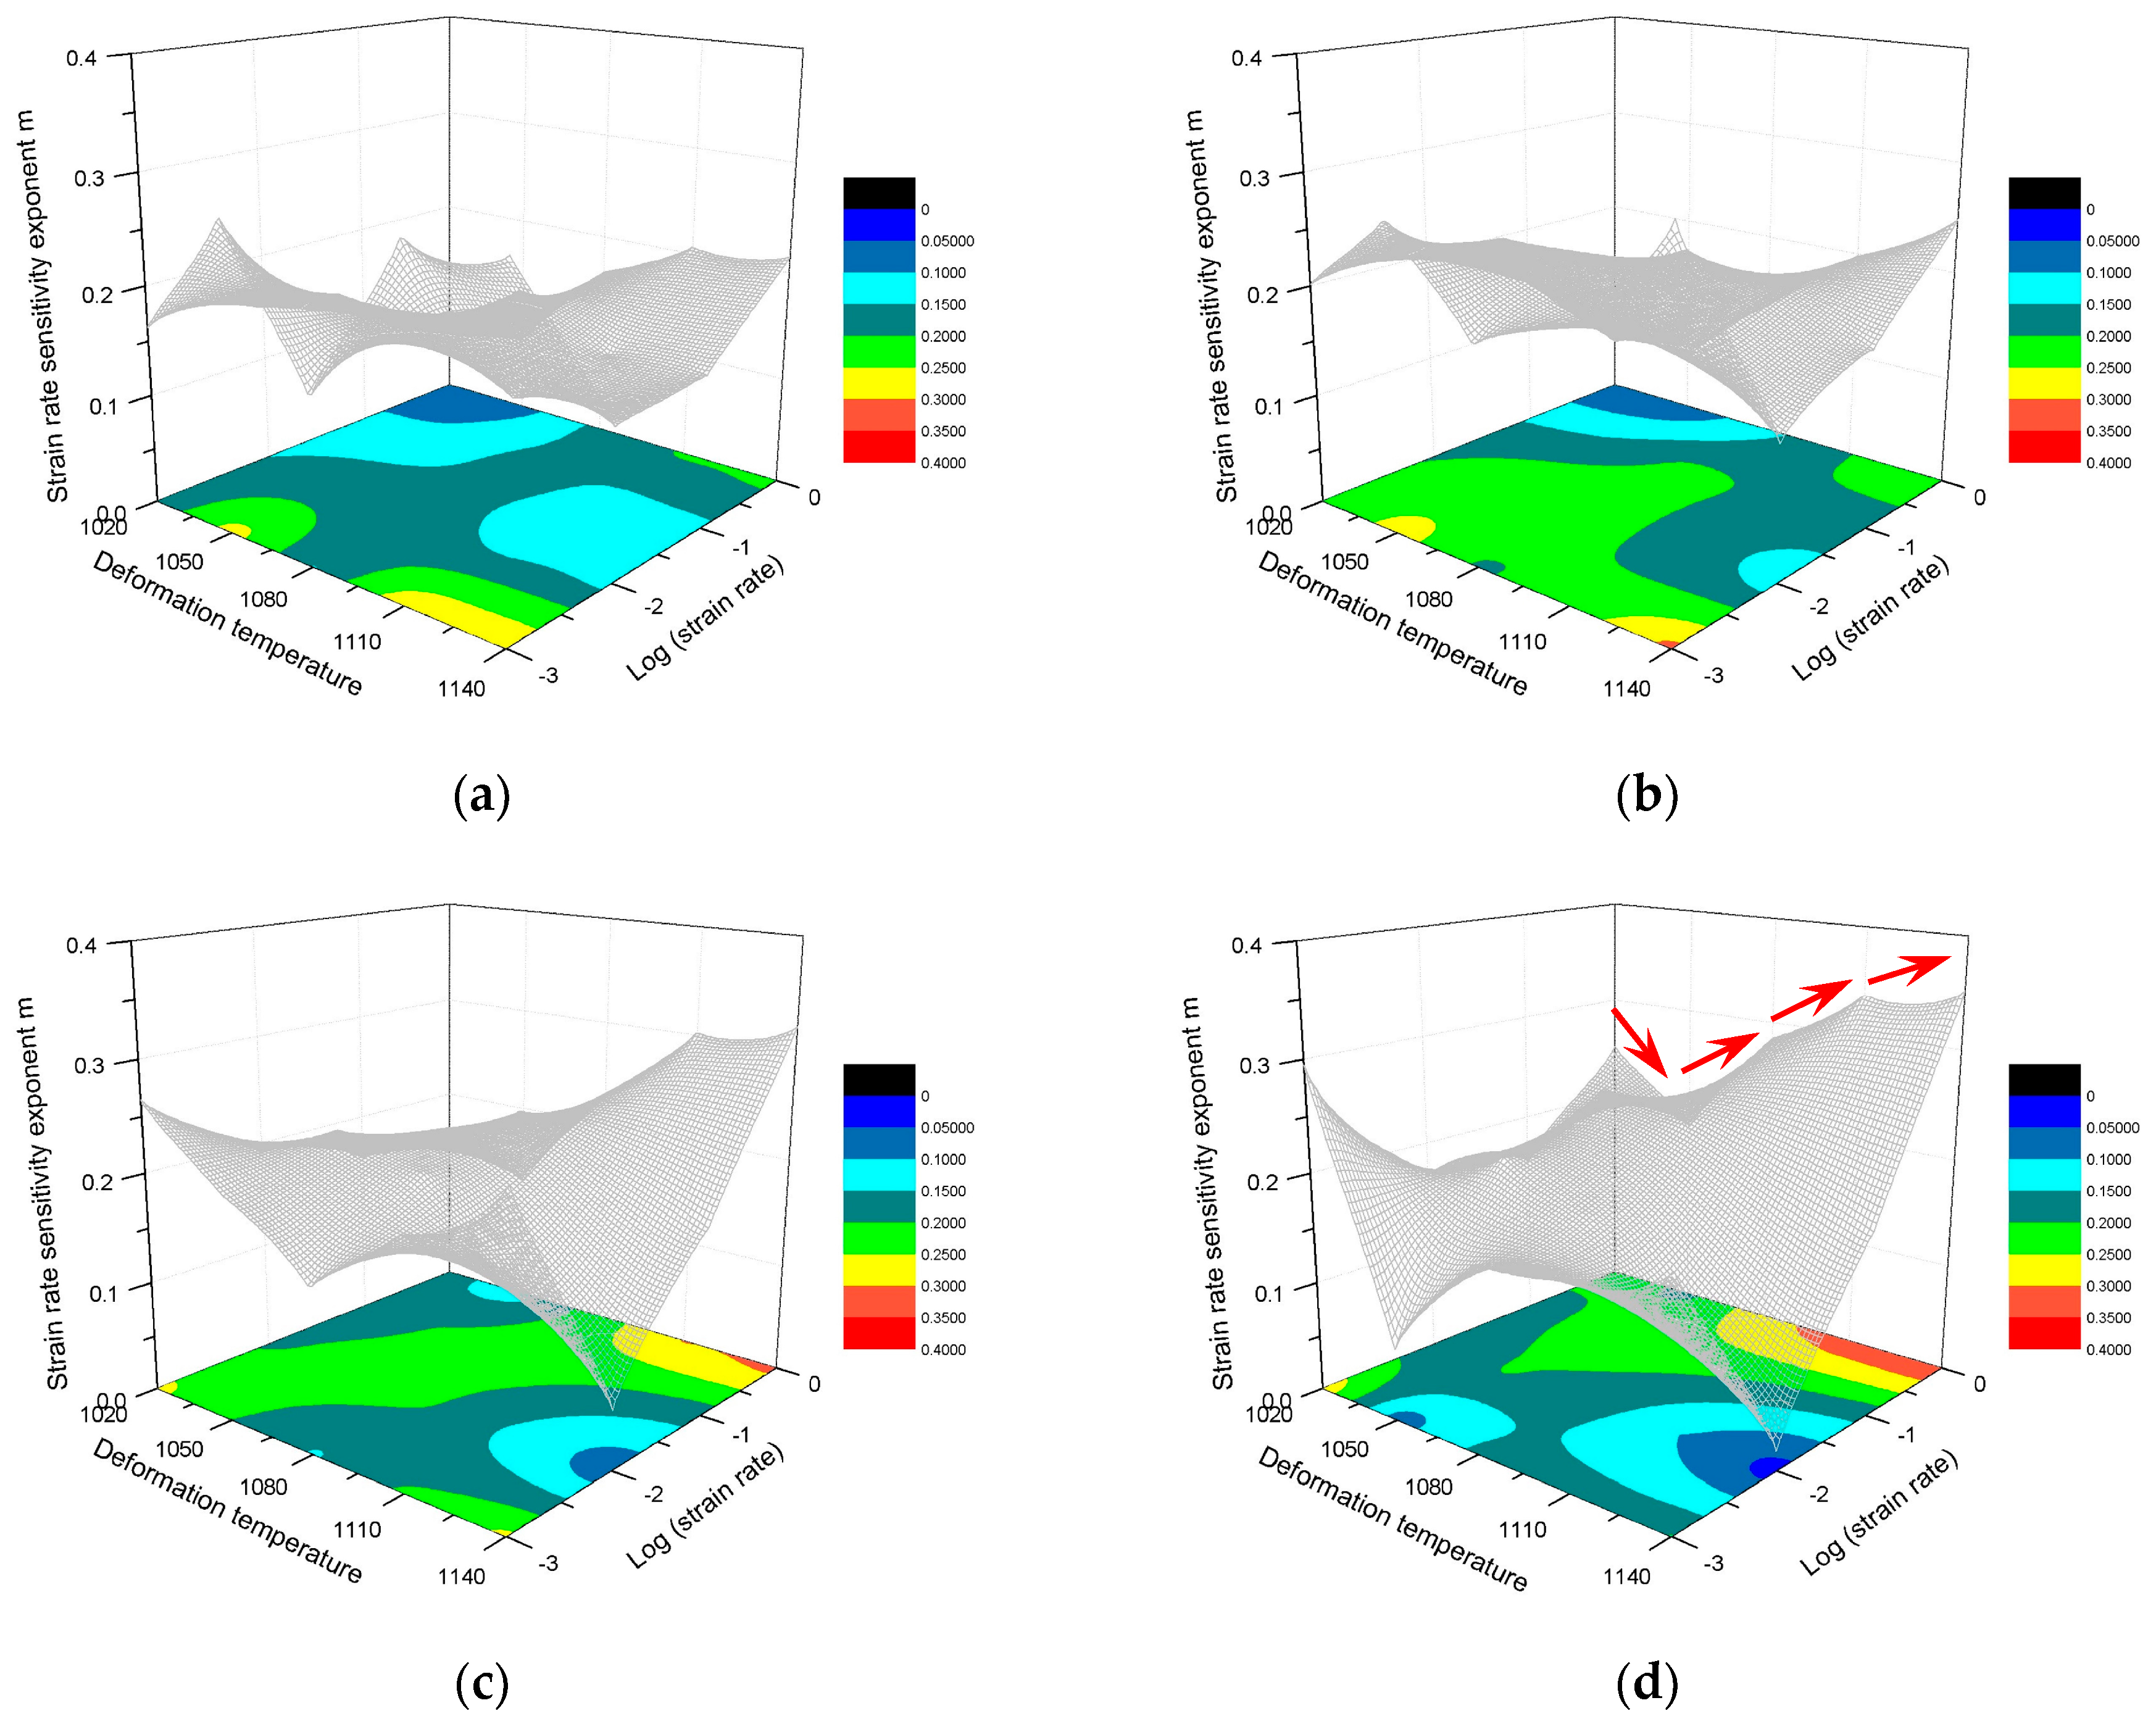
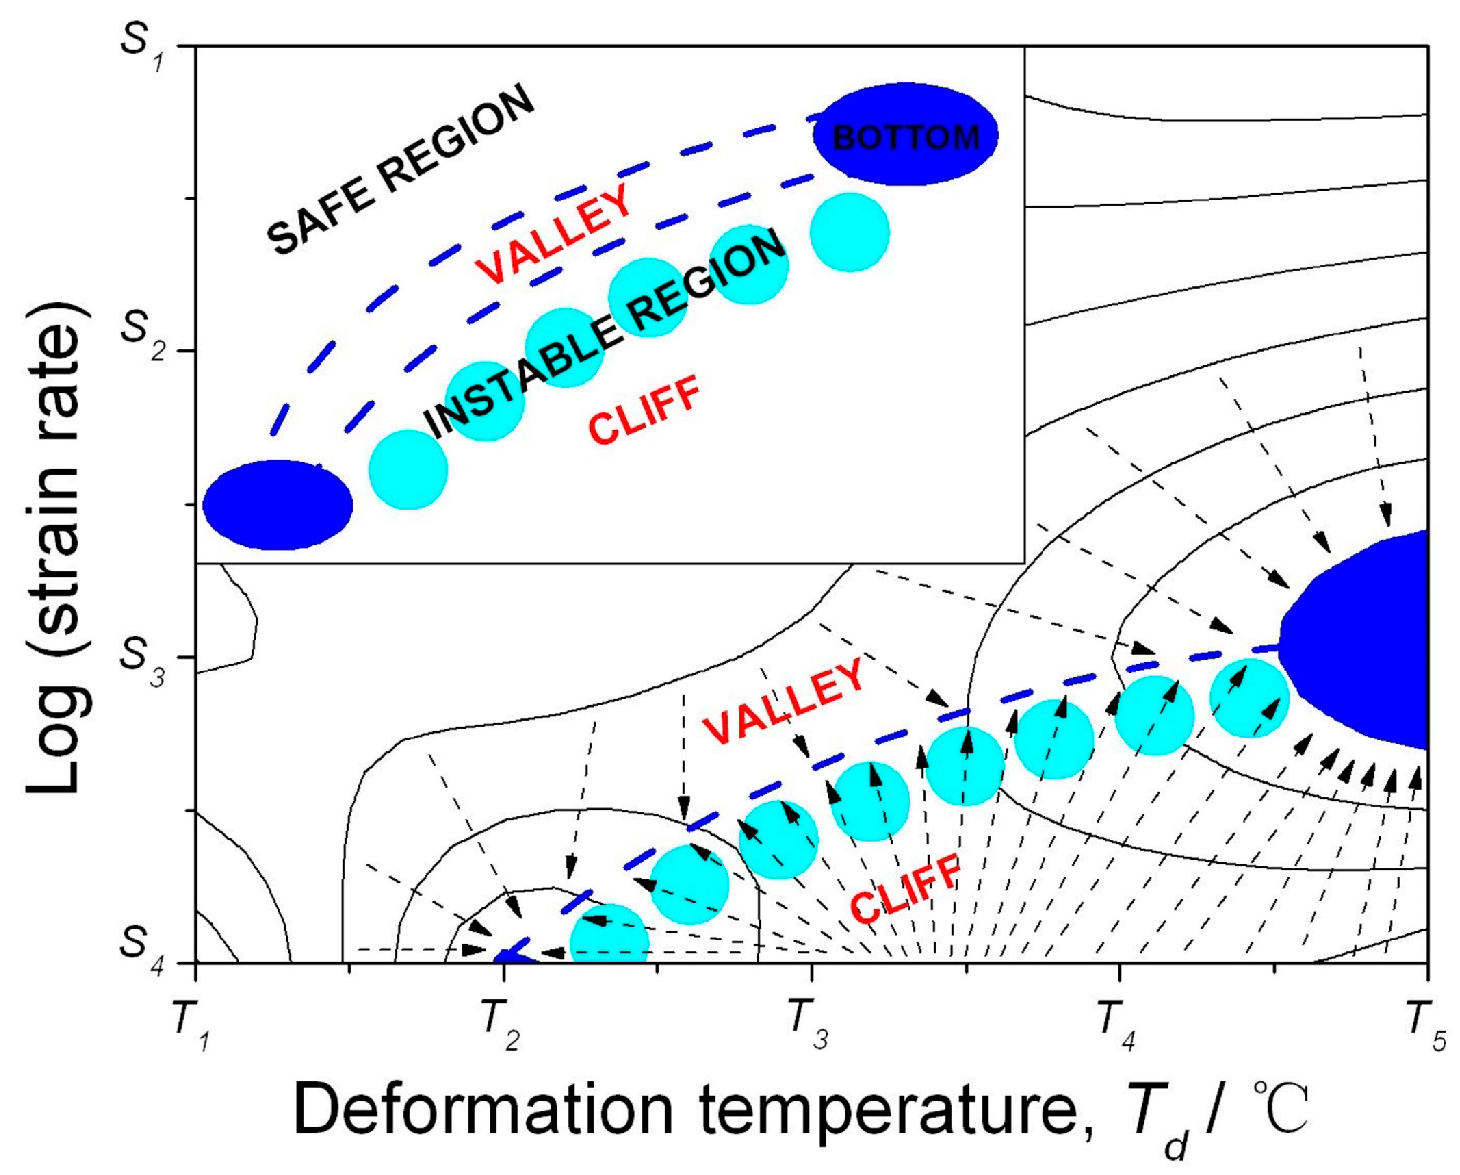
3.4. New Instability Criterion from Power Dissipation Map

According to the dynamic material model (DMM), different instability criteria have been advanced by Prasad [25], Gegel [26], Malas [27], Murty [28], and Semiatin [29], which are utilized to investigate the hot plastic deformation of metallic materials. In this research, a new approach for finding the instable region from power dissipation map is proposed. Figure 13 schematically illustrates the instability criterion of the PM/Wrought dual superalloy. A local region marked as cliff is shown in Figure 13, where the η-value distinctly converts from high into low. Subsequently, under the cliff, it can be observed that there is a valley with a lower η-value. In general, there are some “bottoms” in the valley, in which the value of η is less than 0.1. An unstable region can be predicted between the cliff and valley. The flow instability may occur during the hot plastic deformation process when the deformation condition located in this region. It should be noted that the “cliff” and “valley” features are the sufficient conditions of flow instability, but not necessary conditions. As a matter of fact, the occurrence of flow instability is the result of the interaction of many complex factors in the hot plastic deformation process. Therefore, further research is still needed to provide certification of the microstructural mechanism and mathematical equation.

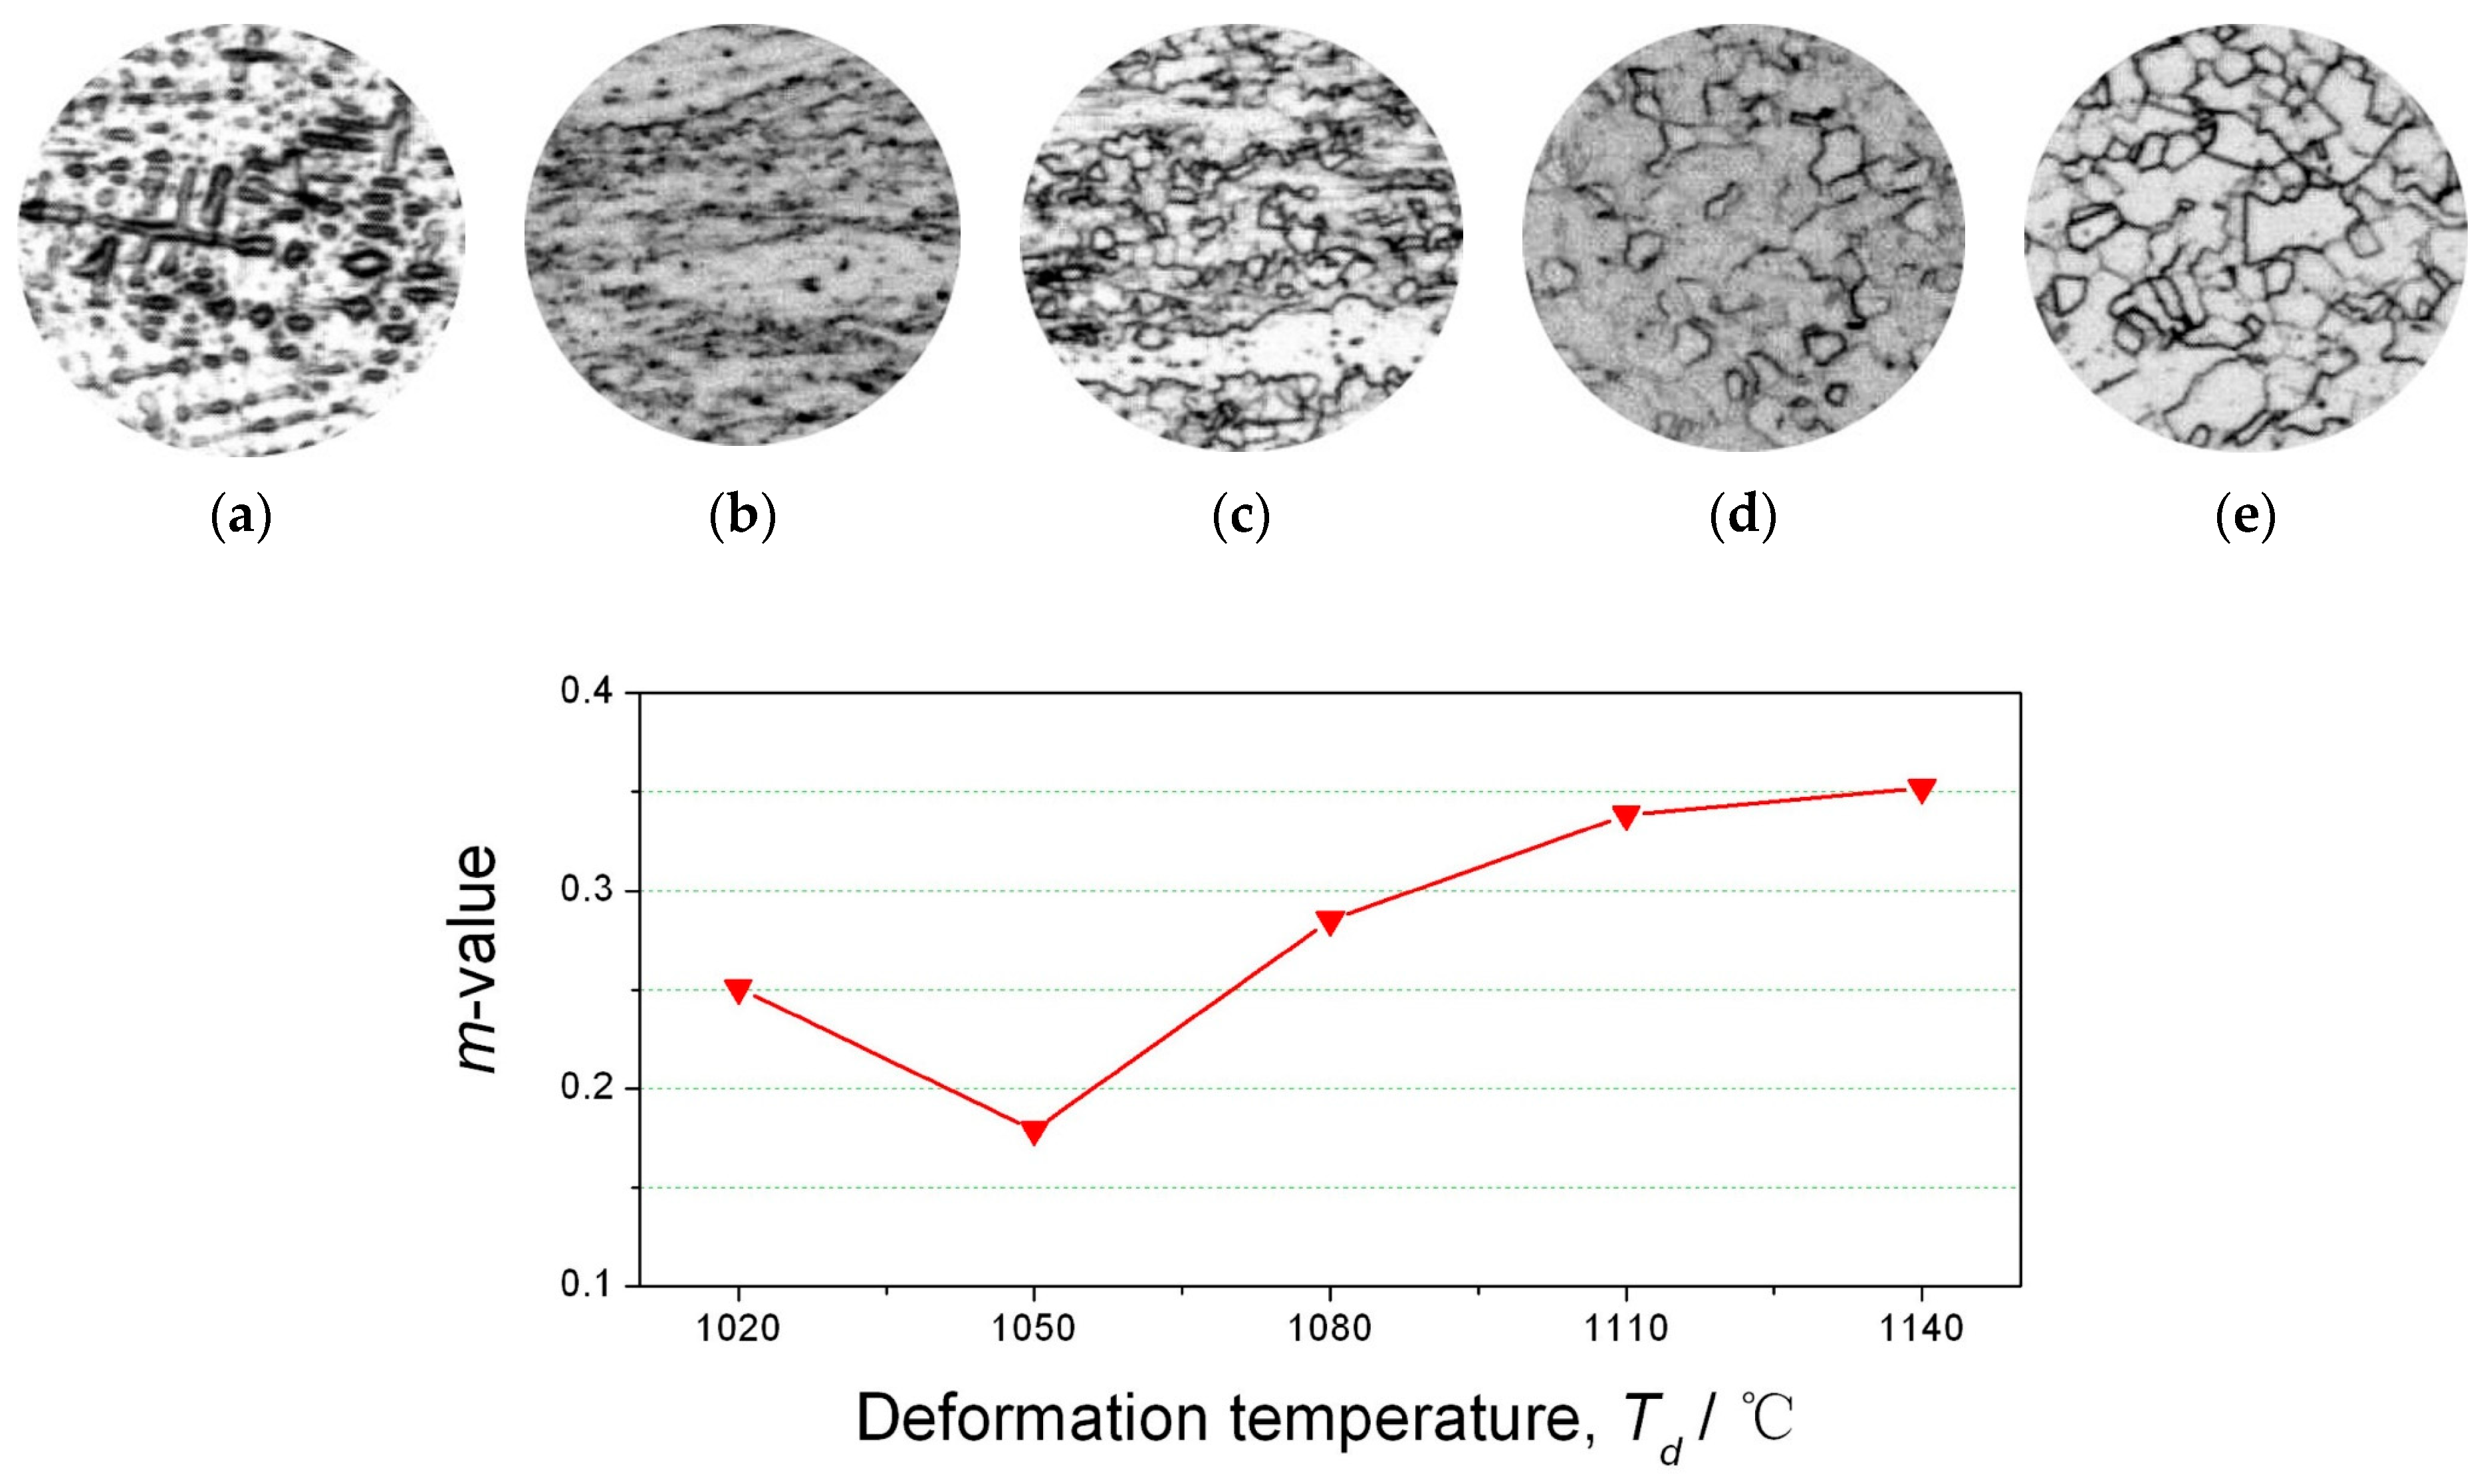
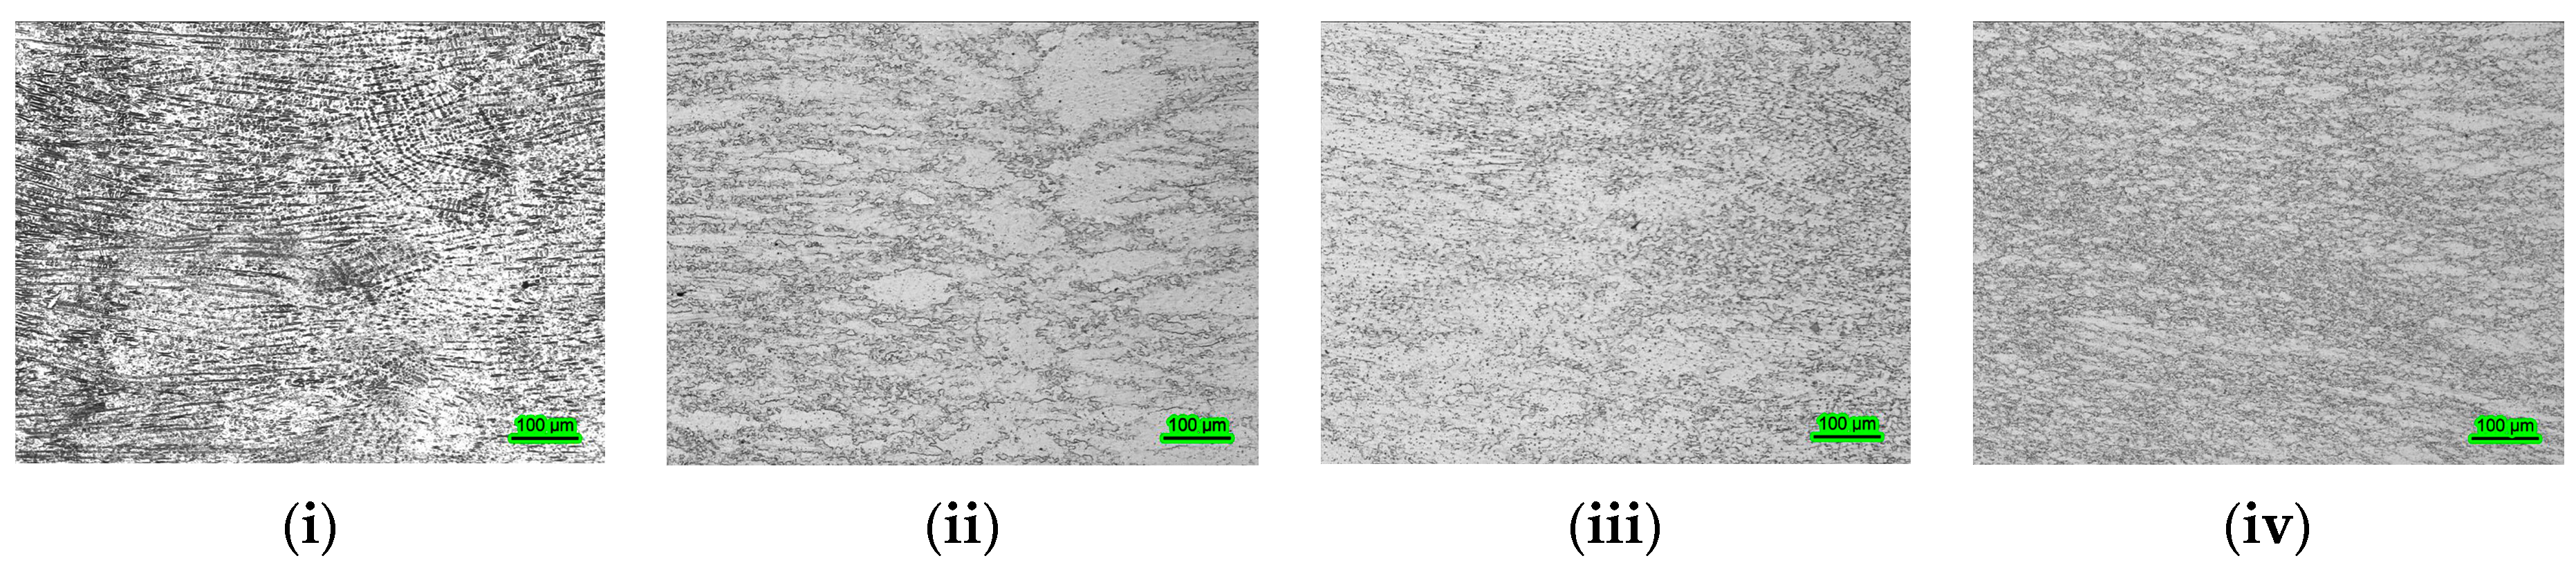
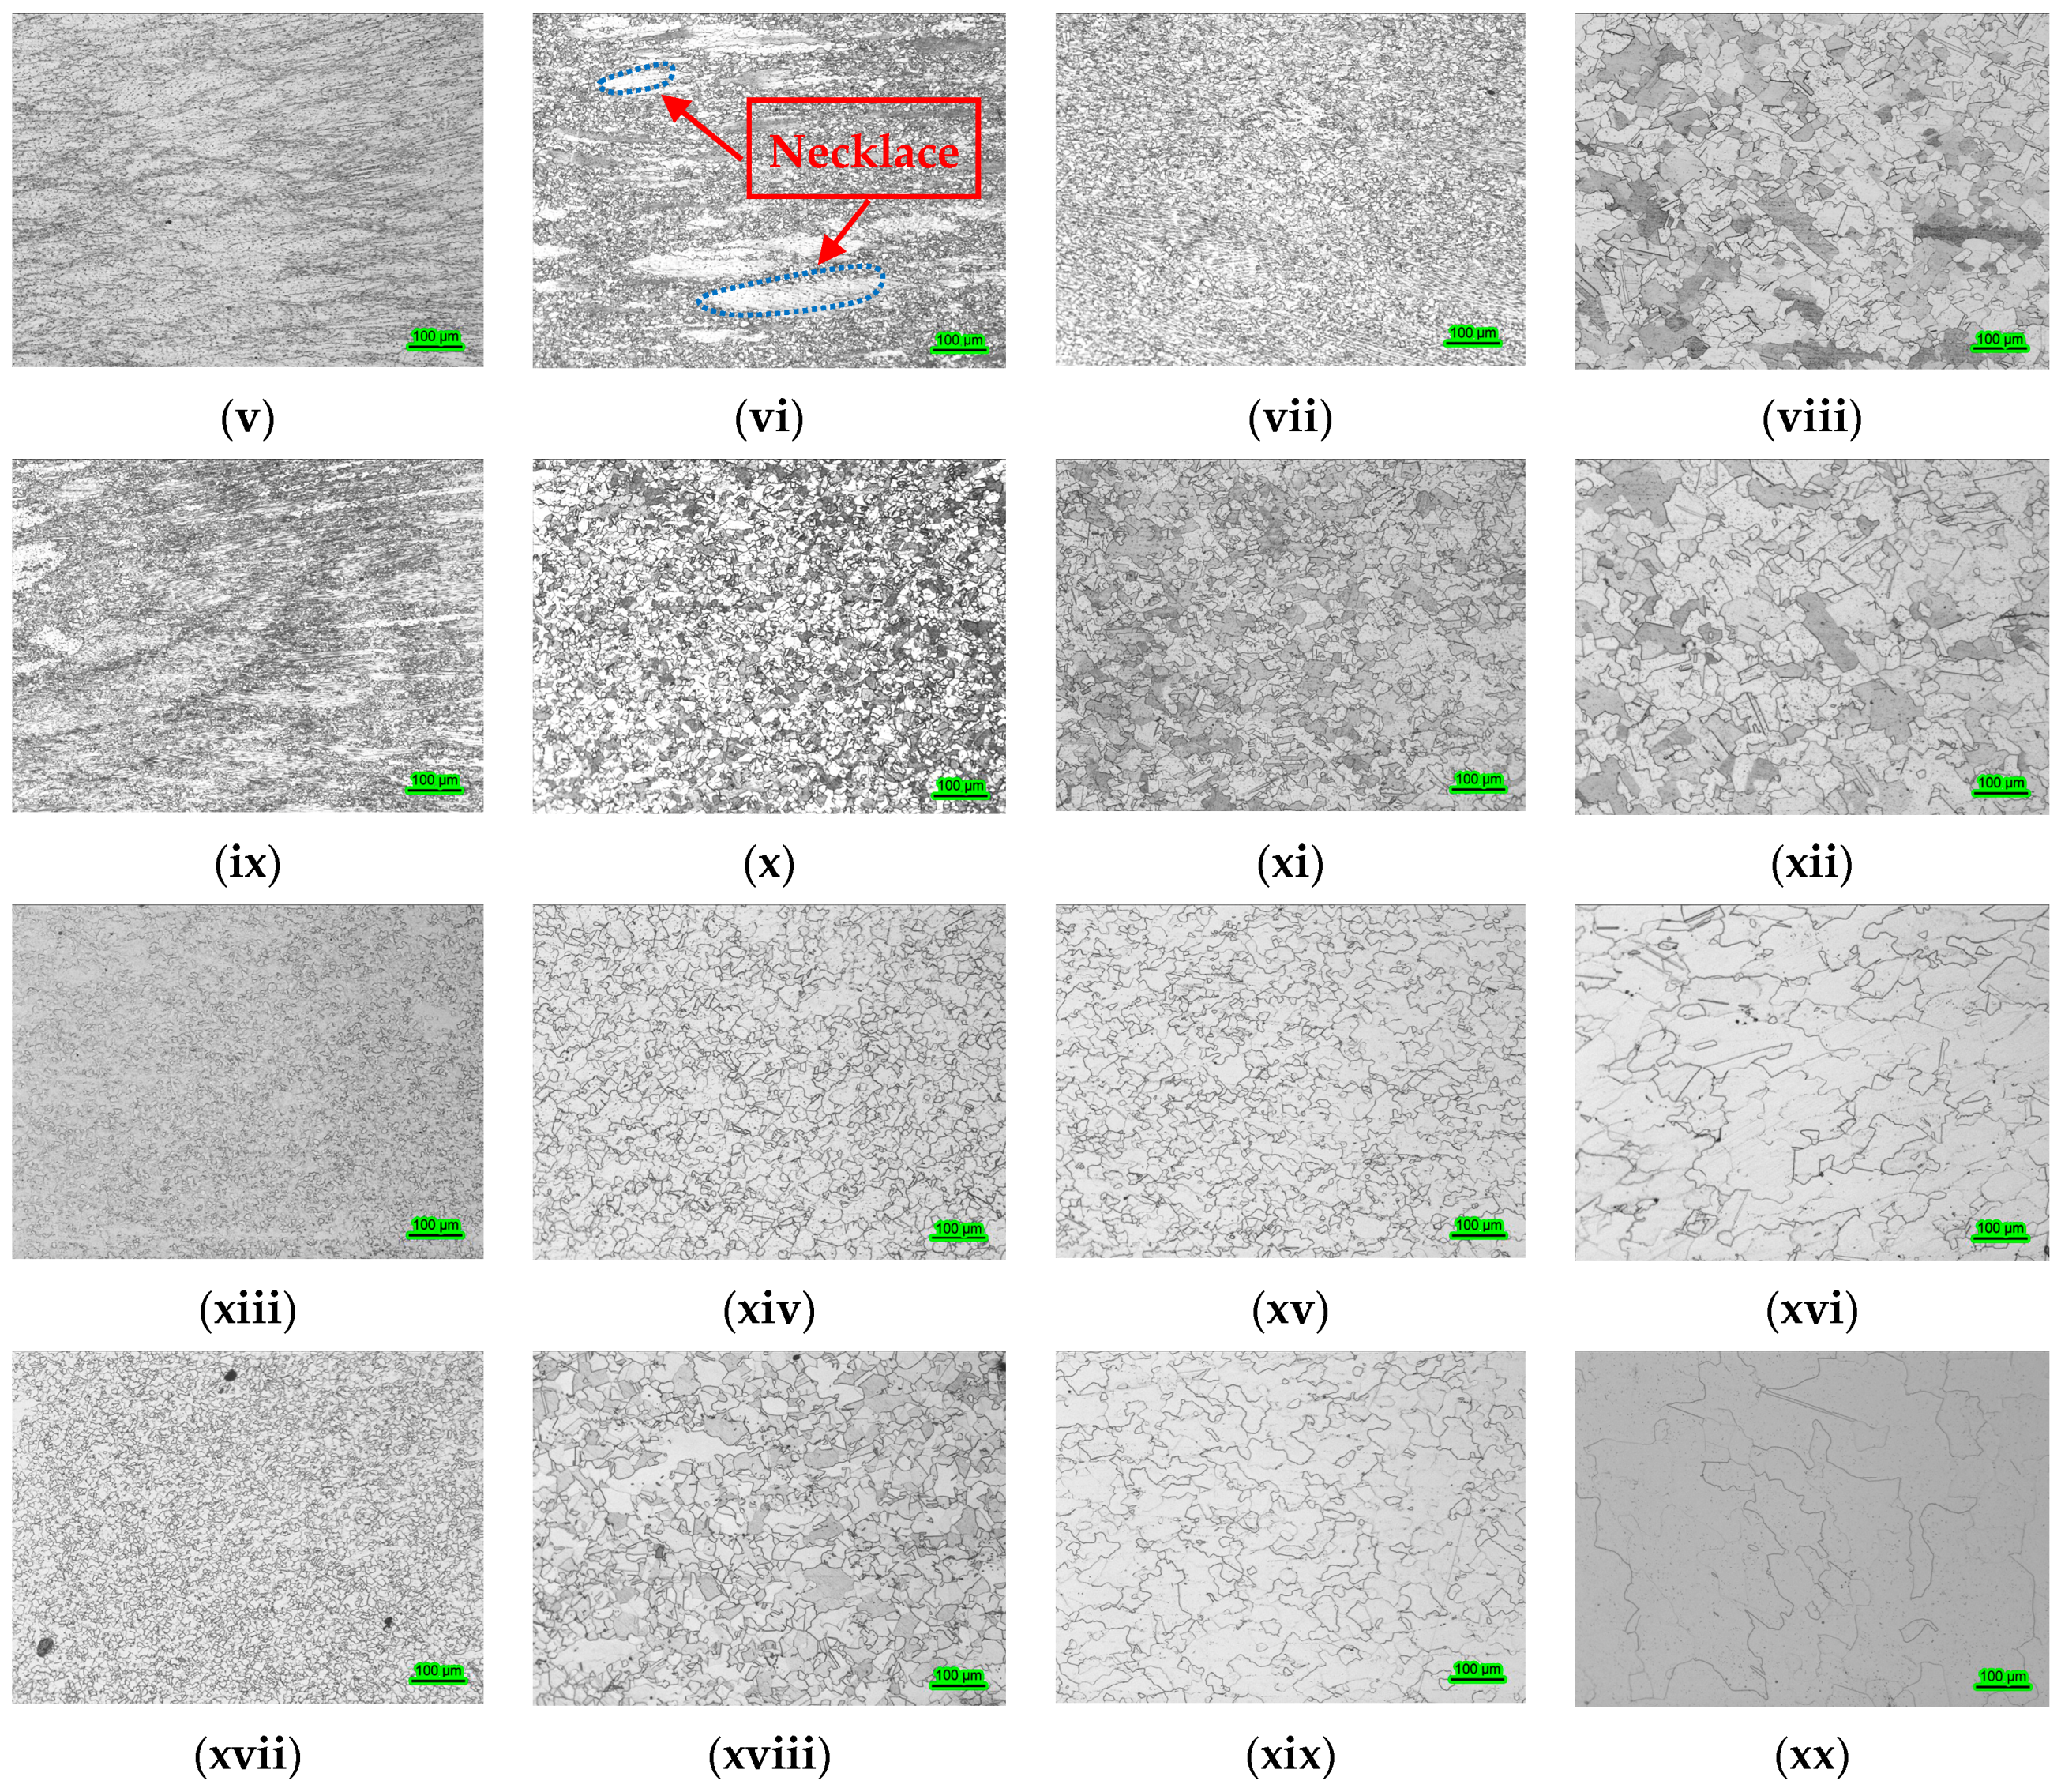
3.5. Typical Microstructures of PM/Wrought Dual Superalloy Processed After Hot Plastic Deformation

Figure 14 shows the microstructures of the PM/Wrought dual superalloys that were deformed at different hot compression conditions. Obviously, the deformation temperature and strain rate have great effects on the interface microstructure of the PM/Wrought dual superalloy. Moreover, it can be clearly observed from Figure 14 that these typical microstructures provide the evidence for DRV, DRX, and grain growth. The compression microstructures of the samples at 1020 °C under different strain rates are shown in Figure 14i–iv. In these microstructures, many grains are elongated in the compression direction and the grain boundaries are irregular. In general, the DRV are difficult to encourage to develop due to the limited deformation activation energy when the deformation temperature is low. When the PM/Wrought dual superalloy deformed at the deformation temperature of 1050 °C and high strain rates of 0.1–1.0 s−1, the typical microstructures present a distinct feature of DRV. In addition, typical necklace structures could be observed, as shown in Figure 14vi, in which the residual dendrite is entirely surrounded by the recrystallized grains. A typical DRX microstructure is shown at the lower-left domain with the deformation temperatures of 1080–1140 °C and strain rates of 0.1–1.0 s−1. The distribution of DRX grains and residual dendrite in this domain can be seen. Furthermore, the area fraction of DRX grain increases with deformation temperature, this indicates that the relatively high deformation temperature can accelerate the process of DRX. As shown in the lower-right domain, the residual dendrites are almost totally disappeared at deformation temperatures of 1110–1140 °C and strain rates of 0.001–0.01 s−1 due to the DRX has occurred fully. Moreover, it is noteworthy that the coarse microstructure exists at this domain. This phenomenon is owing to the grain growth and strengthened phase being coarsened when the samples were deformed at the lower strain rate. So as to obtain the homogeneous microstructure with fine grains and realize a great transition of the welding interface, hot plastic deformation should be processed under the condition of 1140 °C/1.0 s−1 with the peak efficiency of 0.55. After hot plastic deformation, the microstructure of welding seam for PM/Wrought dual superalloy was greatly improved, showing equiaxed microstructure. It is noteworthy that there may be some differences in grain size between powder metallurgy superalloy, bonding interface, and wrought superalloy. Therefore, further research focus should be concentrated on microstructural optimization.

4. Conclusions

The hot deformation behavior and microstructural mechanism of PM/Wrought dual superalloy fabricated by electron beam welding have been deeply investigated at the deformation temperatures of 1020–1140 °C and strain rates of 0.001–1.0 s−1. Conclusions as below can be summarized from this research:
(1)
PM/Wrought dual superalloy presents the similar flow behavior to that of single alloy. The true stress-strain curves indicate that the deformation temperature and strain rate have a significant effect on the flow behavior of the PM/Wrought dual superalloy.
(2)
The apparent activation energy of the PM/Wrought dual superalloy at the strain of 0.2 was determined as 780.07 kJ·mol−1. The constitutive equation constructed for modeling the hot plastic deformation of PM/Wrought dual superalloy can be expressed as:
ε ˙ = 2.33 × 10 28 [ sinh ( 0.0066 σ ) ] 4.14 exp ( 780070 R T )
(3)
A new approach for finding the instable region from power dissipation map was proposed: the “cliff” and “valley” features are the sufficient conditions of flow instability.
(4)
According to the power dissipation map and microstructural characterization, the optimum hot plastic deformation parameter is suggested to be 1140 °C/1.0 s−1 with the peak efficiency of 0.55 for manufacturing the dual-property turbine disc.

Author Contributions

Methodology, B.Z.; investigation, B.Z. and H.Y.; writing—original draft preparation, B.Z. and X.L.; writing—review and editing, Y.N.; funding acquisition, Y.N.

Funding

The work was financially supported by the National Natural Science Foundation of China (Grant No. 51775440) and Fundamental Research Funds for the Central Universities (Grant No. 3102018ZY005).

Conflicts of Interest

The authors declare no conflict of interest.

References

  1. Ning, Y.Q.; Yao, Z.K.; Guo, H.Z.; Fu, M.W. Structural-gradient-materials produced by gradient temperature heat treatment for dual-property turbine disc. J. Alloys Compd. 2013, 557, 27–33. [Google Scholar] [CrossRef]
  2. Cheng, C.; Yu, B.B.; Chen, Z.Y.; Liu, J.R.; Wang, Q.J. Mechanical properties of electron beam welded dissimilar joints of TC17 and Ti60 alloys. J. Mater. Sci. Technol. 2018, 34, 1859–1866. [Google Scholar] [CrossRef]
  3. Zhang, S.L.; Ma, Y.J.; Huang, S.S.; Youssef, S.S.; Qi, M.; Wang, H.; Qiu, J.K.; Lei, J.F.; Yang, R. Temperature-gradient induced microstructure evolution in heat-affected zone of electron beam welded Ti-6Al-4V titanium alloy. J. Mater. Sci. Technol. 2019, 35, 1681–1690. [Google Scholar] [CrossRef]
  4. Vishwakarma, K.R.; Richards, N.L.; Chaturvedi, M.C. Microstructural analysis of fusion and heat affected zones in electron beam welded ALLVAC® 718PLUSTM superalloy. Mater. Sci. Eng. A 2008, 480, 517–528. [Google Scholar] [CrossRef]
  5. Ning, Y.Q.; Yao, Z.K.; Guo, H.Z.; Fu, M.W. Hot deformation behavior and hot working characteristic of Nickel-base electron beam weldments. J. Alloys Compd. 2014, 584, 494–502. [Google Scholar] [CrossRef]
  6. Qin, C.; Yao, Z.K.; Ning, Y.Q.; Shi, Z.F.; Guo, H.Z. Hot deformation behavior of TC11/Ti−22Al−25Nb dual-alloy in isothermal compression. Trans. Nonferrous Met. Soc. China 2015, 25, 2195–2205. [Google Scholar] [CrossRef]
  7. Chen, X.M.; Lin, Y.C.; Wen, D.X.; Zhang, J.L.; He, M. Dynamic recrystallization behavior of a typical nickel-based superalloy during hot deformation. Mater. Des. 2014, 57, 568–577. [Google Scholar] [CrossRef]
  8. Lin, Y.C.; Wu, X.Y.; Chen, X.M.; Chen, J.; Wen, D.X.; Zhang, J.L.; Li, L.T. EBSD study of a hot deformed nickel-based superalloy. J. Alloys Compd. 2015, 604, 101–113. [Google Scholar] [CrossRef]
  9. Sellars, C.M.; Mctegart, W.J. On the mechanism of deformation. Acta Metall. 1966, 14, 1136–1138. [Google Scholar] [CrossRef]
  10. Kashyap, B.P.; Chaturvedi, M.C. Activation energy for superplastic deformation of in718 superalloy. Scripta Mater. 2000, 43, 429–433. [Google Scholar] [CrossRef]
  11. Briottet, L.; Jonas, J.J.; Montheillet, F. A mechanical interpretation of the activation energy of high temperature deformation in two phase materials. Acta Mater. 1996, 44, 1665–1672. [Google Scholar] [CrossRef]
  12. Zener, C.; Hollomon, J.H. Effect of strain rate upon plastic flow of steel. J. Appl. Phys. 1944, 15, 22–32. [Google Scholar] [CrossRef]
  13. Mehtedi, M.E.; Gabrielli, F.; Spigarelli, S. Hot workability in process modeling of a bearing steel by using combined constitutive equations and dynamic material model. Mater. Des. 2014, 53, 398–404. [Google Scholar] [CrossRef]
  14. Anbuselvan, S.; Ramanathan, G. Hot deformation and processing maps of extruded ZE41A magnesium alloy. Mater. Des. 2010, 31, 2319–2323. [Google Scholar] [CrossRef]
  15. Lin, Y.C.; Li, L.T.; Xia, Y.C.; Jiang, Y.Q. Hot deformation and processing map of a typical Al–Zn–Mg–Cu alloy. J. Alloys Compd. 2013, 550, 438–445. [Google Scholar] [CrossRef]
  16. Prasad, Y.V.R.K. Processing maps: A status report. J. Mater. Eng. Perform. 2003, 12, 638–645. [Google Scholar] [CrossRef]
  17. Rao, K.P.; Prasad, Y.V.R.K.; Suresh, K. Hot working behavior and processing map of a γ-TiAl alloy synthesized by powder metallurgy. Mater. Des. 2011, 32, 4874–4881. [Google Scholar] [CrossRef]
  18. Stüwe, H.P.; Les, P. Strain rate sensitivity of flow stress at large strain. Acta Mater. 1998, 46, 6375–6380. [Google Scholar] [CrossRef]
  19. Ghosh, A.K. On the measurement of strain-rate sensitivity for deformation mechanism in conventional and ultra-fine grain alloys. Mater. Sci. Eng. A 2007, 463, 36–40. [Google Scholar] [CrossRef]
  20. Ning, Y.Q.; Yao, Z.K.; Guo, H.Z.; Fu, M.W.; Li, H.; Xie, X.H. Investigation on hot deformation behavior of P/M Ni-base superalloy FGH96 by using processing maps. Mater. Sci. Eng. A 2010, 527, 6794–6799. [Google Scholar] [CrossRef]
  21. Lin, Y.C.; Deng, J.; Jiang, Y.Q.; Wen, D.X.; Liu, G. Hot tensile deformation behaviors and fracture characteristics of a typical Ni-based superalloy. Mater. Des. 2014, 55, 949–957. [Google Scholar] [CrossRef]
  22. Liu, Y.H.; Ning, Y.Q.; Yang, X.M.; Yao, Z.K.; Guo, H.Z. Effect of temperature and strain rate on the workability of FGH4096 superalloy in hot deformation. Mater. Des. 2016, 95, 669–676. [Google Scholar] [CrossRef]
  23. Ning, Y.Q.; Yao, Z.K.; Li, H.; Guo, H.Z.; Tao, Y.; Zhang, Y.W. High temperature deformation behavior of hot isostatically pressed P/M FGH4096 superalloy. Mater. Sci. Eng. A 2010, 527, 961–966. [Google Scholar] [CrossRef]
  24. Liu, Y.H.; Ning, Y.Q.; Yao, Z.K.; Fu, M.W. Hot deformation behavior of the 1.15C–4.00Cr–3.00V–6.00W–5.00Mo powder metallurgy high speed steel. Mater. Des. 2014, 54, 854–863. [Google Scholar] [CrossRef]
  25. Doraivelu, S.M.; Gegel, H.L.; Gunasekera, J.S.; Malas, J.C.; Morgan, J.T.; Thomas, J.F. A new yield function for compressible p/m material. Int. J. Mech. Sci. 1984, 26, 527–535. [Google Scholar] [CrossRef]
  26. Collings, E.W.; Gegel, H.L. A physical basis for solid-solution strengthening and phase stability in alloys of titanium. Scripta Metall. 1973, 7, 437–443. [Google Scholar] [CrossRef]
  27. Malas, J.C.; Seetharaman, V. Using material behavior models to develop process control strategies. JOM 1992, 44, 8–13. [Google Scholar] [CrossRef]
  28. Murty, S.V.S.N.; Rao, B.N.; Kashyap, B.P. Instability criteria for hot deformation of materials. Int. Mater. Rev. 2000, 45, 15–26. [Google Scholar] [CrossRef]
  29. Semiatin, S.L.; Seetharaman, V.; Weiss, I. Hot workability of titanium and titanium aluminide alloys—an overview. Mater. Sci. Eng. A 1998, 243, 1–24. [Google Scholar] [CrossRef]
Figure 1. Schematic illustration of the fabrication for dual-property turbine disc in present research.
Metals 09 01127 g001
Figure 2. Typical microstructure of the PM/Wrought dual superalloy. (a) Optical micrograph showing previous particle boundaries (PPBs) network in base metal PM superalloy, dendrite microstructure in fusion zone, and equiaxed microstructure in base metal wrought superalloy; (b) Optical micrograph showing no boundary between PM superalloy and fusion zone at higher magnification; (c) Optical micrograph showing obvious boundary between fusion zone and wrought superalloy at higher magnification.
Metals 09 01127 g002
Figure 3. The true stress-strain curves of the PM/Wrought dual superalloy under different deformation temperatures with strain rates of (a) 1.0 s−1; (b) 0.1 s−1; (c) 0.01 s−1; (d) 0.001 s−1.
Metals 09 01127 g003
Figure 4. Relationship of the PM/Wrought dual superalloy between: (a) ln σ and ln ε ˙ ; (b) σ and ln ε ˙ .
Metals 09 01127 g004
Figure 5. Relationship of the PM/Wrought dual superalloy between: (a) ln ε ˙ and ln [ sin h ( α σ ) ] ; (b) ln [ sin h ( α σ ) ] and ( 1000 / T ) .
Metals 09 01127 g005
Figure 6. Relationship of the PM/Wrought dual superalloy between ln Z   and   ln [ sin h ( α σ ) ] .
Metals 09 01127 g006
Figure 7. Relationships between (a) Q; (b) ln A ; (c) n; (d) α; and true strain in polynomial fit of the PM/Wrought dual superalloy.
Metals 09 01127 g007
Figure 8. Comparison between experimental and predicted flow stresses of the PM/Wrought dual superalloy at deformation temperatures of (a) 1020 °C; (b) 1050 °C; (c) 1080 °C; (d) 1110 °C; (e) 1140 °C.
Metals 09 01127 g008aMetals 09 01127 g008b
Figure 9. Relationships between stress and strain rate in log scale of the PM/Wrought dual superalloy at different deformation temperatures as true strains: (a) 0.1; (b) 0.3; (c) 0.5; (d) 0.69.
Metals 09 01127 g009aMetals 09 01127 g009b
Figure 10. The response 3D surfaces of m-values for the PM/Wrought dual superalloy to deformation temperature and strain rate as true strains: (a) 0.1; (b) 0.3; (c) 0.5; (d) 0.69.
Metals 09 01127 g010
Figure 11. The microstructures and m-values of the PM/Wrought dual superalloy processed with the strain rate of 1.0 s−1 at different deformation temperatures of (a) 1020 °C; (b) 1050 °C; (c) 1080 °C; (d) 1110 °C; (e) 1140 °C.
Metals 09 01127 g011
Figure 12. The response 3D surfaces of the efficiency of power dissipation (η) for the PM/Wrought dual superalloy to deformation temperature and strain rate as true strains: (a) 0.1; (b) 0.3; (c) 0.5; (d) 0.69.
Metals 09 01127 g012
Figure 13. Schematic illustration of the instability criterion for PM/Wrought dual superalloy.
Metals 09 01127 g013
Figure 14. Typical microstructures of PM/Wrought dual superalloy processed after hot compression. (i) 1020 °C/1.0 s−1; (ii) 1020 °C/0.1 s−1; (iii) 1020 °C/0.01 s−1; (iv) 1020 °C/0.001 s−1;.(v) 1050 °C/1.0s−1; (vi) 1050 °C/0.1 s−1; (vii) 1050 °C/0.01 s−1; (viii) 1050 °C/0.001 s−1; (ix) 1080 °C/1.0 s−1; (x) 1080 °C/0.1 s−1; (xi) 1080 °C/0.01 s−1; (xii) 1080 °C/0.001 s−1; (xiii) 1110 °C/1.0s−1; (xiv) 1110 °C/0.1 s−1; (xv) 1110 °C/0.01 s−1; (xvi) 1110 °C/0.001 s−1; (xvii) 1140 °C/1.0 s−1; (xviii) 1140 °C/0.1 s−1; (xix) 1140 °C/0.01 s−1; (xx) 1140 °C/0.001 s−1.
Metals 09 01127 g014aMetals 09 01127 g014b
Table 1. Polynomial fit results of Q, ln A , n, and α of the PM/Wrought dual superalloy.
QValue ln A ValuenValueαValue
Q0940.08L079.723N06.3205A00.0074500
Q1−879.10L1−88.860N1−27.140A1−0.016700
Q2−52.679L264.273N2125.381A20.10177
Q32267.1L325.585N3−307.87A3−0.24573
Q4−2840.6L4−37.734N4376.22A40.28957
Q5807.79L5−29.901N5−177.80A5−0.13540

