
Investigation on the Tensile Properties of Inconel 625 Using Small Punch Test
Abstract
:1. Introduction
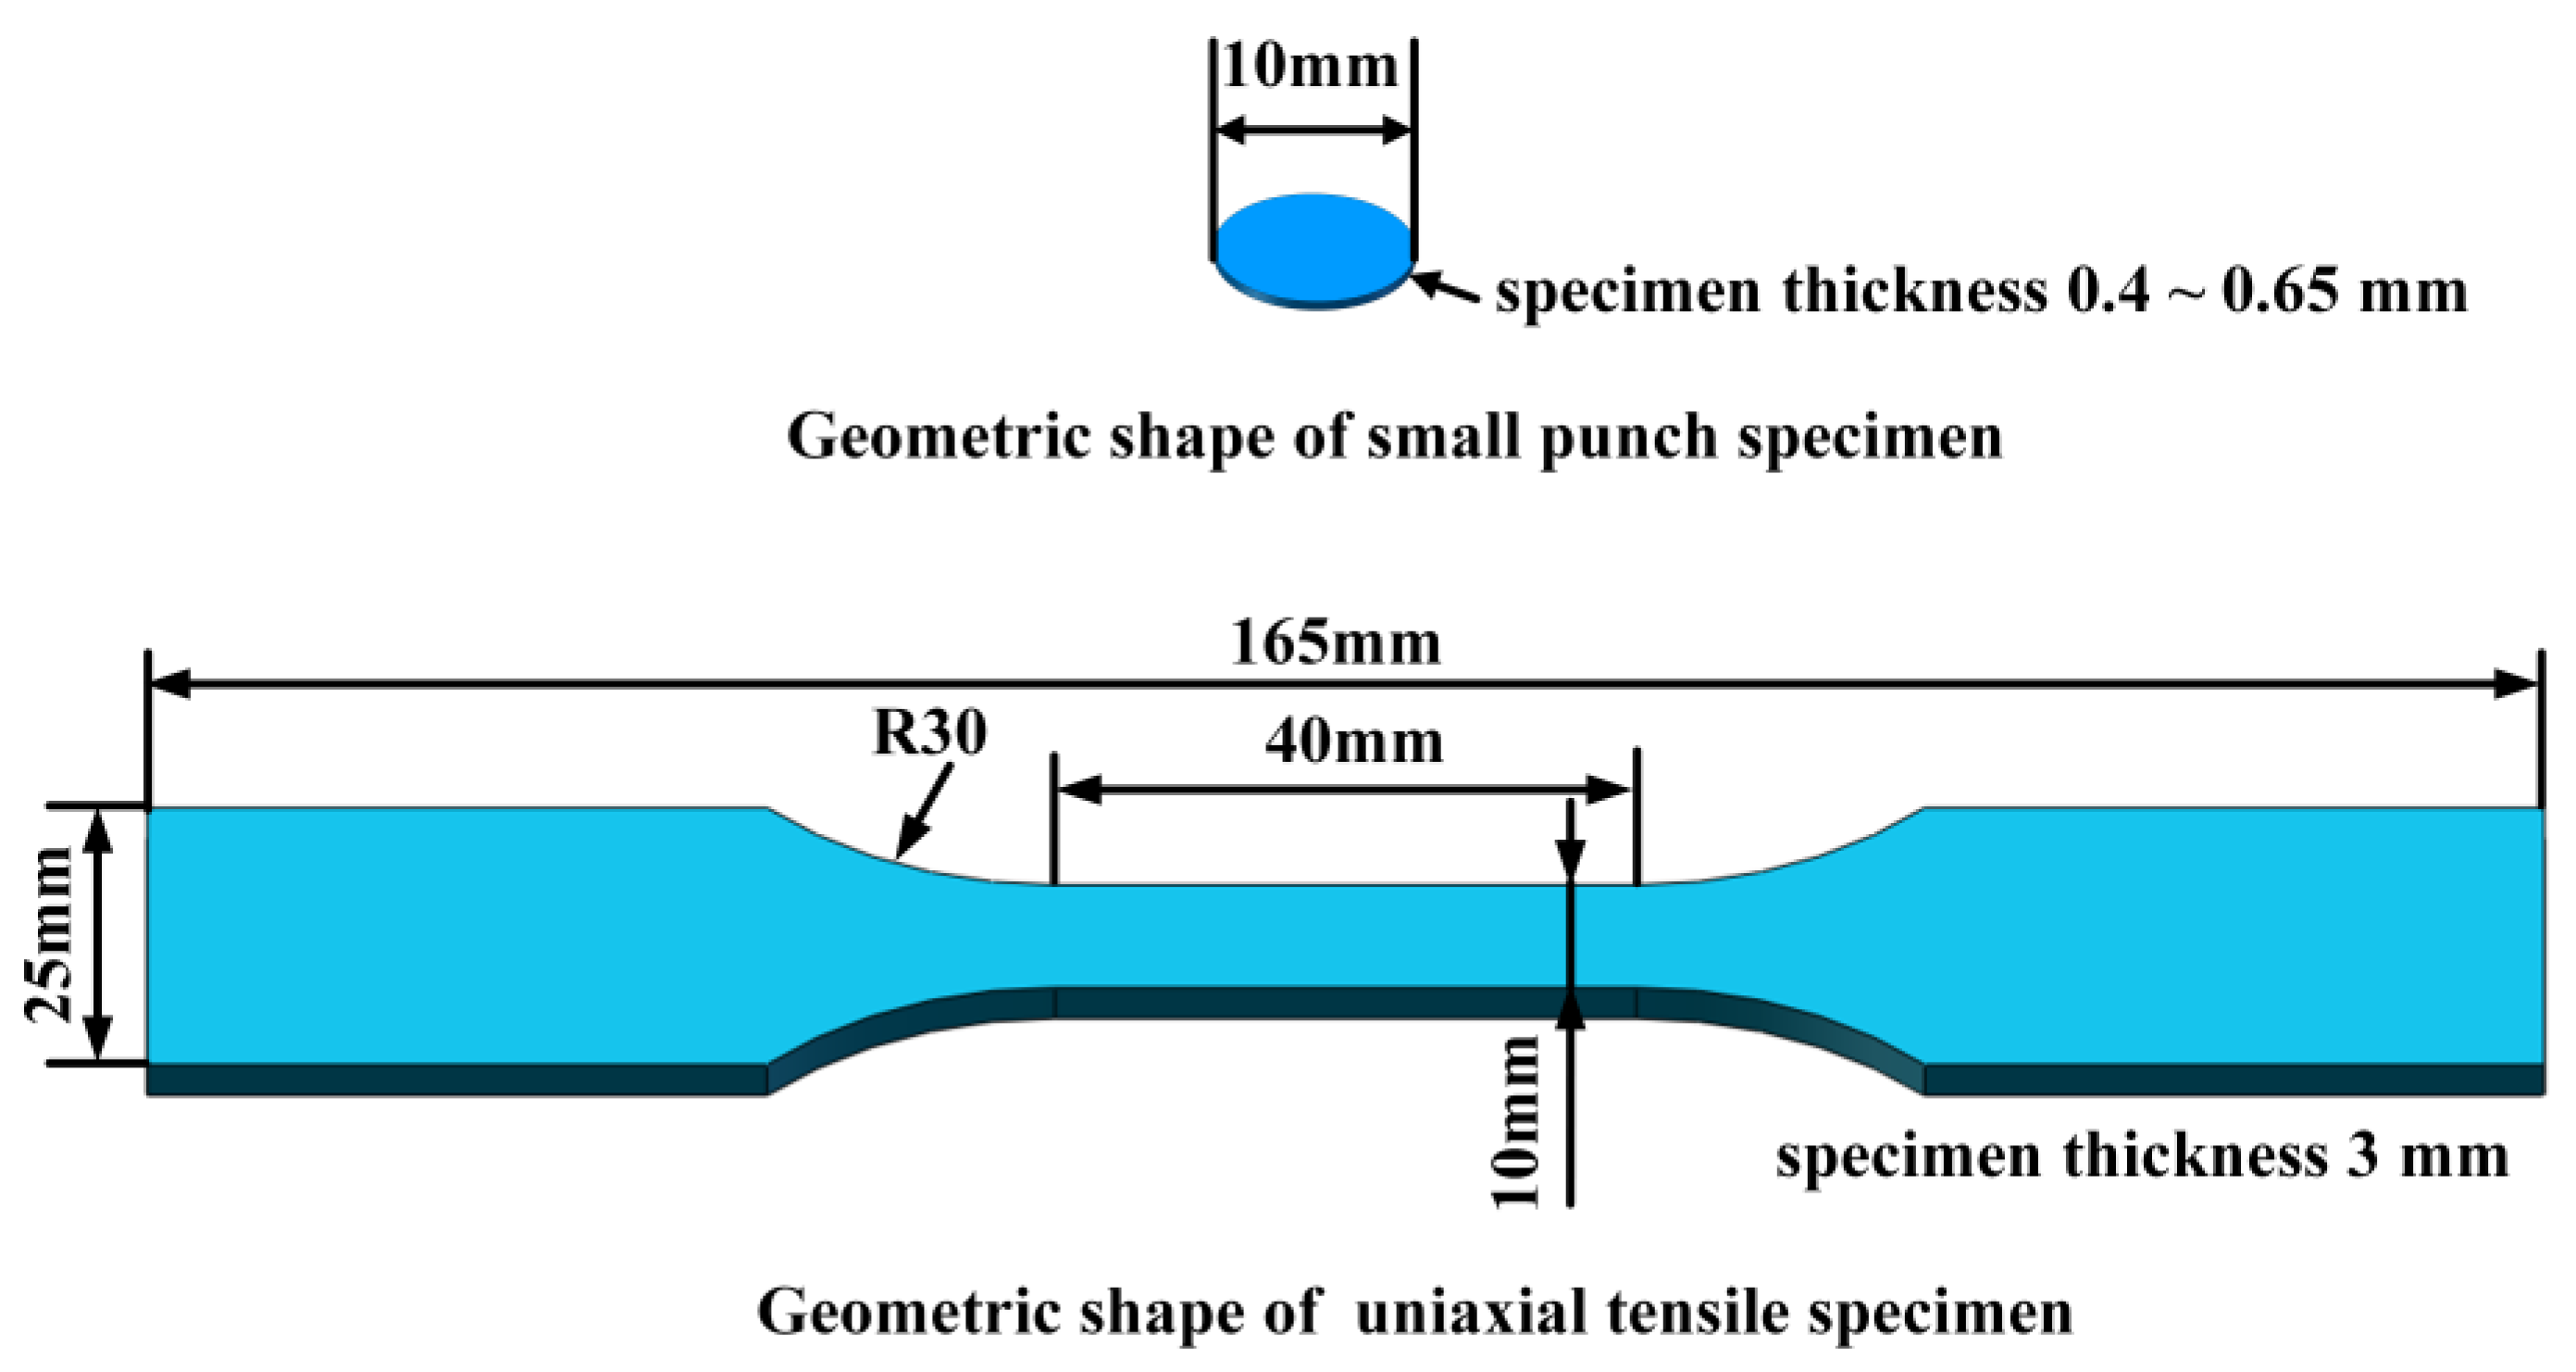
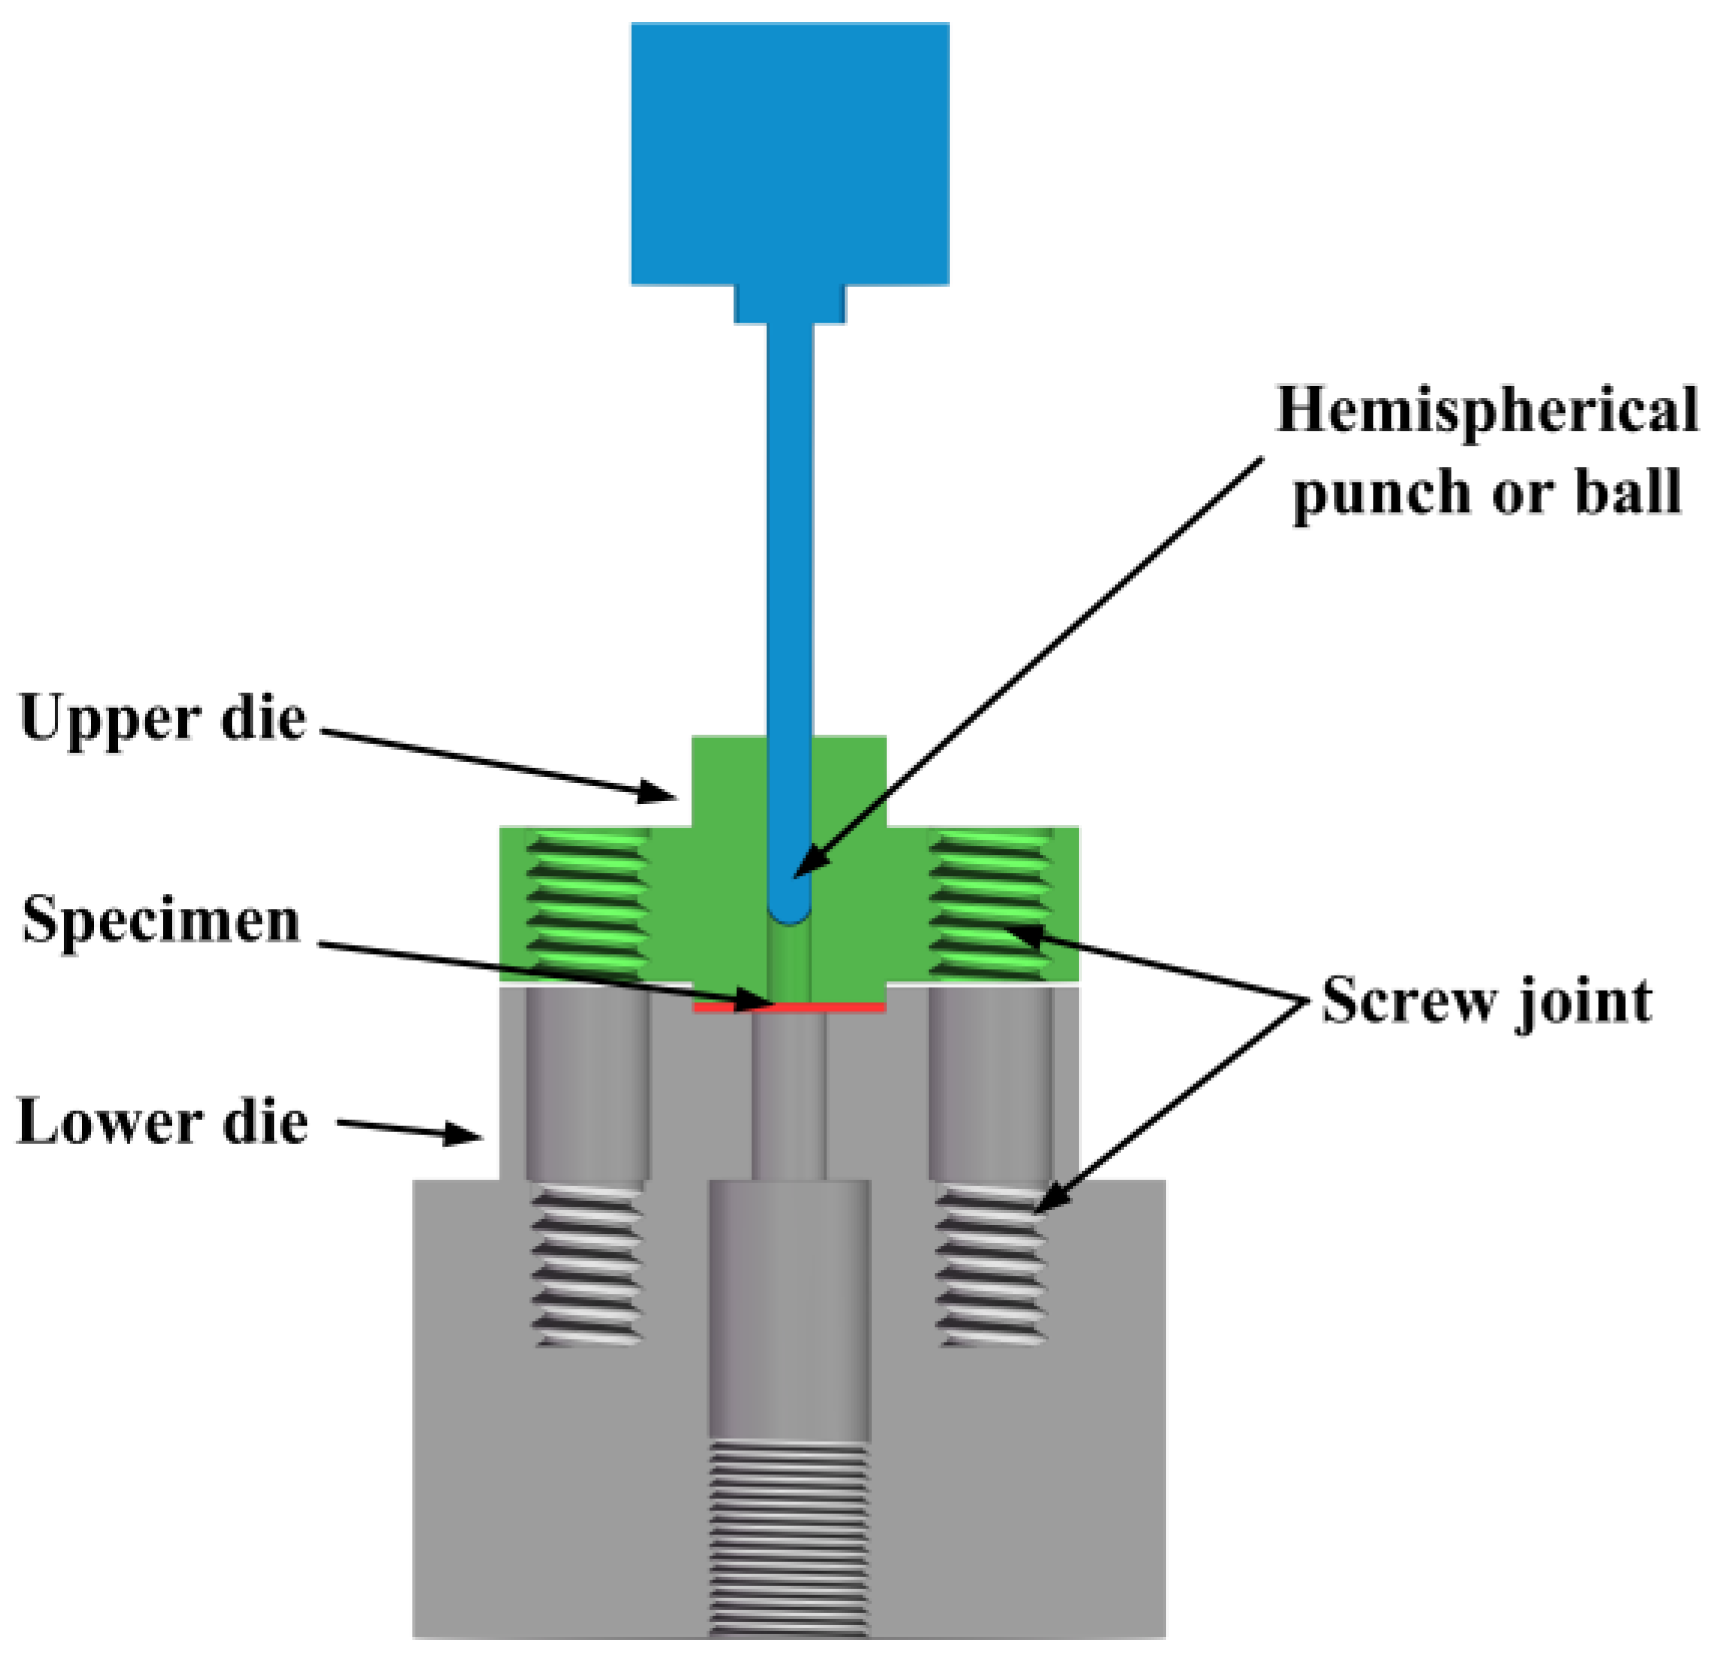
2. Experimental
3. Tensile Strength Estimation Based on Characteristic Load
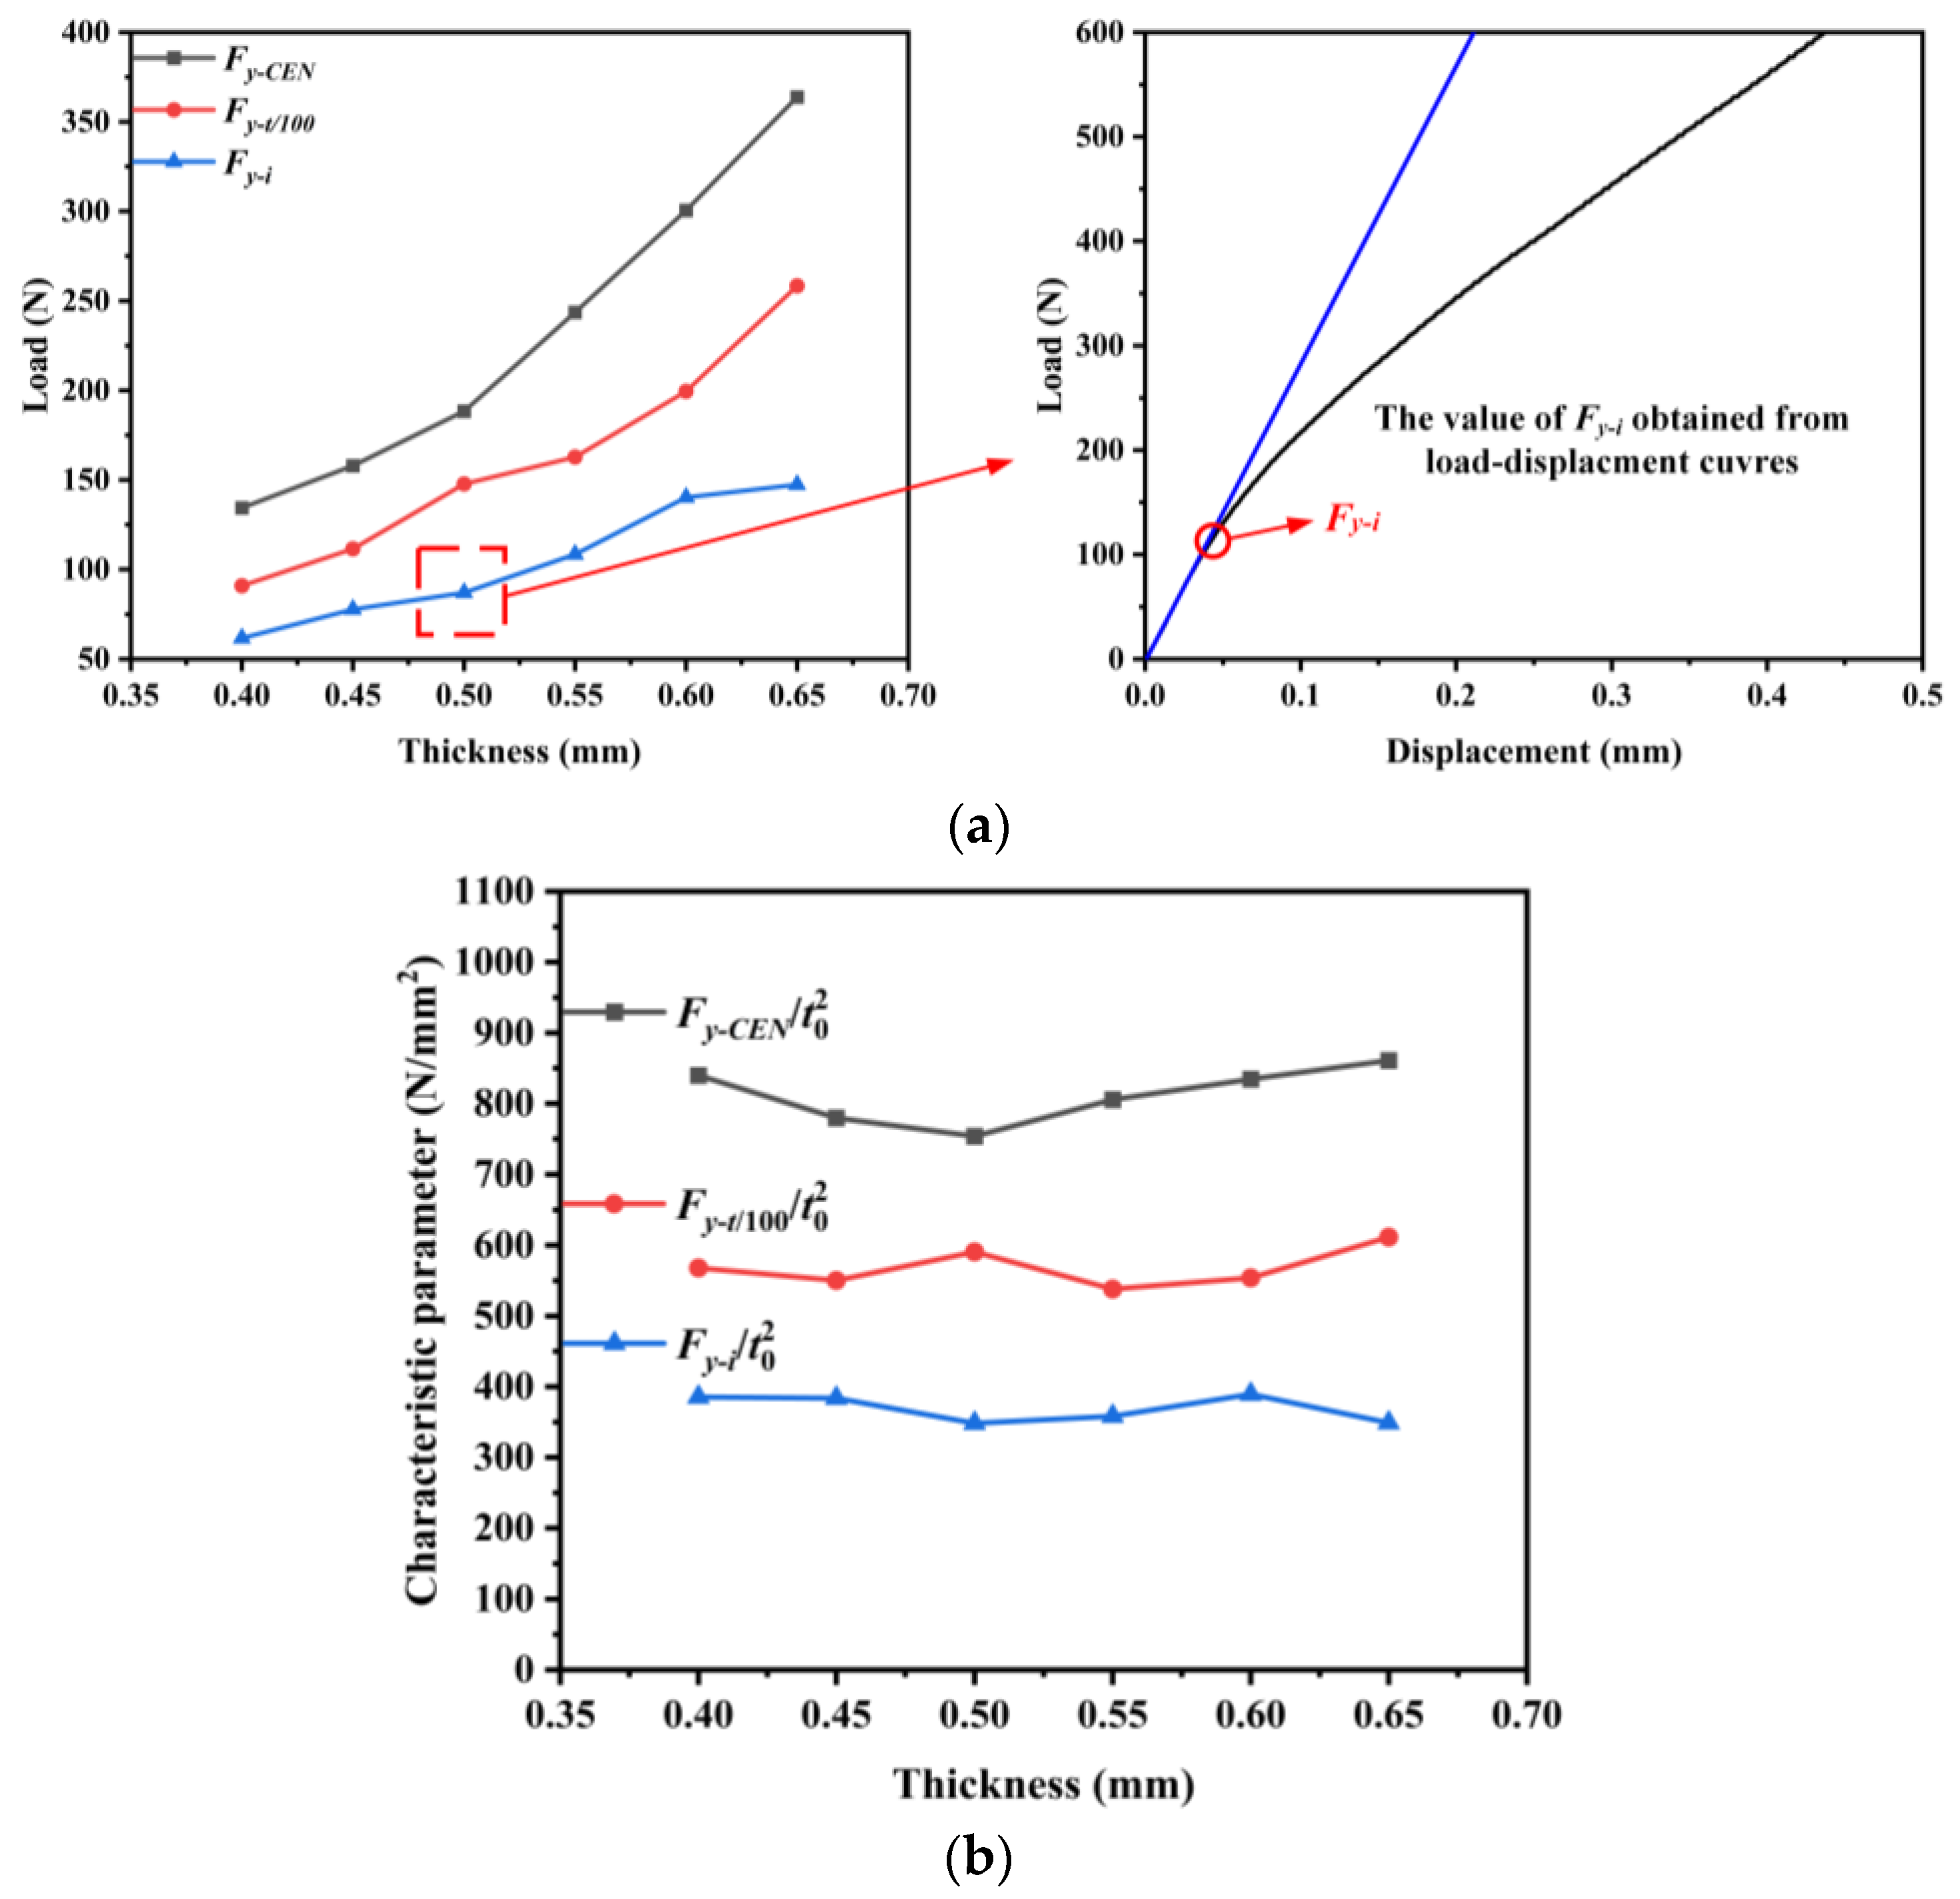
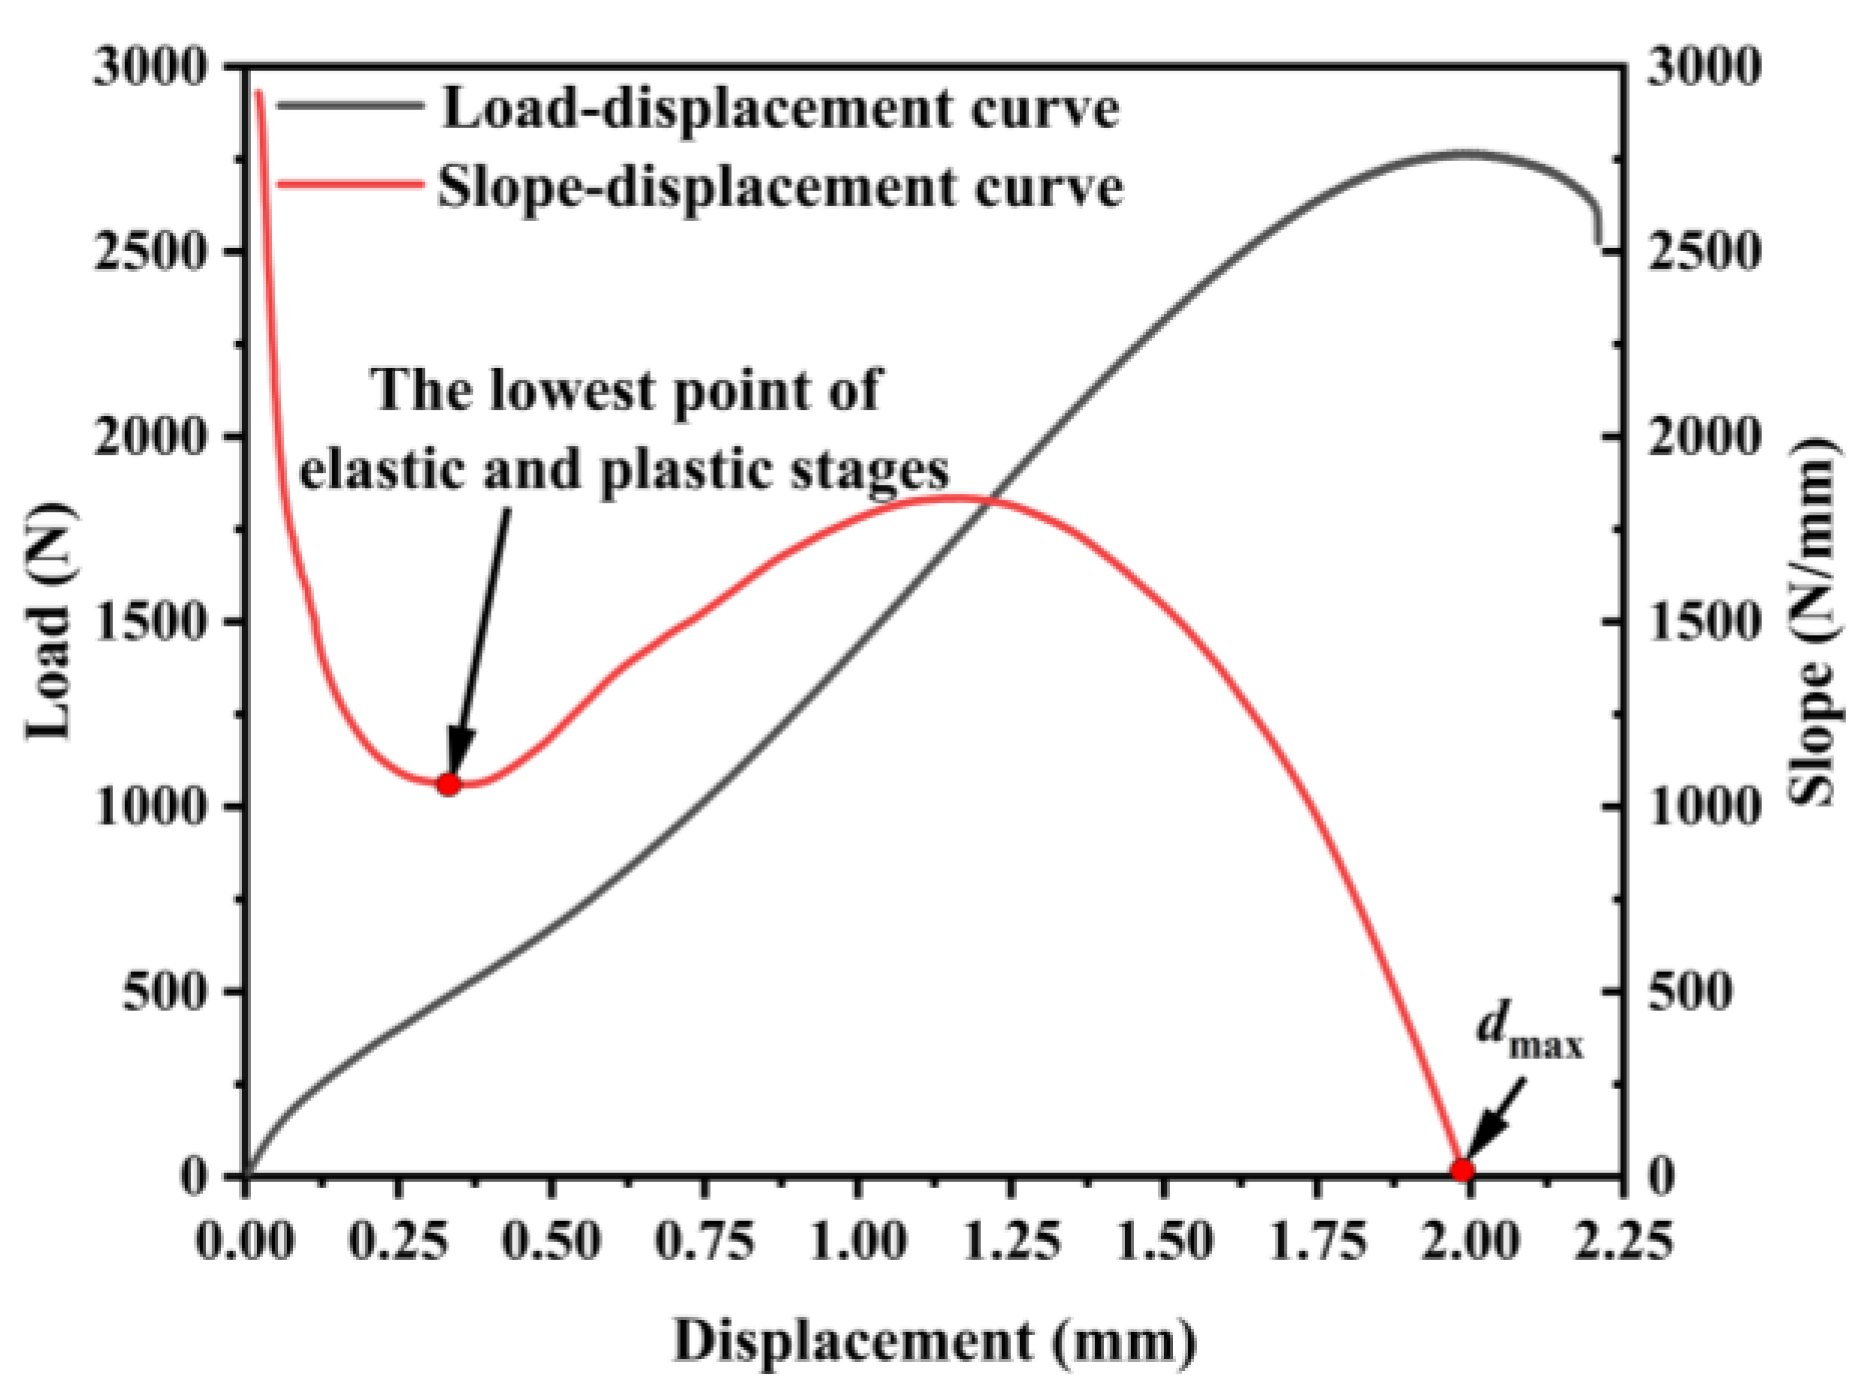
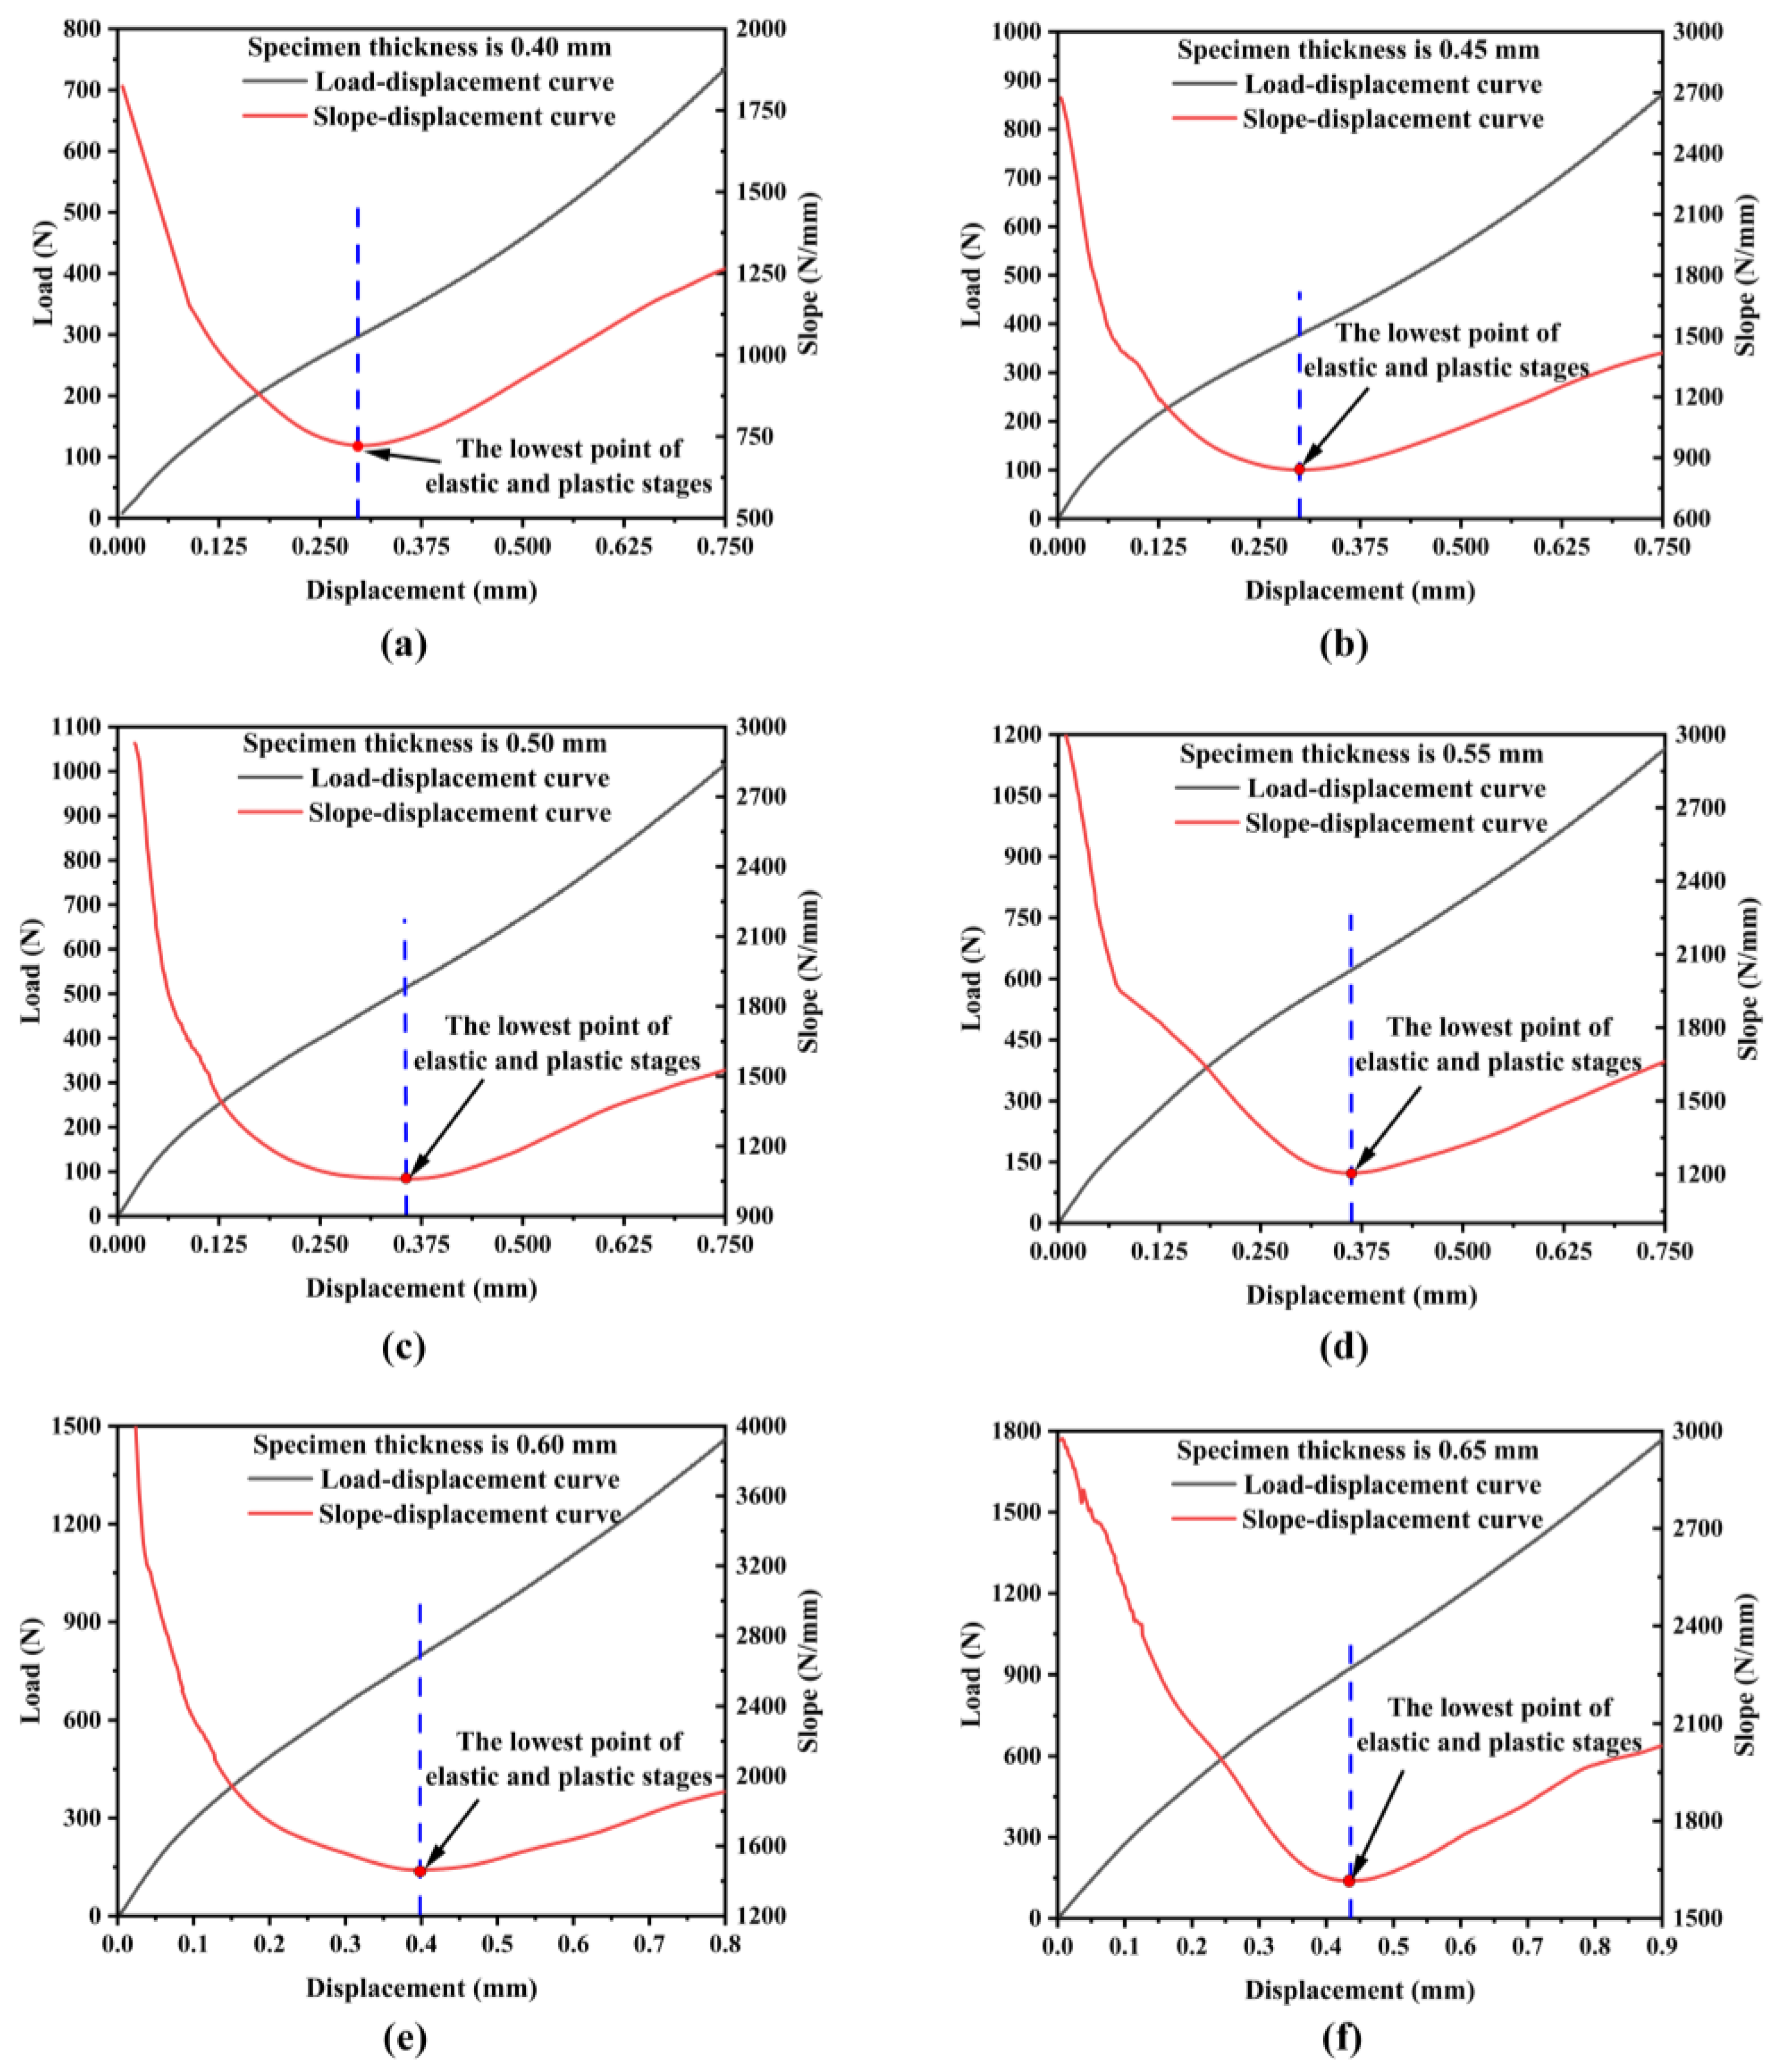
3.1. Yield Strength Estimation Based on the First Inflection Point
3.2. Ultimate Tensile Strength Estimation Based on the Maximum Load
4. Yield Strength Analysis Based on Deformation Energy
5. Conclusions
Author Contributions
Funding
Data Availability Statement
Conflicts of Interest
References
- Fleury, E.; Ha, J.S. Small punch tests to estimate the mechanical properties of steels for steam power plant: I. Mechanical strength. Int. J. Press. Ves. Pip. 1998, 75, 699–706. [Google Scholar] [CrossRef]
- Tian, X.; Zhang, S.F.; Xu, H.; Li, T.J.; Yang, B.X.; Zhang, M. Assessment of Creep Properties Using Small Punch Test for a 9%Cr-Mo-Co-B Power Plant Steel. Metals 2021, 11, 1996. [Google Scholar] [CrossRef]
- Nguyen, T.T.; Park, J.; Bae, K.-O.; Baek, U.B. Correlation between in-situ small punch and conventional test result in evaluating hydrogen embrittlement susceptibility of API X70 base and weld under hydrogen gas mixture. Eng. Fail. Anal. 2024, 159, 108047. [Google Scholar] [CrossRef]
- Milička, K.; Dobes, F. Small punch testing of P91 steel. Int. J. Press. Ves. Pip. 2006, 83, 625–634. [Google Scholar] [CrossRef]
- García, T.E.; Rodríguez, C.; Belzunce, F.J.; Cuesta, I.I. Effect of hydrogen embrittlement on the tensile properties of CrMoV steels by means of the small punch test. Mat. Sci. Eng. A 2016, 664, 165–176. [Google Scholar] [CrossRef]
- Nguyen, T.T.; Yoon, K.B. Fully plastic J-integral and C* equations for small punch test specimen with a surface crack. Int. J. Press. Ves. Pip. 2020, 188, 104214. [Google Scholar] [CrossRef]
- Altstadt, E.; Bergner, F.; Houska, M. Use of the small punch test for the estimation of ductile-to-brittle transition temperature shift of irradiated steels. Nucl. Mater. Energy 2021, 26, 100918. [Google Scholar] [CrossRef]
- Hähner, P.; Soyarslan, C.; Çakan, B.G.; Bargmann, S. Determining tensile yield stresses from Small Punch tests: A numerical-based scheme. Mater. Design 2019, 182, 107974. [Google Scholar] [CrossRef]
- Melkior, T.; Terentyev, D.; Chang, C.C.; Bakaev, A.; Holmström, S.; Lebediev, S.; Paputsia, A. Mechanical properties of structural metallic alloys for nuclear applications deduced by small punch test. J. Nucl. Mater. 2023, 583, 154521. [Google Scholar] [CrossRef]
- Mahalle, G.; Davis, T.P.; Lee, W.E.; Mamun, A.A. Investigation of strain-rate sensitivity of T91 Steel Using Small Punch Testing. Procedia Struct. Integr. 2022, 42, 570–577. [Google Scholar] [CrossRef]
- BS EN 10371: 2021; Metallic Materials-Small Pinch Test Method. CEN: Brussels, Belgium, 2021.
- ASTM E3205-20; Standard Test Method for Small Punch Testing of Metallic Materials. ASTM: West Conshohocken, PA, USA, 2020.
- Calaf-Chica, J.; Bravo Díez, P.M.; Preciado Calzada, M. Improved correlation for elastic modulus prediction of metallic materials in the Small Punch Test. Int. J. Mech. Sci. 2017, 134, 112–122. [Google Scholar] [CrossRef]
- Janča, A.; Siegl, J.; Haušild, P. Small punch test evaluation methods for material characterization. J. Nucl. Mater. 2016, 481, 201–213. [Google Scholar] [CrossRef]
- Mao, X.; Takahashi, H. Development of a further-miniaturized specimen of 3 mm diameter for TJZM disk (0.3 mm) small punch tests. J. Nucl. Mater. 1987, 150, 42–52. [Google Scholar] [CrossRef]
- Leclerc, N.; Khosravani, A.; Hashemi, S.; Miracle, D.B.; Kalidindi, S.R. Correlation of measured load-displacement curves in small punch test with tensile stress-strain curves. Acta Mater. 2021, 204, 116501. [Google Scholar] [CrossRef]
- Rodríguez, C.; Cabezas, J.G.; Cárdenas, E.; Belzunce, F.J.; Betegón, C. Mechanical properties characterization of heat-affected zone using the small punch test. Weld. J. 2009, 88, 188–192. [Google Scholar]
- Calaf-Chica, J.; Bravo Díez, P.M.; Preciado Calzada, M.; Ballorca-Juez, D. A systematic FEM analysis of the influence of mechanical properties in the reliability of the correlation methods in the small punch test. Int. J. Mech. Sci. 2019, 153–154, 299–309. [Google Scholar] [CrossRef]
- Calaf-Chica, J.; Bravo Díez, P.M.; Preciado Calzada, M.; Garcia-Tarrago, M.-J. Optimization of the t/10 offset correlation method to obtain the yield strength with the Small Punch Test. J. Nucl. Mater. 2020, 534, 152177. [Google Scholar] [CrossRef]
- Altstadt, E.; Houska, M.; Simonovski, I.; Bruchhausen, M.; Holmström, S.; Lacalle, R. On the estimation of ultimate tensile stress from small punch testing. Int. J. Mech. Sci. 2018, 136, 85–93. [Google Scholar] [CrossRef]
- Isselin, J.; Shoji, T. Yield strength evaluation by small-punch test. J. Test. Eval. 2009, 37, 531–537. [Google Scholar] [CrossRef]
- Abendroth, M.; Kuna, M. Identification of ductile damage and fracture parameters from the small punch test using neural networks. Eng. Fract. Mech. 2006, 73, 710–725. [Google Scholar] [CrossRef]
- Husain, A.; Sehgal, D.K.; Pandey, R.K. An inverse finite element procedure for the determination of constitutive tensile behavior of materials using miniature specimen. Comp. Mater. Sci. 2004, 31, 84–92. [Google Scholar] [CrossRef]
- Pan, H.Y.; Peng, J.; Geng, X.X.; Gao, M.X.; Miao, X.T. Prediction of mechanical properties for typical pressure vessel steels by small punch test combined with machine learning. Int. J. Press. Ves. Pip. 2023, 206, 105060. [Google Scholar] [CrossRef]
- Moreno, M.F. Effects of thickness specimen on the evaluation of relationship between tensile properties and small punch testing parameters in metallic materials. Mater. Des. 2018, 157, 512–522. [Google Scholar] [CrossRef]
- Calaf-Chica, J.; Bravo Díez, P.M.; Preciado Calzada, M. Development of an improved prediction method for the yield strength of steel alloys in the Small Punch Test. Mater. Des. 2018, 148, 153–166. [Google Scholar] [CrossRef]
- Mak, J.; Wei, T.; Wuhrer, R.; Yeung, W.; Heness, G.; Di, Z. A Solution for Estimating the Tensile Yield Strength from Small Specimens. J. Test. Eval. 2013, 41, 647–650. [Google Scholar] [CrossRef]
- Anand Badrish, C.; Kotkunde, N.; Mahalle, G.; Singh, S.K.; Mahesh, K. Analysis of hot anisotropic tensile flow stress and strain hardening behavior for Inconel 625 alloy. J. Mater. Eng. Perform. 2019, 28, 7537–7553. [Google Scholar] [CrossRef]
- Hyde, T.H.; Stoyanov, M.; Sun, W.; Hyde, C.J. On the interpretation of results from small punch creep tests. J. Strain. Anal. Eng. 2010, 45, 141–164. [Google Scholar] [CrossRef]
- García, T.E.; Rodríguez, C.; Belzunce, F.J.; Suárez, C. Estimation of the mechanical properties of metallic materials by means of the small punch test. J. Alloys Compd. 2014, 582, 708–717. [Google Scholar] [CrossRef]
- Yang, S.S.; Xue, L.; Lu, W.B.; Ling, X. Experimental study on the mechanical strength and dynamic strain aging of Inconel 617 using small punch test. J. Alloys Compd. 2020, 815, 152447. [Google Scholar] [CrossRef]
- Singh, S.P.; Bhattacharya, S.; Sehgal, D.K. Evaluation of high temperature mechanical strength of Cr–Mo grade steel through small punch test technique. Eng. Fail. Anal. 2014, 39, 207–220. [Google Scholar] [CrossRef]
- Pandey, A.V.; Karthik, V.; Shaik, A.R.; Kolhatkar, A.; Divakar, R. Estimation of UTS from small punch test using an Improved method. Int. J. Press. Ves. Pip. 2022, 200, 104818. [Google Scholar] [CrossRef]


Disclaimer/Publisher’s Note: The statements, opinions and data contained in all publications are solely those of the individual author(s) and contributor(s) and not of MDPI and/or the editor(s). MDPI and/or the editor(s) disclaim responsibility for any injury to people or property resulting from any ideas, methods, instructions or products referred to in the content. |
© 2024 by the authors. Licensee MDPI, Basel, Switzerland. This article is an open access article distributed under the terms and conditions of the Creative Commons Attribution (CC BY) license (https://creativecommons.org/licenses/by/4.0/).
Share and Cite
Li, C.; Shi, S.; Zhang, J.; Yang, S.; Li, Q. Investigation on the Tensile Properties of Inconel 625 Using Small Punch Test. Metals 2024, 14, 411. https://doi.org/10.3390/met14040411
Li C, Shi S, Zhang J, Yang S, Li Q. Investigation on the Tensile Properties of Inconel 625 Using Small Punch Test. Metals. 2024; 14(4):411. https://doi.org/10.3390/met14040411
Chicago/Turabian StyleLi, Changjian, Shuaichen Shi, Jianwen Zhang, Sisheng Yang, and Qingsheng Li. 2024. "Investigation on the Tensile Properties of Inconel 625 Using Small Punch Test" Metals 14, no. 4: 411. https://doi.org/10.3390/met14040411