Article

Rapid Prediction of Hot-Air Temperature of Kalugin Top Combustion Hot Blast Stove by Means of Computational Fluid Dynamics Numerical Simulation

School of Materials and Metallurgy, University of Science and Technology Liaoning, Anshan 114051, China
*
Author to whom correspondence should be addressed.
Metals 2023, 13(9), 1623; https://doi.org/10.3390/met13091623
Submission received: 28 July 2023 / Revised: 16 September 2023 / Accepted: 18 September 2023 / Published: 20 September 2023
(This article belongs to the Topic Energy-Saving and Emission Reduction in Metallurgy)

Abstract

:
Based on the three-dimensional (3D) steady-state CFD numerical simulations conducted previously on an industrial Kalugin top combustion hot blast stove, a two-dimensional (2D) transient CFD numerical model for a single channel (hole) of a column of checker bricks in the regenerator of the same hot stove was established in the present work. The average mass flowrate and temperature of the flue gas flowing into the checker brick holes during the combustion period predicted by the 3D model were used as the inlet boundary conditions of the 2D model. Inside the hole of the checker bricks, processes of fluid flow and heat transfer of the flue gas during the combustion period and those of cold air during the hot-air-supply period were simulated using the 2D model for multiple operation cycles (combustion and hot-air-supply periods) of the hot stove, enabling rapid predictions of hot-air temperature under different operating conditions. The simulation results show that when the fuel gas flowrate and air consumption coefficient during the combustion period are controlled within the range of 80,000–100,000 Nm3/h and 1.02–1.28, respectively, a hot-air temperature in the range from 1273 °C to 1295 °C can be obtained during the hot-air-supply period. Applying this optimized operating condition to the industrial hot stove investigated in this study can achieve significant effects of reducing fuel gas flowrate by 8.6% and increasing hot-air temperature by 32 °C. In addition, a regression analysis on the numerical simulation results and the data measured from the industrial hot stove yields a roughly linear relationship between the dome temperature during the combustion period and the hot-air temperature during the hot-air-supply period, that is, the hot-air temperature would be increased by about 16 °C for every increment of 10 °C in the dome temperature, for instance. Therefore, the influences of the operating parameters on heat transfer characteristics in the regenerator and on hot-air temperature obtained in the present work provide a useful reference for guiding the hot stove operation optimization to achieve significant energy saving and emission reduction through facilitating more efficient combustion to minimize fuel gas consumption in steel plants.

1. Introduction

The hot blast stove is one of the important components of the blast furnace ironmaking process. Kalugin [1,2] first proposed the concept of a top combustion hot blast stove. In recent years, many researchers have made technological improvements and practices on hot blast stoves. Xiang and Peng [3] carried out renovations and improvements on the top combustion gas heating stove and summarized the ideas and methods for renovations. Wang et al. [4] proposed using the design of the Kalugin hot blast stove burner to achieve long-term stable operation of the burner. Wei et al. [5,6] developed a high-air-temperature and low-nitrogen-combustion technology, achieving the goal of low nitrogen oxide emissions. Zhu [7] renovated the top combustion hot blast stove by increasing the weight of the heat accumulator so that the air supply temperature of the hot blast stove is increased and the coke ratio of the blast furnace and the cost of pig iron are reduced. Li [8] and Xu [9] proposed a way to increase air temperature and reduce consumption in hot blast stoves, which can also reduce the coke ratio and save production costs.
In addition, more and more researchers have attempted to apply numerical simulation methods to optimize the operation of hot blast stoves. Chen et al. [10] used numerical simulation methods to find that the distribution of cold air in the regenerator can be improved by changing the position of the baffle plate in the grate region and the distribution of the holes on the baffle. Zhong et al. [11] conducted numerical simulations on the heat transfer phenomenon in a self-preheating hot blast stove’s regenerator. Their research results indicate that using the self-preheating process and with combustion of a low-calorific-value fuel gas can achieve hot air temperatures of about 1200 °C. Zhao et al. [12] established a three-dimensional mathematical model of a top combustion hot blast stove and analyzed the influence of the mixed burning of coke oven gas in different proportions on the internal temperature field and hot-air temperature of the hot blast stove. Chen et al. [13] used C language programming to conduct one-dimensional and two-dimensional simulations on the regenerator of a hot blast stove and predicted the temperature distributions in radial and vertical directions in the regenerator and their relationship with operating parameters. Hwang et al. [14] analyzed the heat transfer of multi-layer refractory bricks using finite element software ANSYS 13 APDL and obtained the radial temperature distribution of the refractory bricks. Zheng and Huang [15] simplified the heat transfer in the regenerator of a hot blast stove to that occurring in a single channel of checker bricks and established a model to predict the outlet flue gas temperature during the combustion period and the outlet hot-air temperature during the hot-air-supply period. Compared with the data from a production hot blast stove, the calculation results have a relatively small error, which verifies the validity of the single-channel numerical model. Gan et al. [16] calculated the temperature and stress distribution during the operation of the hot blast stove using a 3D thermodynamic and thermomechanical model. Yu [17] studied the influences of physical parameters (such as thermal conductivity and specific heat capacity, etc.) and geometric parameters (such as the number and diameter of channels and roughness of the channel wall, etc.) of checker bricks on heat transfer efficiency through carrying out numerical simulations. Chen et al. [18] used Fluent 18 software to establish a three-dimensional mathematical model of flow, heat transfer, combustion, and radiation for a new type of annular burner of top combustion hot blast stoves. The combustion process in the stove was calculated at different combustion chamber heights, and the flow, concentration, temperature fields, and flame shape in the combustion chamber were analyzed. Wen et al. [19] performed numerical simulations on the flow and heat-transfer processes in the regenerator under variable operating conditions. They proposed a critical hot air volume that is suitable for hot air supply duration. By assuming the regenerator of a top combustion hot blast stove to be a porous medium body in numerical simulations, Hou and Luo [20] found that the distribution of flue gas on the top surface of the regenerator becomes more uniform after improving the structure of checker bricks. Zhu et al. [21] and Zhang et al. [22] used CFD simulation technology to optimize the structure of the burner and heating wall, respectively. Zhou [23] used CFX 15 software and a simplified modeling method to predict the status of the heat storage in checker bricks in the regenerator of a hot blast stove and obtained the optimal burning method for heating the checker bricks. Chang et al. [24] established a mathematical model for gas flow and heat transfer in a top combustion hot blast stove and analyzed the flow, temperature, and concentration fields inside the stove body. Huang and Lv [25] conducted numerical solutions on two non-equilibrium energy equations describing the transient heat transfer process in a top combustion hot blast stove and obtained results that are helpful for selecting appropriate parameters for operating that hot stove. To solve the phenomenon of uneven temperature distribution on horizontal levels in the regenerator of a traditional top combustion hot blast stove, Zhang et al. [26,27] carried out numerical simulations on the hot stove with the design of a conical throat so as to increase the flue gas flowrate to the regenerator and alter the flow pattern, and eventually effectively lift the temperature of hot air with prolonged supply time. Zetterholm et al. [28] used the finite difference approximation method to establish a mathematical model of heat transfer in a hot blast stove during its operation to evaluate the performance of the hot blast stove. Park et al. [29] established a finite-element-based CFD model to predict the temperature and stress fields of an internal combustion hot blast stove. By using CFD simulation methods, Wang et al. [30] analyzed the distribution characteristics of the flow, CO concentration, and temperature inside three top combustion hot blast stoves with a top injection of combustion air and compared with those inside a traditional top combustion hot blast stove.
So far, research on hot blast stoves reported in the literature has studied heat transfer characteristics between checker bricks and gas only for a specific operation period (either the combustion period or hot-air-supply period), without evaluations based on actual hot stove combustion operation requirements; therefore, there is a lack of systematic numerical simulation investigations on the full operation period (both the combustion period and hot-air-supply period) of hot blast stoves and those numerical simulation methods based on transient three-dimensional models cannot provide quick predictions on hot-air temperature. In addition, the numerical simulation results reported so far also lack verification with data measured from actual hot blast stoves in steel plants. Therefore, in the present work, based on the actual operation requirements of an industrial Kalugin top combustion hot blast stove, a three-dimensional steady-state CFD model for the whole stove body—developed previously [31]—is combined with a two-dimensional transient CFD model—established in the present work for a single channel of checker brick column in the regenerator of the same hot stove to conduct numerical simulations on the Kalugin top combustion hot blast stove during a full operation cycle—so as to identify optimal operating conditions that have less fuel gas consumption while meeting the requirements for hot air supply. Furthermore, the accuracy of the present numerical simulation method is verified by applying the practical data measured from the industrial hot blast stove mentioned above. In addition, the present simulation method of the combined implementation of the three-dimensional steady-state model with the two-dimensional transient model can efficiently simulate multiple and consecutive operation cycles of the hot blast stoves and ultimately achieve rapid predictions on hot-air temperature, providing references for operation optimization of these industrial hot blast stoves.

2. Development of a Two-Dimensional Transient CFD Model for a Single Channel of Checker Bricks in the Regenerator of a Hot Blast Stove

2.1. Assumptions

  • Two-dimensional axisymmetric transient fluid flow and heat transfer;
  • The fluid flow and heat transfer inside each hole of the checker bricks are the same, and thus, the heat flow through the middle interface between the holes is zero;
  • During the combustion period, the phenomenon of residual fuel gas combustion is ignored;
  • The “change-over” operation of the hot blast stove from the combustion period to the hot-air-supply period, and vice versa, is neglected.

2.2. Governing Equations

In this study, the two-dimensional transient CFD model for a single channel of checker bricks in the regenerator of a Kalugin top combustion hot blast stove is developed through numerically solving the following partial differential equations.
  • Continuity Equation:
𝜕 ρ 𝜕 t + · ρ u = 0
2.
Momentum Equation:
𝜕 ρ u 𝜕 t + · ρ u u = p + · [ ( μ + μ t ) ( u + u r ) ]
3.
Standard k-ε turbulence equations:
𝜕 ρ k 𝜕 t + · ρ u k = · μ + μ t σ k k + P k ρ ε
𝜕 ρ ε 𝜕 t + ( ρ u ε ) = μ + μ t σ ε ε + C 1 ε ε k P k C 2 ε ρ ε 2 k
μ t = C μ ρ k 2 ε
4.
Energy Equation:
𝜕 ρ h 𝜕 t + ( ρ u h ) = λ e f f T
where, ρ is the density, kg/m3; u the velocity vector, m/s; p the pressure, Pa; μ the molecular viscosity, Pa·s; μt the turbulent viscosity, Pa·s; k the turbulent kinetic energy, m2/s2; ε the dissipation rate of turbulent kinetic energy, m2/s3; σk the turbulent Prandtl number for turbulent kinetic energy; σε the turbulent Prandtl number for the dissipation rate of turbulent kinetic energy; Pk the rate of production of turbulent kinetic energy, W/m3; h the enthalpy, J/kg; T the absolute temperature, K; λeff the effective thermal conductivity, W/(m·K).

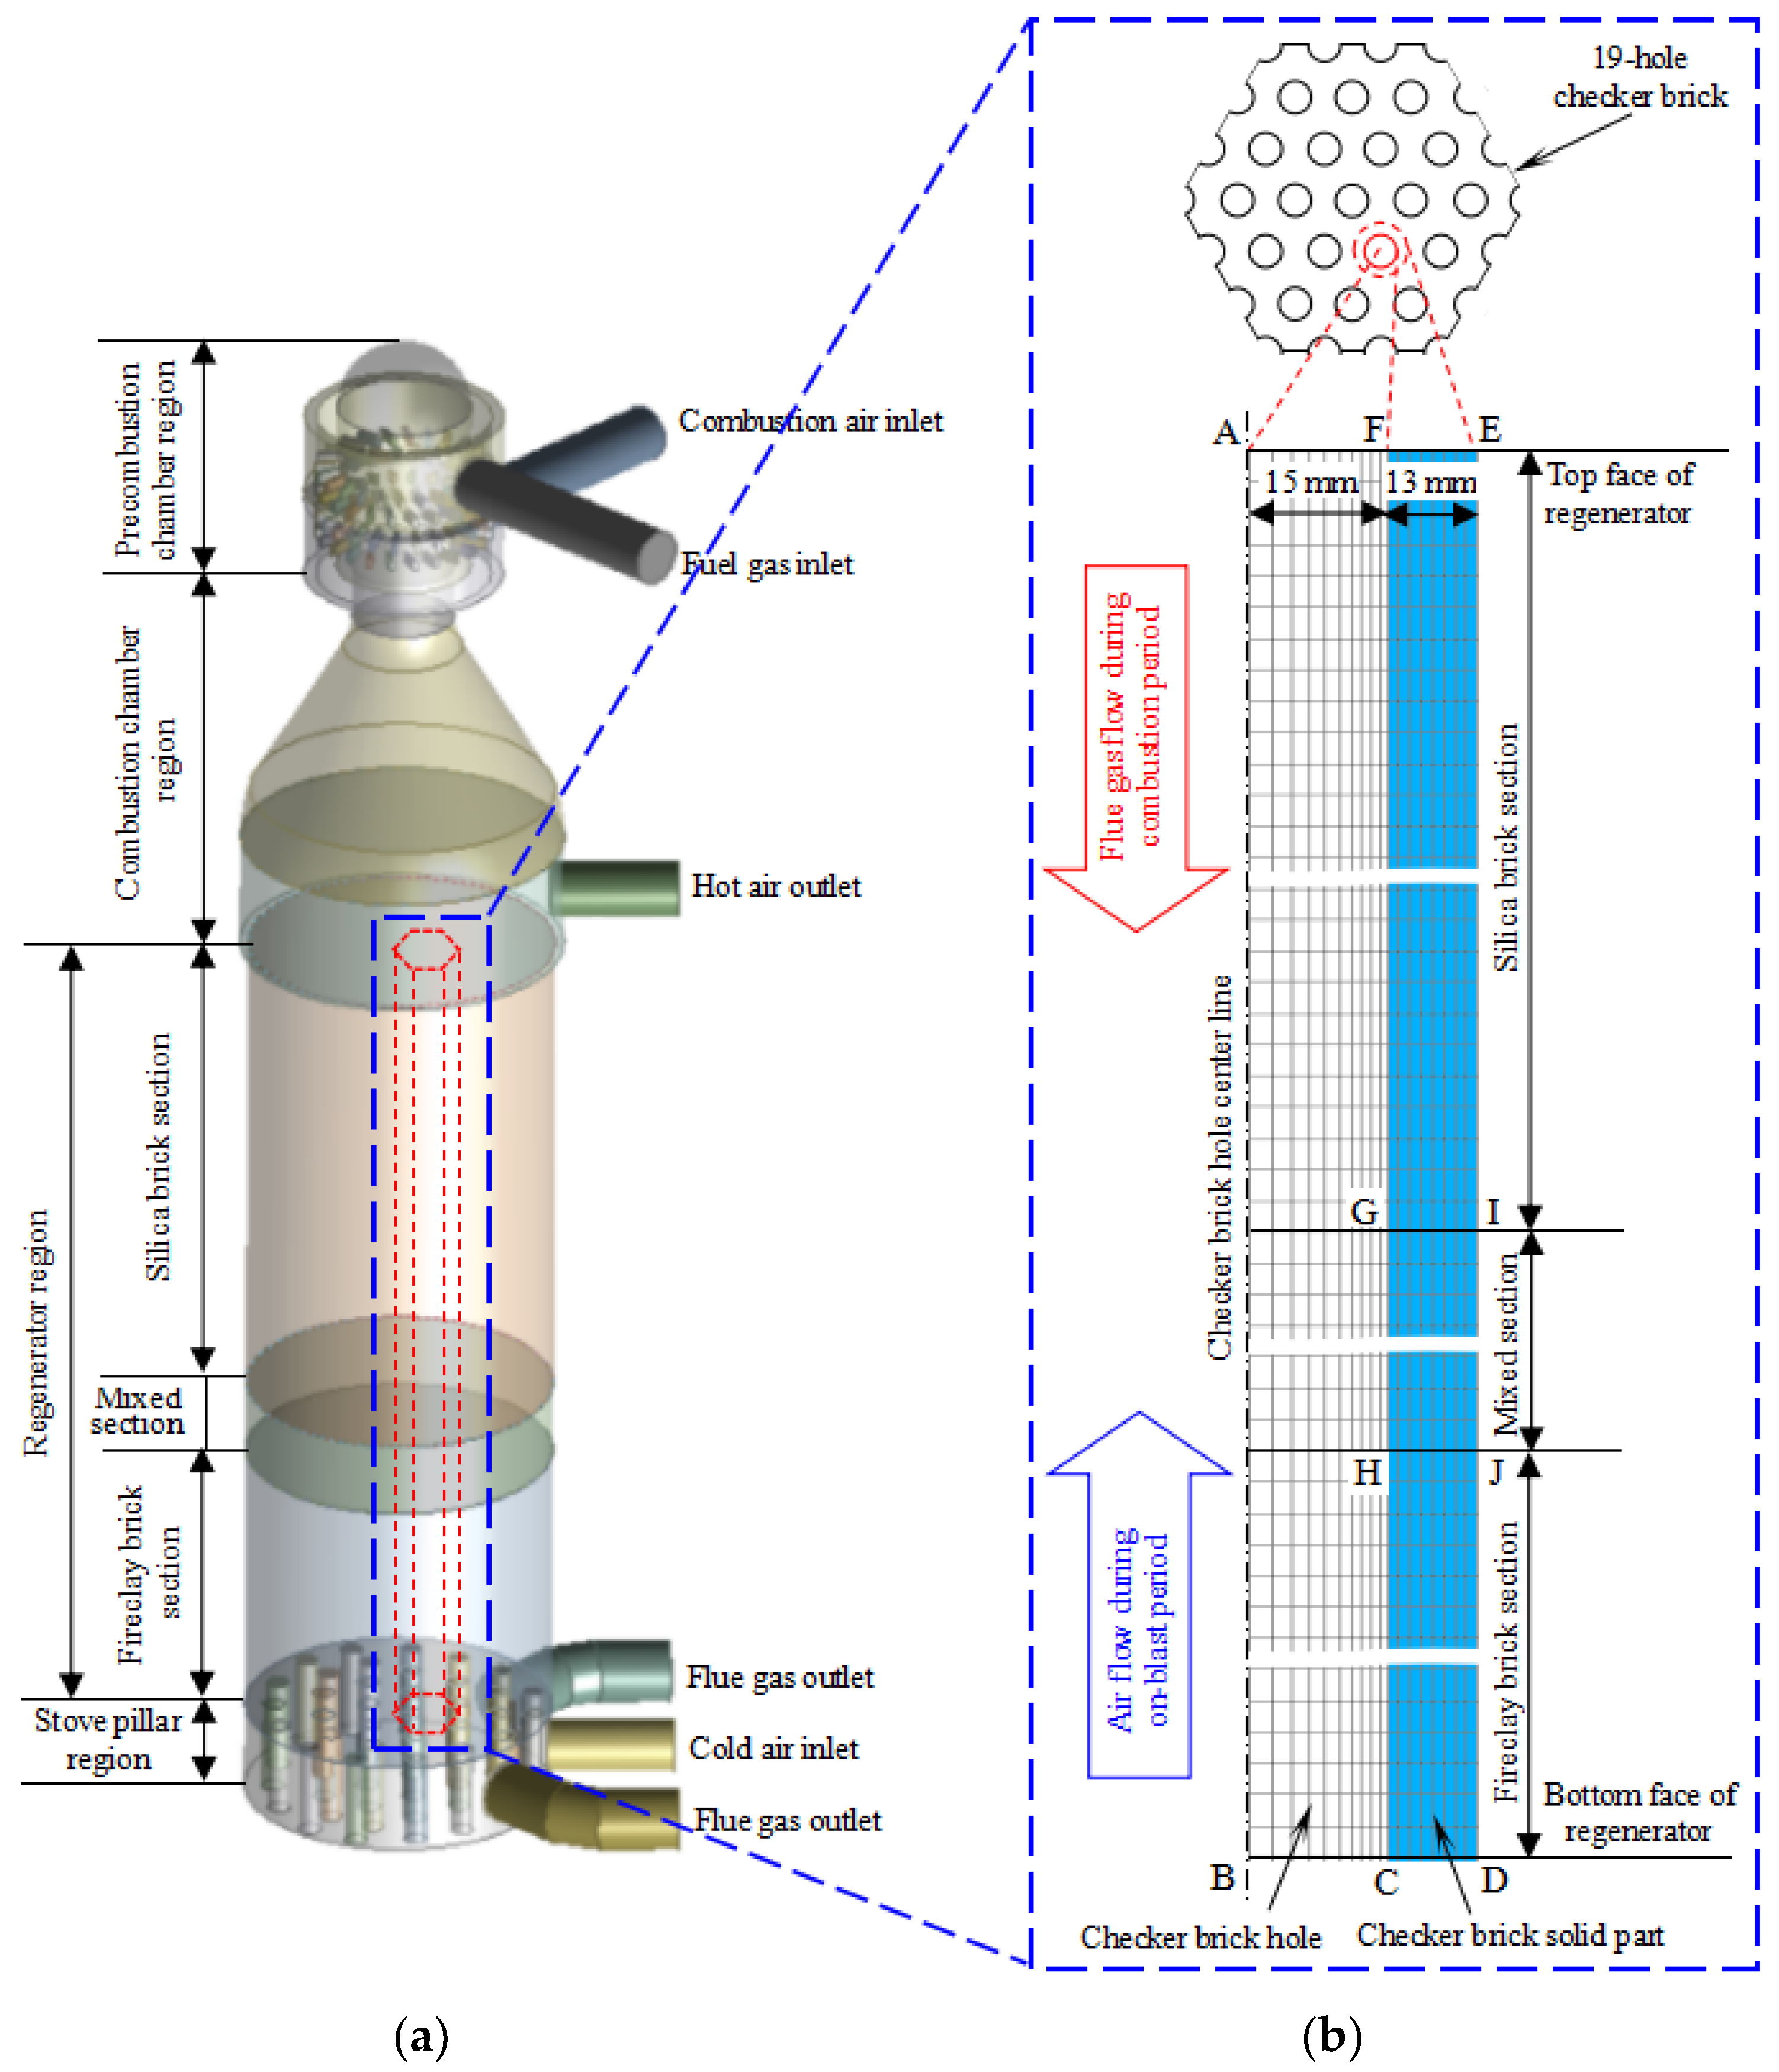
2.3. Model Geometry and Computation Grids

Figure 1 shows the three-dimensional geometry of the industrial Kalugin top combustion hot blast stove being simulated in this study and the computation grids defined for the two-dimensional CFD model of a single channel of checker bricks in a regenerator. Among them, the geometry for establishing the three-dimensional steady-state CFD model of the hot blast stove, shown in Figure 1a, has been described in detail elsewhere [31]. In the two-dimensional geometry for the CFD model of a single channel of checker bricks in a regenerator, shown in Figure 1b, the thickness (13 mm) of the solid region (i.e., a cylindrical wall) is calculated from the average volume of the surrounding solid part that is heated and cooled by gases in each hole of the checker bricks. That is, the solid volume of each checker brick is divided by the total number of holes in that brick and is then converted into an equal volume of a cylindrical wall. Table 1 provides the materials used in each region of the computation domain for the two-dimensional CFD model of a single channel of checker bricks defined in Figure 1b.

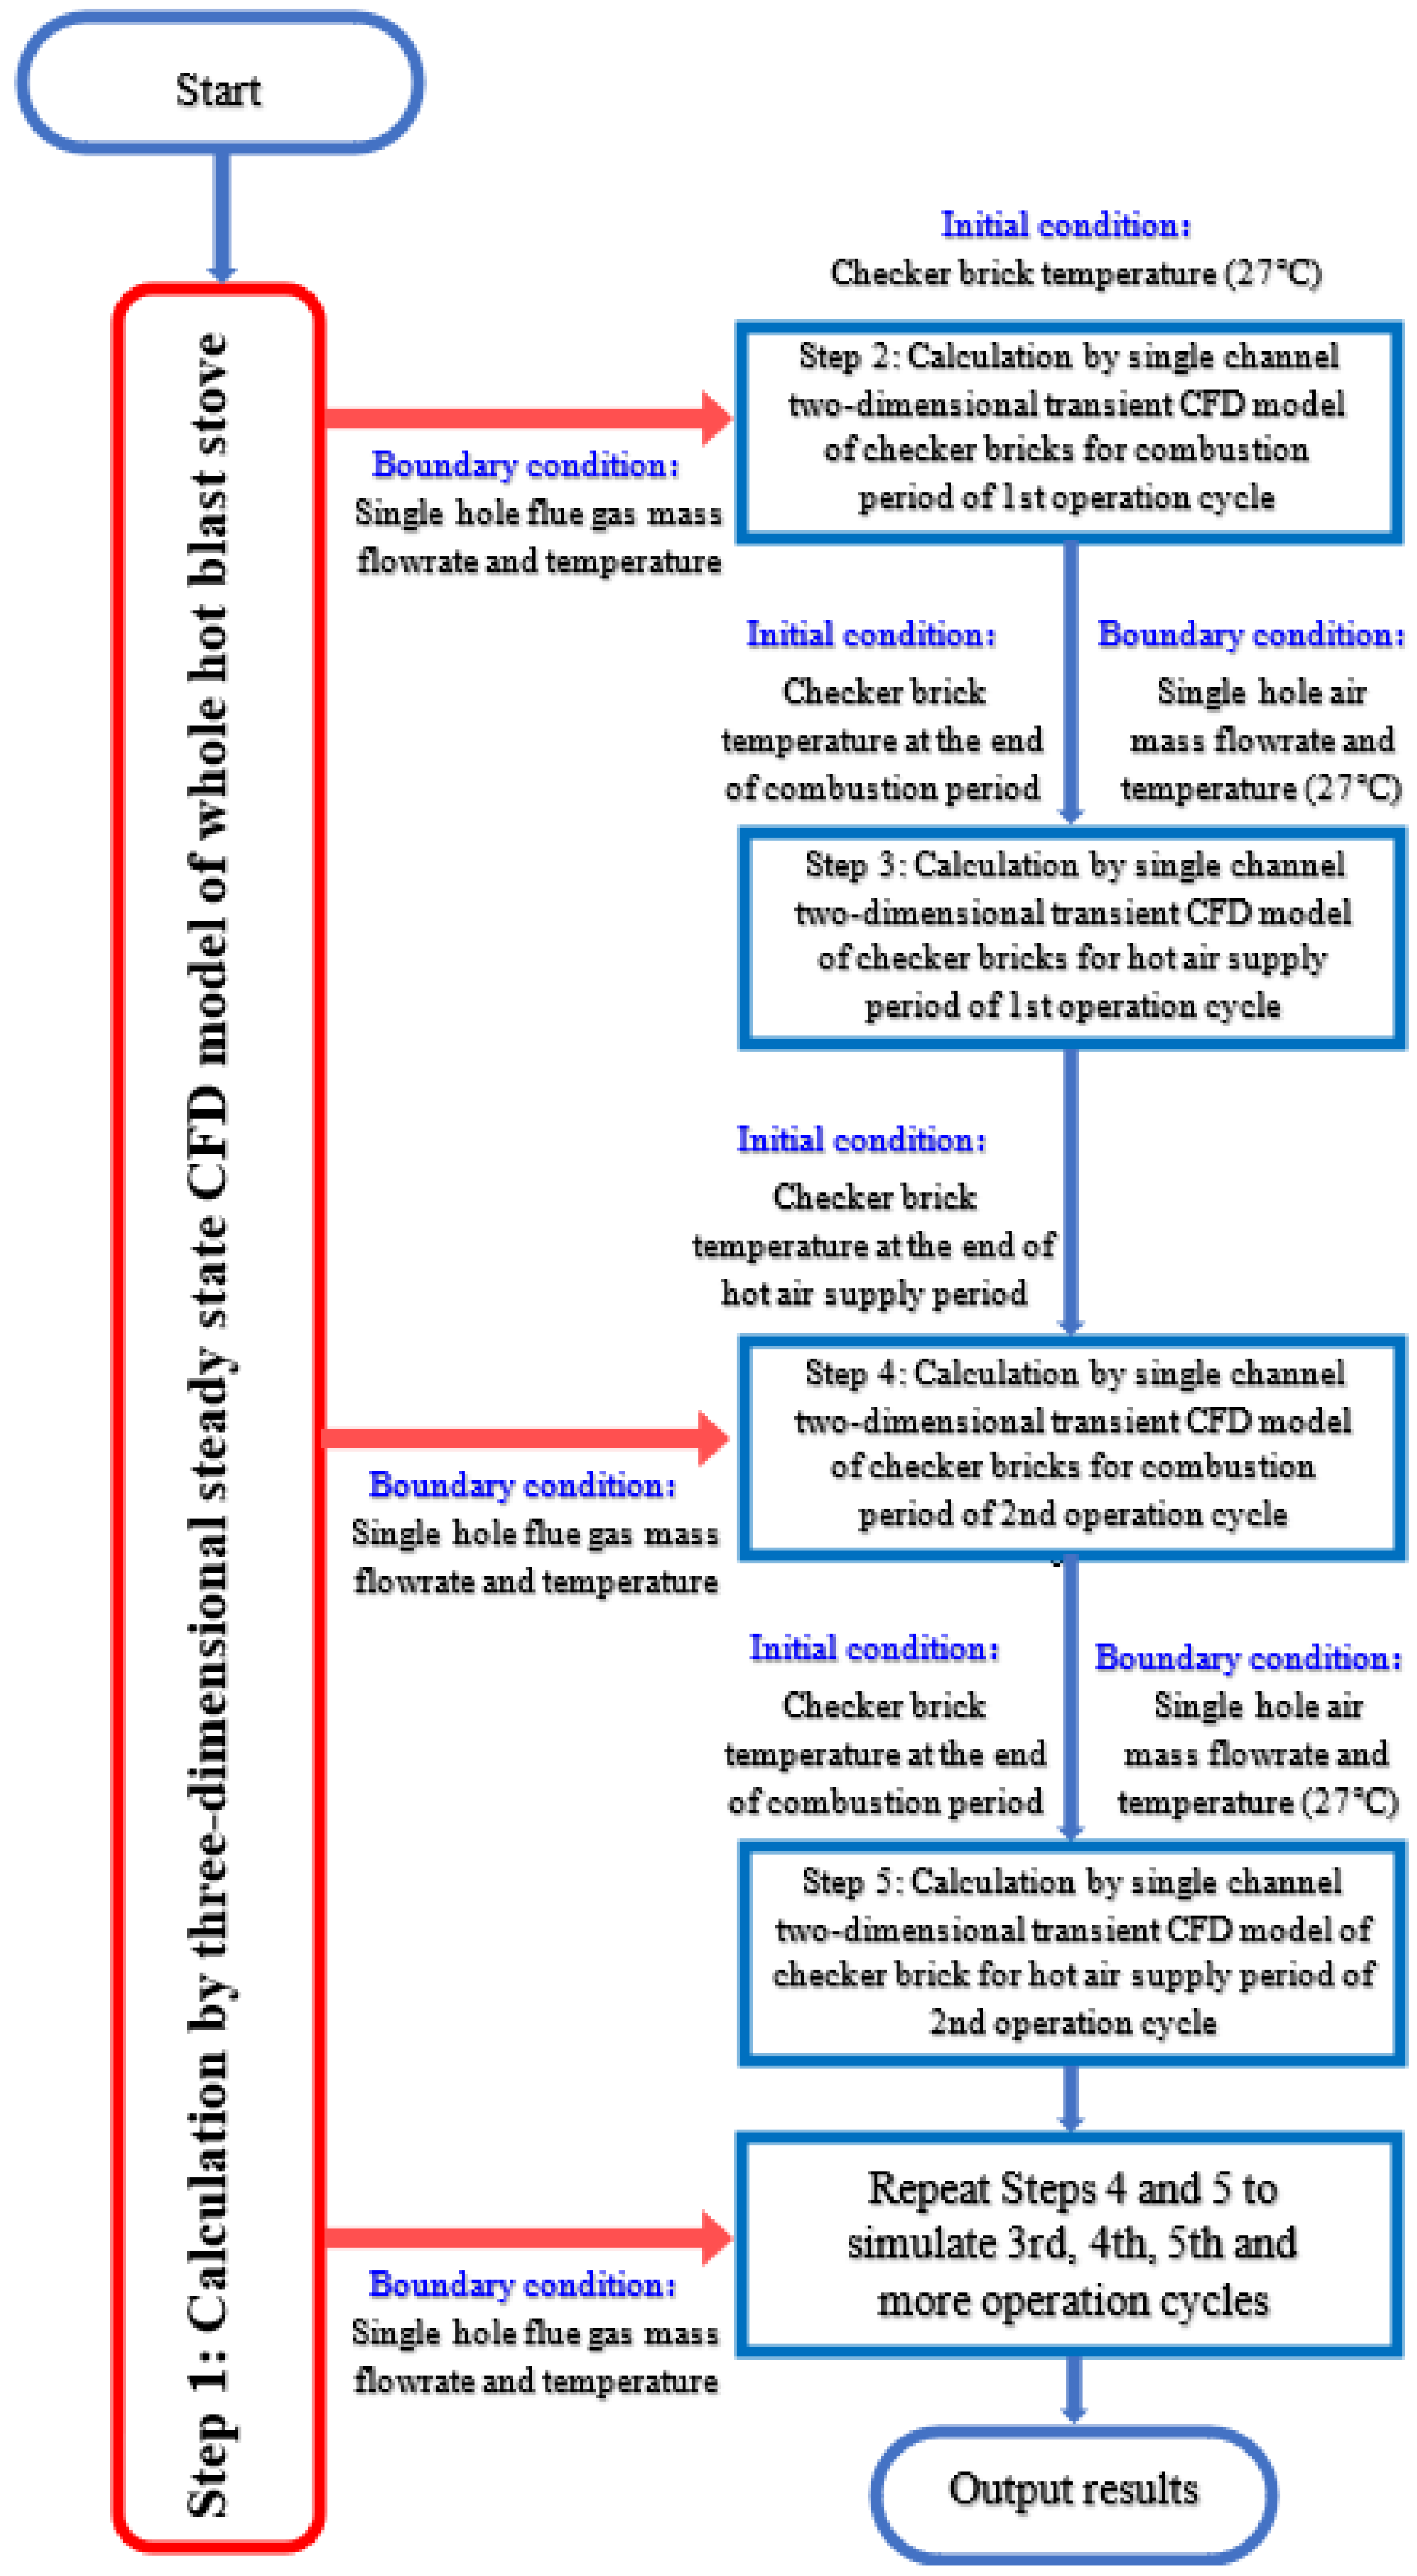
2.4. Boundary and Initial Conditions

The boundary and initial conditions of the two-dimensional CFD model of a single channel of checker bricks are given in Table 2. In addition, Figure 2 shows a calculation block diagram that depicts the simulation strategy of the present work, which reads:
  • Firstly, execute the previously developed three-dimensional steady-state CFD model (3D model for short) of the whole hot blast stove to simulate the combustion period of operation to predict the average temperature of flue gas entering the regenerator (i.e., the average temperature at the top surface of the regenerator);
  • Secondly, taking the average temperature of the flue gas entering the regenerator predicted by the 3D model as the boundary condition for the flue gas flow inlet (AF) and the initial temperature of the checker bricks being set to 27 °C (room temperature) as the initial condition, the two-dimensional transient CFD model (2D model for short) of a single channel of checker bricks is executed to simulate the start-up phase of the hot blast stove. Then, the checker bricks are gradually heated up by the high-temperature flue gas until the temperature of the checker bricks at the flue gas outlet section (BD, i.e., the bottom of the regenerator at the stove’s grate level) reaches 390 °C. This heating-up phase is termed the “combustion period of 1st operation cycle”;
  • Thirdly, taking the checker brick temperature distribution at the end of the “combustion period of 1st operation cycle” as the initial condition, changing the BC boundary into the inlet of cold air at room temperature (27 °C), and changing the AF boundary into the outlet, run the 2D model to simulate the heat exchange process between cold air and hot checker bricks in the hot-air-supply period, which is termed the “hot-air- supply period of 1st operation cycle”;
  • Fourthly, taking the checker brick temperature distribution at the end of the “hot air supply period of 1st operation cycle” as the initial condition, changing the AF boundary as the inlet of flue gas with its average temperature (also predicted by the 3D model) as the boundary condition of this inlet, and changing the BC boundary into the outlet, proceed to run the 2D model to simulate the heat exchange process between the hot flue gas and the “cold” checker bricks, which is termed the “combustion period of 2nd operation cycle”;
  • Fifthly, taking the checker brick temperature distribution at the end of the “combustion period of 2nd operation cycle” as the initial condition, changing the BC boundary into the inlet of cold air at room temperature (27 °C), and changing the AF boundary into the outlet, continue to run the 2D model to simulate the heat exchange process between cold air and hot checker bricks in the hot-air-supply period, which is termed the “hot-air-supply period of 2nd operation cycle”;
  • Lastly, repeat the calculations in steps (4) and (5) to simulate the processes of heating (combustion period) and cooling (hot-air-supply period) in the following third, fourth, and fifth, etc., operation cycles of the hot blast stove.
Figure 2. Block diagram of numerical simulation strategy.
Metals 13 01623 g002
Table 2. Boundary conditions of single-channel two-dimensional transient CFD model of checker bricks in regenerator (c.f., Figure 1).
BoundaryBoundary NameBoundary TypeBoundary Condition
ABChecker brick hole center axisSymmetrical axisZero flux
AFFlue gas inlet (a) or hot air outlet (b)Inlet (a) or outlet (b)Constant mass flowrate and temperature (a) or pressure (b)
BCFlue gas outlet (a) or cold air inlet (b)Outlet (a) or inlet (b)Constant pressure (b) or mass flowrate and temperature (b)
CDEnd face of checker brick at regenerator bottomWallAdiabatic wall face
EFEnd face of checker brick at regenerator topWallAdiabatic wall face
FHGHCInner wall face of checker brick holeWallConjugate heat transfer between fluid and solid and non-slip to fluid
EJIDOuter wall face of equivalent cylinder of checker brickWallAdiabatic wall face
(a) For combustion period; (b) For hot-air-supply period.
Table 3 and Table 4 provide, respectively, the operating conditions (termed as Cases A, B, and C) of the combustion period and the hot-air-supply period of the hot blast stove investigated in the present work. The combustion period operation is divided into two phases: the “main combustion phase” (50 min) and the “thermal retention phase” (30 min). In addition, corresponding to the different operating conditions of the combustion period, the same operating conditions as given in Table 3 and Table 4 are used in the thermal retention phase and the hot-air-supply period. Table 5 presents the 3D model’s predicted average temperature of the flue gas entering the regenerator corresponding to Cases A, B, and C in both the main combustion phase and the thermal retention phase [31], which are used as the inlet boundary conditions of the 2D model (c.f., Figure 2).

2.5. Numerical Solution of Governing Equations

In the present work, the ANSYS Fluent CFD 13 software package [32] was used to numerically solve the governing equations expressed as Equations (1)–(6). The partial differential equations are discretized using the control volume method and solved by means of the SIMPLE algorithm. The equations of turbulent kinetic energy and its dissipation rate are discretized with the first-order upwind difference scheme, and those equations describing continuity, momentum, and heat transport are discretized with the second-order upwind difference scheme.

3. CFD Simulation Results and Discussion

As mentioned earlier, the strategy of combining the three-dimensional steady-state CFD model with the two-dimensional transient CFD model proposed in this work can achieve efficient simulation of multiple consecutive operation cycles of the hot blast stove. Except for the first operation cycle, which is the start-up stage of heating the hot blast stove, the second operation cycle and all subsequent ones can be considered the normal status of hot stove operation. Therefore, the following sections discuss the simulation results of the second operation cycle obtained using the CFD models developed in the present work.

3.1. Influences of Operating Parameters on the Heat Transfer Characteristics in the Regenerator of a Kalugin Top Combustion Hot Blast Stove

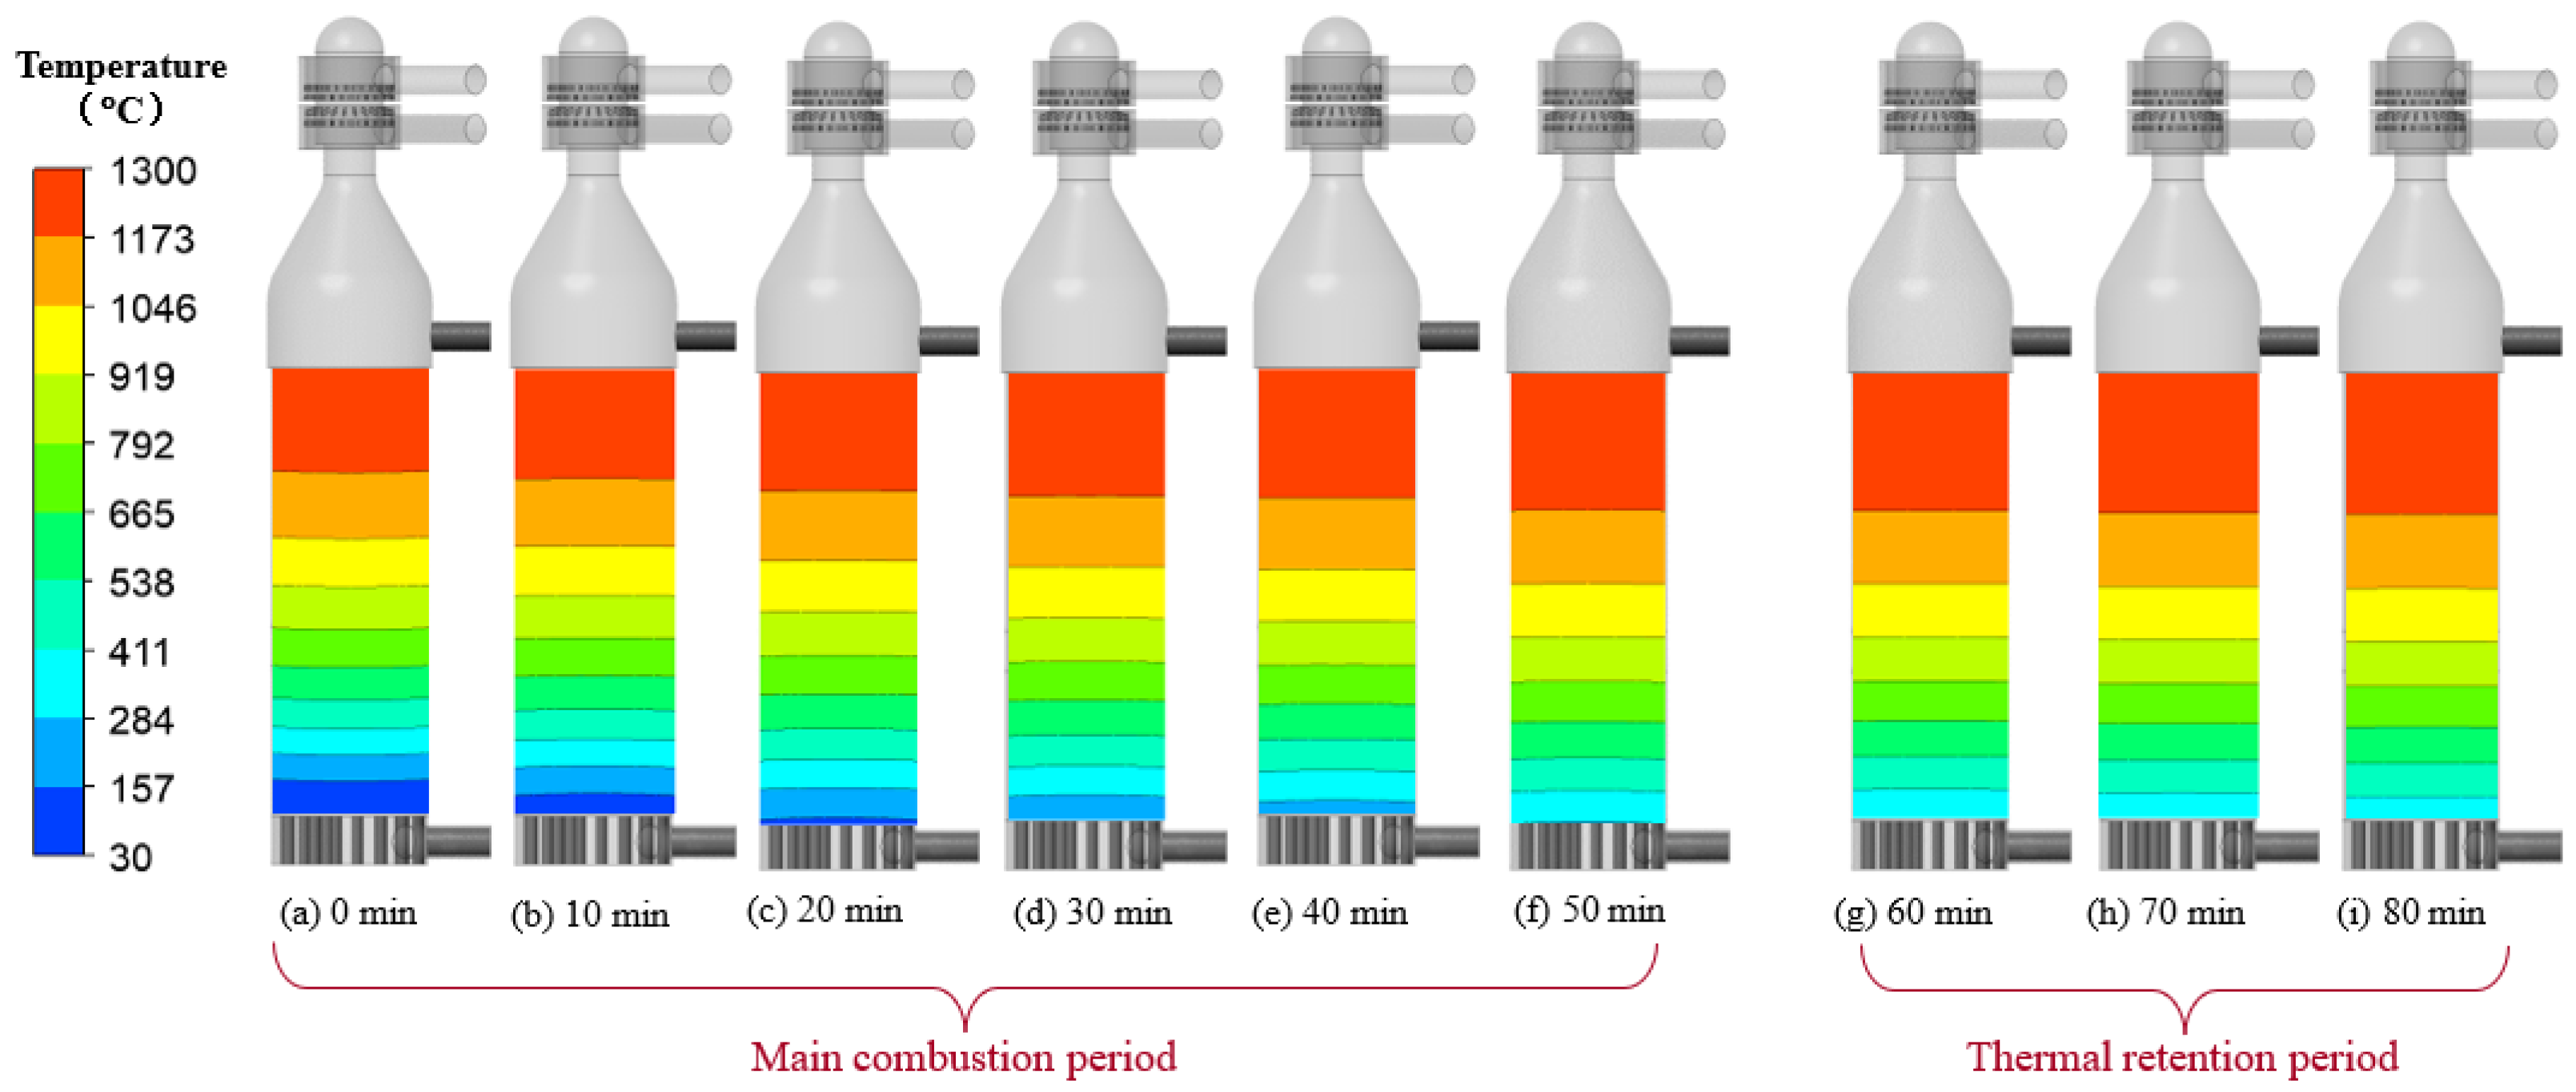
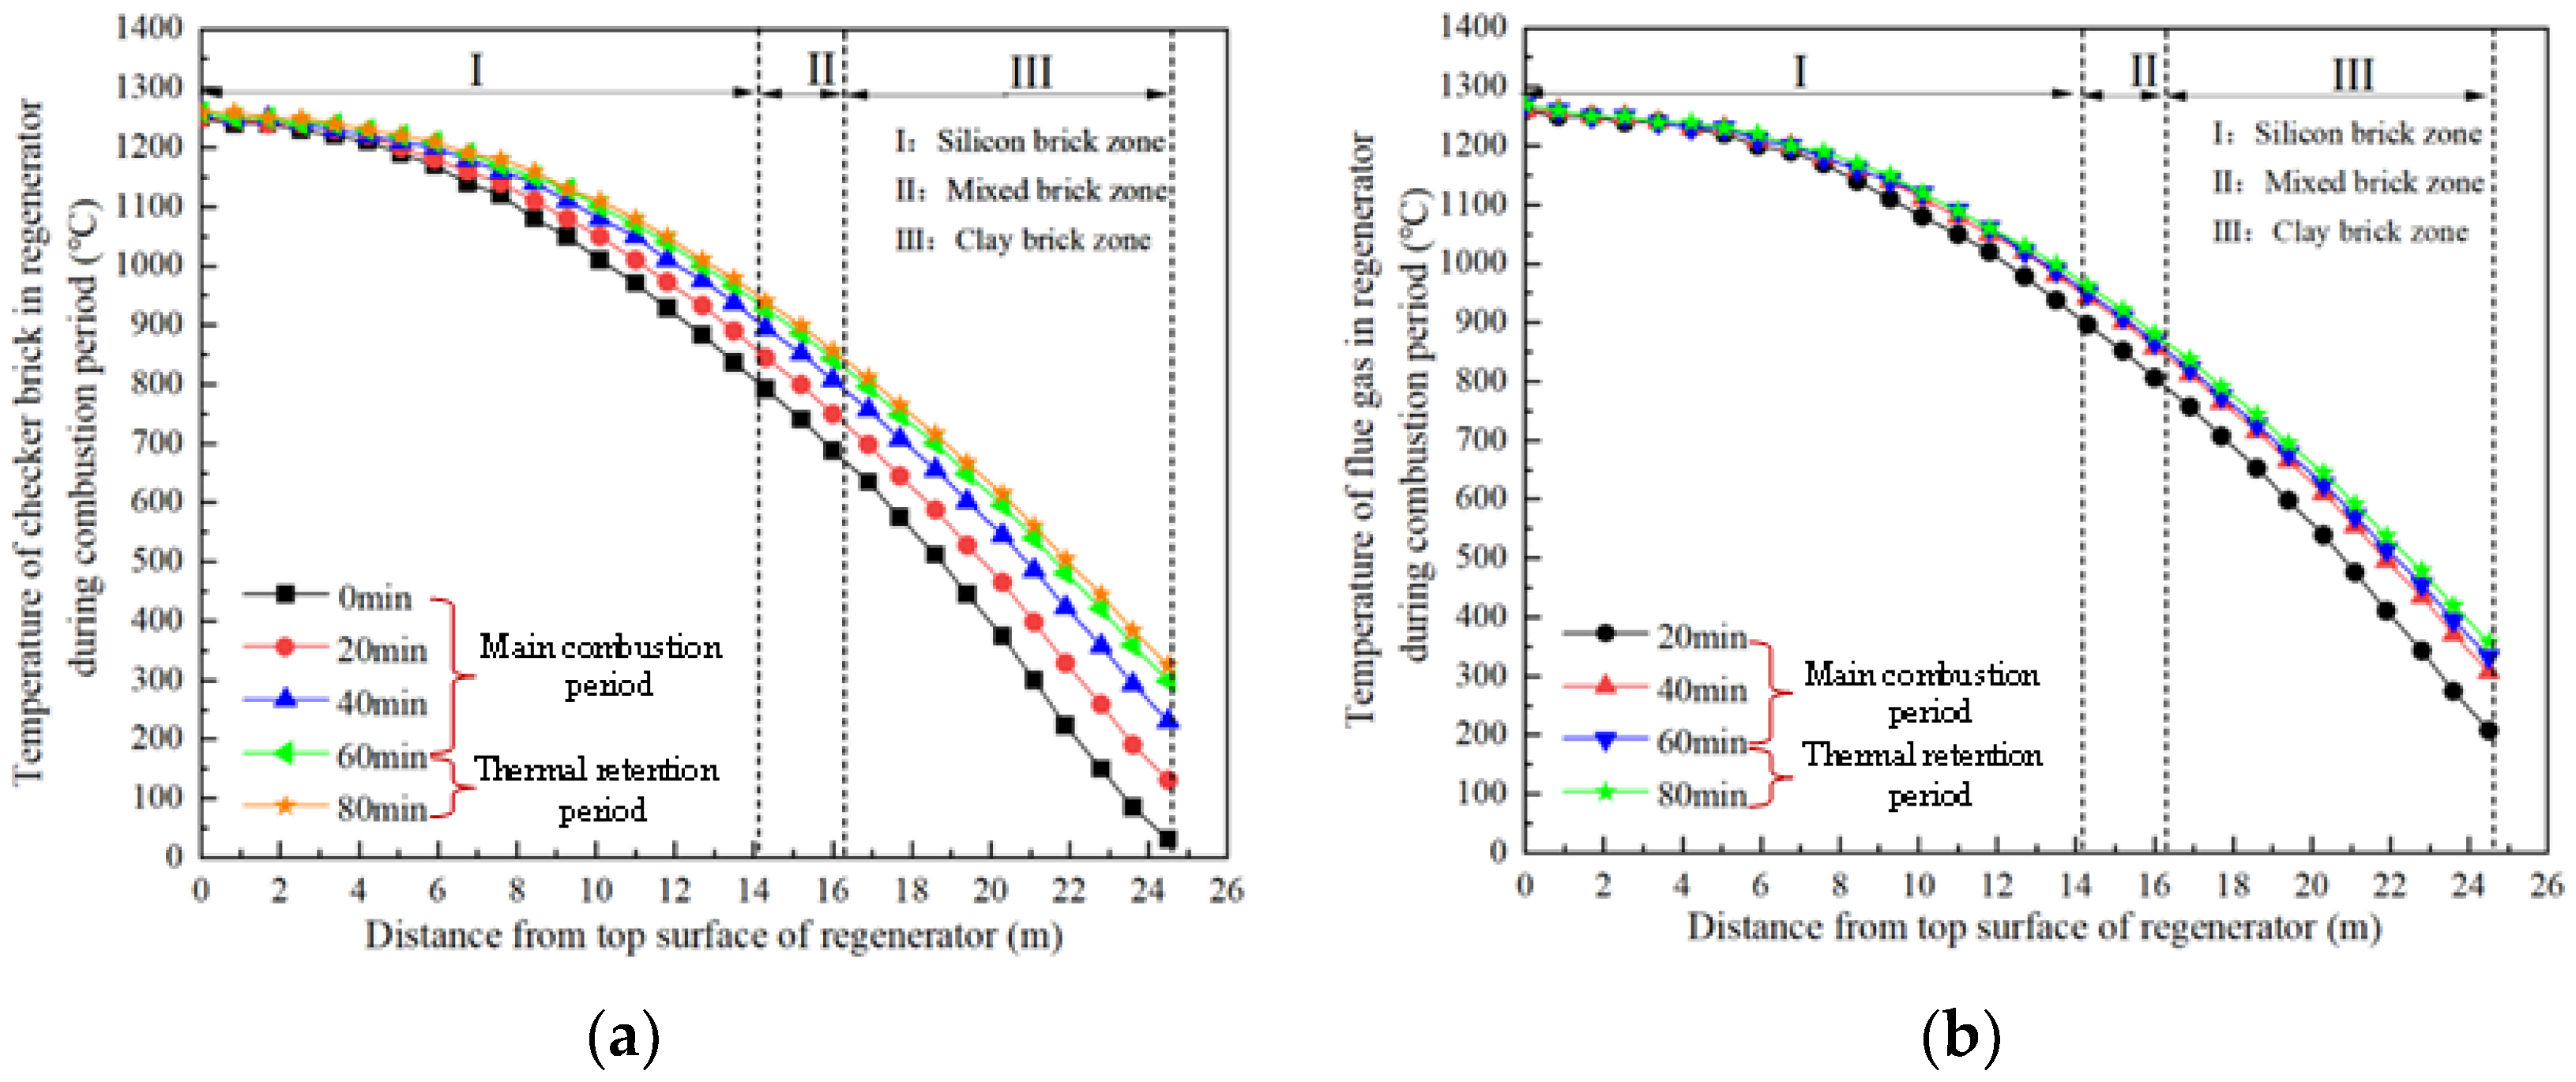
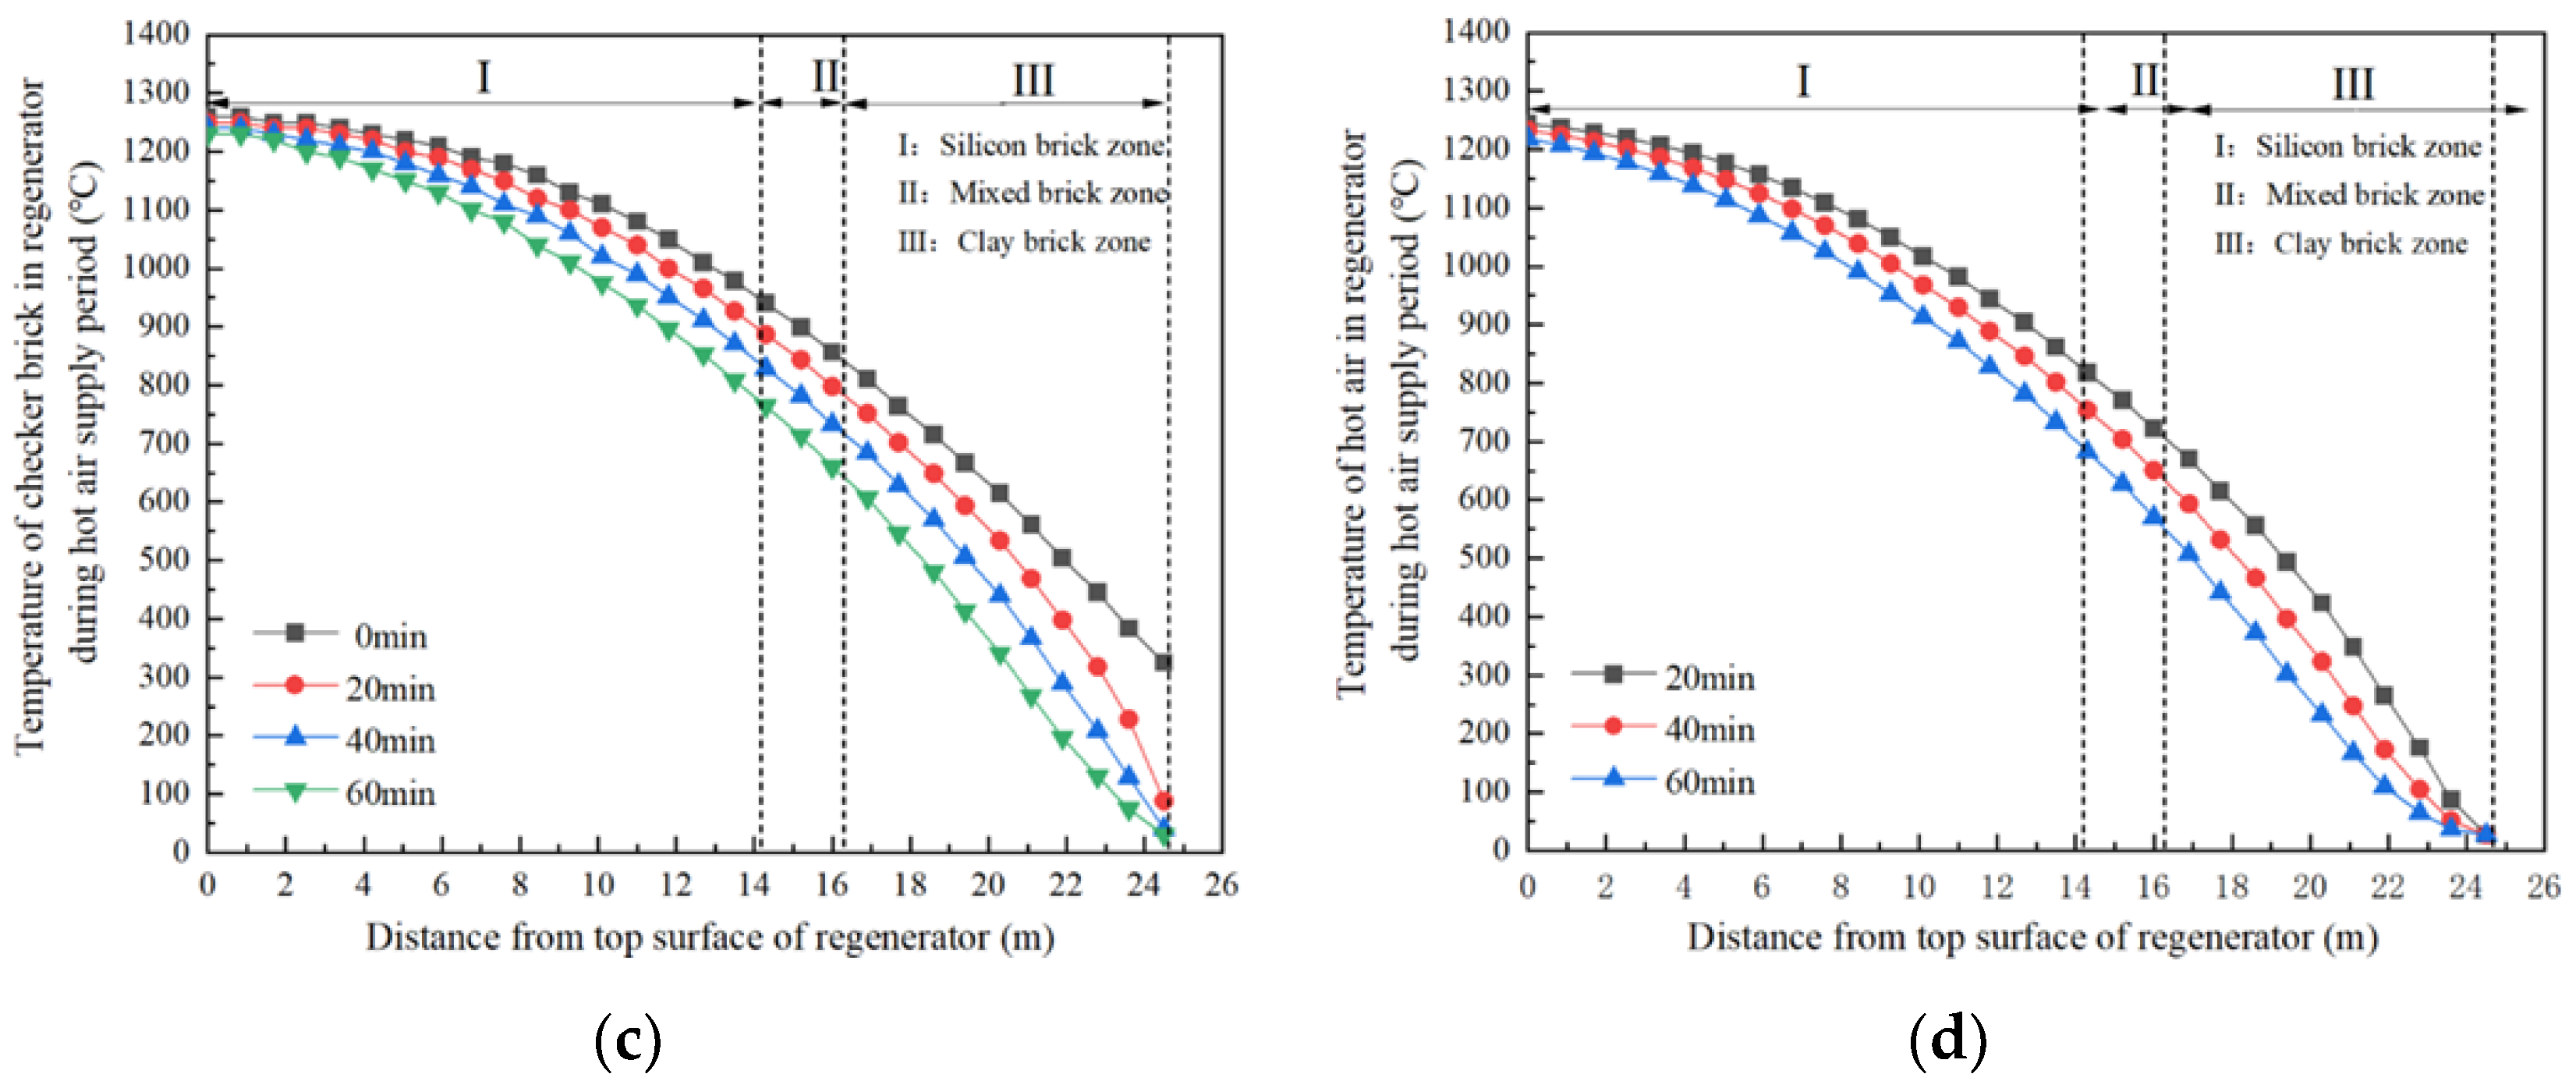
  • Example of Model Predictions on Heat Transfer Characteristics in Regenerator
As an example, we first analyze the CFD simulation results under the operating condition of Case A (c.f., Table 4 and Table 5). Under this operating condition, the CFD simulation results for the combustion period and the hot-air-supply period of the whole second operation cycle are shown in Figure 3 and Figure 4, respectively. Figure 3 is the CFD-model-predicted contour diagram indicating the evolution of temperature distribution in the checker bricks in the regenerator with the time during the combustion period under the operating condition of Case A. As seen from this figure, the checker brick temperature as a whole gradually becomes higher over time. During the main combustion phase, due to heating by high-temperature flue gas with a large flowrate, the checker brick temperature rises obviously, with the high-temperature zone expanding downwards (defined as the area where the temperature is above the 1173 °C contour line, for instance). During the thermal retention phase, however, due to the relatively low temperature of the flue gas with a significantly decreased flowrate, the checker brick temperature distribution essentially remains unchanged, generally fulfilling the aim of holding the heat content in the regenerator with a small amount of fuel gas consumption. Figure 4 shows the CFD-model-predicted evolution of checker-brick temperature contours in the regenerator with time during the hot-air-supply period for the same operation conditions (Case A). It can be seen from this figure that under the cooling effect of cold air, the checker brick temperature drops gradually over time, and the high-temperature zone as defined above gradually contracts upwards.
Figure 5 shows the distribution curves of the checker bricks and the gas temperatures along the height direction of the regenerator during the full operation cycle of the hot blast stove under the operation conditions of Case A. It can be seen from this figure that, during both the combustion period and the hot-air-supply period, the temperature variation extent in checker bricks becomes larger and larger downwards, as shown in Figure 5a,c. The fireclay brick section experiences the largest thermal variations while the silica-brick section withstands the least thermal fluctuations, and the heating and cooling amplitudes of the mixed-brick section sit in-between. During the thermal retention phase (i.e., from the 60th minute to the 80th minute), the checker bricks continue to heat up but to a rather limited extent with the temperature rise at the bottom of the fireclay brick section being only 25 °C, indicating that the thermal retention operation has achieved the goal. Figure 5b shows the variation in flue gas temperatures over time during the combustion period. Due to the exchange of heat with the checker bricks whose temperature keeps increasing, the temperature of the flue gas at the outlet gradually increases but the highest outlet flue gas temperature is 358 °C, which is well below the temperature limit of 390 °C set for safety reasons in the grate and pillar region of the hot blast stove. Figure 5d shows the CFD-model-predicted evolution of air temperature distribution along the height direction of the regenerator with time during the hot-air-supply period. As seen, although gradually decreasing over time, the hot-air temperature at the outlet still keeps above 1200 °C during the whole hot-air-supply period.
2.
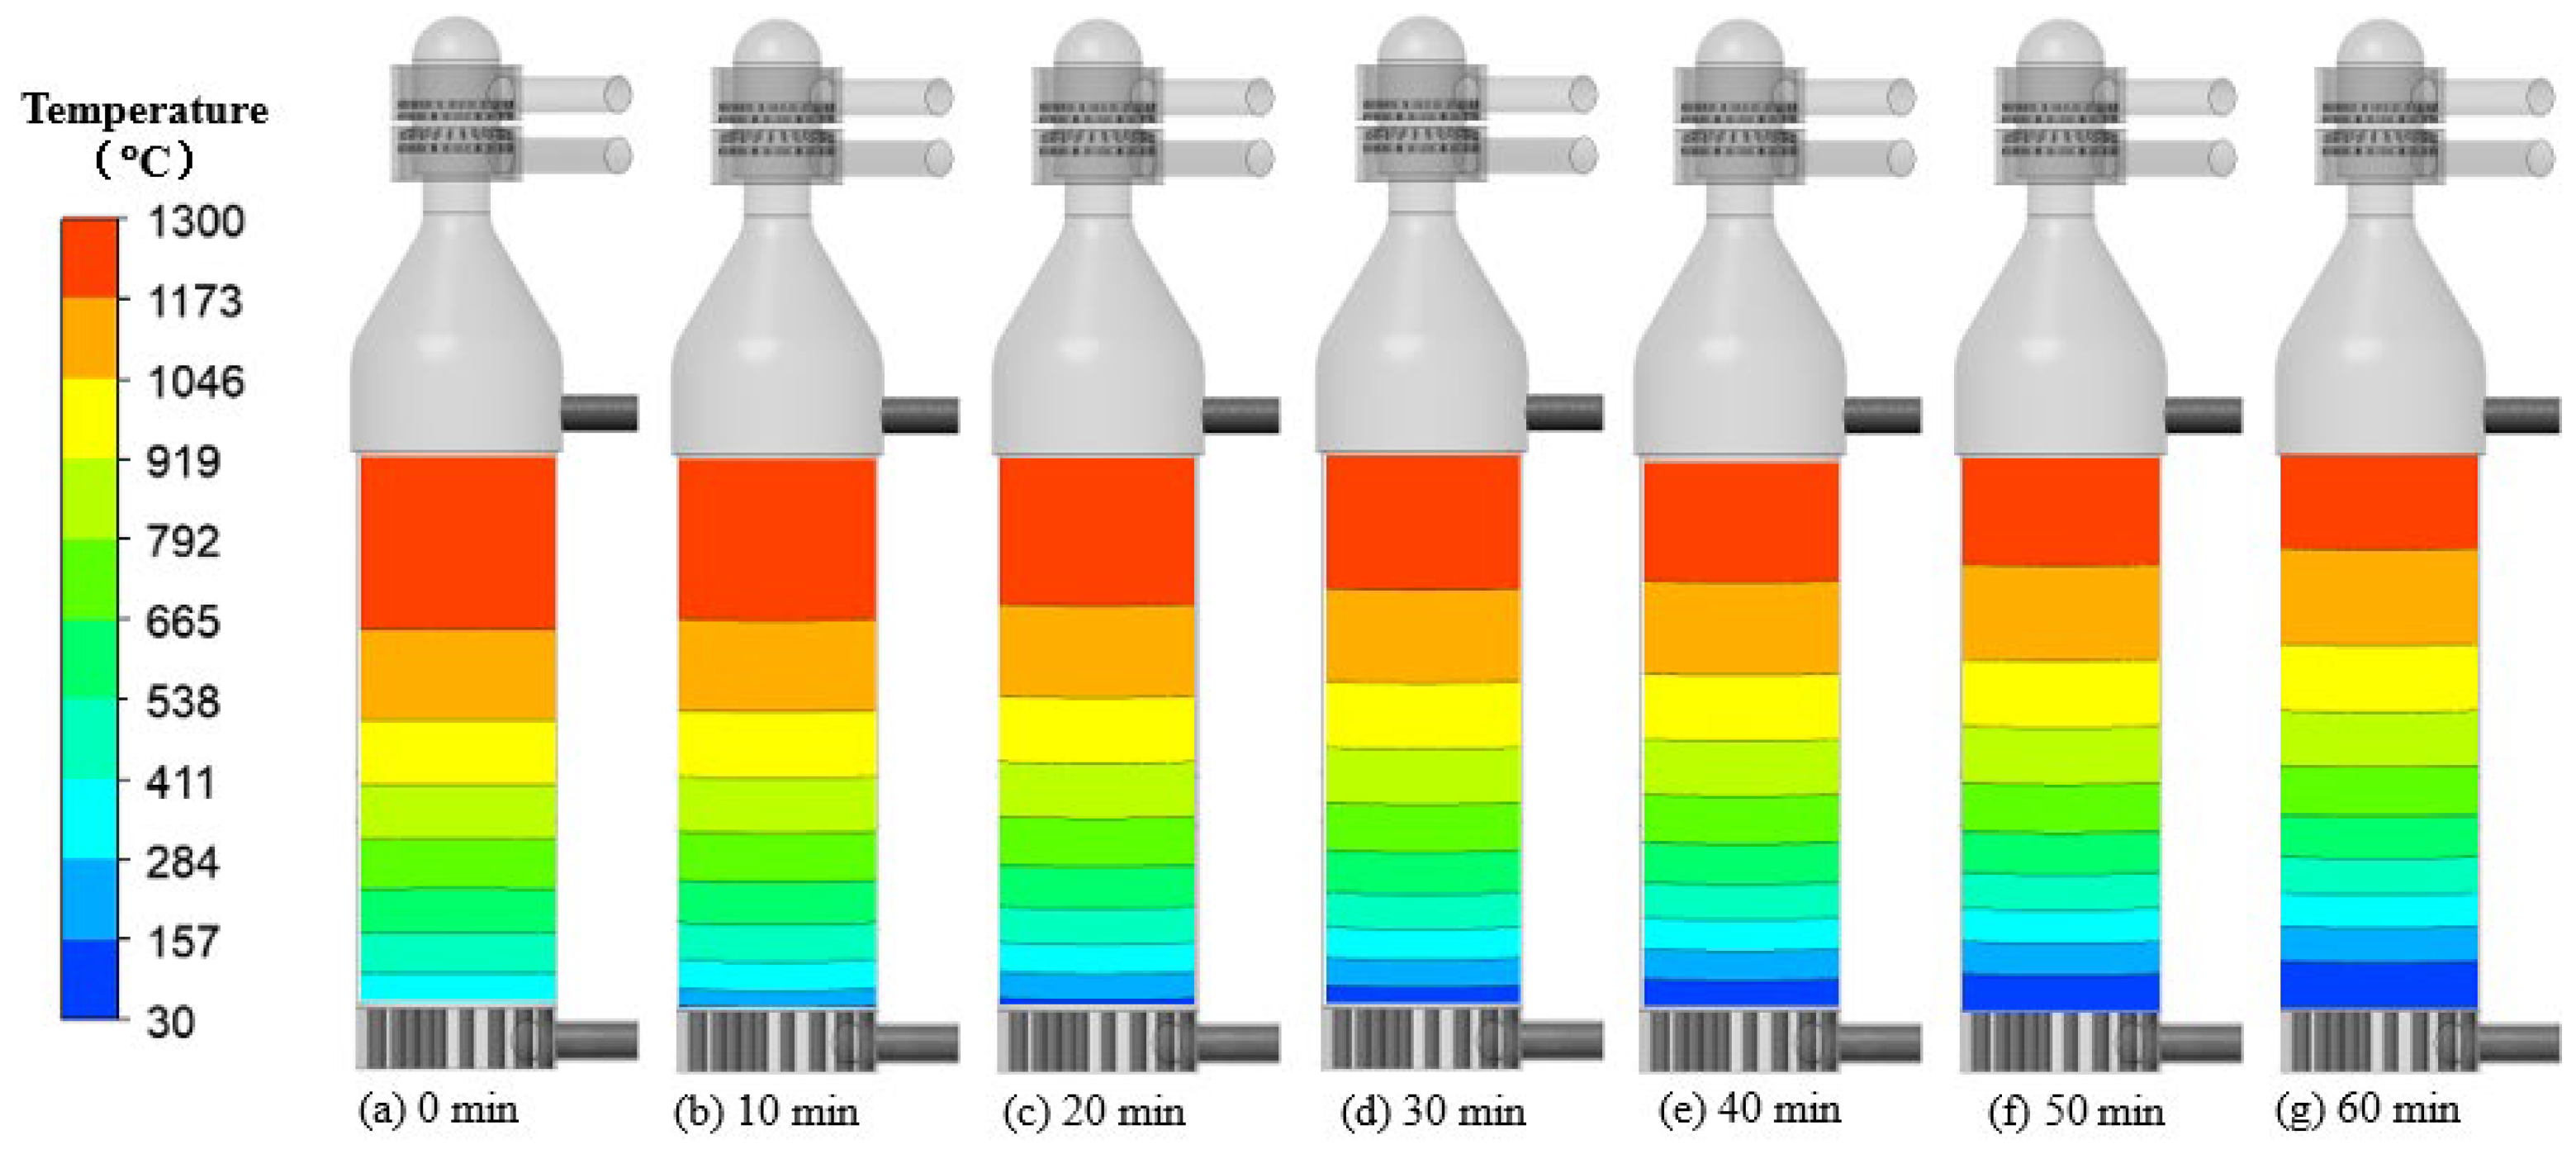
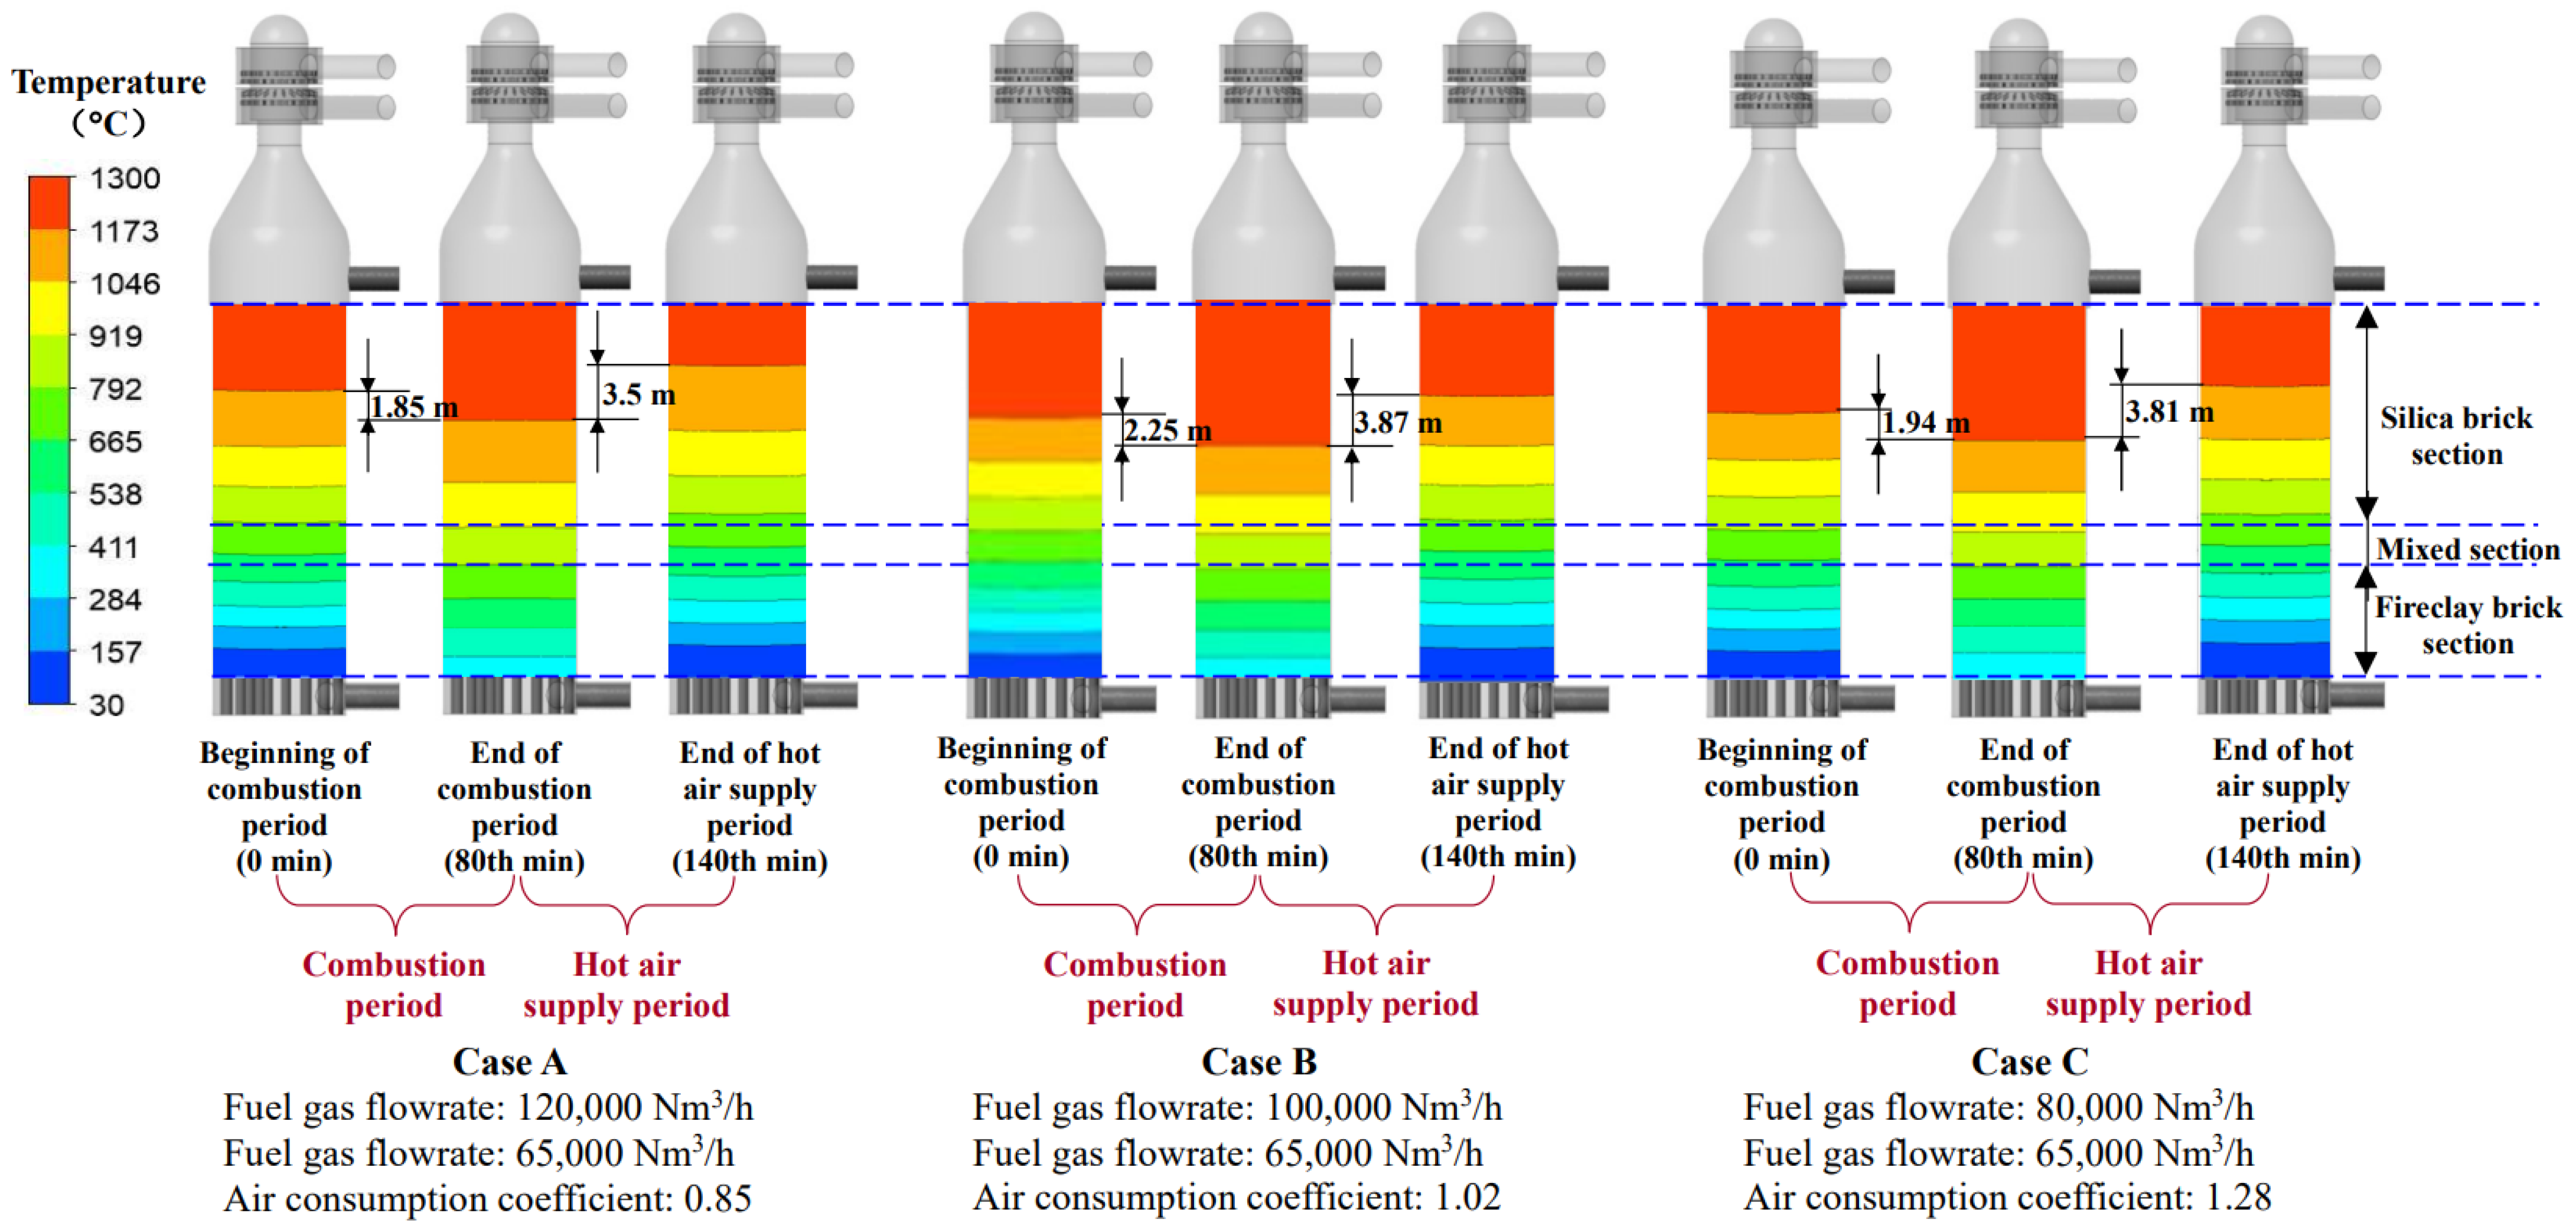
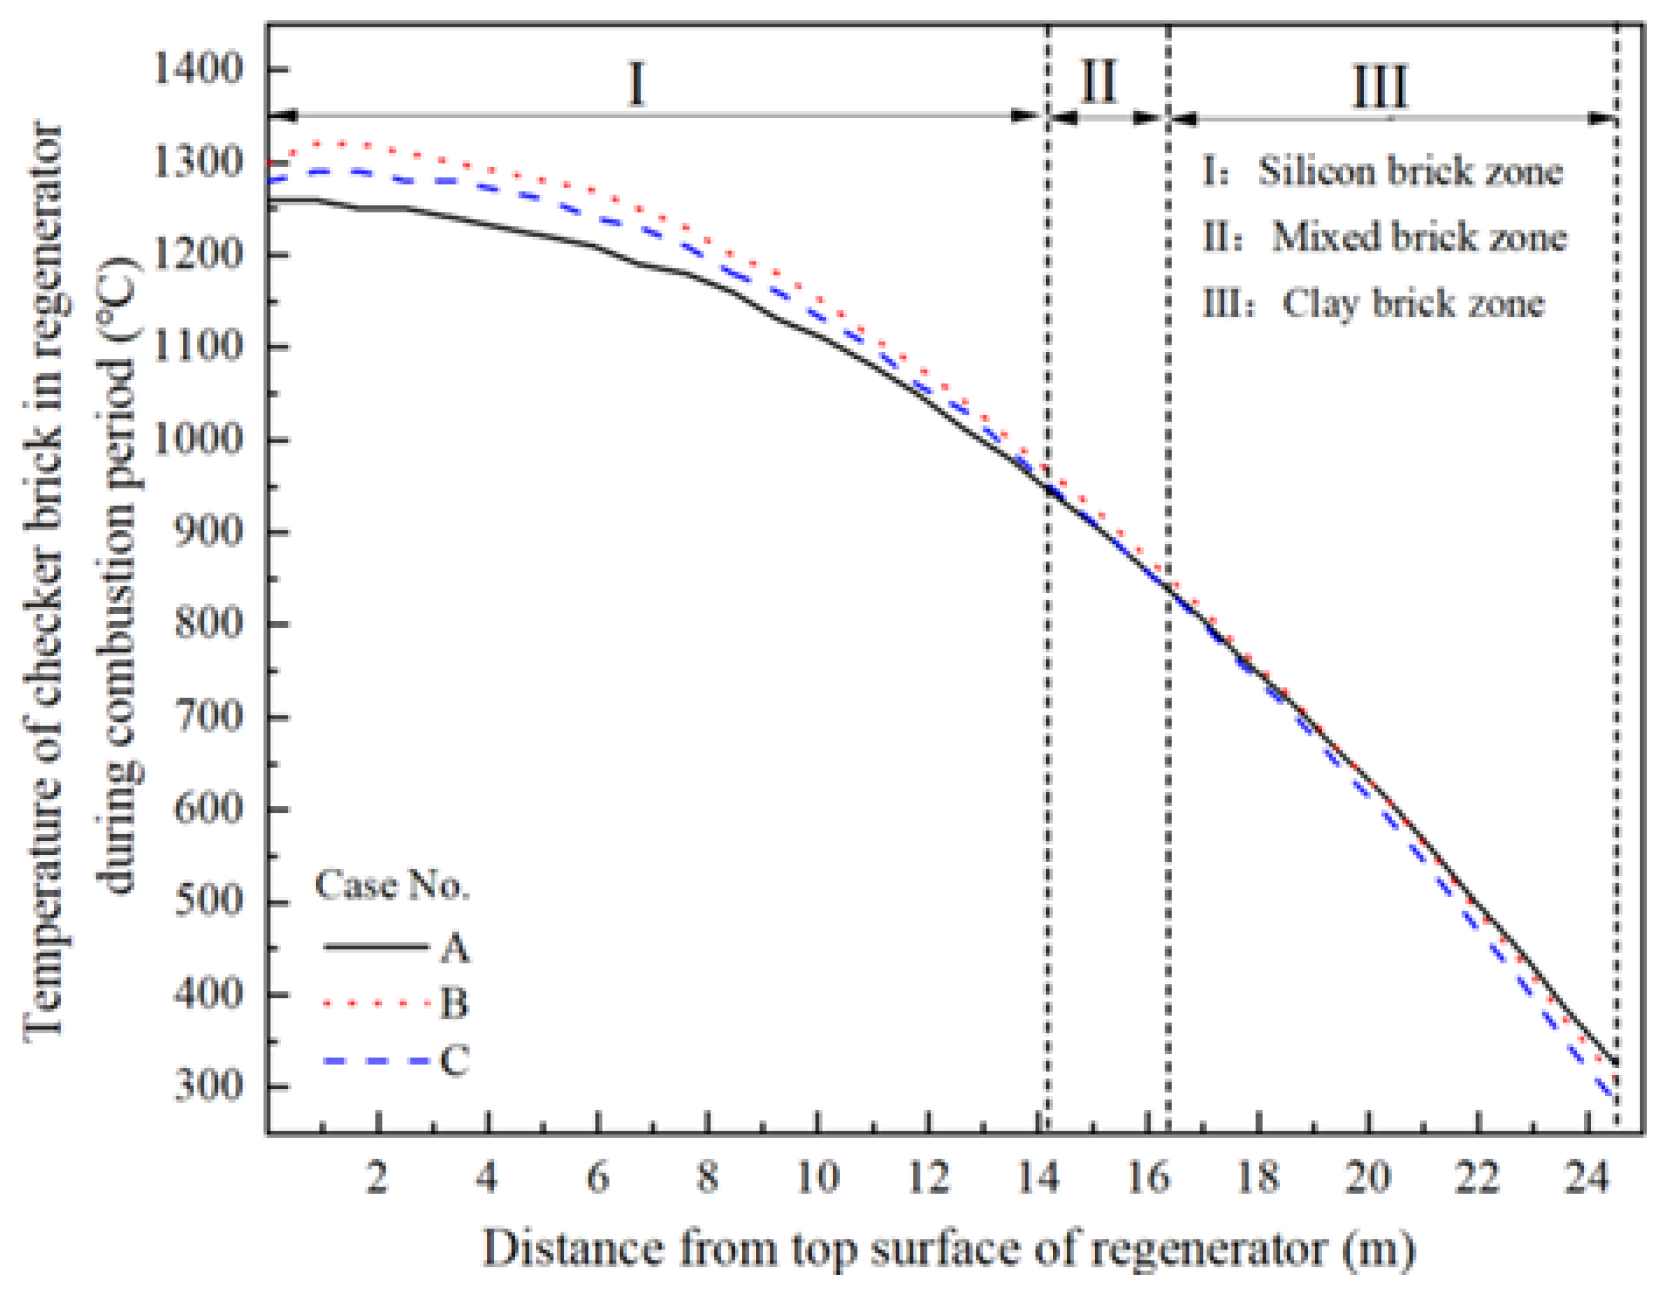
Comparison of Heat Transfer Characteristics for Different Operating Conditions
The proceeding section mainly presents the numerical simulation results under operating conditions of Case A, as an example, showing the distributions of the checker brick and gas temperatures along the height direction of the regenerator and their evolution over time. The simulation results obtained in this study under the operating conditions of Cases B and C also exhibit similar distribution patterns to those in Case A but the variation extent in the checker brick and gas temperatures are markedly different. Therefore, in this section, quantitative analyses of the heat transfer characteristics in the regenerator of the hot blast stove under different operating conditions are presented through comparing their differences so as to identify the optimal operating conditions for the hot blast stove.
Figure 6 shows the comparisons of the checker-brick temperature distribution in the regenerator at the beginning (0 min), the end of the combustion period (80th min), and the end of the hot-air-supply period (140th min) under different operating conditions in the second operation cycle. It can be seen from this figure that, during the combustion period, the high-temperature zones (above 1173 °C isotherm) in the regenerator under the operating conditions of Cases A, B, and C expand downwards by 1.85 m, 2.25 m, and 1.94 m, respectively, and the average temperature in the silica-brick section of regenerator increased to 1160 °C, 1209 °C, and 1187 °C, respectively. During the hot-air-supply period, those high-temperature zones in the regenerator under the operating conditions of Cases A, B, and C contract upwards by 3.50 m, 3.87 m, and 3.81 m, respectively, and the average temperature in the silica-brick section of the regenerator decrease to 1063 °C, 1102 °C, and 1082 °C, respectively.
Figure 7 shows the checker-brick temperature distributions along the height direction in regenerator at the end of combustion period under operating conditions of Cases A, B, and C. As seen from this figure, in the lower sections of the regenerator (i.e., fireclay brick and mixed-brick sections) there are little differences in temperature under different operating conditions but more obvious temperature differences exist in the silica-brick section that will eventually dominate the air temperature during the hot-air-supply period. The higher the temperature in the silica-brick section, the higher the hot-air temperature. Figure 7 also indicates that, in the silica-brick section, the temperature is the highest under the operating conditions of Case B, followed quite closely by that in Case C, whereas Case A gives the lowest brick temperature; therefore, the operating conditions of Cases B and C would be optimal.
Figure 8 shows the variations in the outlet hot-air temperature with time under the different operating conditions during the hot-air-supply period. Due to the continuous absorption of heat from checker bricks by air over time, the checker-brick temperature gradually drops so that its heating capacity to air gradually weakens. As a result, the outlet hot-air temperature gradually becomes lower. Furthermore, Figure 8 also depicts that the operating conditions of Cases B and C maintain the outlet hot-air temperature significantly higher than Case C does, and thus, should be considered the optimum operating conditions for the hot blast stove.

3.2. Verification of Numerical Simulation and Operation Optimization

In order to verify the results of the numerical simulation and the effect of operation optimization using the CFD models established in this work, the operational data from an industrial Kalugin top combustion hot blast stove were collected. Comparisons between the numerical simulation results and the collected actual operational data are shown in Figure 9 and Figure 10. Figure 9 illustrates the influence of the air consumption coefficient on the dome temperatures measured from the industrial hot blast stove before and after operation optimization and those predicted using the three-dimensional steady-state CFD model, previously reported by the authors [31], which is quoted here for convenience of discussion. Figure 10 illustrates a similar effect of the air consumption coefficient during the combustion period on the outlet hot-air temperature during the hot-air-supply period, both measured from the industrial hot blast stove and predicted by means of the numerical simulation strategy depicted in Figure 2. Both figures indicate that variations in the dome temperature and the hot-air temperature essentially synchronize with each other. They all first increase with the air consumption coefficient to maximum levels and then decrease with further increasing the air consumption coefficient. The highest dome temperature and hot-air temperature occur when the air consumption coefficient approaches 1, reflecting that when the air consumption coefficient is controlled to around 1 during the combustion period, the highest temperature of hot air can be obtained during the air-supply period. In addition, both the dome temperature and the outlet hot-air temperature predicted by the CFD models are close to the measured ones, which demonstrates that the numerical simulation method proposed in this study, as shown in Figure 2, is generally reliable.
Furthermore, according to the data collected from the industrial hot blast stove shown in Figure 9 and Figure 10, details of which were tabulated and published elsewhere [31], the average fuel gas flowrate during the combustion period was decreased from 106,488 Nm3/h (corresponding to an average air consumption coefficient of 0.79) before operation optimization to 97,310 Nm3/h (corresponding to an average air consumption coefficient of 1.27) after operation optimization with a reduction in fuel gas flowrate of 8.6%; and the average hot-air temperature during the hot-air-supply period was lifted from 1146 °C before operation optimization to 1178 °C after operation optimization with a temperature increase of 32 °C. Therefore, a significant saving of fuel gas—while maintaining a high enough hot-air temperature for blast furnace ironmaking—was achieved.
Figure 11 shows the relationship between the dome temperature during the combustion period and the hot-air temperature during the hot-air-supply period, measured from the industrial hot blast stove before and after optimization, and those predicted using CFD simulation. As seen, the hot-air temperature roughly linearly increases with the increase in the dome temperature. Through regression analysis on all the data shown in Figure 11, a linear regression correlation of the form y = 1.6072x − 819.4 is obtained that shows, for instance, if the dome temperature is increased by 10 °C, the hot-air temperature could be lifted by about 16 °C. It is worth noting here that although the regression correlation coefficient is not so high (R2 = 0.4467), the CFD simulation results postulate that, on the basis of the present operation optimization of the hot blast stove, further increasing the dome temperature can likely lead to even higher hot-air temperatures. This finding provides a reference basis for further operation optimization of the hot blast stove and, therefore, the numerical simulation results in the present work provide practical guidance for the operation of industrial Kalugin top combustion hot blast stoves.

3.3. Analysis of Model Simulation Efficiency

The numerical simulation strategy proposed in this work, as shown in Figure 2, is based on the assumption that the combustion reactions all reach chemical equilibrium and that the flow and heat transfer within the fluids are in a steady state. The main reasons for adopting this assumption have been detailed elsewhere [31]. Therefore, the three-dimensional steady-state CFD model previously established for the whole stove body is used to predict the temperature of flue gas entering the regenerator [31], which serves as the inlet boundary condition for the presently established two-dimensional transient CFD model for a single channel of checker bricks in the regenerator of the hot blast stove. The main purpose of the present work is to improve the numerical simulation efficiency so as to quickly predict the hot-air temperature. It would be ideal if three-dimensional transient CFD simulations were performed for the entire operation cycle of the hot blast stove but this would result in an unacceptable computation time. As is well-known, compared to the three-dimensional transient numerical simulation, the computation times required for the three-dimensional steady-state numerical simulation and the two-dimensional transient numerical simulation are significantly reduced. Taking the simulation for the combustion period of the hot blast stove as an example, a personal computer (with hardware configuration of Intel Core i7, 8-core CPU, and a main frequency of 2.3 GHz) was used for calculation and comparison. The results show that, for advancing one minute of real hot blast stove operation, the computation time required for conducting a three-dimensional transient numerical simulation is about 18 h, while that for conducting a two-dimensional transient numerical simulation of a single channel of checker bricks is only 0.0667 h. That is, the time of the two-dimensional transient simulation is only about 1/270 of the time for the three-dimensional transient simulation! Even taking into account the time consumed for the three-dimensional steady-state numerical simulation (about 8 h), which is required only once (c.f., Figure 2), the simulation strategy proposed in this study that combines the three-dimensional steady-state CFD model for the whole hot blast stove with the two-dimensional transient CFD model of a single channel of checker bricks has an efficiency that cannot be matched by the three-dimensional transient CFD model. Therefore, considering the current trend of ever-improving computing power, it can be foreseen that using the numerical simulation strategy proposed in this study (c.f., Figure 2) could make real-time tracking simulation of hot blast stove operations become a reality.

4. Conclusions

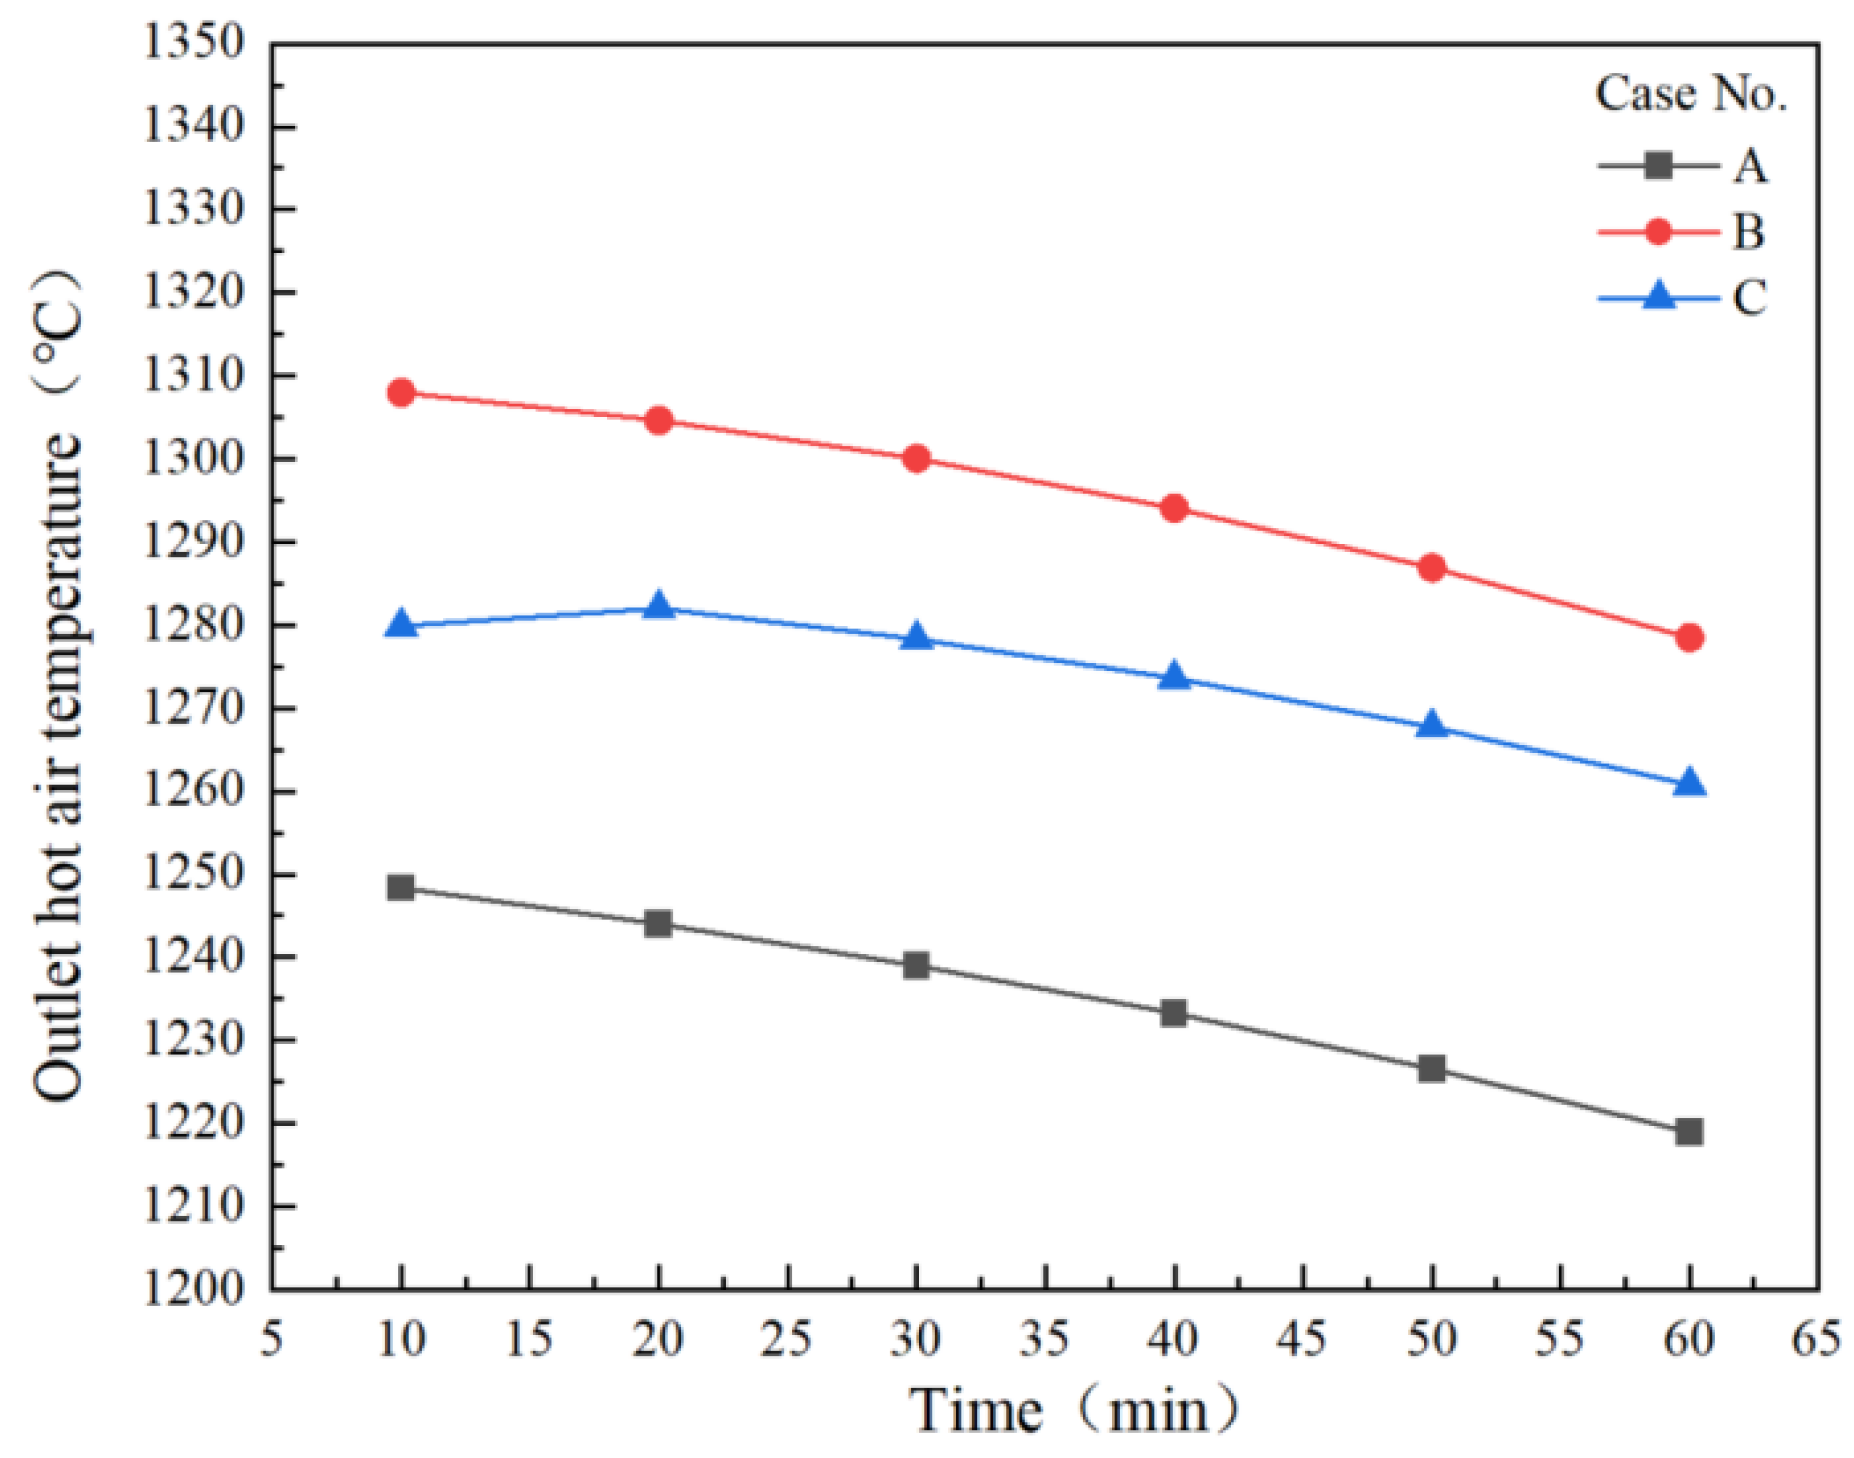
  • When fuel gas and combustion air flowrates of the hot blast stove during the main combustion phase are set at 120,000 Nm3/h and 65,000 Nm3/h, respectively, (corresponding to an air consumption coefficient of 0.85) the average temperature of checker bricks in the silica-brick section of the regenerator at the end of the combustion period is rather low (only 1160 °C), so the average hot-air temperature during the hot-air-supply period is also relatively low (1235 °C);
  • On the basis of the above-mentioned operating conditions, when the fuel gas flowrate is reduced to 100,000 Nm3/h (corresponding to an increase in the air consumption coefficient to 1.02), the average temperature of the checker bricks in the silica-brick section of the regenerator at the end of the combustion period is the highest (reaching 1209 °C). As a result, the average hot-air temperature during the hot-air-supply period is also the highest (up to 1295 °C). Therefore, this operation significantly improves the hot-air temperature level while reducing fuel gas consumption.
  • When further decreasing the fuel gas flowrate to 80,000 Nm3/h (corresponding to an air consumption coefficient of 1.28), the average temperature of the checker bricks in the silica-brick section of the regenerator at the end of the combustion period is still high enough (1187 °C), leading to a relatively high average hot-air temperature during the hot-air-supply period (1273 °C). Therefore, this operating condition can further save fuel gas while ensuring the required level of hot-air temperature;
  • During the entire operation cycle of the hot blast stove, the extent of the checker brick temperature fluctuation in the lower section of the regenerator is greater than that in the upper section of the regenerator; however, the changes in operating conditions only significantly influence the temperature of the silica-brick section of the regenerator at the end of the combustion period but have a relatively small effect on the checker-brick temperature in middle and lower sections of the regenerator;
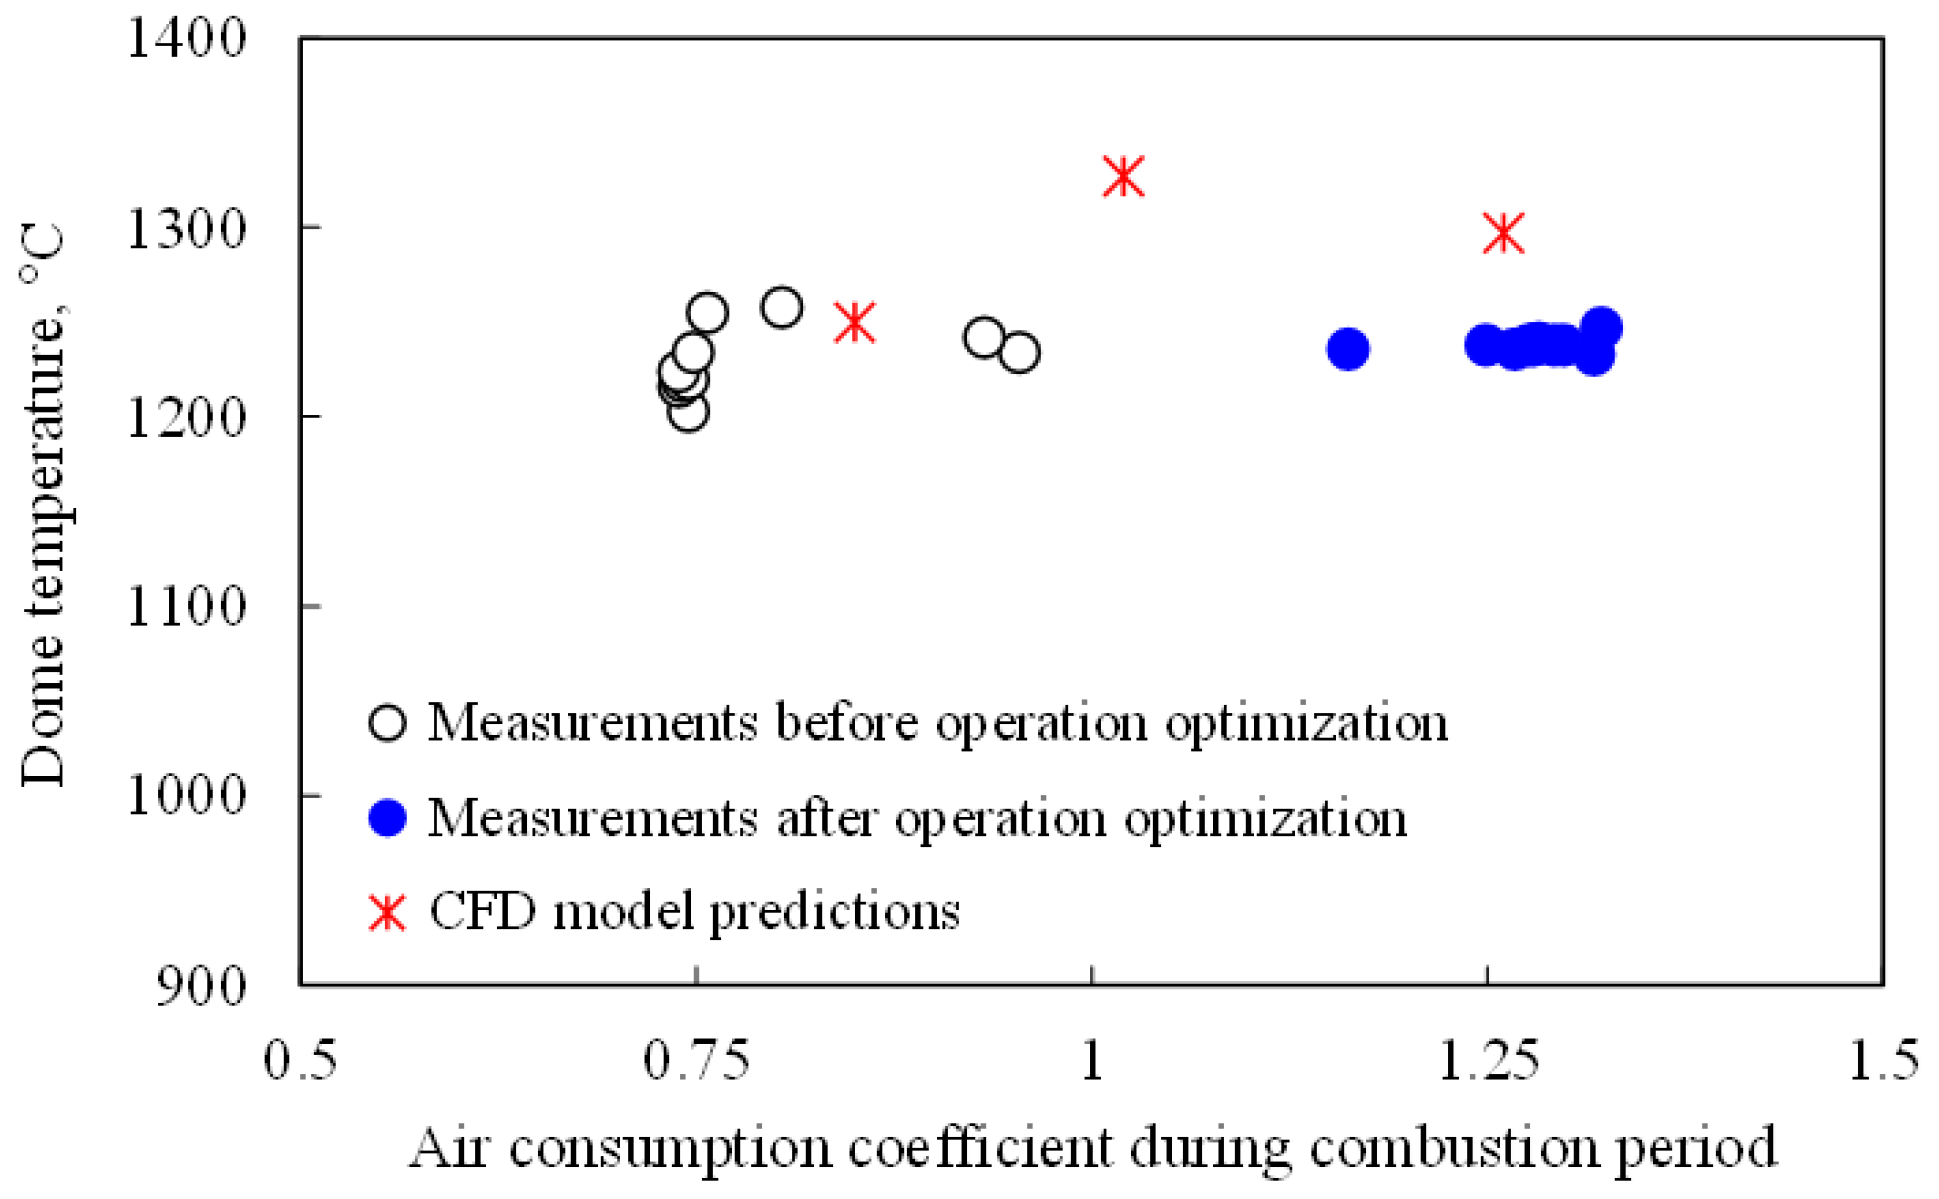
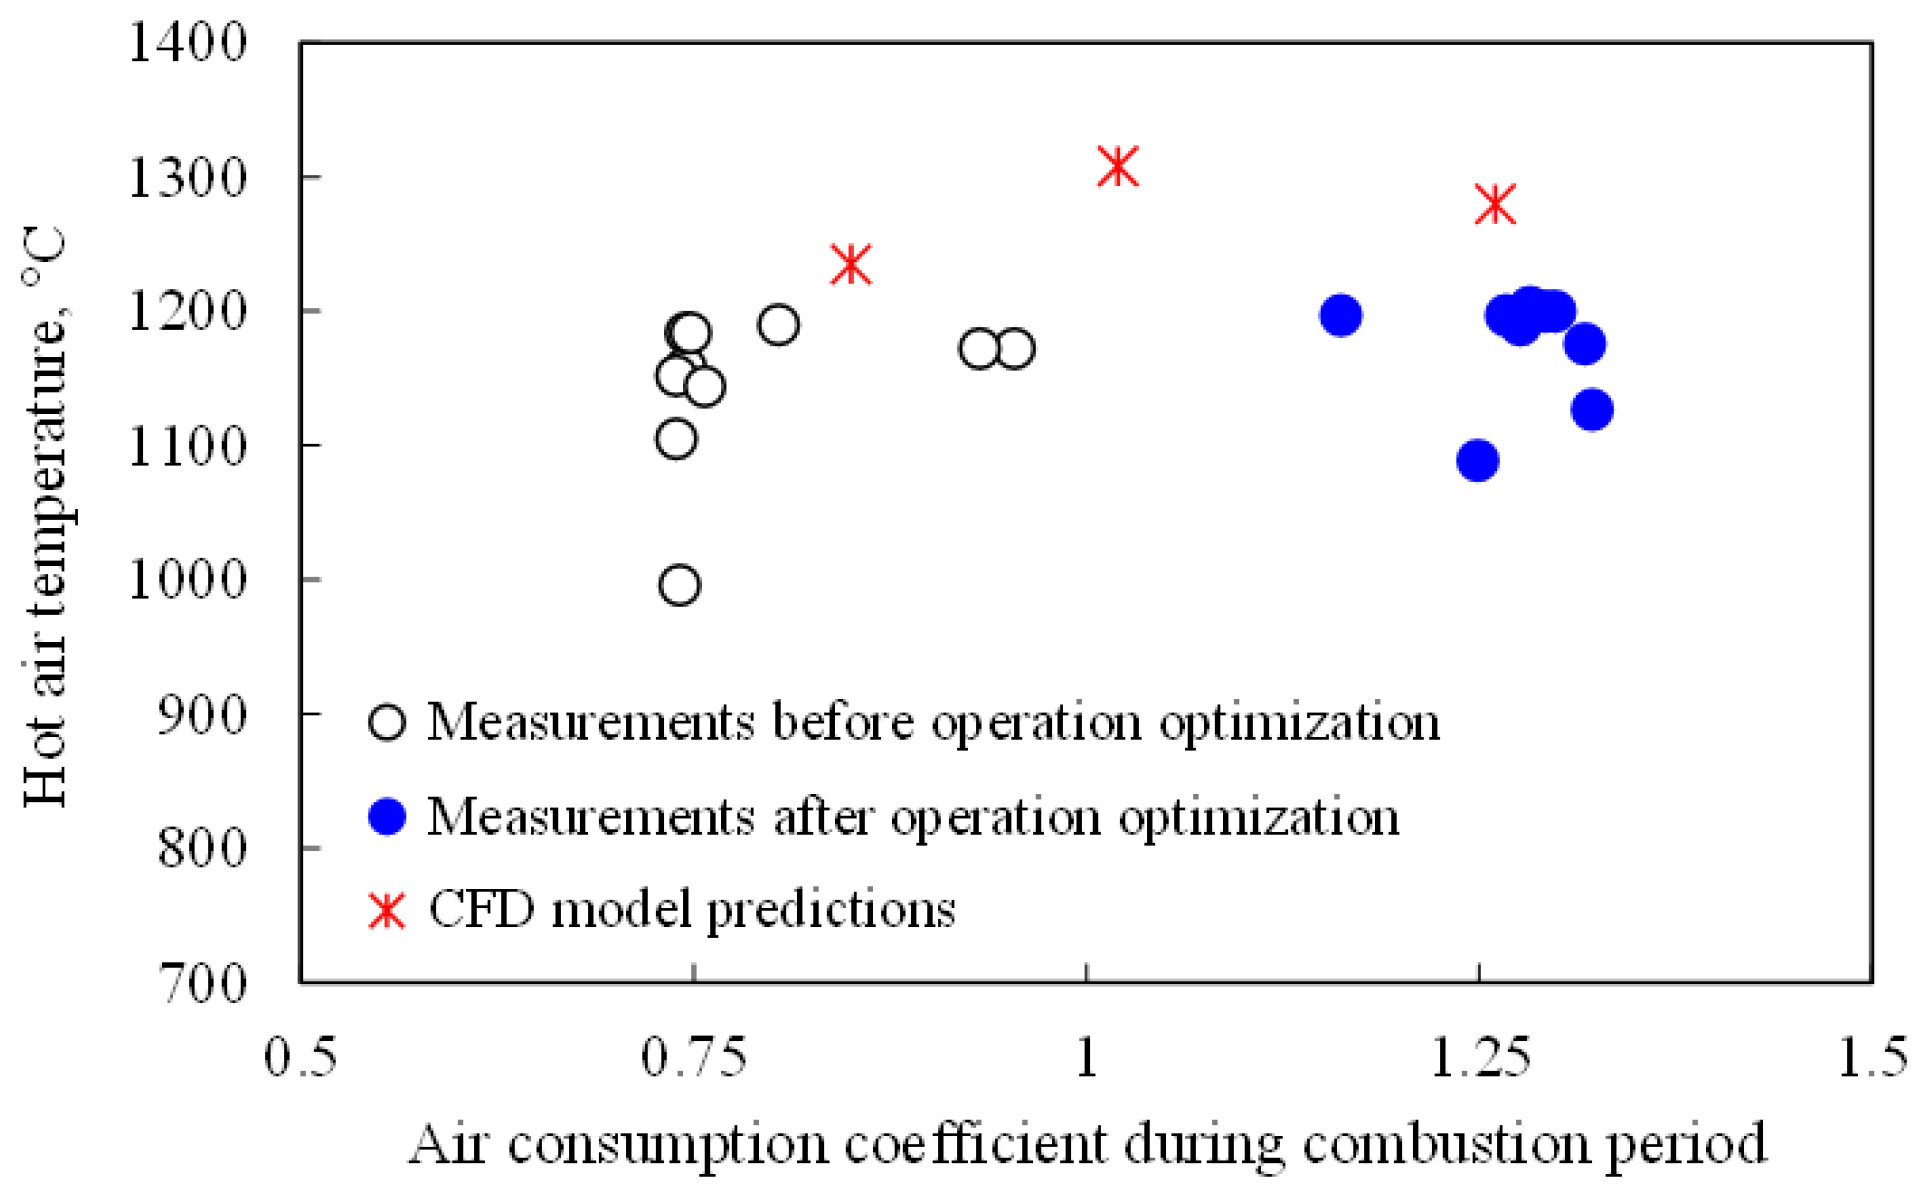
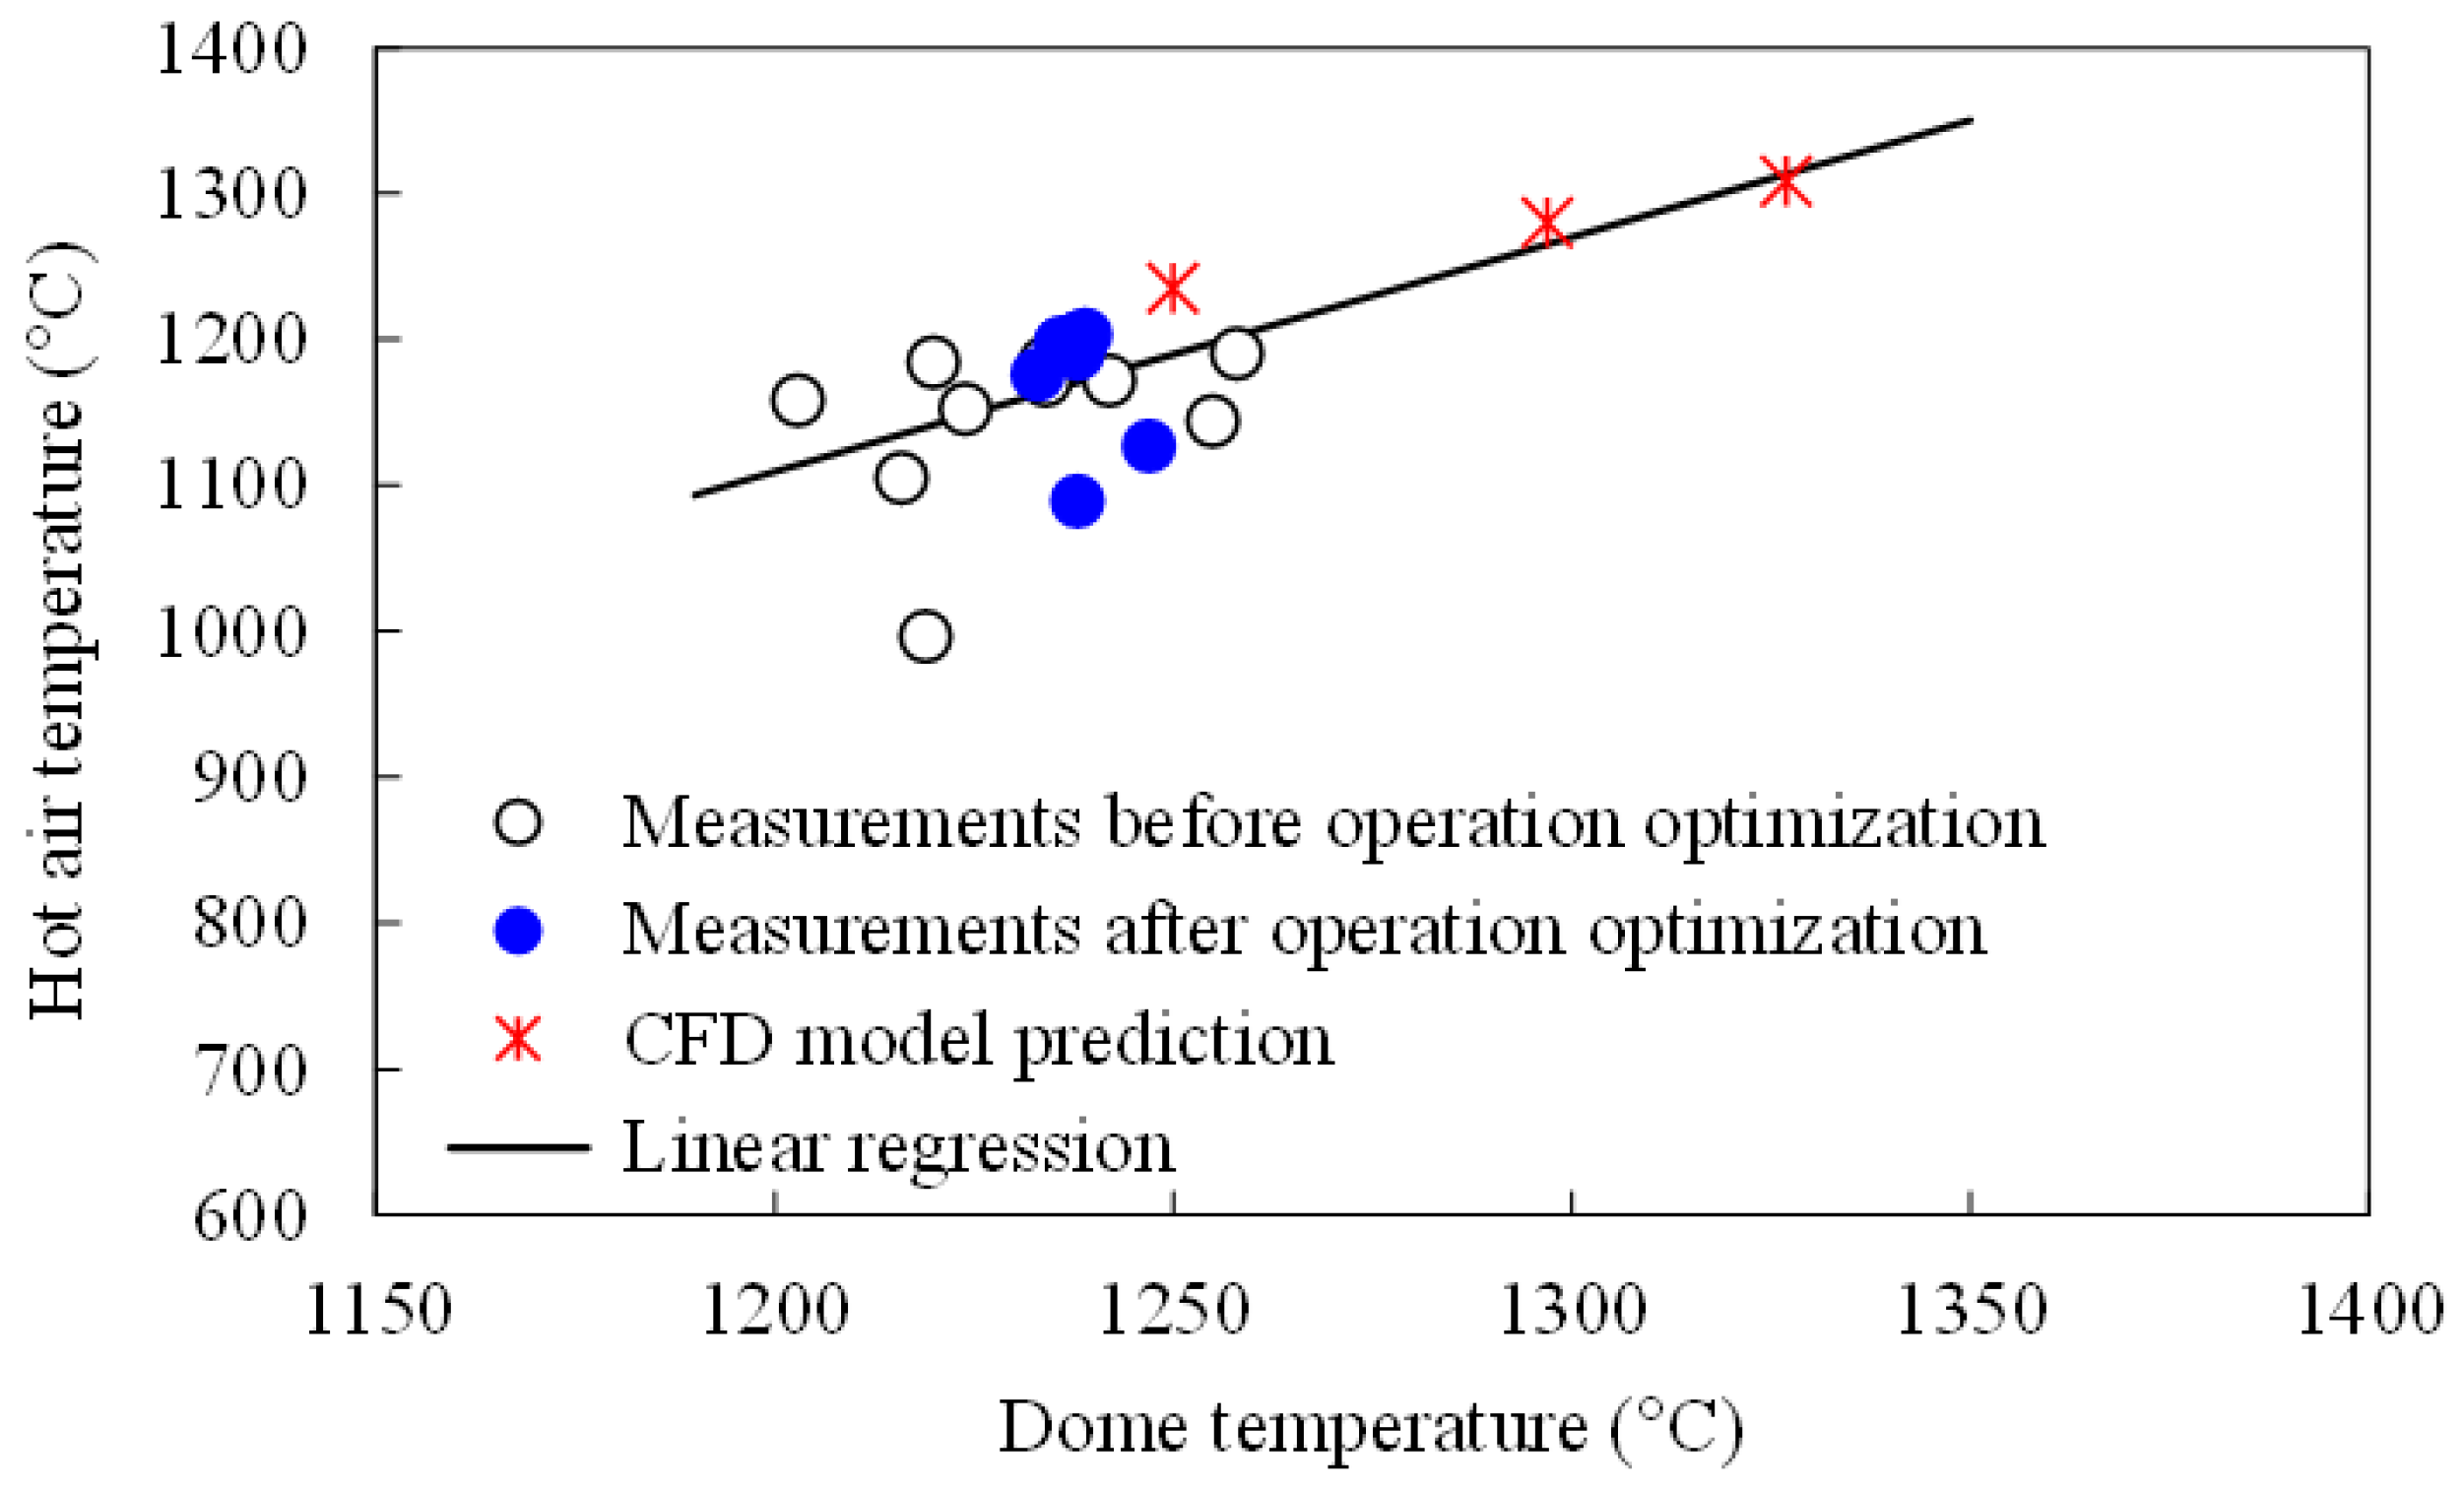
  • Controlling the air consumption coefficient within the range of 1.02–1.28 during the main combustion phase of the hot blast stove can achieve the best effects on combustion and heat transfer, which has been demonstrated by the measured dome temperature and hot-air temperature from the industrial hot blast stove. In addition, there is a roughly linear relationship between the dome temperature during the combustion period and the hot-air temperature during the hot-air-supply period, exhibiting that if the dome temperature is increased by 10 °C, for instance, it is possible to increase the hot-air temperature by about 16 °C. Such a linear relationship between the dome temperature and the hot-air temperature would play an important role in guiding the operation of Kalugin top combustion hot blast stoves in steel plants;
  • The data of the fuel gas flowrate and the hot-air temperature collected from the industrial hot blast stove before and after operation optimization indicate a reduction in fuel gas flowrate by 8.6% and an increase in the hot-air temperature by 32 °C, proving that the numerical simulation strategy proposed in the present work can achieve the goal of energy conservation and fuel consumption reduction while maintaining the hot-air temperature level required for blast furnace ironmaking.

Author Contributions

Conceptualization, M.Z. and Y.P.; methodology, M.Z. and Y.P.; validation, F.M. and M.Z.; formal analysis, M.Z. and Y.P.; investigation, M.Z. and F.M.; resources, Y.P. and P.M.; data curation, M.Z. and Y.P.; writing—original draft preparation, M.Z., F.M. and Y.P.; writing—review and editing, M.Z., Y.P. and P.M.; visualization, M.Z.; supervision, Y.P. and P.M.; project administration, M.Z.; funding acquisition, Y.P. and P.M. All authors have read and agreed to the published version of the manuscript.

Funding

Ansteel Group Corporation, China, for financial support for this work under contract number HZ2018009.

Data Availability Statement

Data supporting the reported results can be found in this paper.

Acknowledgments

The authors express their special gratitude to Lidi Jia and Guangyu Ma of Iron and Steel Research Institute of Ansteel Group Corporation for their support for plant investigations and sampling of plant data and to Fanshuang Meng and Dongsheng Li of General Ironmaking Plant of Ansteel Group Corporation for their support for plant investigations and providing data for validation of simulation results.

Conflicts of Interest

The authors declare no conflict of interest.

References

  1. Kalugin, Y. Development and research of a new type of top combustion hot blast Stove. Energy Metall. Ind. 1988, 7, 60–61. (In Chinese) [Google Scholar]
  2. Kalugin, Y. High-temperature stoves for blast furnaces: New designs. Metallurgist 1997, 41, 414–416. [Google Scholar] [CrossRef]
  3. Xiang, P.; Peng, C. Innovation and application of hot stove technology. Metall. Equip. 2020, 257, 71–74. (In Chinese) [Google Scholar]
  4. Wang, Z.; Cui, X.; Lin, Y.; Wang, Y. Design of burner of Kalugin hot-blast stove. Metall. Equip. 2021, 270, 31–33. (In Chinese) [Google Scholar]
  5. Wei, Q.; Ge, L.; Liu, S.; Fu, Z.; Cheng, S.; Wang, L.; Liu, L. High air temperature and low nitrogen combustion technology of top burning catenary hot blast stove. Hebei Metall. 2021, 302, 64–68. (In Chinese) [Google Scholar]
  6. Wei, Q.; Ge, L.; Liu, S.; Fu, Z.; Liu, L. Key technical points for achieving high air temperature and low nitrogen oxide emissions in hot blast stove. Ironmaking 2021, 40, 46–49. (In Chinese) [Google Scholar]
  7. Zhu, G. Practice of top burning transformation of 6# hot blast furnace of No.2 blast furnace in Jiusteel. Gansu Metall. 2023, 45, 17–19. (In Chinese) [Google Scholar]
  8. Li, H. Practice of increasing air temperature and reducing consumption in hot blast stove. Metall. Mater. 2022, 42, 13–15. (In Chinese) [Google Scholar]
  9. Xu, Y. Ways to improve air temperature of blast furnace hot blast stove. Metall. Manag. 2022, 7, 60–62. (In Chinese) [Google Scholar]
  10. Chen, Y.; Zhang, J.; Na, S.; He, Y.; Dong, W.; Xing, M.; Bao, Y. Computer simulation of cooling gas distributions in the hot-blast stove (II). J. Baotou Univ. Iron Steel Technol. 1999, 2, 108–110. (In Chinese) [Google Scholar]
  11. Zhong, L.; Liu, Q.; Wang, W. Computer simulation of heat transfer in regenerative chambers of self-preheating hot blast stoves. ISIJ Int. 2004, 44, 795–800. [Google Scholar] [CrossRef]
  12. Zhao, C.; Chen, L. Numerical simulation of periodic operation of top combustion hot blast stove. China Metall. 2021, 31, 132–137. (In Chinese) [Google Scholar]
  13. Chen, W.; Luo, H. Numerical simulation of flow and heat transfer in regenerative reheating furnace. J. Huazhong Univ. Sci. Technol. (Nat. Sci. Ed.) 2005, 33, 17–19. (In Chinese) [Google Scholar]
  14. Hwang, Y.M.; Lee, Y.M. Thermal stress analysis of refractory linings in a hot blast stove. J. Phys. Conf. Ser. 2020, 1633, 012075. [Google Scholar] [CrossRef]
  15. Zheng, Z.; Huang, Z. Study on operating regulation of hot air stove and numerical simulation of heat transfer in regenerator based on FLUENT. Ind. Heat. 2008, 37, 37–41. (In Chinese) [Google Scholar]
  16. Gan, Y.F.; Jang, J.Y.; Wu, T.Y. 3D dynamic thermal and thermomechanical stress analysis of a hot blast stove. Ironmak. Steelmak. 2020, 47, 959–972. [Google Scholar] [CrossRef]
  17. Yu, H. The Simulation of Thermal Processes and Analysis of Characteristics about Hot Blast Stove. Master’s Thesis, Northeastern University, Shenyang, China, 2011. (In Chinese). [Google Scholar]
  18. Chen, H.; Cheng, X.; Cheng, S.; Wang, L.; Liu, S. Simulation and analysis of combustion process of a new type annular internal combustion chamber top combustion hot blast stove. Ind. Furn. 2022, 44, 1–7. (In Chinese) [Google Scholar]
  19. Wen, W.; Huang, S.; Jin, S.; Chen, W.; Yan, R.; Zhang, X.; Fang, S.; Zhang, Y. Numerical simulation of flow and heat transfer process in hot blast stoves regenerator. Ind. Heat. 2012, 41, 23–27. (In Chinese) [Google Scholar]
  20. Hou, S.; Luo, Z. Numerical simulation of airflow distribution in top combustion hot stove checker chamber. China Metall. 2017, 27, 11–13, 67. (In Chinese) [Google Scholar]
  21. Zhu, H.; Su, F.; Kang, Z.; Fang, L.; Wen, Z. Structural optimization internal combustion hot stove burner. China Metall. 2022, 32, 128–134. (In Chinese) [Google Scholar]
  22. Zhang, J.; Zhang, J.; Yu, H.; Zhu, H.; Su, F. Numerical simulation of heating wall structure optimization of internal combustion hot stove. Ironmaking 2022, 41, 59–62. (In Chinese) [Google Scholar]
  23. Zhou, L. Study on combustion method of hot air stove based on CFX simulation. Ind. Control. Comput. 2018, 31, 27–29. (In Chinese) [Google Scholar]
  24. Chang, Q.; Chen, Y.; Li, Y. Numerical simulation of combustion process in top burning hot blast stove. Ind. Heat. 2014, 43, 57–60. (In Chinese) [Google Scholar]
  25. Huang, B.; Lv, X. Study on numerical simulation of top combustion hot blast stove. Mech. Eng. 2020, 3, 118–120. (In Chinese) [Google Scholar]
  26. Zhang, Q.; Chen, L.; Ma, X.; Zhao, C. Numerical study of combustion and air supply characteristics and structural optimization of top combustion hot blast stoves. ISIJ Int. 2020, 61, 62–70. [Google Scholar] [CrossRef]
  27. Zhang, Q.; Chen, L.; Zhao, C. Numerical simulation of combustion and air supply process and optimal design of traditional top combustion hot blast stoves. Steel Res. Int. 2021, 92, 311–320. [Google Scholar] [CrossRef]
  28. Zetterholm, J.; Ji, X.; Sundelin, B.; Martin, P.; Wang, C. Dynamic modelling for the hot blast stove. Appl. Energy 2016, 185, 2142–2150. [Google Scholar] [CrossRef]
  29. Park, D.; Guo, F.; Choi, J.; Park, J.; Kim, N. Temperature and thermal stress analysis of a hot blast stove with an internal combustion chamber. Processes 2023, 11, 707–726. [Google Scholar] [CrossRef]
  30. Wang, Z.; Qi, F.; Liu, Z.; Li, B.; Liu, H. Simulation of the combustion process of top combustion hot blast stove with top injection. J. Mater. Metall. 2023, 22, 110–118. (In Chinese) [Google Scholar]
  31. Zhao, M.; Pan, Y.; Meng, F.; Ma, P.; Jia, L.; Ma, G.; Meng, F.; Li, D. CFD numerical simulation of operation optimization for energy saving during combustion period of Kalugin top combustion hot blast stove. Trans. Indian Inst. Met. 2023, 76, 1967–1976. [Google Scholar] [CrossRef]
  32. ANSYS Inc. ANSYS CFD User’s Manual; ANSYS Inc.: Canonsburg, PA, USA, 2013. [Google Scholar]
Figure 1. Schematic illustrations of three-dimensional geometry of industrial Kalugin top combustion hot stove and two-dimensional geometry and grid division for CFD model of single channel of checker bricks in regenerator: (a) Physical model for 3D CFD simulation on whole stove [31]; (b) Computation grids for 2D CFD simulation of single channel of checker bricks.
Metals 13 01623 g001
Figure 3. CFD-model-predicted contours of checker brick temperature distribution at different times during combustion period of Case A.
Metals 13 01623 g003
Figure 4. CFD-model-predicted contours of checker brick temperature distribution at different times during hot-air-supply period of Case A.
Metals 13 01623 g004
Figure 5. CFD-model-predicted distributions of checker brick and gas temperatures along the height direction of regenerator during full operation cycle of hot blast stove under operation conditions of Case A: (a) Evolution of checker brick temperature distribution with time during combustion period; (b) Evolution of flue gas temperature distribution with time during combustion period; (c) Evolution of checker brick temperature distribution with time during hot-air-supply period; (d) Evolution of air temperature distribution with time during hot-air-supply period.
Metals 13 01623 g005aMetals 13 01623 g005b
Figure 6. Comparison of variation in temperature distribution contours in regenerator at different times of operation under operating conditions of Cases A, B, and C.
Metals 13 01623 g006
Figure 7. Distributions of checker-brick temperature along the height direction in regenerator at the end of combustion period under different operating conditions.
Metals 13 01623 g007
Figure 8. Variations in outlet hot-air temperature with time during hot-air-supply period under different operating conditions.
Metals 13 01623 g008
Figure 9. Influence of air consumption coefficient on dome temperatures measured before and after optimization and predicted using CFD simulation for combustion period [31].
Metals 13 01623 g009
Figure 10. Influence of air consumption coefficient for combustion period on hot-air temperatures measured before and after operation optimization and predicted using CFD simulation for hot-air-supply period.
Metals 13 01623 g010
Figure 11. Relationship between dome temperature and hot-air temperature before and after optimization measured from industrial hot blast stove and those predicted using CFD simulation.
Metals 13 01623 g011
Table 1. Definition of computational domain of single-channel two-dimensional transient CFD model of checker bricks in regenerator (c.f., Figure 1).
RegionRegion NameRegion TypeMaterial
ABCHGFGas flow channel in checker brickFluidFlue gas (a) or air (b)
FGJEUpper section of regeneratorSolidSilica checker brick
GHIJMiddle section of regeneratorSolidMixed region of silica and fireclay checker bricks
CDIHLower section of regeneratorSolidFireclay checker brick
(a) For combustion period; (b) For hot-air-supply period.
Table 3. Operating conditions for simulation in combustion period.
Main Combustion PhaseThermal Retention Phase
Operation CaseFuel Gas FlowrateCombustion Air FlowrateTimeFuel Gas FlowrateCombustion Air FlowrateTime
(Nm3/h)(Nm3/h)(min)(Nm3/h)(Nm3/h)(min)
A120,00065,0005030,00024,00030
B100,00065,0005030,00024,00030
C80,00065,0005030,00024,00030
Table 4. Operating condition for simulation in hot-air-supply period.
Cold Air Flowrate
(Nm3/h)
Temperature
(K)
Time
(min)
300,00030060
Table 5. Three-dimensional steady-state CFD model predicted average temperatures of flue gas entering the regenerator together with operating conditions for different simulation cases [31].
Operation Phase in Combustion PeriodMain Combustion PhaseThermal Retention Phase
Simulation CaseABCA, B, C
Fuel gas flowrate (Nm3/h)120,000100,00080,00030,000
Combustion air flowrate (Nm3/h)65,00065,00065,00024,000
Air consumption coefficient0.851.021.281.24
Average temperature of flue gas (°C)1258132712971270
Disclaimer/Publisher’s Note: The statements, opinions and data contained in all publications are solely those of the individual author(s) and contributor(s) and not of MDPI and/or the editor(s). MDPI and/or the editor(s) disclaim responsibility for any injury to people or property resulting from any ideas, methods, instructions or products referred to in the content.

